Biomech Model Mechanobiol DOI 10.1007/s10237-013-0531-y ORIGINAL PAPER Understanding the need of ventricular pressure for the estimation of diastolic biomarkers Jiahe Xi · Wenzhe Shi · Daniel Rueckert · Reza Razavi · Nicolas P. Smith · Pablo Lamata Received: 3 May 2013 / Accepted: 19 September 2013 © The Author(s) 2013. This article is published with open access at Springerlink.com Abstract The diastolic function (i.e., blood filling) of the left ventricle (LV) is determined by its capacity for relax- ation, or the decay in residual active tension (AT) gener- ated during systole, and its constitutive material properties, or myocardial stiffness. The clinical determination of these two factors (diastolic residual AT and stiffness) is thus essen- tial for assessing LV diastolic function. To quantify these two factors, in our previous work, a novel model-based para- meter estimation approach was proposed and successfully applied to multiple cases using clinically acquired motion and invasively measured ventricular pressure data. However, the need to invasively acquire LV pressure limits the wide application of this approach. In this study, we address this issue by analyzing the feasibility of using two kinds of non- invasively available pressure measurements for the purpose of inverse mechanical parameter estimation. The prescrip- tion of pressure based on a generic pressure–volume (P–V) relationship reported in literature is first evaluated in a set of J. Xi · P. Lamata Department of Computer Science, Oxford University, Oxford, UK e-mail: [email protected] W. Shi · D. Rueckert Department of Computing, Imperial College London, London, UK e-mail: [email protected] D. Rueckert e-mail: [email protected] N. P. Smith · R. Razavi · P. Lamata (B ) Department of Biomedical Engineering, St Thomas Hospital, King’s College London, London, UK e-mail: [email protected] N. P. Smith e-mail: [email protected] R. Razavi e-mail: [email protected] 18 clinical cases (10 healthy and 8 diseased), finding reason- able results for stiffness but not for residual active tension. We then investigate the use of non-invasive pressure mea- sures, now available through imaging techniques and limited by unknown or biased offset values. Specifically, three sets of physiologically realistic synthetic data with three levels of diastolic residual active tension (i.e., impaired relaxation capability) are designed to quantify the percentage error in the parameter estimation against the possible pressure offsets within the physiological limits. Maximum errors are quanti- fied as 11% for the magnitude of stiffness and 22% for AT, with averaged 0.17 kPa error in pressure measurement offset using the state-of-the-art non-invasive pressure estimation method. The main cause for these errors is the limited tem- poral resolution of clinical imaging data currently available. These results demonstrate the potential feasibility of the esti- mation diastolic biomarkers with non-invasive assessment of pressure through medical imaging data. Keywords Cardiac computational modeling · Parameter estimation · Diastolic biomarkers · Myocardial stiffness · Residual active tension 1 Introduction An increasingly important research area within the field of cardiac modeling is the development and study of methods of model-based parameter estimation from clinical measure- ments of cardiac function (Wang et al. 2009, 2010; Moireau and Chapelle 2011; Chabiniok et al. 2011; Xi et al. 2013, 2011). This set of techniques provides an comprehensive approach to the quantification of cardiac function, with the potential for improved selection of individuals with patho- logical myocardial mechanics for further therapy (Nagel and 123

Welcome message from author
This document is posted to help you gain knowledge. Please leave a comment to let me know what you think about it! Share it to your friends and learn new things together.
Transcript

Biomech Model MechanobiolDOI 10.1007/s10237-013-0531-y
ORIGINAL PAPER
Understanding the need of ventricular pressure for the estimationof diastolic biomarkers
Jiahe Xi · Wenzhe Shi · Daniel Rueckert ·Reza Razavi · Nicolas P. Smith · Pablo Lamata
Received: 3 May 2013 / Accepted: 19 September 2013© The Author(s) 2013. This article is published with open access at Springerlink.com
Abstract The diastolic function (i.e., blood filling) of theleft ventricle (LV) is determined by its capacity for relax-ation, or the decay in residual active tension (AT) gener-ated during systole, and its constitutive material properties,or myocardial stiffness. The clinical determination of thesetwo factors (diastolic residual AT and stiffness) is thus essen-tial for assessing LV diastolic function. To quantify thesetwo factors, in our previous work, a novel model-based para-meter estimation approach was proposed and successfullyapplied to multiple cases using clinically acquired motionand invasively measured ventricular pressure data. However,the need to invasively acquire LV pressure limits the wideapplication of this approach. In this study, we address thisissue by analyzing the feasibility of using two kinds of non-invasively available pressure measurements for the purposeof inverse mechanical parameter estimation. The prescrip-tion of pressure based on a generic pressure–volume (P–V)relationship reported in literature is first evaluated in a set of
J. Xi · P. LamataDepartment of Computer Science, Oxford University, Oxford, UKe-mail: [email protected]
W. Shi · D. RueckertDepartment of Computing, Imperial College London, London, UKe-mail: [email protected]
D. Rueckerte-mail: [email protected]
N. P. Smith · R. Razavi · P. Lamata (B)Department of Biomedical Engineering, St Thomas Hospital, King’sCollege London, London, UKe-mail: [email protected]
N. P. Smithe-mail: [email protected]
R. Razavie-mail: [email protected]
18 clinical cases (10 healthy and 8 diseased), finding reason-able results for stiffness but not for residual active tension.We then investigate the use of non-invasive pressure mea-sures, now available through imaging techniques and limitedby unknown or biased offset values. Specifically, three setsof physiologically realistic synthetic data with three levelsof diastolic residual active tension (i.e., impaired relaxationcapability) are designed to quantify the percentage error inthe parameter estimation against the possible pressure offsetswithin the physiological limits. Maximum errors are quanti-fied as 11 % for the magnitude of stiffness and 22 % for AT,with averaged 0.17 kPa error in pressure measurement offsetusing the state-of-the-art non-invasive pressure estimationmethod. The main cause for these errors is the limited tem-poral resolution of clinical imaging data currently available.These results demonstrate the potential feasibility of the esti-mation diastolic biomarkers with non-invasive assessment ofpressure through medical imaging data.
Keywords Cardiac computational modeling · Parameterestimation · Diastolic biomarkers · Myocardial stiffness ·Residual active tension
1 Introduction
An increasingly important research area within the field ofcardiac modeling is the development and study of methodsof model-based parameter estimation from clinical measure-ments of cardiac function (Wang et al. 2009, 2010; Moireauand Chapelle 2011; Chabiniok et al. 2011; Xi et al. 2013,2011). This set of techniques provides an comprehensiveapproach to the quantification of cardiac function, with thepotential for improved selection of individuals with patho-logical myocardial mechanics for further therapy (Nagel and
123

J. Xi et al.
Schuster 2010). In organ-level cardiac mechanical models,both passive constitutive material parameters and active con-tractility parameters are required for the simulation of dias-tolic and systolic functions, respectively (Niederer and Smith2009; Nordsletten et al. 2011). As such, these active and pas-sive parameters are important physiological variables relatedto the function of the heart.
In particular, the diastolic function (i.e., left ventricular-LV—blood filling) is affected by two main characteristics ofthe myocardium (Zile et al. 2004; Maeder and Kaye 2009):(1) its capacity to relax, produced by the release of the actin-myosin cross-bridges, and (2) its compliance (or its recip-rocal, stiffness) often quantified within models via constitu-tive material parameters that dictate the capacity of the LVchamber to passively dilate. These two physiological prop-erties, corresponding to the diastolic residual active tension(AT) and passive constitutive parameters in the mechanicalmodel, are difficult to assess in vivo. For this reason, to a sig-nificant degree, the traditional criterion to diagnose diastolicdysfunction is subject to many limitations and controversies(Maeder and Kaye 2009).
In our previous work (Xi et al. 2013), we demonstratedthe feasibility of estimating these diastolic mechanical para-meters and decoupling the effects of active recoil and pas-sive inflation. Using a model-based approach, a clear differ-ence was shown in the diastolic mechanical parameters (i.e.,the stiffness and diastolic residual active tension) betweenhealthy and diseased subjects. However, the need for bothmotion and pressure measurements in a single subject toutilize this method limits its wide application. Specifically,accurate values of LV pressure are only available in the clinicvia an invasive cardiac catheterization procedure, where acatheter is typically introduced through a femoral artery andadvanced to the LV (Sasayama et al. 1984; Urheim et al. 2002;Zile et al. 2004). Furthermore, while the cardiac catheteriza-tion remains the clinical standard, these measurements can beaffected by calibration errors (Solomon and Stevenson 2009),and the potential complications and health risks associatedwith this invasive technique underscore the need for reliablenon-invasive methods to measure LV pressures (Chatterjee2009; Solomon and Stevenson 2009).
As a potential alternative to invasively acquired data, thereare three main non-invasive methodologies for estimatingthe LV diastolic pressure. The first approach uses 4D veloc-ity fields available via specialized US, CT or MR imagingprotocols and then computes the pressure gradients by solv-ing the Navier Stokes equation, typically with a number ofsimplifications (Krittian et al. 2012; Song et al. 1994; Yotti etal. 2011). This method can potentially provide pressure mapswith high spatio-temporal resolution (Pitcher et al. 2013), butpressure values can only be computed relative to one pointin that domain. Therefore, absolute values are not availablewithout a known reference. This technique has been suc-
cessfully applied to compute LV filling pressure gradients(Ebbers et al. 2001; Yotti et al. 2011) and thus has the poten-tial to also be used for the estimation of diastolic parameters.The second methodology uses a microbubble-based ultra-sound contrast agent (UCA) and is based on the fact that thechange in the acoustic properties of UCA depends on bloodpressure (Forsberg et al. 2005; Dave et al. 2012). The use ofUCA has been approved in the United States for clinical LVopacification studies (Dave et al. 2012) and has the poten-tial to non-invasively monitor LV pressures in real time, withreported pressure offset errors ranging from 0.025 to 0.33 kPa(Dave et al. 2012; Geoffrey et al. 2003). With both methods,LV pressure can effectively be estimated in relative terms,with an uncertain amount of offset in its absolute value. Afurther approach to the central blood pressure estimation is tonon-invasively measure radial artery pressures, from which atransfer function is applied, as introduced by (Karamanogluet al. 1993). While this approach has been widely used inthe last few years for central pressure estimation (Hope et al.2008), as currently implemented, it is not valid for the assess-ment of diastolic LV pressure, since a closed valve isolatesaortic and ventricular domains during diastolic filling.
The aforementioned developments in LV pressure mea-surement technology present both challenges in the relativenature of the resulting data or errors in pressure offset andopportunities for estimation of mechanical properties. In thiscontext, this study addresses two important questions for theclinical translation of techniques that enable the estimation ofpassive stiffness and active tension parameters: are pressuremeasurements required for parameter estimation? If so, whatis the impact of the presence of errors in the pressure offsetvalue required to transform the relative pressure measuresinto absolute values? A parameter estimation methodologyrobust to offset errors will enable the use of non-invasivepressure methods, such as UCA measurements (Geoffrey etal. 2003; Forsberg et al. 2005; Dave et al. 2012) or relativepressure fields from velocity data (Krittian et al. 2012; Songet al. 1994; Yotti et al. 2011).
The investigation of the importance of the LV pressureboundary condition on the problem of estimation of diastolicproprieties is developed as follows. We analyze two methodsto prescribe pressure boundary conditions, i.e., to imposethe absolute value of pressure (assumed constant throughthe ventricle) at any time during diastolic filling, in our pre-viously reported estimation methodology (Xi et al. 2013).Firstly, we investigate the reliability of prescribing pressurebased on a LV pressure–volume relationship widely acceptedin literature. Using this approach, we show that this genericrelationship adds little to our ability to discriminate betweenhealthy and diseased cases, when compared with the informa-tion extracted only from images. Secondly, we investigate theuse of pressure with an unknown or biased offset by analyz-ing results on three sets of physiologically realistic synthetic
123

Understanding the need of ventricular pressure for the estimation of diastolic biomarkers
Fig. 1 Schematic representation of the LV mechanics with a 1D springmodel similar to the one used in (Remme et al. 2011): The displacementof the spring x , relative to the reference position x0, is driven by boththe external loading force P and the active stress Tz . The passive stressTp is developed as the spring is deformed, relating to the spring stiffnessconstant K
measurements with three levels of diastolic residual activetension as benchmarks. The quantification of errors againstpossible pressure offsets within physiological limits will leadus to determine the feasibility of this second approach.
2 Materials and methods
2.1 Method for the estimation of diastolic biomarkers
The estimation of diastolic biomarkers is based on the solu-tion of an inverse problem, where the stiffness and decayingactive tension parameters are found to best explain the rela-tionship between the deformation and pressure of the leftventricle during diastole. A 1D spring model with discretemeasurement points is used to explain the key concepts andassumptions underlying this methodology, and the reader isreferred to (Xi et al. 2013) for a detailed description.
As shown in Fig. 1, the deformation of the spring (anal-ogous to the deformation of LV) is driven by two factors:stretching by the external force P (analogous to the LV cavitypressure increasing during venous return) and contracting bythe active stress T (analogous to the active tension developedby the contraction of the myocardial fiber). Passive stress T pis developed when the spring is stretched or compressed fromthe reference position x0 to another position xi . Stress anddeformation are assumed to be related linearly through thespring constant K (stiffness) in this simplified illustrativemodel (note that a nonlinear relationship is actually used inthe 3D model).
Measurements available in the clinic during diastole aretypically 5–6 image frames by dynamic magnetic resonancestudies, which define the deformed position xi , and a pres-sure recording to impose the external loading force Pi . The’unknowns’ of the system are Tz at each frame, K and x0.The solution of this problem is possible with two additionalassumptions: The remaining active tension at the end of dias-tole is nominal, and the reference configuration x0 is similarto one point during the diastolic sequence. The first assump-
Fig. 2 Illustration, in a pressure-displacement (P-x) curve, of the para-meter estimation process. The result of a correct estimation of both stiff-ness K and reference position x0 is represented by drawing a tangentline (red line) for the P-x curve at the final measurement point, reachingthe horizontal line of P = 0 (essentially analogous to deflating fromthe end diastolic state to zero pressure for the LV model). The amountof active tension is proportional to the length of the 5 horizontal dashedlines at the 5 measurement points, because that is the amount of forceneeded to compress the spring from the red line (pure passive behavior)to the corresponding positions of the P-x curve. The blue line representsthe scenario of an incorrect estimation of the reference position, wherethe AT estimated at measurement point 4 (denoted by the dash verticalline) will be negative (note that the blue line falls to the left of the P-xcurve, i.e., negative AT is needed to stretch the spring to match the P-xcurve)
tion reduces by one the number of variables to estimate and isjustified by measurements of active relaxation time (averagetime for full relaxation of 122.5 and 206.5 ms for controlsand heart failure cases, respectively Zile et al. 2004). The sec-ond assumption was introduced to challenge the conventionof taking the frame with minimum pressure as the referenceframe (Wang et al. 2009) and is used to find the configurationwhen the active contractile force is balanced with the exter-nal inflating pressure applied to the ventricle (equivalent tothe definition of the reference volume in Remme et al. 2011,when the passive forces are null). With the second assump-tion, x0 can be estimated as the first position that leads to acontinuing decaying profile of active tension, without nega-tive values, as illustrated in Fig. 2.
2.2 Estimation using literature P–V relationship
In order to apply our model-based parameter estimationmethodology to clinical cases without invasive pressurerecordings, we require a method to infer pressure from com-monly available measurements (i.e., MRI). In literature, LVpressure–volume (P–V) data have been reported extensively(Kawaguchi et al. 2001; Steendijk et al. 2006; Brinke et al.2010), and the LV P–V relationship has been well stud-ied (Zile and Brutsaert 2002; Zile et al. 2004; Klotz et al.2007). Thus, for the purpose of parameter estimation without
123

J. Xi et al.
pressure information, we first consider the implications ofinferring the LV pressure using relationships defined fromthis data.
2.2.1 PZ : LV pressure surrogate based on Zile et al. (2004)
The diastolic LV P–V relationship has previously beendescribed by an exponential equation (Zile and Brutsaert2002; Zile et al. 2004), P = AeβV , where P is the left ven-tricular diastolic pressure, V is the left ventricular diastolicvolume, and A and β are empirically determined constantsused to quantify passive stiffness. This empirical P–V rela-tionship has been widely used, and the stiffness constant β
is currently the gold-standard for the characterization of thestiffness of the heart in the clinical practice (Aurigemma andGaasch 2004; Burkhoff et al. 2005; Westermann et al. 2008).To understand the impact of pressure on the parameter esti-mation, we use the P–V relationship (P = 2.3e0.01V ) mea-sured in the control cases (Zile et al. 2004) for the followingexperiments. The reason for this choice is that, using this sin-gle pressure profile prescribed in the same way (i.e., withoutbiasing estimation results by the prescribed pressure), ourgoal is to analyze, as a criteria of assessing the plausibility ofestimated parameters, how the estimation of AT and stiffnessdiffers between healthy and diseased subjects.
It is important to notice that the P–V relationship chosenwas defined by removing the effect of the active recoil fromthe pressure transient and fitted to three points during dias-tole: (1) minimum volume, (2) point prior to atrial kick and(3) end-diastolic volume (Zile et al. 2004).
It is also important to note that the P–V relationship cannotbe used directly, because when it is applied to diseased heartswith a large LV volume, this relationship will produce unre-alistic pressure (Fig. 3a). To address this limitation, we usethe normalized volume as suggested by (Klotz et al. 2007).As shown in Fig. 3a, this normalization is done using thediastolic LV minimum and maximum volume (denoted bythe black leftmost and rightmost vertical dashed lines). Toinfer the LV pressure for new cases (the blue and red curvesin Fig. 3a), the same normalization is undertaken on each ofthe new cases to get the normalized volume. Pressure is thendetermined by indexing the normalized P–V relationship. InFig. 3b, we verify this normalization-based P–V relationshipby comparing it to the diastolic P–V data reported in litera-ture for AHA class II and III patients (Lorusso et al. 1997;Kawaguchi et al. 2001; Steendijk et al. 2006; Brinke et al.2010).
2.2.2 Application of LV pressure surrogate to 18 clinicalcases
Using the method of a literature-based pressure value PZ , weapply the parameter estimation methodology proposed in our
Fig. 3 Pressure surrogate PZ using a normalized diastolic P–V rela-tionship reported in (Zile et al. 2004). a Direct application of P–V rela-tionship reported in (Zile et al. 2004) (black sold line, direct extrap-olation to large volume ranges, represented in dashed font, will leadto not physiological pressure values) and PZ computed for two casesafter volume normalization (green and red lines, details in Sect. 2.2). bComparison of PZ (solid line) against diastolic P–V data (dash lines,the same volume normalization is performed) reported in literature forheart failure patients with large LV volumes
previous work (Xi et al. 2013) to a total of 18 clinical caseswith only imaging data. As introduced earlier, we analyzedthe parameter difference between healthy and diseased casesand compared these results to the information extracted onlyfrom the imaging measurements.
The imaging data are short axis cine MRI acquired inSt Thomas’ Hospital London. The data sets used in thestudy conform to the principles outlined in the Declarationof Helsinki, and the study was carried out as part of a localethics committee approved protocol with informed consentobtained from the subjects. In these 18 cases, 10 cases arehealthy volunteers and 8 are heart failure patients. A sum-mary of each case is provided in Table 1. The LV volumetransients (normalized) are plotted in Fig. 4 which, interest-ingly, shows a clear difference in the timing of the minimumvolume points, suggesting a delayed diastolic relaxation forthe diseased cases.
The parameter estimation methodologies, including themethods for processing the MR measurements, mechanicalmodel simulation and algorithm for estimating the AT andmaterial properties, are described in detail in (Xi et al. 2013).In brief, the cine MRI sequence is first processed using anmotion tracking algorithm (Shi et al. 2012) to extract themyocardial displacements, based on which a sequence of
123
Understanding the need of ventricular pressure for the estimation of diastolic biomarkers
Table 1 Patient information of the 18 clinical cases
Sex Age HR Wt EF Vmax AHA
H1 M 34 74 72 49 131 0
H2 M 32 77 82 44 110 0
H3 M 27 50 89 49 193 0
H4 M 29 61 65 41 165 0
H5 M 22 67 65 45 118 0
H6 M 22 69 73 40 143 0
H7 M 30 54 74 36 160 0
H8 M 31 71 65 38 153 0
H9 F 24 50 54 54 156 0
H10 M 20 74 85 43 204 0
D1 M 79 43 70 26 365 3
D2 M 66 83 85 18 318 3
D3 F 65 57 65 19 328 2
D4 M 62 57 110 23 282 3
D5 M 80 62 90 30 243 3
D6 M 58 54 90 33 353 2
D7 M 58 77 104 26 225 2
D8 F 76 59 54 30 204 3
H stands for healthy, and D stands for diseased. HR heart rate (beatsper min), Wt weight (kg), EF ejection Fraction, Vmax maximum LVvolume (ml), AHA American heart association classification of heartfailure (from 0 to 4)
Fig. 4 Normalized volume transients over a heart cycle for the 18 clin-ical cases
cubic-Hermite meshes are then constructed and aligned tothe motion observed in each frame of MRI sequence (Lamataet al. 2011). These meshes are compared to the simulationresults generated using our finite deformation-based mechan-ical model, with the previously defined pressure surrogate(illustrated in Fig. 3d) as its boundary condition. The mechan-ical parameters are then estimated using our novel parame-ter algorithm (outlined in 2.1). It is important to note that,
because the cine MRI data do not provide accurate 3D dis-placements within the myocardium, the parameter optimiza-tion criterion is based in this study on LV volume (an integralmetric) instead of 3D displacements (a detailed descriptionof strain).
2.3 Parameter estimation with unknown or biased LVpressure offset
Our second goal in this study is to assess the accuracyof parameter estimation using pressure measurements withunknown or biased offset values. In order to achieve thisgoal, synthetic cases with ground-truth values provide aclean set of benchmarks to quantitatively analyze the errorintroduced with the presence of pressure offsets. These syn-thetic recordings represent idealized non-invasive pressuredata from imaging methods (such as UCA Geoffrey et al.2003; Forsberg et al. 2005; Dave et al. 2012 or relative pres-sure fields from velocity data Krittian et al. 2012; Song etal. 1994; Yotti et al. 2011). Note that the scope of this workis not to provide a complete methodological pipeline fromimage measurements to diastolic biomarkers, but to assessthe feasibility and potential of using non-invasive pressureestimation methods.
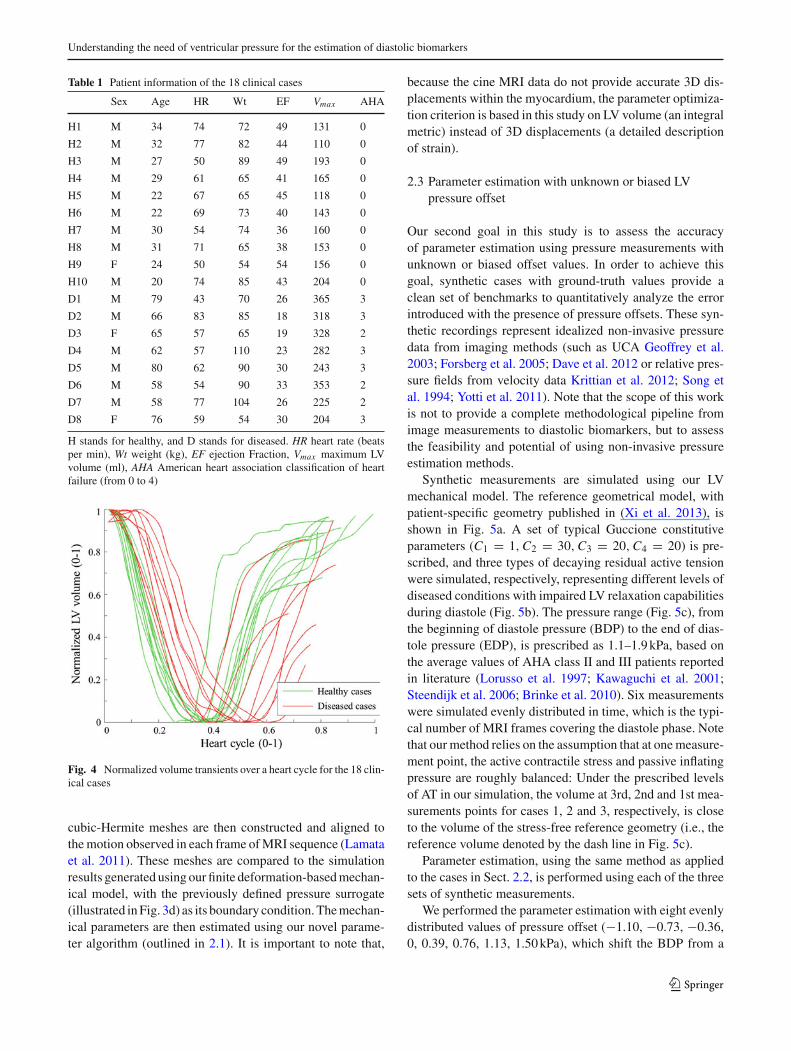
Synthetic measurements are simulated using our LVmechanical model. The reference geometrical model, withpatient-specific geometry published in (Xi et al. 2013), isshown in Fig. 5a. A set of typical Guccione constitutiveparameters (C1 = 1, C2 = 30, C3 = 20, C4 = 20) is pre-scribed, and three types of decaying residual active tensionwere simulated, respectively, representing different levels ofdiseased conditions with impaired LV relaxation capabilitiesduring diastole (Fig. 5b). The pressure range (Fig. 5c), fromthe beginning of diastole pressure (BDP) to the end of dias-tole pressure (EDP), is prescribed as 1.1–1.9 kPa, based onthe average values of AHA class II and III patients reportedin literature (Lorusso et al. 1997; Kawaguchi et al. 2001;Steendijk et al. 2006; Brinke et al. 2010). Six measurementswere simulated evenly distributed in time, which is the typi-cal number of MRI frames covering the diastole phase. Notethat our method relies on the assumption that at one measure-ment point, the active contractile stress and passive inflatingpressure are roughly balanced: Under the prescribed levelsof AT in our simulation, the volume at 3rd, 2nd and 1st mea-surements points for cases 1, 2 and 3, respectively, is closeto the volume of the stress-free reference geometry (i.e., thereference volume denoted by the dash line in Fig. 5c).
Parameter estimation, using the same method as appliedto the cases in Sect. 2.2, is performed using each of the threesets of synthetic measurements.
We performed the parameter estimation with eight evenlydistributed values of pressure offset (−1.10, −0.73, −0.36,0, 0.39, 0.76, 1.13, 1.50 kPa), which shift the BDP from a
123
J. Xi et al.
Fig. 5 Illustration of the generation of three synthetic measurementsused for parameter estimation experiments. a Stress-free referencegeometry (visualized with one slice of short axis cine MRI), a patient-specific geometrical model constructed from MR images (Xi et al.2013). b Three types of decaying residual active tension profiles, whichare prescribed in the synthetic simulations to present three levels ofdisease conditions (i.e., impaired relaxation during early diastole).c Volume of the six simulated synthetic measurements (six states dur-ing diastole) for each case, together with the corresponding prescribedLV pressure. Note that since the reference geometry and constitutiveparameters are assumed to be the same for the three synthetic cases andthe residual tension is zero at end-diastole, the simulated end-diastolicvolume is thus the same
minimum of 0 kPa to a maximum of 2.6 kPa, correspond-ing to the physiological range of BDP reported in literature(Lorusso et al. 1997; Kawaguchi et al. 2001; Steendijk et al.2006; Brinke et al. 2010).
3 Results
We present the results of parameter estimation either usingthe literature-based pressure surrogate (PZ ) or introducingpressure offset errors in the following two subsections.
3.1 Feasibility of parameter estimation without anypressure data
Figure 6 plots the α values (stiffness, defined in Xi et al.2013) of the estimated Guccione parameters for the 18 clin-ical cases using PZ . Overall, there is a significant differencebetween healthy and diseased cases in terms of the stiffnessimplied by α, which agrees with the prior knowledge of dis-ease classification. However, it is likely that the difference inthe α values between the healthy and diseased cases couldbe already implied by the difference in the ejection fraction(EF) calculated from the volume (further details in discussionsection).
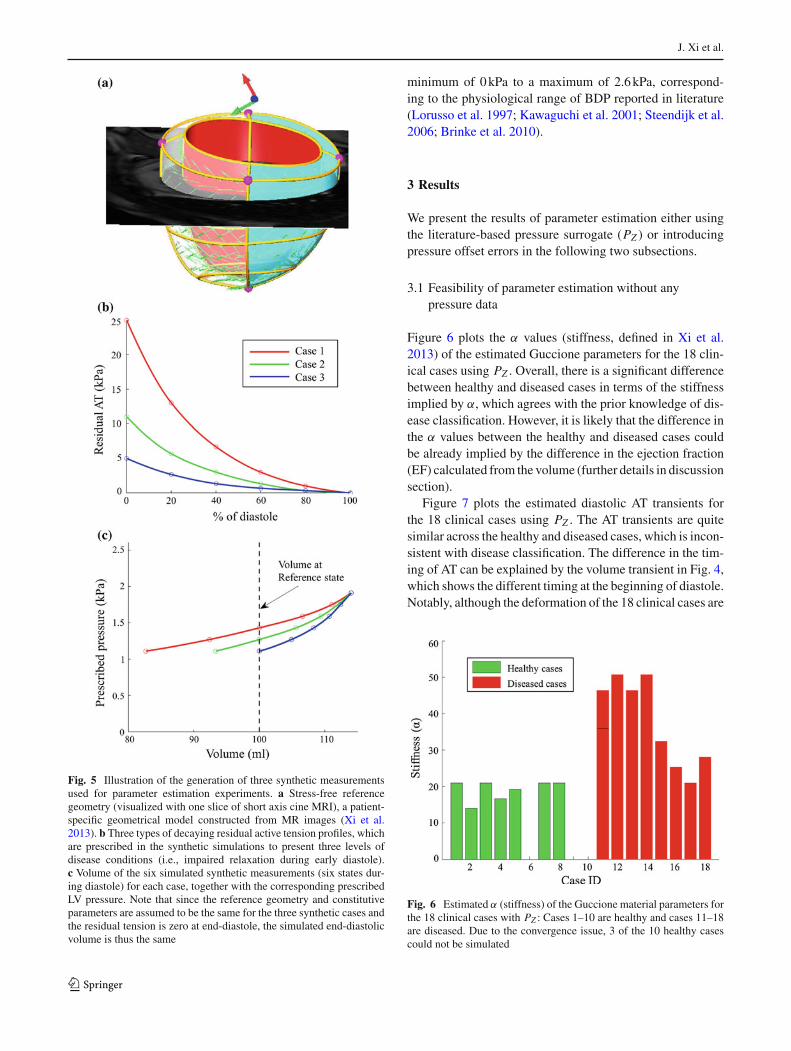
Figure 7 plots the estimated diastolic AT transients forthe 18 clinical cases using PZ . The AT transients are quitesimilar across the healthy and diseased cases, which is incon-sistent with disease classification. The difference in the tim-ing of AT can be explained by the volume transient in Fig. 4,which shows the different timing at the beginning of diastole.Notably, although the deformation of the 18 clinical cases are
Fig. 6 Estimated α (stiffness) of the Guccione material parameters forthe 18 clinical cases with PZ : Cases 1–10 are healthy and cases 11–18are diseased. Due to the convergence issue, 3 of the 10 healthy casescould not be simulated
123
Understanding the need of ventricular pressure for the estimation of diastolic biomarkers
Fig. 7 Estimated diastolic AT transient for the 18 clinical cases withPZ . Transients are grouped by disease class: healthy (green) and dis-eased (red). As described in (Xi et al. 2013), AT transients shown hereare fitted exponential curves
significantly different (in terms of the LV volume and ejectionfraction), surprisingly the estimated AT transients (especiallyin terms of the maximal AT) are similar, indicating that AT islikely to be highly coupled with the prescribed pressure. Thisdifference in the estimated AT transients between healthy anddiseased cases is significantly smaller then that reported in(Xi et al. 2013) using the measured LV pressure.
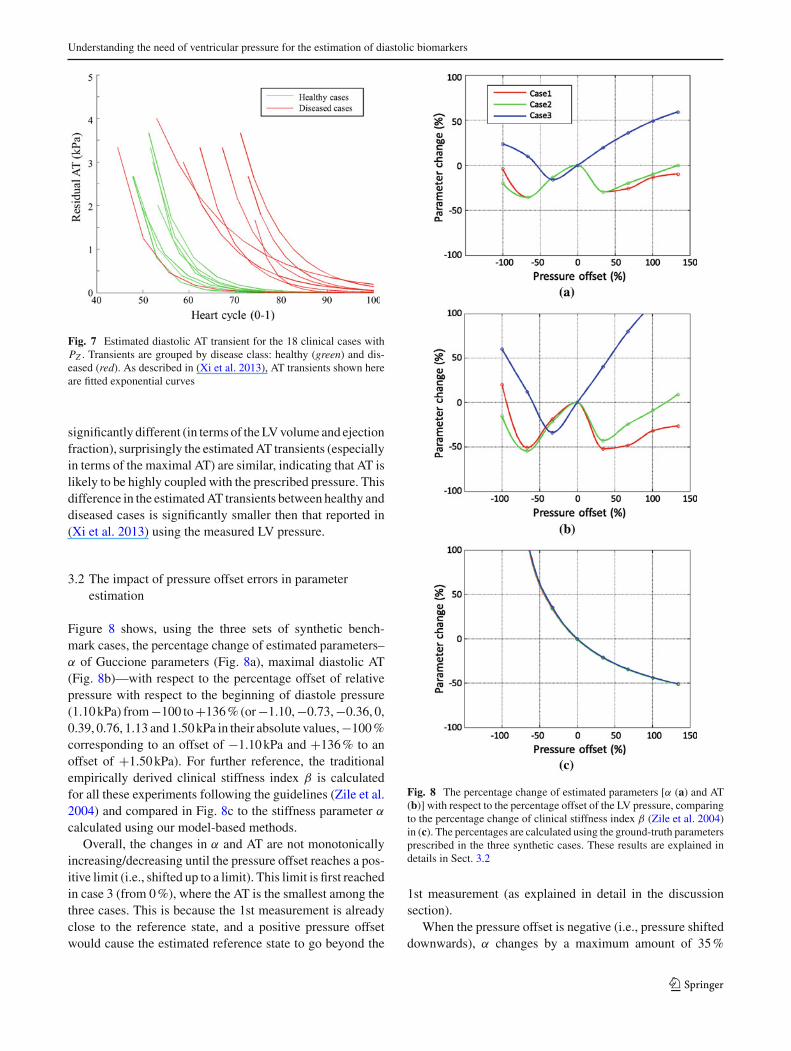
3.2 The impact of pressure offset errors in parameterestimation
Figure 8 shows, using the three sets of synthetic bench-mark cases, the percentage change of estimated parameters–α of Guccione parameters (Fig. 8a), maximal diastolic AT(Fig. 8b)—with respect to the percentage offset of relativepressure with respect to the beginning of diastole pressure(1.10 kPa) from −100 to +136 % (or −1.10, −0.73, −0.36, 0,0.39, 0.76, 1.13 and 1.50 kPa in their absolute values, −100 %corresponding to an offset of −1.10 kPa and +136 % to anoffset of +1.50 kPa). For further reference, the traditionalempirically derived clinical stiffness index β is calculatedfor all these experiments following the guidelines (Zile et al.2004) and compared in Fig. 8c to the stiffness parameter α
calculated using our model-based methods.Overall, the changes in α and AT are not monotonically
increasing/decreasing until the pressure offset reaches a pos-itive limit (i.e., shifted up to a limit). This limit is first reachedin case 3 (from 0 %), where the AT is the smallest among thethree cases. This is because the 1st measurement is alreadyclose to the reference state, and a positive pressure offsetwould cause the estimated reference state to go beyond the
Fig. 8 The percentage change of estimated parameters [α (a) and AT(b)] with respect to the percentage offset of the LV pressure, comparingto the percentage change of clinical stiffness index β (Zile et al. 2004)in (c). The percentages are calculated using the ground-truth parametersprescribed in the three synthetic cases. These results are explained indetails in Sect. 3.2
1st measurement (as explained in detail in the discussionsection).
When the pressure offset is negative (i.e., pressure shifteddownwards), α changes by a maximum amount of 35 %
123
J. Xi et al.
(in contrast, β changes by −51 to +1120 %), and AT bya maximum of 60 %. The maximal error ranges for α andAT also hold for the positive pressure offset, but not afterthe monotonically increasing limit, after which the estimatedparameter will increase without an upper bound.
In the ±30 % window of pressure offset, which corre-sponds to the reported maximal measurement error 0.33 kPausing the current state-of-art non-invasive pressure estima-tion method (Dave et al. 2012), the maximal changes are27 % for α and 45 % for AT, respectively. In the ±16 % win-dow of pressure offset, which corresponds to the reportedmean error (0.17 kPa) in the pressure estimation, the maximalchanges become 11 % for α and 22 % for AT, respectively.It is important to note that based on the published resultsin (Xi et al. 2013), the healthy and diseased cases have dif-ferences of approximately 42 % in α, and 69 % in AT. Assuch, under the mean error assumption, these results showpromise for delineating the healthy and diseased cases usingpressure obtained from current imaging-based non-invasiveestimation methods.
4 Discussion
We have performed the first study, to the best of our knowl-edge, to analyze the feasibility of using literature-based pres-sure surrogates, and the impact of pressure offset errors, in theproblem of inverse parameter estimation in ventricular dias-tole. In the following, we discuss the reliability and implica-tions of the parameter estimation results using both sourcesof LV pressure information.
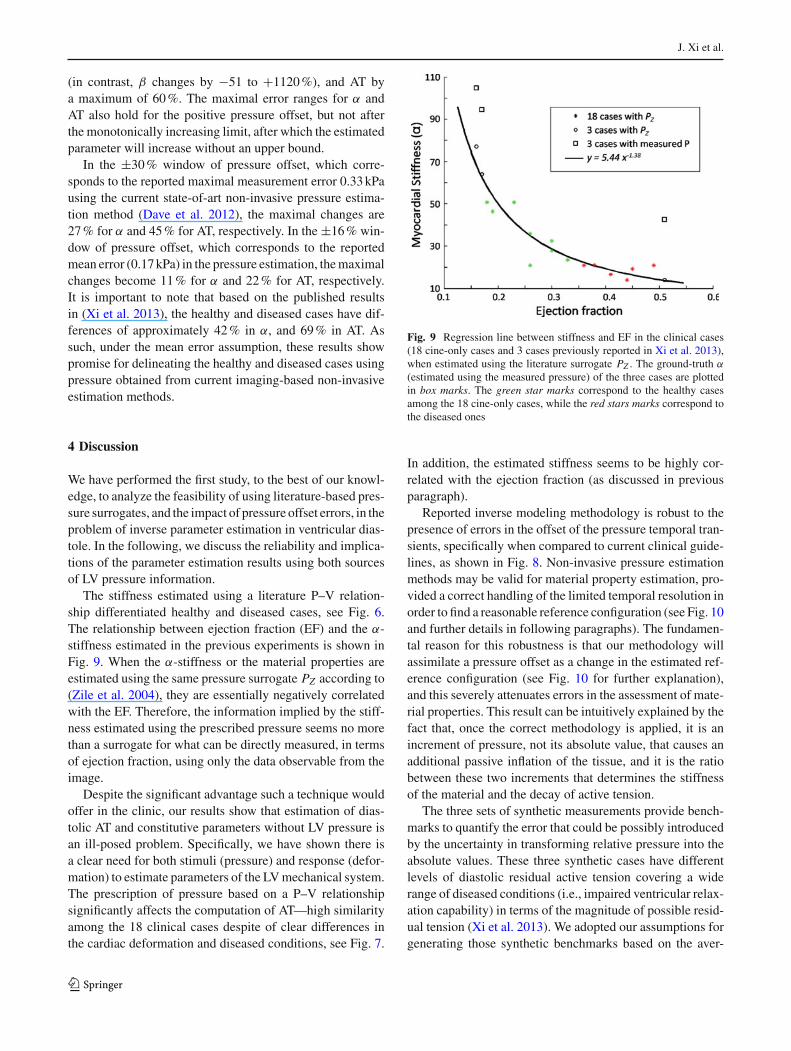
The stiffness estimated using a literature P–V relation-ship differentiated healthy and diseased cases, see Fig. 6.The relationship between ejection fraction (EF) and the α-stiffness estimated in the previous experiments is shown inFig. 9. When the α-stiffness or the material properties areestimated using the same pressure surrogate PZ according to(Zile et al. 2004), they are essentially negatively correlatedwith the EF. Therefore, the information implied by the stiff-ness estimated using the prescribed pressure seems no morethan a surrogate for what can be directly measured, in termsof ejection fraction, using only the data observable from theimage.
Despite the significant advantage such a technique wouldoffer in the clinic, our results show that estimation of dias-tolic AT and constitutive parameters without LV pressure isan ill-posed problem. Specifically, we have shown there isa clear need for both stimuli (pressure) and response (defor-mation) to estimate parameters of the LV mechanical system.The prescription of pressure based on a P–V relationshipsignificantly affects the computation of AT—high similarityamong the 18 clinical cases despite of clear differences inthe cardiac deformation and diseased conditions, see Fig. 7.
Fig. 9 Regression line between stiffness and EF in the clinical cases(18 cine-only cases and 3 cases previously reported in Xi et al. 2013),when estimated using the literature surrogate PZ . The ground-truth α
(estimated using the measured pressure) of the three cases are plottedin box marks. The green star marks correspond to the healthy casesamong the 18 cine-only cases, while the red stars marks correspond tothe diseased ones
In addition, the estimated stiffness seems to be highly cor-related with the ejection fraction (as discussed in previousparagraph).
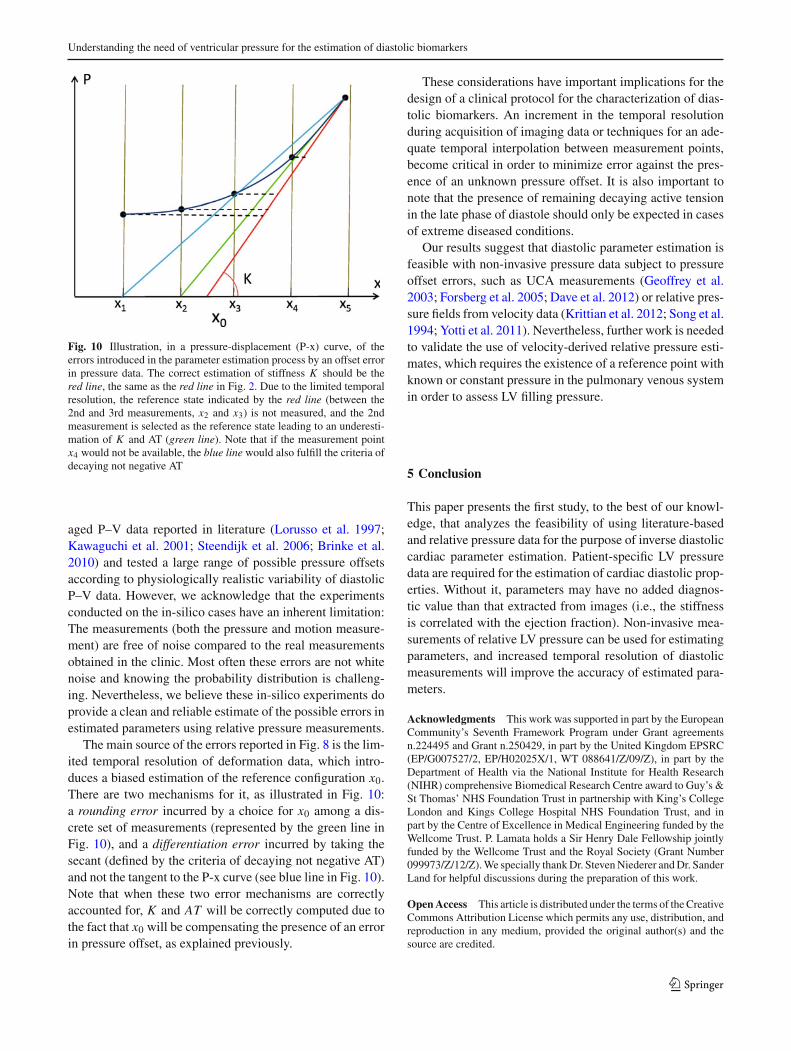
Reported inverse modeling methodology is robust to thepresence of errors in the offset of the pressure temporal tran-sients, specifically when compared to current clinical guide-lines, as shown in Fig. 8. Non-invasive pressure estimationmethods may be valid for material property estimation, pro-vided a correct handling of the limited temporal resolution inorder to find a reasonable reference configuration (see Fig. 10and further details in following paragraphs). The fundamen-tal reason for this robustness is that our methodology willassimilate a pressure offset as a change in the estimated ref-erence configuration (see Fig. 10 for further explanation),and this severely attenuates errors in the assessment of mate-rial properties. This result can be intuitively explained by thefact that, once the correct methodology is applied, it is anincrement of pressure, not its absolute value, that causes anadditional passive inflation of the tissue, and it is the ratiobetween these two increments that determines the stiffnessof the material and the decay of active tension.
The three sets of synthetic measurements provide bench-marks to quantify the error that could be possibly introducedby the uncertainty in transforming relative pressure into theabsolute values. These three synthetic cases have differentlevels of diastolic residual active tension covering a widerange of diseased conditions (i.e., impaired ventricular relax-ation capability) in terms of the magnitude of possible resid-ual tension (Xi et al. 2013). We adopted our assumptions forgenerating those synthetic benchmarks based on the aver-
123
Understanding the need of ventricular pressure for the estimation of diastolic biomarkers
Fig. 10 Illustration, in a pressure-displacement (P-x) curve, of theerrors introduced in the parameter estimation process by an offset errorin pressure data. The correct estimation of stiffness K should be thered line, the same as the red line in Fig. 2. Due to the limited temporalresolution, the reference state indicated by the red line (between the2nd and 3rd measurements, x2 and x3) is not measured, and the 2ndmeasurement is selected as the reference state leading to an underesti-mation of K and AT (green line). Note that if the measurement pointx4 would not be available, the blue line would also fulfill the criteria ofdecaying not negative AT
aged P–V data reported in literature (Lorusso et al. 1997;Kawaguchi et al. 2001; Steendijk et al. 2006; Brinke et al.2010) and tested a large range of possible pressure offsetsaccording to physiologically realistic variability of diastolicP–V data. However, we acknowledge that the experimentsconducted on the in-silico cases have an inherent limitation:The measurements (both the pressure and motion measure-ment) are free of noise compared to the real measurementsobtained in the clinic. Most often these errors are not whitenoise and knowing the probability distribution is challeng-ing. Nevertheless, we believe these in-silico experiments doprovide a clean and reliable estimate of the possible errors inestimated parameters using relative pressure measurements.
The main source of the errors reported in Fig. 8 is the lim-ited temporal resolution of deformation data, which intro-duces a biased estimation of the reference configuration x0.There are two mechanisms for it, as illustrated in Fig. 10:a rounding error incurred by a choice for x0 among a dis-crete set of measurements (represented by the green line inFig. 10), and a differentiation error incurred by taking thesecant (defined by the criteria of decaying not negative AT)and not the tangent to the P-x curve (see blue line in Fig. 10).Note that when these two error mechanisms are correctlyaccounted for, K and AT will be correctly computed due tothe fact that x0 will be compensating the presence of an errorin pressure offset, as explained previously.
These considerations have important implications for thedesign of a clinical protocol for the characterization of dias-tolic biomarkers. An increment in the temporal resolutionduring acquisition of imaging data or techniques for an ade-quate temporal interpolation between measurement points,become critical in order to minimize error against the pres-ence of an unknown pressure offset. It is also important tonote that the presence of remaining decaying active tensionin the late phase of diastole should only be expected in casesof extreme diseased conditions.
Our results suggest that diastolic parameter estimation isfeasible with non-invasive pressure data subject to pressureoffset errors, such as UCA measurements (Geoffrey et al.2003; Forsberg et al. 2005; Dave et al. 2012) or relative pres-sure fields from velocity data (Krittian et al. 2012; Song et al.1994; Yotti et al. 2011). Nevertheless, further work is neededto validate the use of velocity-derived relative pressure esti-mates, which requires the existence of a reference point withknown or constant pressure in the pulmonary venous systemin order to assess LV filling pressure.
5 Conclusion
This paper presents the first study, to the best of our knowl-edge, that analyzes the feasibility of using literature-basedand relative pressure data for the purpose of inverse diastoliccardiac parameter estimation. Patient-specific LV pressuredata are required for the estimation of cardiac diastolic prop-erties. Without it, parameters may have no added diagnos-tic value than that extracted from images (i.e., the stiffnessis correlated with the ejection fraction). Non-invasive mea-surements of relative LV pressure can be used for estimatingparameters, and increased temporal resolution of diastolicmeasurements will improve the accuracy of estimated para-meters.
Acknowledgments This work was supported in part by the EuropeanCommunity’s Seventh Framework Program under Grant agreementsn.224495 and Grant n.250429, in part by the United Kingdom EPSRC(EP/G007527/2, EP/H02025X/1, WT 088641/Z/09/Z), in part by theDepartment of Health via the National Institute for Health Research(NIHR) comprehensive Biomedical Research Centre award to Guy’s &St Thomas’ NHS Foundation Trust in partnership with King’s CollegeLondon and Kings College Hospital NHS Foundation Trust, and inpart by the Centre of Excellence in Medical Engineering funded by theWellcome Trust. P. Lamata holds a Sir Henry Dale Fellowship jointlyfunded by the Wellcome Trust and the Royal Society (Grant Number099973/Z/12/Z). We specially thank Dr. Steven Niederer and Dr. SanderLand for helpful discussions during the preparation of this work.
Open Access This article is distributed under the terms of the CreativeCommons Attribution License which permits any use, distribution, andreproduction in any medium, provided the original author(s) and thesource are credited.
123
J. Xi et al.
References
Aurigemma G, Gaasch W (2004) Diastolic heart failure. N Engl J Med351(11):1097–1105
Burkhoff D, Mirsky I, Suga H (2005) Assessment of systolic and dias-tolic ventricular properties via pressure-volume analysis: a guide forclinical, translational, and basic researchers. Am J Physiol Heart CircPhysiol 289(2):H501–H512
Chabiniok R, Moireau P, Lesault PF, Rahmouni A, Deux JF, Chapelle D(2011) Estimation of tissue contractility from cardiac cine-mri usinga biomechanical heart model. Biomech Model Mechanobiol, 1–22:doi:10.1007/s10237-011-0337-8
Chatterjee K (2009) The swan-ganz catheters: past, present, and futurea viewpoint. Circulation 119(1):147–152
Dave J, Halldorsdottir V, Eisenbrey J, Raichlen J, Liu J, McDonald M,Dickie K, Wang S, Leung C, Forsberg F (2012) Noninvasive lv pres-sure estimation using subharmonic emissions from microbubbles.JACC Cardiovasc Imaging 5(1):87
Ebbers T, Wigström L, Bolger A, Engvall J, Karlsson M (2001) Estima-tion of relative cardiovascular pressures using time-resolved three-dimensional phase contrast mri. Magnetic resonance in medicine45(5):872–879
Forsberg F, Liu J, Shi W, Furuse J, Shimizu M, Goldberg B (2005)In vivo pressure estimation using subharmonic contrast microbub-ble signals: proof of concept. IEEE Trans Ultrason Ferroelectr FreqControl 52(4):581–583
Geoffrey C, Rajkumar C, Kooner J, Cooke J, Bulpitt C (2003) Estima-tion of central aortic pressure by sphygmocor requires intra-arterialperipheral pressures. Clin Sci 105:219–225
Hope S, Meredith I, Cameron J (2008) Arterial transfer functions andthe reconstruction of central aortic waveforms: myths, controversiesand misconceptions. J Hypertens 26(1):4
Karamanoglu M, O’Rourke M, Avolio A, Kelly R (1993) An analysisof the relationship between central aortic and peripheral upper limbpressure waves in man. Eur Heart J 14(2):160–167
Kawaguchi A, Sugimachi M, Sunagawa K, Ishibashi-Ueda H, Kara-manoukian H, Batista R (2001) Perioperative hemodynamics inpatients undergoing partial left ventriculectomy. J Cardiac Surg16(1):48–55
Klotz S, Dickstein M, Burkhoff D (2007) A computational methodof prediction of the end-diastolic pressure-volume relationship bysingle beat. Nature Protoc 2(9):2152–2158
Krittian SB, Lamata P, Michler C, Nordsletten DA, Bock J, BradleyCP, Pitcher A, Kilner PJ, Markl M, Smith NP (2012) A finite-element approach to the direct computation of relative cardiovascu-lar pressure from time-resolved mr velocity data. Med Image Anal16(5):1029–1037. doi:10.1016/j.media.2012.04.003
Lamata P, Niederer S, Nordsletten D, Barber DC, Roy I, Hose DR,Smith N (2011) An accurate, fast and robust method to generatepatient-specific cubic hermite meshes. Med Image Anal 15(6):801–813. doi:10.1016/j.media.2011.06.010
Lorusso R, Milan E, Volterrani M, Giubbini R, van der Veen F,Schreuder J, Picchioni A, Alfieri O (1997) Cardiomyoplasty as anisolated procedure to treat refractory heart failure. Eur J CardiothoracSurg 11(2):363–372
Maeder M, Kaye D (2009) Heart failure with normal left ventricularejection fraction. J Am Coll Cardiol 53(11):905–918
Moireau P, Chapelle D (2011) Reduced-order Unscented Kalman Filter-ing with application to parameter identification in large-dimensionalsystems. ESAIM Control Optim Calc Var (COCV) 17:380–405.doi:10.1051/cocv/2010006
Nagel E, Schuster A (2010) Shortening without contraction: newinsights into hibernating myocardium. JACC Cardiovasc Imaging3(7):731
Niederer S, Smith N (2009) The role of the Frank-Starling law in thetransduction of cellular work to whole organ pump function: a com-
putational modeling analysis. PLoS Comput Biol 5(4):e1000371.doi:10.1371/journal.pcbi.1000371
Nordsletten D, Niederer S, Nash M, Hunter P, Smith N (2011) Couplingmulti-physics models to cardiac mechanics. Prog Biophys Mol Biol104(1–3):77–88
Pitcher A, Lamata P, Krittian S, Nordslettern D, Bissell M, Francis J,Cassar T, Barker A, Markl M, Neubauer S, Smith N (2013) Towardsa comprehensive description of relative aortic pressure: insights from4d flow cmr. J Cardiovasc Magn Reson 15(Suppl 1):P243. doi:10.1186/1532-429X-15-S1-P243
Remme EW, Opdahl A, Smiseth OA (2011) Mechanics of left ventric-ular relaxation, early diastolic lengthening, and suction investigatedin a mathematical model. AJP Heart Circul Physiol 300(5):1678.doi:10.1152/ajpheart.00165.2010
Sasayama S, Nonogi H, Sakurai T, Kawai C, Fujita M, Eiho S, KuwaharaM (1984) Assessment of cardiac function by left heart catheteriza-tion: an analysis of left ventricular pressure-volume (length) loops.Journal of cardiography Supplement(1):25–34
Shi W, Zhuang X, Wang H, Luong D, Tobon-Gomez C, Edwards P,Rhode K, Razavi R, Ourselin S, Rueckert D (2012) A comprehensivecardiac motion estimation framework using both untagged and 3dtagged mr images based on non-rigid registration. IEEE Trans MedImaging 31(6):1263–1275. doi:10.1109/TMI.2012.2188104
Solomon S, Stevenson L (2009) Recalibrating the barometer. Circula-tion 119(1):13–15
Song S, Leahy R, Boyd D, Brundage B, Napel S (1994) Determiningcardiac velocity fields and intraventricular pressure distribution froma sequence of ultrafast ct cardiac images. IEEE Trans Med Imaging13(2):386–397
Steendijk P, Tulner S, Bax J, Oemrawsingh P, Bleeker G, van Erven L,Putter H, Verwey H, van der Wall E, Schalij M (2006) Hemodynamiceffects of long-term cardiac resynchronization therapy analysis bypressure-volume loops. Circulation 113(10):1295–1304
ten Brinke E, Klautz R, Tulner S, Verwey H, Bax J, Schalij M, van derWall E, Versteegh M, Dion R, Steendijk P (2010) Long-term effectsof surgical ventricular restoration with additional restrictive mitralannuloplasty and/or coronary artery bypass grafting on left ventricu-lar function: Six-month follow-up by pressure-volume loops. J Tho-rac Cardiovasc Surg 140(6):1338–1344
Urheim S, Bjornerheim R, Endresen K, Vatne K, Rabben S, SorhusV, Smiseth O (2002) Quantification of left ventricular diastolicpressure-volume relations during routine cardiac catheterizationby two-dimensional digital echo quantification and left ventricularmicromanometer. J Am Soc Echocardiogr 15(3):225–232
Wang V, Lam H, Ennis D, Cowan B, Young A, Nash M (2009) Mod-elling passive diastolic mechanics with quantitative MRI of cardiacstructure and function. Med Image Anal 13(5):773–784
Wang V, Lam H, Ennis D, Cowan B, Young A, Nash M (2010) Cardiacactive contraction parameters estimated from magnetic resonanceimaging. Stat Atlases Comput Models Heart, vol 6364. pp 194–203
Westermann D, Kasner M, Steendijk P, Spillmann F, Riad A, WeitmannK, Hoffmann W, Poller W, Pauschinger M, Schultheiss H et al (2008)Role of left ventricular stiffness in heart failure with normal ejectionfraction. Circulation 117(16):2051–2060
Xi J, Lamata P, Lee J, Moireau P, Chapelle D, Smith N (2011) Myocar-dial transversely isotropic material parameter estimation from in-silico measurements based on a reduced-order unscented kalmanfilter. J Mech Behav Biomed Mater 4(7):1090–1102
Xi J, Lamata P, Niederer S, Land S, Shi W, Zhuang X, Ourselin S,Duckett SG, Shetty AK, Rinaldi CA, Rueckert D, Razavi R, SmithNP (2013) The estimation of patient-specific cardiac diastolic func-tions from clinical measurements. Med Image Anal 17(2):133–146.doi:10.1016/j.media.2012.08.001
Yotti R, Bermejo J, Benito Y, Antoranz JC, Desco MM, Rodrguez-Prez D, Cortina C, Mombiela T, Barrio A, Elzaga J, Fernndez-AvilsF (2011) Noninvasive estimation of the rate of relaxation by the
123

Understanding the need of ventricular pressure for the estimation of diastolic biomarkers
analysis of intraventricular pressure gradients. Circul CardiovascImaging 4(2):94–104
Zile M, Brutsaert D (2002) New concepts in diastolic dysfunction anddiastolic heart failure: part I. Circulation 105(11):1387–1393
Zile M, Baicu C, Gaasch W (2004) Diastolic heart failure—abnormalities in active relaxation and passive stiffness of the leftventricle. N Engl J Med 350(19):1953–1959
123
Related Documents