For more information, [email protected] or 617-253-7054 please visit our website at http://ebusiness.mit.edu or contact the Center directly at A research and education initiative at the MIT Sloan School of Management Understanding the Impact of Marketing Actions in Traditional Channels on the Internet: Evidence from a Large Scale Field Experiment Paper 216 Eric Anderson Erik Brynjolfsson Yu (Jeffrey) Hu Duncan Simester January 2005

Welcome message from author
This document is posted to help you gain knowledge. Please leave a comment to let me know what you think about it! Share it to your friends and learn new things together.
Transcript

For more information,
[email protected] or 617-253-7054 please visit our website at http://ebusiness.mit.edu
or contact the Center directly at
A research and education initiative at the MIT Sloan School of Management
Understanding the Impact of Marketing Actions in Traditional Channels on the
Internet: Evidence from a Large Scale Field Experiment
Paper 216 Eric Anderson Erik Brynjolfsson Yu (Jeffrey) Hu Duncan Simester
January 2005
Understanding the Impact of Marketing Actions in Traditional Channels on the Internet: Evidence from a Large Scale Field Experiment
Eric Anderson
Kellogg School of Management, Northwestern University
Erik Brynjolfsson Sloan School of Management, MIT
Yu (Jeffrey) Hu
Sloan School of Management, MIT
Duncan Simester Sloan School of Management, MIT
ABSTRACT This paper studies the conflicts and complementarities between traditional marketing channels, such as a catalog, and the Internet channel. Two effects are modeled: a potential conflict due to substitution between channels, and a potential complementarity, due to increased overall awareness of the company’s products. A large-scale field experiment was conducted with a retailer of apparel and outdoor gear that has both a catalog channel and an Internet channel to formally test these hypotheses. A sample of 9,824 of the company’s “Best” customers was selected together with a separate sample of 9,683 of the company’s “Good” customers. Customers from each of these samples were then randomly assigned to equal-sized Test and Control groups, yielding a total of four groups.
We find that marketing actions in the catalog channel do indeed have a significant impact on the demand via the Internet. Interestingly, sending additional catalogs to Best customers tends to crowd out sales on the Internet, while sending catalogs to Good customers tends to increase Internet sales. Furthermore, sending additional catalogs to Good customers who are also prior Internet users led to a big increase in demand through the Internet and a smaller increase through the catalog channel. On the other hand, sending additional catalogs to Best customers who are prior Internet users caused such a large shift in demand from the Internet to the catalog channel that the net effect on overall demand was actually negative. Part of the explanation for this effect is that Internet orders are larger in size and more frequently have items from different categories. We interpret this as evidence that the Internet channel, because of its user-friendly searching, browsing and recommendation capabilities, may lead to more impulse purchasing compared with the catalog channel.
Our results suggest that retailers who ignore cross channel conflicts and complements will send too many catalogs to their “best” customers, too few to their “good” customers, and miss opportunities to drive customers to the Internet channel.
Acknowledgements: We thank participants at the 2004 Workshop on Information Systems and Economics (WISE) for valuable comments on this paper. Generous financial support was provided by the Center for eBusiness at MIT under a grant from Amazon.com.
1. Introduction
Today most firms use the Internet channel, in addition to their traditional marketing channels
such as physical stores and catalogs, to reach their customers.1 As the proportion of revenue
brought in by the Internet channel grows, firms increasingly worry about the interaction between
the Internet channel and traditional marketing channels. How will marketing actions in
traditional channels spillover to the Internet channel, and vice versa? Will marketing plans that
are profitable in the absence of the Internet channel still make sense in the presence of the
Internet channel? Do marketing actions in one channel increase overall sales, or simply lead to
substitutions from other channels? Answers to these questions have important economic
consequences and equally important managerial implications.
Understanding the cross-channel impact of marketing actions is especially important for the
direct marketing industry. The direct marketing industry has a long-standing tradition of
conducting repeated split-sample tests in which randomly selected samples of customers are
exposed to different marketing actions. In the past customers have responded either by mail or
telephone, which has allowed the firm to track which conditions a certain customer was exposed
to. The Internet now offers a new channel through which customers can place orders. In practice,
firms have found it much harder to match customers with marketing actions these customers are
exposed to, in the presence of the Internet channel. This issue has undermined the marketing
plans of many firms. For example, the reduction in response rates over the traditional mail and
telephone ordering channels led some firms to conclude that the return on their investment in
mailing catalogs no longer justifies the cost of the catalogs. However, when these firms reduced
their mailing rates they sometimes saw drops in demand on their Internet channel, a potential
consequence that they had not anticipated when designing their mailing policies. In discussions
1 Aberdeen Group surveyed more than 500 retailing and business-to-business firms and reported that 84.1% of these firms have an Internet channel in addition to traditional channels. (Aberdeen 2004)
2

with a wide range of direct-marketing firms, managers at these firms have identified this issue of
understanding cross-channel effects as one of the most important problems facing the retail
industry.
Surprisingly there has been very little work documenting how marketing actions in one channel
affect demand in other channels. In this paper we report the findings from a large-scale field
experiment that investigates this issue. The experiment was conducted with a retailer of apparel
and outdoor gear that has both a catalog channel and an Internet channel. A sample of 9,824 of
the company’s “Best” customers was selected together with a separate sample of 9,683 of the
company’s “Good” customers.2 Customers from each of these samples were then randomly
assigned to equal-sized Test and Control groups, yielding a total of four groups: Test and Control
for both Best and Good customers. Customers in the two Test groups were mailed 17 catalogs
over a nine-month period. Customers in the two Control groups received just 12 catalogs over
this period. We then separately measured the demand from each group through the catalog (mail
and telephone) and Internet channels.
Sending additional catalogs can potentially have two effects on demand. First, it can be thought
of as increasing advertising and knowledge of the company’s products, and thus causes an
increase in overall demand. Second, it may simply shift demand from the Internet to the catalog
channel. Which effect will be important in practice? Our findings confirm the existence of both
effects. When different subsamples are studied, an interesting dichotomy is revealed. Among the
Good customers, mailing additional catalogs yielded a significant increase in demand across both
channels. Apparently, when these customers were reminded more frequently about company’s
products, they ordered more not only via the catalogs, but also via the Internet. The positive
effect on the Internet channel was large and confirms that catalogs have an impact beyond the
2 Customers without at least a “good” prior purchase history, based on recency, frequency and monetary value, were not included in the firm’s experiment.
3

catalog channel. This means that if firms only measure how catalogs affect orders through the
catalog channel they will tend to under-invest in mailing to these Good customers.
In contrast, amongst the Best customers, mailing additional catalogs did not increase demand
over the Internet. In fact, there was a significant reduction in the number of items ordered over
the Internet amongst the Best customers in the Test group, compared to those in the Control
group. We interpreted this finding as evidence of substitution: the Best customers had little scope
for increasing their demand and instead just shifted their demand from the Internet to the catalog
channel. If firms only measure how catalogs affect orders through the catalog channel they will
tend to over-invest in mailing to these Best customers.
We could also examine Internet-intensive customer more intensively. Customers who had
ordered from the Internet before the experiment made a large proportion of their purchases
through the Internet channel after the start of the experiment. Cross-channel effects are more
significant for these prior Internet users than for the general population of customers. Sending
additional catalogs to Good customers who are prior Internet users led to a big increase in
demand through the Internet and a smaller increase through the catalog channel. On the other
hand, sending additional catalogs to Best customers who are prior Internet users caused a shift in
demand from the Internet to the catalog channel. Surprisingly, the net effect on overall demand
was actually negative.
To explore whether a switch of purchases from the Internet channel to the catalog channel
increases a firm’s revenue, we study the difference between the Internet orders and catalog
orders and find that Internet orders are larger in size and more frequently have items from
different categories. We interpret this as evidence that the Internet channel, because of its user-
friendly searching, browsing and recommendation capabilities, may lead to more impulse
4
purchasing compared with the catalog channel. This can help explain why it is so costly when a
firm’s customer shifts from the Internet channel to the catalog.
The remainder of the paper proceeds as follows. In Section 2, we provide a brief review of the
literature related with cross-channel effects. In Section 3, we provide a simple model of how
marketing actions affect demand across channels and use this model to formulate predictions on
how cross-channel effects can be different for different segments of customer. In Section 4, we
describe the design of the field experiment. In Section 5, we present our findings from the
experiment. The paper concludes in Section 6 with some broader implications.
2. Literature Review
There has been some research that uses theoretical models to study how a multi-channel retailer
that has one traditional channel and one Internet channel should set prices optimally. Lal and
Sarvary (1999) compare the optimal prices under two scenarios: selling through stores only and
selling through both stores and the Internet channel, and find that the introduction of an Internet
channel may lead to a higher price. Cattani, Gilland and Swaminathan (2003) study the pricing
decisions of a retailer that has one traditional channel and one Internet channel, when the efforts
a consumer has to make in order to purchase from these two channels are different and the
retailer’s operating costs in these two channels are different. Their computational results show
that the strategy of holding the price in the traditional channel steady and setting the Internet
price to maximize the total profit performs reasonably well. Huang and Swaminanthan (2003)
have similar findings in a setting where the traditional channel and the Internet channel have a
certain degree of substitution. In these papers the Internet channel and the traditional channel are
either assumed to be independent from each other, or assumed to be substitutes for each other
and competing for customer demand. Our paper is not concerned with the pricing strategies of a
5

multi-channel retailer. Instead, we focus how marketing actions in one channel can affect
demand in another channel. It complements this literature by providing empirical evidence that
these two channels can be substitutes for each other for one segment of customers while
complementing each other for another segment of customers.
This paper uses sending catalogs as an example of marketing actions and demonstrates how
marketing actions in one channel can affect the demand through both channels. Because sending
catalogs can be thought of as advertising, this research is related with the literature on the effect
of advertising. There is a long debate in this literature on whether advertising increases overall
demand (informative advertising) or simply redistributes demand among sellers (combative
advertising). These opposing views of the effect of advertising can be traced to Marshall (1919)
and Chamberlin (1933). Researchers have developed theoretical models to analyze these types of
advertising, such as Stigler (1961), Milgrom and Roberts (1986), and Becker and Murphy
(1994). More recently this debate has been renewed when researchers study this question
empirically using data from tobacco advertising. A review can be found in Duffy (1996).
Interestingly, our paper find evidence that supports the existence of both effects: sending
catalogs has both an effect of increasing overall demand and an effect of redistributing demand
among channels. For customers who are already satiated, the main effect is the channel-
switching effect; but for customers who are not satiated yet, the effect on overall demand can be
significant.
3. A Model of How Marketing Actions Affect Demand
In this section, we provide a simple model of how marketing actions affect demand across
channels. This model helps us formulate the hypotheses that we will test using data from a large-
scale field experiment.
6

We assume a multi-channel firm that sells to its customers through both a traditional channel
(catalog) and an Internet channel. The demand through a certain channel is given as the overall
demand times the demand share of that channel. We assume that marketing actions can affect
both the overall demand and the demand share and that these effects can be different for different
customers. More formally, we have:
... 3, 2, 1, ),,(),( == jXASXADD jIjIj (1)
... 3, ,2, 1 )),,(1)(,( =−= jXASXADD jCjCj (2)
where is customer j’s demand through the Internet channel, is customer j’s demand
through the catalog channel, is customer j’s overall demand under marketing action A,
is customer j’s share of demand through the Internet channel, and is customer j’s
characteristics.
IjD CjD
),( jXAD
),( jI XAS jX
The marginal effects of marketing action A are simply the partial derivatives:
... 3, 2, 1, ,),(
),(),(),(
=∂
∂+
∂
∂=
∂
∂j
AXAS
XADXASA
XADA
D jIjjI
jIj (3)
... 3, 2, 1, ,),(
),()),(1(),(
=∂
∂−+−
∂
∂=
∂
∂j
AXAS
XADXASA
XADA
D jIjjI
jCj (4)
where A
XAD j
∂∂ ),(
is the marginal effect of marketing action A on the overall demand,
AXAS jI
∂
∂ ),( is the marginal effect on of marketing action A on the share of demand through the
Internet channel.
We assume that marketing actions have decreasing returns, i.e., it is harder to improve the
overall demand when the overall demand is high than when the overall demand is low. In other
7

words, A
XAD j
∂
∂ ),( is low for high . We also assume that marketing actions have larger
effects on the share of demand through the Internet channel when the share of demand through
the Internet channel is non-zero. This assumption is based on the observation that it is especially
hard to improve the share of Internet channel when a customer has currently a zero share of
Internet channel—this customer either has no Internet access or has a strong aversion to the
Internet channel. In other words,
),( jXAD
AXAS jI
∂
∂ ),( is low for low . ),( jI XAS
In addition, we assume that sending catalogs to customers will have a positive effect on the
overall demand, i.e., 0),(>
∂
∂
AXAD j and a negative effect on the share of Internet channel, i.e.,
0),(<
∂
∂
AXAS jI . We are now ready to derive predictions on how sending catalogs can have
different effects on demand for different segments of customers.
Customers who Have High Overall Demand and Small Share of Internet Channel
For customers who have already been purchasing a lot but very few of their purchases are
through the Internet channel, the marginal effect of sending catalogs on the overall demand and
the marginal effect on the share of Interne channel are both small, i.e., A
XAD j
∂
∂ ),( and
AXAS jI
∂
∂ ),( are both low. By definition, these customers have high and low
. Thus, the marginal effect of sending catalogs on the demand through the Internet, as
shown in equation (3), is dominated by
),( jXAD
),( jI XAS
AXAS
XAD jIj ∂∂ ),(
),( which is a small negative effect.
On the other hand, the marginal effect of sending catalogs on the demand through the catalog
8

channel, as shown in equation (4), is the sum of two small positive terms, resulting in a small
positive effect.
Customers who Have Low Overall Demand and Small Share of Internet Channel
For customers who have not been purchasing a lot and very few of their purchases are through
the Internet channel, the marginal effect of sending catalogs on the overall demand, A
XAD j
∂
∂ ),(,
dominates the marginal effect on the share of Interne channel, A
XAS jI
∂
∂ ),(. By definition, these
customers have low and low . Thus, the marginal effect of sending catalogs
on the demand through the Internet, as shown in equation (3), is dominated by
),( jXAD ),( jI XAS
),(),(
jIj XAS
AXAD
∂∂
which is a small positive effect. On the other hand, the marginal effect of
sending catalogs on the demand through the catalog channel, as shown in equation (4), is the sum
of a large positive term and a small positive term, resulting in a sizable positive effect.
Customers who Have High Overall Demand and Large Share of Internet Channel
For customers who have already been purchasing a lot and a lot of their purchases are through
the Internet channel, the marginal effect of sending catalogs on the overall demand, A
XAD j
∂
∂ ),(,
is small and the marginal effect on the share of Interne channel, A
XAS jI
∂
∂ ),(, is large. By
definition, these customers have high and large . Thus, the marginal effect
of sending catalogs on the demand through the Internet, as shown in equation (3), is dominated
by
),( jXAD ),( jI XAS
AXAS
XAD jIj ∂∂ ),(
),( which is a sizable negative effect. On the other hand, the marginal
9

effect of sending catalogs on the demand through the catalog channel, as shown in equation (4),
is the sum of a large positive term and a small positive term, resulting in a large positive effect.
Customers who Have Low Overall Demand and Large Share of Internet Channel
For customers who have not been purchasing a lot but a lot of their purchases are through the
Internet channel, the marginal effect on the share of Interne channel, A
jI
∂
XAS∂ ),( and the
marginal effect of sending catalogs on the overall demand, A
j
∂
XAD∂ ),(
),( XAD ),( XAS
, are both large. By
definition, these customers have low and large . Thus, the marginal effect
of sending catalogs on the demand through the Internet, as shown in equation (3), is dominated
by
j jI
),( jIj XAS
A∂),( XAD∂
which is a large positive effect. On the other hand, the marginal effect
of sending catalogs on the demand through the catalog channel, as shown in equation (4), is the
sum of two large positive terms, resulting in a large positive effect.
With these theoretical predictions in place, we are in position to test them with the large scale
field experiment.
4. Design of the Experiment
In this section we will describe the design of the experiment and how data was collected.
The experiment was conducted over a nine-month period from January 1, 2002 to September 31,
2002 with a retailer of apparel and outdoor gear that has both a catalog channel and an Internet
channel. A sample of 9,824 of the company’s “Best” customers was selected together with a
separate sample of 9,683 of the company’s “Good” customers. Customers from each of these
samples were then randomly assigned to equal-sized Test and Control groups, yielding a total of
10
four groups: Test and Control for both Best and Good customers. Customers in the two Control
groups were mailed 12 catalogs over this nine-month period. Customers in the two Test groups
were mailed 5 additional over this period, in addition to the same 12 catalogs that were mailed to
the Control groups. The company then tracked subsequent purchases made by these 19,507
customers that are in the experiment, until June 30, 2003—roughly nine months after the last test
catalog was mailed. From the company’s past experience, it can take up to 15 weeks for
customers to respond to catalog mailing. Thus, in order to make sure we cover all the purchases
that may have resulted from the mailing of the 17 test catalogs, we will use in our demand
analyses consumers’ purchasing data in a eighteen-month period from the start of mailing the
first test catalog (January 1, 2002) until nine months after the mailing of the last test catalog
(June 30, 2003). It is worth mentioning that consumers in the Control groups and the Test groups
would, on average, get the same catalog mailing treatment after the last test catalog was mailed,
because customers were randomly assigned to each group.
The tracking of a customer’s purchasing history is made possible by the use of a unique account
number for each customer. In transaction data, there exists a flag that indicates whether an order
is placed through the Internet channel or the catalog channel. For an order placed through the
catalog channel, we can even pinpoint which catalog it is placed from. In addition, we have data
of these 19,507 customers’ entire purchasing history before the experiment, up to June 24, 1988.
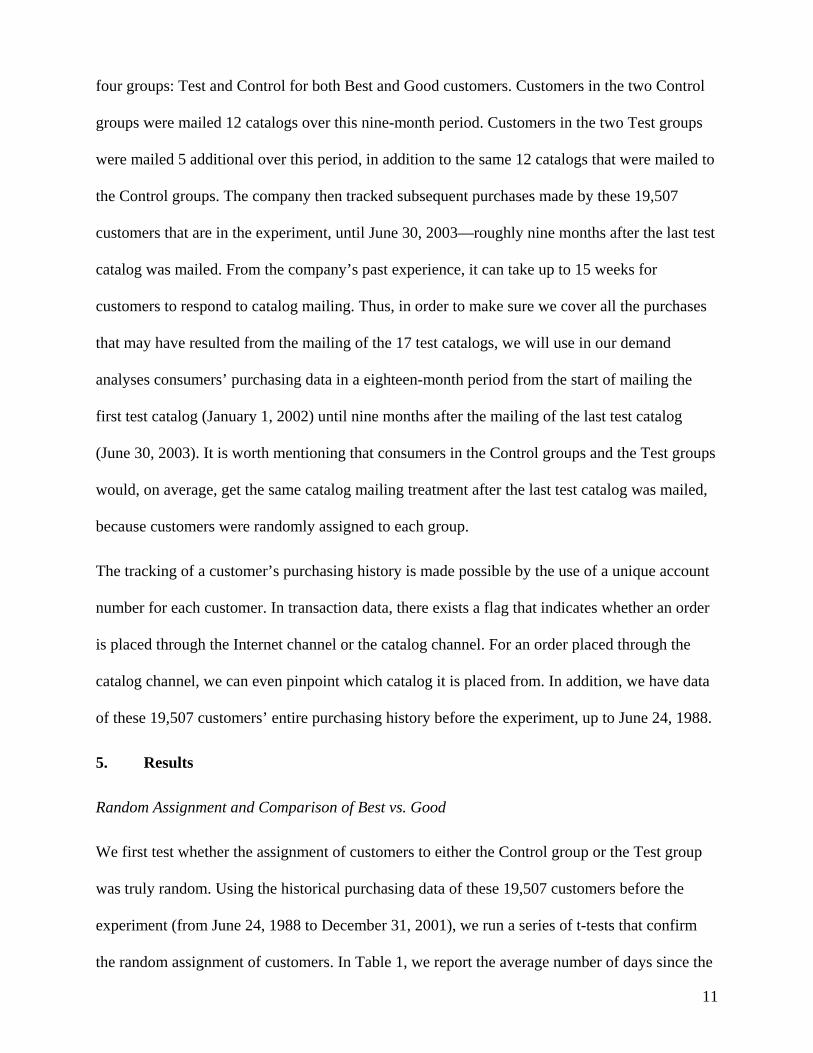
5. Results
Random Assignment and Comparison of Best vs. Good
We first test whether the assignment of customers to either the Control group or the Test group
was truly random. Using the historical purchasing data of these 19,507 customers before the
experiment (from June 24, 1988 to December 31, 2001), we run a series of t-tests that confirm
the random assignment of customers. In Table 1, we report the average number of days since the
11
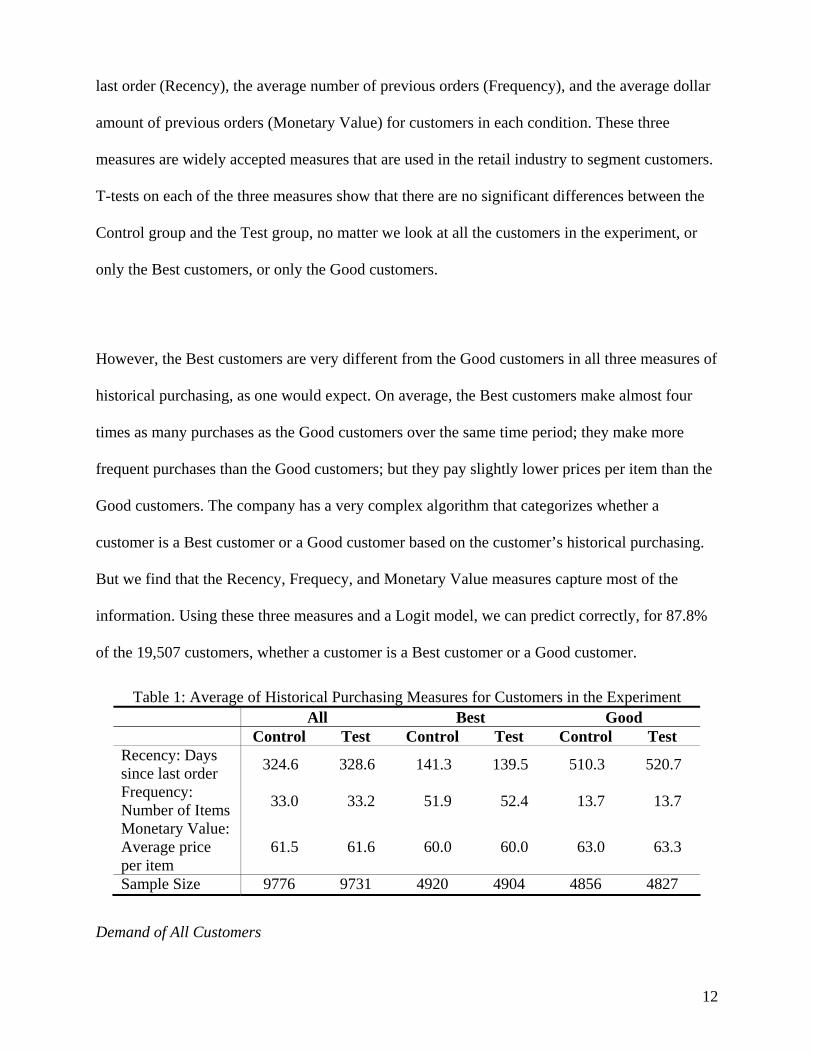
last order (Recency), the average number of previous orders (Frequency), and the average dollar
amount of previous orders (Monetary Value) for customers in each condition. These three
measures are widely accepted measures that are used in the retail industry to segment customers.
T-tests on each of the three measures show that there are no significant differences between the
Control group and the Test group, no matter we look at all the customers in the experiment, or
only the Best customers, or only the Good customers.
However, the Best customers are very different from the Good customers in all three measures of
historical purchasing, as one would expect. On average, the Best customers make almost four
times as many purchases as the Good customers over the same time period; they make more
frequent purchases than the Good customers; but they pay slightly lower prices per item than the
Good customers. The company has a very complex algorithm that categorizes whether a
customer is a Best customer or a Good customer based on the customer’s historical purchasing.
But we find that the Recency, Frequecy, and Monetary Value measures capture most of the
information. Using these three measures and a Logit model, we can predict correctly, for 87.8%
of the 19,507 customers, whether a customer is a Best customer or a Good customer.
Table 1: Average of Historical Purchasing Measures for Customers in the Experiment All Best Good Control Test Control Test Control Test Recency: Days since last order 324.6 328.6 141.3 139.5 510.3 520.7
Frequency: Number of Items 33.0 33.2 51.9 52.4 13.7 13.7
Monetary Value: Average price per item
61.5 61.6 60.0 60.0 63.0 63.3
Sample Size 9776 9731 4920 4904 4856 4827
Demand of All Customers
12

Having confirmed the random assignment of consumers to either the Control group or the Test
group, we next study the effect of mailing additional catalogs on demand. Table 2 presents the
average number of items ordered by customers in the Control group and the Test group. We see
that sending additional catalogs to the Test group increases the total number of items ordered per
customer from 3.873 to 4.070. This increase mostly comes from the catalog channel. The effect
on the number of items ordered per customer through the Internet channel is positive, but very
small and statistically insignificant. This result seems to suggest that marketing actions in the
catalog channel have no significant impact on the Internet channel.
Table 2: Average Number of Items Ordered by Customers in the Experiment
All Control Test Difference
Average number of items ordered
3.873 4.070 0.197
From Internet
0.382 0.394 0.012
From catalogs
3.491 3.676 0.185*
Sample Size 9776 9731 (Note: * significantly from zero in a two-tailed t-test, p<0.05, ** significantly from zero in a two-tailed t-test, p<0.01)
Comparing Best versus Good Customers
However, this cross-channel effect becomes significant once the total population is segmented
into the Best customers and the Good customers. Table 3 shows the effect of mailing additional
catalogs on the demand by the Good customers and on the demand by the Best customers
respectively. As we mentioned before, the Best customers are very different from the Good
customers in terms of historical purchasing. Therefore, they may respond differently to the
mailing of additional catalogs. There indeed exists an interesting dichotomy. Sending additional
catalogs to the Best customers leads to an increase in the number of items ordered through the
13
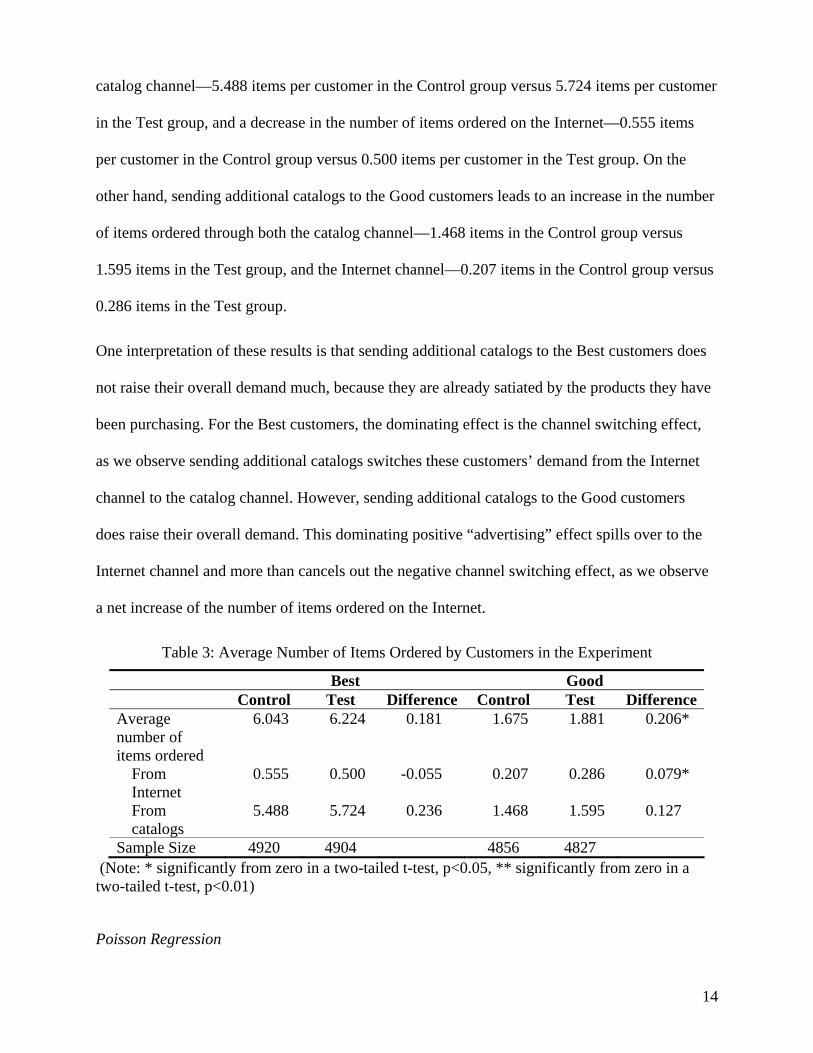
catalog channel—5.488 items per customer in the Control group versus 5.724 items per customer
in the Test group, and a decrease in the number of items ordered on the Internet—0.555 items
per customer in the Control group versus 0.500 items per customer in the Test group. On the
other hand, sending additional catalogs to the Good customers leads to an increase in the number
of items ordered through both the catalog channel—1.468 items in the Control group versus
1.595 items in the Test group, and the Internet channel—0.207 items in the Control group versus
0.286 items in the Test group.
One interpretation of these results is that sending additional catalogs to the Best customers does
not raise their overall demand much, because they are already satiated by the products they have
been purchasing. For the Best customers, the dominating effect is the channel switching effect,
as we observe sending additional catalogs switches these customers’ demand from the Internet
channel to the catalog channel. However, sending additional catalogs to the Good customers
does raise their overall demand. This dominating positive “advertising” effect spills over to the
Internet channel and more than cancels out the negative channel switching effect, as we observe
a net increase of the number of items ordered on the Internet.
Table 3: Average Number of Items Ordered by Customers in the Experiment
Best Good Control Test Difference Control Test Difference
Average number of items ordered
6.043 6.224 0.181 1.675 1.881 0.206*
From Internet
0.555 0.500 -0.055 0.207 0.286 0.079*
From catalogs
5.488 5.724 0.236 1.468 1.595 0.127
Sample Size 4920 4904 4856 4827 (Note: * significantly from zero in a two-tailed t-test, p<0.05, ** significantly from zero in a two-tailed t-test, p<0.01)
Poisson Regression
14

Although the differences in demand between the Control group and the Test group reported in
Table 3 are sizable, t-tests does not prove the differences are statistically significant, except for
the difference in demand between the Good customers in the Control group and the Good
customers in the Test group. We suspect that this might have resulted from the data’s deviation
from normality. Among 19,507 customers in this experiment, only 58.8% of them purchased at
least one item from either channel in the eighteen-month period. Because there are a lot of
consumers who made zero purchases, the number of items ordered by each customer is heavily
skewed toward zero and does not fit a normal distribution well. It has a skewness of 5.883 and a
kurtosis of 81.227. A skewness-kurtosis joint test rejects the hypothesis that the number of items
ordered by each customer is drawn from a normal distribution. This large deviation from
normality can significantly lower the power of t-tests and lead to false statistical insignificance.
In order to investigate whether the differences in demand between the Control group and the Test
group are statistically significant, we use a Poisson regression model. This model is a widely-
accepted model for count data in economics and marketing literature. This model also allows us
to introduce a customer’s historical purchasing measures—Recency, Frequency and Monetary
Value—into the regression and control for them. More specifically, we assume that the number
of items ordered by customer i is drawn from a Poisson distribution with parameter iλ :
... 2, 1, 0, ,!
)Pr( ===−
eqY
qi
i
iλλ
(5)
iiiii Dmfr γβββλ +++= lnlnlnln 321 , (6)
where is the number of items ordered by customer i, , , and are respectively measures
of customer i’s Recency, Frequency, and Monetary Value, and is a dummy variable that is
iY ir if im
iD
15

one for customers who were in the Test group and received additional catalogs and zero for
others.
Three Poisson regression models are estimated for the Best customers and for the Good
customers respectively: the first model with being the total number of items ordered, the
second with being the number of items ordered through the catalog channel, and the third
with being the number of items ordered through the Internet channel. Under this specification,
the
iY
iY
iY
γ coefficient measures the marginal effect of sending additional catalogs on the log of
expected number of items ordered ( ii D∂∂= /lnλγ ), controlling for historical purchasing. In
other words, the estimated γ coefficient is the percentage change in the expected number of
items ordered when additional catalogs were mailed. Table 4 reports the estimates of γ
coefficient for Best customers and Good customers.
Poisson regression results confirm the results derived by t-tests. Sending additional catalogs to
the Best customers leads to a 3.3% increase in their demand through the catalog channel while
causing a 12.0% decrease in demand through the Internet channel. Since the catalog channel
brings in more sales than the Internet channel, the net effect is an increase of 2.0% in total
demand. Estimates of these coefficients are highly significant. Poisson regression results confirm
t-test results that sending additional catalogs does not raise the Best customers’ overall demand
much, and the main effect is the channel switching effect. If the company only measures how
catalogs affect orders made through the catalog channel, it will ignore the negative effect on the
demand through the Internet channel and will over-invest in mailing to these Best customers.
On the contrary, sending additional catalogs to the Good customers raises their overall demand
by 11.6%. This is exhibited in increases in demand through both channels: an 8.3% increase
through the catalog channel and a 32.2% increase through the Internet channel. All of these
16

effects are highly significant. If the company only measures how catalogs affect orders made
through the catalog channel, it will ignore the positive effect on the demand through the Internet
channel and will under-invest in mailing to these Good customers.
Table 4: Marginal Effect of Sending Additional Catalogs to the Log of Expected Number of Items Ordered
Best Good % change in expected number of items ordered
0.020** 0.116**
From Internet
-0.120** 0.322**
From catalogs
0.033** 0.083**
Sample Size 9824 9683 (Notes: Poisson regression; * significantly from zero in a two-tailed t-test, p<0.05, ** significantly from zero in a two-tailed t-test, p<0.01)
Number of Orders or Order Size?
It is important to explore further why sending additional catalogs to the Best customers reduces
their demand on the Internet. Do they make fewer orders? Or do they order fewer items per
order? Sending additional catalogs to the Good customers increases their demand on the Internet,
but one may wonder whether they make more orders or they order more items per order. In this
section, we try to separate the impact of sending additional catalogs on the number of items
ordered into the effect on the number of orders and the effect on the order size and study these
two effects separately.
The number of items ordered by a customer can be written as the number of orders times the
average number of items per order (or average order size):
iii SOY *= , (7)
17
where is the number of items ordered by customer i, is the number of orders placed by
customer i, and is the average order size by customer i.
iY iO
iS
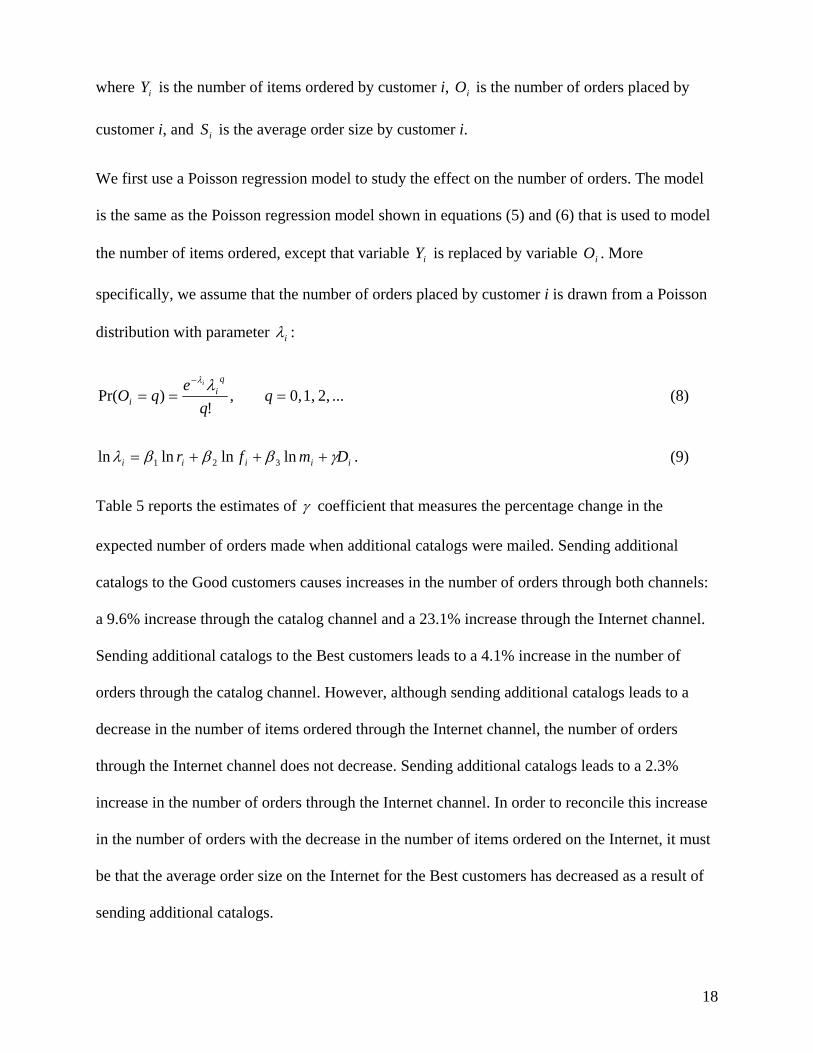
We first use a Poisson regression model to study the effect on the number of orders. The model
is the same as the Poisson regression model shown in equations (5) and (6) that is used to model
the number of items ordered, except that variable is replaced by variable . More
specifically, we assume that the number of orders placed by customer i is drawn from a Poisson
distribution with parameter
iY iO
iλ :
... 2, 1, 0, ,!
)Pr( ===−
eqO
qi
i
iλλ
(8)
iiiii Dmfr γβββλ +++= lnlnlnln 321 . (9)
Table 5 reports the estimates of γ coefficient that measures the percentage change in the
expected number of orders made when additional catalogs were mailed. Sending additional
catalogs to the Good customers causes increases in the number of orders through both channels:
a 9.6% increase through the catalog channel and a 23.1% increase through the Internet channel.
Sending additional catalogs to the Best customers leads to a 4.1% increase in the number of
orders through the catalog channel. However, although sending additional catalogs leads to a
decrease in the number of items ordered through the Internet channel, the number of orders
through the Internet channel does not decrease. Sending additional catalogs leads to a 2.3%
increase in the number of orders through the Internet channel. In order to reconcile this increase
in the number of orders with the decrease in the number of items ordered on the Internet, it must
be that the average order size on the Internet for the Best customers has decreased as a result of
sending additional catalogs.
18

Table 5: Marginal Effect of Sending Additional Catalogs to the Log of Expected Number of Orders
Best Good % change in expected number of orders
0.040** 0.114**
From Internet
0.023 0.231**
From catalogs
0.041** 0.096**
Sample Size 9824 9683 (Notes: Poisson regression; * significantly from zero in a two-tailed t-test, p<0.05, ** significantly from zero in a two-tailed t-test, p<0.01)
We next study the effect of sending additional catalogs on the average order size. The average
order size is a continuous measure, and we model it by the following linear regression model:
iiiiii DmfrS εγβββα +++++= lnlnln 321 , (10)
where is the average order size by customer i, , , and are respectively measures of
customer i’s Recency, Frequency, and Monetary Value, is a dummy variable that is one for
customers who were in the Test group and received additional catalogs and zero for others, and
iS ir if im
iD
iε is a normally distributed random error. We estimate this model with being the overall
average order size, the average order size on the Internet, and the average order size through the
catalog channel, respectively. Notice that for customers who did not place any orders, we cannot
calculate their average order size. For customers who did not place any orders through a certain
channel, we cannot calculate their average order size through that channel. Such customers are
automatically excluded from this analysis. Thus the actual number of observations for each
regression can be less than the number of customers.
iS
Table 6 reports the estimates of γ coefficient that measures the change in the average order size
when additional catalogs were mailed. We find that sending additional catalogs lowers the
19

average order size, both on the Internet and through the catalog channel. The effect of sending
additional catalogs on the average order size is very small and statistically significant for the
Good customers. For the Best customers, the effect of sending additional catalogs on the average
order size is much larger but still statistically insignificant.
Table 6: Marginal Effect of Sending Additional Catalogs to the Average Order Size
Best Good Change in average order size
-0.052 0.006
From Internet
-0.250 -0.050
From catalogs
-0.039 -0.004
Sample Size3 9824 9683 (Notes: linear regression; * significantly from zero in a two-tailed t-test, p<0.05, ** significantly from zero in a two-tailed t-test, p<0.01)
The falling average order size for the Best customers is evidence of their satiation by the
products they have been purchasing. After the Best customers are satiated, it becomes very hard
for them to find products that interest them. As a result, the order size decreases quickly as they
make more orders. The Good customers have not been purchasing as many products as the Best
customers have, and they are less likely to be satiated. As they make more orders, the order size
does not fall as quickly as it would for the Best customers.
Order Size on the Internet vs. through the Catalog Channel
Table 6 also reveals an interesting phenomenon: the change in the average order size is much
larger on the Internet than through the catalog channel. Sending additional catalogs to the Best
customers leads to a reduction of 0.250 in the average order size on the Internet, while causing a
reduction of only 0.039 in the average order size through the catalog channel. The same is true
3 The actual number of observations for each regression can be less than the number of customers. We only list the number of customers here.
20
for the Good customers. One potential explanation is that orders on the Internet are larger in size,
when compared with orders through the catalog channel. Thus, the same percentage change
would translate to a larger effect in order size on the Internet than through the catalog channel.
We next explore this possibility and compare the order size on the Internet with the order size
through the catalog channel.
It is worth mentioning that the comparison of order size on the Internet and through the catalog
channel can help us understand how a switch of demand from the Internet channel to the catalog
channel would affect a multi-channel retailer’s revenue. If the order size is larger on the Internet,
then every order switched from the Internet channel to the catalog channel causes a loss in the
retailer’s total revenue, and vice versa.
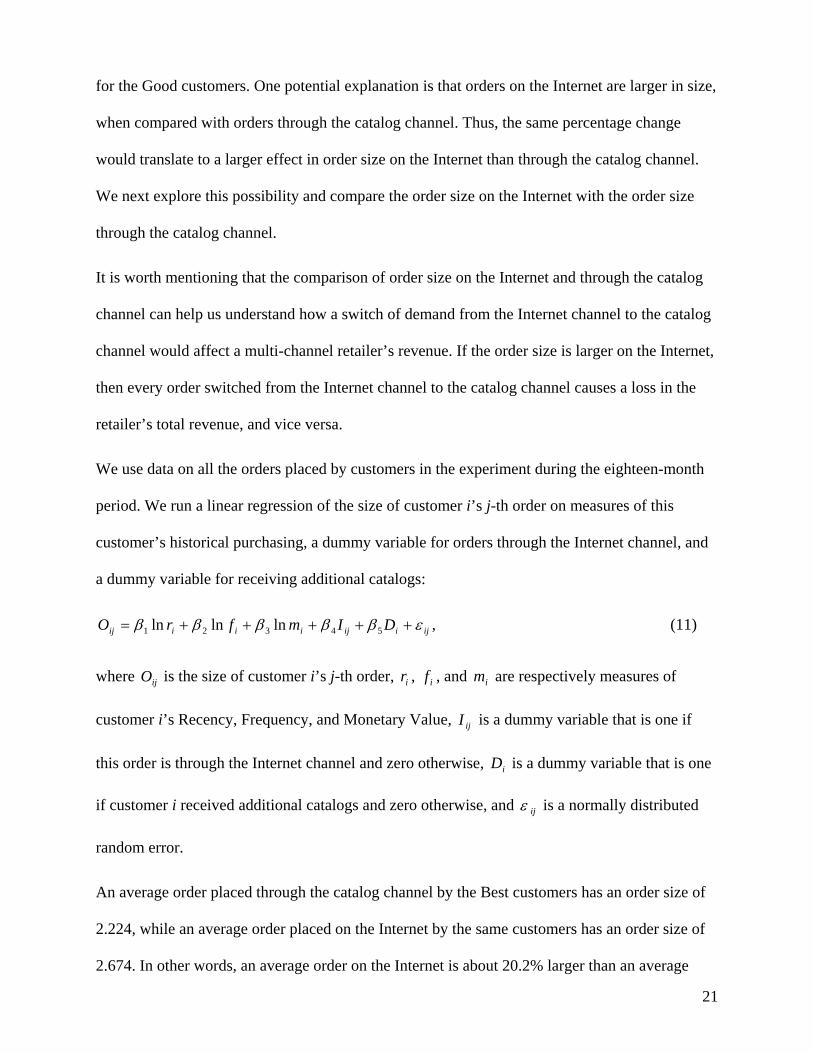
We use data on all the orders placed by customers in the experiment during the eighteen-month
period. We run a linear regression of the size of customer i’s j-th order on measures of this
customer’s historical purchasing, a dummy variable for orders through the Internet channel, and
a dummy variable for receiving additional catalogs:
ijiijiiiij DImfrO εβββββ +++++= 54321 lnlnln , (11)
where is the size of customer i’s j-th order, , , and are respectively measures of
customer i’s Recency, Frequency, and Monetary Value, is a dummy variable that is one if
this order is through the Internet channel and zero otherwise, is a dummy variable that is one
if customer i received additional catalogs and zero otherwise, and
ijO ir if im
ijI
iD
ijε is a normally distributed
random error.
An average order placed through the catalog channel by the Best customers has an order size of
2.224, while an average order placed on the Internet by the same customers has an order size of
2.674. In other words, an average order on the Internet is about 20.2% larger than an average
21

order through the catalog channel, for the Best customers. The same result holds true for the
Good customers: an average order on the Internet is about 10.7% larger than an average order
through the catalog channel (2.254 versus 2.037).
Regression results in Table 7 confirm the trend shown by these descriptive statistics. The
coefficient on the dummy for Internet orders is 0.444 for the Best customers and 0.170 for the
Good customers, with both being highly significant. This is after controlling for customers’
historical purchasing and whether a customer received additional catalogs. We interpret the
larger order size on the Internet as impulse purchasing. The Internet channel, because of its user-
friendly searching, browsing, and recommending capabilities, often leads to more impulse
purchasing compared with the catalog channel.
This finding of larger order size on the Internet than through the catalog channel has important
implications for a multi-channel retailer. It suggests that a multi-channel retailer should drive its
customers toward the Internet channel by engaging in efforts such as designing catalogs that
promote its Internet channel, providing online tools for customers to easily locate items that
appear in catalogs, and offering Internet promotions.
Table 7: Comparison of Order Size on the Internet and through the Catalog Channel
All Best Good
ln(Recency) 0.047** -0.029 (0.015) (0.018) ln(Frequency) 0.530** 0.347** (0.020) (0.024) ln(Monetary Value)
0.434** 0.144*
(0.067) (0.065) Dummy for Internet orders
0.444** 0.170**
(0.051) (0.065) Dummy for Receiving Additional Catalogs
-0.035 0.022
22

(0.027) (0.043) Constant -1.856** -0.729* (0.318) (0.319) R-squared 0.028 0.028 Sample Size 26699 8338
(Notes: linear regression; standard errors in parentheses; * significantly from zero in a two-tailed t-test, p<0.05, ** significantly from zero in a two-tailed t-test, p<0.01)
To explore this impulse purchasing issue further, we study whether Internet orders more
frequently combine items from different categories, compared with orders through the catalog
channel. We regress the number of categories spanned by items in customer i’s j-th order
(variable ) on measures of this customer’s historical purchasing and a dummy variable for
Internet orders, and a dummy variable for receiving additional catalogs. The model is the same
as the linear regression model shown in equation (11), except that variable is replaced by
variable . More specifically, we have:
ijC
ijO
ijC
iijiiiij DImfrC 54321 lnlnln βββββ ++++= . (12)
An average order placed through the catalog channel by the Best customers spans 1.053
categories, while an average order placed on the Internet by the same customers spans 1.074
categories. The same result holds true for the Good customers: an average order placed through
the catalog channel spans 1.058 categories, while an average order on the Internet spans 1.092
categories. Most orders have only items in one product category. But orders on the Internet more
frequently combine items from multiple categories, compared with orders through the catalog
channel. For the Best customers, the percentage of orders that have items multiple categories is
6.6% on the Internet and 4.9% through the catalog channel. For the Good customers, the
percentage is 8.3% on the Internet versus 5.4% through the catalog channel.
Regression results in Table 8 confirm the trend shown in these descriptive statistics. The
coefficient on the dummy for Internet orders is 0.021 for the Best customers and 0.024 for the
23

Good customers, with both being highly significant. This is after controlling for customers’
historical purchasing and whether additional catalogs were mailed.
Table 8: Comparison of Number of Categories Spanned by Orders on the Internet and through the Catalog Channel
All Best Good
ln(Recency) -0.003 -0.016** (0.002) (0.002) ln(Frequency) 0.033** 0.027** (0.002) (0.003) ln(Monetary Value)
-0.061** -0.005
(0.007) (0.009) Dummy for Internet orders
0.021** 0.024**
(0.006) (0.009) Dummy for Receiving Additional Catalogs
0.002 -0.002
(0.003) (0.006) Constant 1.181** 1.099** (0.036) (0.042) R-squared 0.014 0.020 Sample Size 26699 8338
(Notes: linear regression; standard errors in parentheses; * significantly from zero in a two-tailed t-test, p<0.05, ** significantly from zero in a two-tailed t-test, p<0.01)
Prior Internet Users
Customers who had ordered through the Internet channel before the start of the experiment on
average made 47.4% of their orders on the Internet in the eighteen months after the start of the
experiment. This number drops to 8.1% for customers who had not ordered on the Internet.
Because a lot of these prior Internet users prefer ordering on the Internet to ordering through the
catalog channel, cross-channel effects may be different for these customers than for the general
population of customers.
24

Table 9 shows the effect of mailing additional catalogs on the demand by these prior Internet
users. Sending additional catalogs to the Best customers who are also prior Internet users leads to
an increase in the number of items ordered through the catalog channel—4.523 items per
customer in the Control group versus 4.705 items per customer in the Test group, and a decrease
in the number of items ordered on the Internet—5.210 items per customer in the Control group
versus 3.805 items per customer in the Test group. The decrease in the demand on the Internet is
much bigger than the increase in the demand through the catalog channel, and the net effect is
negative. On the other hand, sending additional catalogs to the Good customers who are also
prior Internet users causes an increase in the number of items ordered through both the catalog
channel—1.209 items in the Control group versus 1.526 items in the Test group, and the Internet
channel—1.168 items in the Control group versus 2.078 items in the Test group.
Table 9: Average Number of Items Ordered by Customers in the Experiment who Are Prior Internet Users
Best Good Control Test Difference Control Test Difference
Total number of items ordered per customer
9.733 8.510 -1.223 2.377 3.604 1.227*
From Internet
5.210 3.805 -1.405* 1.168 2.078 0.910*
From catalogs
4.523 4.705 0.182 1.209 1.526 0.317
Sample Size 371 406 388 371 (Note: * significantly from zero in a two-tailed t-test, p<0.05, ** significantly from zero in a two-tailed t-test, p<0.01)
We re-estimate the Poisson regression model described in equation (5) and (6), using data on
prior Internet users only. Results are shown in Table 10. These results confirm the results derived
by t-tests. Sending additional catalogs to the Best customers who are also prior Internet users
leads to a 5.7% increase in their demand through the catalog channel while causing a 29.3%
decrease in demand on the Internet. The net effect is a decrease of 11.5% in total demand. If the
25

company only measures how catalogs affect orders made through the catalog channel, it will
ignore the large negative effect on the demand through the Internet channel and will make the
wrong decision on whether to send additional catalogs to these customers.
On the contrary, sending additional catalogs to the Good customers who are also prior Internet
uses raises their overall demand by 32.8%. This is exhibited in increases in demand through both
channels: a 13.8% increase through the catalog channel and a 49.0% increase through the
Internet channel. If the company only measures how catalogs affect orders made through the
catalog channel, it will ignore the bigger positive effect on the demand through the Internet
channel and will heavily under-invest in mailing to these customers.
Table 10: Marginal Effect of Sending Additional Catalogs to the Log of Expected Number of Items Ordered for Prior Internet Users
Best Good Total number of items ordered per customer
-0.115** 0.328**
From Internet
-0.293** 0.490**
From catalogs
0.057 0.138*
Sample Size 777 759 (Notes: Poisson regression; * significantly from zero in a two-tailed t-test, p<0.05, ** significantly from zero in a two-tailed t-test, p<0.01)
6. Conclusion
In this paper we study the impact of marketing actions in traditional channels on the Internet.
Using data collected from a large-scale field experiment that is conducted by a retailer that has
both an Internet channel and a catalog channel, we demonstrate that marketing actions in
traditional channels can have a significant impact on the Internet. Our results also show that the
overall cross-channel effect can be different in magnitude as well as signs for different segments
of customers. Key parameters that can be used to segment a customer base in this context include
26

measures of customers’ past purchasing history as well as their familiarity with the Internet
channel.
Because of this cross-channel effect, marketing plans that are profitable in the absence of the
Internet channel may not make sense in the presence of the Internet channel. Using sending
additional catalogs as an example of marketing actions, we find that sending additional catalogs
can potentially have two effects on demand. It can cause an increase in overall demand, and it
may also shift demand from the Internet to the catalog channel. Our findings confirm the
existence of both effects and reveal an interesting dichotomy. Amongst the Good customers
mailing additional catalogs yielded a significant increase in demand across both channels. The
effect on the Internet channel was large and confirms that catalogs have an impact beyond the
catalog channel. If firms only measure how catalogs affect orders through the catalog channel
they will tend to under-invest in mailing to these Good customers. In contrast, amongst the Best
customers, mailing additional catalogs did not increase demand over the Internet. Rather, the
main effect is a shift of demand from the Internet to the catalog channel. If firms only measure
how catalogs affect orders through the catalog channel they will tend to over-invest in mailing to
these Best customers. In order to make the right marketing decision, firms cannot isolate
channels from one another and assume the non-existence of cross-channel effect. Instead, the
right marketing plan requires sharing of data across marketing channels and integrating customer
data that are scattered across organizations.
We also find that the Internet channel, because of its user-friendly searching, browsing, and
recommending capabilities, often leads to more impulse purchasing compared with traditional
channels. We provide evidence supporting the theory of increased impulse purchasing on the
Internet, including the larger order size on the Internet compared with through the catalog
channel, and the higher frequency of Internet order combining items from multiple categories
27

compared with orders through the catalog channel. These results suggest that a multi-channel
retailer should drive its customers toward the Internet channel by engaging in efforts such as
designing catalogs that promote its Internet channel, providing online tools for customers to
easily locate items that appear in catalogs, and offering Internet promotions.
28

Bibliography
Ackerberg, D. 2001. Empirically distinguishing informative and prestige effects of advertising. RAND Journal of Economics, 32(2): 100-118.
Becker, G. S. and K. M. Murphy. 1993. A simple theory of advertising as a good or bad. Quarterly Journal of Economics, 108 (4): 941-964.
Brynjolfsson, E., Y. Hu, and M. D. Smith. 2003. Consumer surplus in the digital economy: Estimating the value of increased product variety at online booksellers. Management Science, 49(11): 1580-1596.
Cattani, K. D., W. G. Gilland, and J. M. Swaminathan. 2003. Adding a direct channel? How autonomy of the direct channel affects prices and profits. Working Paper. The Kenan-Flagler Business School, University of North Carolina, Chapel Hill, NC.
Chamberlin, E. 1933. The Theory of Monopolistic Competition. Harvard University Press. Cambridge, MA.
Duffy, M. 1996. Econometric studies of advertising, advertising restrictions and cigarette demand: A survey. International Journal of Advertising, 15: 1-23.
Huang, W. and J. M. Swaminathan. 2003. Pricing on traditional and Internet channels under monopoly and duopoly: Analysis and bounds. Working Paper. The Kenan-Flagler Business School, University of North Carolina, Chapel Hill, NC.
Lal, R. and M. Sarvary. 1999. When and how is the Internet likely to decrease price competition. Marketing Science, 18(4): 485-503.
Marshall, A. 1919. Industry and Trade. MacMillan and Co. London, U.K.
Milgrom, P. and J. Roberts. 1986. Price and advertising signals of product quality. Journal of Political Economy, 94(4): 796-821.
Stigler, G. L. 1961. The economics of information. Journal of Political Economy, 71():213-225.
29
Related Documents