Understanding Subsidy Budget Planning Council 10-3-14

Understanding Subsidy Budget Planning Council 10-3-14.
Dec 26, 2015
Welcome message from author
This document is posted to help you gain knowledge. Please leave a comment to let me know what you think about it! Share it to your friends and learn new things together.
Transcript

Understanding Subsidy
Budget Planning Council 10-3-14

Subsidy Components
Appropriations are fixed amounts – additional subsidy for growth is relative to what all institutions are experiencing – changing the size of slices of a fixed pie• Completions = Formula Subsidy
• Reimbursement for credit hour production • Based on the number of FTE students (30 semester hours) that complete the
course (I’s, F’s, and withdraws don’t count)• Allocation for at risk completions
• Degrees = reimbursement for the number of degrees granted• Subdivided by residency and risk
• Doctoral = a fixed pool statewide• Allocations for FTE production (55%), degrees granted (30%) and NSF/NIH grant
funding (15%)• Medical = direct allocation to medical schools based on headcount enrollment• Access Challenge = Earmarks for Access institutions (Akron, Cincinnati, Cleveland,
Central, Shawnee and Youngstown)

OU FY15 Subsidy Projection
• Degrees • Non Residents weighted 50%• At Risk degrees have four factors with all possible combinations = 16 groups
• Age > 22 when starting college• EFC < $2,190• ACT < 17 or Developmental Courses• Minority Race
• POM Adjustment – set aside for campuses with excessive space costs• Budget = 98% of Projection • Degree allocations for the Nursing program were changed to remove the Age risk factor given
preliminary feedback that other universities were questioning the at risk calculations associated with online-completion programs. This removed $13.6M from the budgeted subsidy
Budget Tab • Completions – three-year average of FTE credit hour production
• At Risk Completions are students completing that fit into two categories of risk - financial need (EFC < $2190 and academic risk (ACT <17 and those in developmental courses))

Formula Subsidy Taxonomy• Subsidy is earned by producing credit hours• 22 cost models
• 13 Undergraduate• 9 Masters• 2 Doctoral
• Represents statewide average cost of producing an FTE (30 semester hours) in different discipline groups)
• AH = Arts & Humanities• BES = Business, Education & Social Science• STEM = Science, Technology, Engineering &
Math• Levels 1 & 2 = introductory / general education• At Risk earnings apply only to undergraduate activity• Shaded = Graduate• Doctoral has separate pool and associated calculation• Extra weighting for Graduate and STEM• Overall reimbursement is 11% of the cost

Subsidy Models
• Allocation is based on discipline • Courses are grouped together by discipline• Course-Discipline combinations are grouped
together under a model• Note that a discipline can show up in
multiple models – within each model you would find different courses within that discipline (e.g. Communication)
• The average cost across the model is the amount used to determine the reimbursement rate for all the courses in that model
• The most accurate reimbursement approach would be to tie the rate to every course individually but that is not practical so this approach is a middle ground where the cost differences across disciplines and courses is recognized using a rough approximation
StatewideAH1 CostCommunication 6122English 6410Journalism 6543Philosophy and Religion 6675AH2Communication 9115English 9437Philosophy and Religion 9361Art 7040Foreign Language 7194Liberal Arts 7420Other Visual/Performing 8934Drama 8063Music 7465AH3Art 11162Foreign Language 9968Journalism 10209Other Visual/Performing 11737AH4Liberal Arts 14381Drama 16128Music 15615AH5Art 25114Communication 25206English 21614Foreign Language 24307Journalism 25451AH6Drama 30248Liberal Arts 36128Music 29747Other Visual/Performing 26627Philosophy and Religion 28819
CLWR1810CLWR2220COMS1010COMS1030ENG 1510ENG 1610ENG 2800ENG 3850JOUR1050MDIA1091PHIL1010PHIL1200PHIL1300
All other COMS courses

Model Cost Distributions
AH1AH3
AH5
BES1
BES3
BES5
BES7
STEM2
STEM4
STEM6
STEM8
0
10000
20000
30000
40000
50000
60000
Costs per FTE

Subsidy Breakdown

OU Subsidy Formula Earnings• Reimbursement Cost =
statewide average cost to produce an FTE
• Completed FTE – OBR projection of our three-year average
• At Risk FTE – three year projection of FTEs within total that are At Risk
• Completion Earnings = FTE times the Reimbursement Rate
• Total SSI = both combined• Completion SSI Earnings per
FTE = Completion SSI / Completed FTEs
• At risk is a very small fraction of total funding <3%

At Risk Formula Earnings• At Risk FTEs are weighted by the extent to which completions occur in each subsidy model
across the state. This calculation creates a ratio between the completion rate for non-risk to that of at-risk students in each model to come up with a weighting factor that will be used to differentially inflate a university’s FTE for each model
• For example, AH1 completion rates for Non-risk students is 89% statewide while for At-Risk it is 75%. So 89%/75% = 118.44% so AH1 completions will get an 18.44% extra weight.
• For AH2 the weight is 9.46% and so on.• These weights will be used to calculate the additional subsidy provided for At Risk
completionsNon Risk % CompletionAt Risk % Completion -1

Campus Risk Index• An additional weighting is given to
universities that attract more At-Risk students compared to others.
• In this calculation a statewide weight is determined for each of the three risk combinations (Financial, Academic and Both) and each universities activity is weighted
• Then a ratio of weighted to unweighted activity is computed to create a campus index
Universities with small amounts of at risk completions like OU and Miami get a smaller index than universities with more activity like Central, Shawnee and Cleveland

OU Subsidy Formula EarningsThis is the OBR calculation of our formula subsidy
Three year of FTE CompletionsTwo years of At Risk Completions with the third year projected using the rates for OU derived on the At Risk tab
Three year averages
Statewide weight for at risk for each modelAthens Campus Index
Note that at risk components are zero for graduate models since risk applies only to undergraduate activity
At risk FTE times the two weights produces additional FTE that get added to the main at-risk
FTE number when computing reimbursement
Total cost of FTE produced using costs on Assumptions tab
Subsidy we will receive

Degree EarningsAs with the cost of producing credit hours, OBR collects data on the cost to produce degrees (Associate, Bachelors, Masters) across the system

At Risk Degree Weights
• From the four risk factors used for degrees, there are sixteen combinations with a student having zero, one, two, three or all four of the factors – Case 00 through 16
• OBR collects data from all universities for the number of at risk student that enroll vs those that complete the degree
• This is rolled up to the state level and statewide completion rates are created (green) that will be used to weight at risk degrees to provide subsidy for producing them
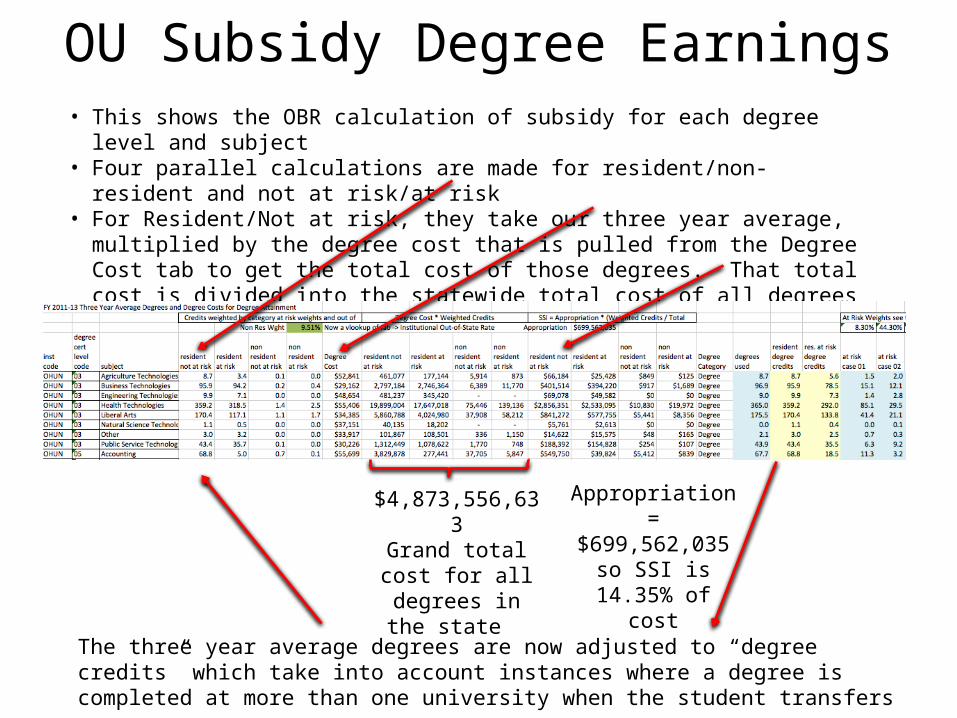
OU Subsidy Degree Earnings• This shows the OBR calculation of subsidy for each degree level and subject• Four parallel calculations are made for resident/non-resident and not at risk/at risk• For Resident/Not at risk, they take our three year average, multiplied by the degree cost
that is pulled from the Degree Cost tab to get the total cost of those degrees. That total cost is divided into the statewide total cost of all degrees produced to get a proportion which is multiplied by the appropriation for degrees to determine the SSI earned
$4,873,556,633Grand total cost for
all degrees in the state
Appropriation = $699,562,035 so SSI is 14.35% of
cost
The three year average degrees are now adjusted to “degree credits” which take into account instances where a degree is completed at more than one university when the student transfers

OU Subsidy Degree EarningsOBR Degrees Tab
• For NonResident/Not at risk, the process is the similar but the total degrees are calculated by taking the three-year average degree credits times 0.5 to weight non-resident degree at 50% and then times an institutional non-resident rate which is the percentage of non-resident students from that university working in Ohio after graduation. This is a different number for each institution (9.51% for OHIO)
2.4 degree credits * 50% * 9.51% = 0.11193
• This calculated number of of degrees is then multiplied by the statewide degree cost to get the total cost of those degrees. That total cost is divided into the statewide total cost of all degrees produced to get a proportion which is multiplied by the appropriation for degrees to determine the SSI earned

OU Subsidy Degree EarningsOBR Degrees Tab
• For Resident/At risk, the process is more complicated because the 16 risk cases are used• First the total resident at risk degree credit for each subject are broken down into 16
values using the percentage of our degrees falling into each case
• As with the Resident/NonRisk degrees, this calculated number of of degrees is then multiplied by the degree cost to get the total cost of those degrees. That total cost is divided into the statewide total cost of all degrees produced to get a proportion which is multiplied by the appropriation for degrees to determine the SSI earned
• The same process is used for NonResident/At Risk with the additional weighting of 50% and the 9.51% Non Res Weight for OU
The 16 values are multiplied by the statewide at risk weights and added up to get a total number of degrees
Multiply

Doctoral Set Aside
Institution Base FTE Base % 85% BaseAKRN 761 6.17% 697BGSU 685 5.56% 599CINC 2,261 18.32% 1,843CLEV 172 1.39% 163KENT 1,003 8.13% 977MIAM 437 3.54% 445OHSU 5,076 41.15% 4,612OHUN 850 6.89% 791TLDO 604 4.90% 652WSUN 457 3.70% 405YNGS 31 0.25% 20
12,337 100.00% 11,204
• Doctoral subsidy is a flat percentage of the appropriation with each university getting a set share as long as they are at 85% of the target set when doctoral subsidy was frozen.
• This limiting of the doctoral subsidy regardless of how much credit activity occurs at the doctoral level is where the concept of doctoral subsidy being “capped” orginates.
• With the new taxonomy a new calculation for doctoral was created and will be phased in over 10 years – we are now in year 6
• Factors will be the number of degrees granted, funded research dollars and a factor related to mission that was never defined and is now lumped in with the FTE portion.

Doctoral Subsidy EarningsFor Degree Cost, we have a three year average of $6.7M which is 4.52% of the total across all universities so we will get that proportion of the part of the appropriation allocated to degrees (30%)
For Research we have 3.03% of the funded research across the state so we will get that proportion of the part of the appropriation allocated to research (15)%

Doctoral Subsidy Earnings
• Each university gets a proportion share of the each of the three appropriation pools• Doctoral Set Aside is for FTE production as long as you hit your target. So we get 6.89%
of the $88.8M allocated to that component = $6,247,039• For Degree Cost we get 4.52% of the $50.6M allocated to that component = $2,291,319• For Research we get 3.03% of the $25.3M allocated to that component = $767,546• So our total doctoral funding is $9,305,903

Subsidy in TransitionOBR two-year transition of the model:
FY14• Move appropriation from 25% on
degrees to 50%• Move all components
(completions and degrees) to three-year average
• Change from funding out-of-state degree costs at 100% to 25%
FY15• Merge main campus and regional
campus funding models into a single system – removes previous restrictions on what regional campuses could offer
• Start providing subsidy for Associate Degrees as part of the degree component
• Award degree subsidy on a fractional basis for transfer students (split funding)
• “At Risk” defined relative to institution rather than statewide

Subsidy in TransitionAdditional Formula Refinements for FY16
– At Risk Degree subsidy removed for students entering with 30+ credit hours
– Students entering with an Associate degree will now be partially funding for a Bachelor degree instead of fully funded

Change to At Risk Calculation
• Students entering with 30+ credit hours have the same completion rate as students with no risk factors
• The At Risk bonus will be eliminated for students entering with 30+ hours
• This will decrease degree subsidy for universities with large numbers of transfers and/or large bachelor completion programs (RN-BSN)
• The value of all other degrees in the system (including other OHIO degrees) will increase

RN-to-BSN program:• This program has a very large number of degrees which brought in $10M in at risk subsidy
for those degrees alone• Nearly 100% of the students in that program fall into the Age risk category because they
already have an associate degree• This attracted an enormous amount of subsidy given the additional weighting provided
for at risk degrees - $10M on top of the $20M.• Other universities are arguing that age is not really a risk for this type of student and it is
likely that this will change, we reduced the resident at risk degrees from 721 to 150 and the non-resident at risk degrees from 11 to 1.• This brought the at risk subsidy down by around $7M
FY15 Budget Adjustment

Change to Funding Multiple Degrees
• Currently if you provide a Bachelor degree to a student with an Associate degree you receive 100% of the funding for the Bachelor degree – essentially double counting the Associate degree
• Associate degrees from non-IUC schools (e.g. community colleges) were not counted in this reduction creating a “bonus” on Bachelor degrees for those students.
• This will change to subtracting the value of the Associate degree from the value of the Bachelor degree and funding the difference regardless of the school where the Associate degree was earned.
• This drastically reduces the $20M subsidy portion for Nursing degrees as well

Net Effect• The rough impact of the changes using old
data from FY14 has been modeled. This is for illustrative purposes only
• No changes will be made to FY15 subsidy allocations based on these changes. Modeling will be done later this fall to estimate what would have happened in FY15 if these changes had been implemented
• In FY16 this reduction will be offset by funding shifting to other degree and by our growth in enrollment – the net effect is still to be determined
Related Documents


![Understanding the Budget - Prince William County, … William County | FY 2010 Fiscal Plan [Understanding the Budget] 99 Facts about the Budget ... documents: the Proposed Fiscal Plan](https://static.cupdf.com/doc/110x72/5aee05177f8b9a585f910fe1/understanding-the-budget-prince-william-county-william-county-fy-2010-fiscal.jpg)


