Linköping University Medical Dissertations No. 665 8QGHUVWDQGLQJVXEJURXSVRI QRYLFHGULYHUV $EDVLVIRULQFUHDVHGVDIHW\DQGKHDOWK Hans-Yngve Berg Division of Social Medicine and Public Health Science, Department of Health and Environment, Faculty of Health Sciences, S-581 85 Linköping, Sweden Linköping 2001

Welcome message from author
This document is posted to help you gain knowledge. Please leave a comment to let me know what you think about it! Share it to your friends and learn new things together.
Transcript
1
Linköping University Medical Dissertations
No. 665
�������������� ����������������������
�� ������������������������������������
Hans-Yngve Berg
Division of Social Medicine and Public Health Science, Department of Health and Environment,
Faculty of Health Sciences, S-581 85 Linköping, Sweden ��
Linköping 2001

2
����������������������������������������������
ISBN 91-7219-958-X ISSN 0345-0082�

3
�����������������������������������������������
������������� ��������

4
5
������������������� �!�� "�� #�$�����#������ �����������������������������������
Hans-Yngve Berg
Division of Social Medicine and Public Health Science, Department of Health and Environment, Faculty of Health Sciences, S-581 85 Linköping, Sweden
������$�� Every year, drivers throughout the world are killed or injured in road traffic, particularly in developing countries. Young drivers run a greater risk everywhere, and this problem is still largely unsolved. Better understanding of the underlying processes could, however, be a useful tool in preventive endeavours. The aim of this thesis is to elucidate some of the accident problem among young car drivers. The focus is on understanding how lifestyle and other social and demographical factors influence the health of young people in terms of mobility and safety. Better knowledge of these factors makes it possible to design safety measures specially tailored for different subgroups. This is expected to help make the measures more effective and reduce the conflict between mobility and safety. The thesis is based on five studies, the first of which focuses on the factors that influence young people in their decision concerning whether or not to obtain a driving licence (Paper I). In the second study, focus lies on how groups with different lifestyles and socio-economic background start practice driving and the benefit derived from the opportunity to practise from the age of 16 (Paper II). The third study aims at visualising accident patterns during driving practice (Paper III) while the fourth evaluates the effects of a reform that lowered the age limit for practice driving to 16 (Paper IV). The last study aims at analysing the relation between the lifestyles of young drivers and accidents (Paper V). The results of the five studies underlines the complexity of the young driver problem. Many factors such as financial means, time and norms influence how many people take their licence and consequentially, safety and health (I). Socio-economic background together with lifestyle influences the possibility of obtaining a driving licence and of accumulating extensive driving practice (II), which is relevant as regards safety on the road for newly qualified drivers (IV). Paper III shows the prevalent accident pattern during driver training and Paper V shows that the accident risk is different in different lifestyle groups. The combined results presented in the five papers offers the possibility of developing different countermeasures for the selective influencing of different groups under different conditions. If this is adapted as closely as possible to target groups and situations, it should be possible to significantly enhance safety without losing much of young drivers’ mobility, both during driving practice and afterwards.

6
7
!��"�$�� This thesis is based on the following Papers, which will be referred to in the text by their Roman numerals.
I Berg H-Y., Andersson F., Warmark, M. (2000). Driving licence or not: What influences young people’s choice? – An interview- and questionnaire-based study. Transportation Research Part F, under review. II Berg H-Y., Eliasson K., Palmkvist J., Gregersen N P. (1999). Learner drivers and lay instruction – how socio-economic standing and lifestyle are reflected in driving practice from the age of 16. Transportation
Research Part F 2, 167-179. III Berg H-Y., Gregersen N P. (2001). Typical accident patterns during
driver training in Sweden – an explorative study using correspondence analysis. Accident Analysis & Prevention, submitted.
IV Gregersen N P., Berg H-Y., Engström I., Nolén S., Nyberg A., Rimmö P-A (2000). Sixteen years age limit for learner drivers in Sweden – an evaluation of safety effects. Accident Analysis & Prevention. 32:25-35. V Gregersen, N P., Berg, H-Y. (1994). Lifestyle and accidents among young
drivers. Accident Analysis & Prevention. 26:297-303.
8
$ ������ !��
ABSTRACT 5
PREFACE 7
DEFINITIONS 10
1. INTRODUCTION 11
2. AIMS OF THE STUDIES 24
3. MATERIALS, METHODS, RESULTS AND DISCUSSION 25
3.1 General comments on methods and materials 25 3.1.1 Statistical and other methods 26
3.2 Driving licence or not: What influences young people’s choice? – An interview- and questionnaire-based study (I) 27
3.2.1 Materials and methods 27 3.2.2 Results 27 3.2.3 Discussion 28
3.3 Learner drivers and lay instruction – how socio-economic standing and lifestyle are reflected in driving practice from the age of 16 (II) 28
3.3.1 Materials and methods 28 3.3.2 Results 29 3.3.3 Discussion 30
3.4 Typical accident patterns during driver training in Sweden – an exploratory study using correspondence analysis (III) 30
3.4.1 Materials and methods 30 3.4.2 Results 31 3.4.3 Discussion 31
3.5 Sixteen years age limit for learner drivers in Sweden – an evaluation of safety effects (IV) 32
3.5.1 Materials and methods 32 3.5.2 Results 33 3.5.3 Discussion 35
3.6 Lifestyle and accidents among young drivers (V) 35 3.6.1 Materials and methods 35 3.6.2 Results 36 3.6.3 Discussion 36
4 GENERAL DISCUSSION 37
5 GENERAL CONCLUSIONS 41
6. ACKNOWLEDGEMENTS 43
7. REFERENCES 44
9
!�!��� !�� Driving licence or not: What influences young people’s choice? – An interview- and questionnaire-based study. 49 Learner drivers and lay instruction – how socio-economic standing and lifestyle are reflected in driving practice from the age of 16. 71 Typical accident patterns during driver training in Sweden – an explorative study using corespondence analysis. 87 Sixteen years age limit for learner drivers in Sweden – an evaluation of safety effects. 103 Lifestyle and accidents among young drivers. 117
10
��"����� ��� ����������% – Number of accidents per driven km (unless otherwise defined). &��������� – A driver in the 18-24 age group (unless otherwise defined). '������������ – A driver without a license but with permission to practice with an instructor as co-driver. '������������ – A driver with permission to supervise a learner driver, usually a father, mother or a relative. !�������������������� – Usually a employee in a driving school and specially educated to teach driving. ���������������(���)���*������������(���)������ – A driver who has recently qualified for a driving license, independent of biological age. KFB The Swedish Transport and Communication Research Board SNRA Swedish National Road Administration NTF National Society for Road Safety VTI Swedish National Road and Transport Research Institute
11
+,� ���� ��$�� ��
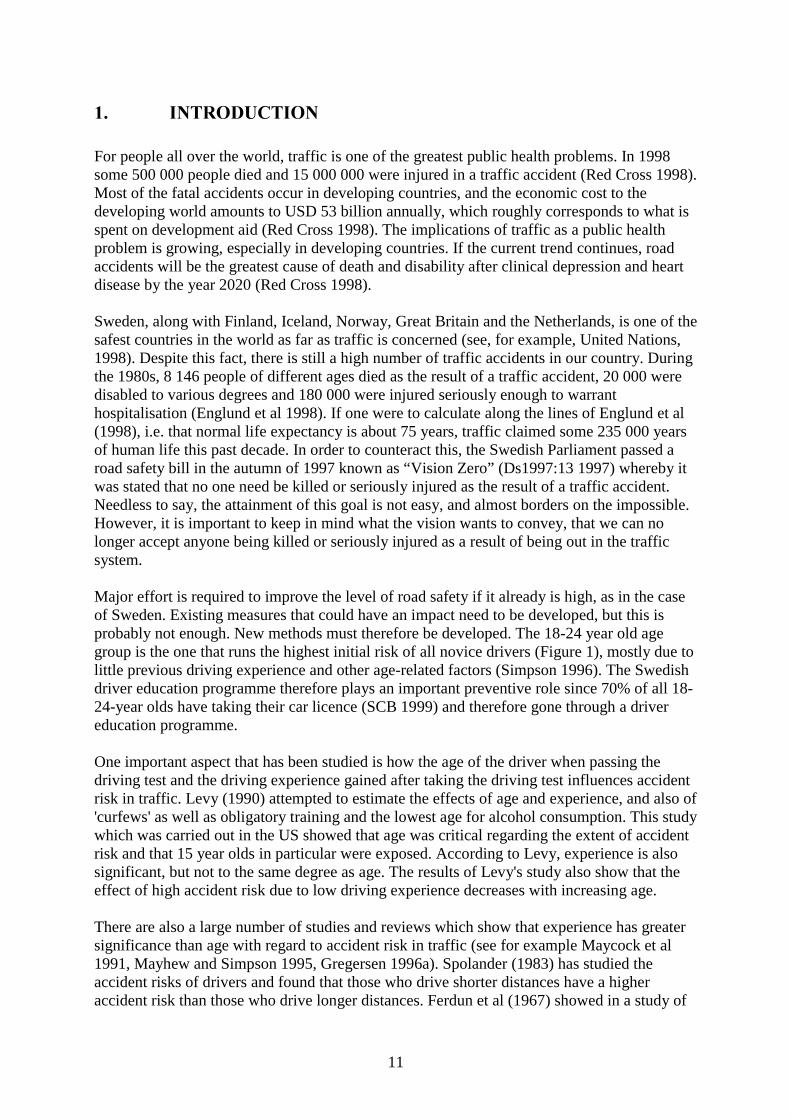
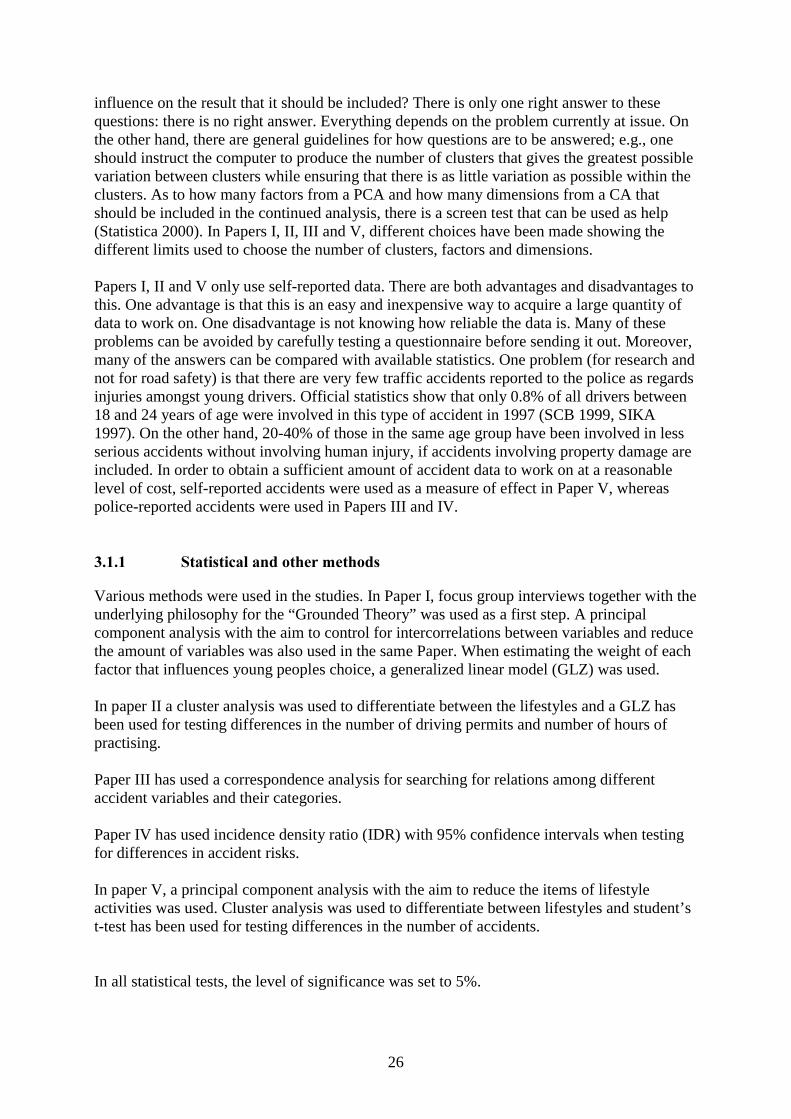
For people all over the world, traffic is one of the greatest public health problems. In 1998 some 500 000 people died and 15 000 000 were injured in a traffic accident (Red Cross 1998). Most of the fatal accidents occur in developing countries, and the economic cost to the developing world amounts to USD 53 billion annually, which roughly corresponds to what is spent on development aid (Red Cross 1998). The implications of traffic as a public health problem is growing, especially in developing countries. If the current trend continues, road accidents will be the greatest cause of death and disability after clinical depression and heart disease by the year 2020 (Red Cross 1998). Sweden, along with Finland, Iceland, Norway, Great Britain and the Netherlands, is one of the safest countries in the world as far as traffic is concerned (see, for example, United Nations, 1998). Despite this fact, there is still a high number of traffic accidents in our country. During the 1980s, 8 146 people of different ages died as the result of a traffic accident, 20 000 were disabled to various degrees and 180 000 were injured seriously enough to warrant hospitalisation (Englund et al 1998). If one were to calculate along the lines of Englund et al (1998), i.e. that normal life expectancy is about 75 years, traffic claimed some 235 000 years of human life this past decade. In order to counteract this, the Swedish Parliament passed a road safety bill in the autumn of 1997 known as “Vision Zero” (Ds1997:13 1997) whereby it was stated that no one need be killed or seriously injured as the result of a traffic accident. Needless to say, the attainment of this goal is not easy, and almost borders on the impossible. However, it is important to keep in mind what the vision wants to convey, that we can no longer accept anyone being killed or seriously injured as a result of being out in the traffic system. Major effort is required to improve the level of road safety if it already is high, as in the case of Sweden. Existing measures that could have an impact need to be developed, but this is probably not enough. New methods must therefore be developed. The 18-24 year old age group is the one that runs the highest initial risk of all novice drivers (Figure 1), mostly due to little previous driving experience and other age-related factors (Simpson 1996). The Swedish driver education programme therefore plays an important preventive role since 70% of all 18- 24-year olds have taking their car licence (SCB 1999) and therefore gone through a driver education programme. One important aspect that has been studied is how the age of the driver when passing the driving test and the driving experience gained after taking the driving test influences accident risk in traffic. Levy (1990) attempted to estimate the effects of age and experience, and also of 'curfews' as well as obligatory training and the lowest age for alcohol consumption. This study which was carried out in the US showed that age was critical regarding the extent of accident risk and that 15 year olds in particular were exposed. According to Levy, experience is also significant, but not to the same degree as age. The results of Levy's study also show that the effect of high accident risk due to low driving experience decreases with increasing age. There are also a large number of studies and reviews which show that experience has greater significance than age with regard to accident risk in traffic (see for example Maycock et al 1991, Mayhew and Simpson 1995, Gregersen 1996a). Spolander (1983) has studied the accident risks of drivers and found that those who drive shorter distances have a higher accident risk than those who drive longer distances. Ferdun et al (1967) showed in a study of
12
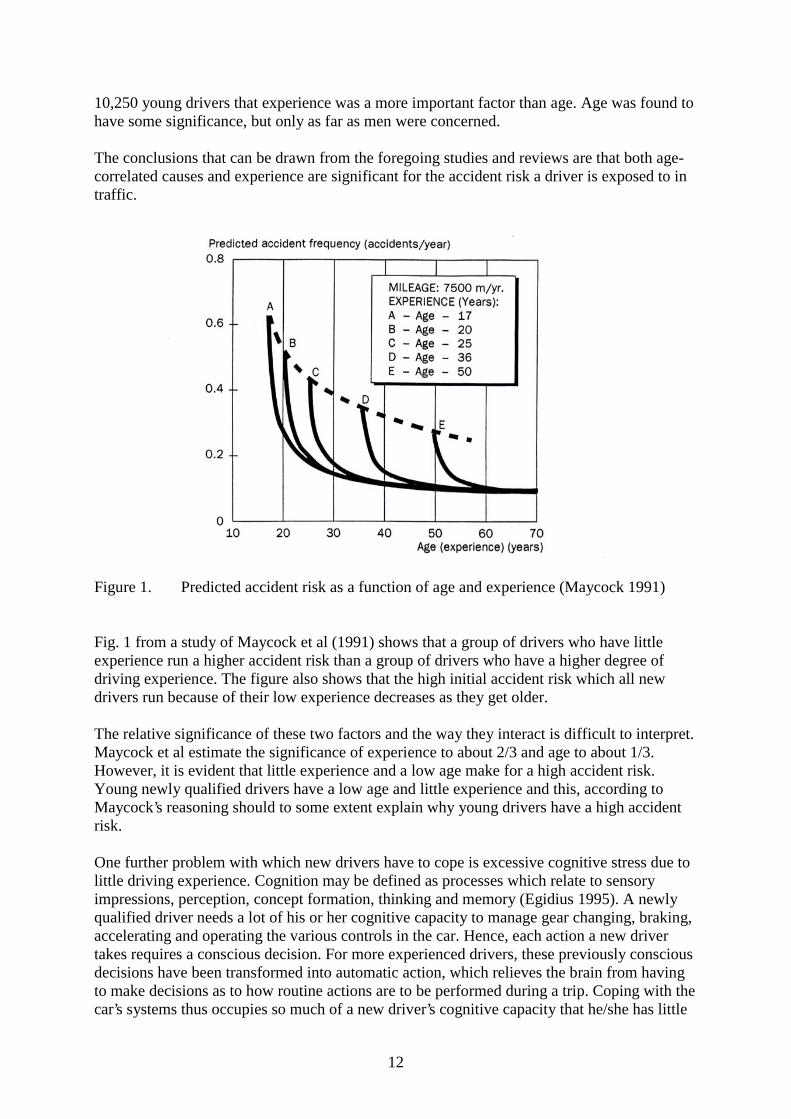
10,250 young drivers that experience was a more important factor than age. Age was found to have some significance, but only as far as men were concerned. The conclusions that can be drawn from the foregoing studies and reviews are that both age-correlated causes and experience are significant for the accident risk a driver is exposed to in traffic.
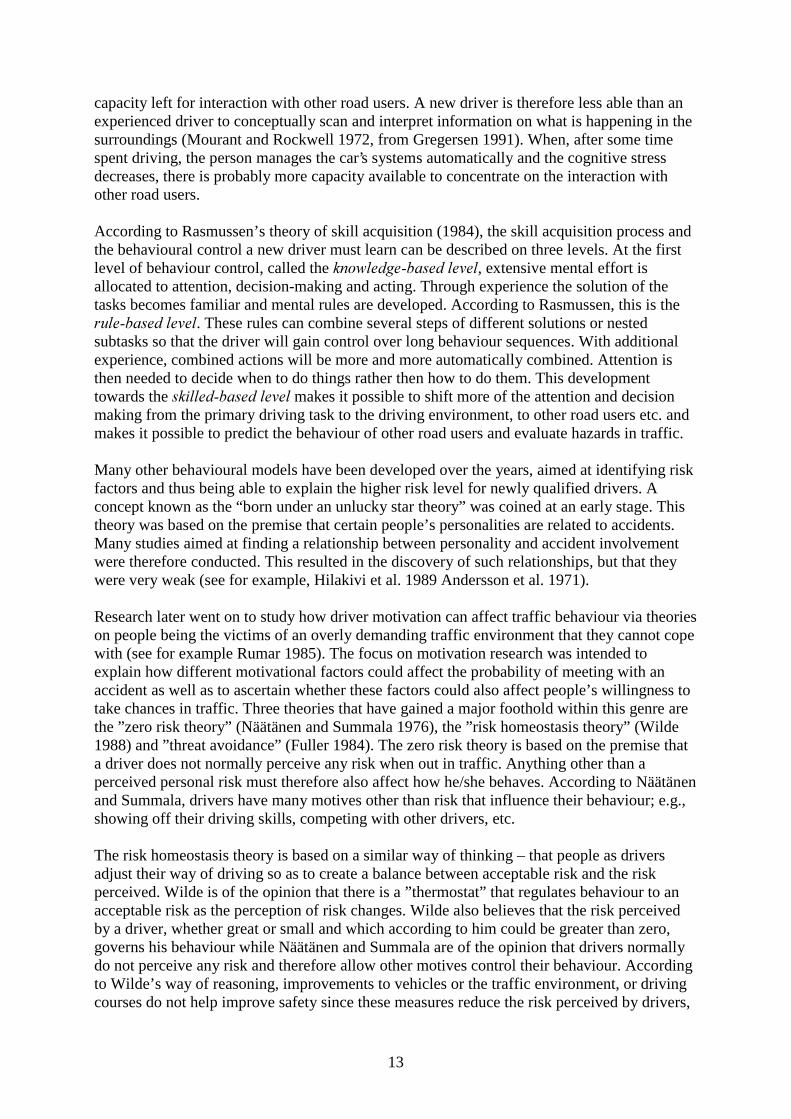
Figure 1. Predicted accident risk as a function of age and experience (Maycock 1991) Fig. 1 from a study of Maycock et al (1991) shows that a group of drivers who have little experience run a higher accident risk than a group of drivers who have a higher degree of driving experience. The figure also shows that the high initial accident risk which all new drivers run because of their low experience decreases as they get older. The relative significance of these two factors and the way they interact is difficult to interpret. Maycock et al estimate the significance of experience to about 2/3 and age to about 1/3. However, it is evident that little experience and a low age make for a high accident risk. Young newly qualified drivers have a low age and little experience and this, according to Maycock’s reasoning should to some extent explain why young drivers have a high accident risk. One further problem with which new drivers have to cope is excessive cognitive stress due to little driving experience. Cognition may be defined as processes which relate to sensory impressions, perception, concept formation, thinking and memory (Egidius 1995). A newly qualified driver needs a lot of his or her cognitive capacity to manage gear changing, braking, accelerating and operating the various controls in the car. Hence, each action a new driver takes requires a conscious decision. For more experienced drivers, these previously conscious decisions have been transformed into automatic action, which relieves the brain from having to make decisions as to how routine actions are to be performed during a trip. Coping with the car’s systems thus occupies so much of a new driver’s cognitive capacity that he/she has little
13
capacity left for interaction with other road users. A new driver is therefore less able than an experienced driver to conceptually scan and interpret information on what is happening in the surroundings (Mourant and Rockwell 1972, from Gregersen 1991). When, after some time spent driving, the person manages the car’s systems automatically and the cognitive stress decreases, there is probably more capacity available to concentrate on the interaction with other road users. According to Rasmussen’s theory of skill acquisition (1984), the skill acquisition process and the behavioural control a new driver must learn can be described on three levels. At the first level of behaviour control, called the ������������� �����, extensive mental effort is allocated to attention, decision-making and acting. Through experience the solution of the tasks becomes familiar and mental rules are developed. According to Rasmussen, this is the �������� �����. These rules can combine several steps of different solutions or nested subtasks so that the driver will gain control over long behaviour sequences. With additional experience, combined actions will be more and more automatically combined. Attention is then needed to decide when to do things rather then how to do them. This development towards the ����������� ����� makes it possible to shift more of the attention and decision making from the primary driving task to the driving environment, to other road users etc. and makes it possible to predict the behaviour of other road users and evaluate hazards in traffic. Many other behavioural models have been developed over the years, aimed at identifying risk factors and thus being able to explain the higher risk level for newly qualified drivers. A concept known as the “born under an unlucky star theory” was coined at an early stage. This theory was based on the premise that certain people’s personalities are related to accidents. Many studies aimed at finding a relationship between personality and accident involvement were therefore conducted. This resulted in the discovery of such relationships, but that they were very weak (see for example, Hilakivi et al. 1989 Andersson et al. 1971). Research later went on to study how driver motivation can affect traffic behaviour via theories on people being the victims of an overly demanding traffic environment that they cannot cope with (see for example Rumar 1985). The focus on motivation research was intended to explain how different motivational factors could affect the probability of meeting with an accident as well as to ascertain whether these factors could also affect people’s willingness to take chances in traffic. Three theories that have gained a major foothold within this genre are the ”zero risk theory” (Näätänen and Summala 1976), the ”risk homeostasis theory” (Wilde 1988) and ”threat avoidance” (Fuller 1984). The zero risk theory is based on the premise that a driver does not normally perceive any risk when out in traffic. Anything other than a perceived personal risk must therefore also affect how he/she behaves. According to Näätänen and Summala, drivers have many motives other than risk that influence their behaviour; e.g., showing off their driving skills, competing with other drivers, etc. The risk homeostasis theory is based on a similar way of thinking – that people as drivers adjust their way of driving so as to create a balance between acceptable risk and the risk perceived. Wilde is of the opinion that there is a ”thermostat” that regulates behaviour to an acceptable risk as the perception of risk changes. Wilde also believes that the risk perceived by a driver, whether great or small and which according to him could be greater than zero, governs his behaviour while Näätänen and Summala are of the opinion that drivers normally do not perceive any risk and therefore allow other motives control their behaviour. According to Wilde’s way of reasoning, improvements to vehicles or the traffic environment, or driving courses do not help improve safety since these measures reduce the risk perceived by drivers,

14
which is then expressed in higher speeds, for example, since vehicles and the traffic environment have become safer. Unlike the other two theories, the threat avoidance theory (Fuller 1984) is based more on a theory of learning which assumes that there is an inherent conflict between two different motives in drivers – a desire to travel as quickly and efficiently as possible from one place to another while avoiding danger during the journey. According to the threat avoidance theory, people learn to identify the dangers in traffic over time while at the same time learning to avoid them. ��� ��������� ������� During the past ten years, traffic research has tended to concentrate more on studying how different social factors influence how people use cars, and how this is related to accident risk. The concepts of lifestyle and socio-economic standing have been used in many studies (see, for example Schulze 1990, Berg and Gregersen 1993, Berg 1994 and Beirness 1996). Lifestyle is seen in most theoretical models as an expression of values and attitudes (Miegel 1990). Using this concept has the advantage of being able to know how people behave in their daily life, which can then be related to the possible risk they run in traffic. Socio-economic background is more a reflection of social class affiliation and thus the opportunity for completing something, like a driver education course. Since the term lifestyle is used as an all-embracing and general concept, anyone using it in a study must decide the level at which it is to be examined. In post-modernistic theories of lifestyle, there are three concepts that may be seen as complementing one another, namely “form of life”, “lifestyle” and “style”. These three concepts are quite unstable and fluid. Form of life has been given a broader meaning than lifestyle, which in turn is broader than style. To describe or analyse basic differences in living conditions, perspective on life, and social praxis, among various social classes, strata, or groups, the term form of life is often used. The concept of lifestyle is most often used to delimit basic values, interests, free time, or consumption. Finally, style is used to describe expressive expressions, signs, symbols, or artefacts that a special social group, subculture, or culture uses. There are also no absolute boundaries between the aspects of reality to which the concepts refer (Lundgren, 1992). Since the use of this concept is often determined by the object of the research, lifestyle may be said to have become a generic term which is used to denote different social and cultural aspects of human life and way of living (Miegel 1990). Hermansson (1988) is of the opinion that the lifestyle concept generally refers to people's actions and that the material culture in which people live can be seen as the result of these actions, while spiritual culture can be seen as both the framework which determines these actions and the result of these actions. Hermansson also considers that all young people belong to the same lifestyle but that they are divided into different youth subcultures. According to Hermansson, punks and a hard rock fan therefore live in the same lifestyle. However, punks and hard rock fans orientate themselves towards different groups of companions and therefore they represent different youth subcultures. Human life and living can be studied at three different, but nevertheless inter-related levels. These three levels are: structural level, positional level and individual level (Thunberg et al 1982:61 from Lööv and Miegel 1989). The highest level, structural level, refers to the level in
15
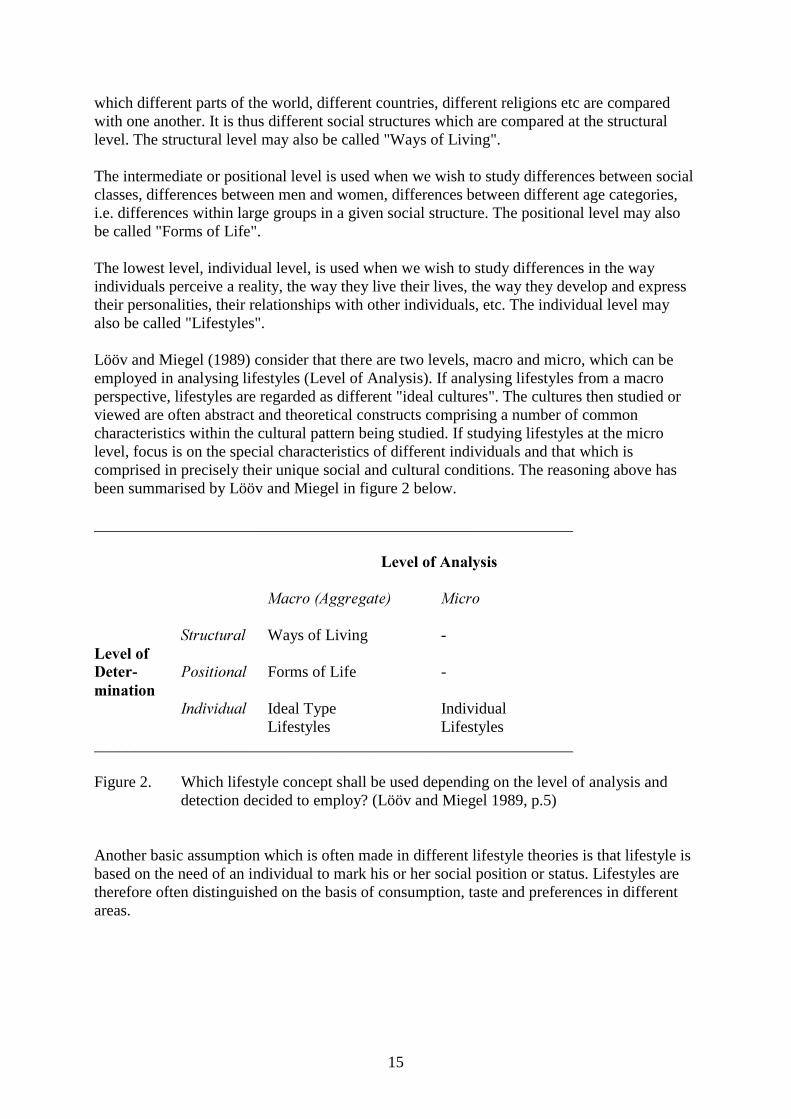
which different parts of the world, different countries, different religions etc are compared with one another. It is thus different social structures which are compared at the structural level. The structural level may also be called "Ways of Living". The intermediate or positional level is used when we wish to study differences between social classes, differences between men and women, differences between different age categories, i.e. differences within large groups in a given social structure. The positional level may also be called "Forms of Life". The lowest level, individual level, is used when we wish to study differences in the way individuals perceive a reality, the way they live their lives, the way they develop and express their personalities, their relationships with other individuals, etc. The individual level may also be called "Lifestyles". Lööv and Miegel (1989) consider that there are two levels, macro and micro, which can be employed in analysing lifestyles (Level of Analysis). If analysing lifestyles from a macro perspective, lifestyles are regarded as different "ideal cultures". The cultures then studied or viewed are often abstract and theoretical constructs comprising a number of common characteristics within the cultural pattern being studied. If studying lifestyles at the micro level, focus is on the special characteristics of different individuals and that which is comprised in precisely their unique social and cultural conditions. The reasoning above has been summarised by Lööv and Miegel in figure 2 below. ____________________________________________________________
� '���������������� ����� ����������� ����� ���������� Ways of Living - '�������������- ���������� Forms of Life -�.����� ���������� Ideal Type Individual Lifestyles Lifestyles ____________________________________________________________ Figure 2. Which lifestyle concept shall be used depending on the level of analysis and
detection decided to employ? (Lööv and Miegel 1989, p.5) Another basic assumption which is often made in different lifestyle theories is that lifestyle is based on the need of an individual to mark his or her social position or status. Lifestyles are therefore often distinguished on the basis of consumption, taste and preferences in different areas.
16
��� ����� ������� Social values are of central importance in people’s symbolic environment (Allardt 1988). "Social value" is a concept often employed in sociology. According to Allardt (1988), social values refer to 1) acquired values, 2) general values, 3) persistent values, 4) purposeful values and 5) tendencies to choose between different alternative actions. "Values are properties which characterise an object, tangible or intangible subjects and phenomena" (Brante and Fasth, p. 118 from Allardt 1988). Lööv and Miegel (1989) write that in most lifestyle theories it is assumed that a lifestyle is, in one way or another, an expression of human values. Lööv and Miegel examine four different types of values. These are ethical and moral values, religious and metaphysical values, material values and aesthetic values. In his typology for the relationship between value and lifestyle, Miegel (1990) has used these four types of values. The assumption that lifestyles are in one way or another an expression for comprehensive human values is made in most lifestyle studies. On the basis of the psychological needs which values satisfy for the individual, the American philosopher Howard Kamler (1984) distinguishes between different groups of values. One important such need is identity. Kamler makes a distinction between social and personal identity. Lifestyle values help the individual create and reinforce his or her social identity, while life philosophy values are important for an individual's personal identity. Kamler further considers that life philosophy values are embraced by an individual largely irrespective of the opinions of his or her environment. The situation regarding lifestyle values is exactly the opposite; the individual acquires these precisely on the basis of what those in his or her environment think. Life philosophy values are influenced by factors such as the social background, personality type etc of the individual. Lifestyle values, on the other hand, are influenced by both the immediate and the more remote and broader environment. This can be interpreted to mean that our environment influences us to embrace a certain lifestyle. Wind & Green (1974) consider that it should be possible to obtain a complete picture of an individual's lifestyle by describing this person's
- value structure,
- the relationship between these values and activities, interests and attitudes regarding leisure time, work and consumption.
Hedlund and Julander (1977) make use of Rokeach (1968 and 1973 in Hedlund and Julander 1977) when they in their lifestyle investigation want to define the concepts of attitude and value. They define attitudes as opinions relating to a certain object in the surroundings. Attitude is assumed to govern the actions of the individual, which clearly has its application in a traffic context, e.g. in choosing one's speed. According to Rokeach, values have the following functions: They are:
- the standard for one's actions

17
- the standard in developing attitudes. They are used to:
- rationalise actions in hindsight - make a moral judgment of oneself in relation to others - compare oneself with others.
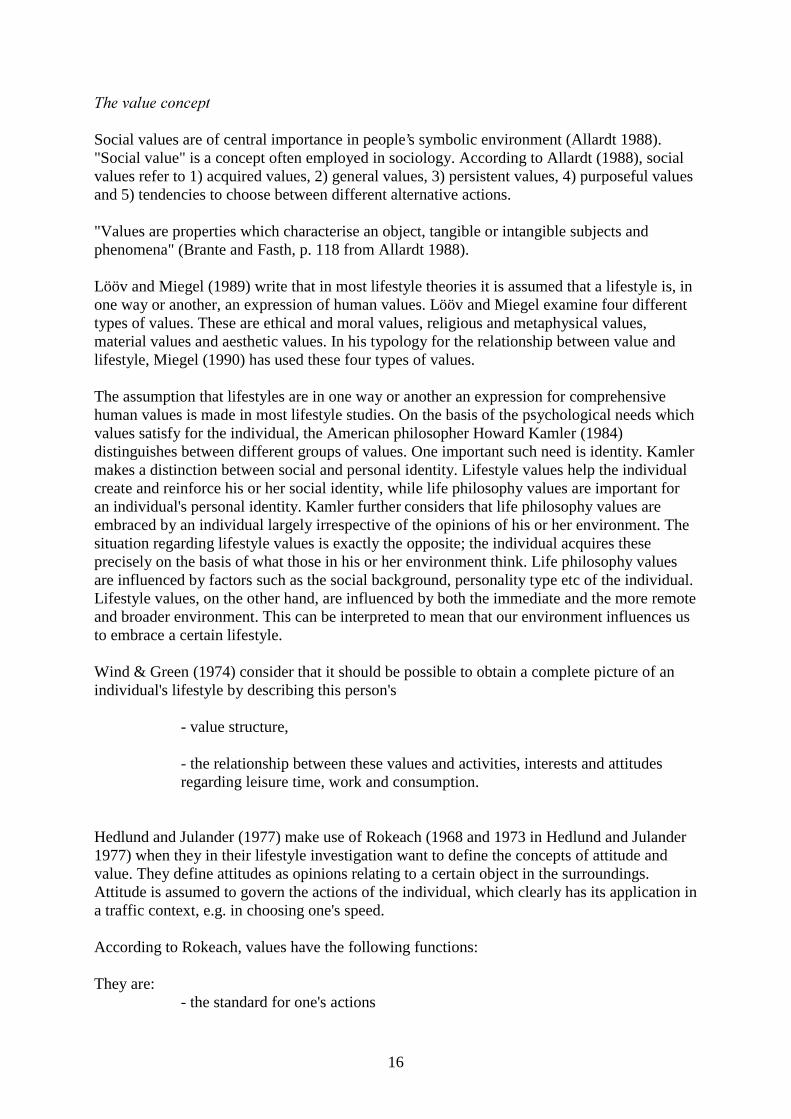
The value system of a person is described by how important he or she thinks it is to attain individual values. According to Rokeach (1973 (from Hedlund and Julander 1977), the value system is a function of the culture in which the person lives, socialisation processes, sex, age, class position, his or her religion, etc. Briefly, the environment in which a person lives influences his or her value system. ������ ��� ������ �������� ������ According to Miegel (1990), there are two overriding types of values. One type of values expresses the social identity of the person and another type expresses his or her personal identity. The first type of values could instead be called outward oriented values, and the second type inward oriented values. In turn, the outward oriented values can be subdivided into material and aesthetic values. The inward oriented values comprise ethical and metaphysical values. Of these two types of values, it is the outward oriented values which, in various theories, have always been regarded as the most interesting from a lifestyle perspective, but all values should be important in lifestyle research since values are a concept which forms the basis of most lifestyle studies. "In many respects, the lifestyle of an individual is an expression for all the values which he or she embraces" (Miegel 1990, p. 7). This fact has influenced empirical lifestyle research on endeavouring to form as complete a picture as possible of people’s lifestyles by using the greatest possible number of indicators of what a lifestyle represents and what is comprised in the concept of lifestyle. Miegel makes use of four large value spheres (see Figure 3). The explanations for these four value spheres are a direct quotation from Miegel’s research report. "The material values which may be said to consist of the individual’s conceptions of what, in the material sense, is "useful", "necessary", etc. This is the value which forms the basis of a person’s attitude to the consumption of time and capital. The aesthetic values which reflect the individual’s conceptions of "nice", "beautiful", etc. These values form the basis of the individual’s ideas regarding art, music, literature, films, etc. The ethical values which represent the individual’s fundamental conceptions of "good", "right", etc. These values help the individual to think and act in different kinds of moral issues.
18
The metaphysical values which consist of the individual’s fundamental conceptions of "true", "real", "eternal", etc. Metaphysical values provide guidance for us in existential issues" (Miegel 1990, p. 6).
Figure 3. How does a lifestyle arise? Miegel’s model (1990, p. 10) Each value sphere, in turn, creates an attitude. The values of an individual are concretised at attitude level. "The attitudes of an individual consist of his or her attitude to specific objects, phenomena and states in reality" (Miegel 1990, p. 8). These attitudes are then expressed in a large number of different actions and behaviours. The four types of values which an individual embraces give rise to the same number of types of attitudes. The attitudes which are based on material values are called interests. The term interest refers to the attitude of the individual to consuming and using his or her time and tangible and intangible resources. Attitudes arising from the aesthetic values of the individual may be denoted by the term taste. Taste means the attitude to the aesthetic qualities of different objects such as films, art, literature, music, choice of type of car, etc.
STRUCTURE
POSITION
INDIVIDUAL
OUTWARD ORIENTED INWARD-ORIENTEDVALUES VALUES
MATERIAL AESTHETIC ETHICAL METAPHYSICVALUES VALUES VALUES VALUES
INTERESTS TASTE PRINCIPLES CONVICTIONS
INTERESTS MORAL IDEOLOGICALACTIONS STYLE ACTIONS ACTIONS
LIFESTYLE

19
Our attitudes to e.g. euthanasia, animal experiments, immigration issues, consideration in traffic etc derive from our ethical values. These attitudes may be denoted by the term principles. Attitudes resulting from the metaphysical values of the individual are here called convictions. Convictions may refer, for instance, to the attitude of the individual to God’s existence, the meaning of life, the transmigration of souls, political ideologies, etc. Each and every one of the four types of attitudes gives rise to a special type of action at activity level. The material attitudes, i.e. interests, are expressed by what may be called interest actions. The way these actions are often expressed is that the individuals devote themselves to certain interests. An individual interested in music expresses this interest by listening a lot to music, an individual interested in motor sport carries out or watches a lot of different motor competitions, and an individual interested in football plays or watches a lot of football. The way in which a person expresses his or her aesthetic attitudes is called style. The term style describes the way an individual wears different clothes, uses expressions, listens to a certain type of music, watches a certain type of film on TV, reads certain books, etc. The ethical attitudes or principles are manifested in the actual moral actions of the individual, i.e. the way he or she behaves in situations where a decision must be made regarding issues which to him or her are moral ones. Being a vegetarian because one considers that animals are cruelly treated in slaughterhouses, being a conscientious objector, obeying all traffic rules, are examples of actions which may have an ethical basis. The term ideological actions is applied to actions based on metaphysical values and attitudes. Being interested in saving trees, being politically involved etc are examples of ideological actions. "The lifestyle of an individual is thus a meaningful pattern of his or her interest actions, style, moral actions and ideological actions, based on his or her values and attitudes" (Miegel 1990, p. 9), i.e. on all the four types of actions which have been discussed above. Miegel’s model is to be seen as an attempt to roughly schematise the complex concept of lifestyle. In reality, however, the boundaries between the different boxes are not so sharp but more indistinct, and in many cases they overlap. If the reasoning is to be carried to its logical conclusion, it may be said that there is a typology for every individual in this world. Typology may however be regarded as an aid in discussing and comparing different ways of theoretically tackling and empirically studying lifestyles. ��� �������� ������ ����� ��� ��������� According to Giddens (1994), class is the type of social stratification that exists in modern Western society. He defines social stratification as a structural inequality among people and distinguishes four different stratification systems: slavery, caste, estate, and class. As stated, the latter is characteristic of our type of society, while slavery, caste, and estate belong elsewhere, geographically or historically. The term “class” differs from the other three

20
systems of stratification in that social mobility is possible both upward and downward between classes. Unlike the other three stratification systems, class affiliation is in part acquired, not simply inherited. Moreover, class boundaries are not as sharp as boundaries in the other systems. According to Giddens, differences that exist between classes are often dependent on economic differences such as capital, ownership, and control over the means of production, which creates differences in wages and working conditions. According to Giddens, it is these differences that lead to structural inequality among various groups of people in Western society. In Marx’s classification according to class, it is the relationship to the means of production that is crucial. Marx divides society into three classes: wage labourers, capitalists and landowners. This classification was made in the late 19th century and is still applicable on a societal level. However, the link on the individual level is no longer as clear as it was a hundred years ago. Examples of this are the enormous growth of the white-collar sector and the increase in administrative professions (Ahrne, 1985). Unlike Marx, Weber’s classification by class is not dependent solely on control or lack of control over the means of production, but it also includes economic factors that are not directly related to ownership, such as the education, skills, and qualifications a person has when he or she looks for a job (Giddens, 1994). The social class structure described by Marx and Weber is based primarily on antagonisms between social classes that arise in the struggle to gain control over capital and production. Since this goal cannot be achieved by everyone, this struggle leads to conflict (Giddens, 1994). When making a classification according to class, it is important that the classes reflect actual conditions. Dividing people into social groups or classes can certainly be an easy way to sort people for a sociological analysis, but the division is irrelevant if it has no counterpart in reality. Thus, it is important how the classes are defined and how an individual is assigned to a class. In other words, it could be said that a class concept attempts to describe and identify basic conditions among a large group of people (Ahrne, 1985). The question then is what is defined as basic conditions? Ahrne writes that these conditions must first have significance to the individuals included in the group and, secondly, they must have important relationships to the economic and material structure of society. In this way, class becomes a link between society and the individual. ������ ����� ��� ��������� �The job situation, which is at the foundation of socio-economic class distinctions can determine a person’s living habits through a number of factors, such as income, place of residence, free time habits, knowledge, type of work, etc. (Ahrne, 1985). This means that the living patterns one has are related to the social class to which one belongs. In addition to class position, Ahrne believes age and gender also determine the living patters an individual develops. Age and gender, for their part, can also affect the class position a person has. Ahrne sees two perspectives on life, based on the combination of age and class position. One he calls “career perspective” and it is typical of high-level white-collar workers and business executives. He calls the other “wear-and-tear perspective” and it is found primarily among the
21
working class. He describes these perspectives as ways of related to production. With the career perspective, a person has a chance to advance through the hierarchy. This possibility increases with age. The opposite, i.e. the wear-and-tear perspective, means that the workers’ value on the labour market diminishes with increasing age. Thus, Ahrne assumes that a relatively strong relationship should exist between lifestyle, class, and age. Consequently, instead of using the concept of lifestyle as an alternative to that of class, he believes it should be a complement in analysing how class position influences people’s lives and behaviour. Hermansson (1988) has presented a class-based classification. He points out that in a study on young people it is difficult to place them in various classes. This is because, by definition, the class of young people is determined by the class position of their parents and does not consider their own experiences of work and any positions they may have held in the world around them. Nevertheless, he believes that there is a link between the parents’ class position and the child’s lifestyle, in that most middle class children stress family life, while working class youth emphasize interaction with their friends. He interprets this to mean that there is a lifestyle difference that is based on social class. Hermansson bases his class-based classification on the occupations of the parents. He considers young people whose parents are employed in traditional working class occupations such as trades, transportation, and production, but also those in subordinate positions in the public and private sectors to be working class youth. Under middle class, he includes those whose parents work in the private and public sectors in administrative positions or who hold skilled jobs as office workers or care providers. Like Ahrne, Hermansson discusses the question of whether lifestyle can be seen as separate from social class. He believes that people’s actions, which can be defined within a lifestyle, are related to their social position and social relationships. He also sees the concept of lifestyle as a complement to the concept of class. He has also found in different studies that the various lifestyles were linked to the social class of the parents. !��������" ����� ��� �������� ���� �� ������� Many studies have been made into the risk perception and risk assessment of young drivers. Young drivers' risk-taking may be associated with their lifestyles or part of their lifestyles (Beirness 1996, Jessor 1987). It is not known for certain what it is that governs young drivers' risk-taking, but one interesting aspect is the relationship which is found between their accident risks and their search for adventure, "sensation seeking" (e.g. Moe and Jenssen 1990, Jonah 1997). Young people also expose themselves to greater risk than older people when they drive under the influence of alcohol. Studies show that young drivers with an elevated blood alcohol content are over-represented in accidents, but that they do not drive while drunk more often than older drivers. This is borne out by the Norwegian researcher Glad who has estimated the risks young drivers run while driving. If the risk for a sober driver is put at 1.0, the relative risk for a drunk driver is 901 for younger drivers (18-24) as against 142 for older drivers (25-42). (Glad 1985). Several studies (e.g. Schulze 1990, Beirness 1996) shows that there are strong indications that the high accident rate of young people has a high degree of association with their lifestyles
22
and the social group to which they belong. Schulze studied young people’s accidents during journeys to and from leisure activities in the evening and overnight, "discotheque accidents". Over a three-month period, Schulze collected data relating to all accidents which occurred during journeys to and from discotheques in Germany. He found that 61% of drivers involved in accidents had blood alcohol contents above the permitted limit. In order to be able to decide to what extent lifestyle was related to the number of accidents, Schulze interviewed 1024 people in the 18-24 age group (November 1988 to January 1989). 79% of those interviewed had Class 3 (car) driving licences. Schulze interviewed the young people about their general and leisure interests, their attitudes concerning driving and traffic behaviour, alcohol habits and their background conditions. He identified seven different "lifestyles" and found that three of these lifestyles defined high-risk groups in traffic. 30% of those interviewed were in these three groups. Schulze called these three groups "action type", "fan type" and "nonconforming type". The "action type" group contained 16% of the investigation group. It is a special characteristic of this group that they often frequent pubs, discotheques and restaurants. They dislike soap operas, comics, and critical social films but like action films. To spend the time "just driving around" is also common in this group. The group is also characterised by the fact that they have many leisure activities outside their homes. The "fan type" group made up 9% of the investigation group. The primary characteristic of this group is that they are interested in football. They also prefer action films and dislike intellectual films and subjects. Members of the group often go to discotheques and often kill time by just driving around. The "nonconforming type" group contained 6% of the respondents. Their characteristics are that they dislike sports, membership of clubs, family life etc. Just driving around to kill time is popular in this group also. Those belonging to the "nonconforming type" group are very fond of music, especially rock, punk rock and hard rock. They also have an open mind towards more serious areas such as classical music and intellectual films. They have a poor opinion of football supporters and people who like going to discos. In spite of this, they accept activists and pacifists. These three groups have a number of common factors which explain their high accident risks. They drive a lot, particularly at night. They also consume a large quantity of alcohol, especially at weekends. 70-80% of those in the three groups are young men, and the occupations which dominate in these three high-risk groups are "masculine" occupations such as building workers and metal workers. One objection that can be made to Schulze’s study is that he had a fairly small sample and therefore found it difficult to form generalisable groups. His age spread in the investigation group was also quite large, and his results are sometimes perhaps due more to age variables than to lifestyle. Schulze’s results must therefore be interpreted with some degree of carefulness, and attention should instead be concentrated on his methodology which, in traffic safety research, created a new approach.
23
�#�������� �� � ������� ������� �� ����� ������ If a young person obtains a licence to drive a car at age 18, it comes during a transition period in which many other things are happening: finishing school, perhaps moving away from home, performing military service, getting a job, or deciding on further education, etc. Just as moving away from home is not just a practical solution to a problem of finances or insufficient space, but also a way of testing one’s wings or demonstrating independence vis-à-vis one’s parents and others, the driving licence can have similar symbolic importance. Mitterauer (1991) discusses important symbolic events in the transition of youth to adulthood. He calls these events “caesura of youth,” i.e. a kind of gradual change in status from the world of youth to the world of adults. Thus, he believes that obtaining a driving licence is one such caesura for young people, both in their own eyes and in the eyes of others. Other caesurae may be gaining sexual experience, going and coming when one chooses, finishing job training, moving away from home, etc. Mitterauer also believes that a driving licence/car ownership is not simply a practical means of transportation that becomes available, but also symbolises progress, independence, and freedom of movement on the path towards adulthood. He writes:
“For today’s young people, obtaining a driver’s license is a more important ‘initiation rite’ than coming of age or obtaining the right to vote.” (Mitterauer, 1991, p. 58)
Andersson (1987) also discusses the importance of a driving licence to young people’s entry into the adult world. He believes that for young people, this licence is a major step towards independence and self-reliance vis-à-vis their parents. With a driving licence, the young person is no longer dependent on public transportation or parental good will in order to get around. Even though Andersson’s work was published many years ago, his ideas are still relevant when he says that in times of unemployment a driving licence is even more important as a symbol of adult status. Young people are forced to remain in the world of youth, since they cannot get a job and their own living quarters. Instead, they continue studying and living at home with their parents. Thus, according to Andersson, young people are highly enthusiastic about obtaining their driving licence and other symbols of adult status. In their discussions, both Mitterauer and Andersson stress the significance of the driving licence in the transition from juvenile to adult life. Thus, obtaining a driving licence takes on symbolic content for many young people. In this case, the licence is important not only because it grants permission to drive a car independently and offers a means of identification, but it also serves as a visible symbol of who one is and what one is. Thus, it seems reasonable that many young people see the driving licence as a symbol of a more independent and adult position vis-à-vis parents and friends.

24
/,� ��0�� "��1����������
The five studies presented in the thesis have the common goal to increase the understanding of the accident problem among young car drivers. The focus of the thesis is also to contribute to the understanding of how lifestyles and other social and demographical factors influence young peoples health in terms of mobility and safety. Increased knowledge of the different factors mentioned above makes it possible to design safety measures specially tailored for different subgroups. This is expected to contribute to an increased effectiveness of the measures and reduce the conflict between mobility and safety. Special aims, defined in Papers I - V were: 1. To study the factors that influence young people in their decision concerning whether or
not to obtain a driving licence (Paper I) 2. To identify which groups of young people with different lifestyles and socio-economic
background start practice driving, and to determine the extent to which the different groups benefit from and take advantage of the new opportunity in Sweden to practise from the age of 16 (Paper II)
3. To visualise accident patterns during driving practice (Paper III) 4. To evaluate the effects of the reform that lowered the age limit for practice driving to 16 (Paper IV) 5. To identify specific lifestyles among young drivers and to analyse the relationship
between their lifestyle and accidents (Paper V)
25
2,� 0������'�(�0��1 ��(�����'����������$���� ��
As the five sub-studies differ with respect to design, material, methods etc, they will be presented individually in consecutive order. The material and methods, the results and a discussion of the methods used will be presented under separate headings. A general discussion and a conclusion of the results will be presented under chapter 4 and 5.
2,+� ����������..��������.�����������.��������
There are two ways to generate knowledge in science: through proof, ���������, or through discovery, ���������. Deduction and induction are each concepts for inference (Holmberg 1987). Deduction is highly suitable when studying well-known problems, where many studies have already been conducted using known methods. The theories and models already known help the researcher interpret and draw conclusions from the results obtained. Where knowledge is to be generated in new areas, a deductive approach is less suitable and an inductive approach could be preferable. Working inductively can be compared to an exploring expedition without really knowing the destination. Those studies for which the results cannot be explained on the basis of already known theories and models often need to be interpreted, thereby incorporating uncertainty into the results. Many studies that use an inductive approach can on the other hand help create a bulk of knowledge that can be used to generate theories and models that can later be used in deduction. Since both these approaches exist, different ways of working have also been developed to suit them and their way of generating knowledge. If the researcher elects a deductive approach, the work usually involves testing hypotheses based on experimental designs and methods using several different statistical analyses like the t-test, z-test, ANOVA, Chi-square and special variations of these. If on the other hand the researcher chooses to work inductively and create hypotheses, interviews can be used and/or explorative statistical methods like principal component, factor analysis, cluster analysis, or correspondence analysis, etc. Both approaches have been used and combined on occasion in the five studies comprising this thesis. An inductive approach has primarily been used in Paper III. Both have been used in Papers I, II, and V, while Paper IV is more purely deductive. There are advantages and disadvantages to each method and design. In applied research, the problem of being able to control everything except the variable being studied often arises in connection with experimental design. If the researcher is taking an inductive approach, as in Papers I, II, III and V, the difficulty in keeping constants is not as crucial since the problem was more general in nature. The matter of constants is more important to consider in Paper IV since the objective of the study was to find differences between three different groups of youths who had started driving practice at different points in time. Paper IV uses inferential statistical methods and the question of control is therefore extra important to consider. Paper IV therefore discusses this problem including how the results can have been influenced by different confounders that were impossible to control. One problem that arises when explorative analyses are used, like in Papers I, II, III and V, is where to draw the limit. How many clusters should the computer be told to produce? How many factors should be included in further analyses from a principal component analysis (PCA)? When should a dimension in a correspondence analysis (CA) be seen to have such an
26
influence on the result that it should be included? There is only one right answer to these questions: there is no right answer. Everything depends on the problem currently at issue. On the other hand, there are general guidelines for how questions are to be answered; e.g., one should instruct the computer to produce the number of clusters that gives the greatest possible variation between clusters while ensuring that there is as little variation as possible within the clusters. As to how many factors from a PCA and how many dimensions from a CA that should be included in the continued analysis, there is a screen test that can be used as help (Statistica 2000). In Papers I, II, III and V, different choices have been made showing the different limits used to choose the number of clusters, factors and dimensions. Papers I, II and V only use self-reported data. There are both advantages and disadvantages to this. One advantage is that this is an easy and inexpensive way to acquire a large quantity of data to work on. One disadvantage is not knowing how reliable the data is. Many of these problems can be avoided by carefully testing a questionnaire before sending it out. Moreover, many of the answers can be compared with available statistics. One problem (for research and not for road safety) is that there are very few traffic accidents reported to the police as regards injuries amongst young drivers. Official statistics show that only 0.8% of all drivers between 18 and 24 years of age were involved in this type of accident in 1997 (SCB 1999, SIKA 1997). On the other hand, 20-40% of those in the same age group have been involved in less serious accidents without involving human injury, if accidents involving property damage are included. In order to obtain a sufficient amount of accident data to work on at a reasonable level of cost, self-reported accidents were used as a measure of effect in Paper V, whereas police-reported accidents were used in Papers III and IV. 2,+,+� ��������������������.�������
Various methods were used in the studies. In Paper I, focus group interviews together with the underlying philosophy for the “Grounded Theory” was used as a first step. A principal component analysis with the aim to control for intercorrelations between variables and reduce the amount of variables was also used in the same Paper. When estimating the weight of each factor that influences young peoples choice, a generalized linear model (GLZ) was used. In paper II a cluster analysis was used to differentiate between the lifestyles and a GLZ has been used for testing differences in the number of driving permits and number of hours of practising. Paper III has used a correspondence analysis for searching for relations among different accident variables and their categories. Paper IV has used incidence density ratio (IDR) with 95% confidence intervals when testing for differences in accident risks. In paper V, a principal component analysis with the aim to reduce the items of lifestyle activities was used. Cluster analysis was used to differentiate between lifestyles and student’s t-test has been used for testing differences in the number of accidents. In all statistical tests, the level of significance was set to 5%.
27
2,/�� ������������������3�4�������������������������5�������6�7����
������)-�����*����������- �����������8�9��
2,/,+� 0������������.������
�This first study adopts an explorative inductive initial approach with a following statistical component. For a start, the study uses a qualitative methodology to build up a decision model to describe why a group of young people chose, or did not choose, to obtain a driving licence. The collection of data for the interview was carried out with the help of focus groups, which is a form of group interview in which 6-12 persons from the relevant population discuss a set topic with reference to their own experiences and views. Each interview took approximately one hour to complete, and a total of 44 young adults participated, of whom 16 represented urban areas and 28 rural areas. The interviewees were also split evenly between theoretical and vocational upper secondary school courses. The ages ranged from 17 to 19 years, and all were third-year students at upper secondary school. The distribution between males and females was balanced. The focus group interviews were analysed with the help of Grounded Theory (Glaser & Strauss 1967). The results of the questionnaire study were used for constructing a model, which was tested using a questionnaire sent to 2000 18½ year-olds in Sweden. The recipients of the questionnaire were randomly selected from the Swedish population register. Two reminders were sent out. A principal component analysis (PCA) with varimax rotation was then used in order to reduce the number of variables and to establish whether the response patterns present in the questionnaire study were the same as in the interview study. A PCA had to be used because several of the properties correlated strongly with one another and there was thus a risk that this would influence the result of the final regression analysis. This problem was excluded by performing a PCA, since the factors which are covered in a PCA are orthogonally separate from one another. The Generalized Linear Model (GLZ) (Statistica 1999) was used in order to provide an opportunity to establish the extent to which the different factors of the PCA influenced the decision whether or not to obtain a learner’s permit or a driving licence. 2,/,/� ��������
The results shows that underlying reasons for the decision by young people whether or not to take their driving test are very complex, since the two studies revealed that there are many different factors that influence young people in this decision. Perceived financial situation is the dominant factor with regard to the number of driving licences that will be held among young people in Sweden. The amount of time left over from schoolwork and leisure time activities is also highly significant. The norm among parents and friends in relation to a driving licence also has an influence on the numbers taking their driving test. The same situation also applies to how the car is regarded as a means of transport and to what a driving licence is considered to signify other than the right to drive a car. If the car is seen to increase independence, and if the driving licence is seen to confer status or to be a step towards the adult world, the effect will be to generate more driving licence holders. The opportunity to
28
travel by public transport also has an influence on the numbers taking their driving test. The better the opportunity to travel without having to use a car, the fewer the driving licences. 2,/,2� ���������
This article sets out the results of two studies which, from the outset, were conceived to interact in order to produce the most reliable result possible. An interview study was conducted ahead of the questionnaire study because very few previous studies had attempted to explain why the proportion of 18- and 19-year-olds taking their driving test had fallen so dramatically during the 1990s. There were thus two objectives for establishing initial contact with the target group and obtaining their direct views in respect of why they had chosen, or had not chosen, to obtain a driving licence. One objective was to generate new knowledge, and it was envisaged that the result would lead to an explanatory model. The other objective was, with the help of the results of the interview study, to produce the basis on which to construct a questionnaire with the highest possible validity. These two objectives were achieved, since the interview study not only gave new information about why the numbers taking their driving test in Sweden had fallen, but also contributed to the development of a model which was of very great help when the questionnaire and its questions were being formulated. The findings of the interview and questionnaire studies indicate a similar result. This is encouraging, as it demonstrates the benefit of embarking on a study based on qualitative methodology in which, as in this study, our knowledge of the problem area is low, and of then proceeding with the help of quantitative methodology with the aim of quantifying the different relations found in the interview study. 2,2� '��������������������������������7���)�����-�����.���������
���������������������������������������������.�����������+:�8��9�
2,2,+� 0������������.�������
The study consists of two parts, a minor pilot study and a main study. The pilot study was carried out in order to check whether the concept of lifestyle used in the study was reasonably fitted for the purpose of the main study and to give assistance in the development of the details of the questionnaire to be used. Six youngsters were asked to participate in a discussion about youngsters and obtaining a driving licence. The idea was to discuss not only questions of driving practice but also general issues in the everyday lives of young people and their friends. They were asked what they thought could influence and motivate young people to obtain a learner’s permit. In their comments, no distinctions between various youth cultures were found. Instead they stressed the importance of the family. Their views dealt mostly with material conditions, differences in family composition, etc. The results supported the choice of a lifestyle model chosen from Hermansson (1988) as a basis for the study. Hermansson describes the term ‘lifestyle’ as referring to people’s actions. He found in interviews with young people that it is the basic differences in their everyday lives that form a basis for the lifestyle classification. Hermansson found that some young people stressed their relationship with their parents, while others talked more about contact with their friends. He saw this as an expression of two different lifestyles among young people: parent-oriented and friend-oriented. Continuing his analysis, he found a third category which stressed both parents and
29
friends. Hermansson viewed this third group as a variant of the parent-oriented lifestyle. He describes this third group as being externally-oriented. In the early 1980s, SCB (Statistics Sweden) invested considerable resources in developing a new classification of socio-economic standing (MIS 1984) and this classification system was used in this study. The classification makes it possible to distinguish between blue-collar and white-collar workers. The occupational classification is dependent on several criteria. Both blue-collar and white-collar occupations are classified according to the number of years of training normally required for the occupation. The expected level of qualification is assumed to determine the position in the organizational hierarchy to which a person tends to belong. In studies involving young people, it may be desirable to know the socio-economic group to which their parents’ household belongs. Classification by household then becomes the young people’s classification, i.e. the household’s socio-economic code applies to the young person. The main study was conducted using a questionnaire mailed to a random selection of 601 17-year-olds throughout the country. The sample was extracted from the national Swedish population register. The respondents who received the questionnaire had had an opportunity to utilise the new driver education system where supervised practice driving could be started at 16 years of age for 13 months. The questionnaire was designed on the basis of Hermansson’s lifestyle classification, the MIS classification of socio-economic background and consisted of questions about these matters together with questions about learner’s permits and how the driver training was carried out. In the analysis, a cluster analysis (Everitt 1993) was used to divide the individuals into the various lifestyles. When testing for differences at a nominal level, Pearson and Wald's chi-square was used as a measure of statistical significance. A generalized linear model (Statistica 1999) was used when searching for differences in number of learner's permits and number of hours of driving practice. 2,2,/� ��������
The results show that men obtain a learner's permit more often than women (67.4% vs. 57.2%) and that youngsters in white-collar families acquire a learner's permit in more cases than those in blue-collar families (67.4% vs. 52.4%). One of the reasons for the latter group not acquiring a permit is that they cannot afford it, while children in white-collar families state they have neither the time nor the desire. No significant difference was found between the three lifestyle groups. When it comes to amount of practice, men were out on the road on average 39.9 hours during their first 13 months, compared to 19.9 hours for women. In the lifestyle groups, those who belong to the so-called externally-oriented lifestyle have practised most. They have reported 39.2 hours compared to the parent-oriented group with the least amount of training, 22.2 hours on average. The friend-oriented group had 27.9 hours of practice. When both lifestyle and socio-economic standing were considered, even greater differences were found. The white-collar group of the externally-oriented lifestyle reported as much as 51.5 hours, compared to the blue-collar group of the parent-oriented lifestyle with only 18.4 hours of practising.
30
2,2,2� ���������
A comparison of the results with official statistics showed that there was no greater dropout rate in one socio-economic group than in another. Among those who answered the questionnaire, ca. 60% had a learner’s permit, which was in good agreement with the corresponding national average for permits in this age category. The classification into lifestyle groups was based primarily on how the respondent relates to and how much time he or she spends on school, parents, and friends. With regard to lifestyle classification in general, whether or not the surrounding world-oriented group is the same as the one that is called surrounding world-oriented in the theoretical section is a matter that could be discussed. This could be because the questions were measured on a two-dimensional scale, where the alternatives go from parent-orientation to friend-orientation. The study was performed on a national average, while the lifestyle model used was based on a qualitative study on a very small number of persons in the city of Eskilstuna. Thus, the difference in the results of the study and Hermansson’s results (which served as the model for the study) could be due to differences in selection and methods and changes in society. The concept of lifestyle�chosen is relatively independent of time, since it is not defined in terms of fluctuating phenomena in society, but rather it is based on fundamental differences in young people’s lives. With regard to the socio-economic classification, one may discuss whether or not the classification represents a good measure of social stratification. Arguments are being presented in the current debate for other forms of stratification. For example, individuals can be divided into gainfully employed and unemployed or those who have access to information and communications via the global network and those who do not. Nevertheless the somewhat older socio-economic classification used still provides a measure of differences in income, level of education, and occupational status that are of consequence in the everyday life of the individual. 2,;� ��������������������������������������������)�����7����
�<�������������������������������������������8���9�
2,;,+� 0������������.�������
A total of 1081 police-reported accidents, which occurred during driver training in Sweden from 1994 to 1999, was the basic material used in this study. This material was extracted from Swedish National Road Administration accident database. Variables which described ���� happened, ����� it happened, ���# the accident affected and ���� the accident occurred were used in the analysis. The analysis covers all types of vehicle. No selection was made in respect of the question of blame for the accidents. Correspondence Analysis (CA) was used as the only statistical method in the study. CA is a descriptive/exploratory technique designed to analyse simple two-way and multi-way tables containing some measure of correspondence between the rows and columns (Benzéri 1992). It is thus possible to state that:
31
“��� #��� ������� �� �������������� �������� �� �� ������ ��� ��������� �� � ��#���$ ���� #����$ � ��������� ��� ��� ���� ���� � #��� ��#��� ���� #����$ ������� ������ ��������� �����#�����” (Clausen 1998, page 1)
CA is not an hypothesis-testing analysis, rather it is intended to permit “a cognitive synthesis” about systems of relationships in the data (Broady, 1988). Another important characteristic of correspondence analysis is that it is a geometrical method rather than a statistical method (Greenacre 1984). Also, a correspondence analysis can be simple or multiple. A multiple analysis (MCA) was used in the study. MCA may be considered to be an extension of a simple correspondence analysis to include more than two variables, and it is a simple correspondence analysis performed on an indicator (or design) matrix with cases as rows and categories of variables as columns. Both MCA and CA make use of a comparative approach, which is used in hypothesis testing with the help of a chi-squared test. A deviation between the actual distribution and the expected distribution is expressed as a weighted value, which is more specific than a chi-squared value (Heyman 1995). According to Heyman the interesting information lies in this chi-square distance measured. The information produced by the analysis is used to make clear a pattern of relations in a figure which can be expressed in a one-, two- or three-dimensional plane. Those categories which exhibit a similarity or over rows or columns will end up close to one another in a multi-dimensional space and categories which exhibit a dissimilarity will end up far away from one another. The different relationships must then be interpreted on the basis of the relative positions of these points, for example as spatial dimensions and/or clustering. 2,;,/� ��������
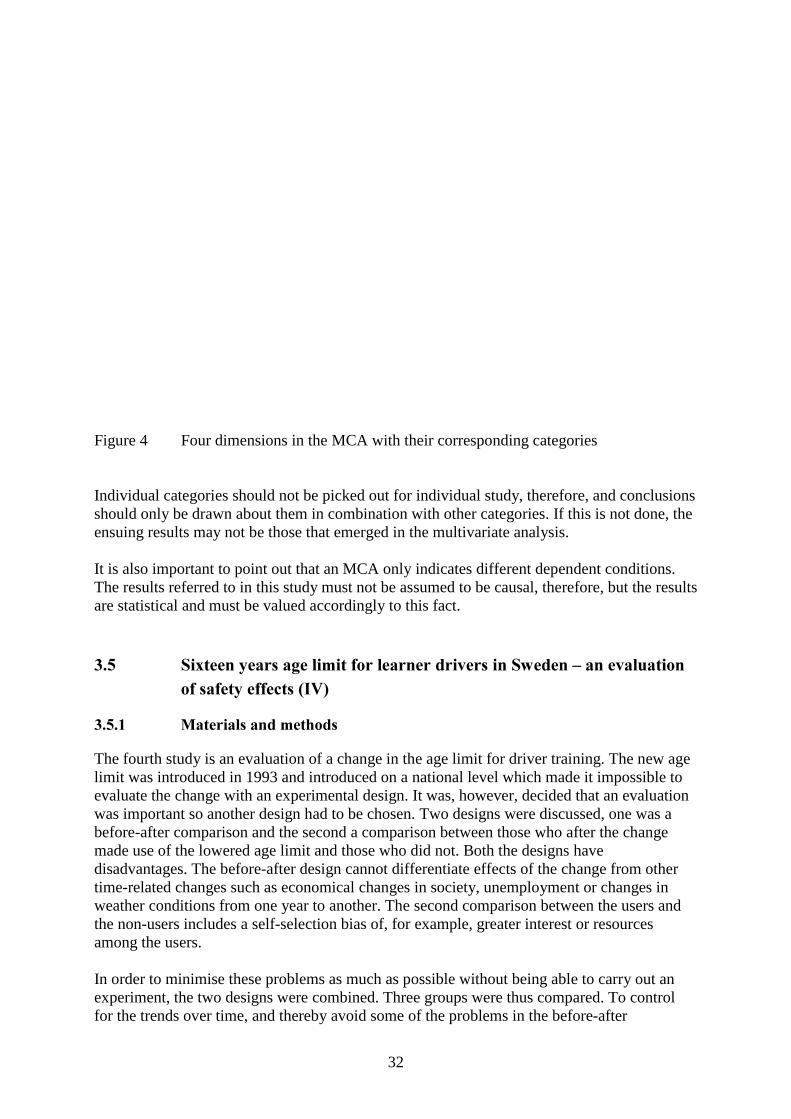
The results (figure 4) show that the problem of accidents during driving practice is multi-dimensional. The eight accident patterns which emerged in the results indicates that the problem is so complex that specific countermeasures must be developed – one single, simple problem solution is not enough. The results also show that it is possible to create images of different accident situations, in which every situation describes unique relationships which can be used in accident and injury prevention work. The results also indicate that general measures may be considered wrong when applied in wrong subgroups or circumstances. 2,;,2� ���������
It is important to consider that the findings are based on a large number of different approximations. If univariate or bivariate statistics had been used in the study, it would have been necessary to make many more analyses. The precision would perhaps have been greater in every individual analysis, but the general overview of the result, would have been, because of to many cross tables, drastically reduced. The decision to make use of multivariate analysis in this study also means that the result studied must always be considered jointly with the other categories included in the analysis.
32
Figure 4 Four dimensions in the MCA with their corresponding categories Individual categories should not be picked out for individual study, therefore, and conclusions should only be drawn about them in combination with other categories. If this is not done, the ensuing results may not be those that emerged in the multivariate analysis. It is also important to point out that an MCA only indicates different dependent conditions. The results referred to in this study must not be assumed to be causal, therefore, but the results are statistical and must be valued accordingly to this fact.
2,=� �<���������������.������������������������)�����7��������������������������������8�#9�
2,=,+� 0������������.�������
The fourth study is an evaluation of a change in the age limit for driver training. The new age limit was introduced in 1993 and introduced on a national level which made it impossible to evaluate the change with an experimental design. It was, however, decided that an evaluation was important so another design had to be chosen. Two designs were discussed, one was a before-after comparison and the second a comparison between those who after the change made use of the lowered age limit and those who did not. Both the designs have disadvantages. The before-after design cannot differentiate effects of the change from other time-related changes such as economical changes in society, unemployment or changes in weather conditions from one year to another. The second comparison between the users and the non-users includes a self-selection bias of, for example, greater interest or resources among the users. In order to minimise these problems as much as possible without being able to carry out an experiment, the two designs were combined. Three groups were thus compared. To control for the trends over time, and thereby avoid some of the problems in the before-after

33
comparison, an analysis was conducted of the accident involvement trend among young drivers over the period 1992-1997, i.e., the period covered in the evaluation. Three comparison groups have thus been used in the present study. The group, which took advantage of the opportunity to start practising at the age of 16 will be referred to as the ”16 years” group in this presentation. For one of the two control groups, the driving licence was obtained during the pre-reform period, before the change. These will be referred to as the ”old 17½ years” group. The second control group, which comprises youngsters who, after the reform, did not take advantage of the extended training period and started practising after 17½, will be referred to as the ”new 17½ years” group. Common for all groups was that the age limit for obtaining a licence was 18 years. For controlling for confounding factors such as difference in socio-economic background, age at which the drivers got their licence etc. Information about accidents was collected from the register of accidents reported to the police. Only the accidents causing fatalities or personal injuries were used. For each accident, the driver involved, type and date of accident were obtained from the register. Information on date of learner’s permit and licence were obtained from the national driving licence register. The samples in the additional trend analysis included young drivers between 20 and 24 years and the same type of data were obtained. For controlling for confounding factors a questionnaire was used. The samples were randomly drawn from the Swedish national driving licence register and sent at different times to drivers in the three comparison groups. Only two types of data from the questionnaire were used in this paper: data on vehicle mileage and socio-economic background. The analysis procedure is shown below. 1. The three comparison groups were identified in the two population registers, that is, the
total number of drivers in each group and, the number of drivers in each group who had been involved in police-reported accidents with personal injuries.
2. Individual data about date and age of learner’s permit and licence were transferred from the licence register to the corresponding post in the accident register. The Swedish personal social security number was used to match individuals in the two registers.
3. The accidents per 1,000 licence holders in each comparison group were calculated. 4. Data on mileage driven in each group obtained from the questionnaires were used as
estimates of exposure, to be used in the calculations of risk from the population registers data.
5. Accident risk (accidents per 10 million km) was calculated for each of the three comparison groups.
6. The general effect of the reform was analysed by combining the ”16 years” drivers and ”new 17½ years” drivers and comparing their accident involvement with the ”old 17½ years” drivers.
7. The accident involvement of the ”16 years” drivers, the ”new 17½ years” drivers and the ”old 17½ years” drivers were compared to each other.
8. Questionnaire data on socio-economic background, trends in national accident statistics and national register data on differences in licensing age were used to estimate confounding factors.
2,=,/� ��������
A comparison of the accident involvement between the ”old 17½ years” group and the combined figures from the other groups (the “16 years” and “new 17½ years” groups) gives a
34
measure of the general effect of the reform. The analysis shows that the reduction of accidents per 1,000 drivers after the reform, as compared to before, was 20.8 percent and the reduction in accidents per 10 million km was 17.2 percent. Each of the three comparison groups was compared as well. The results show that the ”16 years” group had a lower number of accidents per 1,000 licence holders and a lower accident risk (accidents per 10 million km) compared to each of the two control groups. The difference in accident risk between the ”16 years” group and the two control groups were in both cases 45.9 percent. The influence of three additional possible confounding factors was estimated in this evaluation. These were socio-economic background, general accident trend and licensing age. In the results of the questionnaire study (Gregersen, 1996b) it was found that the socio-economic conditions differ between the groups, which in itself may cause differences in accident involvement. The ”16 years” group belongs in a higher degree to families with university education compared to the other groups. The difference is approximately 10 percent compared to the ”old 17½ years” group and 5 percent compared to the ”new 17½ years” group. A generous interpretation of the influence of these background preconditions was applied on the results of the present study in order to avoid overestimation of the effect of the reform. Based on the results the differences in socio-economic preconditions in the ”16 years” group was approximated to 7.8 percent compared to the ”old 17½ years” group and 21.9 percent compared to ”new 17½ years” group. With an extreme and generous assumption, that the drivers with higher level of education in the family have no accidents at all, the accident involvement of the ”16 years” group would be reduced with 7.8 and 21.9 percent respectively in the comparison with each of the control groups. A comparison of the accident involvement between the ”16 years” and the ”old 17½ years” groups may also, over and above any effect of the reform, suffer from effects of changes in the general year-to-year trend of accidents as data were obtained at different time periods. In order to control for this, a trend analysis of accident involvement was carried out among drivers 20-24 years of age during the period of the evaluation study. National statistics of accident involvement show that the number of accidents per 1,000 licence holders was almost exactly the same over the entire evaluation period. There was a reduction from 1992 to 1993 which only influences the very first drivers of the ”old 17½ years” group itself since the follow-up period of the ”old 17½ years” drivers includes the years 1992-1995. The mean number of accidents per 1,000 licence holders over these years was 5.95. This can be compared to the mean level of 5.8 accidents per 1,000 licence holders for the follow-up period of the ”16 years” and the ”new 17½ years” drivers, which include the period from 1994 to 1997. In a comparison of licensure age it was found that the ”16 years” group was licensed at the age of 18.3, approximately 1 month earlier than the ”new 17½ years” and almost at the same age as the ”old 17½ years” group. After compensating the ”new 17½ years” drivers for this one month ‘lack of extra exposure, which is approximately 4.2 percent of 24 months together with the estimated influence of the other two confounding factors, the total effect of the extended learning period was estimated to approximately 15 percent, calculated as accidents per 10 million km. The resulting difference in accident risk for those who utilised the lowered age limit was approximately 40 percent compared to “old 17½ years” drivers and 24 percent compared to “new 17½ years” drivers. The reason why the difference between the risks of the “16 years” group and the “new 17½ years” group decreased so much, from 45.8 percent to
35
23.9, is mostly because the estimated difference in socio-economic background is as large as 21.9 percent. 2,=,2� ���������
The estimations of the effects of the reform have taken some confounding factors into account. The influence of three confounding factors, over and above that of exposure, has been approximated. These are, however, crude approximations and there may still be other confounding factors not controlled for. There may for example be unmeasured motivational aspects that influence the willingness to start practising early. It can, however, be concluded that the reform has given young drivers the opportunity to gain more experience. It would also, in order to increase this understanding, have been interesting to relate accident involvement directly to socio-economic background, attitudes, self-assessment, self reported driving style etc. This has, however, not been possible since data has been collected from different sources. Accident information was collected from national registers and all the other information comes from questionnaires among random samples of licence holders. Comparisons between these two sources were possible on an aggregated group level only. One of the confounding factors that was controlled was the general accident trend among young drivers. In this trend analysis, drivers between the age of 20-24 years were used. The slightly older age group was chosen to avoid influence from the reform. This difference in age may, however, result in an underestimation of the trend. The younger age groups may have been more sensitive to general trends in society, such as the economy and unemployment and therefore bias the trend estimate performed here. It is, however, not possible to differentiate such trends from the trends caused by the reform among the youngest drivers, since they apply to the same group.
2,:�� '����������������������.���������������8#9�
2,:,+� 0������������.�������
The fifth study was a questionnaire study among young drivers. A sample of 3,000 youngsters, 20 years old, were randomly drawn from the Swedish population register. The questionnaires were sent out by mail and the respondents were asked to answer questions about lifestyle actions according to the theory of Miegel (1990). The questionnaire therefore included questions about sports, music, movies, reading, dancing, cars and driving, clothing, body care, style, house holding, political and social engagement, alcohol and drugs, etc. There were also questions about background factors like gender, rural/urban living, education, occupation etc. and about involvement in traffic accidents. Accident reports were instructed to include material damage and/or bodily injury. The data from the many lifestyle questions of the questionnaire was reduced through a principal component analysis (PCA) rotated with varimax. The PCA resulted in a number of factors (lifestyle components) that were used in the second step, a cluster analysis (Everitt 1993). The purpose of the cluster analysis was to group the respondents into similar profiles over the lifestyle components. These clusters define the lifestyle groups.
36
After the cluster analysis, each cluster was analysed with regard to traffic accident risk (accidents/licence holders). A t-test was run for each group to calculate if they had been involved in significantly more or less accidents /person than the average of the whole group. Only accidents where respondents were the cause were used. From these analyses high-risk and low-risk groups were defined. 2,:,/� ��������
Using PCA, 10 factors were extracted, which together explain almost 50% of the variance in the material. The cluster analysis, based on the 10 factors and six other variables, defined fifteen clusters including four high-risk groups with an average overrisk of 150% and two low-risk groups with an average underrisk of 75%. The four high-risk groups together represent approximately 20% of the whole sample, and the two low-risk groups approximately 29%. 2,:,2� ���������
Two of the statistical procedures used in this study, PCA and cluster analysis are dependent on the subjective interpretations and decisions of the researchers. In the PCA, an approximation is done by reducing a number of variables into a few factors. In this case, the researcher makes the decisions about how large a proportion of the variance that should be explained in the factors used. If all factors from the analysis are included, the number of factors will be the same as the number of variables put in to the PCA. No reduction would have been done. In this study a limit of 50% explained variance has been used. This was achieved with ten factors. The rest of the variance, 50%, is explained by the 49 factors not used. Each new factor contributes very little to the variance. In the same way, the cluster analysis includes approximations. When grouping individuals into clusters, the procedure optimises the profiles and finds the distribution where the distances from the profile of each group are minimised. The profiles however will not be perfect until there are as many profiles as individuals. By grouping them together, there will always be approximations that cannot be fully controlled. �The basic interest in the study has been focused on how many accidents youngsters have, not their risk per mileage. Hence, accident risk in this study is defined as accidents/licence holder. In road safety research however, a traditional risk measure is accidents/mileage. The reason why this was not used here is that exposure has been regarded as an important part of lifestyle. Exposure is measured in several aspects like time of day, motives for driving, goals etc. If the exposure patterns are included in the lifestyle, conclusions can be drawn as to countermeasures intended to change exposure patterns. If, for example, a high-risk group drives a lot during night hours with motives other than transport, the conclusions will be that it is important to change their way of using the car.

37
;� ������'����$���� ��
The five studies combined provides more knowledge about the mechanisms behind the high accident risk amongst novice drivers. Paper I provides new findings about the factors that influence young people as to whether or not to obtain a driving licence. It also reveals a pattern, which clearly explains why fewer 18-year-olds are taking the driving test in Sweden. Financial resources, time, and accepted attitudes to a driving licence and public transport are the variables that have the greatest influence on the decision whether or not to take the driving test. This agrees closely with the pattern of developments for young people in Sweden during the 1990s. The majority of them today are enrolled in school until they are 18 years old. Many of them then continue to study at university or college, which often necessitates moving to the larger cities. These cities very often have a well-developed public transport system, and a driving licence is therefore not necessary for transportation purposes. Furthermore, students, regardless of whether they are studying in their final year at upper secondary school or in their first year at university/college, usually have a low income, which is needed for other things than a driving licence. Sweden also experienced an economic recession during the 1990s, which meant that unemployment rose and that the economic situation of families was weakened. The overall effect of this was to make it more difficult for young people to obtain a driving licence. The changes in values, which were proposed in the previous research as an explanation for this decline, gain a certain degree of support in the results of this study. It shows that young people today prioritise devoting more time to their studies rather than driver training. It emerged during the course of the interview study that young people think that it is expensive to take the driving test, and for many of them this is the reason why they do not do so. However, it was also revealed that, even if they had the necessary financial resources, many would still set entirely different priorities and would allocate their money to other things, such as entertainment, travel, clothes and various other activities. The norm of obtaining a driving licence as early as possible has thus changed over the last 15 years. All those interviewed said that they would eventually obtain a driving licence, although they do not know precisely when this will be. In view of the significance attributed to a driving licence and a car until the 1990s, it can be assumed from the results of this study that there has been a change in values. The status of the driving licence among young people appears to have declined, and it is also no longer regarded as the only entrance ticket to the adult world. This may be a reasonable assumption, as an increasing number of young people opt to study for a longer period (in this study, more than 60 % stated that they intend to continue with their studies after finishing upper secondary school). Accordingly, they feel that they have neither the time, the resources nor the need for a driving licence. This aspect was also mentioned during the interviews, where it emerged that obtaining a driving licence was something that would have to wait until after completing their studies and considering getting a job. This cannot be said to apply to all young people, however, since the driving licence was still regarded as important by some of the young people interviewed. One argument which should also be advanced in conjunction with the result of the study is the nature of the distribution between mobility and safety. We are already aware that the younger the group of newly qualified drivers the greater the risk of accident for the group (see, for example, Maycock 1991). Another side of this argument is that the study shows that it is
38
easier for many young people to extend their horizons with a driving licence. They can go on holiday in a car, they can reach their leisure interests more conveniently, and they can travel to and from their friends more easily, which means that they can derive a lot of enjoyment from a driving licence. It is also an advantage for some to have a driving licence when they want to find a job. If the desire is to reduce the number of accidents among young drivers in a simple way, the measures adopted should not make it easier for them to obtain a driving licence. If, on the other hand, the desire is to increase the mobility of young people and, in so doing, to ensure the benefit that they can derive from a driving licence, the opposite approach should be taken, i.e. adopt measures that make it easier for them to obtain a driving licence. The objective of this study is not to provide an answer that indicates which of these approaches is correct. Rather, the sole objective has been to attempt to explain what influences the decision of 18 ½ year-olds concerning whether or not to take their driving test. Knowing the factors that influence whether young people obtain a driving licence or not also makes it possible to predict the groups of young adults who will primarily make use of the Swedish driver education programme. Such knowledge can be used to adapt parts of the syllabus to suit different groups and thereby have a greater impact. Linderholm (1997) has shown that it is possible to influence different groups through different types of measure. Based on the findings in Paper V, she conducted a study aimed at developing a method for target group analysis of young drivers. She therefore selected four groups of men and called them adventure seekers, risk takers, responsibility takers and security seekers. Linderholm’s results indicate that the responsibility takers and the security seekers respond to logical arguments and the adventure seekers respond primarily to emotional arguments. Linderholm could not find any type of argument to which the risk takers tended most clearly to respond and offers two explanations: that the major factor for this group is the sender, and that this group needs very strong arguments before it is ready to respond. Knowing what use will be made of the driver education system makes it possible to have a sufficient number of teachers and driving schools that can help young people acquire a good education. The same knowledge can also be used to introduce different kinds of support measures aimed at helping young people manage their transport needs without having a driving licence. Andréasson and Sjöberg (1996) have shown that this ought to be possible. An interview with 17-year-olds showed that young people have a more positive attitude to using public transport than their parents. This was considered to be a reaction to the habitual use of the car by their parents, which they regard as environmentally unsound. Andréasson (2000) has shown similar results in his thesis. He is of the opinion that many young people today take a stand against the established car-owning generation. According to Andréasson, driving licences and cars have lost a lot of the importance assigned to them by representatives of the older generation. Andréasson and Sjöberg’s research findings show that it ought to be possible to persuade many young people to manage their transport needs through using public transport instead of having their own car. Most likely they will need a driving licence at a later stage in life, but if different support measures can help postpone the time when a driving licence becomes necessary, significant safety gains could be won without this restricting the mobility of young people. The positive effect on safety includes a higher average age for novice drivers, which should also serve to lower the initial accident risk for this group. For anyone still wanting a driving licence, extensive driving experience prior to obtaining a licence is important. Paper IV reveals new findings about the impact of a lower practice driving age limit on the accident risk for novice drivers. The study also shows how and who (as regards social background) takes advantage of the opportunity for practice driving over a
39
longer period of time. The findings also support the theory of skill acquisition (Rasmussen 1984). Regarded in the perspective of Rasmussen’s theory, skill acquisition takes place purely as a development from conscious decision-making and reflection towards gradually increasing automation. In this process, systems of behavioural rules and mental models are created so that car driving, to a greater extent can take place with but occasional mental effort. Such sequences can be expected as a result of increased exposure to a variety of traffic situations in which the student builds up a bank of routine and recognition. Further, Paper IV shows the inequality between different social classes as regards the opportunity for extensive practice driving, and thereby inequality as regards safety on the road for novice drivers from different social backgrounds. The findings in Paper II have been used in paper IV to better understand the phenomenon concerning social differences in practice driving and obtaining a drivers license. Two main conclusions may be drawn from the results of Paper II. The first is that there are differences between men and women in obtaining a learner’s permit, as well as between the two socio-economic groups. The second is that the amount of practice is also influenced by gender, as well as by lifestyle, both on its own and in combination with socio-economic background. These results are highly significant since they do not comply with the intentions of the lowered age limit. The idea behind the new system was that all young people should have the opportunity for a longer period of driving practice in order to reduce the high accident risk during the first years after obtaining a driving licence. The results indicate that it is more difficult for women and for blue-collar youth to start practising at the age of 16, and for other subgroups to practise much at all. Measures must therefore be taken to remedy this situation. If the situation remains, the consequence will be that certain groups will not have the opportunity to benefit from the possibilities of increasing their experience behind the wheel under supervision. Since the evaluation of the lowered age limit (IV) has shown considerable safety enhancement effects, those groups will, due to inequality, be exposed to higher risks in traffic. The results therefore show that if society wants everyone with a learner’s permit to practise extensively prior to taking the driving licence, and thereby improve the accident statistics afterwards, endeavours must be made so that this chance is available to everyone. The findings also indicate the area in which this support should be introduced. Despite the fact that Paper IV shows the positive impact on safety of extensive practice driving, there is a negative aspect involved in persuading everyone to practise frequently; i.e., the accidents that occur during practice driving. It is true that these are fewer than those involving newly qualified drivers, but they are still unacceptable. Since practice driving is governed by so many different background factors, it can also be assumed that there is a difference in the kind of accident that occurs in connection with practice driving. In order to counteract this, these accidents must therefore be visualised and the findings in Paper III show where to possibly begin. The eight different accident patterns shown in Paper III characterize the situations in which a particular type of accident is most likely to occur. It is important to remember that specific accident patterns exist, since this creates many opportunities to develop new ways of working with targeted prevention. Instead of adopting the previous approach, i.e. making a general attempt to counteract the relationship between individual variables and accidents, it is possible instead to focus on a whole context and its relationship with its typical accidents and any resulting injuries. A context-by-context approach of this kind means that the measures that are taken can act selectively without contributing to the introduction of a large number of general restrictions, e.g. with respect to where and when practice driving is permissible.
40
Although the accident reduction in the ”16 years” group was approximately 40 percent, the national general effect of the reform was 15 percent. The obvious reason for this difference was apparently that only some of the young learner drivers took advantage of the lowered age limit. If a larger part of the young learner driver population could be persuaded to start early and to practise more, the safety potential of the lowered age limit may be exploited even more. As shown in many different studies (e.g. Simpson 1996, Gregersen 1996a), there are, however, also a large number of other factors that are related to driver behaviour and accident involvement of young, novice drivers. Many of these factors cannot be reached through increased experience solely. The first four studies concern taking a driving licence and practice driving. Paper V is based on the perspective that the conditions for different groups are not the same after passing the driving licence, and that this knowledge can be utilised to influence the accident risk afterwards. Paper V shows further that accident prevalence varies substantially between groups of novice drivers categorised according to lifestyle. Thus, novice drivers should not be seen as a homogeneous high-risk group, which is often the case in debates and discussions concerning conceivable measures. Paper V also shows that there is a dominance of men in the high-risk groups, but that they also include a substantial number of women. The results also provide knowledge about the kind of targeted prevention action that can maximise the effect of a measure within the different lifestyle groups, as well as where and how to try to find the different groups. Maximum advantage can be drawn from this, more than what is the case today. The findings in Paper V were further developed by Linderholm (1997), who also defined groups of novice drivers according to what is described above. It ought to be possible to further develop her work based on the studies in this report and in so doing learn more about how best to influence different groups. The results obtained from the five studies presented in this thesis provide a sound basis for the continued development of driver education in the direction of a higher level of safety, or what has been adopted by the Swedish Parliament as the ”Vision Zero”, meaning that no one should have to be killed or severely injured in traffic. The main emphasis in ”Vision Zero” is on injury prevention through built-in safety features in vehicles and remedial action in the road environment. The underlying philosophy is that people do unintentionally make mistakes, even in traffic. If such mistakes are made by young novice drivers, for example, the road environment should be “forgiving” in order to prevent serious repercussions. Behaviour- oriented measures aimed at reducing the impact of such mistakes are also important in the “Vision Zero” approach; e.g., better speed adaptation and driver education. This means supplementing other types of road safety undertaking with more group-adapted learning and experience accumulation processes. It is also a matter of reducing the number of accidents that occur during driver training; individualising driver training in order to increase risk awareness; convincing young males not to overestimate their driving skill; conveying an insight into the influence of group pressure, lifestyle and personality on driving style and accident involvement; and use all these means to stimulate the motivation to drive carefully and with greater safety margins. Many of these measures have been in the process of development for a long period of time in many countries. In Sweden, the Government and the National Road Administration have decided to continue improving driver education. By making use of frontline knowledge about young novice drivers, a graduated driver education system is currently being developed. The most important aim of this work is the further reduction of novice drivers’ involvement in road accidents.

41
=� ������'�$ �$'��� ���
It is obvious that the findings in this thesis pose many questions; but they also provide answers. One important answer is the large variation in the results presented in the five papers. It is important to regard this variation as an asset. If models to account for the variation can be created, this will offer the possibility of developing different countermeasures for the selective influencing of different groups under different conditions with greater accuracy than today. If advantage of this opportunity is not taken, general countermeasures are the alternative. However, although general measures can reduce the accident risk to which a specific group is exposed, they can also make driving practice difficult for other groups. Paper III has shown that only 0.2 % of all learner drivers are involved in a traffic accident during driver training. It is important, therefore, not to restrict the opportunity to practise for the 99.8% who were not involved in any accident reported to the police. An attempt should be made instead to encourage those who wish to take their driving test to practise as much as possible but, at the same time, to introduce measures to ensure that they can practise as safely as possible. If this is well adapted to target groups and situations, safety can be enhanced significantly, both during driving practice and afterwards. It is important to apply the same way of thinking when it comes to the youngest age group of driving licence holders as well. In order to get an idea of the relationship between drivers involved in road traffic accidents entailing injury which were or were not reported to the police, it is interesting to mention that in the 18-24 year old category, 3652 of 462 638 drivers, or about 0.8% were involved in an accident reported to the police in 1997 (SCB 1999, SIKA 1997). This means that some 99 of 100 young drivers do not figure in the official accident statistics. Needless to say, there is a large number of non-reported cases when it comes to accident statistics, but the fact still remains that most young drivers do not meet with serious accidents to any greater extent. If it is the intention to take deterrent action in order to reduce the number of accidents that actually do occur, using general methods like bans on driving at night, on weekends or with friends in the car, etc should therefore be avoided. The mobility of the majority is not to be restricted because of the few drivers involved in accidents reported to the police. It is also important to take the concept of health into consideration, since a healthy life does not consist only of the absence of misfortune. Human health also includes physical and psychological well-being. WHO (2001) defines health as: 1. A state of complete physical, social and mental well-being, and not merely the absence of disease or infirmity. 2. Health is as resource for everyday life, not the object of living. It is a positive concept emphasizing social and personal resources as well as physical capabilities Being able to get around by car when and where one wants is a source of well-being for many young people. Restricting the needs of the majority because of the few who are involved in an accident risks lowering the collective level of health for young people as a group. Selective influence is therefore important from two aspects: eliminating as many accidents as possible without simultaneously limiting mobility for young people as a whole. If this is done in a way that is well suited to target groups and the situation at hand, it should be possible to achieve significant positive effects on safety and health.

42
%����� ���� This thesis does not offer a complete solution on ��� to deal with the implementation of a more precisely targeted preventive approach. On the other hand, it does contribute knowledge about ����� traffic safety endeavours should start and on ���# and ���� this work must be focused. Developmental work aimed at answering the ��� �� �� question must, therefore, follow from this thesis. Further studies and explanation of the inter-relationships indicated in the results will also be required. Only then can effective measures be adopted with a view to increasing both safety and mobility among novice drivers during driving practice and afterwards.

43
:,� �$>� 4'����0�����
A thesis can not be made without some organisations financing several projects. The financial support for the studies in this thesis comes mainly from NTF, SNRA and KFB. Many thanks to this organisations and especially to Magnus Björnback, Divisional Manager at NTF, Örjan Ellström Divisional Manager at SNRA and Nils Edström, KFB. I also wish to thank the present chairman of the Division of Social Medicine and Public Health Science, Department of Health and Environment, Faculty of Health Sciences at the University of Linköping, Professor Toomas Timpkka, MD, PhD, for accepting me as a doctoral student and for promoting me to a public defence of my doctor’s thesis. I am also grateful to Hans Erik Pettersson, PhD, Research Director at VTI, for his financial support of my postgraduate studies. In four of the articles in this thesis two names, Berg and Gregersen, stands together as author or co-author. This co-operation has been going on for almost ten years and given me a lot of fun and valuable help. A special thanks goes therefore to my tutor and friend Nils Petter Gregersen, PhD, Senior Researcher at VTI, for his constructive guidance, encouragement and always strong support. A special thanks goes also to Mats Wiklund, PhLic, Senior Researcher at VTI, for his never ending patience when answering all my statistical questions. Many thanks to both of you. I also wish to express my gratitude to all my fellow researchers at VTI for all their help and support during my work towards this thesis. It is only possible to mention some of all of you I would like to express my sincere thanks to. A special thanks goes to Sixten Nolén, Inger Engström, Anders Nyberg, Kristian Eliasson, Jan Palmkvist, Fredrik Andersson, Martin Warmark, Stina Järmark, AnnSofie Senneberg, as well as many others from other organisations who have helped me with research ideas and valuable discussions such as Per-Olof Grummas Granström, MSc, Divisional Manager at SNRA, Esko Keskinen, PhD, Professor at Department of Psychology, University of Turku, Mika Hatakka, PhD, Inger Linderholm, PhD, Håkan Andréasson, PhD and Gunnar Carlsson, MSc, Research Director at NTF. Many thanks also to Anders Englund, PhD, Emeritus Professor for his support in the beginning of my postgraduate studies and to Per Bjurulf, MD, PhD, Emeritus Professor of Division of Social Medicine and Public Health Science, Department of Health and Environment, Faculty of Health Sciences at the University of Linköping, for his valuable guidance how to write this thesis. I am also very grateful to all the young drivers who have answered the questionnaires or let themselves be interviewed. All who took part in this work were a tremendous help. Finally, a special thank to my parents, Gun and Sten-Åke, for all their support and encouragement during my 15 years of under- and post graduated studies.
,-,-,�
44
?,� ��"����$���
Allardt, E. Sociologi. (1988). ��#��#��&'" ��#�(����������� ��� �������������. AWE/GEBERS. Andersson, B-E. )'������� *�� ��� � ����'������+ (1987). Ingår i Spolander, K. (Ed.): Ungdomar och trafiken omöjlig kombination, NTF. Kista.
Andersson, A L., Nilsson, A., Henriksson, N. (1971) ����������� ����������� ������ �������������� ��� ������������ ����� ��� �������+ British journal of psychology, vol 61:409-421. Andréasson, H. (2000). ,����(��� � ����#�(����+ Etnologiska föreningen i Västsverige. Göteborg. Andréasson, H., Sjöberg, A. (1996). -����#��� ��� �. ��������������� ��� ��+ Göteborg. Trafikkontoret. Ahrne, G. Ekerwald, H,. Leiulfsrud, H. (1985). )�����#�(����� �'�(������. Arkiv, Lund, 1985. Beirness, D. (1996). ��� ������������ ������ ��������� ������� ��� ���������� ��������� ����� �������+ In Simpson, H. (ed) (1996). New to the road. Reducing the risks for young motorists. Youth Enhancement Service, University of California, Los Angeles. Benzécri, J-P. (1992). /������������� �������� 0������. New York. Marcel Deeker, Inc. Berg, H-Y., Gregersen N P. (1993). ��#��� #����� ���� ���'����� �������� ��� ����� ���������� � ��������� VTI rapport 374, Linköping. Berg, H-Y. (1994) !�������" ������ ��� ���� ���'����+ *� ������&�������+ Statens Väg- och transportforskningsinstitut, Linköping, VTI rapport 389. Broady, D. (1988). 1������� 2��34��� ��� ���������������������+ Arbetsrapport 1988:4. Stockholm. UHÄ. Clausen, S-E. (1988). ������� /������������� ��������5 �� ������������+ Sage University Papers. Series on Quantitative Applications in the Social Sciences, 07-121. Thousand Oaks, CA:Sage. Ds1997:13 (1997). �. �(� #�� ��� �������(��� ��#�(����+ Regeringskansliet, kommunikationsdepartementet, Stockholm. Egidius, H. (1995). ���������" ���������" �����������" ���#��$����+ Lund, Esselte studium. Englund, A., Gregersen, N. P., Hydén, C., Lövsund, P., Åberg, L. (1998). �������(������+ *� ��������'�������+ Studentlitteratur, Lund. Everitt, B S. (1993). /������ ��������. (third edition). New York: Halsted Press.
45
Ferdun, G S., Peck, R C. and Coppin, R S. (1967). ��� �������� ������+ �� ���������� �� ���" �$��������" ������� �$������ ��� ������ �������� �� ���� ������ �� ������� ������+ Highway Research Record, No 163 (31-53). Fuller, R A. (1984). /���������������� �� ������� �������� �� ������ ���������+ Ergonomics 27, 1139-1155. Glad, A. (1985). ,������� �� �������� ��� ������� �� 6�����+ Oslo, Temahefte nr 15 i temaserien Samferdsel, TOI. Glaser, B G., Strauss, A L. (1967). ��� ��������� �� �������� ������5 ���������� ��� 7���������� ��������+ New York: Aldine Publishing Company. Gregersen, N P. (1991�+ -��� ���'����" �(������������# ��� �������� �� ����������.��(����+ Linköping, VTI rapport 368. Gregersen, N P. (1996a). 8���� ��� �������+ 9�� ��� ���� ��������������� �� ������� ���������: 0�� ��� ������ �������� �#����� ����� ���������: VTI Report 409A. Swedish Road and Transport Research Institute, Linköping, Sweden. Gregersen, N P. (1996b). *��������� �� ;<����� ��� ��#�� ��� ������ �������� = ����� ������+ VTI Report 418A+ Swedish Road and Transport Research Institute, Linköping, Sweden. Greenacre, M J. (1984). ������ ��� ������������ �� /������������� ��������+ London, Academic Press, Inc. Giddens, A.(1994). Sociologi 1. Studentlitteratur, Lund. Hedlund, G., Julander, C-R. (1977). !�������" #��&'" ��#�(���5 6.��� ������ �# ������# �� ����������� #��������� ��+�Handelshögskolan i Stockholm Hermansson, H-E. (1988). %��������� ���+ Daidalos, Göteborg, 1988. Heyman, I. (1995). >.��� ���� ����? #�.������������������ ���#�($� � ������� �&����'�������� ������������ ;@AB = ;@@;+ Daidalos, Göteborg. Hilakivi, I., Veilahti, J., Asplund, P. Sinivuo, J. Laitinen, L., Koskenvuo, K. (1989). � ��$���������� ����������� ���� ��� ���������� ����#���� ������� ��������� �� ����� �������+ Accident Analysis and Prevention, vol 21:413-418. Holmberg, C. (1987). # ���������. I Patel, R. & Tebelius, U. (red): Grundbok i forskningsmetodik. Studentlitteratur. Lund. Jessor R. (1987). ,���� ������� ��� �����# ���������� �������5 �� �$������� �� �����# ������� ������+ Alcohol, Drugs and Driving, 3:1-11. Jonah, A B. (1997). ��������� ������� ��� ,���� C������+ In Rothengatter, T., Vaya E C. (ed) Traffic & Transport Psychology. Theory and application. Pergamon Press.
46
Kamler, H. (1984). !��� ���������� ��� !��� �����+�Social Indicators Research 14(1) 69-81. Levy, D T. (1990) 8���� ��� ������� ������5 ��� ������� �� ������� ���" �$��������" ��� ���������+ Accident Analysis & Prevention 22, 327-334. Linderholm, I. (1997). �.�������� ��� ��������+ *� #����� �'� #.������������� ��� �����#���� �� ������ �# �������(������ ���� ���� #������ �����������+ Lund Studies In Media and Communication 3, Lund University Press. Lundgren, L-J (redaktör).(1992). !������� ��� #��&' �. �(� #�� ��� #��&'�(����� �������+ AFR, BFR, FRN, HSFR, NUTEK, SNV, TFB, Stockholm. Lööv, T., Miegel, F. (1989). ��� 6����� �� !��������+ ��#� ����������� /�������������+�REPORT No 15, Department of Sociology, University of Lund. Sweden. Maycock, G., Lockwood, C-R., Lester, J-F. (1991). ��� �������� �������� �� ��� �������+ (TRL Research Report 315). Crowthorne: Transport Research Laboratory. Mayhew, D R., Simpson, H M. (1995). ��� ���� �� ������� �$��������5 �#���������� ��� ��� �������� ��� ��������� �� ��� �������+ Toronto, Ontario: Insurance Bureau of Canada. Miegel, F. (1990). # �(���� ��� ������������Rapport nr 25. Forskningsrapporter i kommunikationssociologi. Sociologiska institutionen vid Lunds Universitet, Lund. MIS. (1984). ����������#��� ���������" ��*��+ 1982:4, Reprinted 1984. Statistiska centralbyrån (SCB), Örebro. Mitterauer, M. (1991). -����#������� ������� ��������+ Röda Bokförlaget, Göteborg. Moe, D., Jenssen, G D. (1990). -�� �D���� ������������ �� ����������� ������������� Trondheim, SINTEF, Samferdselteknikk, Rapport STF63 A900007. Näätänen, R., Summala, H. (1976). ,��� ���� �������� ��� ������� ���������+ North-Holland publishing Company. Amsterdam. Rasmussen, J. (1984). �����#����� ���������� ��� ��#��#������ �����������+ An approach to cognitive engineering. North-Holland, New York, Amsterdam, London. Red Cross (1998) at http://www.ifrc.org/docs/news/98/98062501/ Rumar, K. (1985). ��� ���� �� ���������� ��� ��������� ������� �� ������� ��������+ In Evans, L., Schwing, R.C. (Eds.) Human behaviour and traffic safety. New York, NY. Plenum Press, pp 151-165. SCB. (1999). ���������� .���� ;@@@. Stockholm. Statistiska centralbyrån. Schulze, H. (1990). !��������" ������������ ��� ������� �������� �� ����� �������+ VTI rapport 364A. Statens Väg- och transportforskningsinstitut, Linköping, Sweden. SIKA. (1997). ������������ ;@@A" Stockholm, Statistics Sweden
47
Simpson, H. (ed). (1996). 6�� �� ��� ����+ ,������� ��� ����� ��� ����� #��������+ Youth Enhancement Service, University of California, Los Angeles. Spolander, K. (1983). 2���'����� ������������+ *� #����� ������ �. #(� ��� �������+ VTI Rapport 268. Statens Väg- och transportforskningsinstitut, Linköping, Sweden. Statistica. (1999). Electronic manual at http://www.statsoft.com/textbook/stglz.html, 1999-07-15. Statistica. (2000). Electronic manual at http://www.statsoft.com/textbook/, 2000-09-20. United Nations. (1998). ���������� �� ,��� ������� ��������� �� *����� ��� 6���� �#�����. United Nations, Vol. XLIII, New York and Geneva. Wilde G J S. (1988). ,��� ��#�������� ������ ��� ������� ���������5 ������������" ���������� ��� ����������� �� ���������� �� ������ ���������+ Ergonomics, 31 (4). Wind, Y. and Green, P E. (1974). ��#� ����������" #������#��� ��� ���������� �����#� �� ���� ����� ��������+ In: Wells. W D. (ed). (1974). Life style and psychographics. AMA. World Health Organization (WHO) (2001-01-19). http://www.who.int/terminology /ter/index.html

48
49
!��������
������������������3�4�������������������������5�������6�7����������)-�����*����������- �����������

50
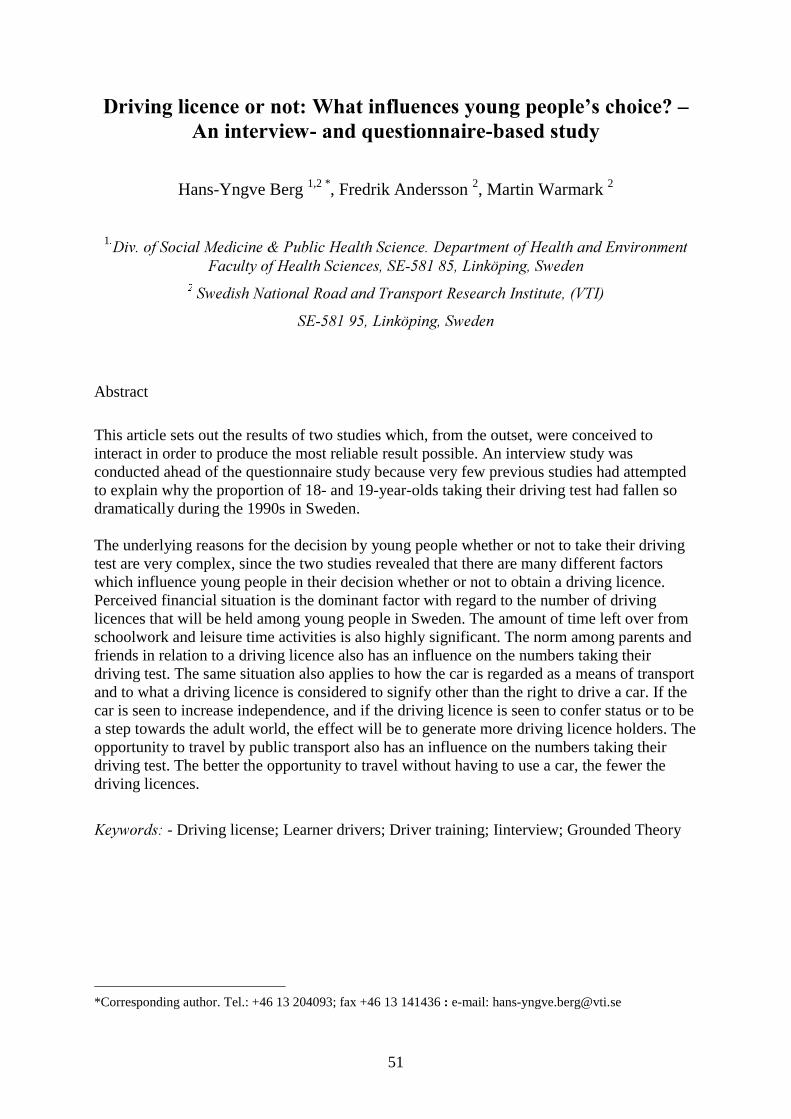
51
������������������3�4�������������������������5�������6�7����������)-�����*����������- �����������
Hans-Yngve Berg 1,2 *, Fredrik Andersson 2, Martin Warmark 2
1�C��+ �� ������ �������� E ����� 0����� �������+ C�����#��� �� 0����� ��� *������#���
%������ �� 0����� ��������" �*FG; GF" !���'����" ������ � ������� 6������� ,��� ��� ��������� ,������� ���������" �H���
�*FG; @F" !���'����" ������
Abstract
This article sets out the results of two studies which, from the outset, were conceived to interact in order to produce the most reliable result possible. An interview study was conducted ahead of the questionnaire study because very few previous studies had attempted to explain why the proportion of 18- and 19-year-olds taking their driving test had fallen so dramatically during the 1990s in Sweden. The underlying reasons for the decision by young people whether or not to take their driving test are very complex, since the two studies revealed that there are many different factors which influence young people in their decision whether or not to obtain a driving licence. Perceived financial situation is the dominant factor with regard to the number of driving licences that will be held among young people in Sweden. The amount of time left over from schoolwork and leisure time activities is also highly significant. The norm among parents and friends in relation to a driving licence also has an influence on the numbers taking their driving test. The same situation also applies to how the car is regarded as a means of transport and to what a driving licence is considered to signify other than the right to drive a car. If the car is seen to increase independence, and if the driving licence is seen to confer status or to be a step towards the adult world, the effect will be to generate more driving licence holders. The opportunity to travel by public transport also has an influence on the numbers taking their driving test. The better the opportunity to travel without having to use a car, the fewer the driving licences.
)�������5 - Driving license; Learner drivers; Driver training; Iinterview; Grounded Theory
*Corresponding author. Tel.: +46 13 204093; fax +46 13 141436�3�e-mail: [email protected]
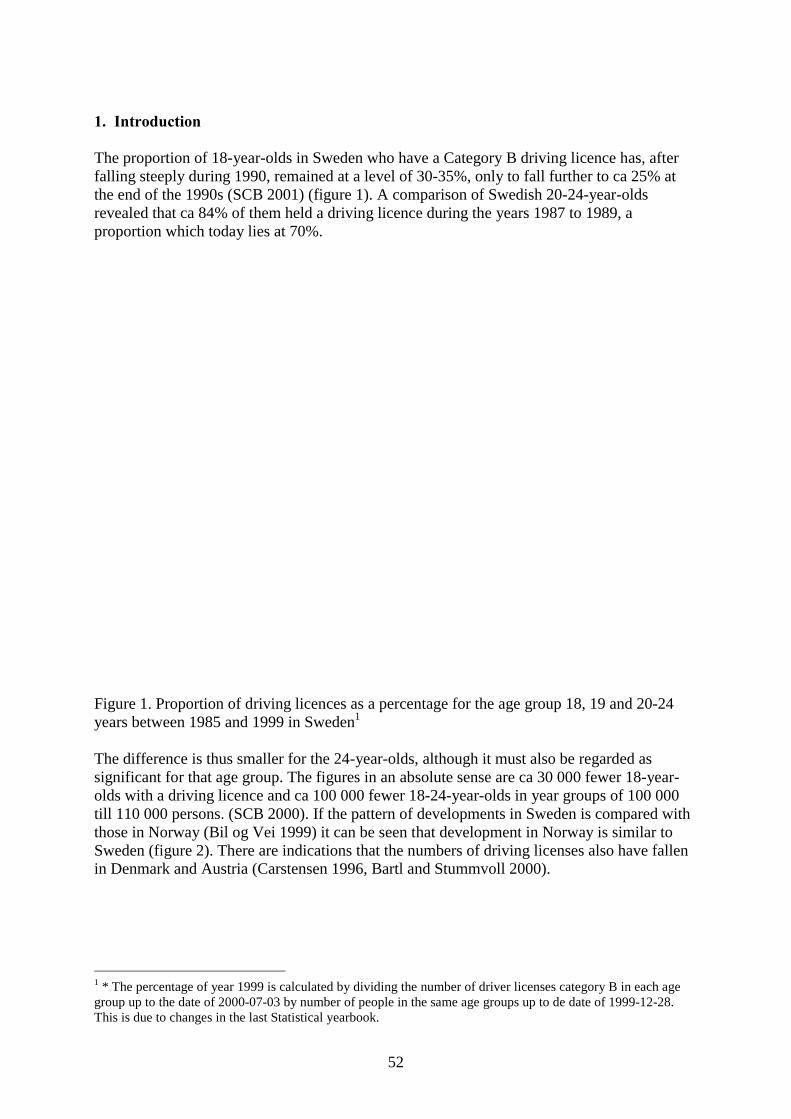
52
+,�������������� The proportion of 18-year-olds in Sweden who have a Category B driving licence has, after falling steeply during 1990, remained at a level of 30-35%, only to fall further to ca 25% at the end of the 1990s (SCB 2001) (figure 1). A comparison of Swedish 20-24-year-olds revealed that ca 84% of them held a driving licence during the years 1987 to 1989, a proportion which today lies at 70%.
Figure 1. Proportion of driving licences as a percentage for the age group 18, 19 and 20-24 years between 1985 and 1999 in Sweden1
The difference is thus smaller for the 24-year-olds, although it must also be regarded as significant for that age group. The figures in an absolute sense are ca 30 000 fewer 18-year-olds with a driving licence and ca 100 000 fewer 18-24-year-olds in year groups of 100 000 till 110 000 persons. (SCB 2000). If the pattern of developments in Sweden is compared with those in Norway (Bil og Vei 1999) it can be seen that development in Norway is similar to Sweden (figure 2). There are indications that the numbers of driving licenses also have fallen in Denmark and Austria (Carstensen 1996, Bartl and Stummvoll 2000).
1 * The percentage of year 1999 is calculated by dividing the number of driver licenses category B in each age group up to the date of 2000-07-03 by number of people in the same age groups up to de date of 1999-12-28. This is due to changes in the last Statistical yearbook.
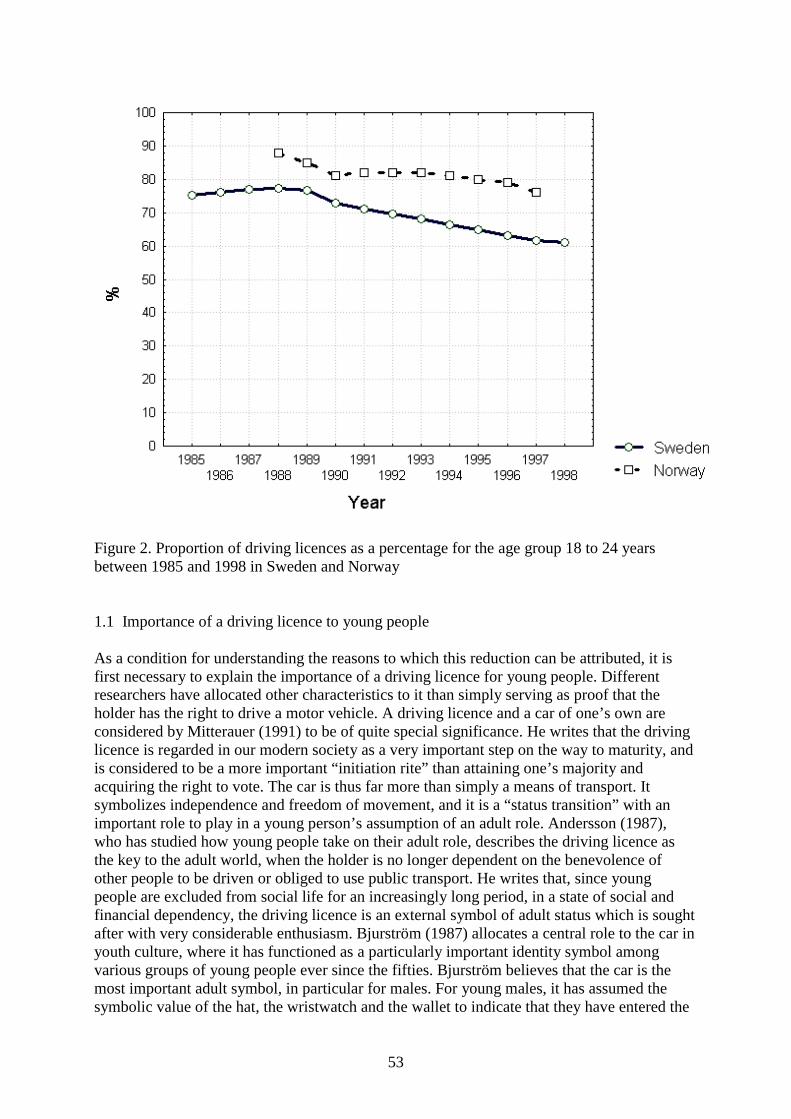
53
Figure 2. Proportion of driving licences as a percentage for the age group 18 to 24 years between 1985 and 1998 in Sweden and Norway
1.1 Importance of a driving licence to young people As a condition for understanding the reasons to which this reduction can be attributed, it is first necessary to explain the importance of a driving licence for young people. Different researchers have allocated other characteristics to it than simply serving as proof that the holder has the right to drive a motor vehicle. A driving licence and a car of one’s own are considered by Mitterauer (1991) to be of quite special significance. He writes that the driving licence is regarded in our modern society as a very important step on the way to maturity, and is considered to be a more important “initiation rite” than attaining one’s majority and acquiring the right to vote. The car is thus far more than simply a means of transport. It symbolizes independence and freedom of movement, and it is a “status transition” with an important role to play in a young person’s assumption of an adult role. Andersson (1987), who has studied how young people take on their adult role, describes the driving licence as the key to the adult world, when the holder is no longer dependent on the benevolence of other people to be driven or obliged to use public transport. He writes that, since young people are excluded from social life for an increasingly long period, in a state of social and financial dependency, the driving licence is an external symbol of adult status which is sought after with very considerable enthusiasm. Bjurström (1987) allocates a central role to the car in youth culture, where it has functioned as a particularly important identity symbol among various groups of young people ever since the fifties. Bjurström believes that the car is the most important adult symbol, in particular for males. For young males, it has assumed the symbolic value of the hat, the wristwatch and the wallet to indicate that they have entered the
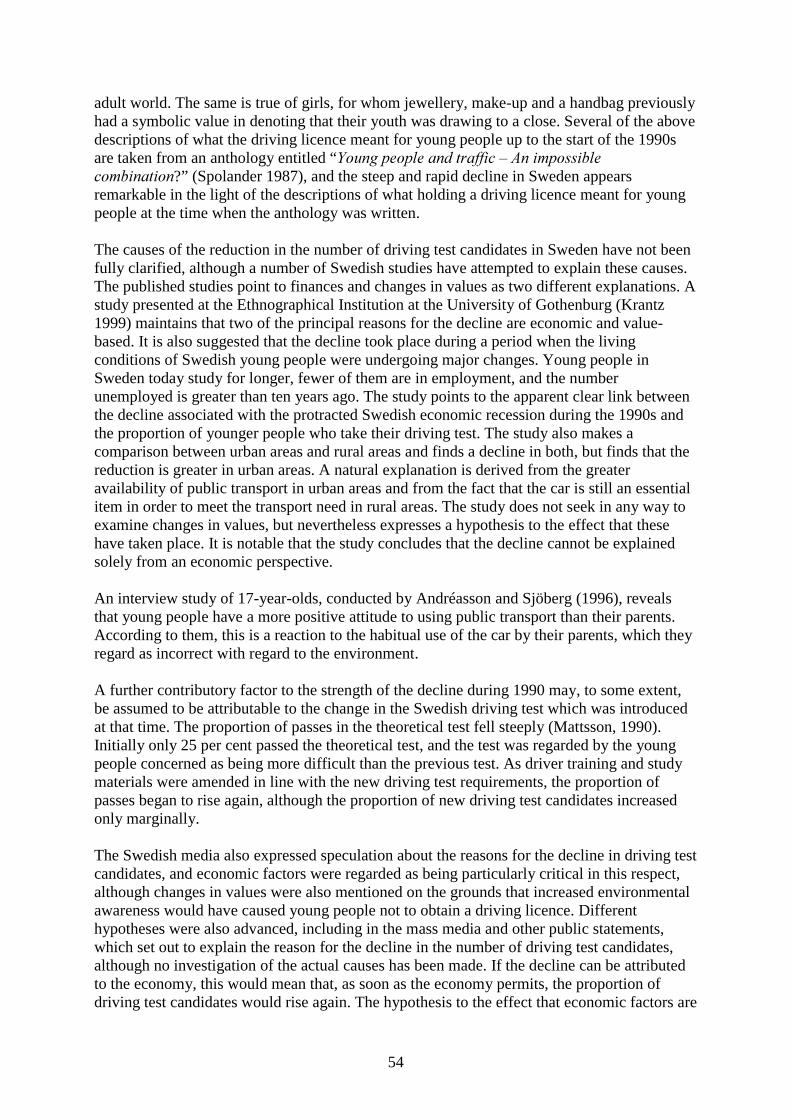
54
adult world. The same is true of girls, for whom jewellery, make-up and a handbag previously had a symbolic value in denoting that their youth was drawing to a close. Several of the above descriptions of what the driving licence meant for young people up to the start of the 1990s are taken from an anthology entitled “8���� ������ ��� ������� = �� �#������� ��#�������?” (Spolander 1987), and the steep and rapid decline in Sweden appears remarkable in the light of the descriptions of what holding a driving licence meant for young people at the time when the anthology was written. The causes of the reduction in the number of driving test candidates in Sweden have not been fully clarified, although a number of Swedish studies have attempted to explain these causes. The published studies point to finances and changes in values as two different explanations. A study presented at the Ethnographical Institution at the University of Gothenburg (Krantz 1999) maintains that two of the principal reasons for the decline are economic and value-based. It is also suggested that the decline took place during a period when the living conditions of Swedish young people were undergoing major changes. Young people in Sweden today study for longer, fewer of them are in employment, and the number unemployed is greater than ten years ago. The study points to the apparent clear link between the decline associated with the protracted Swedish economic recession during the 1990s and the proportion of younger people who take their driving test. The study also makes a comparison between urban areas and rural areas and finds a decline in both, but finds that the reduction is greater in urban areas. A natural explanation is derived from the greater availability of public transport in urban areas and from the fact that the car is still an essential item in order to meet the transport need in rural areas. The study does not seek in any way to examine changes in values, but nevertheless expresses a hypothesis to the effect that these have taken place. It is notable that the study concludes that the decline cannot be explained solely from an economic perspective. An interview study of 17-year-olds, conducted by Andréasson and Sjöberg (1996), reveals that young people have a more positive attitude to using public transport than their parents. According to them, this is a reaction to the habitual use of the car by their parents, which they regard as incorrect with regard to the environment. A further contributory factor to the strength of the decline during 1990 may, to some extent, be assumed to be attributable to the change in the Swedish driving test which was introduced at that time. The proportion of passes in the theoretical test fell steeply (Mattsson, 1990). Initially only 25 per cent passed the theoretical test, and the test was regarded by the young people concerned as being more difficult than the previous test. As driver training and study materials were amended in line with the new driving test requirements, the proportion of passes began to rise again, although the proportion of new driving test candidates increased only marginally. The Swedish media also expressed speculation about the reasons for the decline in driving test candidates, and economic factors were regarded as being particularly critical in this respect, although changes in values were also mentioned on the grounds that increased environmental awareness would have caused young people not to obtain a driving licence. Different hypotheses were also advanced, including in the mass media and other public statements, which set out to explain the reason for the decline in the number of driving test candidates, although no investigation of the actual causes has been made. If the decline can be attributed to the economy, this would mean that, as soon as the economy permits, the proportion of driving test candidates would rise again. The hypothesis to the effect that economic factors are

55
of critical significance is regarded as slightly exaggerated, since no increase in the number of driving test candidates could be discerned in spite of the rise in household purchasing power in recent years. Increased environmental awareness has also been included in the debate, although this has not been investigated in the actual population. It can be established from the different studies conducted in the area that the relationships are thought to be very complex and both structural and individual in nature. There is no simple reason at the present time to explain why so few of today’s young people obtain a driving licence compared with the situation some 15-20 years ago. /,���.� The aim of this study is to attempt to clarify the factors which influence the decision by young people whether or not to obtain a driving licence. With increased knowledge of this subject, we should also be in a better position to predict future changes than we are today. 2,��0�����������.���������Since it was discovered early in the planning stage of the study that only a few other studies have attempted to identify the reasons for the decline in the number of Swedish young people taking their driving test, it was decided that the study should adopt an explorative initial approach and then apply qualitative methodology to build up a decision model to describe why a group of young people chose, or did not choose, to obtain a driving licence. This model would then be used to construct a questionnaire, which would be sent to a representative selection of 2000 18.5-year-olds and subsequently processed with the help of statistical methodology. The study is accordingly structured in two parts, an interview study and a questionnaire study. The two part-studies are presented below.� 3.1 Interview study The collection of data for the interview study was carried out with the help of focus groups, which are a form of group interview in which 6-12 persons from the population concerned discuss a set topic with reference to their own experiences and views (Stewart and Shamdazani 1990). Each interview took approximately one hour to complete, and a total of 44 young people participated, of whom 16 represented urban areas and 28 rural areas. The young people were also split evenly between theoretical and vocational upper secondary school courses. The ages of the young people ranged from 17 to 19 years, and all were third-year students at upper secondary school. The distribution between males and females was balanced. The intention of the questions presented to the focus groups was to cover as many factors as possible which might influence an individual in his or her decision whether or not to obtain a driving licence. The questions were concerned with the reasons for taking a driving test or not and the significance of the driving licence, both in its practical form and in its symbolic value. The following are examples of such questions: “Why do people take a driving test?” or “Is there any status value in holding a driving licence?” The questions also covered different ideological reasons, for example consideration for the environment, the attitude of friends
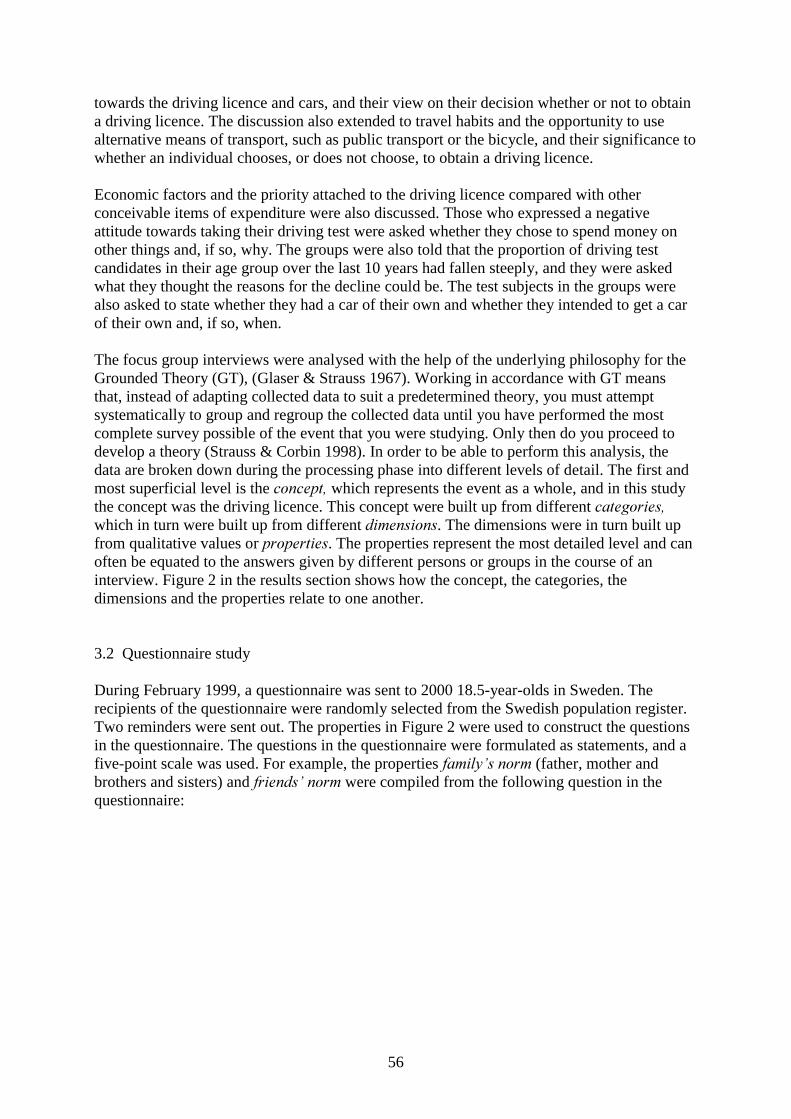
56
towards the driving licence and cars, and their view on their decision whether or not to obtain a driving licence. The discussion also extended to travel habits and the opportunity to use alternative means of transport, such as public transport or the bicycle, and their significance to whether an individual chooses, or does not choose, to obtain a driving licence. Economic factors and the priority attached to the driving licence compared with other conceivable items of expenditure were also discussed. Those who expressed a negative attitude towards taking their driving test were asked whether they chose to spend money on other things and, if so, why. The groups were also told that the proportion of driving test candidates in their age group over the last 10 years had fallen steeply, and they were asked what they thought the reasons for the decline could be. The test subjects in the groups were also asked to state whether they had a car of their own and whether they intended to get a car of their own and, if so, when. The focus group interviews were analysed with the help of the underlying philosophy for the Grounded Theory (GT), (Glaser & Strauss 1967). Working in accordance with GT means that, instead of adapting collected data to suit a predetermined theory, you must attempt systematically to group and regroup the collected data until you have performed the most complete survey possible of the event that you were studying. Only then do you proceed to develop a theory (Strauss & Corbin 1998). In order to be able to perform this analysis, the data are broken down during the processing phase into different levels of detail. The first and most superficial level is the �������" which represents the event as a whole, and in this study the concept was the driving licence. This concept were built up from different ����������" which in turn were built up from different ��#�������. The dimensions were in turn built up from qualitative values or ����������. The properties represent the most detailed level and can often be equated to the answers given by different persons or groups in the course of an interview. Figure 2 in the results section shows how the concept, the categories, the dimensions and the properties relate to one another. 3.2 Questionnaire study During February 1999, a questionnaire was sent to 2000 18.5-year-olds in Sweden. The recipients of the questionnaire were randomly selected from the Swedish population register. Two reminders were sent out. The properties in Figure 2 were used to construct the questions in the questionnaire. The questions in the questionnaire were formulated as statements, and a five-point scale was used. For example, the properties ��#���I� ���# (father, mother and brothers and sisters) and �������I ���# were compiled from the following question in the questionnaire:
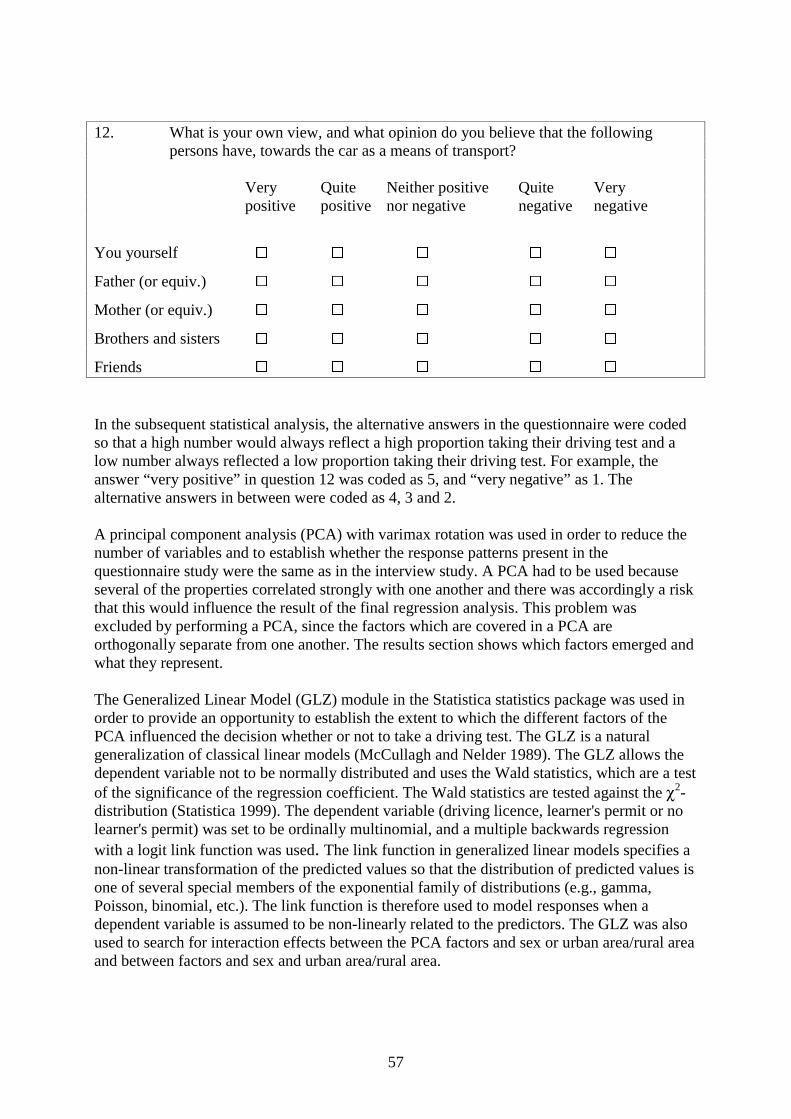
57
12. What is your own view, and what opinion do you believe that the following persons have, towards the car as a means of transport?
Very Quite Neither positive Quite Very positive positive nor negative negative negative
You yourself � � Father (or equiv.) � � �
Mother (or equiv.) � � � Brothers and sisters � � � � Friends � � � In the subsequent statistical analysis, the alternative answers in the questionnaire were coded so that a high number would always reflect a high proportion taking their driving test and a low number always reflected a low proportion taking their driving test. For example, the answer “very positive” in question 12 was coded as 5, and “very negative” as 1. The alternative answers in between were coded as 4, 3 and 2. A principal component analysis (PCA) with varimax rotation was used in order to reduce the number of variables and to establish whether the response patterns present in the questionnaire study were the same as in the interview study. A PCA had to be used because several of the properties correlated strongly with one another and there was accordingly a risk that this would influence the result of the final regression analysis. This problem was excluded by performing a PCA, since the factors which are covered in a PCA are orthogonally separate from one another. The results section shows which factors emerged and what they represent. The Generalized Linear Model (GLZ) module in the Statistica statistics package was used in order to provide an opportunity to establish the extent to which the different factors of the PCA influenced the decision whether or not to take a driving test. The GLZ is a natural generalization of classical linear models (McCullagh and Nelder 1989). The GLZ allows the dependent variable not to be normally distributed and uses the Wald statistics, which are a test of the significance of the regression coefficient. The Wald statistics are tested against the χ2-distribution (Statistica 1999). The dependent variable (driving licence, learner's permit or no learner's permit) was set to be ordinally multinomial, and a multiple backwards regression with a logit link function was used. The link function in generalized linear models specifies a non-linear transformation of the predicted values so that the distribution of predicted values is one of several special members of the exponential family of distributions (e.g., gamma, Poisson, binomial, etc.). The link function is therefore used to model responses when a dependent variable is assumed to be non-linearly related to the predictors. The GLZ was also used to search for interaction effects between the PCA factors and sex or urban area/rural area and between factors and sex and urban area/rural area.
58
;,���������� 4.1 Interview study An analysis of the interviews according to GT resulted in the construction of a decision model (Figure 3). The aspects which are considered as part of the decision whether or not to take a driving test form the ������� of the model (driving licence). The ������� “driving licence” consists of three different ����������, “values”, “need” and “personal opportunities”. The �������� “values” is built up of three different ��#�������, “perceived norm”, “driving licence value” and “ideology”. H����� The ��#������ “perceived norm” describes how people perceive the attitude of the surrounding world to their decision whether or not to obtain a driving licence. “Perceived norm” consists of two ����������, “parents’ norm” and “friends’ norm”. “Parents’ norm” describes the attitude of the parents of the young people who were interviewed to the car as a means of transport and their parents’ attitude to the significance of the driving licence. The variation here is considerable, although the view reported by the interview respondents was that the majority of parents have a positive attitude to the car as a means of transport and believe that they must take their driving test. There are some exceptions which point to the opposite. The major reason why parents adopt an encouraging approach in this area is considered to be their belief that it would be a good thing if the young people were able to make their own way to and from their friends and/or sports training sessions. This is mainly true of young people who live in smaller localities. The following quotations illustrate the variations in the answers.
���� ����� ���� � ������ ���� #� ������� ���� �� ���� �� ������� �� ���� ���� ���� �� ������ ���� �� ����� #� ������ ��� ��� ��#�+ ���� ��� �� ����� �� ��+
�� #���� �� ���������� ��� #� ������� ������� � ���� #� ������� ����+ ��I� � ���� ����� �� �" ���" ���� ���� ����" �� ��� �� ��� ���� �� �� �� �� ��� �� ��� ���� ��+
“Friends’ norm” is the other �������� included in the ��#������ “perceived norm”. The �������� describes the attitude of friends to the significance of the driving licence and to the car as a means of transport. It emerged here that the majority of the interview respondents’ friends share the same attitude towards driving licences as the interviewees themselves. The perception varied from it being very important to have a driving licence to the driving licence not having any particular significance.
8�� ��� �� ������ 7���� �� ��������� �� ���� ��#���� ���5 J� ������ �� ��� ���� ���� ������ #� ������� ����K+
*������� �� �$������ �� ���� ����� ������� ����+ ����� �� ��#������ ��� �� ���� �� ���+
59
The ��#������ “driving licence value” consists of two ����������, “status/prestige” and “freedom/independence”. The �������� “status/prestige” denotes that the driving licence is regarded as an entry ticket into the adult world in the sense of having gained an identity. Some people also felt that the driving licence confers status and pride. Others did not share this perception at all, and considered that this was an outdated view of the driving licence.
� ����� �� #���� ��� #��� �����������" �� ����� �� �� ������+++ � ���I� ����� ��./�����#����� �� ��� ���� ���� ��� ��� �� �����+
The other ��������, “freedom/independence”, included in the ��#������ “value of the driving licence” means that young people do not feel bound to their parents in the sense that they no longer need constantly to feel dependent on them to be driven to and from their friends and sports training sessions, but are able to travel when they themselves wish to travel. The majority thus felt that the driving licence was associated with independence and/or freedom.
� �������� ������ ���� ��� ��� ��#���� #��� ����������� ��� #��� �����+ >��� �� ����+++ ����� ����+++ ����� �� ������#+
The ��#������ “ideology” consists only of the �������� “environment”. The interview answers revealed that some people regard driving as an environmental threat and feel that they do not wish to hold a driving licence for ideological reasons. They believed that they could meet their transport needs by using the bus and the train. Some of the interview respondents also considered that people should not travel alone in the car.
� ��� ������ ������� �� � ����� ��� ����� ������ ����� ����+ %��� ��� �� ���� ��� #��������� ������ ������� ����� �� �� H�����+
6��� The �������� “need” is made up of the ��#������� “travel habits”, “transport alternatives” and “interest”. The ��#������ “travel habits” in turn contains three ����������" which are “recreational journeys”, “journeys to and from school” and “journeys to and from work”. The �������� “recreational journeys” is made up of the travel needs which people feel that they have in their leisure time. Some young people claim to have a major need for mobility and therefore feel that it would be a good thing to have a driving licence. Others refer to a smaller need for mobility and for that reason do not have to give such high priority to a driving licence.
� ���� ���� �� ���� � ������� �������" ������ � �� ���� �� ����� ��� � ����� #��� ���� ����� ��� �� ��� ��#���#�� � ��������� �� ��� ������� ��� ������ ��� ����+
�� ����� ��� ������� �� ��� � ����� �������� ��� ������ � ��� �� ��� ���� �� �� �� ���� ��� #�������� �� �� �������� ����+++
“Journeys to and from school” is the second �������� in the ��#������ “travel habits”. “Journeys to and from school” were defined by the young people as journeys to and from

60
school and associated journeys. This �������� describes how young people travel to and from school. Those young people who had to make a long journey said that they were likely to obtain a driving licence to enable them to use a car for travelling to school. Young people who lived within cycling or walking distance, but who also had access to a car, said that they would continue to cycle or walk. Those young people who had access to good public transport said that they would continue to use that means of transport on both economic and practical grounds. � ���� ��� ����#����� ���# ��� �� ����" �� � ���� �� �� � ���+ � ���� ����� �" �� � ����� �� ����+ “Journeys to and from work” is the third �������� in the ��#������ “travel habits”. These were defined as journeys made in connection with some form of work. It emerged in the course of the interviews that a proportion of young people felt that they were obliged to have a driving licence in order to be certain of obtaining a training place. Journeys to and from work can also arise in connection with jobs performed during leisure time.
��� ���� ���� � ���� � ������� ������� #���� ���� � #������ �� ��� ��� �������� ����� ���� � ������+ � ��� ����� �� ���� #� ������� ���� �� 7������" �� � ���� ������� ����" ��� � ����� ��� ���� ��� ��� ����� ���������+
The ��#������ “transport alternatives” includes the ���������� “public transport” and “alternative means of transport”. The �������� “public transport” specifies the opportunities to travel by public transport such as bus and train, etc., which the young people said were available to them. A number of the young people said that they had good opportunities, and others said that they lacked opportunities to use public transport. Young people who lived in rural areas thus expressed a greater need for a driving licence.
��� ���� �� ��#� ������ �� ������ ���� ��$" ��� ����� ��� ���� ����� ����+ ����� ��� ��� ���� �� ��� �������" ��� ���� �� ��� ��������+ /�#������� �������L
��� �� ������� �� �� ���� ���� ��� ��� #����� #����� ������� � ������� �������+ � �� ��� ���� ��� ������ ���� ��� � ������� �������+ � ��� ����� �� ����� � ���� �� ��" �� � ������� ������� �� ��� �� �#������� ��� #�+
The �������� “alternative means of transport” specifies the choices available to young people for different types of transport alternatives. Young people who live in rural areas have few choices open to them, and they are very often driven to and from their friends and sports training sessions, whereas young people who live in larger cities find that travelling on the cities’ public transport services works well for them. 2�� ��� ����� ��� #� ������� ��� ��� ������ #� ������� ����+ The ��#������ “interest” consists of two ����������, “vehicle interest” and “motivation”. The �������� “vehicle interest” denotes that a proportion of young people obtain a driving licence
61
because they get pleasure from driving a car and/or working on vehicles. There are others who find driving a car boring or are not interested in cars. � ���� ������� ����+ � ����� ������� ���� �� ������ �����+ The �������� “motivation” specifies the level of general motivation for taking their driving test expressed by the young people. The majority of the interview respondents stated a clear wish to have a driving licence, but there were also those who said that they did not want a driving licence, as a result of which their motivation was low.
� ���� ���� �� ��� ��� ����� ���� �� #� ������� ������� #�����+ � ���� ��� � ��##�� &� ��� � ������ �� ����� �� ���� � ��� ���� #� ������� ����+ M9���� ��� ��� ������ �� ������ ���� ���� #����:N 6�" �����L � ���� �� ��� #� ������� ������� �� ����� �� ��� ���� ���� #� #�����" ���� ���# � ����" ���� ��� ���� � ���+
� ����� ������ �� �� ������ ���� � ���� �� ���� ��#�" ������ ���� ������� ���� ���� � ������� ������� �� #� ������+
�������� ������������� The �������� “personal opportunities” consists of four different ��#�������, “access”, “finances”, “time” and “perceived individual ability”. The ��#������ “access” consists of the �������� “instructor/car”, which means that there is variation in the opportunities available to the young people for private driving practice. Some of them said that they did not have a car in the household and, as a result, did not have the opportunity for private driving practice.
� ��������� ������� 7���� � ��� �����+ 2�� �� ���� ��� ���� ��� ���" �� �� �� #��� ��������� �� �������� #� �������+
�� #����� ���� ��� ���� �� ����" �� � ����� ���� #� ������ �������� �� ��� ��� ��#�+
The ��#������ “finances” has two ����������, “parents’ finances” and “individual finances”. The majority of the interview respondents said that they received financial help from their parents to the extent that this was possible, whereas others said that they paid for their driver training themselves. �� ������� ���� ��� ��� #� ������� ���� ���� � ���� ��+ � ���� ���� �� ��� ��� #� ������ �������� #�����+ The �������� “individual finances” means that, although they do not receive the money for their driving test from someone else, a proportion of young people had earned a sum of money which they had earmarked specifically for their driving test. There were also some young people who said that, even if they had had the financial opportunities, they would not use this money to obtain a driving licence.

62
����� ��� ����� ������ �� �� ���� ���� #����+ � ����� ������ �� ����� ������+
�� �� ��� ��� #����+ ��I� &��� ��� ���� � �� ����" � �����+
The ��#������ “time” consists of three ����������, “studies”, “other interests” and “work”. The �������� “studies” describes how much the young people feel that they need to concentrate on their studies. Many of the interview respondents said that they devoted a lot of time to their studies and, as a result, felt that they did not have the time to take a driving test. A number of the interview respondents who had completed the theoretical training expressed the view that they intended to complete their education first and only then, once they had completed their studies, could they consider obtaining a driving licence.
� �� ��� ���� ��� ��#� �� �����+ � �# �� ������ ��� ���" ��� ���� � ���� �� ����� ���� � ��� ��#�+ � &��� ����� ��� ����� �� ��+
����� �� �� #��� �� �� &��� ���" ��� � �� ��� ����� ���� � ���� ���� #� ������� ���� ����� � ���� �������� #� �������+ 2�� ���� � ���� �� �� ��� ��������� �������" ���� � ����� � ��#��� ��� �� ��+
The �������� “other interests” indicates that some young people did not feel that they had the time to obtain a driving licence, since they preferred to spend their leisure time meeting friends, doing sport or traveling.
� ����� ������ �� ����� ��� ��#� �� ����� ������" ���� �� ������� ��� ����� ��� �� ��+
8�� ���� �� ���� #��� �������� �� ������� �$��������� ���� �� �������� � ������� �������+ 8�� ��� ������ �� �� �����+
�� � ��� ��� #����" � ����� ����� ��� ���� #� ������� ����+ � ����� ������+ 8�� ������ ���� ������� ���� ���# ��� ��� ������+ �� ���" ��� ��� ������ ���� ��� ��+ �� �� ���� �� #��� ���� ���� ��������+
The �������� “work” is the third and final �������� in the ��#������ “time”. Since not everyone receives an upper secondary school education, there is an assumption that some people start work instead, and their occupation takes up so much time that they do not have the opportunity to take a driving test. This property did not emerge directly in the course of the interviews, but it could still be discerned behind certain answers; that is why a property with this name is included in Figure 3. The ��#������ “perceived individual ability” consists of the ���������� “self-confidence” and “previous test result”. The �������� “self-confidence” emerged during the interviews when a number of respondents felt that they could not manage the theoretical driving test and for that reason had abandoned the idea of obtaining a driving licence.
�� ���#� �� � �� ��������� �� ���+ MC� ��� #��� ���� ��� ������ ���� �� ��� ������� ���� ���#� �� � ��������� :N ��� ������ ����+++ �� ���#� ��+++ �� ��������� �� ��#� ���+++ *������� ���� ����+
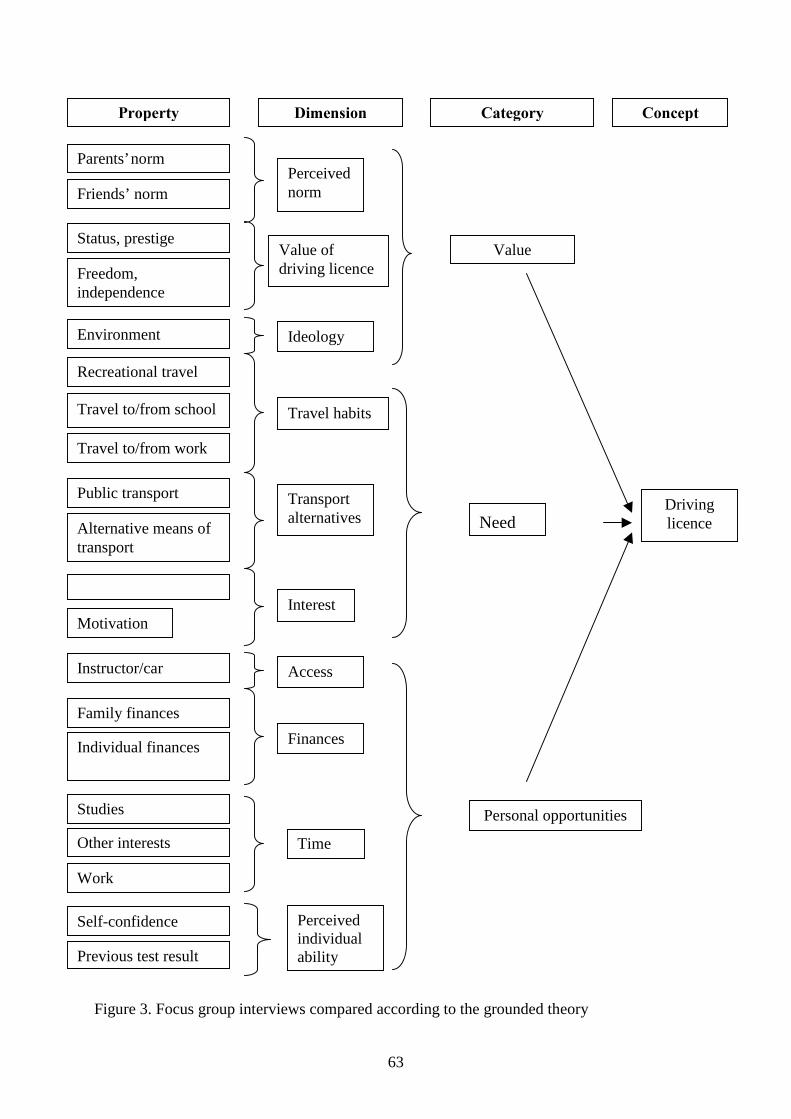
63
�
Figure 3. Focus group interviews compared according to the grounded theory
!�������� �.������ $�������
Instructor/car
Family finances
Individual finances
Studies
Work
Access�
Perceived individual ability
Finances
Personal opportunities
Other interests
Self-confidence
Time
Previous test result
$�������
Parents’ norm
Friends’ norm
Status, prestige
Freedom, independence
Environment
Perceived norm
Value of driving licence
Ideology
Value
Recreational travel
Travel to/from school
Travel to/from work
Public transport
Alternative means of transport
Motivation Interest
Transport alternatives
Travel habits�
Need Driving licence
64
The property “previous test result” was included subsequently, because a situation emerged during the interviews in which pupils who doubted their ability to cope with the theoretical driving test also perceived themselves as being low-performers in theoretical tests in school. A teacher also commented that many of the pupils were tired of school and for that reason were not so successful in their studies. However, none of the interview respondents admitted directly that previous test results had influenced them in their actions. ����� As a result of the interview study, a model was constructed to show what can influence young people in their choice whether or not to obtain a driving licence (Figure 3). The model must also be seen as one of the main results of the interview study. 4.2 Questionnaire study Of the 2000 questionnaires, 1408 or 70.4% were answered (53% by females and 47% by males), 37% of those who answered the questionnaire had a driving licence, 38% had a l learner's permit, 24% did not have a learner's permit, and 1% were unable to obtain a learner's permit. 29% lived in the countryside, and 67% lived in a detached house/terraced house. The majority (67%) lived at home with both parents and with any brothers and sisters. Of those who mentioned the driving licence situation of their parents and brothers and sisters, 96% of the fathers had a driving licence, 90% of the mothers and 70% of the brothers and sisters. 89% stated that their occupation over the coming six months would involve education, 3% said that they were looking for work, 55% were studying on an upper secondary school course with a theoretical approach, and 64% said that they would probably or definitely continue to study after leaving upper secondary school. After the principal component analysis, 10 factors were selected for use in the GLZ. These 10 factors together account for 60% of the total variation. The 10 factors are set out in Table 1. The regression analysis includes the 10 factors in Table 1, sex and urban/rural residence. The dependent variables used were: ����� � ������� �������, ����� � �������O� ���#��" ��� ���� ��� ���� � �������O� ���#��. The ���������� “journeys to and from work” and “work” were not included in the PCA, as only a small proportion of the 18.5-year-olds had a job or made journeys to and from work. The result of the regression analysis is presented in Table 2 below. Only significant findings are reported, as the table would otherwise become far too detailed.
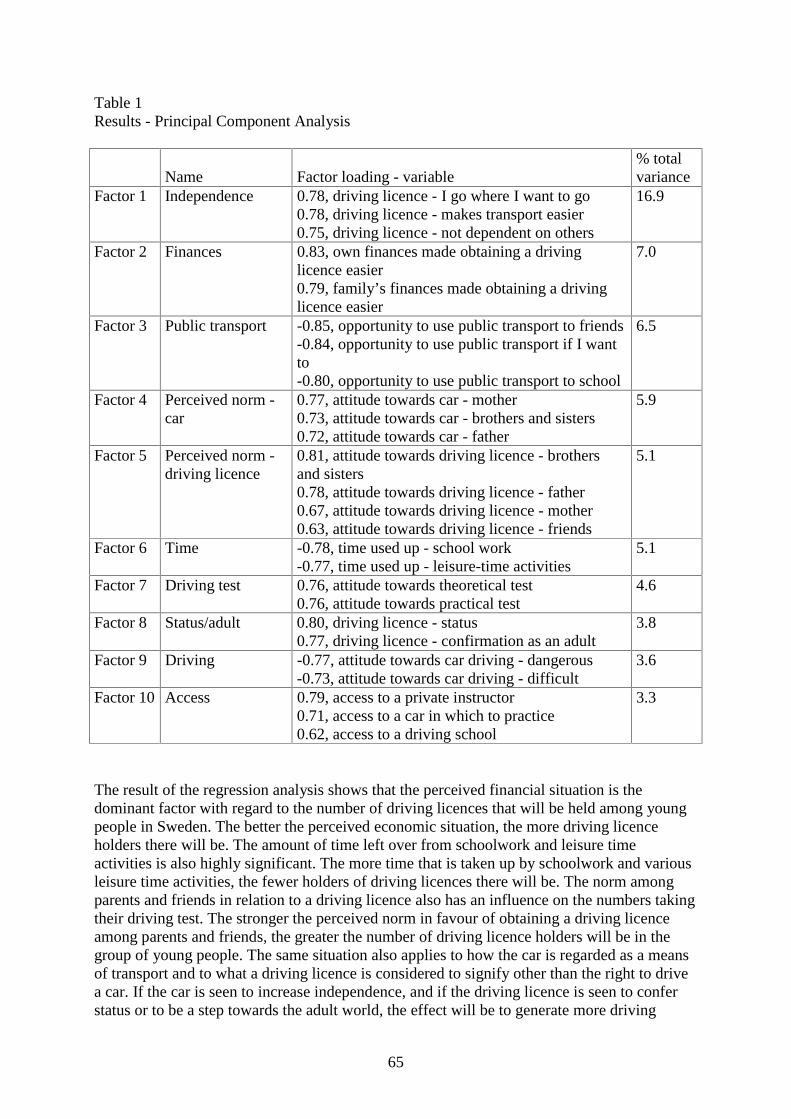
65
Table 1 Results - Principal Component Analysis
Name Factor loading - variable
% total variance
Factor 1 Independence 0.78, driving licence - I go where I want to go 0.78, driving licence - makes transport easier 0.75, driving licence - not dependent on others
16.9
Factor 2 Finances 0.83, own finances made obtaining a driving licence easier 0.79, family’s finances made obtaining a driving licence easier
7.0
Factor 3 Public transport -0.85, opportunity to use public transport to friends -0.84, opportunity to use public transport if I want to -0.80, opportunity to use public transport to school
6.5
Factor 4 Perceived norm - car
0.77, attitude towards car - mother 0.73, attitude towards car - brothers and sisters 0.72, attitude towards car - father
5.9
Factor 5 Perceived norm - driving licence
0.81, attitude towards driving licence - brothers and sisters 0.78, attitude towards driving licence - father 0.67, attitude towards driving licence - mother 0.63, attitude towards driving licence - friends
5.1
Factor 6 Time -0.78, time used up - school work -0.77, time used up - leisure-time activities
5.1
Factor 7 Driving test 0.76, attitude towards theoretical test 0.76, attitude towards practical test
4.6
Factor 8 Status/adult 0.80, driving licence - status 0.77, driving licence - confirmation as an adult
3.8
Factor 9 Driving -0.77, attitude towards car driving - dangerous -0.73, attitude towards car driving - difficult
3.6
Factor 10 Access 0.79, access to a private instructor 0.71, access to a car in which to practice 0.62, access to a driving school
3.3
The result of the regression analysis shows that the perceived financial situation is the dominant factor with regard to the number of driving licences that will be held among young people in Sweden. The better the perceived economic situation, the more driving licence holders there will be. The amount of time left over from schoolwork and leisure time activities is also highly significant. The more time that is taken up by schoolwork and various leisure time activities, the fewer holders of driving licences there will be. The norm among parents and friends in relation to a driving licence also has an influence on the numbers taking their driving test. The stronger the perceived norm in favour of obtaining a driving licence among parents and friends, the greater the number of driving licence holders will be in the group of young people. The same situation also applies to how the car is regarded as a means of transport and to what a driving licence is considered to signify other than the right to drive a car. If the car is seen to increase independence, and if the driving licence is seen to confer status or to be a step towards the adult world, the effect will be to generate more driving
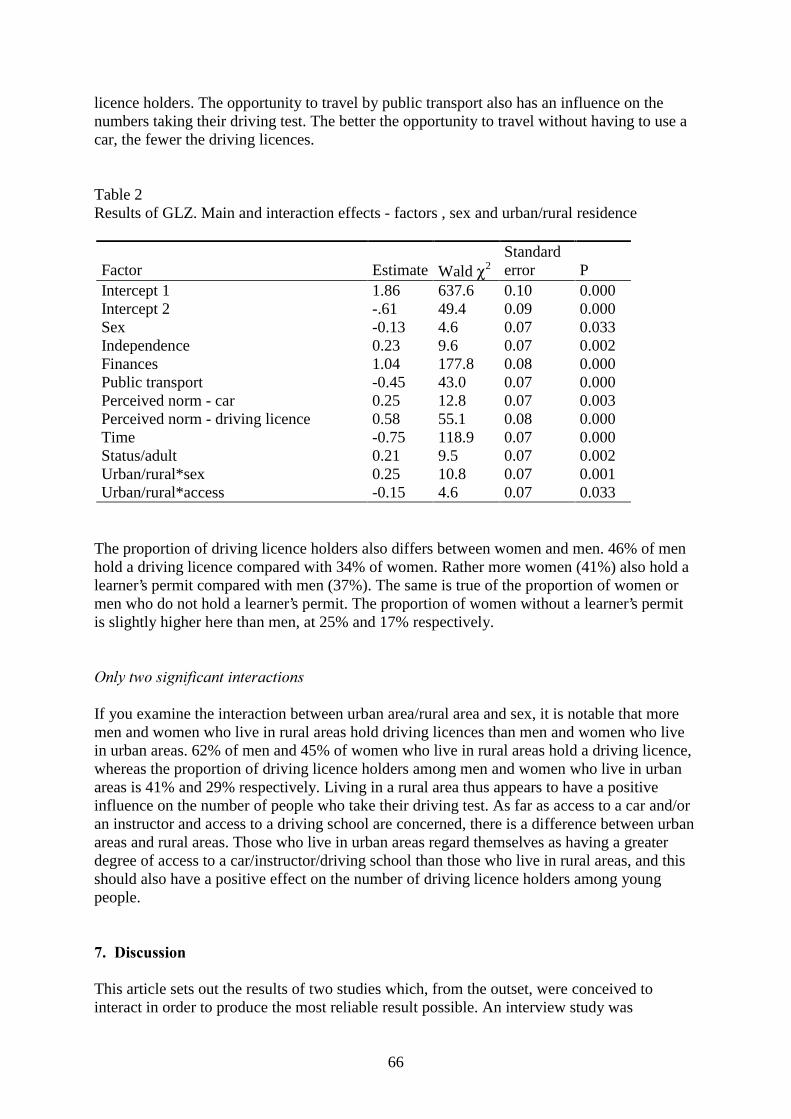
66
licence holders. The opportunity to travel by public transport also has an influence on the numbers taking their driving test. The better the opportunity to travel without having to use a car, the fewer the driving licences. Table 2 Results of GLZ. Main and interaction effects - factors , sex and urban/rural residence Factor �
Estimate�
Wald χ2
Standard error
P
Intercept 1 Intercept 2 Sex Independence Finances Public transport Perceived norm - car Perceived norm - driving licence Time Status/adult Urban/rural*sex Urban/rural*access
1.86 -.61 -0.13 0.23 1.04 -0.45 0.25 0.58 -0.75 0.21 0.25 -0.15
637.6 49.4 4.6 9.6 177.8 43.0 12.8 55.1 118.9 9.5 10.8 4.6
0.10 0.09 0.07 0.07 0.08 0.07 0.07 0.08 0.07 0.07 0.07 0.07
0.000 0.000 0.033 0.002 0.000 0.000 0.003 0.000 0.000 0.002 0.001 0.033
The proportion of driving licence holders also differs between women and men. 46% of men hold a driving licence compared with 34% of women. Rather more women (41%) also hold a learner’s permit compared with men (37%). The same is true of the proportion of women or men who do not hold a learner’s permit. The proportion of women without a learner’s permit is slightly higher here than men, at 25% and 17% respectively. ��� ��� ����������� ������������ If you examine the interaction between urban area/rural area and sex, it is notable that more men and women who live in rural areas hold driving licences than men and women who live in urban areas. 62% of men and 45% of women who live in rural areas hold a driving licence, whereas the proportion of driving licence holders among men and women who live in urban areas is 41% and 29% respectively. Living in a rural area thus appears to have a positive influence on the number of people who take their driving test. As far as access to a car and/or an instructor and access to a driving school are concerned, there is a difference between urban areas and rural areas. Those who live in urban areas regard themselves as having a greater degree of access to a car/instructor/driving school than those who live in rural areas, and this should also have a positive effect on the number of driving licence holders among young people. ?,���������� This article sets out the results of two studies which, from the outset, were conceived to interact in order to produce the most reliable result possible. An interview study was
67
conducted ahead of the questionnaire study because very few previous studies had attempted to explain why the proportion of 18- and 19-year-olds taking their driving test had fallen so dramatically during the 1990s. There were thus two objectives for establishing initial contact with the target group and obtaining their direct views in respect of why they had chosen, or had not chosen, to obtain a driving licence. One objective was to generate new knowledge, and it was envisaged that the result would lead to an explanatory model. The other objective was, with the help of the results of the interview study, to produce the basis on which to construct a questionnaire with the highest possible validity. These two objectives were achieved, since the interview study not only gave new information about why the numbers taking their driving test in Sweden had fallen, but also contributed to the development of a model which was of very great help when the questionnaire and its questions were being formulated. The findings of the interview and questionnaire study indicate a similar result. This is encouraging, as it demonstrates the benefit of embarking on a study based on qualitative methodology in which, as in this study, our knowledge of the problem area is low, and of then proceeding with the help of quantitative methodology. It is also possible to establish, on the basis of the result of the two studies in this article, that the underlying reasons for the decision by young people whether or not to take their driving test are very complex, since the two studies revealed that there are many different factors which influence young people in their decision whether or not to obtain a driving licence. An examination of the three levels in Figure 3 together with the result of the questionnaire study reveals a pattern which clearly explains why taking their driving test has reduced among 18-year-olds in Sweden. Financial resources, time, and accepted attitudes to the driving licence and public transport are the variables which have the greatest influence on the decision whether or not to take the driving test. This agrees closely with the pattern of developments for young people in Sweden during the 1990s. The majority today attend upper secondary schooling until they are 18 years old. Many of them then continue to study at university or college and are obliged to move to the larger cities. These cities very often have a well-developed public transport system, and the young people thus do not need a driving licence for their transport. Furthermore, students, regardless of whether they are studying in their final year at upper secondary school or in their first year at university/college, have low incomes which are needed for things other than a driving licence. Sweden also experienced an economic recession during the 1990s, which meant that unemployment rose and that the economic situation of families was weakened. The overall effect of this was to make it more difficult for young people to obtain a driving licence. The changes in values which were proposed in the previous research as an explanation for this decline attract a certain degree of support in the results of this study. It shows that young people today give priority to devoting time to their studies rather than driver training, for example. It emerged in the course of the interview study that young people think that it is expensive to take their driving test, and for many of them this is the reason why they do not take their driving test, although it also emerged that, even if they had the financial resources to take their driving test, many of them would still set entirely different priorities and would allocate their money to other things, such as entertainment, travel, clothes and various other activities. The norm of obtaining a driving licence quickly has thus changed over the last 15 years. All those who participated in the interview study said that they will eventually obtain a driving licence, although they do not know precisely when this will be.

68
In view of the significance attributed by the research to the driving licence and the car until the 90s, it can be assumed from the results of this study that changes in values have occurred. The status of the driving licence among young people appears to have declined, and it is also no longer retarded as the only entrance ticket to the adult world. This may be a reasonable assumption, as an increasing number of young people opt to study for a longer period (in this study, more than 60 % stated that they intend to continue with their studies after finishing upper secondary school). Accordingly, they feel that they have neither the time, the resources nor the need for a driving licence. This aspect was also mentioned during the interviews, where it emerged that the driving licence will have to wait until they have completed their studies and are thinking about getting a job. This cannot be said to apply to all young people, however, since the driving licence was still regarded as important by some of the interviewed young people. One argument which should also be advanced in conjunction with the result of the study is the nature of the distribution between mobility and safety. We are already aware that, the younger the group of newly qualified drivers, the greater is the risk of accidents for the group (see, for example, Maycock 1991). Another side of this argument is that the study shows that it is easier for many young people to extend their horizons with a driving licence. They can go on holiday in a car, they can reach their leisure interests more conveniently, and they can travel to and from their friends more easily, which means that they can get a lot of enjoyment from a driving licence. It is also an advantage for some to have a driving licence when they want to find a job. If it is wished to reduce the number of accidents among young drivers in a simple way, any measures that are adopted should not make it easier for them to obtain a driving licence. If, on the other hand, it is wished to increase the mobility of young people and, in so doing, to ensure the benefit that they can derive from a driving licence, the opposite approach should be taken, i.e. adopt measures which make it easier for them to obtain a driving licence. The objective of this study is not to produce an answer to indicate which of these approaches is correct, and the sole objective of the study is to attempt to explain what influences the decision by 18.5-year-olds whether or not to take their driving test. Acknowledgments Thanks to P-O Grummas Granström at the National Swedish Road Administration which contributed economic resources to this study, and to the KFB, which also financed the study. Thanks also to Mats Wiklund, VTI, for valuable statistical help. ������������ Andersson, B-E. (1987). Körkortet - Ett led i frigörelsen+ ���� ������O� ������� ���� �� ����������. �� )+ ��������� �*�+�" -����# ��� ������ = �� �#'&��� ��#�������: �8���� ������ ��� ������� �� �#������� ��#��������. (In Swedish). Kista: NTF. Andréasson, H., Sjöberg, A. (1996). -����#��� ��� �. ��������������� ��� ��+ �8����P� ���� �� ����� ���������� ��� �����+ (In Swedish) Göteborg. Trafikkontoret. Bartl, G., Stummvoll G. (2000). Description of post licensing measures in Austria. �� > 2���� �*�+�" C�6,�����+ ,������ �� *-���&���5 C���������� ��� �������� �� ���� !�������� �������� ��� 6����� C������+ Vienna, Austrian Road Safety Board.
69
Bjurström, E. (1987). Bilen och motorcykeln i �����#��������� ���� ��� ��� ��� #��������� �� ��� ������� �� ������� ��� ��������+ In K. Spolander (Ed.), Ungdom och trafik – en omöjlig kombination? �8���� ������ ��� ������� �� �#������� ��#��������. (In Swedish). Kista: NTF. Carstenssen, G. (1996). )'������������ ��� �������� = ������ �. �����������������+ �C����� �������� = ������ �� �������� �������#����+ (In Danish) Rapport 2/1996. Köpenhamn. Rådet för Trafiksikerhedsforskning. Opplysningsrådet for veitrafikken. (1989-1999). 2�! > H*�" ���������� ;@@@. �/�� ��� ��� ,���" ���������� ;@@@� (In Norwegian). Oslo. Glaser, B. G. Strauss, A. L. (1967). ��� ��������� �� �������� ������5 ���������� ��� 7���������� ��������+ New York: Aldine Publishing Company. Krantz, L-G.(1999). ,'���������� #.������ ��� �'�(������+ �C�������� ��� ������ �� #������+ ������I� ����� ������ �� ������ ;@AG ��� ;@@<�+ (In Swedish)+ Kulturgeografiska institutionen. Handelshögskolan vid Göteborgs universitet. Mattson, H. (1990). 6��� ��������� ;@@Q" ���������� ��������� �� �'������������" �.��� ;@@Q+ �� ��� ����������� ������ ����" ����������� ����������" ������ ;@@Q�+ (In swedish). Umeå. Pedagogiska institutionen. Umeå universitet. Maycock, G., Lockwood, C-R., & Lester, J-F. (1991�+ ��� �������� �������� �� ��� �������+ (TRL Research Report 315). Crowthorne: Transport Research Laboratory. McCullagh, P., Nelder, J.A. (1989). >�������3�� ������ #�����. London. Chapman and Hall. Mitterauer, M. (1991). -����#������� ������� ��������+ ���� ������ ������� �� ������ (In Swedish). Göteborg: Röda Bokförlaget. Spolander, K. (Red) (1987). Ungdom och trafik – en omöjlig kombination? (8���� ������ ��� ������� = �� �#������� ��#�������:) (In swedish) Kista. NTF. Statistiska Centralbyrån (1985 – 2001). ���������� .���� IGF IQQ. (Statistical yearbook 85 - 01) (In swedish) Stockholm. Statistiska Centralbyrån. Stewart, D. W. & Shamdasani, P. N. (1990). %���� ������" ������ ��� ��������. New Bury Park: Sage Publications. Applied Social Research Methods Series Volume 20. Statistica. (2000). Electronic manual at http://www.statsoft.com/textbook/stglz.html, 2000-03-25. Strauss, A. Corbin, J. (1998�+ 2����� �� R���������� ,�������+ ������7��� ��� ���������� ��� C��������� >������� ������. London. SAGE.

70

71
!��������
'��������������������������������7���)�����-�����.������������������������������������������������������.�����������+:�
��

72

73

74

75

76

77

78

79

80

81

82

83

84

85

86
87
!����������
��������������������������������������������)�����7�����<������������������������������������������

88
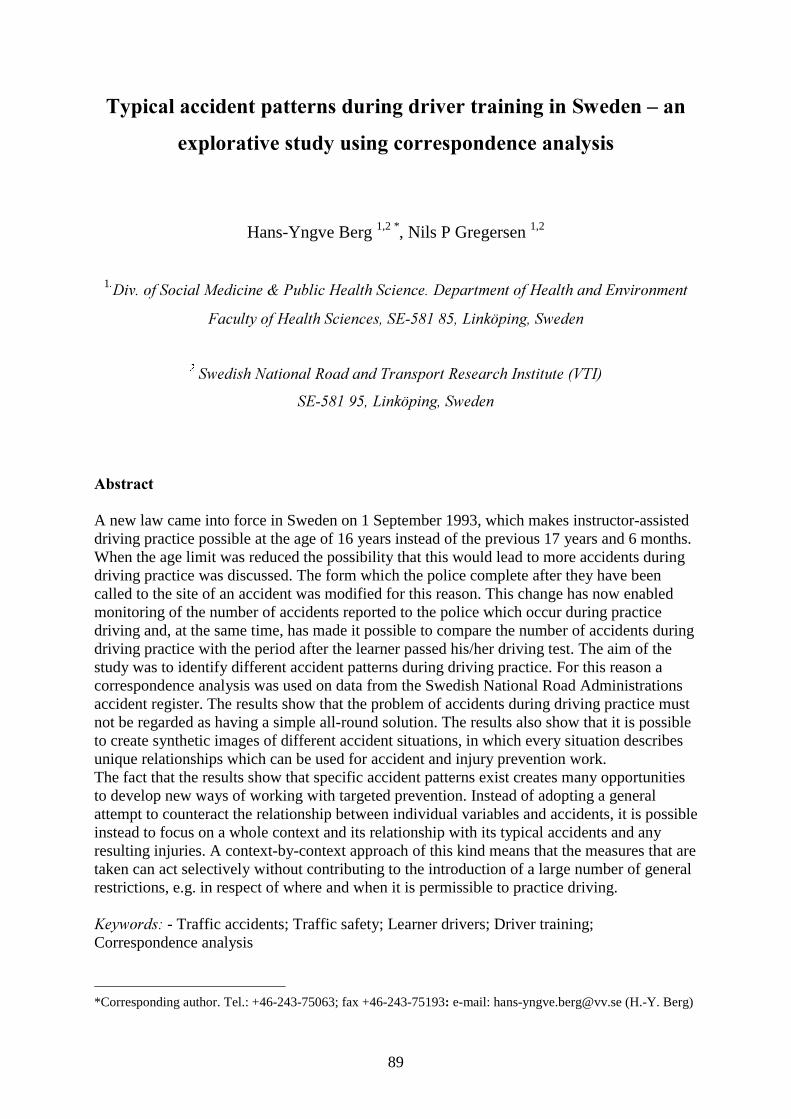
89
��������������������������������������������)�����7����
�<������������������������������������������
Hans-Yngve Berg 1,2 *, Nils P Gregersen 1,2
1�C��+ �� ������ �������� E ����� 0����� �������+ C�����#��� �� 0����� ��� *������#���
%������ �� 0����� ��������" �*FG; GF" !���'����" ������
� ������� 6������� ,��� ��� ��������� ,������� ��������� �H���
�*FG; @F" !���'����" ������
� ������� A new law came into force in Sweden on 1 September 1993, which makes instructor-assisted driving practice possible at the age of 16 years instead of the previous 17 years and 6 months. When the age limit was reduced the possibility that this would lead to more accidents during driving practice was discussed. The form which the police complete after they have been called to the site of an accident was modified for this reason. This change has now enabled monitoring of the number of accidents reported to the police which occur during practice driving and, at the same time, has made it possible to compare the number of accidents during driving practice with the period after the learner passed his/her driving test. The aim of the study was to identify different accident patterns during driving practice. For this reason a correspondence analysis was used on data from the Swedish National Road Administrations accident register. The results show that the problem of accidents during driving practice must not be regarded as having a simple all-round solution. The results also show that it is possible to create synthetic images of different accident situations, in which every situation describes unique relationships which can be used for accident and injury prevention work. The fact that the results show that specific accident patterns exist creates many opportunities to develop new ways of working with targeted prevention. Instead of adopting a general attempt to counteract the relationship between individual variables and accidents, it is possible instead to focus on a whole context and its relationship with its typical accidents and any resulting injuries. A context-by-context approach of this kind means that the measures that are taken can act selectively without contributing to the introduction of a large number of general restrictions, e.g. in respect of where and when it is permissible to practice driving. � )�������5 - Traffic accidents; Traffic safety; Learner drivers; Driver training; Correspondence analysis
*Corresponding author. Tel.: +46-243-75063; fax +46-243-751933�e-mail: [email protected] (H.-Y. Berg)
90
+,�������������� A system under which an individual is permitted to choose for him/herself whether to learn to drive in a driving school and/or through private instruction has been in place in Sweden since the start of the 1920s. A new law came into force on 1 September 1993, which makes instructor-assisted driving practice possible at the age of 16 years instead of the previous 17 years and 6 months. The idea behind the new law was to give young people the opportunity to acquire greater experience of driving before they start to drive on the roads on their own account. In order for a person to be able to practice driving in Sweden, it is necessary for him to obtain a provisional driving licence; this requirement applies regardless of the learner driver’s age. The learner driver can then choose to practice driving only with a lay instructor or only with a driving school, although a combination of these two possibilities is most common. An instructor’s licence is required in order to act as a lay instructor, who more often than not is one or other of the parents. In order to obtain a licence, an instructor must be aged more than 24 years, must have held a full driving licence for a car for five years and must not have any serious entries in the Swedish Police Registry, for example speeding, driving under the influence or having caused a serious accident. Once the learner driver and the lay instructor have obtained their licences, no further restrictions apply. They can practice driving whenever and wherever they wish. This also applies to the driving school. The decision to reduce the age limit was taken because many studies had indicated the significance of experience for the initial accident risk associated with a newly qualified driver (Spolander, 1983; Maycock et al., 1991; Levy, 1990). An evaluation of this reduced age limit (Gregersen, Berg, Engström al., 2000) reveals that it had a positive influence on the accident risk for young and new drivers. The reduction in risk (accidents per 10 million km) after the reform was introduced compared with the previous system was about 15%. The difference between those who took advantage of the opportunity to practice driving from the age of 16 years and those who decided to wait until they had reached 17.5 years was even greater, approximately 40%. The result of the evaluation also showed that the two groups which were compared were not exactly the same in terms of their socio-economic status. Earlier research (Schulze 1990, Berg 1994 and Murray 1998) has shown that groups from different socio-economic backgrounds have a different likelihood of being involved in an accident, and allowance was made for this difference in the analysis. The conclusion reached was that the difference in the accident risk between the two age groups was about. 24%, and that there was still an advantage for those who had started to practice driving at the age of 16 years. When the age limit was reduced the possibility that this would lead to more accidents during driving practice than had previously been the case was discussed. The form which the police complete after they have been called to the site of an accident was modified. Two extra fields with the text “driving school” or “lay instruction” were added. This enabled monitoring of the number of accidents reported to the police which occur during practice driving and, at the same time, has made it possible to compare the number of accidents during driving practice with the period after the learner passed his/her driving test. A ratio of 1:34 is obtained by comparing the number of accidents per thousand drivers during driving practice for a Category B driving licence with the number of accidents per thousand drivers afterwards (Gregersen 2000). This ratio indicates that the problem in the youth group is significantly greater after having completed driver training than during driver training.

91
Since 1997, the Swedish National Road Administration has been investigating the opportunities for introducing a step-by-step driver training system in Sweden. It has been noted that the problem with accidents during driving practice are still so significant that they call for countermeasures. Increased knowledge about where, when and to whom accidents take place during driving practice is thus required in order to be able to adopt appropriate measures. This knowledge is not still available. Limited knowledge has been available about where driving practice accidents occur, when they occur and who is involved in them. The changes made to the police report has made it possible to obtain knowledge which, to a certain extent, provides answers to these questions. Apart from entering details about the type of driving practice, the police also completes details of e.g. the date, time and place where the accident occurred, the age and sex of the driver, type of accident, speed limit, severity of the accident, and the weather and road conditions at the time, etc. etc. Those data are then entered in a database under the responsibility of the Swedish National Road Administration (SNRA). Acces to this data makes it then possible to select different combinations of parameters which can be used for describing a situation or a sequence of events. Sweden is divided by the SNRA into seven operating regions. These regions all have specific characteristics. The Northern and Central region is sparsely populated with many sections of road subject to 90 and 110 km/h speed limits. The traffic density is not as high as in the other regions, but it can sometimes increase during the rush hour in built-up areas. The two regions very often have hard winters with constant large quantities of snow, icy roads and little daylight. The winters are long, and the spring, summer and autumn are rather shorter than in the rest of Sweden. The hours of daylight are noticeably longer during the summer in Northern Sweden, since the sun never sets above a certain latitude for a couple of months during the summer. The temperature in the region fluctuates dramatically between winter and summer, from -30 to -20 degrees Celsius to +15 to +25 degrees Celsius. The Mälardalen and Stockholm regions are densely populated with several large cities and many sections of road that are subject to speed limits of 50, 70, 90 and 110 km/h. The traffic density can sometimes be high. Especially in rush-hour traffic and in the capital city, Stockholm. Winter in the two regions is not anything like as hard as in Northern Sweden, although they have distinctly wintry weather. Road conditions vary, but ground is often bare of snow for the entire winter. The roads can sometimes freeze over, resulting in a severely slippery surface. The hours of daylight during the winter are rather longer than in Northern Sweden, but shorter during the summer months. The summer is like that in Northern Sweden, but arrives rather earlier in the year. The southern regions, Western, South-Eastern and Skåne, are densely populated with larger cities and many roads with speed limits of 50 and 70 km/h. Traffic density is often high in the larger cities, especially during the rush hour. The three regions have milder winters than in the rest of Sweden, although it can sometimes be really cold with heavy snowfalls. It is unusual for the snow to remain on the ground for long periods, although it can sometimes do this. The surface of the roads is very often not slippery, but slippery conditions can occur locally for short periods. The summer is more or less as in the rest of Sweden, but the spring comes earlier than in Northern and Central Sweden. On the other hand, fog can form during the summer and the spring. Severe serial collisions with injury as a result can then occur. Figure 1 shows where the different regions are situated in Sweden.
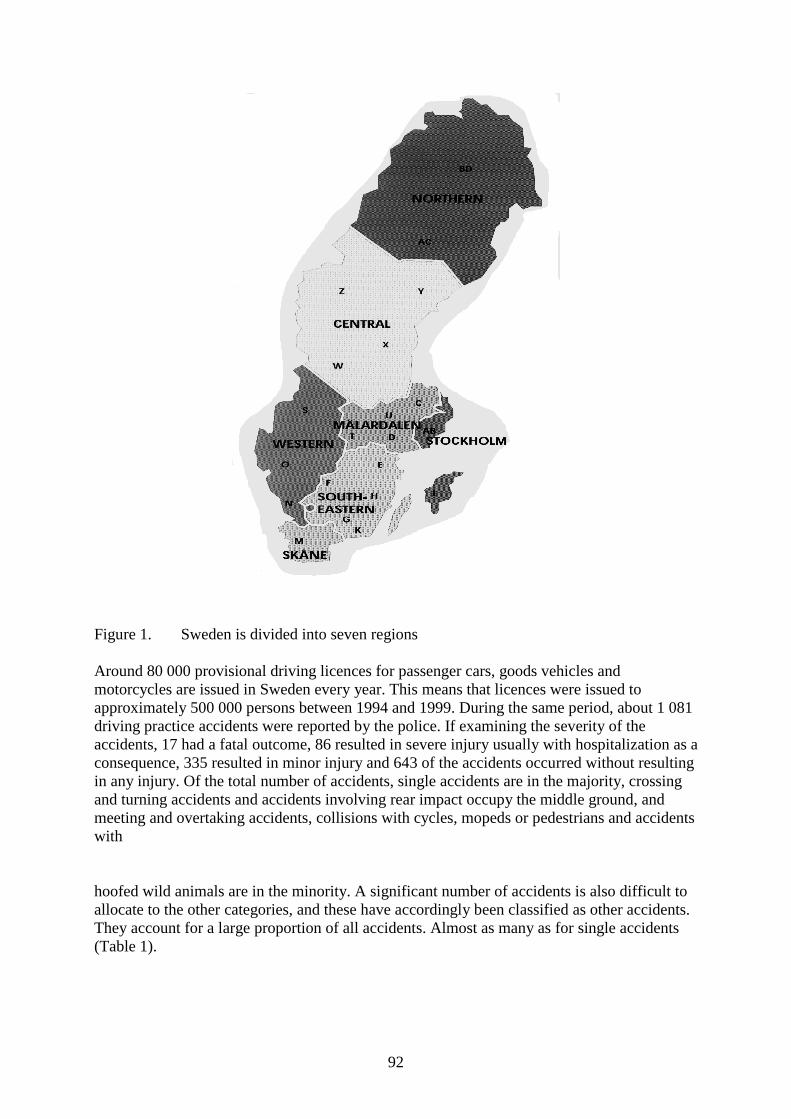
92
Figure 1. Sweden is divided into seven regions Around 80 000 provisional driving licences for passenger cars, goods vehicles and motorcycles are issued in Sweden every year. This means that licences were issued to approximately 500 000 persons between 1994 and 1999. During the same period, about 1 081 driving practice accidents were reported by the police. If examining the severity of the accidents, 17 had a fatal outcome, 86 resulted in severe injury usually with hospitalization as a consequence, 335 resulted in minor injury and 643 of the accidents occurred without resulting in any injury. Of the total number of accidents, single accidents are in the majority, crossing and turning accidents and accidents involving rear impact occupy the middle ground, and meeting and overtaking accidents, collisions with cycles, mopeds or pedestrians and accidents with
hoofed wild animals are in the minority. A significant number of accidents is also difficult to allocate to the other categories, and these have accordingly been classified as other accidents. They account for a large proportion of all accidents. Almost as many as for single accidents (Table 1).
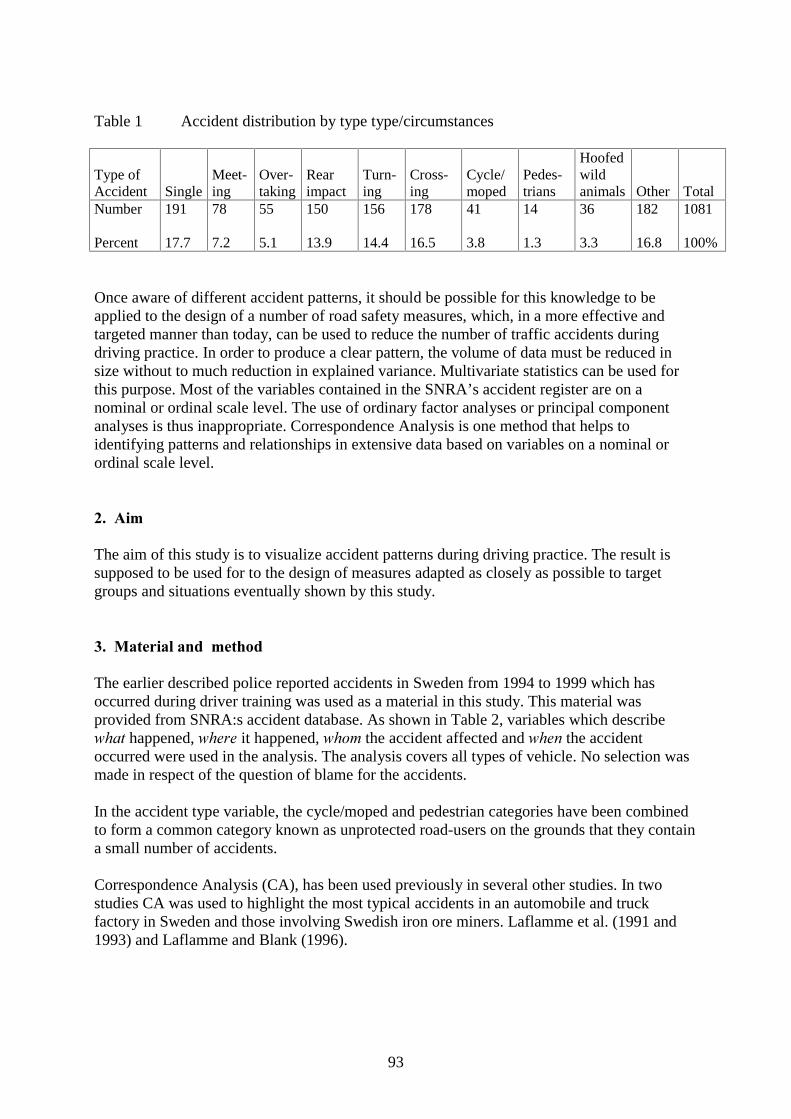
93
Table 1 Accident distribution by type type/circumstances Type of Accident
Single
Meet-ing
Over-taking
Rear impact
Turn- ing
Cross- ing
Cycle/ moped
Pedes-trians
Hoofed wild animals
Other
Total
Number Percent
191 17.7
78 7.2
55 5.1
150 13.9
156 14.4
178 16.5
41 3.8
14 1.3
36 3.3
182 16.8
1081 100%
Once aware of different accident patterns, it should be possible for this knowledge to be applied to the design of a number of road safety measures, which, in a more effective and targeted manner than today, can be used to reduce the number of traffic accidents during driving practice. In order to produce a clear pattern, the volume of data must be reduced in size without to much reduction in explained variance. Multivariate statistics can be used for this purpose. Most of the variables contained in the SNRA’s accident register are on a nominal or ordinal scale level. The use of ordinary factor analyses or principal component analyses is thus inappropriate. Correspondence Analysis is one method that helps to identifying patterns and relationships in extensive data based on variables on a nominal or ordinal scale level. /,���.� The aim of this study is to visualize accident patterns during driving practice. The result is supposed to be used for to the design of measures adapted as closely as possible to target groups and situations eventually shown by this study. 2,��0������������.������ The earlier described police reported accidents in Sweden from 1994 to 1999 which has occurred during driver training was used as a material in this study. This material was provided from SNRA:s accident database. As shown in Table 2, variables which describe ���� happened, ����� it happened, ���# the accident affected and ���� the accident occurred were used in the analysis. The analysis covers all types of vehicle. No selection was made in respect of the question of blame for the accidents. In the accident type variable, the cycle/moped and pedestrian categories have been combined to form a common category known as unprotected road-users on the grounds that they contain a small number of accidents. Correspondence Analysis (CA), has been used previously in several other studies. In two studies CA was used to highlight the most typical accidents in an automobile and truck factory in Sweden and those involving Swedish iron ore miners. Laflamme et al. (1991 and 1993) and Laflamme and Blank (1996).
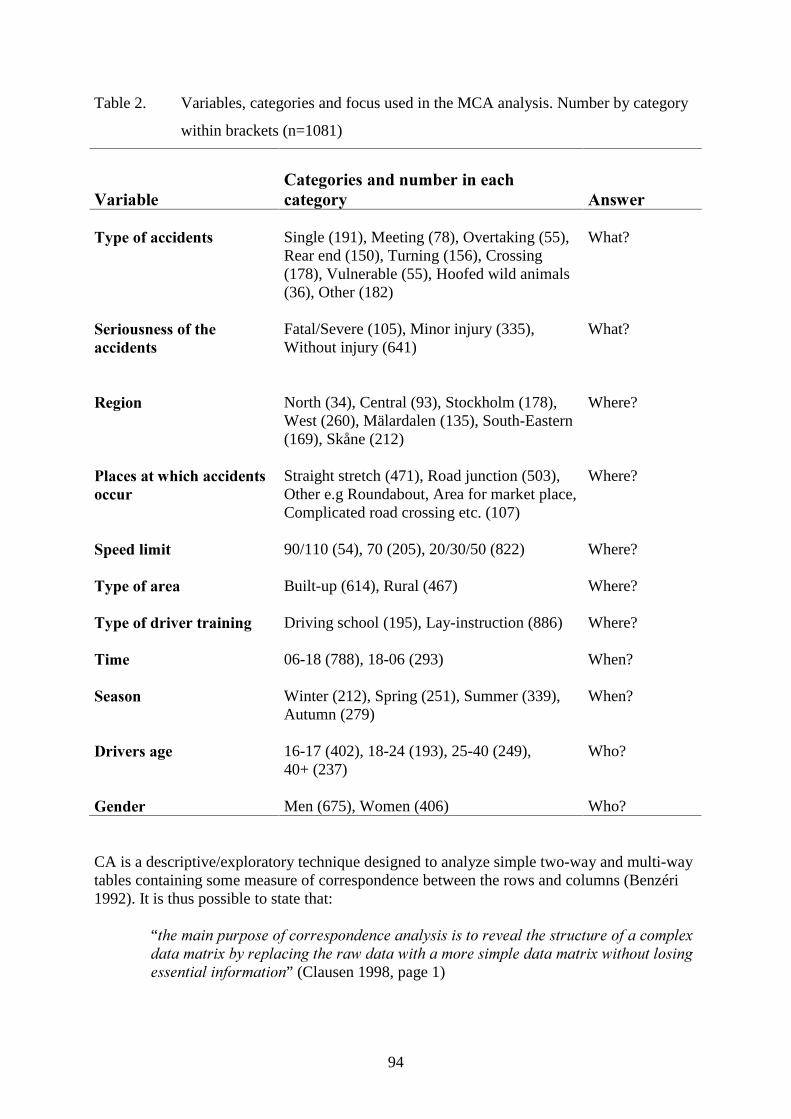
94
Table 2. Variables, categories and focus used in the MCA analysis. Number by category
within brackets (n=1081)
��#��� ��
�$��������������. �����������������
�����)���
������������������
Single (191), Meeting (78), Overtaking (55), Rear end (150), Turning (156), Crossing (178), Vulnerable (55), Hoofed wild animals (36), Other (182)
What?
���������������������������
Fatal/Severe (105), Minor injury (335), Without injury (641)
What?
����� North (34), Central (93), Stockholm (178), West (260), Mälardalen (135), South-Eastern (169), Skåne (212)
Where?
!���������)��������������������
Straight stretch (471), Road junction (503), Other e.g Roundabout, Area for market place, Complicated road crossing etc. (107)
Where?
�������.�� 90/110 (54), 70 (205), 20/30/50 (822)
Where?
������������� Built-up (614), Rural (467)
Where?
�������������������� Driving school (195), Lay-instruction (886)
Where?
�.�� 06-18 (788), 18-06 (293)
When?
������� Winter (212), Spring (251), Summer (339), Autumn (279)
When?
���������� 16-17 (402), 18-24 (193), 25-40 (249), 40+ (237)
Who?
������� Men (675), Women (406) Who? CA is a descriptive/exploratory technique designed to analyze simple two-way and multi-way tables containing some measure of correspondence between the rows and columns (Benzéri 1992). It is thus possible to state that:
“��� #��� ������� �� �������������� �������� �� �� ������ ��� ��������� �� � ��#���$ ���� #����$ � ��������� ��� ��� ���� ���� � #��� ��#��� ���� #����$ ������� ������ ��������� �����#�����” (Clausen 1998, page 1)
95
CA is not an hypothesis-testing analysis, rather it is intended to permit “a cognitive synthesis” about systems of relationships in the data (Broady, 1988). Another important characteristic of correspondence analysis is that it is a geometrical method rather than a statistical method (Greenacre 1984). Also, a correspondence analysis can be simple or multiple. The multiple analysis (MCA) may be considered to be an extension of a simple correspondence analysis to include more than two variables, and it is a simple correspondence analysis performed on an indicator (or design) matrix with cases as rows and categories of variables as columns. Both MCA and CA make use of a comparative approach, which is used in hypothesis testing with the help of a chi-squared test. A deviation between the actual distribution and the expected distribution is expressed as a weighted value, which is more specific than a chi-squared value (Heyman 1995). According to Heyman the interesting information lies in this chi-square distance measured. The information produced by the analysis is used to make clear a pattern of relations in a figure which can be expressed in a one-, two- or three-dimensional plane. Those categories which exhibit a similarity or over rows or columns will end up close to one another in a multi-dimensional space (in figure 2 called a dimension), and categories which exhibit a dissimilarity will end up far away from one another. The different relationships must then be interpreted on the basis of the relative positions of these points, for example as spatial dimensions and/or clustering. In order to be able to interpret and value the result of an MCA more easily, an explanation of some of the most important concepts in the correspondence analysis is given below. ����. The term #��� indicates each category’s total number of rows or columns. The higher the value is the higher is the mass. Since the mass always has a standardized value between 0 and 1, it can easily be expressed as a percentage. A #��� of 0.21 denotes that the row (or column) contains 21% of the total frequency in the material. ������� ��� ��� ��� ����#� ��������. Inertia is computed according to the formula for computing Chi-square statistics for two-way tables. Any deviations from the expected values will contribute to the total inertia. The total sum of chi-square divided by the total number of frequencies is equal to the inertia. The higher the inertia, the greater is the difference between the observed value and the expected value analyzed in the table. The distances of the categories from zero are also important in the interpretation of CA and MCA. The more a category deviates from zero (or gravity center) in a dimension, the more the category differs from the average. R������. The quality of a category indicates what proportion of a category’s variance can be described with reference to the number of dimensions used. It should be noted that a point with high 7������ does not necessarily need to contribute a high accounting row (inertia) in one dimension. ;,���������� A scree test (Statistica 2000) shows that a smooth decrease in own values appears at the fourth dimension and then continues to decrease over the rest of the 34 dimensions. The first four dimensions account for 23.3% of the total inertia (variance) of 2.63. Table 4 and Figure 2
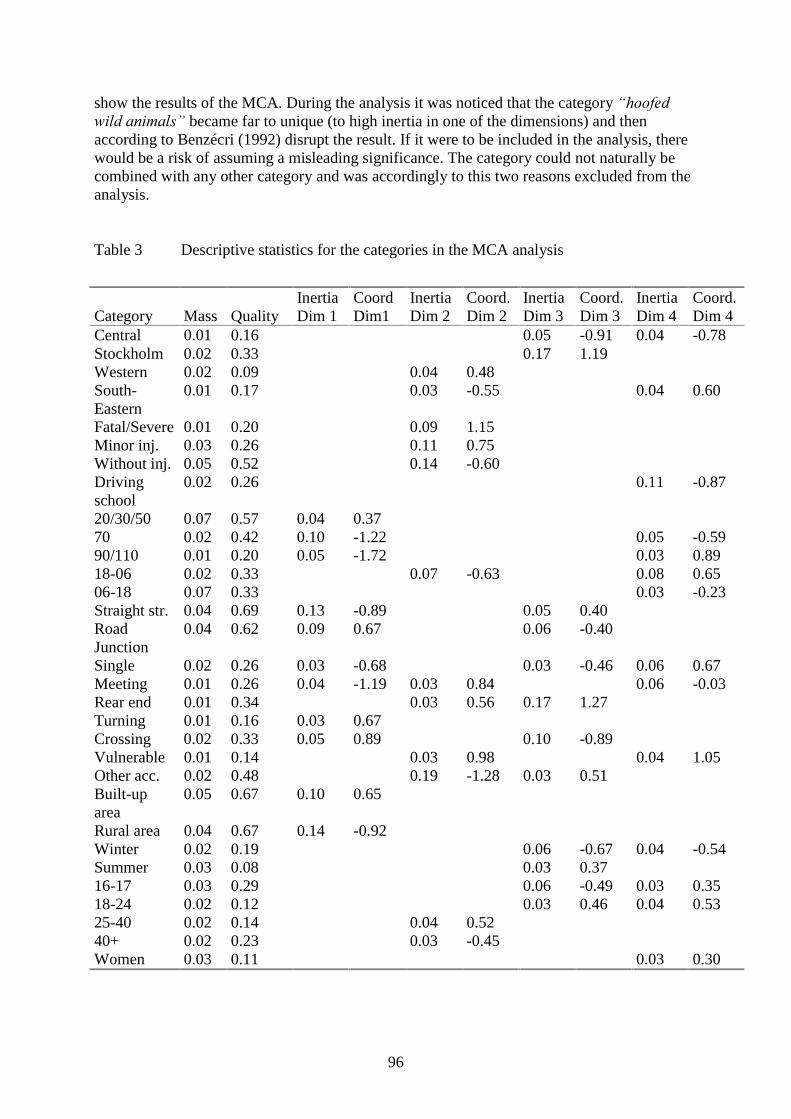
96
show the results of the MCA. During the analysis it was noticed that the category J������ ���� ���#���K became far to unique (to high inertia in one of the dimensions) and then according to Benzécri (1992) disrupt the result. If it were to be included in the analysis, there would be a risk of assuming a misleading significance. The category could not naturally be combined with any other category and was accordingly to this two reasons excluded from the analysis. Table 3 Descriptive statistics for the categories in the MCA analysis
Category
Mass
Quality
Inertia Dim 1
CoordDim1
Inertia Dim 2
Coord. Dim 2
Inertia Dim 3
Coord. Dim 3
Inertia Dim 4
Coord. Dim 4
Central 0.01 0.16 0.05 -0.91 0.04 -0.78 Stockholm 0.02 0.33 0.17 1.19 Western 0.02 0.09 0.04 0.48 South-Eastern
0.01 0.17 0.03 -0.55 0.04 0.60
Fatal/Severe 0.01 0.20 0.09 1.15 Minor inj. 0.03 0.26 0.11 0.75 Without inj. 0.05 0.52 0.14 -0.60 Driving school
0.02 0.26 0.11 -0.87
20/30/50 0.07 0.57 0.04 0.37 70 0.02 0.42 0.10 -1.22 0.05 -0.59 90/110 0.01 0.20 0.05 -1.72 0.03 0.89 18-06 0.02 0.33 0.07 -0.63 0.08 0.65 06-18 0.07 0.33 0.03 -0.23 Straight str. 0.04 0.69 0.13 -0.89 0.05 0.40 Road Junction
0.04 0.62 0.09 0.67 0.06 -0.40
Single 0.02 0.26 0.03 -0.68 0.03 -0.46 0.06 0.67 Meeting 0.01 0.26 0.04 -1.19 0.03 0.84 0.06 -0.03 Rear end 0.01 0.34 0.03 0.56 0.17 1.27 Turning 0.01 0.16 0.03 0.67 Crossing 0.02 0.33 0.05 0.89 0.10 -0.89 Vulnerable 0.01 0.14 0.03 0.98 0.04 1.05 Other acc. 0.02 0.48 0.19 -1.28 0.03 0.51 Built-up area
0.05 0.67 0.10 0.65
Rural area 0.04 0.67 0.14 -0.92 Winter 0.02 0.19 0.06 -0.67 0.04 -0.54 Summer 0.03 0.08 0.03 0.37 16-17 0.03 0.29 0.06 -0.49 0.03 0.35 18-24 0.02 0.12 0.03 0.46 0.04 0.53 25-40 0.02 0.14 0.04 0.52 40+ 0.02 0.23 0.03 -0.45 Women 0.03 0.11 0.03 0.30
97
All the categories included in the analysis are together able to account for 100% of the inertia contributed by each dimension. One basic rule is to use only categories which are able in the dimensions to account for more than the quota of 100% divided with the number of possible dimensions (Blasius 1984), in this case equivalent to 100/38. The categories included in one of the four dimensions thus have an inertia in each dimension which exceeds or is equal to the value 2.6%. In table 4 shows only categories with an inertia higher or equal to 2.6%. Some cells in the table are therefore empty. Figure 2 contains four dimensions with associated categories. Reference is made to Table 4 for more exactly see the position of the categories.
Figure 2 Four dimensions in the MCA with their corresponding categories Dimension 1, “������ ���� = ����� ����K" opposes the environments in which and the places at which accidents occur. The dimension essentially contrasts between high-density and low-density areas, between lower and higher speed limits and between road junctions and straight stretches of road. The positive side of the dimension indicates that typical accidents in high-density areas are crossing and turning accidents. High-density areas are also strongly related to the road crossing type of accident site and to roads where the speed limit is 20, 30 or 50 km/h. The negative side of the dimension shows that accidents in low-density areas are strongly related to the straight stretch of road and to roads where the speed limit is 70 or 90/110 km/h. The negative side of the dimension also shows a strong association between in low-density areas and single and meeting accidents. Dimension 2, or the “��&���S�������� ��#������K" essentially makes a contrast between injury and the absence of injury. On the positive side is fatal/severe injury and minor injury strongly
98
related to rear impact accidents, meeting accidents and collision with vulnerable road users accident types. These are also more typical in the Western region and in age group 25-40. The negative side of the dimension indicates that it is more typical for so-called “other” accidents (accidents which cannot be classified under any of the other five accident types) to occur in the South-Eastern region. These accidents are also corresponding with no injury and occurs more frequently in the evening and at night in the oldest age group (40+). Dimension 3, or the “��������S������ ��#������K" essentially opposes between the two rear-end and crossing accident types, but also between “other” accidents and single accidents and between the Stockholm and Central regions. This dimension also distinguishes between straight stretches or road junctions and between the three youngest age groups. This dimension thus contributes information about which accident types are most typical for the Stockholm and Central regions, where and when they occur and what age groups are over represented in the two regions. The positive side of the dimension indicates that rear-end collision and other types of accidents are more typical in the Stockholm region. It is also possible to see that the 18-24 age group, straight stretches of road and the time of year (summer) lie on the same side of the dimension. It is thus more common for these two types of accident to occur during the summer. It is also more typical for them to occur on a straight stretch of road and for the 18-24 age group to be involved. The negative side of the dimension indicates a strong association between crossing and single types of accident, the youngest age group, road junctions and to the Central region and wintertime. Dimension 4, “������� �����$� ��#������K" highlights driving school accidents, at the same time as it makes a contrast between the times of day 18:00-06:00 and 06:00-18:00. The dimension also makes a contrast between two regions, South-Eastern and Central, between the single, vulnerable and meeting accident types, between 90/110 km/h and 70 km/h speed limits. The two youngest age groups together with the women’s group is also on the positive side of the dimension. This dimension thus contributes information about when accidents are more likely to occur, where they occur and who is more often involved in them. The dimension also contributes information about where accidents in driving schools occur, who is more involved in them, when they are more likely to occur and what occurs. If examining the positive side of the dimension, we find that it is more typical for accidents to occur during the evening and at night in the South-Eastern region. These accidents are also strongly related to single accident and collision with vulnerable road users accident types, the two youngest age groups, speed limits of 90/110 km/h and the fact that the learner driver was a woman. The negative side of the dimension indicates that accidents during driving practice in driving schools varies jointly with the meeting type of accident which occurs during the day when the speed limit is 70 km/h and during the winter season in the Central region. This pattern points to the fact that accidents in driving schools take place to a greater extent in the Central region than in the other regions and for accidents which occur in driving schools to occur to a higher extent on roads with a speed limit of 70 km/h. =,����������� The results show that the problem of accidents during driving practice are multi-dimensional. The pattern which emerges in the results indicates that the problem is so complex that specific countermeasures must be developed – a single and simple solution is not enough. The results also show that it is possible to create synthetic images of different accident situations, in
99
which every situation describes unique relationships which can be used for accident and injury prevention work. It is important to consider that the findings are based on a large number of different approximations. If univariate or bivariate statistics had been used in the study, it would have been necessary to make many more analyses. The precision would perhaps have been greater in every individual analysis, but the general view of the result, would have been, because of to many cross tables, drastically reduced. The decision to make use of multivariate analysis in this study also means that the result studied must always be considered jointly with the other categories included in the analysis. Individual categories should not be picked out for individual study, therefore, and conclusions should only be drawn about them in combination with other categories. If this is not done, the result which emerges may not be that which emerged in the multivariate analysis. It is also important to point out that an MCA only indicates different dependent conditions. The results referred to in this study must not be assumed to be causal, therefore, but the results are statistical and must be valued accordingly. It must be pointed out once again that it is not possible to determine from the input data for the study whether the person who was practicing driving was injured or whether the same person was to blame for any of the accidents. This means that a person practising driving may have suffered a rear impact accident, or equally that he/she may have driven into the rear of someone else. The same applies to meeting, turning and crossing accidents. A person may have been involved in one of these accidents without having been to blame. As far as single and vulnerable road user accidents are concerned, the question of blame is more clear. It is probable in this case that the person who was practising driving was to blame. The results show in the case of dimension 2, for example, that a reduction in the number of dead and injured in driving practice accidents can be brought about by focusing on meeting accidents, rear impact accidents and collisions with unprotected road-users in the Western region. The prospects of achieving success in these efforts are unlikely to be as high as if the same effort were to be made in the South-East region. Similarly, it is possible in accordance with dimension 1 to provide the basis for targeted specific measures, for example at intersections in built-up areas or on stretches of road in rural areas. In the case of winter accidents in the Central region, it is true in accordance with dimension 3 that measures can focus in the first instance on the youngest, i.e. 16-17-year-olds, who are involved in single accidents and crossing accidents at intersections. In the light of the circumstances on the negative side of dimension 4, the driving schools should be able to reduce their accidents in the first instance by drawing on their knowledge of meeting accidents which occur in the Central region and on roads subject to a 70 km/h speed limit. The fact that the results here also indicate that these accidents occur between 06:00 and 18:00 tends to confirm a familiar situation, i.e. that driving practice in driving schools takes place during this period, rather than that the position of the categories contributes any new knowledge. As far as private driving practice is concerned, the results do not give any direct guidelines because this category does not exhibit an inertia which exceeds 2.6%. This must not be interpreted as indicating that no accidents occur during private driving practice. The reason why this category does not appear in the results is that it is not over represented in any of the
100
other categories. It is thus not sufficiently over represented to show up in any of the dimensions. Because private accidents account for ca. 82% of all driving practice accidents, it is possible with advantage to derive benefit from all relations in figure 2 in order to tailor appropriate measures for private accidents. The different accident patterns shown in Figure 2 characterize the situations in which a particular type of accident is most likely to occur. It is important to remember that specific accident patterns exist, since this creates many opportunities to develop new ways of working with targeted prevention. Instead of adopting the previous approach, i.e. making a general attempt to counteract the relationship between individual variables and accidents, it is possible instead to focus on a whole context and its relationship with its typical accidents and any resulting injuries. A context-by-context approach of this kind means that the measures that are taken can act selectively without contributing to the introduction of a large number of general restrictions, e.g. in respect of where and when it is permissible to practice driving. The result of the study does not offer a solution to ��� to deal with the implementation of a more precisely targeted preventive approach. On the other hand, the study contributes knowledge about ����� a traffic safety work should start and on ���# and on ���� this work must be focused on. Development work with the aim of answering the ��� �� �� question must, therefore, follow on from this study. Further study and explanation of the dependencies indicated in the results will also be required. Only then can effective measures be adopted with a view to increasing safety during driving practice. ����������#���� Many thanks to Arne Land, statistician at VTI, and to The Swedish National Road Administration for sharing their accident database which is the base for this study. Also many thanks to associate professor Lucie Laflamme, Karolinska Institutet, for fruitful help and comments about how to use a correspondence analysis and to professor Per Bjurulf for his helpful comments on the writing of this articel. :,������������� Benzécri, J.-P., 1992. Correspondence Analysis Handbook. New York. Marcel Deeker, Inc. Berg, H-Y., 1994. Lifestyle, Traffic and Young Drivers – an Interview Study. VTI Report 389A. Swedish Road and Transport Research Institute, Linköping, Sweden. Blasius, J., 1984. Correspondence Analysis and its Interpretation. In Greenacre, M. J., Blasius, J. (Ed.), Correspondence Analysis in the Social Sciences. London, Academic Press, Inc. Broady D., 1988. Jean-Paul Benzécri och korrespondensanalysen, Arbetsrapport 1988:4. Stockholm. UHÄ. Clausen, S.-E., 1988. Applied Correspondence Analysis: An introduction. Sage University Papers. Series on Quantitative Applications in the Social Sciences, 07-121. Thousand Oaks, CA:Sage.
101
Gregersen, N.P., 2000. Analysis of accidents and risk during driver training. Paper presented at the International Conference on Traffic and Transport Psychology, 4-7 September, Berne, Switzerland. Gregersen, N. P., Berg, H.-Y., Engström, I., Nolén, S., Nyberg, A., Rimmö, P-A., 2000. Sixteen years age limit for learner drivers in Sweden – an evaluation of safety effects. Accident Analysis & Prevention, Vol. 32, pp. 20-35. Greenacre, M. J., 1984. Theory and Applications of Correspondence Analysis. London, Academic Press, Inc. Heyman, I., 1995. Gånge hatt till… Omvårdnadsforskningens framväxt i Sverige - sjuksköterskors avhandlingar 1974 - 1991, Daidalos, Göteborg. Laflamme, L., Backström, T., Döös, M., 1993. Typical Accidents Encountered by Assembly Workers: Six Scenarios for Safety Planning Identified using Multivariate Methods. Accident Analysis & Prevention. Vol. 25, No. 4, pp. 399-410. Laflamme L., Blank V L G., 1996. Age-related Accident Risks: Longitudinal Study of Swedish Iron Ore Miners. American Journal of Industrial Medicine 30:479-487. Laflamme, L., Döös, M., Backström, T., 1991. Identifying patterns using the FAC and HAC; their application to accidents at the engine workshops of an automobile and truck factory, Safety Science, 14 13-33. Levy, D T., 1990. Youth and traffic safety: The effects of driving age, experience, and education, Accident Analysis & Prevention, Vol. 22 (327-334). Maycock, G., Lockwood, C-R., Lester, J-F., 1991. The accident liability of car drivers. (TRL Research Report 315). Crowthorne: Transport Research Laboratory. Murray, Å., 1998. The home and school background of young drivers involved in traffic accidents. Accident Analysis & Prevention 30 pp. 169-182. 1998. Schulze, H., 1990. Lifestyle, Leisurestyle and Traffic Behaviour of Young Drivers. VTI Report 364A. Swedish Road and Transport Research Institute, Linköping Sweden. Spolander, K., 1983. Bilförares olycksrisker. En modell testad på män och kvinnor (Accident risks among drivers. A model tested on men and women). VTI Report 268. Swedish Road and Transport Research Institute. Linköping ,Sweden. Statistica. Electronic manual at http://www.statsoft.com/textbook/stathome.html. 2000-06-14.

102

103
�
!������#��
�<���������������.������������������������)�����7��������������������������������
��

104

105

106

107

108

109

110

111

112

113

114

115

116

117
!�����#��
'����������������������.�����������������

118

119

120

121

122

123

124
�
Related Documents


![Subgroups of direct products of two right-angled Artin groups · papar,[4], was the contrast between nitely presented and nitely generated subgroups. Finitely generated subgroups](https://static.cupdf.com/doc/110x72/5f06640a7e708231d417c234/subgroups-of-direct-products-of-two-right-angled-artin-groups-papar4-was-the.jpg)