St. John Fisher College St. John Fisher College Fisher Digital Publications Fisher Digital Publications Sport Management Undergraduate Sport Management Department Spring 5-1-2014 Understanding Season Ticket Holders’ Buying Behaviors Understanding Season Ticket Holders’ Buying Behaviors Stephen M. Castro Jr. [email protected] Follow this and additional works at: https://fisherpub.sjfc.edu/sport_undergrad Part of the Sports Management Commons How has open access to Fisher Digital Publications benefited you? Recommended Citation Recommended Citation Castro, Stephen M. Jr., "Understanding Season Ticket Holders’ Buying Behaviors" (2014). Sport Management Undergraduate. Paper 7. Please note that the Recommended Citation provides general citation information and may not be appropriate for your discipline. To receive help in creating a citation based on your discipline, please visit http://libguides.sjfc.edu/citations. This document is posted at https://fisherpub.sjfc.edu/sport_undergrad/7 and is brought to you for free and open access by Fisher Digital Publications at St. John Fisher College. For more information, please contact fi[email protected].

Welcome message from author
This document is posted to help you gain knowledge. Please leave a comment to let me know what you think about it! Share it to your friends and learn new things together.
Transcript

St. John Fisher College St. John Fisher College
Fisher Digital Publications Fisher Digital Publications
Sport Management Undergraduate Sport Management Department
Spring 5-1-2014
Understanding Season Ticket Holders’ Buying Behaviors Understanding Season Ticket Holders’ Buying Behaviors
Stephen M. Castro Jr. [email protected]
Follow this and additional works at: https://fisherpub.sjfc.edu/sport_undergrad
Part of the Sports Management Commons
How has open access to Fisher Digital Publications benefited you?
Recommended Citation Recommended Citation Castro, Stephen M. Jr., "Understanding Season Ticket Holders’ Buying Behaviors" (2014). Sport Management Undergraduate. Paper 7.
Please note that the Recommended Citation provides general citation information and may not be appropriate for your discipline. To receive help in creating a citation based on your discipline, please visit http://libguides.sjfc.edu/citations.
This document is posted at https://fisherpub.sjfc.edu/sport_undergrad/7 and is brought to you for free and open access by Fisher Digital Publications at St. John Fisher College. For more information, please contact [email protected].

Understanding Season Ticket Holders’ Buying Behaviors Understanding Season Ticket Holders’ Buying Behaviors
Abstract Abstract Increasing the average dollar spent from fans is important for an organizations’ bottom line. Existing literature focuses on general attendance versus the unique population of season ticket holders. Having already invested fans consume more, due to higher attendance, can increase the bottom line. By having the Rochester Red Wing’s season ticket holders fill out a survey it will uncover their buying behaviors and what affects their attendance. The results show aroma is how fans decide what concessions to buy and new merchandise is how fans decide what merchandise to buy.
Document Type Document Type Undergraduate Project
Professor's Name Professor's Name Dr. Dane
Keywords Keywords Buying Behaviors, Concessions, Merchandise, Fans, Baseball, Season Ticket Holders
Subject Categories Subject Categories Sports Management
This undergraduate project is available at Fisher Digital Publications: https://fisherpub.sjfc.edu/sport_undergrad/7

Running Head: BUYING BEHAVIORS 1
Understanding Season Ticket Holders’ Buying Behaviors
Stephen M. Castro Jr.
St. John Fisher College
BUYING BEHAVIORS 2
Abstract
Increasing the average dollar spent from fans is important for an organizations’ bottom line.
Existing literature focuses on general attendance versus the unique population of season ticket
holders. Having already invested fans consume more, due to higher attendance, can increase the
bottom line. By having the Rochester Red Wing’s season ticket holders fill out a survey it will
uncover their buying behaviors and what affects their attendance. The results show aroma is how
fans decide what concessions to buy and new merchandise is how fans decide what merchandise
to buy.
BUYING BEHAVIORS 3
Increasing the Season Ticket Holders’ Overall Attendance
On a warm summer day you think what a great day to be at the ball park. The feeling of
the warm sun, the smell of the fresh cut grass, and the excitement of being at the game makes it
worth being a season ticket holder. Plus you’re enjoying the game with the same fans and friends
which you’ve known for the last five years. After seven long innings it’s time to stretch your legs
and go grab something to eat for dinner. You take a stroll around the ball park and heads towards
your favorite concession stand. As the stand comes into sight, it hits you, its Wednesday. The
dinner you were so eager to have and would make this night perfect is not available, again. So
you shrug it off like you have done so many times before and figure you will swing by the
merchandise store to see if there is any new product out. After looking around for a second you
realize you have bought everything in the store. As you head back towards your seat you start to
think about how hungry you are and that your son will be disappointed because you didn’t buy
him something new from the store like you promised. After sitting back down in your seat you
bring up your bad experience to the other fans and they all agree, coming on a Wednesday might
not be the best. If the Red Wings only had open the concessions they wanted and a few new
products in the store, then it would make weekday games so much better.
It’s imperative for the companies to find different ways to increase their revenue. Some
examples of increasing the bottom line would include using more energy efficient lights,
lowering insurance premiums, and producing at optimal efficiency. In this day and age keeping
an open door when it comes to listening to your customers will bring a large return. The
Rochester Red Wings, a minor league affiliate of the Minnesota Twins, could use additional
revenue like many other teams. In sports and any other industry, knowing how to satisfy your
customers and give them a better experience will bring additional dollars to the organization.

BUYING BEHAVIORS 4
The reason why the information would be helpful to the Red Wings is because they can
better understand their most avid fans and how to better satisfy them. With more satisfied fans
they will attend more games. The end goal will be higher overall revenue from the additional
dollars spent by on concessions and merchandise. There is limited research the season tickets
holders’ attendance. Therefore there is an opportunity to build on the previous studies which
have been conducted. In addition this research will be adding to Classical Learning Theory. This
will all be possible because the Red Wings will understand their fans better because they are
willing to listen by keeping their doors open.
Literature Review
Theoretical Framework
This research will use classical conditioning theory, also known as classical learning
theory, to understand the buying behaviors of season ticket holders. This theory is explained by
Chen-Yueh and other authors as a “pairing a positive, unconditioned stimulus with a conditioned
stimulus does result in positive attitudes towards the conditioned stimulus” (Chen-Yueh, Yi-
Hsiu, & Chia-Lin, 2012). This theory is used by marketers to shape the attitude of their buyers.
Pavlov was the founder of this theory because of his experiment on dogs (Solomon, 2009). The
experiment was using dog food (unconditioned stimulus) to get salvation to occur (unconditioned
response) from the dog (Limbad, 2013). Then Pavlov introduced a bell by ring it every time the
food was given to the dog. The bell was called the neutral stimulus. By pairing the bell and the
food together, after a few repetitions, the dog started to salivate at the sound of the bell. This is
how classical conditioning was discovered.
There is other research which shows how classical conditioning theory can shape the
attitudes of consumers towards products. In The Role of Affect in Attitude Formation: A
BUYING BEHAVIORS 5
Classical Conditioning Approach, the authors found choosing and arranging visual imagery,
along with repetitions, will lead to a greater positive brand attitude (Kim, Jeen-Su Lim, &
Bhargava, 1998). An additional study found positive music which is appropriate for the product,
will increase positive attitude more successfully than pairing a random choice to the good (Tom,
1995). For example if an organization picks the most popular rap song and pairs it with ballet
shoes to increase profits, the effects would be meniscal compared to a more appropriate song.
In classical conditioning when the neutral stimulus, the bell, is turned into the
conditioned stimulus, it can be viewed as a trigger. An example is everything you hear Zoom
Zoom you think of Mazda or you see a large yellow M you want McDonalds. The sound and the
sight of these elements are the triggers to make your brain think of these items. There are these
same types of triggers in sport. The trigger could be simply going to the game itself and that
could trigger you to want concessions or merchandise. Then there are other triggers where the
fan walks by a concession stand and the smell of the food, the trigger, is what makes the
consumer purchase. Another possible trigger is an advertisement of alcohol, on the jumbo screen,
which makes the fan want to go buy beer. There are many different triggers in the sport arena
and knowing what those are is very useful information.
Factors that Affect Attendance and Consumption
A sport organization needs people in attendance in order to have consumption of their
concession and merchandise products. Therefore knowing the factors which have the greatest
impact on season ticket holders’ attendance is important. This section will discuss those factors
which include pricing, promotions, stadium, and fan identity. Each factor will show the effects it
has on the attendance of sport fans. This study takes into account of other causes which the Red
Wings wouldn’t have direct control over. These elements, which will not be discussed, include

BUYING BEHAVIORS 6
weather, winning, losing, and others. Understanding concession pricing is valuable information
because the effects it has on the consumers. In addition this section will discuss how the
organization’s revenue can be increased or decreased because of the buying habits of the season
ticket holders. Factors such as impulse buying help to explain why this particular fan base
purchases the merchandise and concessions they buy.
Pricing.
There are some differences and similarities between Major League Baseball (MLB) and
Minor League Baseball. When it comes to pricing, there has been research conducted which
shows an effect on attendance and revenue in both leagues (Shapiro, & Drayer, 2012). Different
ticket pricing strategies include VTP (variable ticket pricing) and DTP (demand ticket pricing).
“VTP allows teams to set higher price points for premium games” but “this strategy still may not
accurately depict consumer demand for each game” (Shapiro, & Drayer, 2012, pp.532-533).
While DTP can change prices daily on a game to game basis because of the varying demand
conditions and due to factors which include “weather, player performance, team performance,
opponent, and other situational factors” (Shapiro, & Drayer, 2012, pp.532-533). DTP and VTP
have been used by many different teams to help with increasing their revenue and attendance.
In addition one research article conducted in 2007 stated “this study supports the use of
VTP both to increase and decrease prices from average seasonal levels” (Rascher, McEvoy,
Nagel, & Brown, p.431). In addition lowering ticket prices for less desirable games would
potentially create more positive relationships between teams and their fans (Rascher, et al). Since
the demand for a sporting event can change so quickly, a revenue management strategy, such as
DTP, provides an opportunity for sport organizations to optimally price tickets (Shapiro et. al.,
2012). These types of pricing structures are beneficial for general admission rather than season
BUYING BEHAVIORS 7
ticket holders. Since season ticket holders pay up front for all 72 games, at the beginning of the
season, these pricing structures would not affect them. It’s important to show how different
pricing structures are being used compared to the traditional ways. Having a different structure
for season ticket holders can be explored in further research to increase their attendance.
Promotions.
Promotions are used in every sporting event. Knowing which ones are effective is very
important to a sport organization. Promotions could be possible incentives to increase the overall
attendance of the season ticket holders in one season. Promotions are important because “they
can encourage fans to be more involved and facilitate interaction between groups of fans and
players, which could enhance attachment” (Laverie, & Arnett, 2000, p. 238).
In case the game itself isn’t of high quality, a team must offer a variety of peripheral
products to be successful (McDonald, & Rascher, 2000, p.15). In this statement by McDonald
and Rascher, it shows how important promotions are to sport teams however the research is
outdated by 13 years. Updated research, conducted in 2010, states promotions are still important
because when an organization has a sport’s team as the main product, it needs a controllable
product which are promotions (Lanzillo). The uses of promotions do increase attendance like
sport organizations would want (McDonald & Rascher, 2000). These studies concluded that
promotions are important and they are something teams have control over. Knowing the
promotions which work the best and are cost effective is very helpful for sport organizations.
Special events are effective and low cost but when the giveaways, like bobble heads, are
coupled with an event it draws in even more fans (Price & Sen, 2003). Boyd & Krehbiel also
came to this conclusion that there is high effectiveness of the combining giveaways and special
events, known as stacking (2006). There are many different types of special events which sport
BUYING BEHAVIORS 8
organizations can use. Boyd and Krehbiel found some special events could be less than five
dollars (2006). Knowing the particular events which have little cost but a large impact is very
beneficial because the team is saving money, increasing their attendance. The three events which
showed a high success rate for the Savannah Sand Gnats back in 2009, included fan participation
events such as Tug-A-War, Dizzy Bat Race, and Karaoke Fans (Lachowetz, Dees, Todd, &
Ryan, 2009). These events were made more successful paring them with popular promotions like
“fireworks, adults beverage specials, community involved complimentary tickets, and give-a-
ways”. The give-a-ways included “bobble-heads, baseball card team sets, t-shirts, hats, mini-
bats, gloves, magnetic calendar schedules and drinking glasses” (Lachowetz, et al, 2009, p.226).
All of the promotions just listed can also have a positive impact for other teams, particularly, the
Red Wings. As stated earlier, stacking events and promotions would have a higher success rate
together versus by themselves.
Another promotion in a separate study than Lachowetz, Dees, Todd, and Ryan to see if it
affects fans’ attendance was fireworks. The author, Lanzillo, concluded the fireworks promotion
has a larger impact on fans who attend a few games per season (2010). Since season ticket
holders go to more games than just a few, fireworks would not impact them. On the other hand,
certain give-a-way promotions which reflect player affiliation, such as hats and t-shirts, had a
lager impact on loyal fans like season ticket holders (Lanzillo, 2010). Sport organizations should
know the effects of their promotions before implementing them. One author found promotions
may create an ambience and event culture that will influence sport attendance decisions
(Armstrong, 2008, p. 219). In other words you could affect a fan’s attendance if a sport
organization is marketing promotions to only one type of ethnic group. All teams should be
aware of this problem because they could be spending money on promotions which in fact
BUYING BEHAVIORS 9
decrease the attendance and revenue. Again knowing which promotions work best will help to
save money by not spending it on promotions which have less effect on ticket holders.
Stadium
Updating the sport organization’s stadium is another factor other authors have studied.
There are a few researchers who have concluded changes to a baseball stadium can improve
attendance. One study discusses how playing in a newly constructed stadium is associated with a
significant increase in attendance, and this effect lessens as the stadium ages (p.550). In addition
any renovations done will also increase attendance (Beckman, Cai, Esrock, & Lemke, 2012).
Having something new will generate curiosity and a need for the fans to enjoy the renewal of
something old. These authors show one side of how renovating a stadium can affect the
attendance. There has been other research which shows highly identified fans having a negative
attitude on changing a baseball stadium.
The research conducted at Fenway Park was to gather fans’ opinions on having
renovations done to the stadium. Also the study asked fans if a new stadium would be more
favored opposed to keeping the stadium the way it is. Majority of the participants stated they
were highly identified fans and the results indicated those fans wish to keep Fenway Park as it is
(Sargeant, 2012). This goes against the research from Beckman, Cai, Esrock, and Lemke but the
studies are different because Fenway Park is very unique. Changes to a field seem to affect fans
depending on the stadium itself. Therefore neither study proves or disproves one another because
it’s a case by case difference.
Fan Identity
Fan identity is very important because “if a person is involved with and/or attached to a
sports team, he/she is more likely to rate their fan identity as more important than other

BUYING BEHAVIORS 10
identities” (Laverie & Arnett, 2000, p. 238). Different identities could include a book club, being
a part of a volunteering group, or other non-sport groups. In addition if a team has high fan
identification it doesn’t matter whether a team is unsuccessful or not, the fans will still attend
games and purchase products. The reason for why fan do this is because unsuccessful team’s
fans focus more on aspects of the group and its member while ignoring information about the
poor performance of the team (Fisher & Wakefield, 1998). For the successful team’s fans, the
fans associated with how much the team was winning versus the aspects of the group (Fisher &
Wakefield, 1998). It seems multiple researches conclude a sport organization with high Fan
Identification results in increase consumption (Lanzillo, & Wert-Gray, 2012). This is beneficial
when trying to increasing a sport team’s revenue because it will bring more fans to the stadium.
Teams need to be careful because too much fan identity “could drive fans to be
overzealous” and lead to “avid fans in their zest to support their teams may act in a manner that
violates regulations” (Laverie & Arnett, 2000, p. 241). This would happen more so at the
collegiate level versus minor league baseball but sport organizations should be aware. An
example would be SMU and their money scandal, which end their football program for years
because of their boosters were overzealous. Cities which hold professional sport organizations
have experienced riots because of avid fans demonstrating their support of their team’s victory.
There are other studies which conclude with slightly different results than highly
identified fans’ attendance not being affected by their unsuccessful teams. Other authors found
self-esteem and positive emotions were higher, after a team’s success than after a failure, and
therefore fans tended to associate more with the team after a success (Bizman, & Yinon, 2002, p.
389). The Fisher and Wakefield study was only done four years earlier than the Bizman and
Yinon study. The differences between the two studies are that sports are different. Another study,
BUYING BEHAVIORS 11
conducted at an earlier time, found teams pursue a goal to win because fan attendance is related
to a team’s success (Hansen & Gauthier, 1989). Understanding there can be an effect on fans
self-esteem depending on winning or losing is important because it could affect attendance.
Ways to increase fan identity is by having “charitable events, getting local schools
involved, and other grass roots programs” (Lachowetz et al., 2009, p. 227). Having a community
be directly benefited from a sports team makes the public want to help in return (Lachowetz et
al., 2009). The more a sport organization is involved with the lives of adults and children, will
essentially increase loyalty to the team (Lachowetz et al., 2009). This is important to realize the
potential of having the players and their team, actively engaging the community.
One factor that can decrease the amount of fan identification with a team stems from
athlete behavior. From what was previously discussed, decreasing the fan identification could
lead to lower attendance and revenue generated. In ‘Off-field behavior of athletes and team
identification: Using social identity theory and balance theory to explain fan reactions” it states
“unscrupulous acts by athletes can affect highly identified fans’ level of identification with a
team” (Fink, Parker, Brett, & Higgins, 2009, p.152). It’s also important for sport organizations to
be aware of this relationship because not responding in a certain way could dispirit the general
public and the core base of highly identified fans (Fink, et al., 2009). Also knowing what will
decrease fan identity is just as important as being aware of what can increase it.
One author found reasons why season ticket holders go to more games or discontinue
their tickets. After conducting the surveys on many different professional sports it was concluded
fans would become season ticket holders or attend more games because of tangible reasons, like
discounts, and intangible reasons like, feeling more involved (McDonald & Stavros, 2007,
BUYING BEHAVIORS 12
p.225). It’s important to understand why season ticket holders make certain buying decisions
because it can help other vendors within the organization.
Concessions.
Concession pricing is another factor which needs to be reviewed from previous literature.
Multiple authors agree and concluded setting concession prices in the inelastic portion of
demand will create profit maximization. An example would be complementing admissions with
concessions and similar products (Marburger, 1997). Some sport organizations will make the
tickets prices lower and receive most of their profits from marked up concessions (Drayer,
Shapiro, & Lee, 2012). Two reasons for selling tickets at a lower cost can be to fill up enough
seats to receive television coverage and have more leverage when selling advertisement spots
(Drayer, Rascher, & McEvoy, 2012). In “Can we find it at the concessions? Understanding price
elasticity in professional sports” the author says owners of sport organizations set tickets prices
in the inelastic (rather than unit-elastic) range of demand (Krautmann & Berri, 2007, p. 190).
Another research concluded “that an inelastic ticket price is consistent with profit maximization”
(Marburger, 1997, p.379). Coates and Humphreys (2007) had found franchises set ticket prices
to maximize concessions’ revenues (p.162). All these examples show owners already have
calculated the concession prices to make sure their products are set at a profit maximizing range.
Inelastic pricing is about maximizing long-run profits that will set short- run marginal
revenue (MR) below marginal costs (MC), a necessary condition for inelastic demand
(Krautmann & Berri, 2007, p. 185). Sport teams have to find their own price range which creates
inelastic demand. Most franchises already take into account how much the total Fan Index Cost
should be and what price to set tickets so concession demand isn’t decreased (Coates &
Humphreys, 2007). All of this is important to understand because owners need to set their prices
BUYING BEHAVIORS 13
in a profit maximizing inelastic range. The cause will have fans purchase more concessions
which will increase the baseball team’s overall revenue.
Merchandise
Merchandise is a large component to increasing the bottom line revenue of a sport
organization. When it comes to purchasing merchandise, sport fans have different buying
behaviors, which play a large role in what products are bought.
Preferences for merchandise and concessions, of season ticket holders, can change based
off of numerous factors such as weather and location. There are other variables, like brand
loyalty, which have a stronger impact on the buying preferences of the fans. Wang found fans
with higher identification have positive brand attitude/loyalty, which brings more favorable
purchase intention (Wang, 2012). If merchandise and concessions are stocked with trademarks
that have an emotional tie to the season ticket holders then there will be an increase in sales
(Wang, 2012). In other words, stronger emotional connections between brands and consumers
will increase sales of those products.
Other than brand loyalty affecting fans preferences of what they buy or don’t buy, there
are other strong influences on season ticket holders. Other factors include visual display and
communication of merchandise and concessions. What many companies have started to gravitate
towards is a different form of communication to their consumers. Marketers have moved away
from presenting facts and started to focus on emotional connections (Seo, 2010). An example
would be to focus on using a picture of a family enjoying a baseball game together (emotional
connection), rather than listing out the reasons why a baseball game is enjoyable (presenting
facts). This statement agrees with the study of author Wang mentioned above. An example of
this type of communication would be the feeling of importance a fan receives when supporting
BUYING BEHAVIORS 14
their team, after buying their merchandise. Communicating symbolically to fans, like having an
advertisement with a popular player wearing a new team t-shirt, is a lot more effective because
the connection to the fan is stronger (Seo, 2010). Additionally using visual displays such as big
logos, versus small logos, is more attractive to sport fans and will produce more merchandise
sales (Kwon, 2002). The reason why this occurs is because consumers pay more attention to
larger visuals than smaller visuals (Solomon, 2009).
There are other variables worth pointing out because of their impact on what products
consumers might buy. For example impulse buying helps to explain why sport fans buy certain
goods. Impulse purchasing stood out the most because there has been a lot of research done by
many authors. A few authors concluded this type of buying was a large reason why fans made
their purchase. A reason for impulse buying was due to high fan identity to the team’s brand
(Kwon, & Armstrong, 2002). In addition fans that are in a group with high cohesiveness, while
shopping, have a tendency to buy more on impulse (Chen, Lin, & Chang, 2013).
Research Question and Purpose
After reviewing previous literature, extensive research has explored pricing, concessions,
promotions, stadium, and fan identification. Some studies did focus on how a select group of
consumers spent their money. There were only a few authors who focused their studies on season
ticket holders specifically.
The previous research lacks additional information regarding how to better satisfy the
season ticket holders preferences, with a focus on how fans spend their money. Majority of fan
consumption is from concessions and merchandise. If there was information regarding spending
patterns and decision making, the Red Wings could see an increase in consumption. This
research will answer these two questions:
BUYING BEHAVIORS 15
1. How do fans decide what concessions to buy?
2. How do fans decide what merchandise to buy?
By answering these questions, the Red Wings will understand the buying habits of their
respondents . This research will provide, the local baseball team, with information needed to
become a better organization for their customers. Also there is an opportunity to build on the
research which has already been conducted on season ticket holders.
Method
Participants
The participants included this study are highly identified fans who attend the Rochester
Red Wings home games. The fans that participated in the study were at random. It was the fans’
choice whether they would like to participate or not, by opting in or out of the survey. Further
details on the population are discussed in the results section of this paper. This way of getting a
sample was by using a convenience sampling method because it was simple to access the desired
fan population (Chen, 2011). There was access to the external population through Mr. Craig, an
account representative. Mr. Craig had sent out the survey to all their season ticket holders and
their fan base.
Measures and Variables
This research collected the thoughts of the highly identified fans. Particularly why the
fans purchase the concessions and merchandise they buy. Using and focusing this research on
variables the Red Wings can control is important when implementing them. The independent
variables include the triggers or reasons as to how fans decide which concessions and
merchandise to purchase. Examples of these triggers can be the aroma of a vendor, advertising,
logos, new merchandise, weather and others. The dependent variables include the type of
BUYING BEHAVIORS 16
vendors used and the physical merchandise in the store. For example if aroma is the main trigger
as to how fans deicide to buy concessions and one vendor has a better smell than the other, the
better smelling vendor will have more sales.
This research focused on the factors outlined in the literature review section which
include merchandise and concessions. The most influential independent variables are stated by
the participants to describe how they decide what concessions and merchandise to buy. The
dependent variables are controlled by the Rochester Red Wings such as the type of vendors that
are available for the fans. After completion of this study, the dependent variables can be adjusted
to attempt to increase sales such as getting a better vendor.
Data Collection Instrument
The collection of data was through a survey distributed to all the season ticket holders
and highly identified fans of the Rochester Red Wings. The design is a cross-sectional/survey
design. A survey is the most cost and time effective way to obtain the information to answer the
research question (Gratton, & Jones, 2010). Other reasons why a survey is beneficial for this type
of research include “accessibility, reduction in bias, anonymity, structured data, and increased
time for respondents” (Gratton, & Jones, 2010, p.129). The survey has breaks in order to help
with flow and separate the two topics, concessions and merchandise. There are a total of three
page breaks throughout. First the fans were asked basic questions to see how often they attend
games and which days of the week they decide to go. This helped to separate fans who don’t
attend games at all, those who only go to a few games or attend a lot of games. The fans, who do
not attend games, were opted out because they couldn’t complete the survey accurately.
As the participants scrolled through the questions, they were able to click and type
answers. The answers are in vertical format instead of the horizontal to create better flow and
BUYING BEHAVIORS 17
space. This survey is simple and quick, consisting of 17 questions. All of the questions are able
to measure frequency in order to gather results. In addition, there are a few questions used for
chi-square analysis. The exact questions that are used for both frequency and chi-square analysis
are discussed in data analysis plan section of this research.
There are options to insert additional comments on what items the fans would like to see
added, any changes and how to better serve them to increase their attendance. There are many
different scales such as “likert, ranking, list, and filter questions” (Gratton, & Jones, 2010, p.134-
136). The questions and the entire layout of the survey are included in this research (see
Appendix A for the survey).
Data Collection Plan
The first step was to type an e-mail and embed a link which the participants had clicked
on to access the survey. In the e-mail it stated the reasons for why the Red Wings are conducting
this survey (see Appendix B for the cover e-mail). After typing the e-mail and embedding the
survey, it was sent to a Red Wing’s account manager to look it over. This e-mail was changed
due to the preference of how the Rochester Red Wings wanted to send it. Pilot testing was
conducted as soon the e-mail was sent to the account manager. The cover email that was sent to
the participants for the pilot testing is included in this research (see Appendix C for cover e-mail
of the pilot testing). Once the account manager approved the survey, they sent it out to all the
season ticket holders at the bottom of a promotional advertisement.
The online questionnaire was sent just as the season started in March and on a Friday.
There was a two week time limit for the participants to answer the survey. Within the two week
time limit there was a follow up on Twitter and Facebook (see Appendix D for Twitter and
Facebook posts). By sending a social media post to the fans, the participants and scope of the
BUYING BEHAVIORS 18
research became more generalized versus just a focused sample. This will be discussed further in
the results and implication sections.
After the survey was closed I collected all of the results and sent a thank you to the
account manager to send to all participants (see Appendix E for the thank you e-mail). The
collection was done using survey software to download the results to an excel spreadsheet. Once
the information was on the excel spreadsheet it was download and analyzed through SPSS
Statics (Gratton, & Jones, 2010).
Data Analysis Plan
The data was organized and summarized into numerical data through using descriptive
statistics. The descriptive statistic, frequency, and inferential statistic, chi-squared, were used to
draw conclusions from the collected data. All of the questions in the survey were analyzed using
frequency. The questions as to why the fans bought concessions because they saw, smelled,
and/or heard something and how many times they purchase concessions, was analyzed by using
chi-square. The merchandise questions analyzed with chi-squared included why do you buy
merchandise and how often do you buy merchandise. How all of these questions were examined
can be found in the results portion of this research.
Results
There are 118 participants who took the survey and 109 of those were deemed useable.
The population was reduced by eliminating all contributors who did not complete the survey.
Using 109 surveyed results is justified as valid because other researchers have used less in the
past. For example, the study Baseball Fans' Motivation: An Investigation of Psychological,
Sociological, and Environmental Factors by Chen in 2011 used only 200 participants. The two
hundred participants were gathered from six different games, in three different stadiums, creating
BUYING BEHAVIORS 19
a large fan base to gather a sample from. This research studied the participants to understand
spending patterns and answer these two questions, how do fans decide what concessions to buy
and how do fans decide what merchandise to buy.
Overview
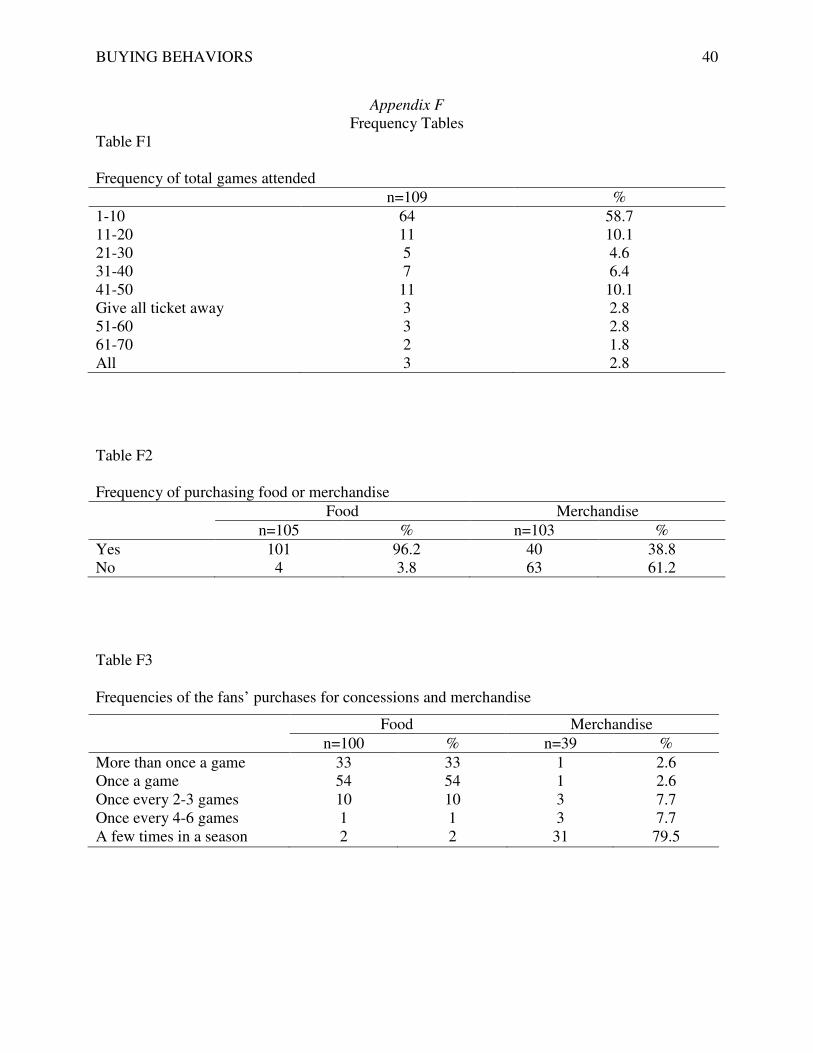
The first frequency table (see Table F1) shows how many total games the majority of
fans surveyed attend. The table shows 58.7 percent of highly identified fans go to at least 1 to 10
games out of the season. This is the majority of the fans, whereas 10.1 percent go to either 11 to
20 games or 41-50 games out of the season. Only 2.8 percent either attend 51-60 games or all of
the games in a season. From this table it shows, most of the fans go to less than half of the games
in one season.
In addition, the results showed 58.7 percent of fans go to weekend games which consist
of Fridays, Saturdays, and/or Sunday games. There are 39.4 percent of fans who attend both
weekday and weekend games. Having more fans attend weekend games only over both weekday
and weekend was expected.
After finding out if the fans attend the games and which days, the next question analyzed
was if they purchased food (see Table F2). A majority of Red Wing respondents answered yes
(96.2 percent) that they did in fact buy food at the games. Then 33.0 percent purchased
concessions more than once a game and 54.0 percent stated they buy food and/or beverages once
a game (see Table F3). Therefore 87.0 percent of fans buy food at least once a game when they
attend.
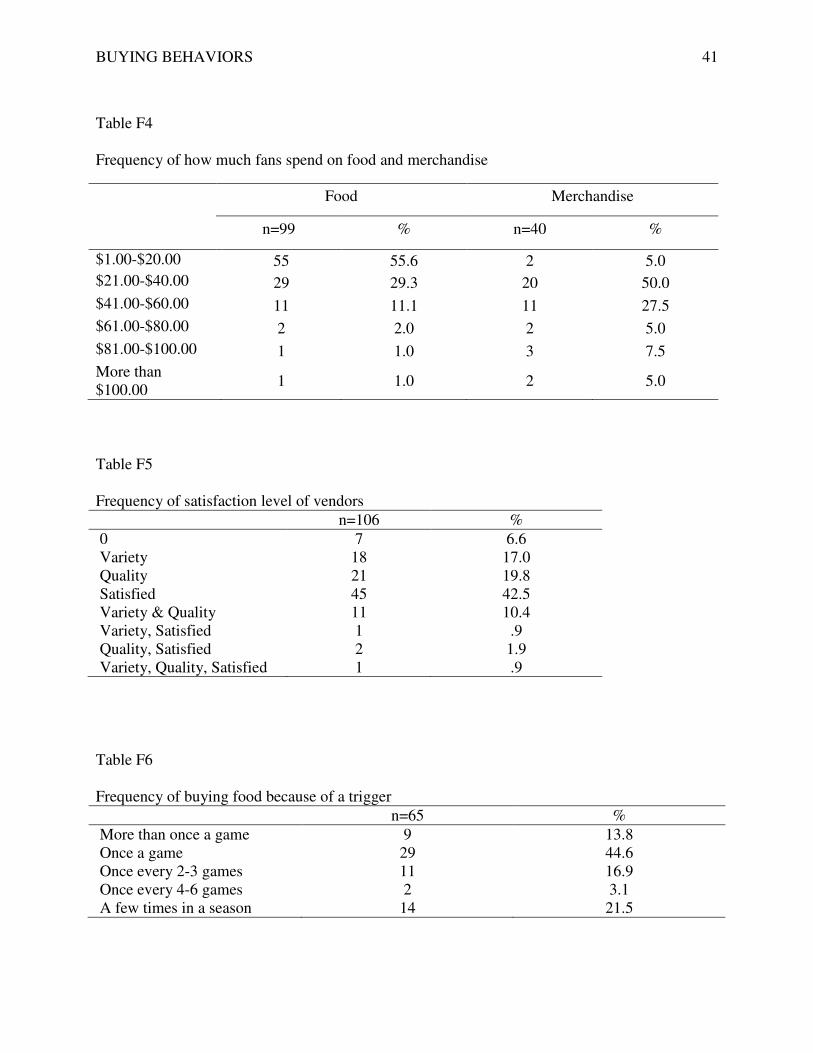
When fans purchase concessions, most of them stay within a range. A majority or 55.6
percent of fans buy $1.00-$20.00 of concessions, 29.3 percent buy $21.00-40.00, and 11.1
percent purchase $41.00-$60.00 (see Table F4). The majority of respondents (96.0 percent)
BUYING BEHAVIORS 20
purchase between $1.00-$60.00 worth of food and/or beverages and 87.0 percent do so at every
game they attend.
There were 42.5 percent of fans who are satisfied with both the quality and variety of
vendors (see Table F5). Compared to17.0 percent said they would like more variety and 19.8
percent of respondents said they want better quality. The Rochester Red Wings have done a good
job of satisfying almost half of the fans with the vendors they use for concessions.
The first general merchandise question analyzed was regarding whether or not the fans
buy merchandise. There is 61.2 percent of respondents who do not buy merchandise and 38.8
percent which do purchase retail goods (see Table F2). This is much different results than the
concessions. Out of the 38.8 percent of fans who do buy merchandise, the majority of them (79.5
percent) only purchase merchandise a few times in a season (see Table F3). In addition, a
combined 77.5 percent of the respondents spend $21.00-$60.00 on merchandise, 50.0 percent
spend $21.00-$40.00 and 27.5 percent spend $41.00-$60.00 (see Table F4). The highly identified
fans spend more money on concessions, on a consistent basis, than they do on merchandise.
Concessions
In this section the results analyzed pertain to the questions which address how fans decide
what concessions to buy. There are triggers that have emerged from the data collected. The
meaning of this data is deliberated later in the discussion portion of this research paper.
The first question asked the respondents if they bought concessions because they heard,
smelled, and/or saw something which reminded them of a vendor. Out of the fans 66.7 percent
said say they did and 33.3 percent stated no they do not. In addition, 44.6 percent said they buy
food and/or beverages every once a game because of this trigger (see Table F6).

BUYING BEHAVIORS 21
The proceeding questions found out which two triggers influenced the respondents the
most when it came to buying concessions from a vendor. Aroma and hunger/thirsty were the
dominate factors. Out of the respondents 50.8 percent said aroma was the reason why they
purchased from a certain vendor. Hunger/Thirsty was also a frequently picked choice, with 41.4
percent of the season fans stating that’s why they bought concessions. In the first chi-square
analysis the comparison was made between fans that attended less than half the games and more
than half of the game with how frequently they purchased food. There was a significant
difference between the amount of games attended and how frequently the fans purchased food
����� =17.752, p<.001. The second chi-squared was to see a correlation between how frequently
do fans purchase concessions because of either advertising and aroma. There was no significant
association between purchase frequency and the two triggers ����� =0.024, p=.877.
Merchandise
Even though there weren’t as many fans who buy merchandise, compared to concessions,
there were triggers that emerged for those who did buy. The results shows 41.7 percent of the
respondents bought merchandise because it was new in the store (see Table F7). The second
highest reason, 13.9 percent of fans, buy merchandise because of the way it’s displayed in the
store.
The fans do not buy for others very often because 64.1 percent said they purchase the
items for themselves. Out of the 35.9 who purchase merchandise for others, 78.6 percent buy for
their child or children and 50.0 percent buy retail items spur of the moment. The last chi-squared
was analyzed for correlation between fans who attend less than half of the games and more than
half the games with how many times they purchase merchandise. There was no significant
BUYING BEHAVIORS 22
association between the how many times a fan goes to a game and how many times they
purchase merchandise ����� =1.812, p=.178.
Discussion and Conclusions
The results support and build upon most of the past literature with these findings. There
are clear reasons as to how most Rochester Red Wing highly identified fans decide what
concessions and merchandise to buy. From these reasons or triggers there are certain buying
behaviors the fans demonstrate.
The fans used in this research are highly identified because they are either season ticket
holders or fans who follow the team on Twitter and/or Facebook. The fans who follow the team
on social media are consider highly identified because they are more involved than fans who
don’t follow the team. The reason why this study is using only fans that are highly identified is
because they are not affected by psychological motivational factors in regards to attendance
(Chen, 2011). The author stated “there is no significant difference in the level of psychological
motivational factors between males and females, age brackets, married and unmarried, employed
and unemployed, and others” (Chen, 2011, p. 176). Since there is no significant difference in the
motivational factors, participants can be looked at as a whole because they are highly identified.
To address the first research question which is, how do fans decide what concessions to
buy? The 33.3 percent, discussed above, shows a large portion has a trigger when buying
concessions. From the results it shows that the fans choose their vendor of choice by their sense
of smell. Therefore having vendors which smell the best to the fans will trigger them to purchase
the concessions. If an unpleasant smell came from a majority of the vendors, there would be a
significant drop in food and/or beverage sales. If the Rochester Red Wings can find the best
smelling vendors and put them in the stadium, it will draw fans to the concessions. Also having
BUYING BEHAVIORS 23
scents, which smell like food, dispersed within the stadium would entice fans to buy concessions.
This study adds to previous literature because there is little to no research conducted on what
triggers a fan to buy concessions and/or merchandise. The trigger of being hungry/thirsty was a
predominate reason as to why fans purchased concessions.
Knowing the fact highly identified fans buy food and/or beverages because they are
hungry or thirsty might not be as surprising as the aroma trigger. Understanding this trigger
effects fans purchases and how to use it to increase sales makes this information beneficial. One
way of using this to the Red Wing’s advantage is by changing the start time of the games.
Having games start before lunch or dinner will help to increase the probability the fans will be
hungry and/or thirsty at the game.
In addition, according to the chi-squared analysis highly identified fans shouldn’t be
treated all the same. There is a significant difference between fans that go to less than 30 games
compared to the fans that go to more than 30 games. According to the results the fans who
purchase most of the concessions are the ones going to fewer games. These fans, which go to
fewer games, might be binging because they have limited opportunity. The fans that go to more
than 30 games might start to become bored with the concessions or start to budget their
spending. Implementing coupons that can be redeemed at the concessions as rewards for coming
to more games would increase the amount spent by fans who consistently attend games. A better
approach would be to use a variable-ratio reinforcement method (Solomon, 2009). This method
is when an organization gives out coupons randomly. By using this fans never know when they
could receive a discount just for walking in the stadium and should increase both concessions
and attendance.

BUYING BEHAVIORS 24
Also the literature review discussed a buying behavior, impulse purchasing, as a way to
describe certain customers. Since the fans are buying based off of the sense of sell and then
making a decision, shows traits of an impulse buyer. Therefore this supports the literature review
on how some consumers make purchasing decisions. Understanding how impulse buyers behave
and knowing the fans are acting on impulse, will help marketers sell to fans more effectively.
The way fans decide how to buy their merchandise, also supports the fact the Red Wing’s fans
are impulse buyers.
When the results were analyzed to answer the second research question which is, how
fans decide what merchandise to buy, different triggers emerged. The most dominate reason as to
why fans buy merchandise is because of new retail items in the store. This means there will be
more sales if the merchandise store has brand new items for fans more often. If they do not have
new items then the sales will suffer. Majority of the fans did not buy merchandise. The cause of
this could be the lack of new items in the store and not as frequently as the fans would like them.
In addition, most fans stated they buy merchandise because of the way it’s displayed in
the store. Having an effective store layout will be helpful when increasing the sale of retail items.
Merchandise is also different because according to the chi-squared fans can be all treated equally
versus separately. It was found highly identified fans who attend less than 30 games and those
who attend more than 30 games all behave similarly when deciding how to purchasing retail
items. Therefore having both new merchandise and an effective display will increase the sales
for all fans. Both of these triggers, new merchandise and display, are again an impulse purchase
behavior. Also fans mentioned when buying for their children, they do so on a spur of the
moment more often than any other reason which supports impulse buying. There were a few
results which fans mentioned what was a trigger for them outside of the reasons provided.
BUYING BEHAVIORS 25
In the results of this study some fans mentioned other items as to which they would
purchase concessions. One of the most common answers was cone head. The employee is a
widely known person within the Rochester Red Wings community. The fans stated seeing and/or
hearing him made them purchase food and/or beverages. Again this supports the reason as to
why majority of the fans are impulse buyers.
Limitations and Future Directions
There are a few weaknesses and holes in this research. First would be the lack of results
received from the fans. If at least 1,000 fans responded it could have changed the results that
were collected or could have been exactly the same. This research only had 109 respondents,
even though the results are still valid, the results could have been more accurate. In addition if
the season ticket holder were the only fans to receive the survey versus highly identified fans, the
research would have been more focused instead of broad.
A suggestion for future research on Rochester Red Wings season ticket holders and fans,
to get the best results, would be to add a promotion or reward to completing the survey. Adding a
reward at the end is an “inducement” and “questionnaires containing a monetary reward produce
better results than ones without” (Gratton, & Jones, 2010, p.147). However adding a reward to
filling out the survey will increase the costs of conducting it. If the Red Wings could find a
sponsor to fund the reward it would cover the cost and have a better response from the ticket
holders. Also another suggestion is to “follow-up” to receive a higher response rate (Gratton &
Jones 2010, p.147). Combining both an inducement method and follow-up method should
increase the response rate. Also having the actual e-mails of the ticket holders would have made
the data collection go a lot more smoothly.
BUYING BEHAVIORS 26
It would be good for further researchers to expand the survey to multiple teams and
compare results. This way the results can show if there is a difference in the buying behaviors of
the fans between the locations of the stadiums. Shortening the survey would be a good idea and
help to code the results better. Some of the fans mentioned triggers which weren’t listed such as
cone head. Some of the fans might have picked that trigger if it was listed with the other triggers
such as aroma and advertising. Finding out certain triggers to a particular population would have
helped.
The Experience
It’s a start of another season and you’re excited for the first game. As you head to the
game you realize what a nice sunny day it is and how hungry you are. The games have changed
their start times right before dinner and you haven’t had the time to eat yet. You walk up to the
gates, hungry, and usher surprises you with a coupon for the concessions. What a great surprise
and exactly what you need right now. As you head to your seat, eager to catch up with your
follow fans, you smell something wonderful. You stop and see a new vender that smells great.
As your stomach groans and you look at your coupon, you think it’s a perfect time to grab some
food and beer.
As you make it back to your seat, you think what a great start to the game because you
have food from a great new vendor. You see your friends and as you start to converse, they all
ask you what that great smell is. You tell them where you purchased the food and how, they then
all immediately get up to get their own. As the game goes on, the seventh inning comes around
and it’s time to stretch your legs. You figure since you didn’t spend so much money on the first
around of food and drinks, you might as well buy some more. As you head towards that great
smelling vendor you pass the merchandise store. The first thing you see perfectly displayed is a

BUYING BEHAVIORS 27
newly designed shirt. Without any hesitation at all you grab two pairs, one for yourself and your
daughter, and buy them.
As you head home you think back to your experience of the home opener. What a great
time you had. You received an unexpected discount for concessions, the team won and you get to
surprise your daughter with a new shirt she will love. Your last thought is if my experience is
going to be this great from now on, I need to find more time to go to more games. Plus you need
to show off how good looking you and daughter will be wearing new matching shirts at the next
game.
BUYING BEHAVIORS 28
References
Armstrong, K. L. (2008). Consumers of color and the "culture" of sport attendance: Exploratory
insights. Sport Marketing Quarterly, 17(4), 218-231.
Beckman, E. M., Cai, W., Esrock, R. M., & Lemke, R. J. (2012). Explaining game-to-game
ticket sales for major league baseball games over time. Journal of Sports Economics,
13(5), 536-553.
Bizman, A., & Yinon, Y. (2002). Engaging in distancing tactics among sport fans: Effects on
self-esteem and emotional responses. The Journal of Social Psychology, 142(3), 381-92.
Boyd, T. C., & Krehbiel, T. C. (2006). An analysis of the effects of specific promotion types on
attendance at major league baseball games. Mid - American Journal of Business, 21(2),
21-32.
Chen, C., Lin, Y., & Chang, W. (2013). Impulsive Purchasing Behavior for Professional Sports
Team-Licensed Merchandise--From the Perspective of Group Effects. Sport Marketing
Quarterly, 22(2), 83-91.
Chen-Yueh, C., Yi-Hsiu, L., & Chia-Lin, H. (2012). Celebrity endorsement for sporting events
using classical conditioning. International Journal Of Sports Marketing & Sponsorship,
13(3), 209-2019.
Chen, S. (2011). Baseball fans' motivation: An investigation of psychological, sociological, and
environmental factors. Retrieved from ProQuest Digital Dissertations. (AAT
865043283).
Chih-Fu, C., Lung Hung, C., & Mei-Yen, C. (2012). Fan participation behaviour in baseball: An
application of the theory of planned behaviour. International Journal of Sports Marketing
& Sponsorship, 14(1), 22-33.

BUYING BEHAVIORS 29
Coates, D., & Humphreys, B. R. (2007). Ticket prices, concessions and attendance at
professional sporting events. International Journal of Sport Finance, 2(3), 161-170.
Drayer, J., Shapiro, S. L., & Lee, S. (2012). Dynamic ticket pricing in sport: An agenda for
research and practice. Sport Marketing Quarterly, 21(3), 184-194.
Drayer, J., Rascher, D. A., & McEvoy, C. D. (2012). An examination of underlying consumer
demand and sport pricing using secondary market data. Sport Management Review,
15(4), 448.
Fink, J. S., Parker, H. M., Brett, M., & Higgins, J. (2009). Off-field behavior of athletes and team
identification: Using social identity theory and balance theory to explain fan reactions.
Journal of Sport Management, 23(2), 142-155.
Fisher, R. J., & Wakefield, K. (1998). Factors leading to group identification: A field study of
winners and losers. Psychology & Marketing, 15(1), 23-40.
Gratton, C., & Jones, I. (2010). Research methods for sports studies (2nd ed.). New York, NY:
Routledge.
Gray, G. T., & Wert-Gray, S. (2012). Customer retention in sports organization marketing:
Examining the impact of team identification and satisfaction with team performance.
International Journal of Consumer Studies, 36(3), 275-281. doi:10.1111/j.1470-
6431.2011.00999.x
Hansen, H. H., & Gauthier, R. R. (1989). Factors affecting attendance at professional sport
events. Journal of Sport Management, 3(1), 15-32.
Kim, J., Jeen-Su Lim, & Bhargava, M. (1998). The role of affect in attitude formation: A
classical conditioning approach. Academy of Marketing Science Journal, 26(2), 143-152.
BUYING BEHAVIORS 30
Krautmann, A. C., & Berri, D. J. (2007). Can we find it at the concessions? Understanding price
elasticity in professional sports. Journal of Sports Economics, 8(2), 183-191.
doi:10.1177/1527002505275093
Kwon, H. (2002). An investigation of the psychosocial and financial factors influencing the
impulse buying of sport team licensed merchandise. Retrieved from ProQuest Digital
Dissertations. (AAT: 305559048).
Kwon, H. H., & Armstrong, K. L. (2002). Factors Influencing Impulse Buying of Sport Team
Licensed Merchandise. Sport Marketing Quarterly, 11(3), 151.
Lachowetz, T., Dees, W., Todd, S., & Ryan, E. (2009). Savannah sand gnats: macro strategies
for using identity to increase attendance in minor league baseball. Sport Marketing
Quarterly, 18(4), 222-227.
Lanzillo, J. D. (2010). The attitudes of minor league baseball fans and team administrators
toward the use of promotions. Retrieved from ProQuest Digital Dissertations. (AAT
756926967).
Laverie, D. A., & Arnett, D. B. (2000). Factors affecting fan attendance: The influence of
identity salience and satisfaction. Journal of Leisure Research, 32(2), 225-246.
Limbad, S. J. (2013). The application of classical conditioning theory in advertisements.
International Journal of Marketing and Technology, 3(4), 197-207.
Marburger, D. R. (1997). Optimal ticket pricing for performance goods. Managerial and
Decision Economics, 18(5), 375-381.
McDonald, H., & Stavros, C. (2007). A defection analysis of lapsed season ticket holders: A
consumer and organizational study. Sport Marketing Quarterly, 16(4), 218-229.

BUYING BEHAVIORS 31
McDonald, M., & Rascher, D. (2000). Does bat day make cents? The effect of promotions on the
demand for major league baseball. Journal of Sport Management, 14(1), 8-27.
Price, D. I., & Sen, K. C. (2003). The demand for game day attendance in college football: An
analysis of the 1997 division 1-A season. Managerial and Decision Economics, 24(1),
35-46.
Rascher, D. A., McEvoy, C. D., Nagel, M. S., & Brown, M. T. (2007). Variable Ticket Pricing in
Major League Baseball. Journal of Sport Management, 21(3), 407-437.
Sargeant, D. (2012). Place bonding, fan identification, nostalgia and fenway's future:
Observations about red sox nation. Retrieved from ProQuest Digital Dissertations. (AAT
1369519692).
Seo, W. J. (2010). Understanding the impact of visual image and communication style on
consumers' response to sport advertising and brand: A cross-cultural comparison.
Retrieved from ProQuest Digital Dissertations. (AAT: 756926967).
Shapiro, S. L., & Drayer, J. (2012). A new age of demand-based pricing: An examination of
dynamic ticket pricing and secondary market prices in major league baseball. Journal of
Sport Management, 26(6), 532-546.
Tom, G. (1995). Classical conditioning of unattended stimuli. Psychology & Marketing (1986-
1998), 12(1), 79.
Solomon, M. R., (8 Eds.). (2009). Consumer Behavior: Buying, Having and Being. New Jersey,
NY: Pearson Prentice Hall.
Wang, C. (2012). The impact of self-congruity and identification on consumers' purchase
intention for character licensed merchandise. Retrieved from ProQuest Digital
Dissertations. (AAT: 1040782303).
BUYING BEHAVIORS 32
Appendix A
Survey
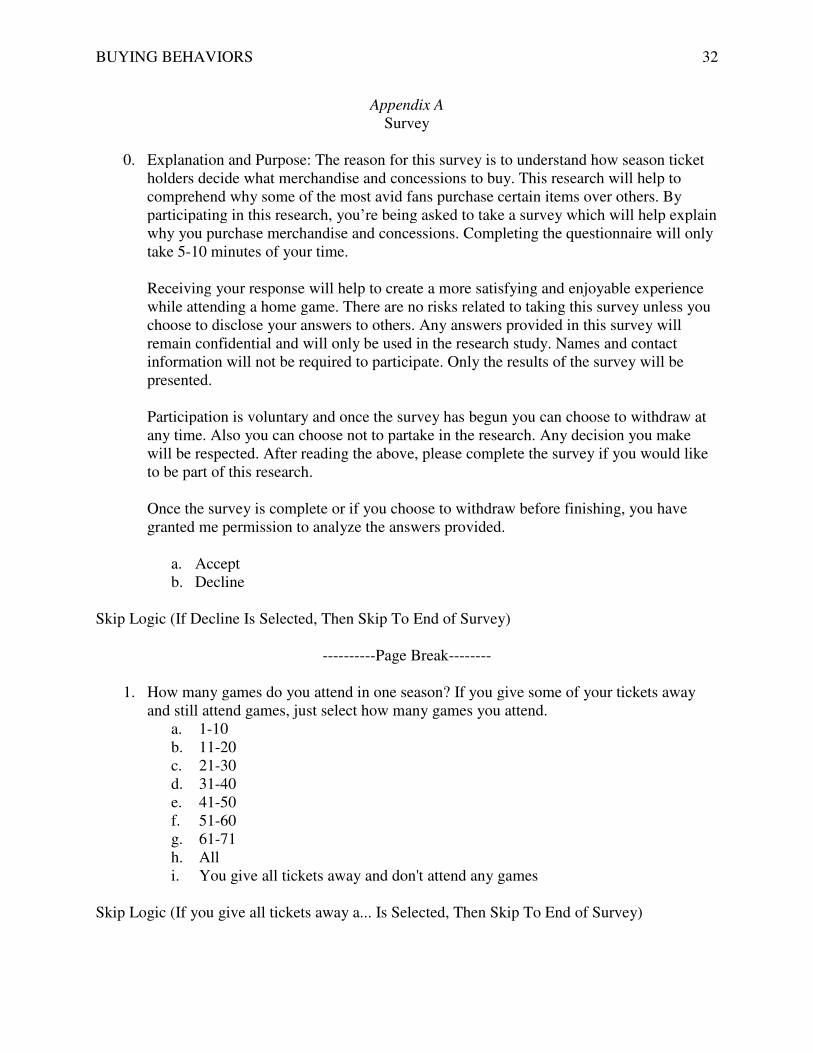
0. Explanation and Purpose: The reason for this survey is to understand how season ticket holders decide what merchandise and concessions to buy. This research will help to comprehend why some of the most avid fans purchase certain items over others. By participating in this research, you’re being asked to take a survey which will help explain why you purchase merchandise and concessions. Completing the questionnaire will only take 5-10 minutes of your time. Receiving your response will help to create a more satisfying and enjoyable experience while attending a home game. There are no risks related to taking this survey unless you choose to disclose your answers to others. Any answers provided in this survey will remain confidential and will only be used in the research study. Names and contact information will not be required to participate. Only the results of the survey will be presented. Participation is voluntary and once the survey has begun you can choose to withdraw at any time. Also you can choose not to partake in the research. Any decision you make will be respected. After reading the above, please complete the survey if you would like to be part of this research. Once the survey is complete or if you choose to withdraw before finishing, you have granted me permission to analyze the answers provided.
a. Accept b. Decline
Skip Logic (If Decline Is Selected, Then Skip To End of Survey)
----------Page Break--------
1. How many games do you attend in one season? If you give some of your tickets away and still attend games, just select how many games you attend.
a. 1-10 b. 11-20 c. 21-30 d. 31-40 e. 41-50 f. 51-60 g. 61-71 h. All i. You give all tickets away and don't attend any games
Skip Logic (If you give all tickets away a... Is Selected, Then Skip To End of Survey)
BUYING BEHAVIORS 33
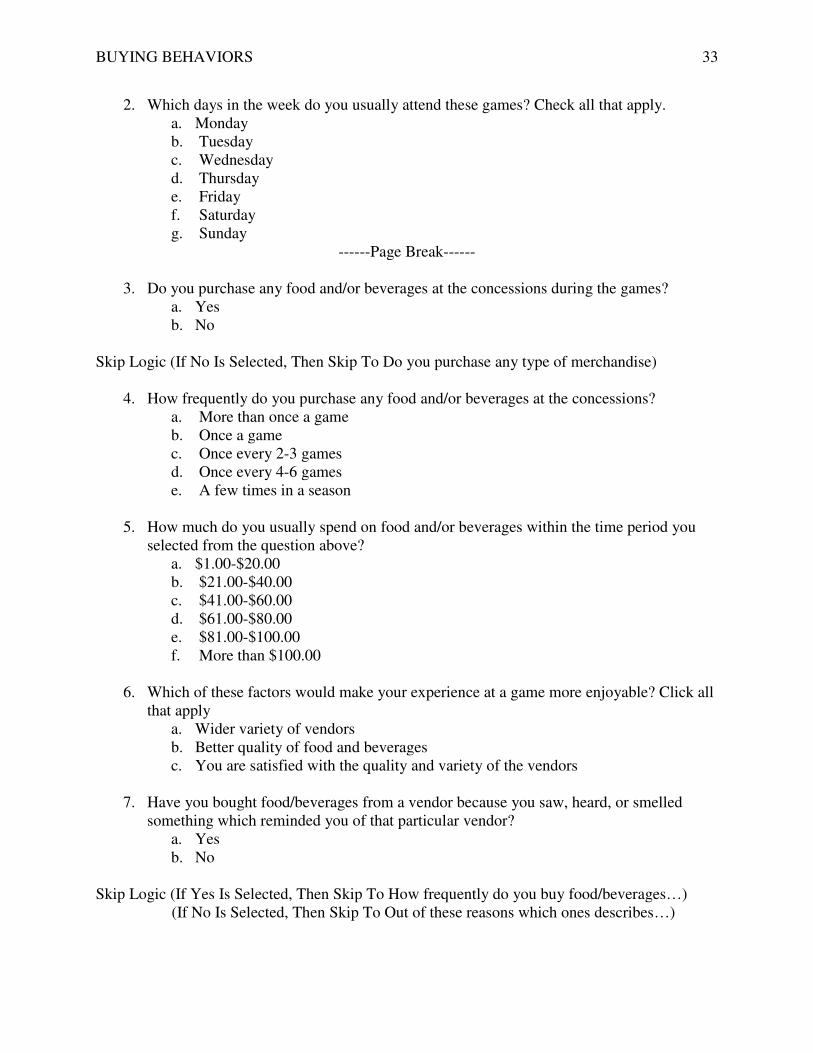
2. Which days in the week do you usually attend these games? Check all that apply. a. Monday b. Tuesday c. Wednesday d. Thursday e. Friday f. Saturday g. Sunday
------Page Break------
3. Do you purchase any food and/or beverages at the concessions during the games? a. Yes b. No
Skip Logic (If No Is Selected, Then Skip To Do you purchase any type of merchandise)
4. How frequently do you purchase any food and/or beverages at the concessions? a. More than once a game b. Once a game c. Once every 2-3 games d. Once every 4-6 games e. A few times in a season
5. How much do you usually spend on food and/or beverages within the time period you
selected from the question above? a. $1.00-$20.00 b. $21.00-$40.00 c. $41.00-$60.00 d. $61.00-$80.00 e. $81.00-$100.00 f. More than $100.00
6. Which of these factors would make your experience at a game more enjoyable? Click all
that apply a. Wider variety of vendors b. Better quality of food and beverages c. You are satisfied with the quality and variety of the vendors
7. Have you bought food/beverages from a vendor because you saw, heard, or smelled
something which reminded you of that particular vendor? a. Yes b. No
Skip Logic (If Yes Is Selected, Then Skip To How frequently do you buy food/beverages…)
(If No Is Selected, Then Skip To Out of these reasons which ones describes…)

BUYING BEHAVIORS 34
8. How frequently do you buy food/beverages from a vendor because you saw, heard, or smelled something which reminded you of the particular vendor?
a. More than once a game b. Once a game c. Once every 2-3 games d. Once every 4-6 games e. A few times in a season
9. Which choices remind you of a particular vendor and then you purchase from that
vendor? Click all that apply. a. Advertisements of the vendor on the big screen b. The aroma of a particular concession c. Hearing a jingle for a concession d. Seeing a concession's logo e. Other (Enter Answer)
10. Out of these reasons which ones describes why you purchase concessions? Click all that
apply a. You enjoy a certain vendor b. People you're with want to eat c. You enjoy trying new concessions d. Hungry/thirsty e. Other (Enter Answer)
-----Page Break----
11. Do you purchase any type of merchandise at games?
a. Yes b. No
Skip Logic (If No Is Selected, Then Skip To End of Survey)
12. How frequently do you purchase any type of merchandise at games? a. More than once a game b. Once a game c. Once every 2-3 a games d. Once every 4-6 games e. A few times in a season
13. How much do you usually spend on merchandise?
a. $1.00-$20.00 b. $21.00-$40.00 c. $41.00-$60.00 d. $61.00-$80.00 e. $81.00-$100.00 f. More than $100.00
BUYING BEHAVIORS 35
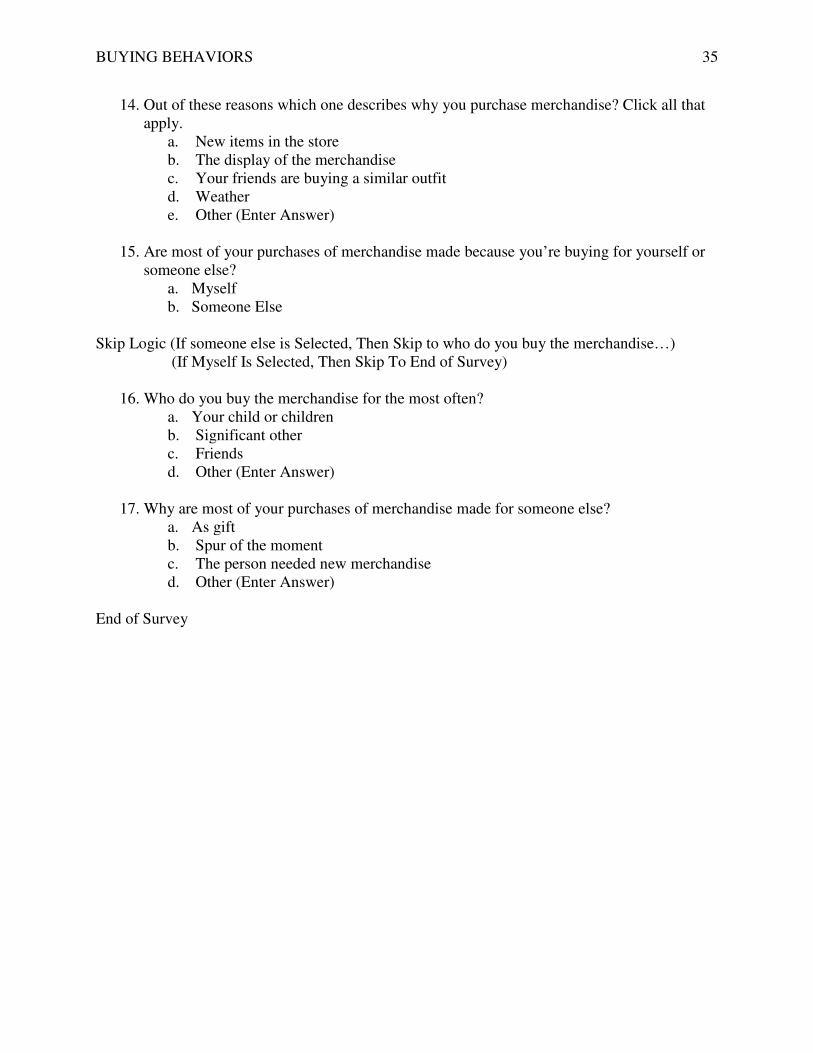
14. Out of these reasons which one describes why you purchase merchandise? Click all that apply.
a. New items in the store b. The display of the merchandise c. Your friends are buying a similar outfit d. Weather e. Other (Enter Answer)
15. Are most of your purchases of merchandise made because you’re buying for yourself or
someone else? a. Myself b. Someone Else
Skip Logic (If someone else is Selected, Then Skip to who do you buy the merchandise…)
(If Myself Is Selected, Then Skip To End of Survey)
16. Who do you buy the merchandise for the most often? a. Your child or children b. Significant other c. Friends d. Other (Enter Answer)
17. Why are most of your purchases of merchandise made for someone else?
a. As gift b. Spur of the moment c. The person needed new merchandise d. Other (Enter Answer)
End of Survey
BUYING BEHAVIORS 36
Appendix B
Cover E-mail
From: (Sport Team) Subject: (Sport Team) Customer Feedback Survey Dear Season Ticket Holder, I want to thank you in advance for taking the time to help improve the (Sport Team) organization. By taking this survey it will benefit you because the (Sport Team) will be able to better serve you, make adjustments to fit your needs, and improve your overall experience at games. This survey will take a brief 5 to 10 minutes of your time. To access the survey, click the link at the bottom or cut and paste the URL into your browser. The survey will expire (date 2 weeks) so don’t miss the chance to voice your opinion. You’re a valuable fan and you’re part of a select group who will receive this survey. Again we appreciate your feedback. Click here to access survey: URL If you have any questions please contact the researcher, Stephen Castro, at [email protected] or the research advisor, Dr. Dane, at [email protected]. Thank you, (Sport Team)

BUYING BEHAVIORS 37
Appendix C
Pilot Test E-mail
From: Stephen Castro (Myself) Subject: Pilot Test: (Sport Team) Customer Feedback Survey Good Afternoon, I want to thank you in advance for taking the time to help improve my survey. By participating in this survey and providing your feedback, will point out any areas I have overlooked. The survey was designed universally so it can be sent to any team’s season ticket holders. The two sport teams I’m considering is the Rochester Knighthawks and Rochester Red Wings. This survey will take a brief 5 to 10 minutes of your time. To access the survey, click the link at the bottom or cut and paste the URL into your browser. When you have a moment please send any suggestions to my e-mail below. Please send any suggestions to me via e-mail. Again I appreciate your feedback. Click here to access survey: URL If you have any questions please contact me at [email protected] or my research advisor, Dr. Dane, at [email protected]. Thank you, Stephen Castro (My name)
BUYING BEHAVIORS 38
Appendix D
Twitter and Facebook post
Twitter Post @RocRedWings Hey Rochester Red Wings fans I’m looking for your help. Please take the
survey below. Thanks! https://sjfc.co1.qualtrics.com/SE/?SID=SV_2coeFwi8EAlxVPv
@RochRedWings Hey Rochester Red Wings fans I’m looking for your help. Please take the
survey below. Thanks! https://sjfc.co1.qualtrics.com/SE/?SID=SV_2coeFwi8EAlxVPv
Facebook Post
Hey Rochester Red Wings fans I’m looking for your help. Please take the survey below. Thanks!
https://sjfc.co1.qualtrics.com/SE/?SID=SV_2coeFwi8EAlxVPv

BUYING BEHAVIORS 39
Appendix E
Thank you e-mail From: (Sport Team) Subject: (Sport Team): Thank You Dear Season Ticket Holder, I want to thank you for taking the time to help improve the (Sport Team) organization. By taking this survey it has benefited you and the (Sport Team) because we will be able to better serve you while improving your overall experience at games. You’re a valuable fan and again we appreciate your feedback. Thank you, (Sport Team)
BUYING BEHAVIORS 40
Appendix F
Frequency Tables Table F1 Frequency of total games attended
n=109 %
1-10 64 58.7 11-20 11 10.1 21-30 5 4.6 31-40 7 6.4 41-50 11 10.1 Give all ticket away 3 2.8 51-60 3 2.8 61-70 2 1.8 All 3 2.8
Table F2 Frequency of purchasing food or merchandise
Food Merchandise
n=105 % n=103 %
Yes 101 96.2 40 38.8 No 4 3.8 63 61.2
Table F3 Frequencies of the fans’ purchases for concessions and merchandise
Food Merchandise
n=100 % n=39 %
More than once a game 33 33 1 2.6 Once a game 54 54 1 2.6 Once every 2-3 games 10 10 3 7.7 Once every 4-6 games 1 1 3 7.7 A few times in a season 2 2 31 79.5
BUYING BEHAVIORS 41
Table F4 Frequency of how much fans spend on food and merchandise
Food Merchandise
n=99 % n=40 %
$1.00-$20.00 55 55.6 2 5.0
$21.00-$40.00 29 29.3 20 50.0
$41.00-$60.00 11 11.1 11 27.5
$61.00-$80.00 2 2.0 2 5.0
$81.00-$100.00 1 1.0 3 7.5
More than $100.00
1 1.0 2 5.0
Table F5 Frequency of satisfaction level of vendors
n=106 %
0 7 6.6 Variety 18 17.0 Quality 21 19.8 Satisfied 45 42.5 Variety & Quality 11 10.4 Variety, Satisfied 1 .9 Quality, Satisfied 2 1.9 Variety, Quality, Satisfied 1 .9
Table F6 Frequency of buying food because of a trigger
n=65 %
More than once a game 9 13.8 Once a game 29 44.6 Once every 2-3 games 11 16.9 Once every 4-6 games 2 3.1 A few times in a season 14 21.5
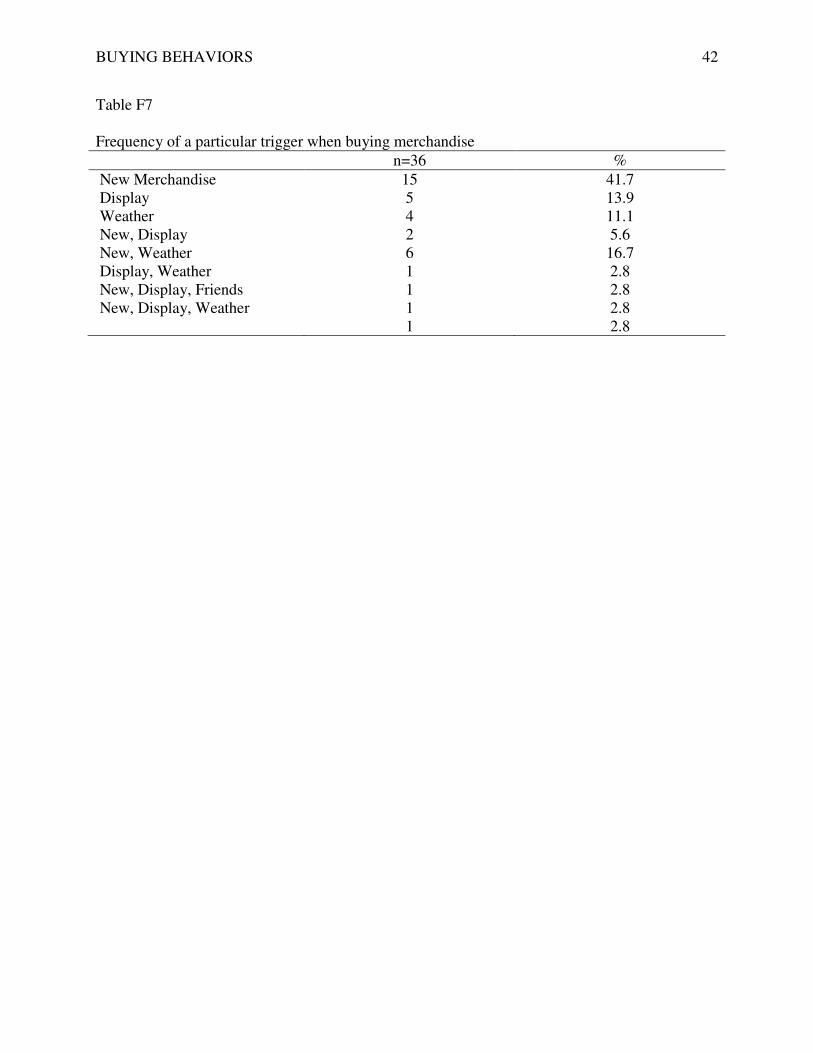
BUYING BEHAVIORS 42
Table F7 Frequency of a particular trigger when buying merchandise
n=36 %
New Merchandise 15 41.7 Display 5 13.9 Weather 4 11.1 New, Display 2 5.6 New, Weather 6 16.7 Display, Weather 1 2.8 New, Display, Friends 1 2.8 New, Display, Weather 1 2.8 1 2.8
Related Documents