Understanding Public Knowledge and Attitudes towards Trafficking in Human Beings Research Paper | Part 1 | October 2014 Dr Kiril Sharapov Center for Policy Studies | Central European University

Welcome message from author
This document is posted to help you gain knowledge. Please leave a comment to let me know what you think about it! Share it to your friends and learn new things together.
Transcript
Understanding Public Knowledge and Attitudes towards Trafficking in Human Beings
Research Paper | Part 1 | October 2014
Dr Kiril Sharapov
Center for Policy Studies | Central European University

Dr Kiril Sharapov Central European University | Glasgow Caledonian University
Understanding Public Knowledge and Attitudes towards Trafficking in Human Beings
Research Paper | Part 1 | October 2014 1
Suggested citation:
Sharapov, K. (2014) Understanding Public Knowledge and Attitudes towards Trafficking in Human Beings: Research Paper. Part 1. Budapest: Center for Policy Studies, Central European University
This research received funding from the People Programme (Marie Curie Actions) of the European Union's Seventh Framework Programme FP7/2007-2013/ under REA grant agreement n° [PIEF-GA-2011-298401].
Art work on the front cover: left corner image - ’A Gift from Heaven’ by Jiao Xingtao. Both images photo courtesy of Kiril Sharapov 1
Kiril Sharapov is Marie Curie Research Fellow at the Center for Policy Studies, Central European University in Budapest, Hungary, on research leave (2013 – 2014) from Glasgow Caledonian University, United Kingdom, where he holds a position as Lecturer in Sociology. Having secured funding from the European Commission, he is currently leading a two-year project investigating public understanding of human trafficking in Hungary, Ukraine and the UK.
Kiril holds an MA in Human Rights from Central European University, and a PhD in Politics from the University of Glasgow.
UP-‐KAT | Kiril Sharapov | Research Report | Part 1 | October 2014 (version 1) 1
Table of Contents Preface ....................................................................................................................................................................... 3 Introduction ............................................................................................................................................................... 4 Human trafficking as a (very specific) issue of concern ............................................................................................. 6 Public opinion and human trafficking ........................................................................................................................ 7 What is public opinion? .......................................................................................................................................... 7 Defining public opinion .......................................................................................................................................... 9 The ability of the general public to arrive at meaningful decisions about complex social phenomena ................ 9 How public opinion is formed, how and to what extent it depends on the nature of information received from political leaders and the media ..............................................................................................................................
9
The relationship between public opinion and policy ............................................................................................. 10 Studying public opinion: methodological issues ........................................................................................................ 10 UP-‐KAT survey methodology ................................................................................................................................. 11 Development of the survey instrument ................................................................................................................. 12 In your own words, describe what you think ‘human trafficking’ is? ........................................................................ 14 Ukraine ................................................................................................................................................................... 15 Hungary .................................................................................................................................................................. 17 Great Britain ........................................................................................................................................................... 21 Comparing responses from Ukraine, Hungary and Great Britain ........................................................................... 24 Unclassified: misconceptions and uncategorised responses ................................................................................. 27 ‘How did you get to know about human trafficking?’ ............................................................................................... 28 Conclusions (part 1) ................................................................................................................................................... 29 References (part 1) .................................................................................................................................................... 32 Annex 1: Survey questionnaire .................................................................................................................................. 35 Annex 2: Country background Information ............................................................................................................... 37 Key socio-‐economic indicators ............................................................................................................................... 37 Migration Profiles ................................................................................................................................................... 40 Human Trafficking Data ......................................................................................................................................... 44 References (Annex 2) ................................................................................................................................................ 48
List of Tables Table 1.1: Case-‐study country survey methodological details Table 1.2: Key codes and code associations for the Ukrainian dataset (N=1,010, age 15-‐59) Table 1.3: Key codes and code associations for the Hungarian dataset (N=1,007, age 18+) Table 1.4: Key codes and code associations for the Great Britain’s dataset (N=994, age 16+) Table 1.5: ‘What does human trafficking mean?’ – (indicatively) comparing national responses Table 1.6: How respondents got to know about human trafficking (national samples, N=693, age: 18-‐59) Table A.1: Population dynamics in Ukraine, Hungary, and the United Kingdom (2007 – 2012) Table A.2: Life expectancy at birth (2007, 2011) Table A.3: GNI per capita, Atlas method (current US dollars, 200, 2012) Table A.4: Levels of unemployment (in % of total labour force, 2007, 2011) Table A.5: Human development indicators in Ukraine, Hungary and the UK (2013 Human Development Report) Table A.6: Net Migration in Ukraine, Hungary and the United Kingdom (2009-‐2013) Table A.7: Attitudes towards Immigration in Ukraine as recorded by the European Social Survey (2004, 2010, 2012 waves) Table A.8: Number of identified and presumed victims (per 100 000 inhabitants, Eurostat 2013) Table A.9: Number of identified and presumed (in brackets) victims in the UK and Hungary by form of exploitation (2008 – 2010, Eurostat 2013) Table A.10: Number of suspected traffickers in the EU by citizenship (including the UK, Hungary, EU total and nationalities with the number of suspected traffickers exceeding 300 in 2010, Eurostat 2013) Table A.11: Victims of Trafficking as assessed by the 2012 UNODC’s Global Report on Trafficking in Persons
List of Figures Figure 1.1: Map of case-‐study countries Figure 1.2: Human trafficking: policy and legal frameworks (in countries with defined anti-‐trafficking agendas) Figure 1.3: What is human trafficking? Key codes and associations identified in the Ukrainian dataset Figure 1.4: What is human trafficking? Key codes and associations identified in the Hungarian Dataset
UP-‐KAT | Kiril Sharapov | Research Report | Part 1 | October 2014 (version 1) 2
Figure 1.5: ‘I do not know what human trafficking is/have no opinion’ and respondents’ employment status (HU dataset) Figure 1.6: ‘I do not know what human trafficking is/have no opinion’ and respondents’ age (HU dataset) Figure 1.7: ‘I do not know what human trafficking is/have no opinion’ and respondents’ social grade (HU dataset) Figure 1.8: ‘I do not know what human trafficking is/have no opinion’ and respondents’ gender (Hu dataset) Figure 1.9: What is human trafficking? Key codes and associations identified in the dataset for Great Britain Figure 1.10: ‘I do not know what human trafficking is/have no opinion’ and respondents’ social grade (GB dataset) Figure 1.11: ‘I do not know what human trafficking is/have no opinion’ and respondents’ age (GB dataset) Figure 1.12: ‘I do not know what human trafficking is/have no opinion’ and respondents’ working status (GB Dataset) Figure 1.13: ‘I do not know what human trafficking is/have no opinion’ and respondents’ gender (GB dataset) Figure 1.14: How respondents got to know about human trafficking (national samples, N=693, age: 18-‐59)
Abbreviations and acronyms HU Hungary GB Great Britain UK United Kingdom UA Ukraine THB Trafficking in Human Beings

UP-‐KAT | Kiril Sharapov | Research Report | Part 1 | October 2014 (version 1) 3
Preface Despite Europe being a major thoroughfare for human trafficking and exploited labour that enables many European consumers to live ‘the good life’, research presented in this paper shows that many citizens do not understand human trafficking, nor do they see it as a problem in their everyday lives. Over the last decade, human trafficking has become a policy priority for governments in all European countries, for non-‐governmental organizations that provide services to victims of trafficking, and for researchers attempting to assess its magnitude. However, little is still known about how many people are trafficked into and exploited within Europe, and how many people are exploited across national economies without being trafficked in the first place. Little is also known about public understanding of human trafficking and public attitudes towards this phenomenon. This study addresses a gap in knowledge in this field and highlights differences in the levels of awareness of human trafficking among the general public in Great Britain, Ukraine, and Hungary. It relies on representative surveys of public understanding and attitudes towards human trafficking in these countries, which represent one of the many trafficking routes from Eastern into Central and Western Europe. The surveys were completed between December 2013 and January 2014. The study suggests that although citizens think that human trafficking is a problem in their countries, they do not consider it to be a problem that affects them directly. Among survey respondents aged between 18 and 59, about 9% in Ukraine, 19% in Hungary, and 17% in Great Britain could not explain what human trafficking was. This is an alarming finding given the ongoing media and political brouhaha surrounding human trafficking and ‘modern day slavery’. These figures, however, are not surprising. Research presented here demonstrates that politicians in many countries, including Hungary and the UK, construct a very specific vision of trafficking as having no immediate and obvious links to the daily lives of ordinary citizens and consumers. This is despite the increasing evidence of European companies’ reliance on exploited labour not only in Europe but also beyond the European borders through poorly regulated practices of offshoring and subcontracting, to deliver a consumerist aspiration of ‘living well for less’. The majority of respondents in the study found that trafficking was a problem in their own countries: in Ukraine, about 73% of respondents aged between 18 and 59 thought trafficking was a problem in their country; 64% of respondents in Hungary thought so; and 77% of respondents in Great Britain. At the same time, the majority of respondents did not consider human trafficking to be a problem affecting them directly: 75% in Ukraine did not think trafficking affected them directly; 81% in Hungary did not consider trafficking as relevant to their everyday life; and 72% of respondents in Great Britain were not concerned about human trafficking as affecting them directly. Labour and sexual exploitation is not restricted to 4,474 ‘registered victims coming into contact with the authorities’ in the United Kingdom, or 250 in Hungary in 2010-‐2012 – the latest figures released by the European Commission in its 2014 Eurostat report on human trafficking (Eurostat 2014: 23). People who have not been trafficked – including migrant workers already in Europe and people moving across borders as far as Southeast Asia – join nationals of countries with non-‐existent or poorly enforced standards of health and safety to work for a pittance at factories, mines, in the fields, on fishing boats, oil rigs, etc. that are part of supply chains delivering consumer goods to Western markets. These workers face threats, abuse, violence, and withheld wages -‐ even if they are not trafficked. Within this context, it appears to be convenient for Western governments to talk about the individualized problem of slavery rather than admit that consumers, companies and governments themselves may be implicated in the exploitation of others for the benefit of our good life. Recent initiatives to raise awareness of human trafficking and exploitation of workers following a series of high-‐profile cases (including deadly factory fires and collapses in Bangladesh) may not be effective since the majority of the general public in European countries, although sympathetic, may not consider human trafficking and exploitation as relevant to their everyday lives. This research report presents key findings of the study along with some background information highlighting the complexity of the relationship between public opinion, government policies and other anti-‐trafficking ‘stakeholders1’.
1 The use of the term ‘stakeholders’ despite its seeming neutrality and indication of inclusiveness remains contested since, in most cases, it appears to imply an equal footing in accessing and influencing policies and debates disregarding important power contestations, which shape access to and control of policy-‐making and implementation processes

UP-‐KAT | Kiril Sharapov | Research Report | Part 1 | October 2014 (version 1) 4
‘Politicians thanks to mass democracy and mass education, possess unlimited opportunities to manipulate public opinion, although they themselves directly depend on attitudinal changes in mass society and can be destroyed by them’
(Donskis 2014: 5) ‘Politics is the art of the possible, and public opinion is one of the factors that define the limits of possibility’
(Hough and Roberts 2005: 16)
Introduction The purpose of this research report is to present headline results of the research project ‘Understanding Public Knowledge and Attitudes towards Trafficking in Human Beings’, which explores public understanding of human trafficking in the three case-‐study countries: Ukraine, Hungary and Great Britain. The project was undertaken by Dr Kiril Sharapov, Marie Curie Fellow at the Centre for Policy Studies, Central European University, supported by funding from the People Programme (Marie Curie Actions) of the European Union's Seventh Framework Programme FP7/2007-‐2013/ under REA grant agreement n° [PIEF-‐GA-‐2011-‐298401]. This paper discusses the outcomes of representative surveys of public opinion in the three case study countries -‐ Ukraine, Hungary and Great Britain. These surveys were undertaken by national market research agencies in December 2013 – January 2014, and included nationwide, random-‐sampled and population-‐weighted samples each consisting of 1,000 respondents. This report refers to the ‘United Kingdom’ when discussing legislation, policies, and anti-‐trafficking activities enacted by the Government of the United Kingdom. In discussing the outcomes of the survey research, the report refers to ‘Great Britain’ since the representative survey sample covered England, Scotland, and Wales and their associated islands, and did not include Northern Ireland. The three case study countries represent one of the trafficking ‘routes’ into Western Europe: Ukraine as a country of origin, Hungary as predominantly a country of transit, and the United Kingdom as a country of destination. Over recent years, however, the origin/transit/destination division has become less representative of the actual complexity of the movements of people trafficked within and outside of Europe with traditional countries of origin increasingly becoming both transit and destination countries (Aronowitz 2001). In addition, further evidence has been emerging of trafficked people originating from countries traditionally regarded as destination countries for human trafficking, including the UK (NCA 2014), and of the increasing incidence of internal trafficking2 (ibid.) Figure 1.1: Map of case-‐study countries3
The paper is divided into 4 parts. Part 1 provides an overview of some of key theoretical and methodological considerations in relation to public opinion research, and the link between public opinion and public policies. It includes an overview of the survey methodology, and reviews responses to the survey’s open-‐ended question, which asked respondents to describe, in their own words, what they understood human trafficking to be. It also includes an overview of which sources of information informed respondents’ knowledge of human trafficking.
2 The UK National Crime Agency’s strategic assessment of the nature and scale of human trafficking in 2013 identifies the UK as number 3 of the ‘most prevalent countries of origin of all potential victims of trafficking identified in 2013’ (after Romania and Poland) with 193 potential UK victims (NCA 2014, pp. 6-‐7) 3 Generated using http://philarcher.org/diary/2013/euromap/
Ukraine
Hungary
United.Kingdom.
UP-‐KAT | Kiril Sharapov | Research Report | Part 1 | October 2014 (version 1) 5
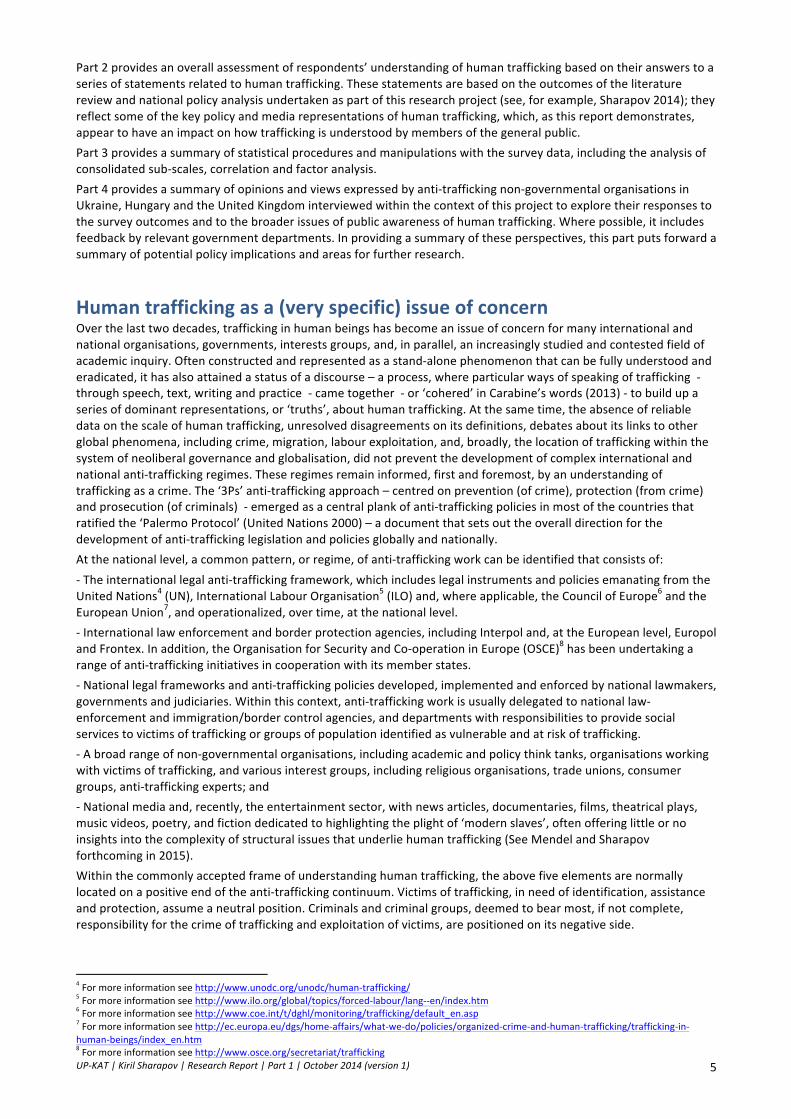
Part 2 provides an overall assessment of respondents’ understanding of human trafficking based on their answers to a series of statements related to human trafficking. These statements are based on the outcomes of the literature review and national policy analysis undertaken as part of this research project (see, for example, Sharapov 2014); they reflect some of the key policy and media representations of human trafficking, which, as this report demonstrates, appear to have an impact on how trafficking is understood by members of the general public. Part 3 provides a summary of statistical procedures and manipulations with the survey data, including the analysis of consolidated sub-‐scales, correlation and factor analysis. Part 4 provides a summary of opinions and views expressed by anti-‐trafficking non-‐governmental organisations in Ukraine, Hungary and the United Kingdom interviewed within the context of this project to explore their responses to the survey outcomes and to the broader issues of public awareness of human trafficking. Where possible, it includes feedback by relevant government departments. In providing a summary of these perspectives, this part puts forward a summary of potential policy implications and areas for further research.
Human trafficking as a (very specific) issue of concern Over the last two decades, trafficking in human beings has become an issue of concern for many international and national organisations, governments, interests groups, and, in parallel, an increasingly studied and contested field of academic inquiry. Often constructed and represented as a stand-‐alone phenomenon that can be fully understood and eradicated, it has also attained a status of a discourse – a process, where particular ways of speaking of trafficking -‐ through speech, text, writing and practice -‐ came together -‐ or ‘cohered’ in Carabine’s words (2013) -‐ to build up a series of dominant representations, or ‘truths’, about human trafficking. At the same time, the absence of reliable data on the scale of human trafficking, unresolved disagreements on its definitions, debates about its links to other global phenomena, including crime, migration, labour exploitation, and, broadly, the location of trafficking within the system of neoliberal governance and globalisation, did not prevent the development of complex international and national anti-‐trafficking regimes. These regimes remain informed, first and foremost, by an understanding of trafficking as a crime. The ‘3Ps’ anti-‐trafficking approach – centred on prevention (of crime), protection (from crime) and prosecution (of criminals) -‐ emerged as a central plank of anti-‐trafficking policies in most of the countries that ratified the ‘Palermo Protocol’ (United Nations 2000) – a document that sets out the overall direction for the development of anti-‐trafficking legislation and policies globally and nationally. At the national level, a common pattern, or regime, of anti-‐trafficking work can be identified that consists of: -‐ The international legal anti-‐trafficking framework, which includes legal instruments and policies emanating from the United Nations4 (UN), International Labour Organisation5 (ILO) and, where applicable, the Council of Europe6 and the European Union7, and operationalized, over time, at the national level. -‐ International law enforcement and border protection agencies, including Interpol and, at the European level, Europol and Frontex. In addition, the Organisation for Security and Co-‐operation in Europe (OSCE)8 has been undertaking a range of anti-‐trafficking initiatives in cooperation with its member states. -‐ National legal frameworks and anti-‐trafficking policies developed, implemented and enforced by national lawmakers, governments and judiciaries. Within this context, anti-‐trafficking work is usually delegated to national law-‐enforcement and immigration/border control agencies, and departments with responsibilities to provide social services to victims of trafficking or groups of population identified as vulnerable and at risk of trafficking. -‐ A broad range of non-‐governmental organisations, including academic and policy think tanks, organisations working with victims of trafficking, and various interest groups, including religious organisations, trade unions, consumer groups, anti-‐trafficking experts; and -‐ National media and, recently, the entertainment sector, with news articles, documentaries, films, theatrical plays, music videos, poetry, and fiction dedicated to highlighting the plight of ‘modern slaves’, often offering little or no insights into the complexity of structural issues that underlie human trafficking (See Mendel and Sharapov forthcoming in 2015). Within the commonly accepted frame of understanding human trafficking, the above five elements are normally located on a positive end of the anti-‐trafficking continuum. Victims of trafficking, in need of identification, assistance and protection, assume a neutral position. Criminals and criminal groups, deemed to bear most, if not complete, responsibility for the crime of trafficking and exploitation of victims, are positioned on its negative side.
4 For more information see http://www.unodc.org/unodc/human-‐trafficking/ 5 For more information see http://www.ilo.org/global/topics/forced-‐labour/lang-‐-‐en/index.htm 6 For more information see http://www.coe.int/t/dghl/monitoring/trafficking/default_en.asp 7 For more information see http://ec.europa.eu/dgs/home-‐affairs/what-‐we-‐do/policies/organized-‐crime-‐and-‐human-‐trafficking/trafficking-‐in-‐human-‐beings/index_en.htm 8 For more information see http://www.osce.org/secretariat/trafficking

UP-‐KAT | Kiril Sharapov | Research Report | Part 1 | October 2014 (version 1) 6
However, two other major constituents -‐ businesses and the general public -‐ remain conspicuously absent from national anti-‐trafficking policies and agendas, and remain overlooked by national policymakers. In addition, the location of national governments spearheading the ‘global fight’ against ‘modern slavery’ on the positive end of an anti-‐trafficking continuum is assumed almost by default and is rarely questioned. The anti-‐trafficking agendas and activities of governments, non-‐governmental organisations (NGOs) and the media have recently come under increasing scrutiny from a variety of sources reflecting a controversy related to the fact that policy-‐makers, NGO-‐workers, and scholars identify human trafficking as a matter of concern for very different reasons. As a consequence, they advocate different policy responses to this issue. Human trafficking may be understood within such contexts as ‘the modern day slavery’, transnational organised crime, an issue of irregular migration, a threat to national security, a human rights violation, violence against women, or a combination of the above. Anderson and Davidson (2002) identified two main strands to the definitional and analytical debates, which continue to dominate current discussions: one concerning tensions between governments’ obligations to protect and promote human rights, which conflict with the domestic political agendas to restrict immigration and ensure ‘national security’; and the other centring on the debate about the nature of prostitution and its relationship to trafficking. Within this context, the policy response of the EU and its member states has been criticised for approaching human trafficking as an issue of organised crime and illegal border crossing, overlooking the rights and protection of victims, failing to ensure effective cooperation between Member States, and failing to address the issues of demand for cheap labour, goods or services, and for exploitative sex (Wylie and McRedmond 2010:8).
At the same time, the intensified international and national anti-‐trafficking rhetoric gives what Kapur describes as an ‘outward sense of progress of something being done, of a social justice being pursued in the name of the human rights of these have-‐nots’ (2005:26). However, the promises of progress and emancipation, and the seeming international unity in fighting the crime of trafficking remain, Kapur argues, myopic, exclusive, and informed by a series of new global panics: a panic about the survival of the nation; a moral panic feeding the anti-‐sex work agenda; and a cultural panic treating the ‘Other’ as cultural contaminant disrupting a nation’s social and cultural fabric (ibid: 26). These panics continue to influence legal and institutional responses to human trafficking. In addition, they have been factors in shaping public opinion and attitudes towards trafficking and its victims as they obfuscate the growing demand for low-‐paid exploitable labour globally, and neglect the gendered and racialised vulnerability and exclusion within the globalised contexts of excessive wealth existing alongside growing poverty (Eisenstein 2010: 11). The relative
Human Trafficking, General Public and Businesses: the UK Policy Perspective The anti-‐trafficking policy in the UK, contained within ‘Human Trafficking: The Government’s Strategy’ (2011) represents the general public in the UK as fully aware and concerned about human trafficking: ‘Many members of the public already care deeply about the plight of trafficking victims and about the impact it has on their communities’ (ibid: 8). It suggests that there is ‘…growing awareness among consumers of the harm caused by unethical business practices’ (ibid: 23). As no evidence is provided, or indeed available to support such assertions, the Strategy appears to overlook any other anti-‐trafficking role that the general public can play and any tangible anti-‐trafficking contribution it can make, apart from knowing ‘what signs to look for’ when potentially coming across a victim of ‘modern slavery’. Equally, the UK policy reduces the role of businesses to a concerned bystander and even a victim: legitimate businesses, the Strategy asserts, are exploited by ‘traffickers and their enablers in order to run their trade’ (ibid: 8). The Policy situates businesses on a positive side of the simplistic ‘bad-‐good guys’ binary, whilst criminals and ‘those that pay for sexual services from trafficked women’ (ibid: 23) are placed on its negative side as unconditionally bearing full responsibility for human trafficking into and within the UK. In doing so, the UK Government appears to implicitly absolve British businesses from any responsibility for relying -‐ directly or through the practices of offshoring and subcontracting -‐ on labour provided by victims of trafficking, and limits their role to ‘raising the risks to traffickers and making it more difficult for them to exploit victims’ (ibid.) Such policy representations achieve a status of ‘hyper-‐separation’ – the stretching of dualisms so that the two poles have nothing in common (Bird 2011). From this perspective, UK businesses and general public appear to be nothing more than concerned bystanders in relation to the crime of trafficking and, generally, play no role in the overall system within which the reliance on cheap and exploitable labour (including labour provided by people trafficked for exploitation) has become an increasingly normalized practice. Recent policy discussions of the Draft Modern Slavery Bill, described by the UK Government as ‘A flagship Bill to tackle modern slavery, the first of its kind in Europe’ (UK Government 2013), focused on the Government’s persistent refusal to impose a positive obligation on companies incorporated and/or operating in the UK to monitor its business operations and supply chains for human trafficking. In October 2014, the UK Government announced it intention to include a requirement for large companies to report on anti-‐trafficking activities in its forthcoming Modern Slavery Bill. It remains to be seen whether a reporting requirement will result in any changes to the structural issues of labour exploitation within the context where other elements of legal and policy frameworks remain absent, including, for example, legislation to prosecute UK companies for human rights violations abroad.
UP-‐KAT | Kiril Sharapov | Research Report | Part 1 | October 2014 (version 1) 7
invisibility of businesses and consumers who may rely on trafficked labour within the context of consumer aspirations to ‘live well for less’9 persists as an outcome of sexual politics, political and structural silencing, and the over-‐focus on female victims by migration and prostitution discourses. This means that the knowledge we do have needs updating as the nature and structural causes of human trafficking shift in response to broader socio-‐economic, ideological and political changes. By exploring public understanding of human trafficking in the three case study countries, the outcomes of this research make a contribution to the understanding of human trafficking as the trade and exploitation of physical and sexual labour under conditions of coercion and force, focusing on underlying causes that give rise to exploitation, structural violence and the coercion of victims. Figure 1.2 outlines the contours of the anti-‐trafficking regime described above. It also questions the unconditional ‘positive’ polarity attached to some of the key anti-‐trafficking ‘stakeholders’, including national governments at the forefront of the ‘global fight’ against human trafficking, and some of the anti-‐trafficking non-‐governmental organisations.
Public opinion and human trafficking The underlying premise of this report is that the general public remains one of the key constituents in finding a solution to reducing vulnerability of men, women and children globally to exploitation, including exploitation facilitated by means of human trafficking. The increasing public awareness of domestic violence, for example, has contributed towards its re-‐definition from a private matter into a social and criminal problem in need of formal social and legal control. The general public can be one of the most powerful interest groups if motivated towards positive actions but are also, to greater and lesser degrees, participants in the supply and demand contexts of human trafficking. This becomes all the more critical against the backdrop of the economic slowdown, growing economic and social inequality within the EU and globally. In spite of the enormous social and economic cost of human trafficking, little research has been undertaken to identify and critically examine public awareness and knowledge of trafficking, how opinions are formed, how they are influenced, and, conversely, what influence they have on public policies in this area. Mary Buckley in her 2009 study of public opinion on human trafficking in Russia notes: ‘What is missing from this accumulating multivariate picture [of trafficking] is…the extent of people’s knowledge about its scale and of what the process entails, and views on what action, if any, should be taken’ (Buckley 2009).
What is public opinion? Public opinion is often described as the way people think, feel about, and respond to political phenomena. Although recognised by many as a potent political force especially within the context of representative democracies (Geer 2004, Price 2008), public opinion remains a contested issue. Sapiro and Shames (2010: 19), for example, describe it as ‘a fascinating, complex and often subtle phenomenon’; Donsbach and Traugott (2008: 1), in turn, suggest that despite being a legitimate, focal and multidisciplinary concept in social sciences, public opinion continues to be one of its ‘fuzziest’ terms. For political scientists and decision-‐makers public opinion remains a centrally situated concept in the study of democracy as a denominator of the relationship between the government and the people, an indicator of too much or too little responsiveness of the government (ibid: 2). For historians, the study of public opinion represents a tool in understanding social change, including the trajectory of citizens’ political mobilisation over time. Legal scholars and experts explore the extent to which law-‐making has been or should be responsive to changes in public opinion, especially when changes in behavioural and cultural norms serve as a catalyst for sweeping legislative changes. These include recent recognition of same-‐sex marriage in a number of countries, or, on the other end of the spectrum, the continuing legal and political assault on fundamental freedoms in Russia endorsed by the Russian general public in the name of ‘order’ (RPORS 2014). In reviewing the sociological perspective on public opinion, Nancy Carrillo (2004) highlights the generational nature of research into understanding how public opinion is formed and how it is to be measured. She notes that while some aspects of discussions on public opinion formation are ‘here to stay’, including the concepts of cross-‐pressures, selectivity and the influence of individuals’ social background, other aspects remain a subject of further debates, including the impacts of media and personal influence. In discussing the agenda-‐setting power of the mass media and other political actors over public opinion, Walgrave and Aelst (2006) note the still unresolved status of the media and political agenda-‐setting ‘puzzle’, whilst Stromback, referring to Herbst (1998), notes that the conflation of the phenomena of public opinion and mass media makes it difficult to differentiate one from another (Stromback 2012:1). Within this context, some of the key questions about public opinion and its relation to governance remain the focus of on-‐going debates, including: Who should we count as ‘public’ and ‘public sphere’? What exactly is public opinion? Does it represent aggregated attitudes of a population? How is it formed? What influence do the news media and political actors have on public opinion? and, How and to what extent does public opinion influence governments and other public and private organisations?
9 ‘Live Well for Less’ is an advertising campaign by J Sainsbury Plc -‐ one of the largest supermarkets in the UK – promoting the company’s ‘commitment to provide customers with quality products at fair prices’, see Sainsbury (2011)

Figure 1.2: Human Trafficking: Policy and Legal Frameworks (in countries with defined an@-‐trafficking agendas)
International Legal Framework: Palermo Protocol (UN 2000) and Supplementary Convention on the Abolition of Slavery (UN 1956)
European Legal Framework: Council of Europe Convention on Action against THB (2005), and EU Directive on Combating and Preventing THB( 2011)
EU Policy Framework: EU Strategy towards the Eradication of Trafficking in Human Beings (2012-2016)
National Legal/Regulatory and Policy Frameworks
FRONTEX
INTERPOLUN
EuropolECOSCE
Criminals
‘Genuine’ Victims
Victims not recognised as ‘genuine’
= ‘Illegal’ immigrants
National governments,
lawmakers and judiciary
Social Services Law enforcement Immigration and border control
Non-governmental organisations
Various Interest groups
News media, entertainment
industry
Businesses / Corporations
Outside of the trafficking framework?
General Public
(consumers)
Outside of the trafficking framework?
‘Regular’ and ‘irregular(ised)’ migrants on continuums of migration and
exploitation
Outside of the trafficking framework?
Legend
Omitted from dominant anti-trafficking discourse
(Almost always assumed to be) Positive anti-trafficking structures and stakeholders
‘Genuine’ victims of trafficking: neutral, in need of identification and rescue
(Almost always) Negative parties within the dominant anti-trafficking discourse

UP-‐KAT | Kiril Sharapov | Research Report | Part 1 | October 2014 (version 1) 9
Defining public opinion The definitions of public opinion abound in academic and policy literature. Kepplinger (2008: 192), for example, offers a broad view of public opinion describing it as ‘appraising judgments concerning reality and/or uncertain ideas about reality’. He distinguishes between three different concepts of public opinion:
-‐ The quantitative concept concerned with the distribution of individual opinions within a population measured by representative opinion polls;
-‐ The qualitative concept concerned with the opinion of elites -‐ interested and well-‐informed citizens -‐ on political issues. Public opinion in this context cannot be measured by opinion polls and can only be deduced from corresponding public statements; and
-‐ The functional concept concerned with the identification of issues that can be discussed in public as a mechanism to establish and stabilize dominant opinions, and the relation between public opinion and political decision-‐making.
Public opinion and attitudes remain closely related concepts within a wide range of scholarly and methodological perspectives including social psychology, sociology, and policy studies. Their interdisciplinary application may explain, to a large extent, the lack of an agreed definition or shared theoretical framework on the differences and similarities between attitudes, beliefs and opinions. There remains no consensus on how attitudes relate to other aspects of personal identity, including values, beliefs, opinions, habits and identifications (Norrander and Wilcox 2010). There is no single attitude theory either with various theoretical strands exploring how attitudes are learned and formed, how they relate to each other, or how they influence behaviour. Tourangeau and Galesic (2008: 143), for example, propose a traditional view of attitudes as ‘enduring structures in long-‐term memory that link an attitude object with an evaluation of it’ and guide ‘both perceptions of the object and behaviour toward it’. This perspective, however, have come under increasing scrutiny since individuals, as its opponents argue, may not always possess underlying ‘true’ attitudes that are relatively stable and enduring. This means that opinion polls, as a vehicle to measure public opinion, may only reflect ‘a static, disjunctive, and individualistic notion of what is ultimately a dynamic, conjunctive, and collective phenomenon’ (Lee 2002: 294). Within the field of policy and public opinion research, the following three lines of contention around the issue of public opinion can be identified:
-‐ The ability of the general public to arrive at meaningful decisions about complex social phenomena; -‐ How public opinion is formed, how and to what extent it depends on the information received from political
leaders and the media; and -‐ The relationship between public opinion and policy.
The ability of the general public to arrive at meaningful decisions about complex social phenomena There is no agreement among scholars and policy-‐makers on the extent to which the general public is capable of making meaningful decisions about complex social phenomena and the impact of varying degrees of political knowledge among the general public on the overall quality of public opinion. Sinderman and Theriault (2004: 134), for example, refer to empirical studies, which demonstrate that citizens’ judgments are ‘impulsive, oversimplified, intemperate, ill-‐considered and ill-‐informed’. Similarly, Visser et al. (2008: 129) note the continuing controversy surrounding the interpretation of political knowledge of the general public and suggest that ‘the fact remains that most citizens do not know very much about the people, policies, and institutions that comprise their political system’. Other studies comment on low levels of information and general public’s adherence to misinformation, and its inability to make policy trade-‐offs (Quirk and Hinchliffe 1998). Yet some research, reviewed by Sinderman and Bullock (2004) suggests that the general public, as a whole, is capable of forming rational beliefs by using cues or heuristics even in circumstances when there is little information. Paul Goren, for example, in his investigation of the competence of American voters, suggests that ‘most citizens have genuine policy principles and rely heavily on these’ when casting their vote (Goren 2012: 4). Within this context, the ‘game of football’ between those disputing and those seeking to prove citizens’ political competence, and the extent to which variations in public competence matter is set to continue for the time being.
How public opinion is formed, how and to what extent it depends on the nature of information received from political leaders and the media There are two primary ways in which people become knowledgeable about new topics: by direct contact with an attitude object and/or by exposure to the information about the object relayed to them from other people through conversation, formal schooling or through the mass media (Visser et al. 2008). However, exposure to new information is only the first of several steps in the process of knowledge acquisition; individuals need to process and store new knowledge by making links with previously acquired information. Visser et al. (ibid.) further argue that when applied to the world of politics, the process of knowledge acquisition imposes significant cognitive demands upon individuals who come face-‐to-‐face with carefully crafted messages and information relayed by politicians and the media in the

UP-‐KAT | Kiril Sharapov | Research Report | Part 1 | October 2014 (version 1) 10
process of framing and priming public opinion. Framing can be defined as ‘…the process by which a communication source constructs and defines a social or political issue for its audience’ (Nelson, Oxley and Clawson 1997 cited by Norrander and Wilcox 2010: xxiv) – a process where frames provide the public with ‘stories’ through which to interpret political issues. Priming, in turn, is a process that activates and brings to the ‘top of one’s head’ certain elements of already processed information -‐ a schemata or attitudes – when a new issue is considered, which influence the way in which new information is processed. Agenda-‐setting, priming, and framing -‐ the three key approaches to understanding the effects of political communication -‐ continue to be at the centre of empirical investigations and theoretical discussions (see, for example, Scheufele 2000, Weaver 2007, Scheufele and Tewksbury 2007, Wolfe, Jones and Baumgatner 2013). Within this context of unresolved theoretical arguments on the one hand, and the diversity of political issues and complexity of public opinion as a sum of individual opinions patterned by their holders’ socio-‐economic and cultural backgrounds, on the other hand, chances of developing a grand meta-‐theory of public opinion formation remain slim. This lack of consensus is similar to that on the ability of individuals to make meaningful political choices, mentioned above.
The relationship between public opinion and policy The relationship between public opinion and policy is another contentious issue within the field of public opinion research and theory with the key question ‘To what extent (if at all) public opinion impacts on policymaking’ and, vice versa, ‘To what extent do policymakers (if at all) influence public opinion’ producing a diversity of often conflicting views and perspectives. Some scholars suggest a strong impact of public opinion on public policy; others argue that the general public does not possess any consistent views at all and even if it does, these views have little relevance to policymaking; still, others suggest that contexts are key, and that in some contexts public opinion has greater influence than in others. Manza, Cook and Page (2002) provide a detailed overview of these three perspectives. Firstly, those who support the existence of a link between public opinion and policy rely on quantitative approaches to assess correlations between majority opinion on an issue and policy outcomes, including time-‐series analyses and case-‐study approaches. Such studies suggest that there are significant and enduring effects of public opinion on policymaking as policies generally tend to move in the direction preferred by the majority public opinion. The explanation for this link is that within the context of representative democracies politicians ‘cock their ears’ like an ‘antelope in an open field’ (Stimson, MacKuen and Erikson 1995 cited by Manza et al. 2002: 20) to secure their position by minimising the gap between their own position and that of voters. Those in favour of a view that only limited, if at all, connections exist between public opinion and policy outcomes focus on the ability of political elites to mould public opinion, which makes any observable correlation between public opinion and policy spurious. This perspective brings into focus the role of broadly defined interest groups in influencing political elites resulting, in some cases, in policies, which may significantly deviate from what appears to be a mass preference. Others argue that public opinion is not sufficiently coherent or consistent to result in an independent causal effect. From this perspective, ‘public opinion surveys present only a rough idea of what people generally think because the results are highly sensitive to a number of factors’ (ibid: 23). The third perspective asserts that in some contexts public opinion influences policy, but in others it does not. Such variability may be explained by ‘factors unique to each political issues or controversy’ (ibid: 27). This may include uneven distributions of attitudes especially in cases of controversial issues, such as abortion or immigration, and the extent to which individual policy domains are ‘crowded’ with influential interest groups or characterised by long-‐established policies, which may be difficult and costly to modify. In addition, the fourth broad point of view claims that the link between policies and public opinion may be entirely spurious owing to politicians exerting influence over ‘docile followers susceptible to elite propaganda’ (Erikson et al 2002: 34) and relying on ‘crafted talk’ to simulate responsiveness by changing public perceptions on already decided policies (Jacobs and Shapiro 2002: 55), or policies set exogenously but matching preferences of the general public. Disagreements on the nature of the relationship between public opinion and policies are further compounded by the lack of a coherent approach to methodology (Norrander and Wilcox 2010): how to measure and study public opinion? What questions, theories and approaches are best? and What methods are the most appropriate?
Studying public opinion: methodological issues Opinion polling, as Stromback (2012: 1) notes, remains the ‘best methodology yet invented to investigate public opinion’. This is despite the known and debated methodological issues of sampling, question ambiguity, wording and context (ibid.), and a more fundamental questioning of the extent to which general population surveys provide a valid representation of the public views (Price 2008: 20). The validity of representation, in turn, invokes the issues of potential distortion of the overall picture by systematic inequalities in knowledge distribution among groups in the population, and by the relative incoherence of many sampled opinions. Yet opinion polls still hold a significant potential to reveal ‘essentially rational collective preferences’ (ibid: 21) formed through a complex interaction of public, media and policy agendas. In understanding citizens as products of their surrounding political culture, the two key questions that the study of public opinion may render answers to are how they -‐ citizens -‐ are at present, and how, under different conditions, they might be (ibid.) It is often argued that public opinion polls produce more

UP-‐KAT | Kiril Sharapov | Research Report | Part 1 | October 2014 (version 1) 11
representative perspective on public attitudes than other methods, which may give voice to ‘the most opinionated, the best organized, or the most readily accessible members of the public’ (Miller 2002: 221). In addition, probability sampling and standardised procedures to assess and evaluate opinion allow replication and error measurement, described by Miller as ‘foundations for polls’ special claim on knowledge of the public will’ (ibid.) Page (2002: 325), for example, defends the ‘pro-‐survey consensus’ based on the issues of feasibility and representativeness, and the capacity of properly designed and analysed surveys to deliver a ‘highly representative picture of what citizens as a collectivity think’. Amid the ongoing contentions and arguments surrounding the issues of what is measured by opinion polls (i.e. the ontological and epistemological concerns of how are we to understand ‘public opinion’ and whether it exists at all), why is it measured (and whether there are any links between public opinion and policy, as discussed above) and how is it measured (methodological issues described below), it is generally accepted that having a knowledge and understanding of public opinion as expressed by outcomes of opinion polls is usually ‘…better for democracy than their not having it. Good information is better than misinformation’ (Taylor 2002: 316). In addition, Traugott (2012: 86) suggests that the dissemination of survey data may change subsequent opinion and behaviour with the ‘knowledge of what others think or believe – or how those opinions are changing’ having an impact on individual opinions and behaviour.
UP-‐KAT survey methodology It is generally accepted that social science survey research can never be completely free of bias, subjectivity or even methodological errors. The very basic unit of any questionnaire -‐ a survey question – can have a number of different wordings, which may result in different answers, especially within the context of opinion polls on sensitive issues (Weaver 2002: 109), with no wording being a correct one. Answers can also be affected by a choice of an open or a closed-‐ended question, by an order in which questions are asked, cues from prior questions, which may consciously or unconsciously influence respondents’ thinking (Rasinski 2008: 362), sampling and interviewing procedures, and a number of other methodological factors with no 100%-‐error-‐free way to eliminate these differences, divergences and potential errors. However, as Weisberg comments (2008: 230), survey errors can be minimised within the constraints of cost, time and ethics. The ‘survey research triangle’, proposed by Weisberg (ibid.), was relied upon in developing the survey methodology for this project to account for and, where possible, to address the following concerns: (a) survey errors, including the issues of measurement, nonresponse, sampling and coverage; (b) survey constraints, including costs, time and ethics, and (c) survey effects, including question-‐related, mode and comparison effects. In addition, the following four requirements for accurate poll data suggested by Traugott (2008: 233) informed the development and administration of the surveys:
(1) Probability samples that permit inferences back to the underlying population, (2) Well-‐written questionnaires that produce unbiased measures of attitudes and behaviour, (3) Appropriate analysis; and (4) Interpretations that do not exceed the limit of all of the forgoing elements.
From the outset, the overall research design, and the survey methodology in particular, addressed a range of research ethics issues, including informed consent, confidentiality and privacy, and broader issues of power, reciprocity and contextual relevance (Shaw 2008). This process involved the completion of an ethical review checklist; relevant guidance from external funders and regulatory bodies was incorporated. In addition, a robust peer-‐review of ethical issues as applied to this project was undertaken. The issues of measurement, nonresponse, sampling and coverage were, in part, addressed by appointing three reputable and experienced market research companies in the case-‐study countries to undertake face-‐to-‐face surveys of representative national samples as part of their Omnibus surveys. The Omnibus survey is a shared cost, multi-‐client approach to survey research, where a market research company carries out a survey on behalf of commissioning organisations. The survey itself consists of several ‘blocks’ of questions submitted by these organisations, which means that the data on a wide variety of subjects is collected during the same interview. Omnibus surveys are generally considered as one of the most cost-‐effective and time-‐efficient ways of interviewing representative population samples, and are used widely not only to explore consumer opinions, but also opinions on social and political issues held by various groups of population (see, for example, DEFRA 2010, Fortnum et al. 2013). Ethical policies of the market research agencies were reviewed at the stage of procurement to ensure compliance with the overall ethical framework adopted for the project, and relevant national data protection legislation. The survey methodology details for each national sample are provided in the table below. In the analysis that follows, national-‐level results are presented using national-‐level weights supplied by survey providers. The issue of ‘centralisation’ of cross-‐national surveys, or the use of a single centralised and standardised research instrument administered by the same survey research company could not have been fully resolved within the context of this project. Although care was taken to ensure equivalence of the survey instrument (for more details see the summary of the survey development process below), it was impossible, given time and budget constraints, to have

UP-‐KAT | Kiril Sharapov | Research Report | Part 1 | October 2014 (version 1) 12
three national surveys administered by a single market research company. Three national market research companies were therefore recruited following a competitive bidding process. As a consequence of relying on three different survey providers, the outcome survey datasets include slightly differing demographic and social classifications, and, despite being representative of national populations (with the established margins of error), are based on different quota sampling methods, weighting procedures and other survey techniques adopted and administered by national survey providers. These were impossible to completely standardise. The inclusion of the survey instrument as part of larger national omnibus surveys may also raise a number of concerns related to the issues of survey blocks’ sequencing (for example, potential inclusion of other survey blocks on the issues of crime or immigration may have influenced respondents’ responses to questions on human trafficking), and the potential impact of interview fatigue on the quality of the data obtained. The opportunities to eliminate the influence of these external factors issues were limited. However, in order to mitigate their potential influence, all of the procedures and technical matters were approximated as close as possible to ensure a maximum degree of uniformity. Table 1.1: Case-‐study country survey methodological details Ukraine Hungary Great Britain Methodology and date
Omnibus face-‐to-‐face, PAPI (paper-‐and-‐pencil interviewing), January 2014
Omnibus face-‐to-‐face, PAPI (paper-‐and-‐pencil interviewing), December 2013
Omnibus face-‐to-‐face, CAPI (computer-‐assisted personal interviewing), January 2014
Sample Size 1,000 representative of national population within the specified age range
1,000 representative of national population within the specified age range
1,000 representative of GB population within the specified age range
Sampling Multi-‐stage sample based on random probability approach with respondents selected by the random route technique with the ‘last birthday’ method employed at the end stage of selection
Multi-‐stage sample selected with proportional stratification with final respondents selected by random walkingsampling
Multi-‐stage sample -‐ 125-‐150 sample points per survey week at the first stage; addresses were then randomly selected from the Post Office Address file (PAF); residents were interviewed according to interlocking quotas on sex, working status and presence of children
Age Range 15-‐59 18 and older 16 and older Coverage Ukraine, national, 6 regions
singled out on a geographic and economic basis
Hungary, national, 8 regions (including Budapest)
Great Britain, south of the Caledonian Canal
Weighting Quota & weight By gender, age group, type of settlement and educational level
By gender, age group, social class and region
Quality control 4% of completed interviews controlled by face-‐to-‐face method and 6% by telephone (100 interviews)
Multiple techniques, including random visits by regional instructors (10%), postal or by telephone post-‐survey quality control when required
10% back check
Company used GfK Ukraine, www.gfk.ua TARKI, http://www.tarki.hu/en/ UK-‐based market-‐research company; name not released for contractual reasons
Representation Representative of the national population, age range 15-‐59, margin of error (95% confidence level) +/-‐ 3.1 percentage points
Representative of the national population, age range 18+, margin of error (95% confidence level) +/-‐ 3.1 percentage points
Representative of the national population, age range 16+, margin of error (95% confidence level) +/-‐ 3.1 percentage points
Development of the survey instrument The questionnaire for the survey was developed at the end of a 6-‐month period of the detailed study of how human trafficking is constructed, or represented, in the scholarly literature, media and anti-‐trafficking policies of the three case-‐study countries. A series of questionnaire development consultations took place, which involved members of the project steering and advisory groups, and some of the key anti-‐trafficking non-‐governmental organisations in Europe. These consultations ensured that questions were written based on ideas and concepts developed in a systematic and logical way. Questions were drafted using procedures proposed by Booth, Colomb and Williams (2003) (cited in Rasinski 2008: 367) and Hader (2008: 389), where the problem was ‘operationalised’ by identifying its key dimensions
UP-‐KAT | Kiril Sharapov | Research Report | Part 1 | October 2014 (version 1) 13
in the first place. The next step involved collecting a series of statements, which described each of the dimensions, and the transformation of these statements into a series of questions by applying the technique of asking ‘who,’ ‘what,’ ‘where,’ ‘when,’ ‘why,’ and ‘how’. Each question was then assigned an objective in order to understand what type of information it was likely to solicit and how this information contributed to the overarching research objective. Unsuitable, duplicate and equivalent statements and questions were eliminated in an iterative manner. The remaining questions were standardised by constructing a scale using the Likert scaling technique with a five-‐point scale response format. The analysis that follows assumes that all given responses represent a ‘good approximation of the attitude of a respondent under study.’ (Hader 2008: 390) To address a reported tendency where some respondents are likely to answer ‘agree’ to all questions if all of them are positively formulated, about 40% of items in the final questionnaire were negatively formulated in order to reduce response acquiescence. The final survey instrument was further edited to ensure that questions were written in as clear and understandable form as possible. In addition to the issue of centralisation, the development of project surveys within the context of cross-‐national research imposes a requirement of the survey instrument’s conceptual equivalence. The issues of conceptual equivalence remain particularly relevant within the context of cross-‐cultural and cross-‐language research, where word-‐by-‐word language equivalence does not always guarantee the equivalence of ideas and concepts since (a) languages carry different ways of thinking and understanding, and (b) a concept, which may appear almost self-‐explanatory in one cultural context, may be imbued with a different meaning in a different cultural context even when an equivalent term (whether in the same language or not) is used. For example, the government anti-‐trafficking policy in the UK relies on the term ‘victims of human trafficking’ to denominate, in most cases, passive victimhood. Any suggestion of victim’s active involvement at any stage of the trafficking process activates the binary of ‘freedom-‐slavery’, which underpins the process of victim identification, recognition and assistance by the UK Government. In Ukraine, the word ‘victim’ is omitted from policy documents all together; instead a phrase ‘a person who suffered from the process of the sale of people’ is used. The use of this term within the context of one of the policy objectives -‐ to re-‐instate human rights of people who suffered from human trafficking – suggest a different understanding and approach to what makes a person a victim, and how such victimisation can be addressed. In order to ensure the equivalence of meaning and measurement between three different versions of the questionnaire (English, as the original ‘source’ questionnaire, Ukrainian and Hungarian) both qualitative and quantitative methods were deployed, including the detailed annotation of the source questionnaire and the iterative back-‐translation, where the source questionnaire was translated into the two required languages and then translated back to the source language to see if any of the questions might have been corrupted (as advised by Fu and Chu 2008: 286). A multi-‐stage pre-‐testing and a piloting process to ensure equivalence at both linguistic and conceptual levels accompanied this process. The pre-‐testing was also used to verify that respondents in the pilot survey understood what the questions asked and that no room was left for misinterpretation (Rasinski 2008, Traugott 2008). The final survey questionnaire included four questions overall: an open-‐ended question followed by three closed questions (a copy of the questionnaire is annexed to this report). The open-‐ended question asked respondents to describe using their own words what they understood human trafficking to be. This was followed by three closed questions, one of which asked respondents to identify how they got to know about human trafficking (prior to the interview) and provided a list of potential sources of information, including an ‘Other sources’ option. The remaining two questions included a series of statements covering different aspects of human trafficking (as reviewed below) and asked respondents to indicate their degree of agreement or disagreement with these statements (items) on a five-‐point Likert scale (Strongly agree, agree, disagree, strongly disagree, do not know). The ‘do not know’ option was included to prevent a situation where respondents were willing to offer opinions on issues that were obscure or fictitious (Tourangeau and Galesic 2008: 145). These items were developed in a way that would allow consolidating them into a single ‘knowledge and attitudes’ scale and a series of subscales to reflect, once consolidated, respondents’ attitudes towards some of the dominants representations of human trafficking in the policy and media discourses. A Cornbach alpha was calculated for each of the subscales to verify that items fit together; these subscales are discussed in Part 3.

UP-‐KAT | Kiril Sharapov | Research Report | Part 1 | October 2014 (version 1) 14
In your own words, describe what you think ‘human trafficking’ is? The first survey question was open-‐ended; it provided no prompts and asked respondents to describe what they thought human trafficking was. Respondents could express their opinion using their own words and without being reminded of any specific representations of human trafficking (as a problem of crime or irregular immigration, for example). The key advantage of open-‐ended questions over closed ones is that the latter almost always carry a certain framing of the problem by a researcher; they provide a series of clues and prompts, which may influence respondents’ answers. This is especially the case where respondents are asked to agree or disagree with pre-‐determined statements, where reality, in a broad sense, is already constructed for them. This may result in a considerable potential to bias or skew responses. All responses were recorded by interviewers, typed up and returned to the Researcher in a verbatim format. Hungarian responses were translated into English by the market research company itself (with a 5% randomised sample checked by the Researcher for the accuracy of translation). Ukrainian responses were translated into English by the Researcher. The qualitative analysis was conducted with the help of SPSS Text Analytics for Surveys software (SPSS TAS), which relies on linguistics-‐based text mining to analyse ‘the structure and meaning of the language of a text’ (IBM 2012:2). The automated process for analysing texts is based on statistical formulas; however these formulas treat text as a ‘bag of words’ rather then identify a structure and decode meanings in their analysis. As such, they make the coding of responses easier rather than completely substitute meaning-‐identification processes undertaken by a researcher. SPSS TAS was relied upon to identify key textual patterns in the three national datasets. Each dataset consisted of about a thousand qualitative responses (including ‘do not know/no opinion’ responses). Each response was manually assigned a code or several codes based on the iterative reading of responses and by relying on a set of categories pre-‐extracted by SPSS TAS. Once this process was completed for all three datasets, the identified codes were contextually approximated: for example, ‘violence and abuse’ in one dataset was matched against ‘abuse and coercion’ and ‘force and dependency’ in the other two datasets, resulting in a single code applied across all three datasets. SPSS TAS was also used to generate visual representations of the key categories (codes) and of any interrelationships between them, shown in the figures below. Each visual representation consists of a series of dots, which represent codes, and lines, which indicate the existence of an association between codes -‐ a situation, where an individual response was assigned two or more codes. The frequency with which each code appears in the dataset (i.e. the number of responses coded accordingly) is represented by the size of the dots; the dots were arranged in a random circular order. The thickness of the connecting lines identifies the strength of the overall relationship between a pair of codes. Tables that accompany each visual representation provide some statistical information on the binary associations for the codes with response frequencies of 100 and higher (referred to as ‘key codes’). The analysis of associations is limited to binary associations for key codes only: for example, the association between ‘Slavery’ and ‘Immigration’ is noted (a binary association of codes), however no discussion of the association between ‘Immigration’, ‘Slavery’ and ‘Crime’ is provided in this report. ‘Codes’ and ‘Categories’ are used as technical terms when discussing the methodological aspects of this analysis. In any further discussions of the outcomes, the word ‘vector’, drawn from Aradau’s work (2008), is relied upon when referring to methodological codes/categories. Aradau (ibid.), in discussing the politicisation of trafficking as a socially constructed category, applies the concept of ‘vectoring’ to metaphorically describe a force that acts in a certain direction. This research report uses the notions of a ‘vector’ and ‘vectoring’ to describe a range of issues, actions or any other social phenomena (for example, removal of documents, slavery, begging), which interact in a certain pattern to form an overall aggregate picture of how human trafficking is understood by the general public in the three case-‐study countries.

UP-‐KAT | Kiril Sharapov | Research Report | Part 1 | October 2014 (version 1) 15
Ukraine Figure 1.3 and Table 1.2 below provide an overview of the codes (or categories) applied to the Ukrainian dataset. Figure 1.3: What is human trafficking? Key codes and associations identified in the Ukrainian dataset
Table 1.2: Key codes and code associations for the Ukrainian dataset (N=1,010, age 15-‐59)
Key code Number of key-‐coded responses
Overall % in the dataset
Associations, including percentages. The data in this column indicates the share of respondents within the category listed as a key code, where respondents’ answers were also coded with one of the codes/categories listed below (associated codes). Only key codes with frequencies of 100 and more are included in this table. It excludes association cases, where less than 10% of key-‐coded responses were marked with any other code (for example, if less than 10% of responses key-‐coded as ‘Slavery’ were also coded with the associated code ‘Children’ – such cases would be omitted from this table)
Slavery 258 26% Buying and selling people – 27%; Sexual exploitation, prostitution – 24%; Abuse, violence, coercion, dependency – 12%, Organ harvesting -‐10%
Buying and selling people
227 23% Slavery – 30%; Sexual exploitation, prostitution – 23%; Organ harvesting – 17%; Kidnapping – 15%; Labour (unfree, unpaid, exploited, coerced, forced) – 15%, Financial gain – 12%
Labour (unfree, unpaid, exploited, coerced, forced)
213 21% Sexual exploitation, prostitution -‐22%; Buying and selling people – 16%; Abuse, violence, coercion, dependency – 14%; Organ harvesting – 14%; Kidnapping – 11%; Deception -‐ 11%
Sexual exploitation, prostitution
166 16% Organ harvesting – 46%; Slavery – 37%; Buying and selling people – 32%; Labour (unfree, unpaid, exploited, coerced, forced) – 28%; Exploitation of women and girls – 11%; Kidnapping -‐11%
Crime and illegality
146 15% Buying and selling people -‐12%; Labour (unfree, unpaid, exploited, coerced, forced) – 11%
Abuse, violence, coercion, dependency
132 13% Slavery – 23%; Labour (unfree, unpaid, exploited, coerced, forced) -‐23%; Exploitation (in a broad sense) – 14%; Buying and selling people – 13%; Sexual exploitation, prostitution -‐11%
Exploitation (in a broad sense)
105 10% Labour (unfree, unpaid, exploited, coerced, forced) – 20%; Abuse, violence, coercion, dependency -‐17%; Sexual exploitation, prostitution – 15%; Crime and illegality -‐12%

UP-‐KAT | Kiril Sharapov | Research Report | Part 1 | October 2014 (version 1) 16
The outcomes of the analysis indicate that in Ukraine the predominant understanding of human trafficking centres around the issues of slavery, buying and selling of people, and unfree labour. These three categories, or vectors, characterise, overall, about 70% of responses. These categories are also interrelated. For example, 27% of respondents, who mentioned slavery, also mentioned the process of buying and selling of people; and 30% of respondents, who referred to the process of buying and selling of people, mentioned slavery. The general pattern that emerges from these outcomes is that human trafficking involves buying and selling of people into slavery for the purposes of labour and sexual exploitation. It is worth noting that the anti-‐trafficking legal and policy frameworks in Ukraine10 refer to ‘the sale of people’ to describe trafficking in human beings as understood by the Palermo Protocol. The terms ‘trafficking in human beings’ (no equivalent term in Ukrainian) or ‘slavery’ (equivalent term in Ukrainian – ‘рабство’) do not appear in any of the official documents. The Government’s decision not to use the term ‘slavery’ is significant given that references to ‘slavery’ and ‘slaves’ became commonplace in the reporting of human trafficking by the Ukrainian news media. Scholarly debates on the extent to which mass media influence public opinion and on the exact mechanism of this influence continue. It is generally acknowledged, however, that more often than not, the news media remain a powerful public opinion agent. Media do not merely convey messages about a phenomenon that the majority of people may never come across in their daily lives. They also embed a certain set of ‘frames’ – the ways of thinking about a phenomenon – into public imagination. In Ukraine, newspaper stories about ‘slavery’, sexual and labour ‘slaves’ are not only commonplace but also specific in that they provide often sensationalist and highly individualised stories of Ukrainian ‘slaves' abroad subjected to forced labour and sexual exploitation. For example, the website of ‘Segodnya’ (Today)-‐ a popular tabloid Ukrainian newspaper – available both in print (daily circulation of about 150,000 copies) and electronically (about 9 million of recorded Internet visitors in August 201411) – returns 27 feature articles dedicated to ‘slavery’ (including ‘labour slavery’ and ‘sexual slavery’) published electronically in 2013. The website of another tabloid newspaper -‐ ‘Facts and Commentary’ -‐ also available both in print (daily circulation of about 623,000 copies) and electronically (about 2 million and thirty thousand recorded visitors in August 2014)12 -‐ returns 14 feature articles dedicated to ‘slavery’ – both ‘sexual’ and ‘labour’ in 2013. Another finding, which highlights the role of the mass media in influencing public perceptions, is a relatively higher (in comparison to Hungary and Great Britain) share of respondents identifying ‘organ harvesting’ as an aspect, or vector, of human trafficking: 9% of respondents in Ukraine, in comparison to less than 1% in Great Britain and 3% in Hungary13. Organ harvesting remains a low priority within the context of the existing anti-‐trafficking policy and legislation in Ukraine14. However, a number of sensationalist stories related to organ harvesting have been reported over recent years in the Ukrainian mass media, implicating healthcare professionals, law enforcement, judiciary, and criminal groups in organizing organ-‐trafficking rings to ‘export’ illegally harvested organs and tissues internationally. In addition, it has also been alleged that various websites, directed at Ukrainian Internet users, continue to advertise opportunities to sell kidneys and other organs privately (Utro 2014). The most recent scandal propagated by Russian tabloids within the context of the ongoing conflict in the East of Ukraine is based on allegations by ‘experts’ of the systematic trafficking of injured soldiers for organ harvesting (KP 2014)15. In spite of 21% of Ukrainian respondents associating human trafficking with unfree labour, not a single survey respondent referred to the phenomenon of ‘zarobitchanstvo’, which relates to the post-‐Soviet labour market changes in Ukraine and large-‐scale labour migration of Ukrainian citizens abroad and internally in search of employment. Nominally and linguistically, the concept ‘zarobitchanstvo’ emphasizes the final purpose of individual migration decisions – ‘to earn’ [money] and, as such, encompasses a variety of individual migration experiences on the continuums of free-‐unfree labour and regular-‐irregular(ised) migration. References to ‘zarobitchanstvo’ are common in academic, policy and media discussions of labour migration in Ukraine (Khanenko Friesen 2007: 104). However, there appears to be a gap between public perceptions of almost expected and accepted physical hardship faced by ‘zarobitchane’ (‘those seeking work’) who voluntarily embark on their often irregular(rised) migration journeys, and public perceptions of ‘slavery’ and exploited, unpaid, coerced or forced labour associated with human trafficking. Within this context, further research may be useful to explore public understanding around the issues of individual agency of Ukrainian migrant workers as they intersect with practices of exploitation and migration on respective continuums. When does, in public view, physical hardship associated with labour migration stop, and when does exploitation begin? How does public understanding of ‘forced labour’ compare to its restrictive definitions contained within relevant international and national pieces of legislation? 10 See the Law of Ukraine on Combating [the process of] the Sale of People (Parliament of Ukraine 2011) and the ‘State Targeted Social Programme on Combatting [the process of] the Sale of People up to 2015’ (Government of Ukraine 2012) 11 For more information on circulation see http://mediagroup.com.ua/view_info.php?id_np=673 and http://www.liveinternet.ru/stat/segodnya.ua/summary.pdf?date=2014-‐08 12 For more information on circulation see http://www.liveinternet.ru/stat/fakty.ua/summary.pdf?date=2014-‐08 and http://mediagroup.com.ua/view_info.php?id_np=692 13 These figures are drawn from national datasets representative of national populations (N=1,000) within slightly different age groups (as explained in Part 1): 15-‐59 in Ukraine, 16 and older in Great Britain and 18 and older in Hungary. 14 Organ transplants in Ukraine are regulated by a separate law on the ‘Transplantation of organs and other anatomical materials’, see http://likarinfund.org/content/19/146/618 [In Ukrainian} 15 For one of the most comprehensive overviews of trafficking in human organs available at the time of writing, see OSCE (2013).

UP-‐KAT | Kiril Sharapov | Research Report | Part 1 | October 2014 (version 1) 17
About 16% of Ukrainian respondents associated trafficking in human beings with sexual exploitation and prostitution. About a half of these respondents also mentioned organ harvesting as another human trafficking vector, which may reflect the views of respondents most affected by the news media reporting of trafficking in Ukraine, where organ harvesting and ‘sexual slavery’ occupy a prominent place in excessively dramatized and individualised reporting of ‘slave-‐holding’. About 15% of respondents made explicit references to trafficking as a crime or illegal activity. This is followed by 13% of respondents expressing their concern about violence, abuse and violation involved in trafficking (with about a quarter of these respondents also making references to slavery). About 10% referred to ‘exploitation’ generally without distinguishing between labour, sexual or any other type of exploitation. Overall, the understanding of trafficking among Ukrainian respondents can be described as a ‘patchwork’ of views, with ‘slavery’, ‘buying and selling of people’, and ‘unfree labour’ dominating the overall pattern. Links between various vectors remain weak with little or no significant associations to allow for the identification of a more complex pattern of views and opinions. This, however, may be an outcome of the specific research methodology where respondents had limited time to express their views and no prompts were used to encourage further discussion. Further research may be required to yield a more nuanced understanding of knowledge and attitudes associated with human trafficking, exploitation and labour migration held by members of the public. Another notable finding is a low level of recognition of human trafficking as a violation of human rights – only 3% of recorded responses. This is despite the Ukrainian government’s efforts to embed a rights-‐based approach into its evolving anti-‐trafficking policy. This includes the policy priority of ‘reinstating human rights’ of trafficked and exploited people. ‘Movement of people’ – an umbrella category, which was used to code responses where movement of people had been mentioned but which had not been coached in the language of immigration or emigration -‐ describes only 6% of responses. This finding should be considered within the context of what appears to be an increasing acceptance among the Ukrainian population of Ukraine being a country of both emigration and, increasingly, immigration with movements within the country and across its borders in search of work becoming a part of everyday life for many Ukrainians (see Annex 2 for more details on the migration dynamics in Ukraine). About 10% of Ukrainian responses were coded as ‘Do not know’. The statistical analysis to explore whether there was any relationship between ‘do not know’ responses on the one hand, and respondents’ socio-‐economic background, on the other (SPSS, chi-‐square test for association) did not find any significant relationship. The socio-‐demographic characteristics included respondents’ gender (χ2(1)=0.038, ρ=0.845), age (χ2(4)=7.046, ρ=0.133), education (χ2(4)=5.757, ρ=0.218), occupation (χ2(5)=6.308, ρ=0.277), and respondents’ own assessment of the financial status of their family (χ2(6)=6.190, ρ=0.402). This is different from the outcomes of a similar analysis for the datasets from Hungary and Great Britain, where there is a significant statistical relationship between respondents’ demographics and ‘no opinion/do not know’ answer pattern.
Hungary Figure 1.4 and Table 1.3 provide an overview of codes and associations for the Hungarian dataset. Figure 1.4: What is human trafficking? Key codes and associations identified in the Hungarian dataset
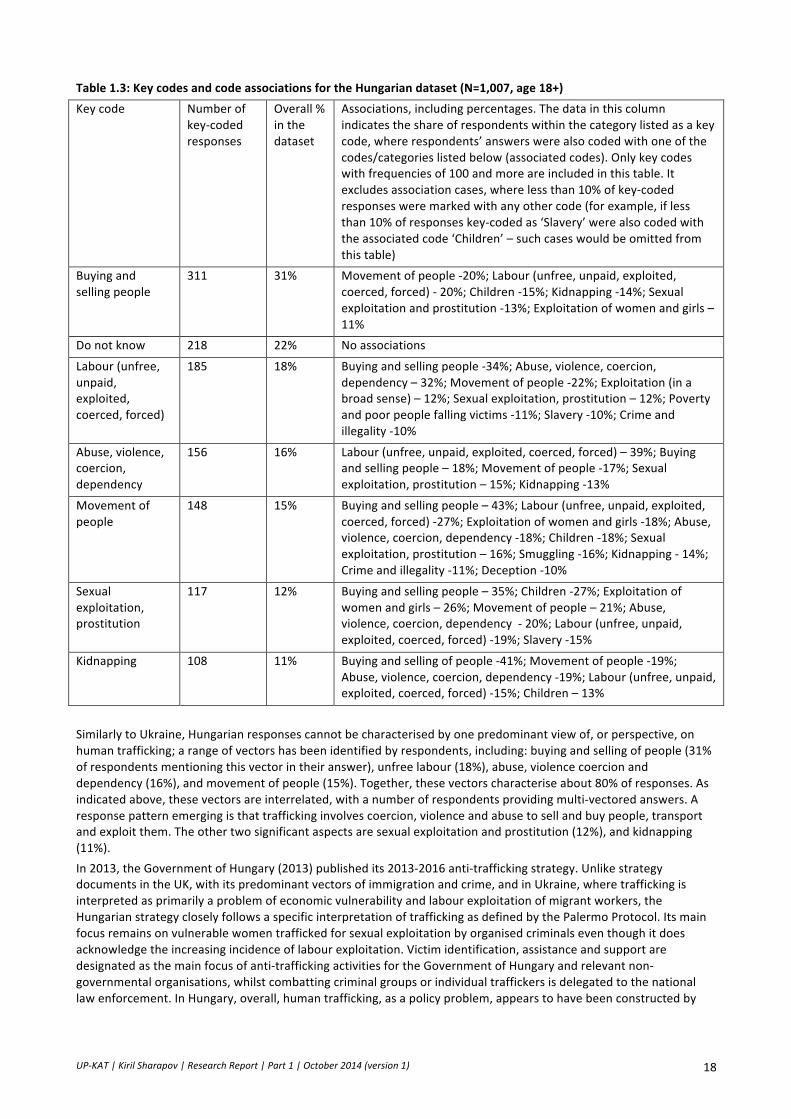
UP-‐KAT | Kiril Sharapov | Research Report | Part 1 | October 2014 (version 1) 18
Table 1.3: Key codes and code associations for the Hungarian dataset (N=1,007, age 18+)
Key code Number of key-‐coded responses
Overall % in the dataset
Associations, including percentages. The data in this column indicates the share of respondents within the category listed as a key code, where respondents’ answers were also coded with one of the codes/categories listed below (associated codes). Only key codes with frequencies of 100 and more are included in this table. It excludes association cases, where less than 10% of key-‐coded responses were marked with any other code (for example, if less than 10% of responses key-‐coded as ‘Slavery’ were also coded with the associated code ‘Children’ – such cases would be omitted from this table)
Buying and selling people
311 31% Movement of people -‐20%; Labour (unfree, unpaid, exploited, coerced, forced) -‐ 20%; Children -‐15%; Kidnapping -‐14%; Sexual exploitation and prostitution -‐13%; Exploitation of women and girls – 11%
Do not know 218 22% No associations
Labour (unfree, unpaid, exploited, coerced, forced)
185 18% Buying and selling people -‐34%; Abuse, violence, coercion, dependency – 32%; Movement of people -‐22%; Exploitation (in a broad sense) – 12%; Sexual exploitation, prostitution – 12%; Poverty and poor people falling victims -‐11%; Slavery -‐10%; Crime and illegality -‐10%
Abuse, violence, coercion, dependency
156 16% Labour (unfree, unpaid, exploited, coerced, forced) – 39%; Buying and selling people – 18%; Movement of people -‐17%; Sexual exploitation, prostitution – 15%; Kidnapping -‐13%
Movement of people
148 15% Buying and selling people – 43%; Labour (unfree, unpaid, exploited, coerced, forced) -‐27%; Exploitation of women and girls -‐18%; Abuse, violence, coercion, dependency -‐18%; Children -‐18%; Sexual exploitation, prostitution – 16%; Smuggling -‐16%; Kidnapping -‐ 14%; Crime and illegality -‐11%; Deception -‐10%
Sexual exploitation, prostitution
117 12% Buying and selling people – 35%; Children -‐27%; Exploitation of women and girls – 26%; Movement of people – 21%; Abuse, violence, coercion, dependency -‐ 20%; Labour (unfree, unpaid, exploited, coerced, forced) -‐19%; Slavery -‐15%
Kidnapping 108 11% Buying and selling of people -‐41%; Movement of people -‐19%; Abuse, violence, coercion, dependency -‐19%; Labour (unfree, unpaid, exploited, coerced, forced) -‐15%; Children – 13%
Similarly to Ukraine, Hungarian responses cannot be characterised by one predominant view of, or perspective, on human trafficking; a range of vectors has been identified by respondents, including: buying and selling of people (31% of respondents mentioning this vector in their answer), unfree labour (18%), abuse, violence coercion and dependency (16%), and movement of people (15%). Together, these vectors characterise about 80% of responses. As indicated above, these vectors are interrelated, with a number of respondents providing multi-‐vectored answers. A response pattern emerging is that trafficking involves coercion, violence and abuse to sell and buy people, transport and exploit them. The other two significant aspects are sexual exploitation and prostitution (12%), and kidnapping (11%). In 2013, the Government of Hungary (2013) published its 2013-‐2016 anti-‐trafficking strategy. Unlike strategy documents in the UK, with its predominant vectors of immigration and crime, and in Ukraine, where trafficking is interpreted as primarily a problem of economic vulnerability and labour exploitation of migrant workers, the Hungarian strategy closely follows a specific interpretation of trafficking as defined by the Palermo Protocol. Its main focus remains on vulnerable women trafficked for sexual exploitation by organised criminals even though it does acknowledge the increasing incidence of labour exploitation. Victim identification, assistance and support are designated as the main focus of anti-‐trafficking activities for the Government of Hungary and relevant non-‐governmental organisations, whilst combatting criminal groups or individual traffickers is delegated to the national law enforcement. In Hungary, overall, human trafficking, as a policy problem, appears to have been constructed by
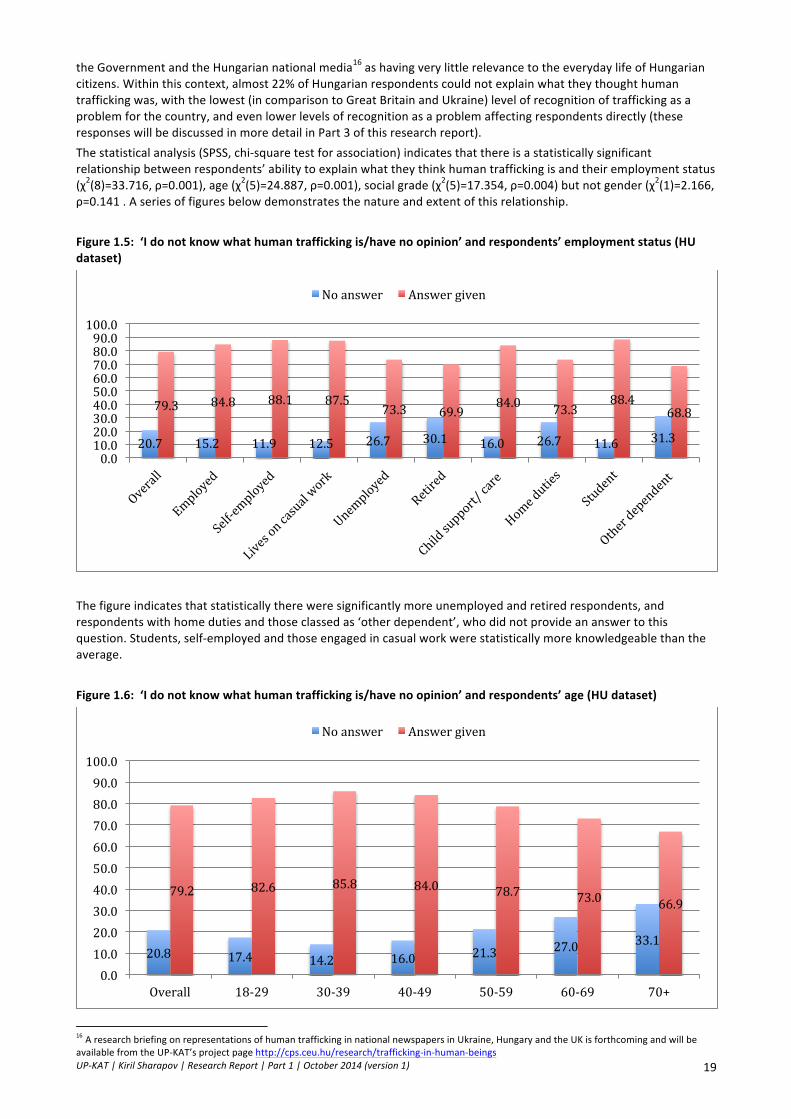
UP-‐KAT | Kiril Sharapov | Research Report | Part 1 | October 2014 (version 1) 19
the Government and the Hungarian national media16 as having very little relevance to the everyday life of Hungarian citizens. Within this context, almost 22% of Hungarian respondents could not explain what they thought human trafficking was, with the lowest (in comparison to Great Britain and Ukraine) level of recognition of trafficking as a problem for the country, and even lower levels of recognition as a problem affecting respondents directly (these responses will be discussed in more detail in Part 3 of this research report). The statistical analysis (SPSS, chi-‐square test for association) indicates that there is a statistically significant relationship between respondents’ ability to explain what they think human trafficking is and their employment status (χ2(8)=33.716, ρ=0.001), age (χ2(5)=24.887, ρ=0.001), social grade (χ2(5)=17.354, ρ=0.004) but not gender (χ2(1)=2.166, ρ=0.141 . A series of figures below demonstrates the nature and extent of this relationship. Figure 1.5: ‘I do not know what human trafficking is/have no opinion’ and respondents’ employment status (HU dataset)
The figure indicates that statistically there were significantly more unemployed and retired respondents, and respondents with home duties and those classed as ‘other dependent’, who did not provide an answer to this question. Students, self-‐employed and those engaged in casual work were statistically more knowledgeable than the average. Figure 1.6: ‘I do not know what human trafficking is/have no opinion’ and respondents’ age (HU dataset)
16 A research briefing on representations of human trafficking in national newspapers in Ukraine, Hungary and the UK is forthcoming and will be available from the UP-‐KAT’s project page http://cps.ceu.hu/research/trafficking-‐in-‐human-‐beings
20.7 15.2 11.9 12.5 26.7 30.1 16.0 26.7 11.6 31.3
79.3 84.8 88.1 87.5 73.3 69.9
84.0 73.3 88.4
68.8
0.0 10.0 20.0 30.0 40.0 50.0 60.0 70.0 80.0 90.0 100.0
No answer Answer given
20.8 17.4 14.2 16.0 21.3 27.0 33.1
79.2 82.6 85.8 84.0 78.7 73.0 66.9
0.0 10.0 20.0 30.0 40.0 50.0 60.0 70.0 80.0 90.0 100.0
Overall 18-‐29 30-‐39 40-‐49 50-‐59 60-‐69 70+
No answer Answer given
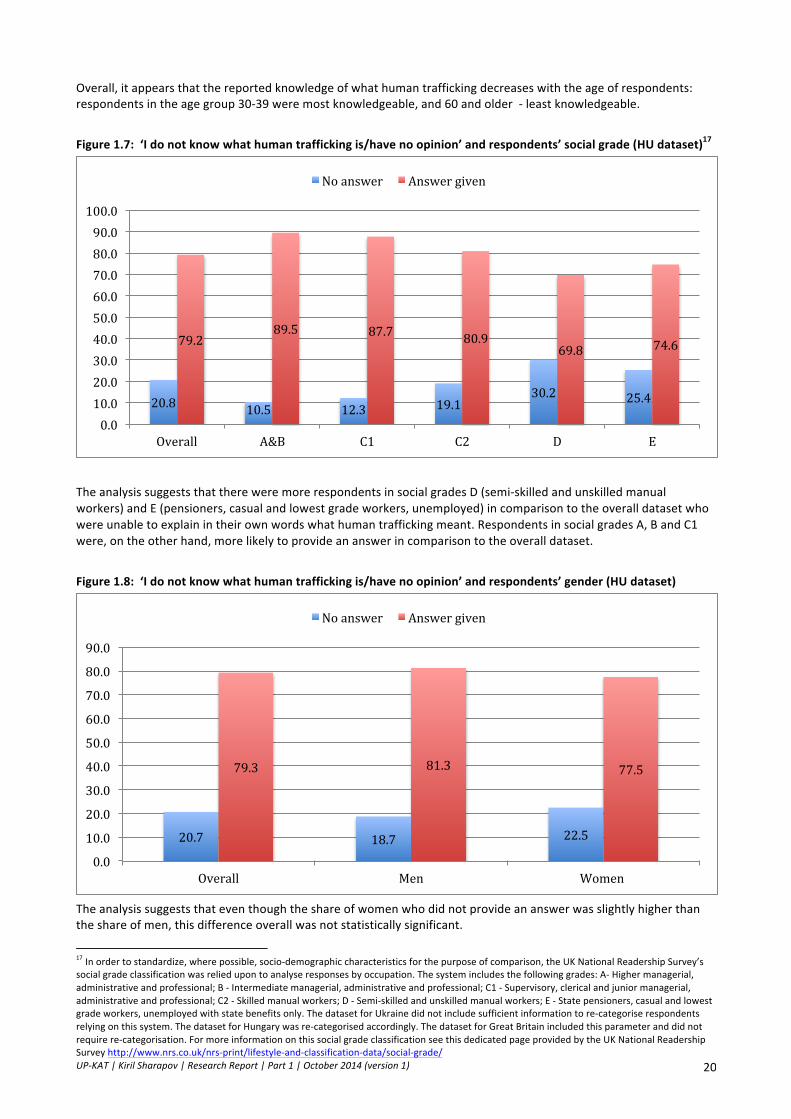
UP-‐KAT | Kiril Sharapov | Research Report | Part 1 | October 2014 (version 1) 20
Overall, it appears that the reported knowledge of what human trafficking decreases with the age of respondents: respondents in the age group 30-‐39 were most knowledgeable, and 60 and older -‐ least knowledgeable. Figure 1.7: ‘I do not know what human trafficking is/have no opinion’ and respondents’ social grade (HU dataset)17
The analysis suggests that there were more respondents in social grades D (semi-‐skilled and unskilled manual workers) and E (pensioners, casual and lowest grade workers, unemployed) in comparison to the overall dataset who were unable to explain in their own words what human trafficking meant. Respondents in social grades A, B and C1 were, on the other hand, more likely to provide an answer in comparison to the overall dataset. Figure 1.8: ‘I do not know what human trafficking is/have no opinion’ and respondents’ gender (HU dataset)
The analysis suggests that even though the share of women who did not provide an answer was slightly higher than the share of men, this difference overall was not statistically significant.
17 In order to standardize, where possible, socio-‐demographic characteristics for the purpose of comparison, the UK National Readership Survey’s social grade classification was relied upon to analyse responses by occupation. The system includes the following grades: A-‐ Higher managerial, administrative and professional; B -‐ Intermediate managerial, administrative and professional; C1 -‐ Supervisory, clerical and junior managerial, administrative and professional; C2 -‐ Skilled manual workers; D -‐ Semi-‐skilled and unskilled manual workers; E -‐ State pensioners, casual and lowest grade workers, unemployed with state benefits only. The dataset for Ukraine did not include sufficient information to re-‐categorise respondents relying on this system. The dataset for Hungary was re-‐categorised accordingly. The dataset for Great Britain included this parameter and did not require re-‐categorisation. For more information on this social grade classification see this dedicated page provided by the UK National Readership Survey http://www.nrs.co.uk/nrs-‐print/lifestyle-‐and-‐classification-‐data/social-‐grade/
20.8 10.5 12.3 19.1 30.2 25.4
79.2 89.5 87.7 80.9
69.8 74.6
0.0 10.0 20.0 30.0 40.0 50.0 60.0 70.0 80.0 90.0 100.0
Overall A&B C1 C2 D E
No answer Answer given
20.7 18.7 22.5
79.3 81.3 77.5
0.0
10.0
20.0
30.0
40.0
50.0
60.0
70.0
80.0
90.0
Overall Men Women
No answer Answer given
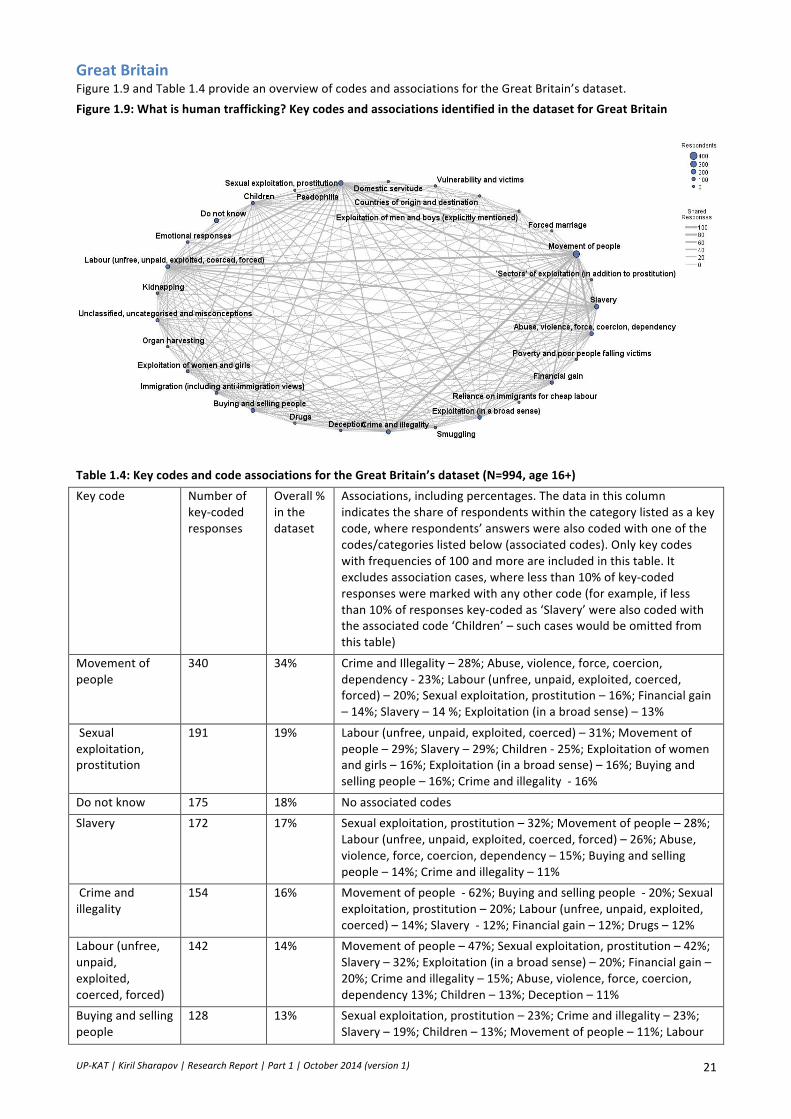
UP-‐KAT | Kiril Sharapov | Research Report | Part 1 | October 2014 (version 1) 21
Great Britain Figure 1.9 and Table 1.4 provide an overview of codes and associations for the Great Britain’s dataset. Figure 1.9: What is human trafficking? Key codes and associations identified in the dataset for Great Britain
Table 1.4: Key codes and code associations for the Great Britain’s dataset (N=994, age 16+)
Key code Number of key-‐coded responses
Overall % in the dataset
Associations, including percentages. The data in this column indicates the share of respondents within the category listed as a key code, where respondents’ answers were also coded with one of the codes/categories listed below (associated codes). Only key codes with frequencies of 100 and more are included in this table. It excludes association cases, where less than 10% of key-‐coded responses were marked with any other code (for example, if less than 10% of responses key-‐coded as ‘Slavery’ were also coded with the associated code ‘Children’ – such cases would be omitted from this table)
Movement of people
340 34% Crime and Illegality – 28%; Abuse, violence, force, coercion, dependency -‐ 23%; Labour (unfree, unpaid, exploited, coerced, forced) – 20%; Sexual exploitation, prostitution – 16%; Financial gain – 14%; Slavery – 14 %; Exploitation (in a broad sense) – 13%
Sexual exploitation, prostitution
191 19% Labour (unfree, unpaid, exploited, coerced) – 31%; Movement of people – 29%; Slavery – 29%; Children -‐ 25%; Exploitation of women and girls – 16%; Exploitation (in a broad sense) – 16%; Buying and selling people – 16%; Crime and illegality -‐ 16%
Do not know 175 18% No associated codes
Slavery 172 17% Sexual exploitation, prostitution – 32%; Movement of people – 28%; Labour (unfree, unpaid, exploited, coerced, forced) – 26%; Abuse, violence, force, coercion, dependency – 15%; Buying and selling people – 14%; Crime and illegality – 11%
Crime and illegality
154 16% Movement of people -‐ 62%; Buying and selling people -‐ 20%; Sexual exploitation, prostitution – 20%; Labour (unfree, unpaid, exploited, coerced) – 14%; Slavery -‐ 12%; Financial gain – 12%; Drugs – 12%
Labour (unfree, unpaid, exploited, coerced, forced)
142 14% Movement of people – 47%; Sexual exploitation, prostitution – 42%; Slavery – 32%; Exploitation (in a broad sense) – 20%; Financial gain – 20%; Crime and illegality – 15%; Abuse, violence, force, coercion, dependency 13%; Children – 13%; Deception – 11%
Buying and selling people
128 13% Sexual exploitation, prostitution – 23%; Crime and illegality – 23%; Slavery – 19%; Children – 13%; Movement of people – 11%; Labour
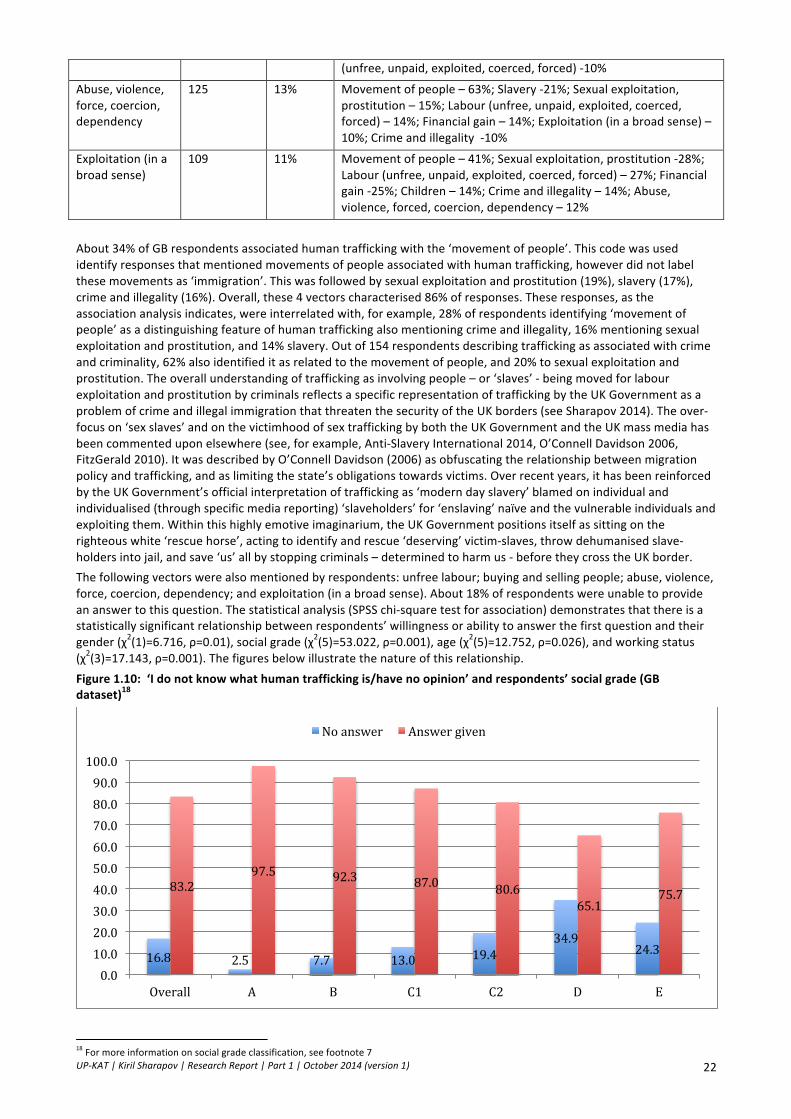
UP-‐KAT | Kiril Sharapov | Research Report | Part 1 | October 2014 (version 1) 22
(unfree, unpaid, exploited, coerced, forced) -‐10%
Abuse, violence, force, coercion, dependency
125 13% Movement of people – 63%; Slavery -‐21%; Sexual exploitation, prostitution – 15%; Labour (unfree, unpaid, exploited, coerced, forced) – 14%; Financial gain – 14%; Exploitation (in a broad sense) – 10%; Crime and illegality -‐10%
Exploitation (in a broad sense)
109 11% Movement of people – 41%; Sexual exploitation, prostitution -‐28%; Labour (unfree, unpaid, exploited, coerced, forced) – 27%; Financial gain -‐25%; Children – 14%; Crime and illegality – 14%; Abuse, violence, forced, coercion, dependency – 12%
About 34% of GB respondents associated human trafficking with the ‘movement of people’. This code was used identify responses that mentioned movements of people associated with human trafficking, however did not label these movements as ‘immigration’. This was followed by sexual exploitation and prostitution (19%), slavery (17%), crime and illegality (16%). Overall, these 4 vectors characterised 86% of responses. These responses, as the association analysis indicates, were interrelated with, for example, 28% of respondents identifying ‘movement of people’ as a distinguishing feature of human trafficking also mentioning crime and illegality, 16% mentioning sexual exploitation and prostitution, and 14% slavery. Out of 154 respondents describing trafficking as associated with crime and criminality, 62% also identified it as related to the movement of people, and 20% to sexual exploitation and prostitution. The overall understanding of trafficking as involving people – or ‘slaves’ -‐ being moved for labour exploitation and prostitution by criminals reflects a specific representation of trafficking by the UK Government as a problem of crime and illegal immigration that threaten the security of the UK borders (see Sharapov 2014). The over-‐focus on ‘sex slaves’ and on the victimhood of sex trafficking by both the UK Government and the UK mass media has been commented upon elsewhere (see, for example, Anti-‐Slavery International 2014, O’Connell Davidson 2006, FitzGerald 2010). It was described by O’Connell Davidson (2006) as obfuscating the relationship between migration policy and trafficking, and as limiting the state’s obligations towards victims. Over recent years, it has been reinforced by the UK Government’s official interpretation of trafficking as ‘modern day slavery’ blamed on individual and individualised (through specific media reporting) ‘slaveholders’ for ‘enslaving’ naïve and the vulnerable individuals and exploiting them. Within this highly emotive imaginarium, the UK Government positions itself as sitting on the righteous white ‘rescue horse’, acting to identify and rescue ‘deserving’ victim-‐slaves, throw dehumanised slave-‐holders into jail, and save ‘us’ all by stopping criminals – determined to harm us -‐ before they cross the UK border. The following vectors were also mentioned by respondents: unfree labour; buying and selling people; abuse, violence, force, coercion, dependency; and exploitation (in a broad sense). About 18% of respondents were unable to provide an answer to this question. The statistical analysis (SPSS chi-‐square test for association) demonstrates that there is a statistically significant relationship between respondents’ willingness or ability to answer the first question and their gender (χ2(1)=6.716, ρ=0.01), social grade (χ2(5)=53.022, ρ=0.001), age (χ2(5)=12.752, ρ=0.026), and working status (χ2(3)=17.143, ρ=0.001). The figures below illustrate the nature of this relationship. Figure 1.10: ‘I do not know what human trafficking is/have no opinion’ and respondents’ social grade (GB dataset)18
18 For more information on social grade classification, see footnote 7
16.8 2.5 7.7 13.0 19.4 34.9
24.3
83.2 97.5 92.3 87.0 80.6
65.1 75.7
0.0 10.0 20.0 30.0 40.0 50.0 60.0 70.0 80.0 90.0 100.0
Overall A B C1 C2 D E
No answer Answer given
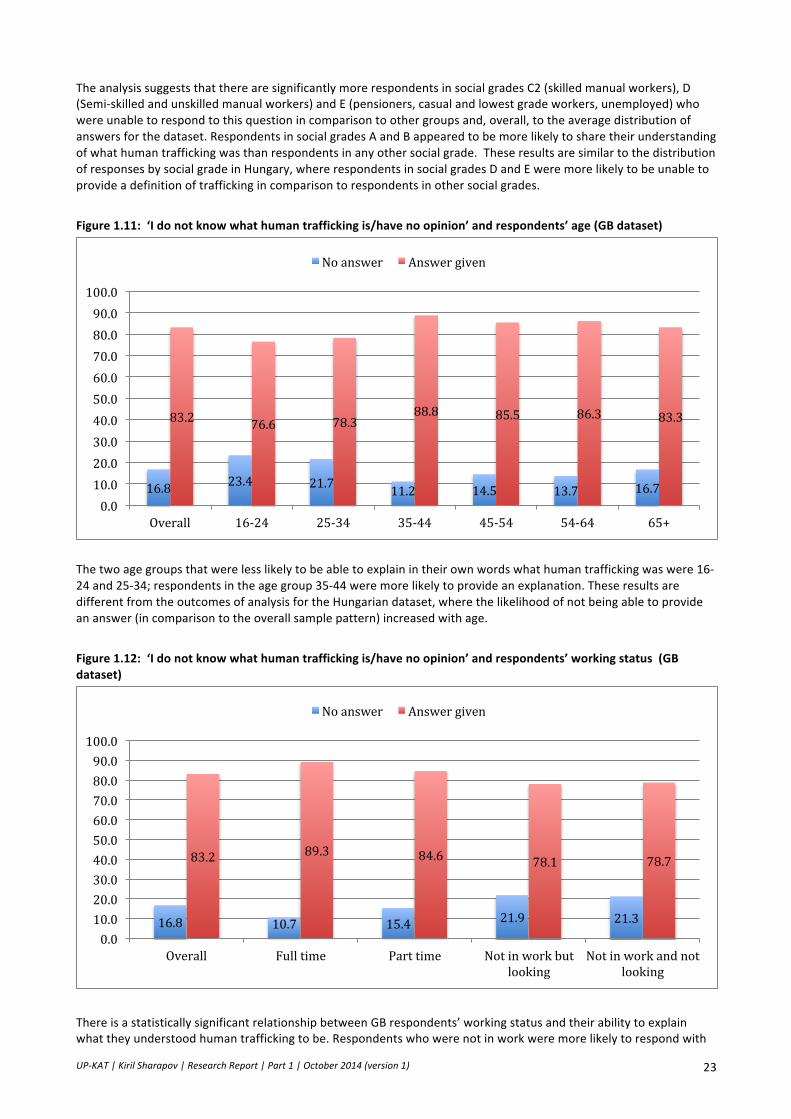
UP-‐KAT | Kiril Sharapov | Research Report | Part 1 | October 2014 (version 1) 23
The analysis suggests that there are significantly more respondents in social grades C2 (skilled manual workers), D (Semi-‐skilled and unskilled manual workers) and E (pensioners, casual and lowest grade workers, unemployed) who were unable to respond to this question in comparison to other groups and, overall, to the average distribution of answers for the dataset. Respondents in social grades A and B appeared to be more likely to share their understanding of what human trafficking was than respondents in any other social grade. These results are similar to the distribution of responses by social grade in Hungary, where respondents in social grades D and E were more likely to be unable to provide a definition of trafficking in comparison to respondents in other social grades. Figure 1.11: ‘I do not know what human trafficking is/have no opinion’ and respondents’ age (GB dataset)
The two age groups that were less likely to be able to explain in their own words what human trafficking was were 16-‐24 and 25-‐34; respondents in the age group 35-‐44 were more likely to provide an explanation. These results are different from the outcomes of analysis for the Hungarian dataset, where the likelihood of not being able to provide an answer (in comparison to the overall sample pattern) increased with age. Figure 1.12: ‘I do not know what human trafficking is/have no opinion’ and respondents’ working status (GB dataset)
There is a statistically significant relationship between GB respondents’ working status and their ability to explain what they understood human trafficking to be. Respondents who were not in work were more likely to respond with
16.8 23.4 21.7 11.2 14.5 13.7 16.7
83.2 76.6 78.3 88.8 85.5 86.3 83.3
0.0 10.0 20.0 30.0 40.0 50.0 60.0 70.0 80.0 90.0 100.0
Overall 16-‐24 25-‐34 35-‐44 45-‐54 54-‐64 65+
No answer Answer given
16.8 10.7 15.4 21.9 21.3
83.2 89.3 84.6 78.1 78.7
0.0 10.0 20.0 30.0 40.0 50.0 60.0 70.0 80.0 90.0 100.0
Overall Full time Part time Not in work but looking
Not in work and not looking
No answer Answer given

UP-‐KAT | Kiril Sharapov | Research Report | Part 1 | October 2014 (version 1) 24
‘do not know/no opinion’ in comparison to working respondents (both full time and part time). Respondents working full time were more likely than any other group in this sample to be able to provide a definition. Figure 1.13: ‘I do not know what human trafficking is/have no opinion’ and respondents’ gender (GB dataset)
There was a significant relationship between respondents’ gender and their ability to answer this question: women were less likely to provide an answer than men.
Comparing responses from Ukraine, Hungary and Great Britain Any comparison of responses within these three samples must be done with caution given that:
(a) Randomised national samples are representative of national populations falling within different age rages: 15-‐59 in Ukraine, 18 and older in Hungary, and 16 and older in Great Britain. The analysis of responses to closed questions is contained in Part 3; it includes two separate parts: analysis of national samples in their entirety (N=1,000), and cross-‐national comparisons of samples, which underwent a sample-‐reduction procedure to adjust for age and to allow for the analysis of responses falling within the age range of 18-‐59 shared across the three samples. The final number of respondents for each sample decreased to 693 (N=693) resulting in the increased margin of error of 3.72 at the standard 95% confidence level. Such a sample-‐reduction procedure was not performed for the open-‐ended question data-‐sets since any qualitative analysis, as a process of meaning-‐making, involves not only embodied, situated and subjective respondents but also an equally embodied, situated and subjective researcher, whose epistemological, ontological and theoretical assumptions in designing and interpreting research may render a complete statistical equivalence of samples as secondary. It is also worth noting that the margin of error for national datasets (N=1,000) (at the 95% confidence level) is plus or minus 3.1 percentage points.
(b) Three different survey providers operating in three different case-‐study countries undertook the surveys. This may have resulted in a combination of both sampling and non-‐sampling errors (in particular, errors linked to the interviewer effect and response bias) further amplified by the context of cross-‐national research.
(c) Responses recorded within these data sets indicate the initial ‘off-‐the-‐top-‐of-‐my-‐head’ individual responses, which means that even when some aspects of trafficking were not immediately mentioned by a respondent and, as a result, were not recorded within the context of this survey, it does not necessarily mean that respondents had no knowledge of these aspects. This is especially the case with those aspects of trafficking, which remain less prominent in the national media reporting, such as, for example, trafficking for the purposes of forced marriage.
With the above caveats in mind, it is possible to indicatively compare how respondents from the three case-‐study samples interpreted trafficking by looking at differences or similarities in the key identifications of human trafficking (THB identifications). These are presented in Table 1.5 below. Although some observed identification frequencies are low (for example, ‘begging’), it is impossible to identify the optimum or required level of identification. Within the context of methodological limitations outlined above, the table below offers an overall interpretation and general suggestions on what the differences between national samples may mean.
16.8 13.6 19.8
83.2 86.4 80.2
0.0 10.0 20.0 30.0 40.0 50.0 60.0 70.0 80.0 90.0 100.0
Overall Men Women
No answer Answer given

UP-‐KAT | Kiril Sharapov | Research Report | Part 1 | October 2014 (version 1) 25
Table 1.5: ‘What does human trafficking mean?’ – (indicatively) comparing national responses19
UA N=1,000 Age: 15-‐59
HU N=1,000 Age: 18 and older
GB N=1,000 Age: 16 and older
What it means: some suggestions (THB = ‘Trafficking in Human Beings’)
Abuse, violence, coercion, dependency
13% 16% 13% Generally equal levels of THB identification with abuse, violence, coercion, dependency
Begging <1% <1% 0% Very low levels of THB identification with begging
Buying and selling people
23% 31% 13% Lower levels of THB identification with the process of buying and selling of people by GB respondents. This may be linked to the dominant representation in the UK policies and media as a problem of crime and immigration (movement of people)
Children 2% 10% 9% Lower levels of THB identification with trafficking in children in Ukraine
Countries of origin and destination
0% 2% <1% No mention of specific countries of origin or destination by Ukrainian respondents
Crime and illegality 15% 8% 16% A higher level of THB identification with crime and illegality in Great Britain. This may reflect the predominant representation of trafficking by the UK Government and the UK media as a matter of crime and immigration.
Deception 8% 4% 3% A higher level of THB identification with deception in Ukraine, which may reflect the representation of trafficking by the government and media as a problem of vulnerable Ukrainian citizens misled, deceived and exploited for their labour abroad
Demand 0% <1% 0% No THB identification with demand for goods and services produced with the involvement of trafficked and/or exploited labour in any of the case-‐study countries. The extent, to which the general public associates human trafficking with labour exploitation, and labour exploitation with consumption, needs further research
Do not know 10% 22% 18% A higher level of non-‐awareness of human trafficking among respondents in Hungary. The comparative data for these three samples (N=693, age 18-‐59) are: 9% in Ukraine, 19% in Hungary, and 17% in Great Britain.
Domestic servitude 0% 0% <1% No THB identification with domestic servitude
Drugs 0% <1% 2% THB identification with drugs as part of criminal enterprise
Emotional responses
5% 2% 4% -‐
Exploitation (in a broad sense)
10% 8% 11% Comparable levels of THB identification with exploitation generally (where respondents did not specify any particular type of exploitation -‐ i.e. for sexual, physical or emotional labour)
Exploitation of men and boys
0% <1% 1% Low levels of THB identification with exploitation of men and boys (when ‘men’ or ‘boys’ were explicitly mentioned by a respondent)
Exploitation of women and girls
3% 8% 5% These levels of THB identification should be read in conjunction with ‘Sexual exploitation and prostitution’. A separate code was used where exploitation was explicitly associated with women and girls; cases where the sexual
19 Please note that any comparison in this table is based on national samples, which slightly differ in terms of age of respondents. Part 3 of this research briefing provides further analysis of responses adjusted for age.
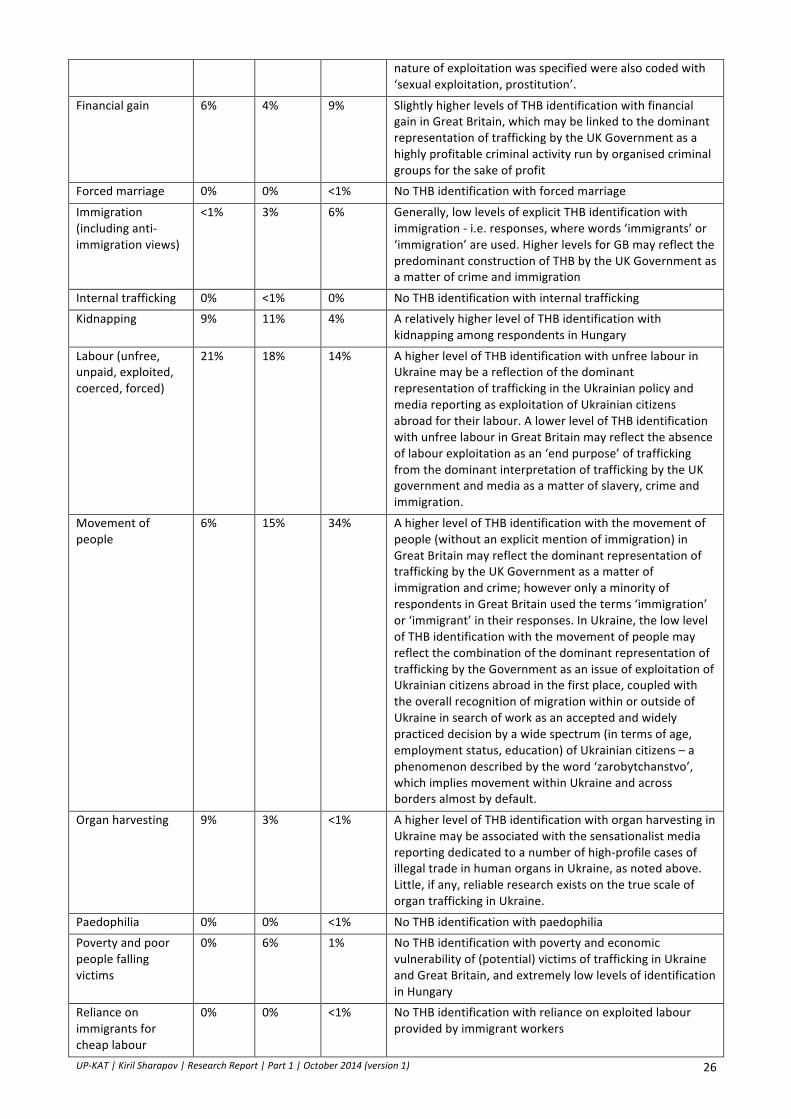
UP-‐KAT | Kiril Sharapov | Research Report | Part 1 | October 2014 (version 1) 26
nature of exploitation was specified were also coded with ‘sexual exploitation, prostitution’.
Financial gain 6% 4% 9% Slightly higher levels of THB identification with financial gain in Great Britain, which may be linked to the dominant representation of trafficking by the UK Government as a highly profitable criminal activity run by organised criminal groups for the sake of profit
Forced marriage 0% 0% <1% No THB identification with forced marriage
Immigration (including anti-‐immigration views)
<1% 3% 6% Generally, low levels of explicit THB identification with immigration -‐ i.e. responses, where words ‘immigrants’ or ‘immigration’ are used. Higher levels for GB may reflect the predominant construction of THB by the UK Government as a matter of crime and immigration
Internal trafficking 0% <1% 0% No THB identification with internal trafficking
Kidnapping 9% 11% 4% A relatively higher level of THB identification with kidnapping among respondents in Hungary
Labour (unfree, unpaid, exploited, coerced, forced)
21% 18% 14% A higher level of THB identification with unfree labour in Ukraine may be a reflection of the dominant representation of trafficking in the Ukrainian policy and media reporting as exploitation of Ukrainian citizens abroad for their labour. A lower level of THB identification with unfree labour in Great Britain may reflect the absence of labour exploitation as an ‘end purpose’ of trafficking from the dominant interpretation of trafficking by the UK government and media as a matter of slavery, crime and immigration.
Movement of people
6% 15% 34% A higher level of THB identification with the movement of people (without an explicit mention of immigration) in Great Britain may reflect the dominant representation of trafficking by the UK Government as a matter of immigration and crime; however only a minority of respondents in Great Britain used the terms ‘immigration’ or ‘immigrant’ in their responses. In Ukraine, the low level of THB identification with the movement of people may reflect the combination of the dominant representation of trafficking by the Government as an issue of exploitation of Ukrainian citizens abroad in the first place, coupled with the overall recognition of migration within or outside of Ukraine in search of work as an accepted and widely practiced decision by a wide spectrum (in terms of age, employment status, education) of Ukrainian citizens – a phenomenon described by the word ‘zarobytchanstvo’, which implies movement within Ukraine and across borders almost by default.
Organ harvesting 9% 3% <1% A higher level of THB identification with organ harvesting in Ukraine may be associated with the sensationalist media reporting dedicated to a number of high-‐profile cases of illegal trade in human organs in Ukraine, as noted above. Little, if any, reliable research exists on the true scale of organ trafficking in Ukraine.
Paedophilia 0% 0% <1% No THB identification with paedophilia
Poverty and poor people falling victims
0% 6% 1% No THB identification with poverty and economic vulnerability of (potential) victims of trafficking in Ukraine and Great Britain, and extremely low levels of identification in Hungary
Reliance on immigrants for cheap labour
0% 0% <1% No THB identification with reliance on exploited labour provided by immigrant workers

UP-‐KAT | Kiril Sharapov | Research Report | Part 1 | October 2014 (version 1) 27
Removal of documents
3% 0% 0% No THB identification with the removal of documents in Hungary and Great Britain, and a low level of identification in Ukraine, which may be linked to the representation of trafficking in the Ukrainian policy and media as exploitation of deceived Ukrainian workers abroad, whose documents are removed to exert more control over them
Sectors, places of exploitation (in addition to prostitution)
0% <1% <1% Only a few respondents in Hungary and Great Britain named sectors (excluding prostitution) where trafficked people are exploited
Sexual exploitation, prostitution
16% 12% 19% THB identification with prostitution and sexual exploitation reflects the prevalent interpretation of THB by national governments, media and some non-‐governmental organisations as involving primarily sexual exploitation of female victims.
Slavery 26% 9% 17% High levels of THB identification with slavery in Ukraine can be explained by the prevalent media reporting of trafficking as ‘slavery’; in the UK, the 17% level of THB identification with slavery may reflect the now well-‐established interpretation of trafficking as ‘modern-‐day slavery’ by the UK Government – an individualised act of criminal evil-‐doing by individual slave-‐holders directed at individual victims.
Smuggling <1% 6% 3% Low levels of identification of THB with smuggling
Unclassified, misconceptions and uncategorised
<1% 6% 9% This code was used to identify responses, which included clear misconceptions about the nature of human trafficking, and also responses, which would not have been categorised into any of the identified codes/categories. Some examples of responses coded under this category are included below.
Victims and victims’ vulnerability
1% 2% 1% Low levels of explicit THB identification with victims of trafficking and their vulnerability were registered for all three countries. However, as noted above, these results represent respondents’ immediate and spontaneous responses, and should be interpreted as such. For example, if the word ‘slavery’ or ‘slaves’ was used by an individual respondent, it may also mean that ‘slaves’ could have been described as ‘victims’ by the same respondent if further questions asking to clarify the initial response were asked.
Violation of rights 3% <1% 0% A slightly higher level of THB identification with the violation of human rights in Ukraine may reflect the policy interpretation of trafficking as involving the violation of human rights of Ukrainian citizens and workers who are exploited for their labour abroad; the overall level however remains low.
Who is responsible (in addition to criminals)
0% 1% 0% No THB identification with other agencies, entities and individuals (for examples, individual consumers, corporations, businesses, governments), apart from criminals, who may be responsible for trafficking and exploitation of human beings
Unclassified: misconceptions and uncategorised responses As noted in the table above, a number of responses within each national sample were coded as ‘Unclassified, misconceptions and uncategorised’ (less than 1% of UA responses, 6% of HU responses, and 9% of GB responses). This code comprises of the following two categories: ‘misconceptions’ -‐ to code obviously erroneous responses, including those exhibiting racist, sexist, anti-‐immigrant attitudes; and ‘unclassified/uncategorised’ to code responses, which contained some information, however information which was insufficient or confusing to allow the assignment of any other code/category.
UP-‐KAT | Kiril Sharapov | Research Report | Part 1 | October 2014 (version 1) 28
The code ‘misconceptions’ was used to mark responses, which provided a clearly erroneous understanding of trafficking not linked to any other relevant concepts: for example, ‘Negative feelings for money’; or linked to other concepts, including immigration, crime and illegality, prostitution but containing an obvious error or exhibiting racist, sexist, offensive, or anti-‐immigrant attitudes. For example, ‘Gypsies bossing people around making them do menial work’. The number of responses exhibiting a range of racist attitudes was too low to allow for any reliable conclusions however one of the trends that can be identified, especially within the context of the Hungarian dataset, is that some respondents perceived trafficking as associated with some ethnic groups more than others. This code was not used to mark responses that provided a one-‐dimensional understanding of trafficking – for example, as a matter of immigration – but which contained no offensive, sexist, racist, anti-‐immigration and alike attitudes. Such responses were coded using the full coding range. For example, had the response above not used a derogative term to refer to Roma, and, instead, was phrased as ‘Criminals forcing people into menial work’, it would have been marked with the codes ‘Crime and illegality’ and ‘Unfree labour’. Within the Ukrainian sample, only 3 responses were coded as ‘Unclassified, misconceptions and uncategorised’ – the lowest among the three. Ukraine was also the country with the lowers level of ‘do not know/no opinion’ responses in comparison to Hungary and Great Britain. Within the Hungarian sample, 29% of 55 responses in this category were linked to the code ‘immigration’ (to mark responses exhibiting anti-‐immigration attitudes), 16% were linked to the code ‘labour’, 15% to ‘crime and illegality’, 15% to ‘slavery’, 15% to ‘sexual exploitation and prostitution’, 15% to ‘countries of origin and destination’, 11% to ‘buying and selling people’, and 11% to ‘movement of people’. Some examples from the Hungarian sample include: ‘Africa – nothing has value over there’, ‘Exploitation of people deprived of their possessions’, ‘It does not exist in Europe, Arabs have it, they sell people, there slavery exists’, ‘The pimping of whores’, ‘Arranging employment opportunities for immigrant labour illegally’, ‘Usually immigrants are taken illegally to America’, ‘Dumb, base-‐born people are being trafficked’, ‘The world of slavery is over’, ‘It happened in old times with black slaves, nowadays this type of thing is rare’. Within the Great Britain’s sample, about 9% of responses – the highest among the three countries – were coded as ‘Unclassified, misconceptions and uncategorised’. Among these, 69% were also linked to the code ‘immigration’, marking responses exhibiting anti-‐immigration and/or racist attitudes; 20% were linked to the code ‘movement of people’, 14% to the code ‘sexual exploitation, prostitution’, 13% to ‘crime and illegality’, 10% to ‘slavery’ and 10% to labour (unfree, unpaid, exploited, coerced, forced). Some examples from the GB sample include: ‘Allowing foreigners into the UK’, ‘ Means to get into a better country’, ‘When people transport people from other country illegally – it is to do with drugs – they put drugs inside themselves’, ‘I do not take too much notice of it’, ‘Not interested really’, ‘Illegal immigrants’, ‘Bogus asylum seekers’, ‘They come here and know that they are getting into payments’, ‘It’s abroad’, ‘Illegal people coming in here’, ‘Rubbish’, ‘Their own fault for getting into that situation’, ‘Criminals moving here especially [for] benefits’.
‘How did you get to know about human trafficking?’ In order to understand how respondents gained their knowledge of human trafficking, they were asked to identify any sources of information that informed their knowledge before the day of the interview. Respondents’ answers were recorded as given, without any further prompts or follow-‐up questions. Therefore, the data presented below presents only a snapshot of one particular aspect of public knowledge formation on human trafficking. It is acknowledged that the process of knowledge formation, including the framing of issues within mediatised public discourses, is a process rather than an event, and that the formation of individual views and attitudes towards trafficking takes places over time and is influenced by a variety of actors (in addition to the mass media). However, knowing what sources of information respondents perceive as key influences on their knowledge of human trafficking (whether or not these sources of information imparted the initial knowledge of what human trafficking was) is crucial in setting the basis for further research (for example, the impact and role of ‘docufictions’ on human trafficking, which deliver a very specific message on what human trafficking is20) and, equally, in assessing the impact of various awareness-‐raising campaigns (those on-‐going and any future ones). The data presented in Table 1.6 below provides a comparative overview of what sources of information were mentioned by respondents in the three case-‐study countries. The table is based on the data drawn from samples subjected to a sample-‐reduction procedure to allow the selection and analysis of responses falling within the age range of 18-‐59 shared across the three samples. The final number of respondents for each sample decreased from 1,000 to 693 (N=693) resulting in the increased margin of error of 3.72 at the standard 95% confidence level. The table includes items, which recorded a minimum of 10% of responses in at least one of the samples. In addition, two other items are included -‐ ‘I personally know someone who was trafficked’ and ‘I know someone who knows someone who was trafficked’ – to provide an indirect assessment of the scale of trafficking. These data, however, are indicative and cannot be treated as reliable indicators due to the survey’s margin of error
20 See Mendel and Sharapov (forthcoming in 2015)

UP-‐KAT | Kiril Sharapov | Research Report | Part 1 | October 2014 (version 1) 29
and other methodological limitations (including various types of response bias, such as acquiescence, social desirability, extreme responding etc.) inherent in public opinion surveys. Table 1.6: How respondents got to know about human trafficking (national samples, N=693, age: 18-‐59)
Sources of information Ukraine, % of respondents
Hungary, % of respondents
Great Britain, % of respondents
I personally know someone who was trafficked 3.3 4.9 1.0
I know someone who knows someone who was trafficked
5.1 6.5 2.0
Someone I know told me about it 7.3 14.4 4.4
Watched a news programme on TV 53.4 80.4 59.8
Watched a documentary on TV 44.8 26.3 38.7
Watched a film on TV 30.5 18.1 16.1
Listened to a programme on the radio 8.9 25.6 20.0
Read an article in the newspaper 17.7 35.6 40.0
Read about it on the internet 22.7 23.0 14.0
The results above demonstrate that TV news programmes represent the most commonly referred to source of information by respondents, with the highest proportion of respondents who learnt about human trafficking by watching a news programme recorded for Hungary (about 80%), followed by Great Britain (about 60%) and Ukraine (about 53%). This is followed by TV documentaries, with about 45% of respondents in Ukraine mentioning TV documentaries, followed by Great Britain (39%), and Hungary (26%). A TV film as a source of information also received a high number of responses: 31% in Ukraine, 18% in Hungary and 16% in Great Britain. Overall, it appeared that TV programmes generally were the main sources of information on human trafficking for respondents in this survey. Newspapers also played a significant role, especially in Great Britain where about 40% of respondents mentioned it as a source of information, followed by Hungary (36%) and a markedly lower share of respondents mentioning newspapers in Ukraine (18%). These were followed by radio programmes (in Hungary and Great Britain) and the Internet (with the highest share of respondents mentioning the Internet in Ukraine). The figure below provides a graphic representation of these data on a country-‐by-‐country basis. Figure 1.14: How Respondents Got to Know about Human Trafficking (national samples, N=693, age: 18-‐59)
Conclusions (Part 1) Despite controversies, contradictions and reservations surrounding the nature of public opinion, its relationship to public policy and mass media, and public opinion research methodology, ‘snapshots’ of public opinion on complex social issues offer a unique insight into no less complex processes of how these issues are constructed within dominant government discourses. The ‘snapshot’ of public understanding of human trafficking in the three case-‐study
7.3 14.4 4.4
53.4
80.4
59.8 44.8
26.3 38.7
30.5 18.1 16.1 8.9
25.6 20 17.7
35.6 40
22.7 23 14
0
10
20
30
40
50
60
70
80
90
UA HU GB
Someone I know told me
TV news programme
TV documentary
TV Vilm
Radio
Newspaper
The Internet
UP-‐KAT | Kiril Sharapov | Research Report | Part 1 | October 2014 (version 1) 30
countries highlights its complexity where a number of ‘vectors’ intersect in a complex pattern of individual responses to form three distinct national-‐level patterns of opinion. Although the majority of these vectors can be found in all three national samples, these national-‐level patterns remain distinctly unique. They appear to reflect dominant representations of human trafficking embedded within the context of national anti-‐trafficking policies and media reporting. The data in this report can only be read as indicative owing to the general limitations of the survey research methodology and unique characteristics of this study reviewed above, including the fact that only initial – ‘on the top of one’s head’ -‐ responses to an open-‐ended question were recorded and analysed. In Ukraine, public opinion can be described as a patchwork of different ‘vectors’ rather than a single easily identifiable public understanding of what human trafficking is. The general public associates human trafficking with abuse, violence, coercion and dependency (15%), buying and selling of people (23%), crime and illegality (15%), unfree labour (21%), sexual exploitation and prostitution (15%), and slavery (26%). In addition, the survey recorded a relatively high level of association with organ harvesting (9%). Such distribution of opinions may reflect a complex anti-‐trafficking landscape in Ukraine with some of the key factors including: (a) national and international non-‐governmental organisations advocating their own vision of what human trafficking is and how it can be eradicated (including La Strada Ukraine, the IOM Mission in Ukraine); (b) the impact of significant anti-‐trafficking funding distributed by the US Government in Ukraine (see Sharapov 2014: 10); (c) the setting up of the anti-‐trafficking machinery at both regional and central levels guided by specific policy representations of trafficking; and (d) the sensationalised reporting of human trafficking by the Ukrainian news media, which reduces it to individualised stories of labour and sex ‘slaves’, and of innocent people having their organs harvested by ominous ‘Black Doctors’. These developments have been taking place within the context of on-‐going economic and political crises in the country and large-‐scale labour migration in, out and within Ukraine that can be described by a specific term ‘zarobitchanstvo’. Only 10% of Ukrainian respondents (aged 15-‐59) were unable to explain in their own words what they understood human trafficking to be, in comparison to 22% in Hungary (aged 18 and older) and 18% in Great Britain (aged 16 and older). The comparative data for these three samples (N=693, age 18-‐59) are: 9% in Ukraine, 19% in Hungary, and 17% in Great Britain. The statistical analysis identified no significant relationship between recorded socio-‐demographic characteristics of respondents in this sample and their ability to explain what they thought human trafficking was. Television programmes, including news, documentaries and feature films appear to be the main sources of information on human trafficking for Ukrainian respondents, followed by the Internet and newspapers. In Hungary, similarly to Ukraine, the general public expressed a patchwork of views on what they thought human trafficking was. No one single vector, or perspective, accounted for the majority of views. The main vectors included: buying and selling of people (identified as a feature of trafficking by 31% of respondents), unfree labour (18%), abuse, violence, coercion and dependency (16%), movement of people (15%) and sexual exploitation and prostitution (12%). About 22% of respondents in Hungary were unable to explain what they understood human trafficking to be. Respondents who were unemployed, retired, respondents with home duties, respondents who were over 50, and those in social grades D and E, were more likely than others not to be able to provide an answer to this question. These outcomes should be considered within the context of a specific policy representation of human trafficking in Hungary as a problem affecting mostly women trafficked for sexual exploitation and requiring assistance and care, in parallel with the law enforcement response to curb organised criminality. This representation appears to have little relevance to the everyday routines of ‘ordinary’ citizens in Hungary. Similarly to Ukraine, television programmes appear to be the main sources of information on human trafficking for respondents in Hungary, followed by newspapers, radio and the Internet. In Great Britain, public understanding of human trafficking reflected a specific representation of trafficking within the UK Government policy and by the UK news media as a matter of immigration, crime, slavery, prostitution and sexual exploitation. More than a third of GB respondents (34%) associated human trafficking with the movement of people but did not mention immigration explicitly. The second most commonly identified vector was ‘sexual exploitation and prostitution’ (19%), which may reflect the initial policy and media framing of human trafficking as a problem of women trafficked into the UK for sexual exploitation. The identification of trafficking as ‘Slavery’ (17%) follows the re-‐ordering of the dominant policy discourse by the UK Government towards an ahistorical and reductive representation of human trafficking as ‘modern day slavery’ mirrored by the sensationalist and individualised reporting of slave-‐holders and victim-‐slaves by the UK media. In addition, the analysis recorded crime and illegality (16%), unfree labour (14%) and exploitation generally (11%) as other significant vectors that provide an insight into a specific understanding of human trafficking by the general public in Great Britain. This understanding is patterned by socio-‐economic characteristics, with respondents who are female, those in social grades C2, D and E, those not in work, and those aged between 16 and 34 being more likely not to be able to provide a definition of trafficking in comparison to respondents in other groups. Overall, about 18% of GB sample respondents were unable to provide a definition. The main sources of information to inform GB respondents of human trafficking were television programmes and newspapers, followed by radio and the Internet. The outcomes presented in this part are important at least for the following two reasons. Firstly, they provide an insight into what the general public knows about human trafficking and what sources of information have been relied upon in forming their knowledge and opinion. They also add to the small but expanding body of evidence that

UP-‐KAT | Kiril Sharapov | Research Report | Part 1 | October 2014 (version 1) 31
highlights that human trafficking is a more complex issue than the narrow and highly ideological anti-‐trafficking agendas pursued by many national governments that construct trafficking and anti-‐trafficking policy responses as auxiliary regulatory systems. These systems appear to be driven by specific neoliberal domestic agendas rather than by a genuine aspiration to eliminate and root out a key structural factor behind human trafficking – increasing reliance on exploitable labour within the context of neoliberal economic developments globally. There is much to learn from these findings if governments are genuine in their desire to tackle the problem. These findings could also aid non-‐state anti-‐trafficking actors to develop responses and measures to counteract representations of trafficking as a sum of individualised stories of abuse, violation and rescue, which could be simply remedied by identifying and assisting victims and putting criminals behind bars. The key value of this research, however, is that it not only identifies what the general public knows about human trafficking, it also identifies what never or rarely gets a mention: the location of the general public itself vis-‐à-‐vis exploitation of labour, including labour provided by trafficked people, and the role of government-‐corporation/state-‐capital entanglements in making exploitation of labour a part of the consumerist ‘living well for less’ everyday. Part 2 of this report provides a more detailed insight into the general public’s understanding of who the victims of human trafficking are, whether it is a problem affecting their country and themselves personally, who bears responsibility for trafficking, how it can be eliminated, and the role of companies and business in eliminating exploitation and trafficking from their supply chains.

UP-‐KAT | Kiril Sharapov | Research Report | Part 1 | October 2014 (version 1) 32
References (Part 1) Anderson, B., and Davidson, J. O. C. (2002) Trafficking – A demand problem? Stockholm, Sweden: Save the Children. Anti-‐Slavery International (2014) Slavery Today. Available: http://www.antislavery.org/english/slavery_today/trafficking.aspx Accessed 10 October 2014. Aradau, C. (2008) Rethinking Trafficking in Women: Politics out of security, Basingstoke, Palgrave. Aronowitz, A.A. (2001) Smuggling and Trafficking in Human Beings: The Phenomenon, the markets that drive it and the organizations that promote it. European Journal on Criminal Policy and Research, 9. Bird, D. R. (2011) Wild Dog Dreaming: Love and Extinction. University of Virginia Press Buckley, M. (2009) Public Opinion in Russia on the Politics of Human Trafficking. Europe-‐Asia Studies, 61(2). Carabine, J. (2013) Unmarried Motherhood 1830-‐1990. A Genealogical Analysis. In: M. Wetherell, S. Taylor, S.J. Yates (eds.) Discourse as Data: A Guide for Analysis. Sage Carrillo, N. (2004) Sociological Perspective. In: J.G. Geer (ed.) Public Opinion and Polling around the World: a Historical Encyclopedia. ABC CLIO DEFRA (2010) Department for Environment, Food and Rural Affairs: 2010 Omnibus Survey on Public Attitudes and Behaviours towards the Environment: Data Tables. Available at: http://www.defra.gov.uk/evidence/statistics/environment/pubatt/download/omnibus-‐datatable.pdf (accessed 10 October 2014). Donsbach, W. and Traugott, M.W. (2008) Introduction. In: W. Donsbach and M.W. Traugott (eds.) The Sage Handbook of Public Opinion Research. Sage Donskis, L. (2014) Towards a Theory of Human Secrecy and Unfathomability, or Exposing Elusive Forms of Evil. In: Z. Bauman and L. Donskis (eds.) Moral Blindness: The Loss of Sensitivity in Liquid Modernity. Polity Press Eisenstein, H. (2010) Feminism Seduced: How Global Elites Use Women's Labor and Ideas to Exploit the World. Paradigm Publishers Erikson, R.S., Mackuen, M.B. and Stimson J.A. (2002) Public Opinion and Policy: Causal Flow in a Macro System Model. In: J. Manza, F.L. Cook and B.I. Page (eds.) Navigating Public Opinion: Polls, Policy and the Future of American Democracy. Oxford University Press Eurostat (2014) Trafficking in Human Beings: 2014 edition. Luxembourg: Publications Office of the European Union, 2014. FitzGerald, S. (2010) Biopolitics and the Regulation of Vulnerability: the Case of the Female Trafficked Migrant. International Journal of Law in Context, 6(3). Fortnum, H., Lee, A. J., Rupnik, B. and Avery, A. (2012) Survey to assess public awareness of patient reporting of adverse drug reactions in Great Britain. Journal of Clinical Pharmacy and Therapeutics, 37. Fu, Y.-‐c. & Chu Y.-‐h (2008) Different Survey Modes and International Comparisons. In: W. Donsbach and M.W. Traugott (eds.) The Sage Handbook of Public Opinion Research. Sage. Geer, J.G. (2004) Preface In: J.G. Geer (ed.) Public Opinion and Polling Around the World: A Historical Encyclopedia. ABC-‐CLIO Goren P. (2012) On Voter Competence. New York: Oxford University Press. Government of Hungary (2013). 4-‐Year Plan Document Related to the Directive against Human Trafficking and the European Strategy towards the Eradication of Trafficking in Human Beings and Replacing the National Strategy against Human Trafficking 2008-‐2012. [on file with the author] Government of Ukraine (2012) State Targeted Social Programme on Combating Trafficking in Human Beings for the period until 2015. Available [in Ukrainian]: http://zakon1.rada.gov.ua/laws/show/350-‐2012-‐п Accessed 10 October 2014. Hader, M. (2008) The use of Scales in Surveys. In: W. Donsbach and M.W. Traugott (eds.) The Sage Handbook of Public Opinion Research. Sage. Hough, M. and Roberts, J. (2005) Understanding Public Attitudes to Criminal Justice. Open University Press. IBM (2012) Analysing Survey Text: a Brief Overview. IBM. Jacobs, L.R. and Shapiro, R.Y. (2002) Politics and Policymaking in the Real World: Crafted Talk and the Loss of Democratic Responsiveness. In: J. Manza, F.L. Cook and B.I. Page (eds.) Navigating Public Opinion: Polls, Policy and the Future of American Democracy. Oxford University Press Kapur, R. (2005) Cross-‐border Movements and the Law: Renegotiating the Boundaries of Difference. In: K. Kempadoo (ed.) Trafficking and Prostitution Reconsidered: New Perspectives on Migration, Sex, Work, and Human Rights. Paradigm Publishers.
UP-‐KAT | Kiril Sharapov | Research Report | Part 1 | October 2014 (version 1) 33
Kepplinger, H.M. (2008) Effects of the News Media on Public Opinion. In: W. Donsbach and M.W. Traugott (eds.) The Sage Handbook of Public Opinion Research. Sage. Khanenko Friesen, N. (2007) Robinson Crusoes, Prostitutes, Heroes? Constructing the ‘Ukrainian Labour Emigrant’ in Ukraine In: A.C. Gow (ed.) Hyphenated Histories: Articulations of Central European Bildung and Slavic Studies in the Contemporary Academy. Brill. KP (2014) Ukrainian Soldiers are Sold for Organ Harvesting to Europe? Available [in Russian|: http://m.kp.ru/daily/26257.3/3135826/ Accessed 10 October 2014. Lee, T. (2002) The Sovereign Status of Survey Data. In: J. Manza, F.L. Cook and B.I. Page (eds.) Navigating Public Opinion: Polls, Policy and the Future of American Democracy. Oxford University Press. Manza, J., Cook, F.L. and Page, B.I. (2002) Navigating Public Opinion: an Introduction. In: J. Manza, F.L. Cook and B.I. Page (eds.) Navigating Public Opinion: Polls, Policy and the Future of American Democracy. Oxford University Press. Mendel, K. and Sharapov, K. (forthcoming in 2015) Human Trafficking and Docufictions. Miller, P. V. (2002) The Authority and Limitations of Polls. In: J. Manza, F.L. Cook and B.I. Page (eds.) Navigating Public Opinion: Polls, Policy and the Future of American Democracy. Oxford University Press. National Crime Agency (2014) Strategic Assessment: The Nature and Scale of Human Trafficking in 2013. Available at: http://www.nationalcrimeagency.gov.uk/publications/399-‐nca-‐strategic-‐assessment-‐the-‐nature-‐and-‐scale-‐of-‐human-‐trafficking-‐in-‐2013/file Accessed October 2, 2014. Norrander, B. and Wilcox, C. (2010) Introduction: the Diverse Paths to Understanding Public Opinion. In: B. Norrander and C. Wilcox (eds.) Understanding Public Opinion. CQ Press O'Connell Davidson, J. (2006) Will the Real Sex Slave Please Stand up? Feminist Review No. 83. OSCE (2013) Trafficking in Human Beings for the Purpose of Organ Removal in the OSCE Region: Analysis and Findings. Organization for Security and Co-‐operation in Europe. Available at: http://www.osce.org/cthb/103393 Accessed 10 October 2014. Page, B.I. (2002) The Semi-‐Sovereign Public. In: J. Manza, F.L. Cook and B.I. Page (eds.) Navigating Public Opinion: Polls, Policy and the Future of American Democracy. Oxford University Press. Parliament of Ukraine (2011) Law of Ukraine ‘On Combating Trafficking in Human Beings’. Available [in Ukrainian]: http://zakon1.rada.gov.ua/laws/show/3739-‐17 Accessed 10 October 2014. Price, V. (2008). The public and public opinion in Political Theories. In: W. Donsbach and M.W. Traugott (eds.) The Sage Handbook of Public Opinion Research. Sage Qurk, P.J. and Hinchliffe, J. (1998) The Rising Hegemony of Mass Opinion. Journal of Policy History, 10. Rasinski, K. A. (2008) Designing Reliable and valid Questionnaires. In: W. Donsbach and M.W. Traugott (eds.) The Sage Handbook of Public Opinion Research. Sage. RPORS -‐ Russian Public Opinion Research Centre (2014) Press Release 1626: Order or Democracy? Available at: http://www.wciom.com/index.php?id=61&uid=944 Accessed October 2, 2014. Sainsbury (2011) Sainsbury's unveils new commitment to customers, to help them ‘Live Well for Less’. Available at: http://www.j-‐sainsbury.co.uk/media/latest-‐stories/2011/20110915-‐sainsburys-‐unveils-‐new-‐commitment-‐to-‐customers-‐to-‐help-‐them-‐live-‐well-‐for-‐less/ Accessed 2 October, 2014. Sapiro, V. and Shames, S.L. (2010) The Gender Basis of Public Opinion. In: B. Norrander and C. Wilcox (eds.) Understanding Public Opinion. CQ Press. Scheufele, D. A. and Tewksbury, D. (2007) Framing, Agenda Setting, and Priming: The Evolution of Three Media Effects Models. Journal of Communication, 57. Shaw, I. (2008) Ethics and the Practice of Qualitative Research. Qualitative Social Work, 7 (4). Sinderman, P.M. and Bullock, J. (2004) A Consistency Theory of Public Opinion and Political Choice: the Hypothesis of Menu Dependence. In: W.E. Saris and P. M. SInderman (eds.) Studies in Public Opinion: Attitudes, Nonattitudes, Measurement of Error, and Change. Princeton University Press. Sinderman, P.M. and Theriault, S.M. (2004) The Structure of Political Argument and the Logic of Issue Framing. In: W.E. Saris and P. M. SInderman (eds.) Studies in Public Opinion: Attitudes, Nonattitudes, Measurement of Error, and Change. Princeton University Press. Stromback, J. (2012) The Media and Their Use of Opinion Polls: Reflecting and Shaping Public Opinion. In: C. Holtz-‐Bacha and J. Stromback (eds.) Opinion Polls and the Media: Reflecting and Shaping Public Opinion. Palgrave Macmillan. Taylor, H. (2002) The Value of Polls in Promoting Good Government and Democracy. In: J. Manza, F.L. Cook and B.I. Page (eds.) Navigating Public Opinion: Polls, Policy and the Future of American Democracy. Oxford University Press. Tourangeau, R. and Galesic, M. (2008) Conceptions of Attitudes and Opinions. In: W. Donsbach and M.W. Traugott (eds.) The Sage Handbook of Public Opinion Research. Sage.

UP-‐KAT | Kiril Sharapov | Research Report | Part 1 | October 2014 (version 1) 34
Traugott, M.W. (2008) The uses and misuses of polls. In: W. Donsbach and M.W. Traugott (eds.) The Sage Handbook of Public Opinion Research. Sage. Traugott, M.W. (2012) Do Polls Give the Public a Voice in a Democracy? In: M.A. Genovese and M.J. Streb (eds.) Polls and Politics: The Dilemmas of Democracy. SUNY Press. UK Government (2011) Human Trafficking: The Government’s Strategy, TSO. UK Government (2013) News story: Modern slavery white paper published. Available at: https://www.gov.uk/government/news/modern-‐slavery-‐white-‐paper-‐published Accessed: 10 October 2014. United Nations (2000) Protocol to Prevent, Suppress and Punish Trafficking in Persons, Especially Women and Children, Supplementing the United Nations Convention against Transnational Organized Crime. Adopted 15 November 2000, entered into force 25 December 2003. Doc. A/55/383. Utro (2014) ‘Black’ Market in Human Organs is Flourishing in Ukraine. Available [in Russian|: http://www.utro.ua/ua/zhizn/v_ukraine_protsvetaet_chernaya_transplantologiya_4a07da5fd7aa0 Accessed 10 October 2014. Visser, P.S., Holbrook, A. and J.A. Krosnick (2008) Knowledge and Attitudes. In: W. Donsbach and M.W. Traugott (eds.) The Sage Handbook of Public Opinion Research. Sage Walgrave, S. and Aelst, P.A. (2006) The Contingency of the Mass Media’s Political Agenda Setting Power: Toward a Preliminary Theory. Journal of Communication, 56. Weaver, D. H. (2007), Thoughts on Agenda Setting, Framing, and Priming. Journal of Communication, 57. Weaver, R.K. (2002) Polls, Priming and the Politics of Welfare Reform. In: J. Manza, F.L. Cook and B.I. Page (eds.) Navigating Public Opinion: Polls, Policy and the Future of American Democracy. Oxford University Press. Weisberg, H. F. (2008) The Methodological Strengths and Weaknesses of Survey Research. In: W. Donsbach and M.W. Traugott (eds.) The Sage Handbook of Public Opinion Research. Sage Wolfe, M., Jobes, B.D. and Baumgartner, F.R. (2013) A Failure to Communicate: Agenda Setting in Media and Policy Studies. Political Communication, 30 (2). Wylie, G & McRedmond, P. (2010) Introduction: Human Trafficking and Europe. In: G. Wylie and P. McRedmond (eds.) Human Trafficking in Europe: Character, Causes and Consequences. Palgrave Macmillan.

UP-‐KAT | Kiril Sharapov | Research Report | Part 1 | October 2014 (version 1) 35
Annex 1: ‘UP-‐KAT’ project questionnaire This survey is conducted as part of a wider study to explore public knowledge of human trafficking in the following three countries: Ukraine, Hungary and the UK. It is just your opinions we are interested in. Q.1 In your own words, please describe what you think ‘human trafficking’ is? Q.2 As you may already be aware. Trafficking in Human Beings is a serious crime which involves a violation of basic human rights. People who are trafficked are exploited for financial gain. They are tricked or forced into forced labour, begging, sexual exploitation or their organs can be removed and sold. Victims of trafficking are recruited by acquaintances, relatives or criminal gangs, often with promises of well-‐paid jobs. They are then transported from rural areas to cities or from poorer to richer countries. They are then exploited for their labour through manipulation, coercion or use of force by people who trafficked them in the first instance or by people who exploit them for their labour. Please tell me whether you agree or disagree with the following statements.
- Most victims of trafficking are young women trafficked for sexual exploitation - Anyone, men, women, children can be trafficked - Most victims of trafficking come from poor countries - Human trafficking does not affect me directly - Human trafficking is a problem in this country - Most victims of trafficking are illegal immigrants who are looking for work - Organized criminals bear the main responsibility for human trafficking - When I do my daily shopping I do not normally think if things that I buy were produced by victims of
trafficking or forced labour - I know what to do if I come across someone who I think is trafficked or exploited - The Internet can be used to recruit the victims of human trafficking and to advertise their services
Q.3 Before today, how did you get to know about human trafficking? - I personally know someone who was trafficked - I know someone who knows someone who was trafficked - Someone I know (a relative, a colleague, a friend) told me about it - I watched a news program on TV - I watched a documentary on TV - I watched a film on TV - I watched a film in the cinema - I listened to a news program on the radio - I read an article in the newspaper - I read about it on the Internet - I learnt about it via social media - I saw an advertising campaign on public transport - I saw an advertising campaign it in the street - I read about it in a pamphlet which was handed to me in the street - I read about it in a pamphlet I picked up in a public space (in the library, on public transport) - Some other source not listed above - Do not know
Q.4 And for these please tell me whether you agree or disagree with each of the following statements.
- We need tougher border controls to stop victims of trafficking from entering this country in the first place - We need tougher law enforcement to tackle criminals responsible for trafficking - All European countries should criminalize the purchase of sexual services\prostitution - We need to provide assistance (psychological, legal and financial) to all victims of trafficking already in this
country - Victims of trafficking need to be deported back to their country of origin after a short recovery period - Victims of trafficking should be allowed to stay in this country legally if they face threats or harm from their
traffickers back home

UP-‐KAT | Kiril Sharapov | Research Report | Part 1 | October 2014 (version 1) 36
- Countries where people are trafficked from need to do more to increase their standard of living so that their nationals do not need to look for work abroad
- We need to identify and prosecute any company relying on labour provided by victims of trafficking - Companies must ensure that their workers are not exploited and to pay them a living wage even if it may
increase consumer prices - Companies must ensure that workers employed by their suppliers are not exploited and paid a living wage
even if may increase consumer prices - I would be prepared to pay up to 10% more for goods and services if I knew that people who produced them
were not trafficked, exploited and paid a living wage - Companies must be required by law to audit their suppliers to ensure that workers are not exploited - I would personally be prepared to boycott companies and businesses if I knew they relied on trafficked or
exploited labor - There should be more awareness-‐raising campaigns about human trafficking in the mass media - There should be more anti-‐trafficking campaigns and messages on the Internet - Children need to be told about human trafficking at schools - Other measures

UP-‐KAT | Kiril Sharapov | Research Report | Part 1 | October 2014 (version 1) 37
Annex 2: Country Background Information The overview below provides background information with regards to key socio-‐economic indicators, data on migration, and official data on human trafficking in the three case study countries. In setting a broader context for the discussion of survey findings in this paper, the information included in this overview is unavoidably incomplete due to the sheer volume of data, assessments and research, which explore these three dimensions. However, it highlights some of the key socio-‐economic and demographic trends that underpin human trafficking as a complex phenomenon, which cuts across key issues of equality, justice and human rights in our societies.
Key socio-‐economic indicators
Population Both Hungary and Ukraine continued to experience population decline owing to low birth rates and high emigration rates. Hungary’s population decreased by approximately 1% between 2007 and 2012. The population of Ukraine decreased by approximately 2% in the same period (see below). In Hungary, according to the Hungarian Ministry for National Economy, the pace of decline slowed down in 2012 owing to ‘…the family-‐friendly policy of the Government’ and ‘family tax allowances introduced as of January 2011’, which increased ‘people’s inclination to have children’ (Government of Hungary 2012). ‘Are you free for a dance’ dance parties aimed at boosting fertility rates among Hungarian youth were sponsored by the Government and took place across Hungary in 2013 (Aljazeera 2013). Another policy direction, described as ‘contradictory’, focused on ‘an increasingly aggressive campaign of granting citizenship to ethnic Hungarians in the region’ (Budapest Business Journal 2011) including neighbouring countries with large Hungarian communities. The population decline in Ukraine has been forecast to continue with predictions of the single largest absolute population loss in Europe between 2011 and 2020 as a result of the low birthrate and one of the highest death rates in the world (World Bank 2013). In the UK, on the other hand, a combination of the highest (in absolute terms) population growth in the EU in 2011-‐2012 and of positive net-‐migration (BBC 2013) has contributed to one of the highest population growth rates within the EU -‐ estimated 0.55% in 2013 (CIA 2013). These changes have been taking place within the context of increasing racialization of East European migration to the UK in the UK Government immigration policy and tabloid journalism (Fox, Morosanu and Szilassy 2012), and the documented increase of racist hostility and xenophobia especially among supporters of extreme right parties (Cutts, Ford, Goodwin 2011) Table A.1: Population dynamics in Ukraine, Hungary, and the United Kingdom (2007 – 2012)
2007 2012 Change, %
Hungary 10,055,780 9,943,755 -‐ 1.11
Ukraine 46,509,350 45,593,300 -‐ 1.97
United Kingdom 60,986,649 63,227,526 + 3.67
European Union 501,398,395 509,036,794 + 1.52
OECD 1,215,850,729 1,256,610,112 + 3.35
Source: World Bank’s DataBank http://databank.worldbank.org
Life Expectancy at Birth Life expectancy at birth is generally considered one of the measures of the overall quality of life in a country. Both Ukraine and Hungary experienced increases in the average life expectancy between 2007 and 2011 at a much faster rate than the UK, EU member states overall or OECD members (averaged rates). Although some of this positive movement may be attributed to improvements in the standard of healthcare and increasing GNI (gross national income), the low base rates for Hungary and Ukraine in 2007 remain a key comparative factor (see Table A.2 below). As a result, although life expectancy in Ukraine increased by 3.79% between 2007 and 2011 – more than two times in comparison to the UK’s rate of 1.64% -‐ the average life expectancy in Ukraine remained more than 10 years shorter than in the UK, with Hungary lagging 6 years behind.

UP-‐KAT | Kiril Sharapov | Research Report | Part 1 | October 2014 (version 1) 38
Table A.2: Life expectancy at birth (2007, 2011)
2007 2011 Change, %
Hungary 73.15 74.86 + 2.33
Ukraine 68.22 70.81 + 3.79
United Kingdom 79.45 80.75 + 1.64
European Union 78.89 80.18 + 1.63
OECD 78.77 79.63 + 1.10
Source: World Bank’s DataBank http://databank.worldbank.org
Gross National Income, per capita Gross national income (GNI) per capita measures the average income accruing to residents of a country, whether earned within this country or overseas. GNI per capita measures overall levels of income and ‘…does not capture multi-‐dimensions of poverty as for example the human development index (HDI) that measures different aspects of human deprivation’ (UNDP 2007: 12). Similarly to ‘Life Expectancy at Birth’, both Hungary and Ukraine experienced significant increases in the levels of gross national income between 2007 and 2012: about 8% in Hungary and 36% in Ukraine, compared to the UK’s negative growth of 14% and a modest positive growth in the EU of 4%. However, despite these positive trends for Ukraine and Hungary, corresponding levels of national income remained extremely low in Ukraine in comparison to the aggregate indicator for EU countries (72% lower) and for the UK (91% lower), and significantly lower for Hungary (63% and 68% accordingly). Table A.3: GNI per capita, Atlas method21 (current US dollars, 200, 2012)
2007 2012 Change, %
Hungary 11,510.00 12,390.00 + 7.65
Ukraine 2,570.00 3,500.00 + 36.19
United Kingdom 44,490.00 38,250.00 -‐ 14.03
European Union 32,221.16 33,609.34 + 4.31
OECD 33.528.58 37,079.12 + 10.59
Source: World Bank’s DataBank http://databank.worldbank.org
Unemployment The relationship between unemployment, the overall performance of national economies, and the push and pull factors of migration, including ‘irregular’ flows of migrants, is too complex to explore within the context of this overview. Recent research by the Migration Policy Centre at the European University Institute concludes ‘…that there is a very consistent and telling trend in the relationship between unemployment and immigration. When unemployment lowers, immigration tends to increase…[while] immigration cannot be regarded as a factor that creates or adds to unemployment’ (McCormick 2012). A number of studies, however, have focused specifically on the impact of migratory flows on the national levels of unemployment. In relation to the three case study countries, these include a study by Pozniak (2012), arguing that ‘without labour migration the unemployment level in Ukraine would be almost twice as high as the registered’. In the UK, the UK Government’s Migration Advisory Committee -‐ an independent, non-‐statutory, non-‐time limited, non-‐departmental public body that advises the government on migration issues – in its 2012 Report found that an increase in the number of working-‐age migrants in the UK was associated with a reduction in the native employment rate over the period 1995 to 2010 (MAC 2012: 64). In Hungary, one of the highest rates of unemployment in the region (and among the three case study countries) has been blamed on ‘protracted economic problems and labour market conflicts – issues that have been radically influenced since 2010 by the current government’ resulting in the increasing rate of emigration over recent years (Hars 2013).
21 The World Bank defines GNI per capita as ‘…the gross national income, converted to U.S. dollars using the World Bank Atlas method, divided by the midyear population. GNI is the sum of value added by all resident producers plus any product taxes (less subsidies) not included in the valuation of output plus net receipts of primary income (compensation of employees and property income) from abroad’. See http://data.worldbank.org/indicator/NY.GNP.PCAP.CD?display=default. In essence, GNI is the total domestic and foreign output claimed by residents of a country, consisting of gross domestic product (GDP) plus factor incomes earned by foreign residents, minus income earned in the domestic economy by nonresidents (Todaro & Smith 2011: 44).

UP-‐KAT | Kiril Sharapov | Research Report | Part 1 | October 2014 (version 1) 39
Table A.4: Levels of unemployment (in % of total labour force, 2007, 2011)
2007 2011 Change
Hungary 7.40 10.90 + 3.50
Ukraine 6.40 7.90 + 1.50
United Kingdom 5.30 7.80 + 2.50
European Union 7.15 9.58 + 2.43
OECD 5.64 7.94 + 2.30
Source: World Bank’s DataBank http://databank.worldbank.org
Human Development Indicators A range of indicators of human development are used by the United Nations Development Programme (UNDP), including the Human Development Index (HDI), Inequality-‐adjusted HDI (IHDI), Gender Inequality Index (GII), and Multi-‐dimensional Poverty Index (MPI). Although the UNDP system of measuring inequality has attracted a range of criticisms (Noorbakhsh 1998, Høyland et al. 2012), it remains one of the most widely used comparative measures of development. The figures below are extracted from the 2013 Human Development Report (UNDP 2013). The Human Development Index (HDI): measures the average achievements in a country in three basic dimensions of human development: a long and healthy life, access to knowledge, and a decent standard of living. The Inequality-‐adjusted Human Development Index (IHDI): adjusts the HDI for inequality in distribution of each dimension across the population. The IHDI equals the HDI when there is no inequality but is less than the HDI as inequality rises. The Gender Inequality Index (GII) reflects women’s disadvantage in three dimensions—reproductive health, empowerment, and the labour market. The index shows the loss in human development due to inequality between female and male achievements in these dimensions. It ranges from 0, which indicates that women and men fare equally, to 1, which indicates that women fare as poorly as possible in all measured dimensions. Table A.5: Human development indicators in Ukraine, Hungary and the UK (2013 Human Development Report)
HDI IHDI GII
Hungary 0.831 Very high human development category, 37th out of 187 countries and territories. Between 1980 and 2012, Hungary’s HDI increased from 0.709 to 0.831.
0.769 A loss of 7.4% from HDI level due to inequality in life expectancy at birth (5.7%), inequality in education (4.1%), and inequality in income (12.2%)
0.256 42nd out of 148 countries 8.8% of parliamentary seats held by women; 93.2% of adult women have reached a secondary or higher level of education compared to 96.7% of men. For every 100,000 live births, 21 women die from pregnancy related causes. Female participation in the labour market is 43.8% compared to 58.4% for men
Ukraine 0.740 High human development category, however below the average of 0.758 for countries in the high development group, and below the average of 0.771 for countries in Europe and Central Asia. Overall, 78th out of 187 countries and territories; between 1990 and 2012, Ukraine’s HDI increased from 0.714 to 0.740
0.672 A loss of 9.2% from HDI level due to inequality in life expectancy at birth (10.5%), inequality in education (6.1%), and inequality in income (10.9%)
0.338 57th out of 148 countries 8% of parliamentary seats held by women; 91.5% of adult women reached a secondary or higher level of education compared to 96.1% of men

UP-‐KAT | Kiril Sharapov | Research Report | Part 1 | October 2014 (version 1) 40
For every 100,000 live births, 32 women die from pregnancy related causes Female participation in the labour market is 53.3% compared to 66.6% for men
United Kingdom
0.875 Very high human development category, 26th out of 187 countries and territories. Between 1980 and 2012, United Kingdom’s HDI increased from 0.748 to 0.875.
0.802 A loss of 8.3% due to inequality in life expectancy at birth (4.8%), inequality in education (2.6%), and inequality in income (16.9%)
0.205 34th out of 148 countries; 22.1% of parliamentary seats held by women 99.6% of adult women have reached a secondary or higher level of education compared to 99.8% of men; For every 100,000 live births; Female participation in the labour market is 55.6% compared to 68.5% for men
Migration Profiles One of the key indicators of migration is ‘Net migration’, which shows the total number of immigrants less the annual number of emigrants over a period of time, including both citizens and non-‐citizens. The World Bank collates this data as part of its World Development Indicators Series, including the following data for 2012 (World Bank 2014). Table A.6: Net Migration in Ukraine, Hungary and the United Kingdom (2009-‐2013)
Country Net Migration
India (largest negative net migration) -‐ 2,295,049
Ukraine -‐ 40,006
Hungary + 75,000
UK + 900,000
USA (largest positive net migration) + 5,000,002
Source: World Bank (2014)
Migration overview: Hungary Hungary remains a country of transit, source and destination for both regular and irregular migration. As a landlocked country in Central Europe, it shares borders with 7 other countries, including two non-‐EU member states -‐ Serbia and Ukraine, both of which host significant populations of Hungarian ethnic minorities (156,600 people in Ukraine according to the Ukrainian census of 2001 (Csernicsko 2005: 95), and 293,299 Hungarians in Serbia, or 3.9 per cent of the population, according to the Serbian census of 2002 (Minority Rights Group International 2008). Owing to the Hungary’s memberships of the EU and the Schengen Agreement, and its relatively high level of economic development (in comparison to other countries in Central and Eastern Europe measured, for example, by HDI), Hungary remains a target destination or transit point for migrants from neighbouring countries. Little systematic data is available on the scale of contemporary Hungarian emigration (Hars 2009), with Hars concluding that relatively favourable local labour market conditions and institutional impediments made emigration not a ‘strong alternative’ for Hungarians until recently. However, an increasing number of Hungarian migrants in a number of European countries may be a response to the developing economic imbalances and stagnation in Hungary (ibid.) Reliable data on immigration into Hungary is also lacking with the official statistics capturing the official – legal -‐ registrations only. According to the Hungarian Central Statistical Office (2014), in 2013, there were 141,357 foreign citizens residing in Hungary, including citizens of EU member states, (or 1.43% of the overall population of 9 908 798) -‐ the lowest in 9 years since 2005 with the highest number of 206,909 registered in 2011. One of the key immigration trends in
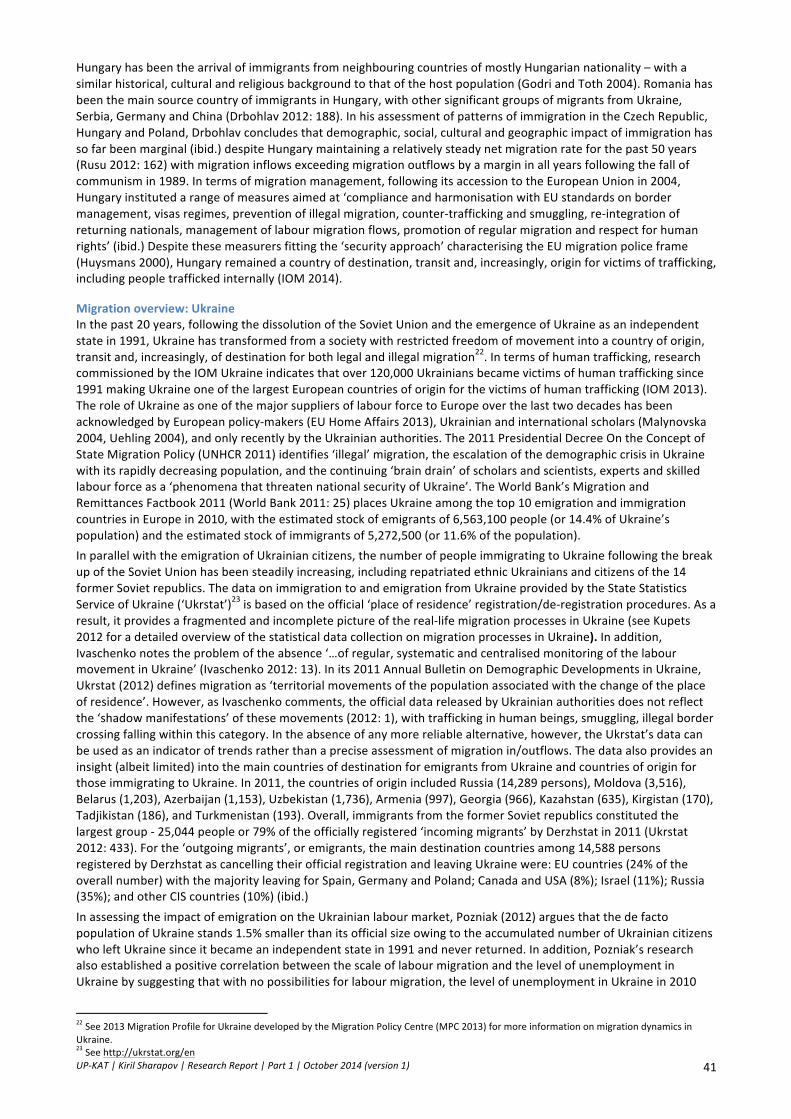
UP-‐KAT | Kiril Sharapov | Research Report | Part 1 | October 2014 (version 1) 41
Hungary has been the arrival of immigrants from neighbouring countries of mostly Hungarian nationality – with a similar historical, cultural and religious background to that of the host population (Godri and Toth 2004). Romania has been the main source country of immigrants in Hungary, with other significant groups of migrants from Ukraine, Serbia, Germany and China (Drbohlav 2012: 188). In his assessment of patterns of immigration in the Czech Republic, Hungary and Poland, Drbohlav concludes that demographic, social, cultural and geographic impact of immigration has so far been marginal (ibid.) despite Hungary maintaining a relatively steady net migration rate for the past 50 years (Rusu 2012: 162) with migration inflows exceeding migration outflows by a margin in all years following the fall of communism in 1989. In terms of migration management, following its accession to the European Union in 2004, Hungary instituted a range of measures aimed at ‘compliance and harmonisation with EU standards on border management, visas regimes, prevention of illegal migration, counter-‐trafficking and smuggling, re-‐integration of returning nationals, management of labour migration flows, promotion of regular migration and respect for human rights’ (ibid.) Despite these measurers fitting the ‘security approach’ characterising the EU migration police frame (Huysmans 2000), Hungary remained a country of destination, transit and, increasingly, origin for victims of trafficking, including people trafficked internally (IOM 2014).
Migration overview: Ukraine In the past 20 years, following the dissolution of the Soviet Union and the emergence of Ukraine as an independent state in 1991, Ukraine has transformed from a society with restricted freedom of movement into a country of origin, transit and, increasingly, of destination for both legal and illegal migration22. In terms of human trafficking, research commissioned by the IOM Ukraine indicates that over 120,000 Ukrainians became victims of human trafficking since 1991 making Ukraine one of the largest European countries of origin for the victims of human trafficking (IOM 2013). The role of Ukraine as one of the major suppliers of labour force to Europe over the last two decades has been acknowledged by European policy-‐makers (EU Home Affairs 2013), Ukrainian and international scholars (Malynovska 2004, Uehling 2004), and only recently by the Ukrainian authorities. The 2011 Presidential Decree On the Concept of State Migration Policy (UNHCR 2011) identifies ‘illegal’ migration, the escalation of the demographic crisis in Ukraine with its rapidly decreasing population, and the continuing ‘brain drain’ of scholars and scientists, experts and skilled labour force as a ‘phenomena that threaten national security of Ukraine’. The World Bank’s Migration and Remittances Factbook 2011 (World Bank 2011: 25) places Ukraine among the top 10 emigration and immigration countries in Europe in 2010, with the estimated stock of emigrants of 6,563,100 people (or 14.4% of Ukraine’s population) and the estimated stock of immigrants of 5,272,500 (or 11.6% of the population). In parallel with the emigration of Ukrainian citizens, the number of people immigrating to Ukraine following the break up of the Soviet Union has been steadily increasing, including repatriated ethnic Ukrainians and citizens of the 14 former Soviet republics. The data on immigration to and emigration from Ukraine provided by the State Statistics Service of Ukraine (‘Ukrstat’)23 is based on the official ‘place of residence’ registration/de-‐registration procedures. As a result, it provides a fragmented and incomplete picture of the real-‐life migration processes in Ukraine (see Kupets 2012 for a detailed overview of the statistical data collection on migration processes in Ukraine). In addition, Ivaschenko notes the problem of the absence ‘…of regular, systematic and centralised monitoring of the labour movement in Ukraine’ (Ivaschenko 2012: 13). In its 2011 Annual Bulletin on Demographic Developments in Ukraine, Ukrstat (2012) defines migration as ‘territorial movements of the population associated with the change of the place of residence’. However, as Ivaschenko comments, the official data released by Ukrainian authorities does not reflect the ‘shadow manifestations’ of these movements (2012: 1), with trafficking in human beings, smuggling, illegal border crossing falling within this category. In the absence of any more reliable alternative, however, the Ukrstat’s data can be used as an indicator of trends rather than a precise assessment of migration in/outflows. The data also provides an insight (albeit limited) into the main countries of destination for emigrants from Ukraine and countries of origin for those immigrating to Ukraine. In 2011, the countries of origin included Russia (14,289 persons), Moldova (3,516), Belarus (1,203), Azerbaijan (1,153), Uzbekistan (1,736), Armenia (997), Georgia (966), Kazahstan (635), Kirgistan (170), Tadjikistan (186), and Turkmenistan (193). Overall, immigrants from the former Soviet republics constituted the largest group -‐ 25,044 people or 79% of the officially registered ‘incoming migrants’ by Derzhstat in 2011 (Ukrstat 2012: 433). For the ‘outgoing migrants’, or emigrants, the main destination countries among 14,588 persons registered by Derzhstat as cancelling their official registration and leaving Ukraine were: EU countries (24% of the overall number) with the majority leaving for Spain, Germany and Poland; Canada and USA (8%); Israel (11%); Russia (35%); and other CIS countries (10%) (ibid.) In assessing the impact of emigration on the Ukrainian labour market, Pozniak (2012) argues that the de facto population of Ukraine stands 1.5% smaller than its official size owing to the accumulated number of Ukrainian citizens who left Ukraine since it became an independent state in 1991 and never returned. In addition, Pozniak’s research also established a positive correlation between the scale of labour migration and the level of unemployment in Ukraine by suggesting that with no possibilities for labour migration, the level of unemployment in Ukraine in 2010
22 See 2013 Migration Profile for Ukraine developed by the Migration Policy Centre (MPC 2013) for more information on migration dynamics in Ukraine. 23 See http://ukrstat.org/en
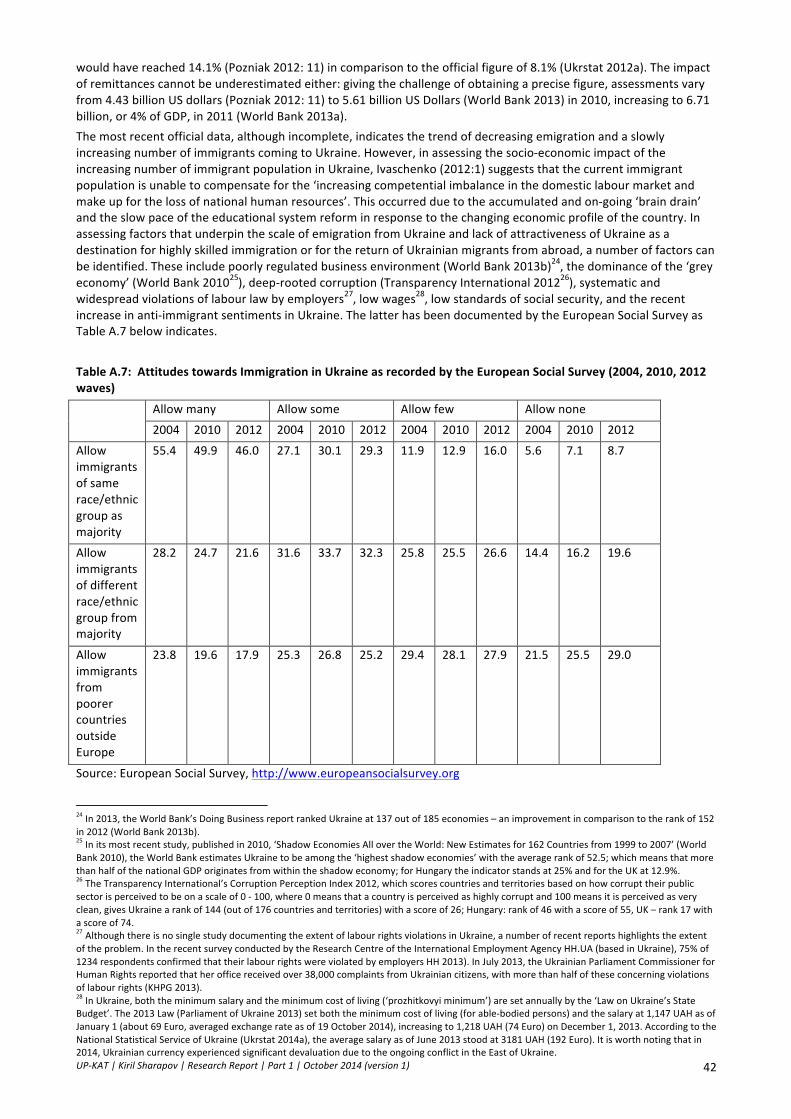
UP-‐KAT | Kiril Sharapov | Research Report | Part 1 | October 2014 (version 1) 42
would have reached 14.1% (Pozniak 2012: 11) in comparison to the official figure of 8.1% (Ukrstat 2012a). The impact of remittances cannot be underestimated either: giving the challenge of obtaining a precise figure, assessments vary from 4.43 billion US dollars (Pozniak 2012: 11) to 5.61 billion US Dollars (World Bank 2013) in 2010, increasing to 6.71 billion, or 4% of GDP, in 2011 (World Bank 2013a). The most recent official data, although incomplete, indicates the trend of decreasing emigration and a slowly increasing number of immigrants coming to Ukraine. However, in assessing the socio-‐economic impact of the increasing number of immigrant population in Ukraine, Ivaschenko (2012:1) suggests that the current immigrant population is unable to compensate for the ‘increasing competential imbalance in the domestic labour market and make up for the loss of national human resources’. This occurred due to the accumulated and on-‐going ‘brain drain’ and the slow pace of the educational system reform in response to the changing economic profile of the country. In assessing factors that underpin the scale of emigration from Ukraine and lack of attractiveness of Ukraine as a destination for highly skilled immigration or for the return of Ukrainian migrants from abroad, a number of factors can be identified. These include poorly regulated business environment (World Bank 2013b)24, the dominance of the ‘grey economy’ (World Bank 201025), deep-‐rooted corruption (Transparency International 201226), systematic and widespread violations of labour law by employers27, low wages28, low standards of social security, and the recent increase in anti-‐immigrant sentiments in Ukraine. The latter has been documented by the European Social Survey as Table A.7 below indicates. Table A.7: Attitudes towards Immigration in Ukraine as recorded by the European Social Survey (2004, 2010, 2012 waves)
Allow many Allow some Allow few Allow none
2004 2010 2012 2004 2010 2012 2004 2010 2012 2004 2010 2012
Allow immigrants of same race/ethnic group as majority
55.4 49.9 46.0 27.1 30.1 29.3 11.9 12.9 16.0 5.6 7.1 8.7
Allow immigrants of different race/ethnic group from majority
28.2 24.7 21.6 31.6 33.7 32.3 25.8 25.5 26.6 14.4 16.2 19.6
Allow immigrants from poorer countries outside Europe
23.8 19.6 17.9 25.3 26.8 25.2 29.4 28.1 27.9 21.5 25.5 29.0
Source: European Social Survey, http://www.europeansocialsurvey.org
24 In 2013, the World Bank’s Doing Business report ranked Ukraine at 137 out of 185 economies – an improvement in comparison to the rank of 152 in 2012 (World Bank 2013b). 25 In its most recent study, published in 2010, ‘Shadow Economies All over the World: New Estimates for 162 Countries from 1999 to 2007’ (World Bank 2010), the World Bank estimates Ukraine to be among the ‘highest shadow economies’ with the average rank of 52.5; which means that more than half of the national GDP originates from within the shadow economy; for Hungary the indicator stands at 25% and for the UK at 12.9%. 26 The Transparency International’s Corruption Perception Index 2012, which scores countries and territories based on how corrupt their public sector is perceived to be on a scale of 0 -‐ 100, where 0 means that a country is perceived as highly corrupt and 100 means it is perceived as very clean, gives Ukraine a rank of 144 (out of 176 countries and territories) with a score of 26; Hungary: rank of 46 with a score of 55, UK – rank 17 with a score of 74. 27 Although there is no single study documenting the extent of labour rights violations in Ukraine, a number of recent reports highlights the extent of the problem. In the recent survey conducted by the Research Centre of the International Employment Agency HH.UA (based in Ukraine), 75% of 1234 respondents confirmed that their labour rights were violated by employers HH 2013). In July 2013, the Ukrainian Parliament Commissioner for Human Rights reported that her office received over 38,000 complaints from Ukrainian citizens, with more than half of these concerning violations of labour rights (KHPG 2013). 28 In Ukraine, both the minimum salary and the minimum cost of living (‘prozhitkovyi minimum’) are set annually by the ‘Law on Ukraine’s State Budget’. The 2013 Law (Parliament of Ukraine 2013) set both the minimum cost of living (for able-‐bodied persons) and the salary at 1,147 UAH as of January 1 (about 69 Euro, averaged exchange rate as of 19 October 2014), increasing to 1,218 UAH (74 Euro) on December 1, 2013. According to the National Statistical Service of Ukraine (Ukrstat 2014a), the average salary as of June 2013 stood at 3181 UAH (192 Euro). It is worth noting that in 2014, Ukrainian currency experienced significant devaluation due to the ongoing conflict in the East of Ukraine.

UP-‐KAT | Kiril Sharapov | Research Report | Part 1 | October 2014 (version 1) 43
The unattractiveness of Ukraine for incoming labour migrants is reflected in the volume of remittance outflows: 31 million in 2011 – just 0.31% of 6.71 billion US dollars remitted into Ukraine in the same year (World Bank 2013a). Pozniak (2012) suggests that without an increase in the number of immigrant population and due to the impact of current demographic trends, Ukraine is likely to experience significant labour shortages; his research estimates that Ukraine’s demand for working-‐age migrants up to 2061 stands at about 7,900,000 people (2012: 14). Given the complexity of migratory flows in and out of Ukraine and their entanglement with both internal and external socio-‐economic and political contexts, the predominance of international labour migration in Ukraine has been interpreted by Ivaschenko (2012: 1) as a ‘natural form of citizens’ spatial self-‐organization in the conditions of the economic crises and unstable political situation in the country and the world’. The scale of internal (within Ukraine) and international (from and to Ukraine) migration over the last two decades produced a new identity category of ‘zarobitchane’ as alluded to in the discussion of the survey findings above. Ivaschenko argues (2012) that the notion of ‘zarobitchanstvo’ (the act of moving to earn money) has both practical and ideological aspects: practical as it presupposes voluntary, however not always ‘legal’ labour migration, and ideological as it has become a ‘way of thinking’ (2012: 2) and a way of living. ‘Zarobitchanstvo’ as a way of earning money to provide for families and to take control of one’s life developed within the context of the increasing unemployment, deteriorating economic situation and diminishing welfare protection and support in Ukraine. The wide-‐spread and systemic corruption in Ukraine (Yemelianova 2010) and extremely low levels of trust in state institutions served as a framing context within which the questions of legality of many activities linked to ‘zarobitchanstvo’ became irrelevant and never asked, i.e. whether the way in which the money was earned was entirely legal or not, whether income taxes were paid or evaded, whether the associated border-‐crossing was legal or clandestine. These considerations became secondary as long as sufficient income was secured to provide for one’s own living and to support family back home via remittances. Although no reliable research exists to gauge public views and attitudes towards ‘zarobitchane’ in Ukraine, the European Social Survey results (2012 wave) are indicative of the overall acceptance and tolerance by Ukrainian respondents (in comparison to respondents in Hungary or the UK) towards people from poor countries coming to Ukraine in search of employment: 43% of respondents in Ukraine agreed that ‘some’ or ‘many’ immigrants from poorer countries outside Europe should be allowed to Ukraine. The country profile for Ukraine by Compas, the Centre on Migration, Policy & Society (Duvell 2007) suggests that Ukraine has become not only the major supplier of migrant labour to Europe, but also the major sending country of irregular immigrant workers. Irregular migration comes, as Broeders notes, in many shapes and sizes, with legality and illegality of entry, stay and employment combining and producing many forms and ‘degrees’ of irregularity (Broeders 2007: 73). This spectrum of irregularity, combined with the increasing levels of corruption in some of the key countries of destination for migrant labour (EC 2014), create a context in which violations of migrants’ human rights, including torture, slavery, forced labour and servitude become endemic and systematic (see, for example, Joseph Rowntree Foundation series of reports on labour exploitation in the UK29). It is within this context, that human trafficking as part of migratory flows in, out and within Ukraine needs to be recognized and understood. In addition, the data reviewed above were recorded before the recent political and social instability in Ukraine and the illegal annexation of Crimea by Russia, which have most likely resulted in the increase of opportunities for enforced / coerced labour movements.
Migration overview: United Kingdom The scope and purpose of this overview do not provide space to focus on diverse and evolving dynamics of migratory flows in, out and within the United Kingdom. This diversity has become more complex following the Eastward expansion of the European Union, the increasing political instability in the Middle East and North Africa, and the increasing influence of environmental factors and other key geopolitical changes on global migration flows (IOM 2014a, Reuveny 2007). The history of emigration from and immigration to the UK is complex with Joppke (1999: 9), for example, in his analysis of nationhood traditions and immigration experiences in post-‐war Germany, Britain and the United States describing Britain as having an ‘obsessive thrust towards zero-‐immigration’. The impact of immigration on population growth has become one of the most controversial issues in the political and media debates in the UK. ‘Britain’s '70 Million' Debate, a report produced by the Migration Observatory at the University of Oxford in 2012 (Migration Observatory 2012), provides a summary of the key questions, which surround migration and population growth in the UK. The Migration Observatory provides regular updates -‐ released as briefings – which provide a series of up-‐to-‐date observations in relation to the most recent migration trends in the UK. Some of these trends include:
- Between 1993 and 2012, the foreign-‐born population in the UK almost doubled from 3.8 million people to around 7.7 million. During the same period, the number of foreign citizens in the UK increased from nearly 2 million to 4.9 million people (Rienzo and Vargas-‐Silva 2012).
- The UK Office for National Statistics reported that net migration to the UK increased to 243,000 in the year ending March 2014 (ONS 2014), a statistically significant increase from 170,000 in the year ending March 2013.
29 See http://www.jrf.org.uk/topic/forced-‐labour

UP-‐KAT | Kiril Sharapov | Research Report | Part 1 | October 2014 (version 1) 44
- Economic and labour market factors remain key determinants of migration to the UK with colonial links and networks being crucial to understanding the composition of immigration flows and the mechanism of migration systems (Czaika and Haas 2013).
- Since 2010, the official immigration policy has been informed by the government’s aim to reduce net migration to the ‘tens of thousands’ by 2015 (Czaika and Haas 2013: 4). Czaika and Hass (2013) suggest, however, that the impact of immigration policies on migration trends may be relatively small when compared to the influence of other economic, social and political determinants of migration (ibid.)
Human Trafficking Data
US Department of State ‘Trafficking in Persons’ Report 2013 The US Department of State’s ‘Trafficking in Persons’ (TIP) Report provides, from the point of discourse analysis, interesting material for the analysis of processes of truth-‐making and problem representation. The ‘Methodology’ section of the 2013 TIP Report gives a brief overview of how country summaries are compiled with what seems to be a haphazard approach towards the data collation. The reports are ‘prepared’, the ‘Methodology’ section reveals, by the US Department of State using ‘information from U.S. embassies, government officials, non-‐governmental and international organizations, published reports, news articles, academic studies, research trips to every region of the world, and information submitted to [email protected]’ (US TIP 2014). The country summaries, however, provide no details as to what information and what data exactly served as a basis for evaluations, and the extent to which the accuracy of the data was scrutinized. For example, the country summary for Ukraine in the 2013 edition of the Report appears to be based primarily on experts’ reports; whilst the assessment of the UK is based on what appears to be a narrative put together by the UK Government itself. The key protagonists within the TIP reporting frame are: (a) anti-‐trafficking experts30 (always knowledgeable and trustable); (b) government/authorities (with a varying degree of culpability for human trafficking); (c) victims (citizens and non-‐citizens/nationals, voiceless and disempowered, in need of protection and assistance, which they rarely receive); (d) criminals and traffickers (in need of identification, prosecution and conviction); (e) ‘donors’ (always benevolent, allocating money towards victim support); and (f) the US State Department itself -‐ the world ‘arbiter’ on the nations’ compliance with its own ‘minimum standards for the elimination of trafficking’. In assessing the extent to which penalties prescribed for trafficking are stringent or not, the Report makes comparisons to ‘other serious crimes, such as rape’ in reinforcing the hierarchy of suffering associated with trafficking for sexual exploitation. The reporting focus remains on the number of trafficking-‐related investigations, prosecutions and convictions; numbers of victims assisted; the extent of support provided by national governments to NGOs; number of shelters in operation and services available within these shelters; and governments’ efforts to ‘reduce the demand for commercial sex acts’.
TIP 2013 and Hungary The report for Hungary (TIP 2013: 192-‐193) appears to be based primarily on contributions from national non-‐governmental organisations. It describes Hungary as a source, transit and destination country for women, men and children subjected to ‘sex trafficking and forced labour’. It notes that Roma women and children are disproportionately represented among victims. The report suggests that the Government of Hungary fails to fully comply with the ‘minimum standards for the elimination of trafficking’, however praises its ‘significant efforts to do so’. The latter, in the eyes of the Report’s authors, is evidenced by the increased conviction rate of trafficking offenders, changes to the legislation to ensure that victims’ assistance is not conditional on their cooperation with law enforcement, the establishment of the national referral mechanism, and the provision of funding to NGOs to increase shelter capacity. The Government’s failures are linked to its limited assistance to the victims of trafficking, criminalisation rather than rehabilitation of victims, failure to ‘proactively’ address internal trafficking, alleged complicity of government officials, criminalisation of children involved in prostitution as perpetrators rather than victims of trafficking – all of which ‘continued to hamper the government’s ability to effectively address Hungary’s trafficking problem’. The report confirms that in 2012, there were 18 new police investigations (same as in 2011), 12 prosecutions (29 in 2011), 18 convictions (8 in 2011); and 122 victims identified by the Government through the National Referral Mechanism.
TIP and Ukraine Similarly to Hungary and the UK, the TIP report (TIP 2013: 373-‐375) describes Ukraine as a source, transit, and destination country for men, women, and children subjected to forced labour and sex trafficking, listing a range of countries of destination, from neighbouring Poland to the Republic of Seychelles, and countries of origin, from Moldova to Cameroon. The report identifies a lack of employment opportunities in Ukraine as one of the major causes, however promotes the stereotypical image of naïve victims who are ‘targeted by Ukrainian recruiters using
30 In her discussion of Foucault’s theorizing of biopower, Oksala (2013: 322) notes that biopower – not political power in the traditional sense as it cannot be understood as a power of a democratically elected sovereign body – ‘is essentially the power of life’s experts, interpreters, and administrators’.

UP-‐KAT | Kiril Sharapov | Research Report | Part 1 | October 2014 (version 1) 45
fraud, coercion, and debt bondage’. Unlike Hungary, where ethnicity (Roma) was the extra dimension of vulnerability, in Ukraine the report identifies children in orphanages and crisis centres as ‘particularly vulnerable’ to internal trafficking. The Report accuses the Government of Ukraine of failing to fully comply with the ‘minimum standards for the elimination of trafficking; however, praises its ‘significant efforts to do so’. The two major failings of the Ukrainian Government are not ‘devoting resources to investigating trafficking crimes’ and not ‘protecting trafficking victims’. The Government’s effort to develop a working legal and institutional framework to ‘fully implement the comprehensive anti-‐trafficking law passed in 2011’ are praised. This praise is however negated by the usual TIP benchmark of the number of officially identified victims, number of investigations, prosecutions and convictions, and the availability (or lack of it) of victim services. The Government is criticised for not dedicating sufficient law enforcement resources, failing to train government officials, non-‐harmonised legislation, failure to collect disaggregated data, and alleged complicity of government employees in trafficking-‐related offenses. Ukrainian nationals, in addition to being accused of acting as ‘recruiters’ are also accused of being implicated in international child sex tourism with the government doing nothing to stop this. Further criticism of the Government is directed at its failure to allocate funding to anti-‐trafficking efforts in 2012 – something that can be disputed on the basis of the Government’s Annual Report produced by the Ministry of Social Policy of Ukraine ‘On the Current State of Affairs on Implementing the State Policy on Fighting Human Trafficking in 2012’, which lists a range of activities undertaken by Ukrainian authorities centrally and in the regions (See Sharapov 2014). The Report provides the following data for 2012: 162 new police investigations (197 in 2011), 122 prosecutions (149 in 2011), 115 convictions (158 in 2011); 187 victims of trafficking identified (294 in 2011) with only 16 granted formal status by the government under the new procedures affording them the right to access legal, medical, and social assistance.
TIP and the United Kingdom Similarly to Ukraine and Hungary, the Report describes the UK as a source, transit, and destination country for men, women, and children -‐ victims of sex trafficking and forced labour (TIP 2013: 378-‐381). If the most vulnerable groups in Hungary were Roma women and children, and orphans in Ukraine, in the UK the most vulnerable group, according to the Report, were unaccompanied migrant children. The Report also notes that migrant workers in the UK (rather than describing them as ‘victims of trafficking’) are subjected to forced labour in agriculture, construction, food processing, domestic service, nail salons, and food services. The Report praises the UK Government for its full compliance with ‘the minimum standards for the elimination of trafficking’. The main indicators of the Government’s ‘success’ are increased detection, prosecution and convictions; improved identification of victims, an increase in the number of victims who ‘received access to care’, the government’s role in initiating, supporting and implementing ‘a wide range of anti-‐trafficking prevention programs in the UK’. The Report also identifies a range of ‘challenges’: extra victim-‐protection services are needed, failure of the victim identification and referral systems to help ‘many victims of trafficking’, criminalisation of victims and treatment of victims as illegal immigrants, inadequate protections for child trafficking victims, the need for a specific anti-‐trafficking law focusing on criminalisation and prosecution of trafficking. The Report notes that the UK Government did not ‘provide comprehensive prosecution, conviction, and sentencing data for trafficking offenders in 2012; however, it did provide data for certain specific cases that demonstrate the government’s ‘vigorous prosecution, conviction, and sentencing of a significant number of trafficking offenders during the reporting period’. The government reported that it proactively identified 1,186 potential trafficking victims from July through December 2012. Approximately 224 of these referrals involved labour trafficking or domestic servitude victims. This figure represents a 25% increase compared with overall NRM referrals in 2011. The Government reported a preliminary figure of 415 trafficking victims, who received a ‘positive grounds’ decision in 2012, with a significant number of outstanding decisions involving non-‐EU victims.
2013 Eurostat Report on Human Trafficking31 According to the first Eurostat Report on Human Trafficking released in 2013 (Eurostat 2013), the majority of ‘identified and presumed’ human trafficking victims in the EU (as reported by the member states’ authorities) were EU citizens (EU 27) – 61% in the period 2008-‐2010 – described, within the EU context, as victims of ‘internal trafficking’ (Eurostat 2013: 50). The Report notes, however, that the balance between trafficked EU and non-‐EU citizens continued to change over the reporting period, with the share of EU citizens decreasing from 88% of male victims in 2008 to 63% in 2010; and 82% of female victims in 2008 to 61% in 2010 (ibid.) The Report provides further details as to the reported nationality of non-‐EU victims of human trafficking with Nigeria and China being the two principal non-‐EU countries of origin of ‘identified and presumed’ victims. Brazil, Russia and Algeria featured in all of the three years of the reporting period (2008-‐2010) (Eurostat 2013: 51). Ukraine has been recorded as one of the top ten countries of
31 In October 2014, the European Commission released the 2014 edition of the Report; see http://epp.eurostat.ec.europa.eu/cache/ITY_OFFPUB/KS-‐TC-‐14-‐008/EN/KS-‐TC-‐14-‐008-‐EN.PDF. Any new data, contained within this edition, is not reflected upon in this current version of the research report.

UP-‐KAT | Kiril Sharapov | Research Report | Part 1 | October 2014 (version 1) 46
citizenship in 2008 with 57 of ‘identified or presumed’ victims, which comprised 2.3% of the total recorded for non-‐EU victims (Eurostat 2013, p. 51). In 2009 and 2010, Ukraine did not appear in the list of the top 10 countries of non-‐EU citizenship of the victims’ origin. The significant majority of traffickers prosecuted for human trafficking in the EU came from the EU member states -‐ 76% of all prosecuted traffickers in 2010 (Eurostat 2013: 73). Ukraine appeared in the top-‐10 list for prosecuted non-‐EU traffickers in 2008 (10 people or 1.8% of the total number of prosecuted non-‐EU traffickers) and in 2009 (2.4%), disappearing from the top 10 list in 2010 (Eurostat 2013: 73). The Report confirms that the number of identified and presumed victims of trafficking varied greatly between Member States due to variations in geographical areas, population size, location, and socio-‐economic situation. It should be noted, however, that the variability in the quality of data, which, as the Report confirms, has been collected from a variety of national authorities working in the field of human trafficking, including civil society organization, have almost certainly had an impact on the final picture presented in the Report. The questions remain about the extent to which the official data on the number of victims, prosecutions and convictions provided by the EU member states reflect the true scale of the problem. According to the Report, the highest number of identified and presumed victims per 100,000 inhabitants over the three reported years were registered in Cyprus (6.3 in 2010), Romania (5.4 in 2010), the Netherlands (6.0 in 2010), Bulgaria (5.7 in 2010) and Estonia (4.3 in 2010). Member states, which reported less than 0.2 victims per 100,000 inhabitants, included Hungary (0.1 in 2010), Malta (0.2 in 2008, 0.0 in 2009 and 1.0 in 2010) and Portugal (0.1 in 2010) (Eurostat 2013:39). The table below is based on the data included within the Report. It includes indicators for the UK and Hungary, the two case study countries, the EU overall, and for the two countries with the highest and the lowest numbers of identified and presumed victims in 2010 for comparative purposes. The latter includes Hungary, which, in 2010, remained one of the European countries with the lowest number of identified or presumed victims of human trafficking. Table A.8: Number of identified and presumed victims (per 100 000 inhabitants, Eurostat 2013)
2008 2009 2010
Total (Identified and presumed)
Victims per 100 000 inhabitants
Total (Identified and presumed)
Victims per 100 000 inhabitants
Total (Identified and presumed)
Victims per 100 000 inhabitants
EU total32 6309 1.3 7795 1.6 9528 2.9
Cyprus 58 7.3 113 14.2 52 6.3
Hungary 10 0.1 9 0.1 10 0.1
United Kingdom
No data No data 331 0.5 427 0.7
Source: Eurostat (2013: 31) The annual data for Hungary and the UK is disaggregated further in Table A.7 by forms of exploitation, i.e. trafficking for sexual exploitation, forced labour and domestic servitude, and other forms including forced begging, criminal activities, removal of organs, other exploitation and unknown purpose. Table A.9: Number of identified and presumed (in brackets) victims in the UK and Hungary by form of exploitation (2008 – 2010, Eurostat 2013)
2008 2009 2010
Sexual
exploitatio
n
Forced
labo
ur
and do
mestic
servitu
de
Other
Sexual
exploitatio
n
Forced
labo
ur
and do
mestic
servitu
de
Other
Sexual
exploitatio
n
Forced
labo
ur
and do
mestic
servitu
de
Other
Hungary 6 -‐ 4 7 1 1 5 1 4
United Kingdom
No data No data No data
96 (55) 90 (76) 4 (10) 95 (75)
139 (89) 11 (18)
Source: Eurostat (2013: 31-‐46) The Report provides further data on the extent of internal trafficking within the EU and Member states noting that
32 The EU Total reflects the total for a given year based on the countries which provided data for that year. Not all EU Member States provided data for all of the three reference years and direct comparisons of EU totals between years may therefore be misleading.
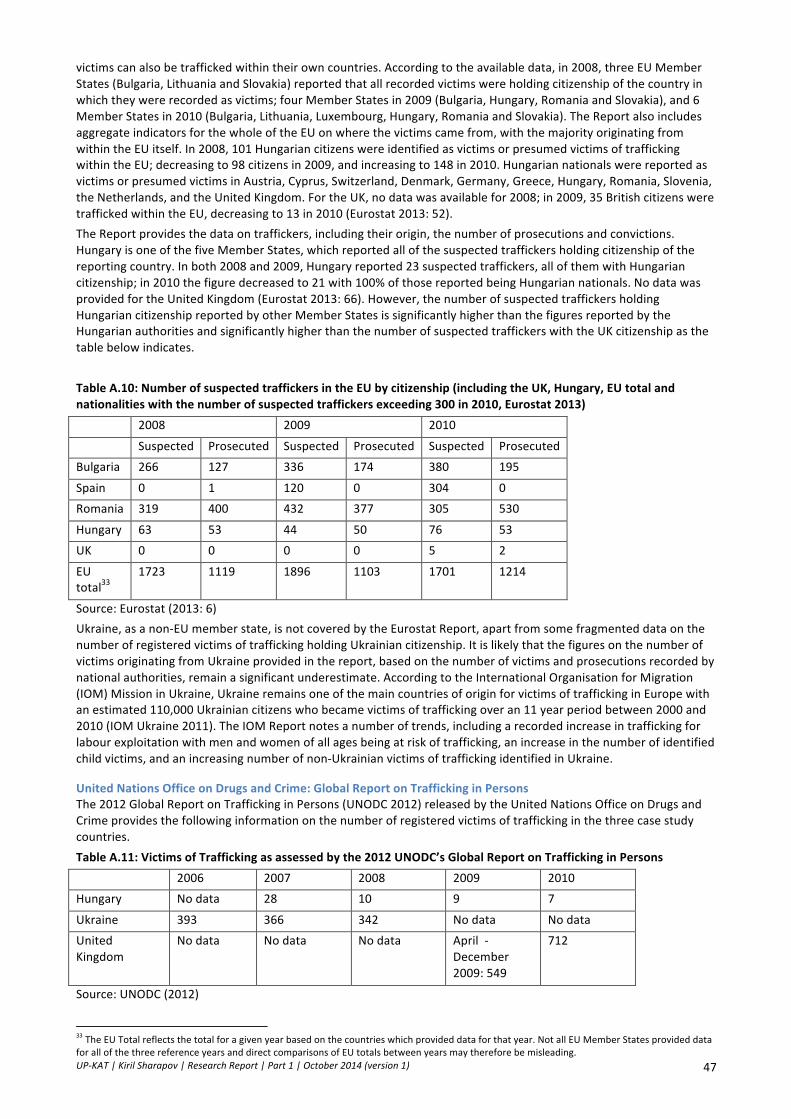
UP-‐KAT | Kiril Sharapov | Research Report | Part 1 | October 2014 (version 1) 47
victims can also be trafficked within their own countries. According to the available data, in 2008, three EU Member States (Bulgaria, Lithuania and Slovakia) reported that all recorded victims were holding citizenship of the country in which they were recorded as victims; four Member States in 2009 (Bulgaria, Hungary, Romania and Slovakia), and 6 Member States in 2010 (Bulgaria, Lithuania, Luxembourg, Hungary, Romania and Slovakia). The Report also includes aggregate indicators for the whole of the EU on where the victims came from, with the majority originating from within the EU itself. In 2008, 101 Hungarian citizens were identified as victims or presumed victims of trafficking within the EU; decreasing to 98 citizens in 2009, and increasing to 148 in 2010. Hungarian nationals were reported as victims or presumed victims in Austria, Cyprus, Switzerland, Denmark, Germany, Greece, Hungary, Romania, Slovenia, the Netherlands, and the United Kingdom. For the UK, no data was available for 2008; in 2009, 35 British citizens were trafficked within the EU, decreasing to 13 in 2010 (Eurostat 2013: 52). The Report provides the data on traffickers, including their origin, the number of prosecutions and convictions. Hungary is one of the five Member States, which reported all of the suspected traffickers holding citizenship of the reporting country. In both 2008 and 2009, Hungary reported 23 suspected traffickers, all of them with Hungarian citizenship; in 2010 the figure decreased to 21 with 100% of those reported being Hungarian nationals. No data was provided for the United Kingdom (Eurostat 2013: 66). However, the number of suspected traffickers holding Hungarian citizenship reported by other Member States is significantly higher than the figures reported by the Hungarian authorities and significantly higher than the number of suspected traffickers with the UK citizenship as the table below indicates. Table A.10: Number of suspected traffickers in the EU by citizenship (including the UK, Hungary, EU total and nationalities with the number of suspected traffickers exceeding 300 in 2010, Eurostat 2013)
2008 2009 2010
Suspected Prosecuted Suspected Prosecuted Suspected Prosecuted
Bulgaria 266 127 336 174 380 195
Spain 0 1 120 0 304 0
Romania 319 400 432 377 305 530
Hungary 63 53 44 50 76 53
UK 0 0 0 0 5 2
EU total33
1723 1119 1896 1103 1701 1214
Source: Eurostat (2013: 6) Ukraine, as a non-‐EU member state, is not covered by the Eurostat Report, apart from some fragmented data on the number of registered victims of trafficking holding Ukrainian citizenship. It is likely that the figures on the number of victims originating from Ukraine provided in the report, based on the number of victims and prosecutions recorded by national authorities, remain a significant underestimate. According to the International Organisation for Migration (IOM) Mission in Ukraine, Ukraine remains one of the main countries of origin for victims of trafficking in Europe with an estimated 110,000 Ukrainian citizens who became victims of trafficking over an 11 year period between 2000 and 2010 (IOM Ukraine 2011). The IOM Report notes a number of trends, including a recorded increase in trafficking for labour exploitation with men and women of all ages being at risk of trafficking, an increase in the number of identified child victims, and an increasing number of non-‐Ukrainian victims of trafficking identified in Ukraine.
United Nations Office on Drugs and Crime: Global Report on Trafficking in Persons The 2012 Global Report on Trafficking in Persons (UNODC 2012) released by the United Nations Office on Drugs and Crime provides the following information on the number of registered victims of trafficking in the three case study countries. Table A.11: Victims of Trafficking as assessed by the 2012 UNODC’s Global Report on Trafficking in Persons
2006 2007 2008 2009 2010
Hungary No data 28 10 9 7
Ukraine 393 366 342 No data No data
United Kingdom
No data No data No data April -‐ December 2009: 549
712
Source: UNODC (2012)
33 The EU Total reflects the total for a given year based on the countries which provided data for that year. Not all EU Member States provided data for all of the three reference years and direct comparisons of EU totals between years may therefore be misleading.
UP-‐KAT | Kiril Sharapov | Research Report | Part 1 | October 2014 (version 1) 48
References (Annex 2) Aljazeera (2013) Dance parties aim to boost Hungary birth rate, 28 May 2013. Available at: http://m.aljazeera.com/story/20135289644987543 Accessed 13 October 2014. BBC (2013) More UK births than any year since 1972, says ONS, 8 August 2013. Available at: http://www.bbc.co.uk/news/uk-‐23618487 Accessed 13 October 2014. Broeders, D. (2007) The New Digital Borders of Europe: EU Databases and the Surveillance of Irregular Migrants. International Sociology, 22(1). Budapest Business Journal (2011) Re-‐populating Hungary, 25 August 2011. Available at: http://www.bbj.hu/life/re-‐populating-‐hungary_59716 Accessed 13 October 2014. CIA (2013) Population Growth Rate. Available at: https://www.cia.gov/library/publications/the-‐world-‐factbook/fields/2002.html#ee Accessed 13 October 2014. Csernicsko, I. (2005) Hungarian in Ukraine. In: A. Fenyvesi (ed.) Hungarian Language Contact Outside Hungary: Studies on Hungarian as a minority language. John Benjamins Publishing Company. Cutts, D., Ford, R. and Goodwin, M. J. (2011) Anti-‐immigrant, politically disaffected or still racist after all? Explaining the attitudinal drivers of extreme right support in Britain in the 2009 European elections. European Journal of Political Research, 50 (3). Czaika, M. and Haas, H. de (2014) Briefing: Determinants of Migration to the UK. Migration Observatory. Available at: http://www.migrationobservatory.ox.ac.uk/sites/files/migobs/Briefing%20-‐%20Determinants%20of%20Migration_0.pdf Accessed 13 October 2014 Drbohlav, D. (2012) Patters of Immigration in the Czech Republic, Hungary and Poland: A Comparative Perspective. In: M. Okolski (ed.) European Immigrations: Trends, Structures and Policy Implications. Amsterdam University Press. Duvell, F. (2007) Ukraine – Europe’s Mexico? Centre on Migration, Policy & Society. Available at: https://www.compas.ox.ac.uk/fileadmin/files/Publications/Research_Resources/Flows/Ukraine_Country_Report_1of3.pdf Accessed 13 October 2014. EC (2014) EU Anti-‐Corruption Report. European Commission. Available at: http://ec.europa.eu/dgs/home-‐affairs/what-‐we-‐do/policies/organized-‐crime-‐and-‐human-‐trafficking/corruption/anti-‐corruption-‐report/index_en.htm Accessed 13 October 2014. EU Home Affairs (2013) Immigration in the EU. Available at: http://ec.europa.eu/dgs/home-‐affairs/e-‐library/docs/infographics/immigration/migration-‐in-‐eu-‐infographic_en.pdf Accessed: 13 October 2014 Eurostat (2013) Trafficking in human beings -‐ 2013 edition. Luxembourg: Eurostat. Available at: http://epp.eurostat.ec.europa.eu/cache/ITY_OFFPUB/KS-‐RA-‐13-‐005/EN/KS-‐RA-‐13-‐005-‐EN.PDF Accessed 13 October 2014. Fox, J.E., Morosanu, L. and Szilassy, E. (2012) The Racialization of the New European Migration to the UK. Sociology, 46(4). Godri, I. and Toth, P.P. (2004) The Social Position of Immigrants: Tarki Social Report Reprint Series No. 24. Tarki. Available at: http://www.tarki.hu/adatbank-‐h/kutjel/pdf/a739.pdf Accessed 13 October 2014. Government of Hungary (2012) Pace of population decline slowing down. Available at: http://2010-‐2014.kormany.hu/download/2/cd/c0000/Pace%20of%20population%20decline%20slowing%20down.pdf Accessed 13 October 2014. Hars, A. (2009) Dimensions and effects of labour migration to EU countries: the case of Hungary. In: B. Galgóczi, J. Leschke, A.Watt, B. Galgoczi (eds) EU Labour Migration since Enlargement. Ashgate. Hars, A. (2013) Labour market crisis: changes and responses. Available at: http://www.tarki.hu/en/news/2013/items/20130305_hars.pdf Accessed 13 October 2014. HH (2013) 75% of Ukrainians Tolerate Violations of Their Labour Rights [in Russian]. Available at: http://hh.ua/article/13846# Accessed 13 October 2014 Høyland, B., Moene, K. and Willumsen, F. (2012) The tyranny of international index rankings. Journal of Development Economics, 97(3). Hungarian Central Statistical Office (2014) 1.6. Foreign citizens residing in Hungary by continents, countrys, sex. Available at: http://www.ksh.hu/docs/eng/xstadat/xstadat_annual/i_wnvn001b.html. Accessed 13 October 2014. Huysmans, J. (2000) The European Union and the Securitization of Migration. JCMS: Journal of Common Market Studies, 38. IOM (2014) Hungary: Facts and Figures. International Organization for Migration. Available at: http://www.iom.int/cms/en/sites/iom/home/where-‐we-‐work/europa/european-‐economic-‐area/hungary.html Accessed: 13 October 2014.
UP-‐KAT | Kiril Sharapov | Research Report | Part 1 | October 2014 (version 1) 49
IOM (2014a) Migration and Climate Change. Available at: https://www.iom.int/cms/envmig Accessed: 13 October 2014. IOM Ukraine (2011) Migration in Ukraine: Facts and Figures. IOM Mission in Ukraine. Available at: http://www.iom.int/jahia/webdav/shared/shared/mainsite/activities/countries/docs/Ukraine/Migration-‐in-‐Ukraine-‐Facts-‐and-‐Figures.pdf Accessed 13 October 2014. Ivaschenko, E. (2012) Social and political implications of labor migration in Ukraine in the mirror of the sociological analysis. CARIM EAST – Consortium for Applied Research On International Migration. Available at: http://www.carim-‐east.eu/media/CARIM-‐East-‐2012-‐RR-‐24.pdf Accessed: 13 October 2014. Joppke, C. (1999) Immigration and the Nation-‐State: The United States, Germany, and Great Britain. OUP Oxford. KHPG (2013) About a half of all complaints to the Ombudsman are made with regards to social and labour rights [in Ukrainian]. Kharkiv Human Rights Protection Group. Available at: http://khpg.org/index.php?id=1374359417 Accessed 13 October 2014 Kupetz, O. (2012) Statistical data collection on migration in Ukraine. CARIM East – Consortium for Applied Research on International Migration. Available at: http://www.carim-‐east.eu/media/exno/Explanatory%20Notes_2011-‐15.pdf Accessed 13 October 2014. MAC -‐ Migration Advisory Committee (2012) Analysis of the Impacts of Migration. Available at: https://www.gov.uk/government/uploads/system/uploads/attachment_data/file/257235/analysis-‐of-‐the-‐impacts.pdf Accessed 13 October 2014. Malynovska, O. (2004) International Migration in Contemporary Ukraine: Trends and Policy. Global Migration Perspectives, No. 14. Global Commission on International Migration (GCIM). Available at: http://www.refworld.org/docid/42ce4b864.html Accessed: 13 October 2014 McCormick, A. (2012) Migration Myths: Migration & Unemployment. Migration Policy Centre. Available at: http://www.migrationpolicycentre.eu/docs/policy_brief/2012Migration%20%20Unemployment.pdf Accessed 13 October 2014. Migration Observatory (2012) Britain’s '70 Million' Debate. Available at: http://migrationobservatory.ox.ac.uk/reports/britains-‐70-‐million-‐debate Accessed: 13 October 2014. Minority Rights Group International (2008) World Directory of Minorities and Indigenous Peoples -‐ Serbia: Hungarians. Available at: http://www.refworld.org/docid/49749cb2c.html Accessed: 13 October 2014. MPC – Migration Policy Centre (2013) Ukraine: MPC Migration Profile. Available at: http://www.migrationpolicycentre.eu/docs/migration_profiles/Ukraine.pdf Accessed: 13 October 2014. Noorbakhsh, F. (1998) The human development index: some technical issues and alternative indices. Journal of International Development, 10 (5). Oksala, J. (2013) From Biopower to Governmentality. In: C. Falzon, T. O’Leary and J. Sawicki (eds.) A Companion to Foucault. Wiley-‐Blackwell. ONS (2014) ONS estimates of Long-‐Term International Migration for the year ending March 2014. Available at: http://www.ons.gov.uk/ons/rel/migration1/migration-‐statistics-‐quarterly-‐report/august-‐2014/sty-‐net-‐migration.html Accessed 13 October 2014. Parliament of Ukraine (2013) Law of Ukraine ‘On the State Budget of Ukraine for 2014’ [in Ukrainian]. Available at: http://zakon4.rada.gov.ua/laws/show/5515-‐17. Accessed 13 October 2014. Pozniak, O. (2012) External Labour Migration in Ukraine as a Factor in Socio-‐demographic and Economic Development. Migration Policy Centre. Available at: http://cadmus.eui.eu/handle/1814/24857 Accessed 13 October 2014. Reuveny, R. (2007) Climate change-‐induced migration and violent conflict. Political Geography, 26. Rienzo, C. and Vargas-‐Silva, C. (2012) Migrants in the UK: An Overview: Migration Observatory Briefing. COMPAS, University of Oxford. Rusu, I. (2012) Migration in Hungary: historical legacies and differential integration. In: E. Carmel, A. Cerami and T. Papadopoulos (eds.) Migration and welfare in the new Europe: Social protection and the challenges of integration, Policy Press. Sharapov, K. (2014) Giving us the ‘Biggest Bang for the Buck’ (or Not): Anti-‐trafficking government funding in Ukraine and the United Kingdom, Anti-‐Trafficking Review, 3. Todaro, M. and Smith, S.C. (2011) Economic Development. Addison Wesley Transparency International (2012) Transparency International’s Corruption Perception Index 2012. Available at: http://www.transparency.org/cpi2012/results Accessed 13 October 2014. Uehling, G. (2004) Irregular and Illegal Migration through Ukraine. International Migration, 42. Ukrstat (2012) Annual Bulletin on Demographic Developments in Ukraine 2011. Available at: http://ukrstat.org/en/druk/publicat/kat_e/publ1_e.htm Accessed 13 October 2014.
UP-‐KAT | Kiril Sharapov | Research Report | Part 1 | October 2014 (version 1) 50
Ukrstat (2012a) Basic indicators on labour market (annual data). Available at: http://ukrstat.org/en/operativ/operativ2007/rp/ean/ean_e/osp_rik07_e.htm Accessed 13 October 2014 Ukrstat (2014) Population. State Statistics Service of Ukraine Available at: http://ukrstat.org/en/operativ/operativ2007/ds/nas_rik/nas_e/nas_rik_e.html Accessed 13 October 2014. Ukrstat (2014a) The Average Salary by Industry in 2013. Available at: http://www.ukrstat.gov.ua/operativ/operativ2013/gdn/Zarp_ek_p/zpp2013_u.htm Accessed 13 October 2013. UNDP (2007) Assessment of programming arrangements, 2004-‐2007. UNDP: New York. UNDP (2013) Human Development Report 2013. Available at: http://hdr.undp.org/sites/default/files/reports/14/hdr2013_en_complete.pdf Accessed 13 October 2014. UNHCR (2011) The Decree of the President of Ukraine, #622/2011. On the Concept of State Migration Policy. Available at: http://unhcr.org.ua/img/uploads/docs/Concept_State%20Migration_Policy-‐June-‐2011.pdf. Accessed 13 October 2014. UNODC (2012) Global Report on Trafficking in Persons 2012. United Nations Office on Drugs and Crime. Available at: http://www.unodc.org/documents/data-‐and-‐analysis/glotip/Country_Profiles_Europe_Central_Asia.pdf Accessed 13 October 2014. US TIP (2013) Trafficking in Persons Report 2013. Available at: http://www.state.gov/documents/organization/210739.pdf Accessed 13 October 2014. US TIP (2014) Trafficking in Persons Report 2014. Available at: http://www.state.gov/j/tip/rls/tiprpt/2014/226645.htm Accessed 13 October 2014. World Bank (2010) Shadow Economies All over the World: New Estimates for 162 Countries from 1999 to 2007. Avaialable at: http://elibrary.worldbank.org/docserver/download/5356.pdf?expires=1377277025&id=id&accname=guest&checksum=EB852E9409FCC18760B91022DE7E588E Accessed 13 October 2014 World Bank (2011) Migration and Remittances Factbook 2011. Available at: http://data.worldbank.org/data-‐catalog/migration-‐and-‐remittances Accessed 13 October 2014. World Bank (2013) Death rate, crude (per 1,000 people). Available at: http://data.worldbank.org/indicator/SP.DYN.CDRT.IN/countries?display=default Accessed 13 October 2014. World Bank (2013a) Migration & Remittances Data (Data file -‐ April 2013). http://econ.worldbank.org/WBSITE/EXTERNAL/EXTDEC/EXTDECPROSPECTS/0,,contentMDK:22759429~pagePK:64165401~piPK:64165026~theSitePK:476883,00.htmlU Accessed 13 October 2014 World Bank (2013b) Ease of Doing Business in Ukraine. Available at: http://www.doingbusiness.org/data/exploreeconomies/ukraine/ Accessed 13 October 2014. World Bank (2014) Net migration. World Bank. Available at: http://data.worldbank.org/indicator/SM.POP.NETM?order=wbapi_data_value_2010+wbapi_data_value+wbapi_data_value-‐first&sort=asc Accessed: 13 October 2014. Yemelianova, A. (2013) A Diagnosis of Corruption in Ukraine. European Research Centre for Anti-‐Corruption and State-‐Building. Available at: http://www.againstcorruption.eu/wp-‐content/uploads/2012/09/WP-‐14-‐Diagnosis-‐of-‐Corruption-‐in-‐Ukraine-‐new.pdf Accessed 13 October 2014.
Related Documents