Understanding Protein-DNA Binding Events Anja Sophie Kiesel München 2017

Welcome message from author
This document is posted to help you gain knowledge. Please leave a comment to let me know what you think about it! Share it to your friends and learn new things together.
Transcript

Understanding Protein-DNABinding Events
Anja Sophie Kiesel
München 2017

Dissertation zur Erlangung des Doktorgradesder Fakultät für Chemie und Pharmazie
der Ludwig–Maximilians–Universität München
Understanding Protein-DNABinding Events
Anja Sophie Kieselaus München, Deutschland
2017


Erklärung:
Diese Dissertation wurde im Sinne von §7 der Promotionsordnungvom 28. November 2011 von Herrn Dr. Johannes Söding betreut.
Eidesstattliche Versicherung:
Diese Dissertation wurde eigenständig und ohne unerlaubte Hilfeerarbeitet.
München, den . . . . . . . . . . . .
Anja Sophie Kiesel
Dissertation eingereicht am 10.10.2017
1. Gutachter: Dr. Johannes Söding2. Gutachter: Prof. Dr. Julien Gagneur
Mündliche Prüfung am 30.11.2017

Acknowledgments
First and foremost I would like to thank my Ph.D. supervisor Dr. Johannes Soed-ing for giving me the opportunity to work in his group and become a member ofthe Soeding team. With several collaborative projects, I had the chance to diveinto a broad variety of biological problems.
Thanks to all the members of my dissertation committee, Prof. Dr. JulienGagneur, Prof. Dr. Förstermann, Dr. Dietmar Martin, Prof. Dr. Karl-KlausConzelmann and Prof. Dr. Karl Peter Hopfner. I appreciate your willingness toread and revise my work.
During the past years, I had the opportunity to work in several collaborationswith bioinformaticians and biochemists which I really enjoyed. Therefore I wouldlike to thank Schulle, Dr. Poony and the Tork-man for the amazing NUTs project,Alexandra for the exciting Histone collaboration, and the members of the Gaullabfor a long-term project to dissect the Drosophila core promoter secrets. In thisextent, I also want to thank Alessio, George, Martha, and Andrea for a great timeduring my lab internship at Alessio’s bench. Thanks to the Tresh lab and the Gag-neur lab, working with you and spending time with you really made my days.Thanks to the Göttinger Lab for being so much fun at the group retreats. SpecialThanks go to Wanwan, you do a fantastic job, and I hope that your work willfind its deserved appreciation. Thank you Schlauchi and Maria for always havingsomething to laugh about and distributing this amazingly happy mood in the of-fice. Thanks to Markus for lively discussions about the web server and the roadtrip from Fischbachau to Ingolstadt. Thank you, Vincent and Juri for being greatoffice neighbors and many discussions about the most abstract things I can imag-ine. Thank you, Carina for not only being a great colleague but also for beingmy friend, conference room buddy and best B&B in Göttingen. Thank you somuch, Holger and Matthias for being my mentors during the past year, not onlyconcerning work-related topics. My biggest Thanks go to my long lasting war-riors Susi and Mark, without you I may not have been able to finish. Mark, thankyou for so much advice and never being annoyed by my never-ending questionsand concerns, thanks for introducing the world of board games to me. Susi, youinspire me everyday with your never-ending enthusiasm and motivation and thank
i
ii
you for making me finally jump out of an airplane, indescribable!I want to thank all my friends and family for the long lasting support and
believe. Even if many of you do not understand what I am working on you stilltried to listen to my explanations without being annoyed by another story about"these proteins in the cell". Thank you, Mom, and thank you, Dad, for your loveand support especially the web server part and the encouragement to stick to the"physics" til the end. My beloved Bro’s, I thank you for being there when I neededyour help and showing interest in my "wicked" work.
Lastly, and most importantly, I want to express my greatest appreciation forthe unconditional support from the best man on earth, Niklas you are my hero!Without you, I would not even have started a Ph.D. and probably dropped outseveral times. You always encouraged me to go on and made me perform at mybest. I love you for being who you are, for supporting me in any part of our life,by always being there when I need you and by helping to make the most out ofeverything. You are incredible, and I am thankful for having you in my life. 5years ago, you promised me a Porsche when I finish my Ph.D.. Now that the endis near, I would like to mention that desires change and that I would like to replacethe Porsche for a Donkey.
Summary
DNA binding proteins regulate essential biological processes such as DNA repli-cation, transcription, repair, and splicing. Transcription factors (TFs) are in thefocus of this work because they have the largest effect of activating and repressinggene expression by influencing transcription rates. It is important to model TFbinding affinity to DNA and to predict protein-DNA binding events to understandhow they regulate cell mechanisms.
Higher order Markov models bring de-novo motif discovery to the next level.BaMM!motif has been shown to provide robust predictions of these more sophis-ticated binding models. Here I introduce the BaMM!motif web application, aweb-based platform which combines de-novo motif discovery with motif enrich-ment and motif-motif comparison tools and a database of known motifs. This webapplication enables the usage of the BaMM!motif algorithm in a straightforwardand robust environment.
Post-translational histone modifications and linker histone incorporation reg-ulate chromatin structure and genome activity. How these systems interface on amolecular level is unclear. Using biochemistry, one observes that the modificationbehavior of N-terminal histone H3 tails depends on the nucleosomal contexts. Ifound that linker histones inhibit modifications of different H3 sites on a genome-wide level.This proposes that alterations of H3 tail-linker DNA interactions bylinker histones execute basal control mechanisms of chromatin function.
Pervasive transcription of eukaryotic genomes stems to a large extent frombidirectional promoters that synthesize mRNA and divergent noncoding RNA(ncRNA). Here, I show that early termination that relies on the essential RNA-binding factor Nrd1 attenuates transcription of 32 genes in yeast. Further, de-pletion of Nrd1 from the nucleus results in 1,526 Nrd1-unterminated transcripts(NUTs) that originate from nucleosome-depleted regions (NDRs) and can dereg-ulate mRNA synthesis by antisense repression and transcription interference.
iii

iv
Publications
The BaMM!motif webserver for de-novo motif discovery andregulatory sequence analysisKiesel A, Meier M, Ge W, Roth C, Wess M, Soeding J(est 2018) Nucleic Acids Res(Web Server issue), Manuscript in preparation
Modulations of DNA Contacts by Linker Histones and Post-translationalModifications Determine the Mobility and Modifiability of Nu-cleosomal H3 TailsStützer A, Liokatis S, Kiesel A, Schwarzer D, Sprangers R, Soeding J, Selenko P,Fischle W(2016) Mol Cell, DOI:10.1016/j.molcel.2015.12.2015
Patient-specific driver gene prediction and risk assesment throughintegrated network analysis of cancer omics profilesBertrand D, Chng KR, Sherbaf FG, Kiesel A, Chia BK, Sia YY, Huang SK, HoonDS, Liu ET, Hillmer A, Nagarajan N(2015) Nucleic Acids Res, DOI:10.1093/nar/gku1393
Transcriptome surveillance by selective termination ofnoncoding RNA synthesisSchulz D, Schwalb B, Kiesel A, Baejen C, Torkler P, Gagneur J, Soeding J,Cramer P(2013) Cell, DOI:10.1016/cell.2013.10.024
v

vi
Contents
Acknowledgments i
Summary iii
Publications v
Table of Contents viii
List of Figures x
1 Introduction to protein-DNA interactions 11.1 Protein-DNA binding controls transcription . . . . . . . . . . . . 1
1.2 Measuring protein-DNA binding . . . . . . . . . . . . . . . . . . 2
1.3 Protein-DNA binding patterns . . . . . . . . . . . . . . . . . . . 3
1.4 Modeling transcription factor binding sites . . . . . . . . . . . . . 4
1.5 Visualization of binding motifs . . . . . . . . . . . . . . . . . . . 8
2 The BaMM!motif web application 112.1 Web applications for motif discovery . . . . . . . . . . . . . . . . 11
2.2 Technical aspects of the web application . . . . . . . . . . . . . . 12
2.2.1 Web application framework . . . . . . . . . . . . . . . . 12
2.2.2 Deployment and portability . . . . . . . . . . . . . . . . 15
2.2.3 Asynchronous job schedueling . . . . . . . . . . . . . . . 19
2.2.4 Security aspects . . . . . . . . . . . . . . . . . . . . . . . 20
2.3 Operating the BaMM!motif web application . . . . . . . . . . . . 23
2.4 De-novo motif discovery results . . . . . . . . . . . . . . . . . . 28
vii
viii CONTENTS
2.5 Motif-Motif comparison . . . . . . . . . . . . . . . . . . . . . . 302.5.1 Variable motif length and shift adjustment . . . . . . . . . 302.5.2 Local randomization of motifs as control cases . . . . . . 312.5.3 Scoring motif-motif similarity . . . . . . . . . . . . . . . 322.5.4 Evaluating scores via E-value . . . . . . . . . . . . . . . 362.5.5 Validation of the BaMM-match method . . . . . . . . . . 37
2.6 Motif enrichment in DNA sequences . . . . . . . . . . . . . . . . 392.7 Higher order motif database . . . . . . . . . . . . . . . . . . . . 412.8 Additional features . . . . . . . . . . . . . . . . . . . . . . . . . 432.9 Conclusion . . . . . . . . . . . . . . . . . . . . . . . . . . . . . 452.10 Outlook . . . . . . . . . . . . . . . . . . . . . . . . . . . . . . . 45
3 Histone modifications and linker Histones 473.1 Introduction . . . . . . . . . . . . . . . . . . . . . . . . . . . . . 473.2 Material and methods . . . . . . . . . . . . . . . . . . . . . . . . 49
3.2.1 Data sets . . . . . . . . . . . . . . . . . . . . . . . . . . 503.2.2 Data preprocessing . . . . . . . . . . . . . . . . . . . . . 503.2.3 Normalization . . . . . . . . . . . . . . . . . . . . . . . 513.2.4 Batch-effect correction . . . . . . . . . . . . . . . . . . . 523.2.5 Genome-wide correlation analysis . . . . . . . . . . . . . 52
3.3 Results . . . . . . . . . . . . . . . . . . . . . . . . . . . . . . . . 533.4 Conclusion . . . . . . . . . . . . . . . . . . . . . . . . . . . . . 55
4 Promoter proximal termination 574.1 Introduction . . . . . . . . . . . . . . . . . . . . . . . . . . . . . 574.2 Material and methods . . . . . . . . . . . . . . . . . . . . . . . . 61
4.2.1 Data sets . . . . . . . . . . . . . . . . . . . . . . . . . . 614.2.2 Normalization . . . . . . . . . . . . . . . . . . . . . . . 614.2.3 Escape Index . . . . . . . . . . . . . . . . . . . . . . . . 624.2.4 Error-correction and thresholding . . . . . . . . . . . . . 64
4.3 Results . . . . . . . . . . . . . . . . . . . . . . . . . . . . . . . . 654.4 Conclusion . . . . . . . . . . . . . . . . . . . . . . . . . . . . . 69
Bibliography 69
List of Figures
1.1 Sequence Logos and higher order Visualization . . . . . . . . . . 9
2.1 BaMM!motif Database Structure . . . . . . . . . . . . . . . . . . 14
2.2 Django Workflow for BaMM!motif . . . . . . . . . . . . . . . . . 16
2.3 Comparison of Docker Container and VMs . . . . . . . . . . . . 17
2.4 BaMM!motif Docker Container Stucture . . . . . . . . . . . . . . 19
2.5 Nginx as Reverse Proxy . . . . . . . . . . . . . . . . . . . . . . . 22
2.6 Operating jobs on BaMM!motif . . . . . . . . . . . . . . . . . . 25
2.7 Result Output of BaMM!motif . . . . . . . . . . . . . . . . . . . 29
2.8 Padding of Underhangs for Motif Comparison . . . . . . . . . . . 31
2.9 Local Randomization of Motifs . . . . . . . . . . . . . . . . . . . 32
2.10 Motif-Motif Comparison Score Distributions for S1 . . . . . . . . 34
2.11 Score Distributions for original and randomized motifs . . . . . . 35
2.12 Exponential Fit for ntop Data Points . . . . . . . . . . . . . . . . 37
2.13 Performance of S1, S2 and TOMTOM . . . . . . . . . . . . . . . 38
2.14 Operating a Motif Enrichment Analysis . . . . . . . . . . . . . . 39
2.15 Result of a Motif Enrichment Analysis . . . . . . . . . . . . . . . 40
2.16 Operaring the BaMM!motif database . . . . . . . . . . . . . . . . 41
2.17 BaMM!motif database entry page . . . . . . . . . . . . . . . . . 42
2.18 Login to BaMM!motif . . . . . . . . . . . . . . . . . . . . . . . 43
2.19 Responsive Web Design . . . . . . . . . . . . . . . . . . . . . . 44
3.1 H1 Linker Histone: PTMs from independent studies . . . . . . . . 51
3.2 H1 Linker Histone: H1-PTM Correlation . . . . . . . . . . . . . 53
3.3 H1 Linker Hitsone: Correlations for all PTMs and H1 linker histones 54
ix

x LIST OF FIGURES
4.1 Anchor-Away: Experimental Procedure . . . . . . . . . . . . . . 604.2 ChIP-seq Profile of Nrd1 . . . . . . . . . . . . . . . . . . . . . . 624.3 Escape Index - Scheme Illustration . . . . . . . . . . . . . . . . . 634.4 Escape Index - Thresholding . . . . . . . . . . . . . . . . . . . . 644.5 Escape Index - Landscape . . . . . . . . . . . . . . . . . . . . . 664.6 Differential ORF-T Profile . . . . . . . . . . . . . . . . . . . . . 674.7 CUTs are terminated NUTs . . . . . . . . . . . . . . . . . . . . . 68
Chapter 1
Introduction to protein-DNAinteractions
Protein-DNA interactions are commonly found in all living organisms. They playa major role in many essential biological processes such as DNA replication, tran-scription, repair, and splicing. Histones are proteins in the eukaryotic cell nu-clei. They are involved in chromosome packaging, a mechanism to regulate DNAaccessibility. The enzyme DNA Polymerase is needed to transcribe DNA intomRNA. Nucleases cleave DNA and glycosylases repair DNA breaks. Transcrip-tion factors (TFs) are in focus of this work on protein-DNA interactions becausethey have the largest effect of activating and repressing gene expression by influ-encing transcription rates. TFs are proteins that have at least one DNA-bindingdomain (DBD), which interacts with a DNA sequence pattern. It is important tomodel TF binding affinity to DNA and to predict protein-DNA binding events tounderstand how they regulate cell mechanisms.
1.1 Protein-DNA binding controls transcription
The rate of gene transcription determines protein abundance to a larger extent thanpost-transcriptional processes such as translation or degradation of mRNAs andproteins. Independent studies [14, 70, 85] show that transcription rates explainthe majority of protein level variation. Schwanhäusser et al. [129] challenged this
1
2 CHAPTER 1. INTRODUCTION TO PROTEIN-DNA INTERACTIONS
view by claiming that differences in translation rates dominate, with transcriptionrates explaining only 34% of the variance in protein abundances. However, Li etal. [86] ascribed 73% of protein level changes to transcription rates based on error-corrected estimates. Thus, transcription control mechanisms play a fundamentalrole in regulating protein abundance.
In 1961, Jacob and Monod [63] found that TF binding to regulatory DNAelements controls protein synthesis. This highlights TFs as the primary regulatorsfor transcription rate [116]. Experimental measures of the correlation betweengenome-wide chromatin modification patterns and gene expression lead to thediscovery of the epigenetic code, which questioned this claim [13, 150]. Sooncomputational approaches were published which use histone modification statesto predict gene expression [40, 73]. These correlations turned out to be indirecteffects instead of causal implications [46, 79]. TF binding can accurately predicthistone modification patterns [16].
The binding of TFs to specific sequence pattern of DNA elements mediatestranscriptional control and therefore also protein abundance. It is essential tomodel binding specificity and genome-wide binding patterns of TFs and otherproteins to uncover regulatory networks.
1.2 Measuring protein-DNA binding
Many in vitro and in vivo experiments have been developed to detect protein-DNAbinding specificities using high-throughput measurements [142].
Protein-binding microarrays (PBMs) expose short DNA fragments as a bind-ing platform for a target TF. Due to the number of fragments and combinatorics,the PBM represents all possible ten-base-long DNA sequences with every eight-base-long fragment occurring 32 times each. A fluorescent antibody then bindsto the protein and is used to measure binding specificity [6, 18, 48]. Cognate siteidentifier (CSI) arrays [158] also use DNA fragments to measure relative binding.In comparison to PBMs, single-stranded DNAs fold back to form double-strandedDNA binding sites to eliminate the need for primer-directed DNA synthesis.
Other high-throughput approaches include the systematic evolution of ligandsby exponential enrichment (SELEX) [68, 69] or microfluidic devices that mechan-
1.3. PROTEIN-DNA BINDING PATTERNS 3
ically induce trapping of molecular interactions (MITOMI) [45, 92].The in vivo approaches, such as chromatin immunoprecipitation followed by
microarray (ChIP-chip) [120] or sequencing (ChIP-seq) [67], determine the loca-tions within the genome that the TFs bind. This provides candidate genes that arelikely to be regulated. Their resolution is not high enough to define exact bind-ing sites. Motif discovery algorithms need to analyze the sequence informationafterward. Gilmour and Lis first introduced ChIP of proteins cross-linked to DNAin 1984 [47]. In a ChIP experiment, all DNA-binding proteins are crosslinked toDNA, i.e., via formaldehyde. Next, sonication shears the chromatin into shortfragments. The fragments have a length of 200-600 bps. Specific antibodiesagainst the protein of interest precipitate the target protein-DNA complexes. Re-verse crosslinking releases the DNA fragments of interest from the complexes.The obtained solution with fragments is purified, amplified via PCR, sequencedand mapped to a reference genome to get the binding sites of the protein of inter-est. ChIP-exo [121] and ChIP-nexus [56] increased the resolution of ChIP-derivedprotein-DNA binding footprints by introducing an extra exonuclease step, whichdigests the ends of the DNA fragments before high-throughput sequencing.
A target-specific antibody is necessary to perform a ChIP-seq experiment. Al-ternatives for measuring binding events without antibodies in vivo include DNase-seq [60, 111, 149] and ATAC-seq [21]. In both cases, regions of open chromatinare measured in a genome-wide fashion by cutting accessible DNA and sequenc-ing the fragment ends. DNase-seq uses DNase I, while ATAC-seq uses transposaseto digest chromatin. These experimental assays offer an antibody-free alternativeto measure more than one TF at a time, by determining collectively occupied ge-nomic regions. These footprints need to be assigned to proteins computationally,which is difficult, especially for paralogous TFs.
1.3 Protein-DNA binding patterns
A protein binds to DNA by forming specific hydrogen bonds and electrostaticinteractions. These interactions take place at the geometrically precisely fittingintersection of the DNA core binding site and the protein’s interface [154, 155].While this binding mechanism solely depends on the sequence (base read-out),
4 CHAPTER 1. INTRODUCTION TO PROTEIN-DNA INTERACTIONS
statistical-mechanical selection theory indicated further properties that influencefunctional specificity [17]. The dependency of neighboring nucleotides withina binding site was reported for several proteins [22, 93] and could partly be at-tributed to a readout mechanism that depends on structural properties of the DNAmolecule (shape readout), such as stacking interactions [123].
Determinants of binding locations were found to be even more complex, sincesecondary effects, such as cooperativity with other TFs, chromatin accessibility orcompetition with nucleosomes, also affect protein-DNA binding events [84, 123,133, 136]. Binding determinants are highly interdependent, resulting in smoothtransitions between base-readout and shape-readout concepts.
Only a small amount (< 30% ) [166] of the estimated 104 to 3× 10⁵ TFmolecules present in a cell [19, 87] are specifically bound to DNA at any giventime. A similar amount of factors bind in an unspecific manner [107] by i.e.,sliding along the DNA [53]. Only specifically binding TFs have been found tointeract in productive transcription [106].
1.4 Modeling transcription factor binding sites
In order to model the binding preference of a TF to a DNA sequence x of length L,the DNA bases x1, . . . ,xL ∈{A,C,G,T} are denoted by random variables X1, . . . ,XL.
According to Boltzmann’s law, the probability of binding is related to theGibbs free energy of binding ∆E by
p(X1 . . .XL = x1 . . .xL) ∝ e−∆E(x1...xL)
kTB (1.1)
Where kB is the Boltzmann constant, and T is the temperature. ApplyingBolzmann’s law assumes that the TF occupancy on the sequence is close to zero(weak binding approximation).
This Section covers models that compromise between simplicity and accuracyto estimate TF binding affinities to DNA sequence.
1.4. MODELING TRANSCRIPTION FACTOR BINDING SITES 5
Position weight matrix
The most common model for protein binding sites is the position weight matrix(PWM), introduced by Stormo [141]. It defines the importance of the four basesadenine (A), cytosine (C), guanine (G) and thymine (T) to the binding affinitybetween a TF and a DNA sequence x1 . . .xL.
The model is based on the idea to approximate the binding probability of a TFto a DNA sequence by assuming that each position i in the binding site contributesto the binding energy independently (see Equation 1.2).
p(x1 . . .xL) = p1 (x1) p2 (x2|x1) p3 (x3|x1x2) . . . pL (xL|x1 . . .xL−1) (1.2)
With this assumption, the binding probability can be approximated by theproduct of the individual probabilities pi(xi) of base xi ∈{A,C,G,T} being presentat position i. (see Equation 1.3).
p(x1 . . .xL)≈L
∏i=1
pi (xi) (1.3)
For N sequences of known binding sites, one can estimate the probabilitypi (xi) of base xi being at position i of the binding site by:
pi (xi) =ni (xi)
N(1.4)
Where ni (xi) is the number of times base xi has been observed at position i inall N sequences.
For accurate probability estimates, a sufficient amount of occurrences of allpossible 4L sequences would need to be reflected in the data. Since the length of aTF binding site can easily reach up to 20 base pairs (bp), the amount of data maybe a limiting factor for the accuracy of the model. It is necessary to compensatemissing data depth by introducing pseudocounts. In general pseudocounts aredesigned to be proportional to the background frequency f (xi) of base xi:
pi (xi) =ni (xi)+α f (xi)
N +α(1.5)
6 CHAPTER 1. INTRODUCTION TO PROTEIN-DNA INTERACTIONS
Where α is the total amount of pseudo counts to add. The influence of pseudocounts decreases and becomes negligible with increasing data depth, i.e., highcounts ni(xi).
The significant advantage of the PWM model is the small number of param-eters and robustness for little data depth. It requires 3× L compared to 4L− 1parameters in the full model. Due to the assumption of independence betweenpositions, the PWM model can only capture base readout but lacks any contri-butions to the binding energy based on a shape readout. Although PWMs workwell in many cases and are still widely used for evaluating protein-DNA bindingspecificity [36, 81, 140], their accuracy is debated [81].
inhomogeneous Markov Models (iMMs)
Inhomogeneous means position-specific while the order defines the positionalrange of the dependency. A PWM corresponds to an inhomogeneous Markovmodel (iMM) of order zero. Since in a PWM model, the conditional probabilitiesare approximated with its monomer probabilities pi(xi), information about corre-lations between positions is lost. iMMs of higher order k can retain informationabout the correlations between k+1 neighboring positions:
p(x1 . . .xL) ∝
L
∏i=1
pi (xi|xi−k . . .xi−1) (1.6)
The probability of base xi at position i is now depending on its precedingbinding site positions i− k to i− 1. The conditional probabilities can be calcu-lated from the sequence counts. They are corrected with pseudo counts which areproportional to the monomer background frequencies (see Equation 1.7).
pi (xi|xi−k . . .xi−1) ∝ni (xi−k . . .xi)+α f (xi)
ni−1 (xi−k . . .xi−1)+α(1.7)
By taking the context into account, iMMs can capture stacking interactionsbetween neighboring bases and local structural properties. However, the modelcomplexity rises with the model order k, leading to more parameters. More data isneeded to reflect all possible oligomers to obtain an accurate model. This makesiMMs more likely to be affected by statistical noise. When using an optimization
1.4. MODELING TRANSCRIPTION FACTOR BINDING SITES 7
process to learn a TF binding site model, this means that iMMs are more prone tooverfitting than PWMs.
inhomogeneous Interpolated Markov Models (iIMMs)
To reduce the risk of overfitting, Salzberg et al. introduced interpolated Markovmodels (IMMs) [124]. inhomogeneous Interpolated Markov Models (iIMMs)combine the ideas of interpolation and inhomogeneous adaptation. Here, adjust-ing the higher-order oligomer counts with pseudo counts based on the lower-orderoligomer probabilities instead of using fixed monomeric background frequenciesinfers dependencies of neighboring bases (see Equation 1.8).
pi (xi|xi−k . . .xi−1) ∝ni (xi−k . . .xi)+αk pi (xi|xi−k+1 . . .xi−1)
ni−1 (xi−k . . .xi−1)+αk(1.8)
iIMMs interpolate between counts and pseudo counts of the order below. Foroligomers that are frequent in the data, the counts dominate over the pseudocounts, while the lower-order pseudo counts drive probabilities of underrepre-sented oligomers. This means, iIMMs do not require a minimum number ofoligomer counts, thus are more robust to statistical noise than iMMs.
The BaMM!motif algorithm
The BaMM!motif algorithm was published by Siebert et al. in 2016 [132]. BaMM!motifis a Bayesian approach for motif discovery using iIMMs in which conditionalprobabilities of order k-1 act as priors for those of order k. This Bayesian Markovmodel (BaMM) training automatically adapts model complexity to the amount ofavailable data.
The pseudo counts of the iIMMs are weighted in an order specific fashion (seeEquation 1.9) because the interaction between neighboring nucleotides decreaseswith distance ([69]).
αk = 1, if k = 0;20×3k−1, if k > 0 (1.9)
BaMM!motif derives an EM algorithm for de-novo discovery of enriched mo-
8 CHAPTER 1. INTRODUCTION TO PROTEIN-DNA INTERACTIONS
tifs.
The goal is to estimate the model parameter pmoti f (K) , which is a vectorcontaining the W×4K+1 conditional probabilities p j(K)(xK+1|x1:K) for any K+
1-mer x1:K+1. The EM algorithm cycles between the E- and M-steps. The E-stepestimates the probabilities for a motif to be present at position i of sequence n.
rni := p(zn = i|xn, pmoti f (K)) (1.10)
They use the zero-or-one-occurrence-per-sequence (ZOOPS) model [7]. Thehidden variable zn indicates where the motif occurs in sequence n. In the M-step they use the new rni to update the model parameter pmoti f (k) for all ordersk = 0, . . . ,K. This update equation is equal to Equation 1.8 except that in thismodel the counts n j(x1:k) are interpreted as fractional counts (see Equation 1.11).
n j(x1:k) := ∑n
rni1(
xni+ j−k:i− j−1 = xi:k
)(1.11)
The indicator function returns 1 if the logical expression is true and 0 other-wise. The update of model parameters in the M-step runs through all orders fromk = 0 . . .K, using the just updated model parameters from the order below eachtime.
For transcription factor binding, BaMM!motif achieves significantly bettermotif models. In 97% of 446 ChIP-seq ENCODE datasets, the cross-validatedpartial AUC outperforms PWMs by an average improvement of 36% [132]. BaMM!motifalso learns complex multipartite motifs, improving predictions of polyadenyla-tion sites, transcription start sites, bacterial pause sites, and RNA binding sites.BaMM!motif never performed worse than PWMs. These robust improvementsargue in favor of generally replacing PWMs by BaMM!motif derived models,called BaMMs.
1.5 Visualization of binding motifs
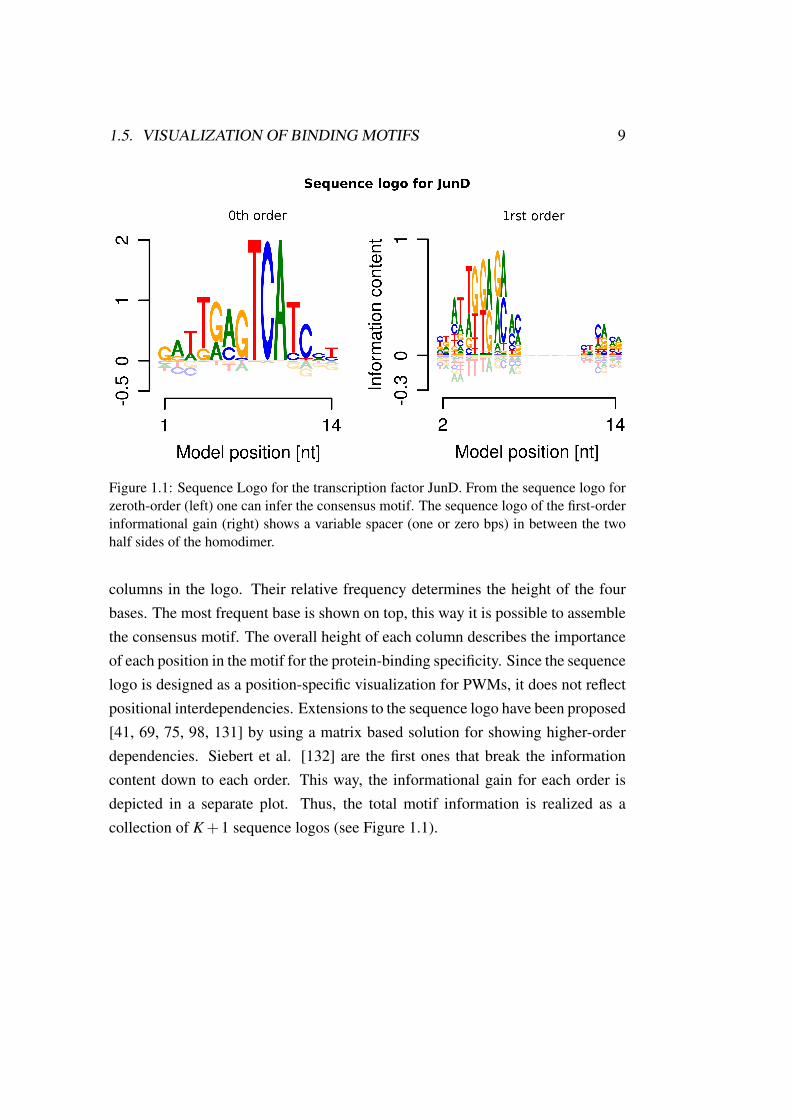
A sequence logo can visualize the content of a PWM [127]. The informationcontent (in bits) for each position in a PWM is represented by the height of the
1.5. VISUALIZATION OF BINDING MOTIFS 9
Figure 1.1: Sequence Logo for the transcription factor JunD. From the sequence logo forzeroth-order (left) one can infer the consensus motif. The sequence logo of the first-orderinformational gain (right) shows a variable spacer (one or zero bps) in between the twohalf sides of the homodimer.
columns in the logo. Their relative frequency determines the height of the fourbases. The most frequent base is shown on top, this way it is possible to assemblethe consensus motif. The overall height of each column describes the importanceof each position in the motif for the protein-binding specificity. Since the sequencelogo is designed as a position-specific visualization for PWMs, it does not reflectpositional interdependencies. Extensions to the sequence logo have been proposed[41, 69, 75, 98, 131] by using a matrix based solution for showing higher-orderdependencies. Siebert et al. [132] are the first ones that break the informationcontent down to each order. This way, the informational gain for each order isdepicted in a separate plot. Thus, the total motif information is realized as acollection of K +1 sequence logos (see Figure 1.1).

10 CHAPTER 1. INTRODUCTION TO PROTEIN-DNA INTERACTIONS
Chapter 2
BaMM!motif: A web application forde-novo motif discovery
To make higher order motif discovery available to a broad public of experimen-talists and scientific computationalists, I have implemented the BaMM!motif webapplication.
The platform provides tools for de-novo motif discovery, motif occurrencesearch, motif-motif comparisons, as well as a database of previously predictedhigher order TF binding models by the BaMM!motif algorithm.
First, I give an overview of available online platforms for motif discovery,and model databases (see Section 2.1). Next, I will explain and discuss whichtechniques I used to implement the BaMM!motif web application (see Sections2.3-2.7), and introduce all available features (see Section 2.8).
2.1 Web applications for motif discovery
Several motif discovery and search tools have been described in literature [9, 42,59, 66, 89, 115, 135, 147, 148]. The MEME suite [9] is the most prominentweb platform, offering tools for motif discovery (DREME [8], MEME [7]), motifoccurrence analysis (FIMO [49]) and motif comparison (TOMTOM [50]).
Common motif analysis tools work with the PWM representation of protein-
11
12 CHAPTER 2. THE BAMM!MOTIF WEB APPLICATION
DNA bindings, hence neglecting interdependencies of adjacent nucleotides. Thus,the BaMM!motif web application aims to provide motif analysis tools similarto the MEME suite but operating on the more sophisticated higher-order motifmodels instead of PWMs.
Many databases such as JASPAR, HOCOMOCO, SwissRegulon or TRANS-FAC [78, 97, 100, 114] provide thousands of TF binding site PWM models. First-order iMMs, sometimes called dinucleotide PWMs, are added to the JASPAR andHOCOMOCO databases. HOCOMOCO’s first-order iMMs yielded better resultsthan simple PWMs on average [78], and JASPAR’s dinucleotide PWMs performsignificantly better than PWMs for 21% of 96 tested datasets [99].
Hence, the BaMM!motif web application includes a database maintaining anddistributing higher order models and is connected with motif search and compar-ison tools, while the BaMM!motif de-novo discovery algorithm provides the coreanalysis of the web application.
2.2 Technical aspects of the web application
Various tools and technologies are available for web development, to design notonly a modern looking web interface but also to create a stable, fast and securebackend server. The following sections describe which technologies I used toimplement the application logic (see Section 2.2.1). The web application backendsetup focuses on flexibility to allow deployment (see Section2.2.2), schedulingasynchronous tasks (see Section 2.2.3) as well as ensuring robust and secure jobcalculations (see Section 2.2.4).
2.2.1 Web application framework
A web application is composed of a web server and web client. Both interactwith each other. The server stores data and processes them while the client con-tains the user interface and delivers tasks to the server [108]. In former daysthe connectivity and the entire construct of the client-server architecture wouldhave been implemented by hand solely aided by a common gateway interface(CGI) [61]. Since the connectivity and the core attributes are the same for each
2.2. TECHNICAL ASPECTS OF THE WEB APPLICATION 13
web application regardless of the content, web application frameworks are usedto provide a common infrastructure for the client-server communication. Manyframeworks are open source and use common scripting languages suitable forweb applications. I have decided to use the web application framework Djangofor this project. It is mainly written in Python and integrates HTML templates forthe client interface.
Django combines multiple tasks of a web application into a framework, hence,gives organization to the client-server architecture by providing a programminginfrastructure and taking care of rudimentary communications between the frontand back end. Django supports Python 3 and is the most popular Python-basedweb framework [37]. Since the BaMM!motif web application is meant to runlong-term, maintainability, security as well as a commonly used programminglanguage which facilities extendability, are essential. Django combines manyof these features and is therefore selected as the web application framework forBaMM!motif.
Django’s Model-View-Controller structure
Django uses a Model-View-Controller (MVC) like design pattern to structure theweb application [113]. The code for defining and accessing data (the model)is separate from the user interface (the view), which again is separate from therequest routing logic (the controller) [83].
A Model is defined in a python class and describes the design of a databasetable [113]. These model classes can be used to create, retrieve, update or deleterecords in the database using python commands rather than repetitive SQL state-ments. Django migrations propagate changes to the database schema. They auto-matically recognize differences in the database structure, store them in a separatemigration directory and apply those to the complete database. Thus, migrationsnot only circumvent problems due to invalid database entries or logic but alsowork as a version control system for the database schema, since a new migrationonly stores changes to the previous version.
Figure 2.1 depicts a schema of all Django models from the BaMM!motif webapplication and their connectivity with each other. The database consists of six
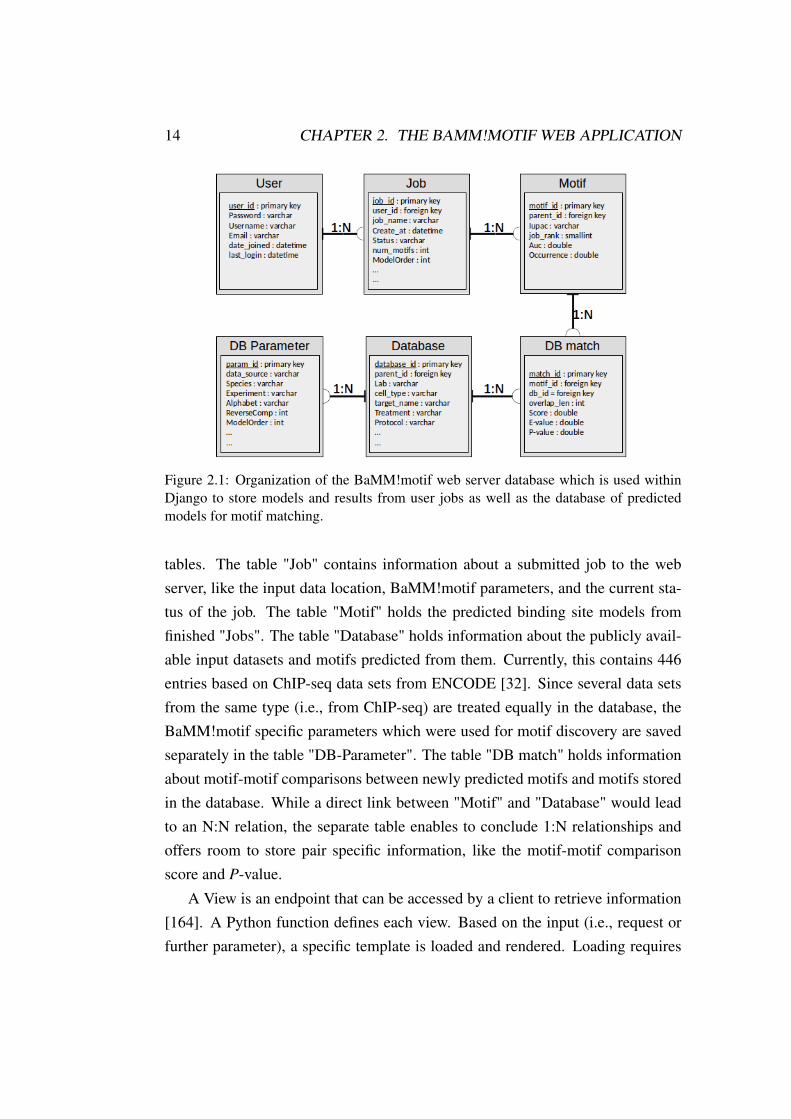
14 CHAPTER 2. THE BAMM!MOTIF WEB APPLICATION
Figure 2.1: Organization of the BaMM!motif web server database which is used withinDjango to store models and results from user jobs as well as the database of predictedmodels for motif matching.
tables. The table "Job" contains information about a submitted job to the webserver, like the input data location, BaMM!motif parameters, and the current sta-tus of the job. The table "Motif" holds the predicted binding site models fromfinished "Jobs". The table "Database" holds information about the publicly avail-able input datasets and motifs predicted from them. Currently, this contains 446entries based on ChIP-seq data sets from ENCODE [32]. Since several data setsfrom the same type (i.e., from ChIP-seq) are treated equally in the database, theBaMM!motif specific parameters which were used for motif discovery are savedseparately in the table "DB-Parameter". The table "DB match" holds informationabout motif-motif comparisons between newly predicted motifs and motifs storedin the database. While a direct link between "Motif" and "Database" would leadto an N:N relation, the separate table enables to conclude 1:N relationships andoffers room to store pair specific information, like the motif-motif comparisonscore and P-value.
A View is an endpoint that can be accessed by a client to retrieve information[164]. A Python function defines each view. Based on the input (i.e., request orfurther parameter), a specific template is loaded and rendered. Loading requires
2.2. TECHNICAL ASPECTS OF THE WEB APPLICATION 15
finding the correct template for a given identifier and preprocessing it by com-piling it to an in-memory representation. This enables the developer to performdatabase searches and requesting specific information which is dynamically inte-grated into a static HTML output template and displayed in the client browser.
In the BaMM!motif web application, each web page is connected to a specificview function. If a client requests dynamic information, e.g., a result page from afinished job, this page will be built dynamically from the job entry in the modeldatabase according to the requested job id and the static HTML representationframe for result pages. Thus, the HTML template for result pages can be reusedfor any job type requested (i.e., de-novo motif discovery, motif occurrence search,or database entry). Python logic infers the differences of these pages and reducestemplates to a minimum.
Views define which HTML templates will be filled and presented to the clientside. Together with the URL pattern definition that connects a URL to each view, itreflects the business logic of the controller layer. BaMM!motif organizes URLs in(a) job submission, (b) job result, (c) database, and (d) general requests. Where ap-plicable, the URL pattern contains the primary key of a submitted job or databaseentry which will be used within the view function to retrieve the correspondinginformation from the related model entry.
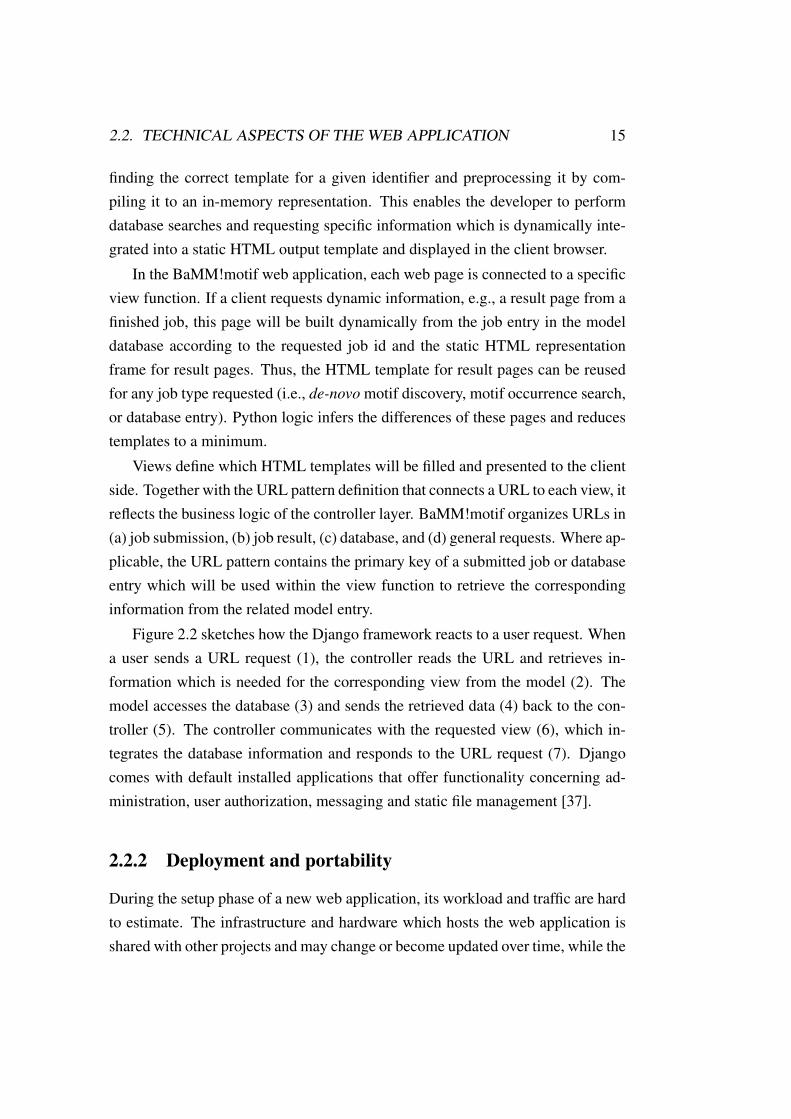
Figure 2.2 sketches how the Django framework reacts to a user request. Whena user sends a URL request (1), the controller reads the URL and retrieves in-formation which is needed for the corresponding view from the model (2). Themodel accesses the database (3) and sends the retrieved data (4) back to the con-troller (5). The controller communicates with the requested view (6), which in-tegrates the database information and responds to the URL request (7). Djangocomes with default installed applications that offer functionality concerning ad-ministration, user authorization, messaging and static file management [37].
2.2.2 Deployment and portability
During the setup phase of a new web application, its workload and traffic are hardto estimate. The infrastructure and hardware which hosts the web application isshared with other projects and may change or become updated over time, while the
16 CHAPTER 2. THE BAMM!MOTIF WEB APPLICATION
Figure 2.2: BaMM!motif webserver: Django’s Model-View-Controller structure. Whena client sends a URL request to the Django web server, the controller communicates withthe model to obtain the requested data base information and sends it to the view whichgives the requested URL response.
application itself might expand to multiple modules. A web application needs aflexible and easy to adapt deployment strategy to prepare for such circumstances.
The most common approaches are virtual machines and container-based sys-tems. They enable to use the same environment during development and pro-duction phase. Software portability encapsulated in a running environment enor-mously speeds up deployment because it eliminates typical problems such as dif-ferent system versions or missing plugins. Among all container solutions, Dockercurrently leads the market [38].
Docker containers versus virtual machines
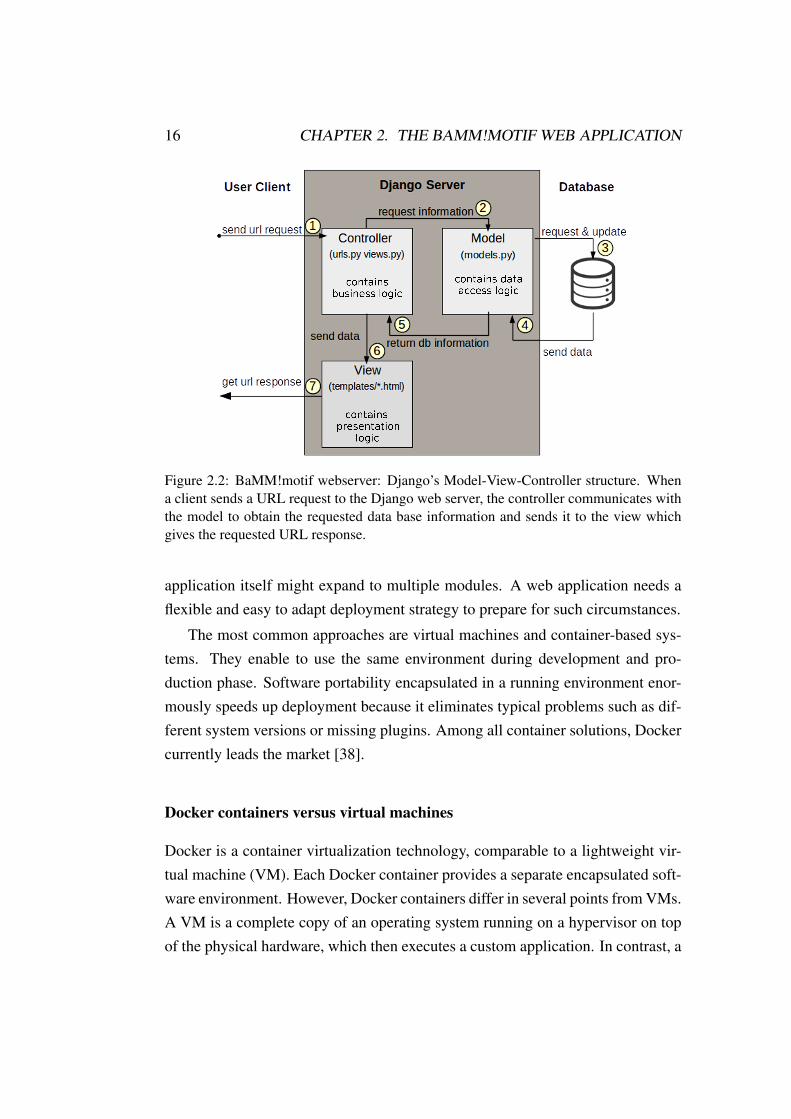
Docker is a container virtualization technology, comparable to a lightweight vir-tual machine (VM). Each Docker container provides a separate encapsulated soft-ware environment. However, Docker containers differ in several points from VMs.A VM is a complete copy of an operating system running on a hypervisor on topof the physical hardware, which then executes a custom application. In contrast, a
2.2. TECHNICAL ASPECTS OF THE WEB APPLICATION 17
Docker container interacts directly with the capabilities of the host’s kernel level(see Figure 2.3).
Consequently, containers are much more lightweight than VMs, thus requireless memory and are faster. Further, multiple Docker containers share supportingsystems from the host, while VMs each need their own instance of a kernel. This isthe reason why VMs need several minutes to launch while Docker containers canstart up in less than a second [64, 71]. While Docker containers can all access oneinstance of shared resources [102], VMs need an instance for each client, makingthem less scaleable and harder to maintain.Note, that although Docker requiresa Linux host system, it is possible to deploy Docker containers on MacOS andWindows, on which a stripped down Linux-based virtual machine is automaticallyconfigured as a host system.
Figure 2.3: Docker Containers are more lightweight than VMs because they share thesame supporting systems from the host, making them quicker in startup and less mem-ory consuming. (Illustration is taken from https://mondedie.fr/d/7164-Tuto-Utilisation-de-Docker/2)
However, the full isolation of VMs has one significant advantage over Dockercontainers. Due to its complete separation from the host system, VMs offer anexcellent protection by isolating for unwanted input/output (I/O) traffic. If a useror process manages to disrupt the kernel, it only impacts the current VM. SinceDocker containers share a common kernel, its disruption would affect all Dockercontainers running on the same host system. This makes VMs the safer andmore robust virtualization technology compared to conventional Docker contain-ers. Nevertheless, several options and isolation levels can be applied to Docker
18 CHAPTER 2. THE BAMM!MOTIF WEB APPLICATION
containers to elevate safety and stability (Section 2.2.4 discusses details aboutDocker container security). Regarding the advantages of Docker containers overVMs and the ability to downsize their drawbacks, I have decided to packageBaMM!motif into a Docker container virtualization.
Docker compose for multiple Docker containers
The idea of Docker containers suggests encapsulating one particular tool within acontainer. Most software systems, such as web applications need several tools towork efficiently, thus consist of multiple containers. To create and appropriatelyintegrate several containers, Docker has introduced its extension Docker-compose[39]. It can be used to unify a setup routine for a group of containers and defineinteractions and access between containers. While pooling administration of mul-tiple containers, Docker compose allows individual container settings to maintainhigh-level scalability.
The BaMM!motif Docker container infrastructure
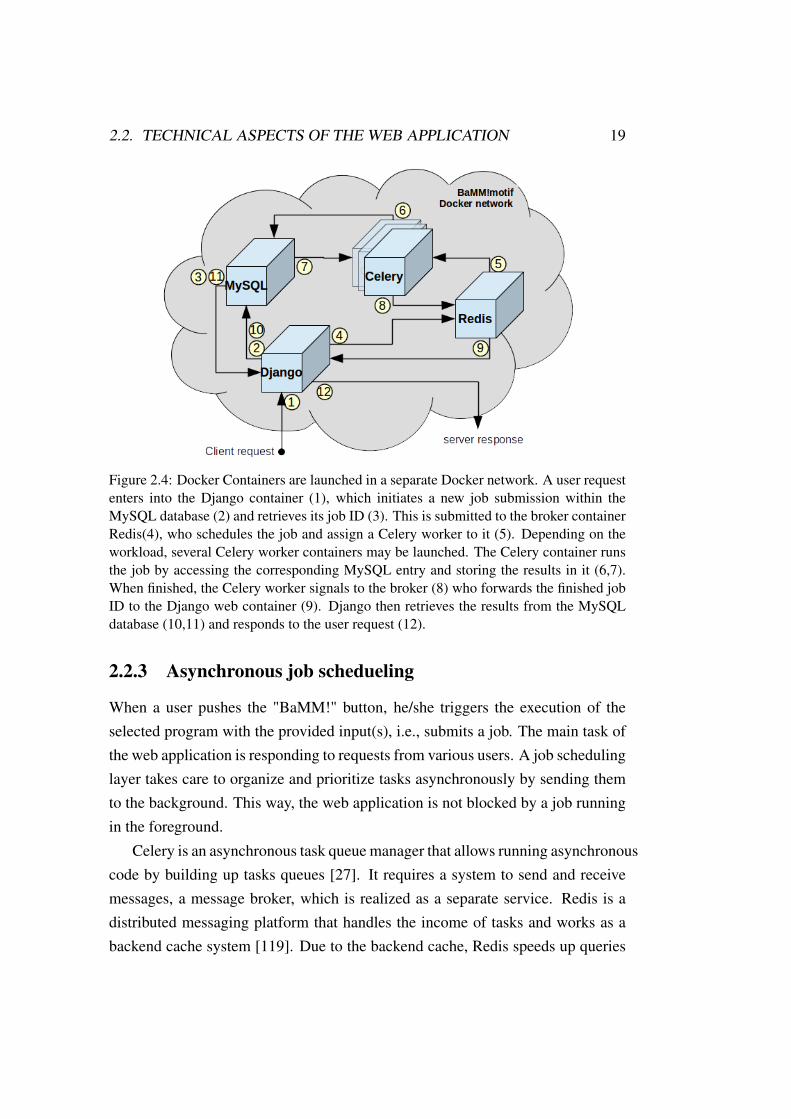
The BaMM!motif web application consists of four containers; one web containerand three service containers (see Figure 2.4).
The web container encapsulates the Django framework and the core of theweb application. A MySQL service container holds the MySQL database wherejob results, as well as the precalculated binding site models, are stored. The Re-dis service container works in collaboration with the Celery service container tomanage asynchronous tasks (described in detail in Section 2.2.3).
All containers run in the same Docker compose instance, and a separate Dockernetwork connects them with each other. A Dockerfile defines the settings for theDocker instance. The Docker-compose client uses the information from the Dock-erfile and the settings from the docker-compose.yml to interact with the Dockerdaemon, i.e., the Docker engine to launch the Docker compose instance.
2.2. TECHNICAL ASPECTS OF THE WEB APPLICATION 19
Figure 2.4: Docker Containers are launched in a separate Docker network. A user requestenters into the Django container (1), which initiates a new job submission within theMySQL database (2) and retrieves its job ID (3). This is submitted to the broker containerRedis(4), who schedules the job and assign a Celery worker to it (5). Depending on theworkload, several Celery worker containers may be launched. The Celery container runsthe job by accessing the corresponding MySQL entry and storing the results in it (6,7).When finished, the Celery worker signals to the broker (8) who forwards the finished jobID to the Django web container (9). Django then retrieves the results from the MySQLdatabase (10,11) and responds to the user request (12).
2.2.3 Asynchronous job schedueling
When a user pushes the "BaMM!" button, he/she triggers the execution of theselected program with the provided input(s), i.e., submits a job. The main task ofthe web application is responding to requests from various users. A job schedulinglayer takes care to organize and prioritize tasks asynchronously by sending themto the background. This way, the web application is not blocked by a job runningin the foreground.
Celery is an asynchronous task queue manager that allows running asynchronouscode by building up tasks queues [27]. It requires a system to send and receivemessages, a message broker, which is realized as a separate service. Redis is adistributed messaging platform that handles the income of tasks and works as abackend cache system [119]. Due to the backend cache, Redis speeds up queries
20 CHAPTER 2. THE BAMM!MOTIF WEB APPLICATION
that run on the backend.
Celery helps the task managing in Django, Redis helps the database and allother sources in executing, managing, caching as well as messaging what is re-quired from Celery to work efficiently. This way multiple tasks can be submittedand processed without disrupting the web page’s response to user requests.
I have decided to use Celery as an asynchronous task queue manager withRedis as message broker because they are both available as Docker images, hencecomfortable to set up as containers.
This also gives the opportunity to scale Celery according to the load balanceby increasing the number of workers without unnecessarily upscaling other con-tainers. Further, Django is capable of integrating Celery as an application into theweb framework with a lightweight configuration file written in Python.
Once Django is setup to work with Celery, one can define Celery tasks writ-ten as Python functions. These tasks can be called from within Django viewssynchronously or asynchronously. This provides a comfortable maintaining envi-ronment having a uniform programming language.
2.2.4 Security aspects
Security systems are an important aspect to consider when operating a web appli-cation. The BaMM!motif web application handles sensitive private data uploadsfrom clients, which need to be guaranteed to not be available to third parties. Fur-ther, malicious user actions may disrupt or even destroy the entire server.
Therefore, web applications, their environment, as well as the underlying sys-tem should be protected against attacks. The following section describes whichactions are taken to decrease the BaMM!motif web application’s vulnerability toa minimum.
Django’s builtin security options
Django offers a way to protect against Cross-Site-Request-Forgery (CSRF). Thisis, an anonymous user tries to execute tasks under the credentials of another userwithout that user knowing. It currently ranks as the most vulnerable technique
2.2. TECHNICAL ASPECTS OF THE WEB APPLICATION 21
[28]. By using the CSRF module appropriately, Django asks for a secret in eachPOST request based on a user-specific cookie.
If a browser connects with an HTTP connection instead of an HTTPS connec-tion, it is possible for existing cookies to be leaked. Since CSRF protection usescookies, BaMM!motif uses the Django options to work with secure sessions andCSRF cookies only.
Therefore, all HTTP requests are redirected over HTTPS connections usingHTTP Strict Transport Security (HSTS) [11].
In certain cases, host headers provided by the client construct URLs. Eventhough sanitation prevents cross site scripting attacks, a false host value couldlead to CSRF. Thus, Django validates host headers against a list of allowed hosts.
Docker’s approach to increase security
Docker containers interact directly with the host’s kernel system and have beencriticized for being less secure than fully encapsulated virtual machines. RecentDocker releases follow best practices and valuable configurations were added toreduce security risks while maintaining a lightweight and fast structure [31].
Docker containers are built from Docker images which are downloaded fromthe public community DockerHub. BaMM!motif only uses ContentTrust certifiedimages provided from Docker. Custom images may include invasive malware andare not recommended, thus also not used for the BaMM!motif web application.
Some file systems from the Linux kernel need to be mounted in a container toachieve proper process running. This is critical since mounting would also enablewriting to folders, which is highly depreciated for system folders.
Therefore, Docker mounts these system files in a "read-only" state, elevatingthe isolation level for processors and memory access [2].
On default, a Docker container runs in root user mode. This enables that eachprocess can be run regardless of its properties. However, this certainly increasesthe impact of malicious commands when having root privileges. Thus, all contain-ers from the BaMMM!motif web applications are launched in user mode withoutroot rights. This namespaced restricted mode eliminates the risk from containerbreakouts [64].
22 CHAPTER 2. THE BAMM!MOTIF WEB APPLICATION
A separate network for the BaMM!motif Docker container further reduces thenamespace. The network is defined within the Docker compose setup file and onlycontains BaMM!motif relevant resources. This eliminates potential crosstalksfrom third-party Docker containers running on the same machine.
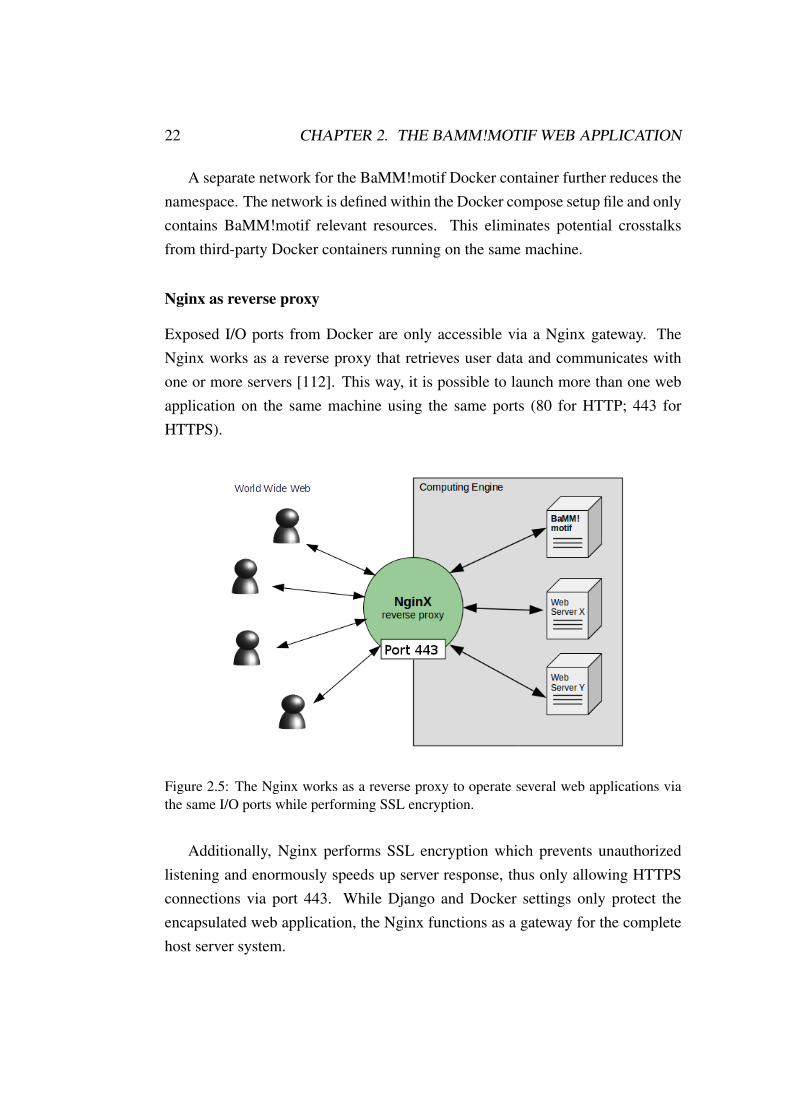
Nginx as reverse proxy
Exposed I/O ports from Docker are only accessible via a Nginx gateway. TheNginx works as a reverse proxy that retrieves user data and communicates withone or more servers [112]. This way, it is possible to launch more than one webapplication on the same machine using the same ports (80 for HTTP; 443 forHTTPS).
Figure 2.5: The Nginx works as a reverse proxy to operate several web applications viathe same I/O ports while performing SSL encryption.
Additionally, Nginx performs SSL encryption which prevents unauthorizedlistening and enormously speeds up server response, thus only allowing HTTPSconnections via port 443. While Django and Docker settings only protect theencapsulated web application, the Nginx functions as a gateway for the completehost server system.
2.3. OPERATING THE BAMM!MOTIF WEB APPLICATION 23
Even though the Nginx makes the server better maintainable, it is crucial thateach web application launched on the server follows a standard level of securityby checking any user data, such as cookies, HTML header or parameter.
2.3 Operating the BaMM!motif web application
The BaMM!motif web application makes BaMM!motif an easy-to-use web-basedtool. It provides de-novo motif discovery (see Section 2.4), evaluates modelperformance, compares new predictions with a database of known higher orderBaMM!motif models (see Section 2.5), offers a search tool for motif occurrences(see Section 2.6), and contains a database of 446 BaMM!motif models from ChIP-seq ENCODE datasets (see Section 2.7). These functionalities and additionalfeatures (see Section 2.8) of the web application are explained in detail in thefollowing sections.
Operating a task on the BaMM!motif web server follows a simple three-stepprocess:
1. Task Selection: The main page provides three possible tasks from whichthe user can choose. (a) De-novo Motif Discovery, (b) Motif OccurrenceSearch, (c) Browse Motif Database or (d) Search with a Motif though aMotif Database.
2. Data Upload: Based on the selected task the user is demanded to provide(a) a sequence set, (b) a motif model or (c) the name of a TF of interest.
3. Submission: Pressing the "BaMM!" button submits the desired query.
This straightforward and short procedure helps users to operate the BaMM!motiftool quickly and comfortable. More experienced users have the opportunity to ad-just the process by entering the advanced sections for data input and parametersetups.
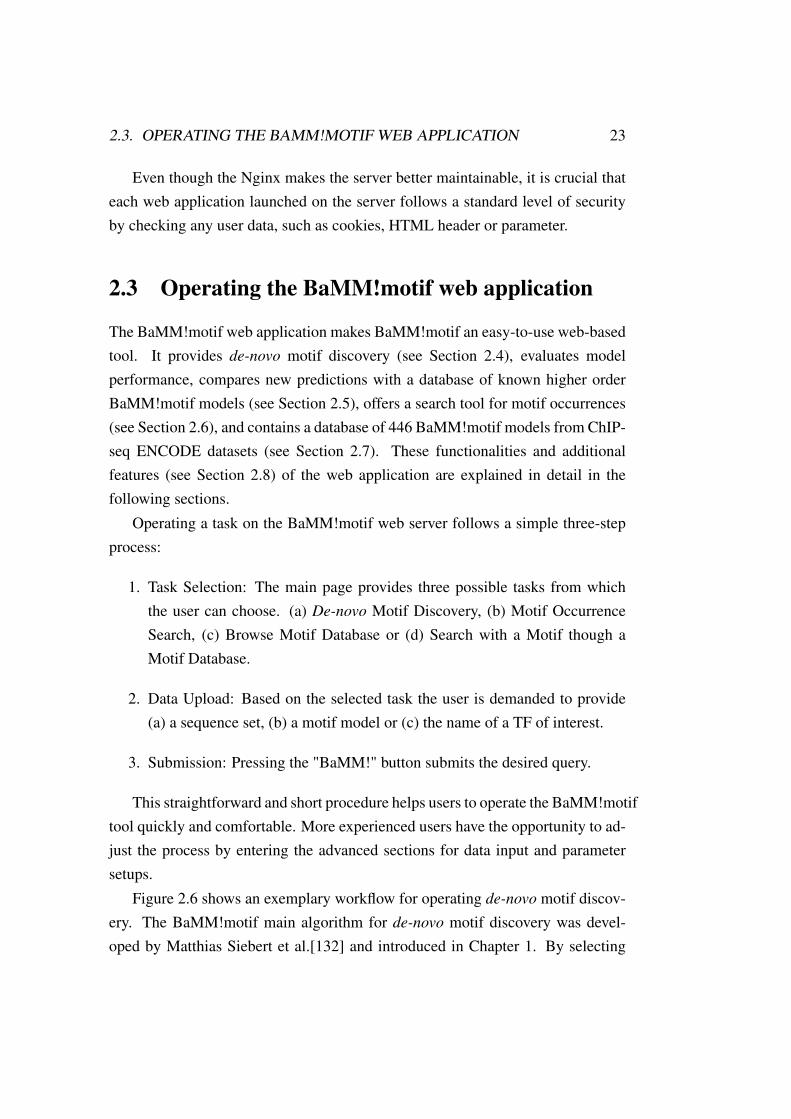
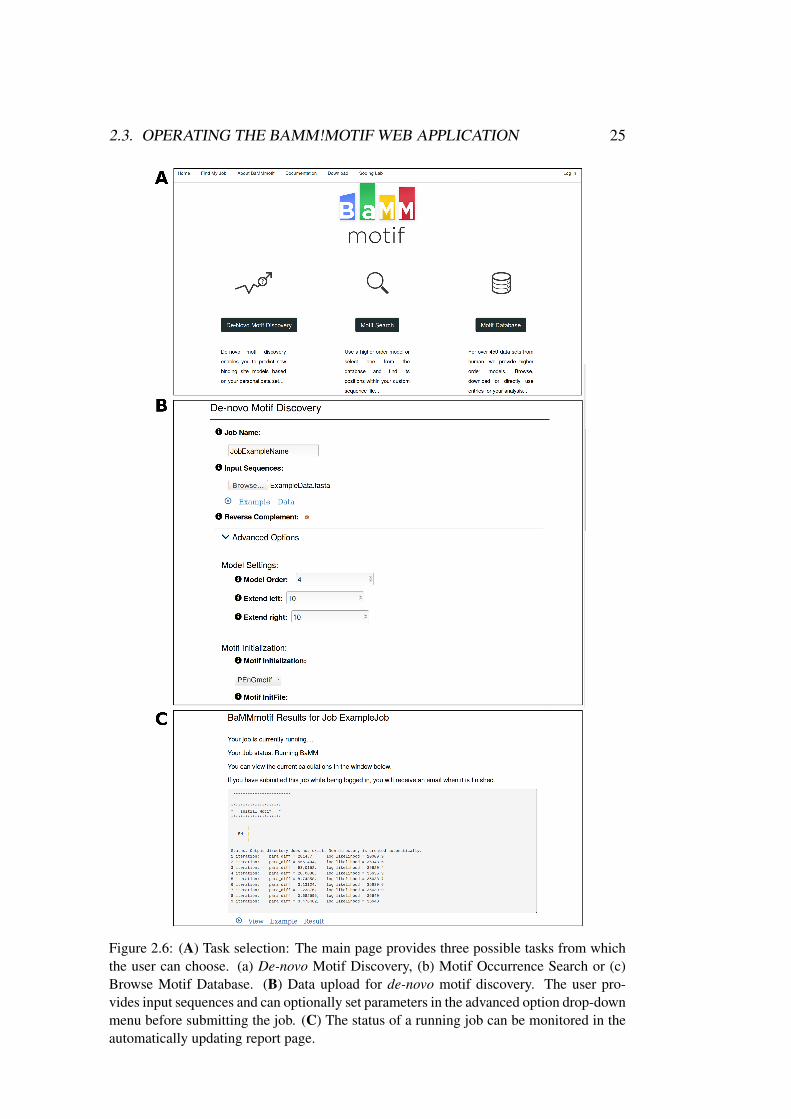
Figure 2.6 shows an exemplary workflow for operating de-novo motif discov-ery. The BaMM!motif main algorithm for de-novo motif discovery was devel-oped by Matthias Siebert et al.[132] and introduced in Chapter 1. By selecting

24 CHAPTER 2. THE BAMM!MOTIF WEB APPLICATION
"De-novo Motif Discovery" from the main home page, the user can start a newjob (see Figure 2.6.A).
2.3. OPERATING THE BAMM!MOTIF WEB APPLICATION 25
Figure 2.6: (A) Task selection: The main page provides three possible tasks from whichthe user can choose. (a) De-novo Motif Discovery, (b) Motif Occurrence Search or (c)Browse Motif Database. (B) Data upload for de-novo motif discovery. The user pro-vides input sequences and can optionally set parameters in the advanced option drop-downmenu before submitting the job. (C) The status of a running job can be monitored in theautomatically updating report page.
26 CHAPTER 2. THE BAMM!MOTIF WEB APPLICATION
The minimal input required by the user is an input sequence set in fasta for-mat and the decision whether to consider reverse complement sequences, basedon the strand specificity of the protein of interest and the given input sequenceinformation.
The ’Advanced Options’ drop-down menu contains suggested default optionsfor BaMM!motif, which can be modified (see Figure 2.6.B).
The user can specify the order of the optimized Bayesian Markov model. Afourth order model learns the frequencies of 5-mer nucleotides to model the corre-lations between nearby positions; i.e., a first-order model consists of dinucleotidedependencies, while a zeroth order model represents a standard PWM withoutinterdependencies. The algorithm is robust against overfitting so that the modelorder can be set high even for low depth input data. However, a higher ordermodel contains more parameters, which takes longer to optimize. The defaultmodel order is set to four as a compromise for speed and precision.
For initialization, BaMM!motif requires a start motif. This motif can eitherbe uploaded by the user or generated automatically using PEnGmotif (https://
github.com/soedinglab/PEnG-motif ). PEnGmotif, which is developed by MarkusMeier, is a fast seeding and merging algorithm to obtain overrepresented k-mersfrom the input sequence set.
BaMM!motif initializes with a PWM representation of fixed length. The usercan extend the model length to each side of the initial PWM by 0-100 bases. Thisgives the possibility to investigate flanking regions of PWMs that contain higherorder information which cannot be captured in a PWM. By default, the initialPWM extends by ten bases to each side.
The user can upload a background sequence set from which the statisticalbackground model is learned. The background model describes how nucleotidesand k-mers are distributed on ’normal’ sequences. BaMM!motif will learn motifswhich are enriched in the input sequence set in comparison to the expectation de-rived from the background model. When no background sequence set is provided,a background model is learned based on a second order homogeneous Markovmodel from the input sequences. The higher the background model order, thehigher is the biological content it describes. Short motifs may already be de-scribed by the background model if the background model order is set too high,
2.3. OPERATING THE BAMM!MOTIF WEB APPLICATION 27
while long, complex motifs are better modeled using a higher-order homogeneousMarkov model as the background model.
BaMM!motif models are optimized using an expectation maximization (EM)approach. The user can deselect this optimization for obtaining PEnGmotif’s ini-tialization PWM. EM specific parameters such as the convergence criteria for pa-rameter differences and the maximum number of optimization iterations can beadjusted. The EM q-value defines the percentage of input sequences expected toobtain a true TF binding site. In ChIP-seq experiments, we expect that roughly90% of the obtained sequences contain a real binding site. Therefore the defaultvalue is set to 0.9.
The user can further adjust the options of the false discovery rate estima-tion (FDR), a motif performance measure implemented by Wanwan Ge. Herea ’mFold’ larger background sequence set as the input sequence set is sampledbased on a background model of the selected FDR sampling order. BaMM!motifexecutes FDR estimation in a cross-validated fashion, where the user can selectthe number of cross-validations with ’cvFold’. On default, BaMM!motif per-forms false discovery rate estimation on a 100-times larger sampled backgroundsequence set with a 5-fold cross-validation.
Lastly, the optimized model will be compared against the BaMM!motif database(see Section 2.7). The result page reports all database matches that score betterthan the selected P-value cut off (more about motif-motif comparison in Section2.5).
After uploading all necessary files and setting parameters, the job is ready forsubmission to the BaMM!motif server. The user obtains the job id of a success-fully submitted job, which can be used to obtain its status and results.
A submitted job and its progress can be viewed in an embedded commandline window which refreshes automatically (see Figure 2.6.C). Once the job hasfinished, the user will be redirected to the resulting output page.
28 CHAPTER 2. THE BAMM!MOTIF WEB APPLICATION
2.4 De-novo motif discovery results
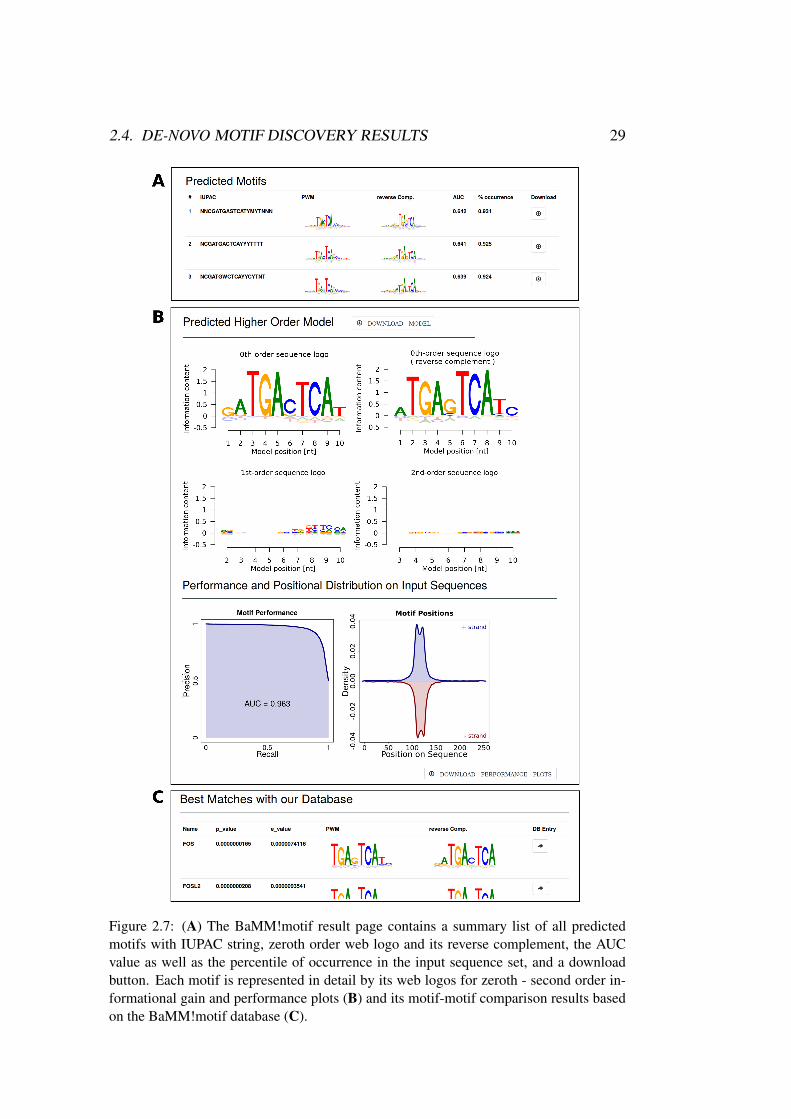
The result page consists of three blocks. First, the settings and input files for theparticular BaMM!motif run are summarized. Next, a compact list of all foundmotifs gives an overview of the results. Third, each predicted motif is explainedin a detailed result box.
The summary list shows a compact overview over all found motifs orderedby their E-value (see Figure 2.7.A). Each motif is listed with its IUPAC stringand web logos of its zeroth order contribution and its reverse complement. Theestimated area under the precision recall curve (AUC) value and the percentile ofoccurrence in the input sequence set give insights into the motif performance. Adownload button provides access to all motif-related data.
By clicking on one motif from the list, the page will jump to the appropriatemotif detail box (see Figure 2.7.B). Sequence logos showing the zeroth order con-tribution as PWM and its reverse complement visualize the model. Higher ordersequence logos show the informational gain upon the lower order to the model forfirst and second order.
The precision recall curve is based on the cross-validated false discovery rateestimation performed on sampled negative sequences. The AUC value gives anestimate of the motif strength. The motif enrichment in the input sequence set isshown as a positional distribution plot. By default, BaMM!motif runs in reversecomplement mode which means that all sequences in the input dataset and theirreverse complements are scanned for motif occurrences of the predicted model.
A motif-motif comparison links known TF binding sites from the BaMM!motifdatabase to the de-novo predicted motif, based on a similarity score (for details seeSection 2.5). Motifs, which have a higher similarity to the new motif than the se-lected P-value cutoff, are listed at the bottom of each motif result box (see Figure2.7.C). The P-value and E-value indicate the significance of the comparison. Atarget name, a web logo (also of the reverse complement) and a link for furtherinformation represent the corresponding database entry.
2.4. DE-NOVO MOTIF DISCOVERY RESULTS 29
Figure 2.7: (A) The BaMM!motif result page contains a summary list of all predictedmotifs with IUPAC string, zeroth order web logo and its reverse complement, the AUCvalue as well as the percentile of occurrence in the input sequence set, and a downloadbutton. Each motif is represented in detail by its web logos for zeroth - second order in-formational gain and performance plots (B) and its motif-motif comparison results basedon the BaMM!motif database (C).
30 CHAPTER 2. THE BAMM!MOTIF WEB APPLICATION
2.5 Motif-Motif comparison
A newly identified motif often raises the question whether it resembles a previ-ously identified TF binding site. To address this problem, I have developed amotif-motif comparison tool which matches a query motif with the BaMM!motifdatabase (for details on the database see Section 2.7). The tool ranks all motifsfrom the database by the similarity of their zeroth order model components to thequery motif and computes P-values and E-values.
2.5.1 Variable motif length and shift adjustment
The similarity between zeroth order motifs is the maximum similarity score s(·, ·)evaluated in the overlapping regions when the two motifs of length l and l′ areshifted by d with respect to each other.
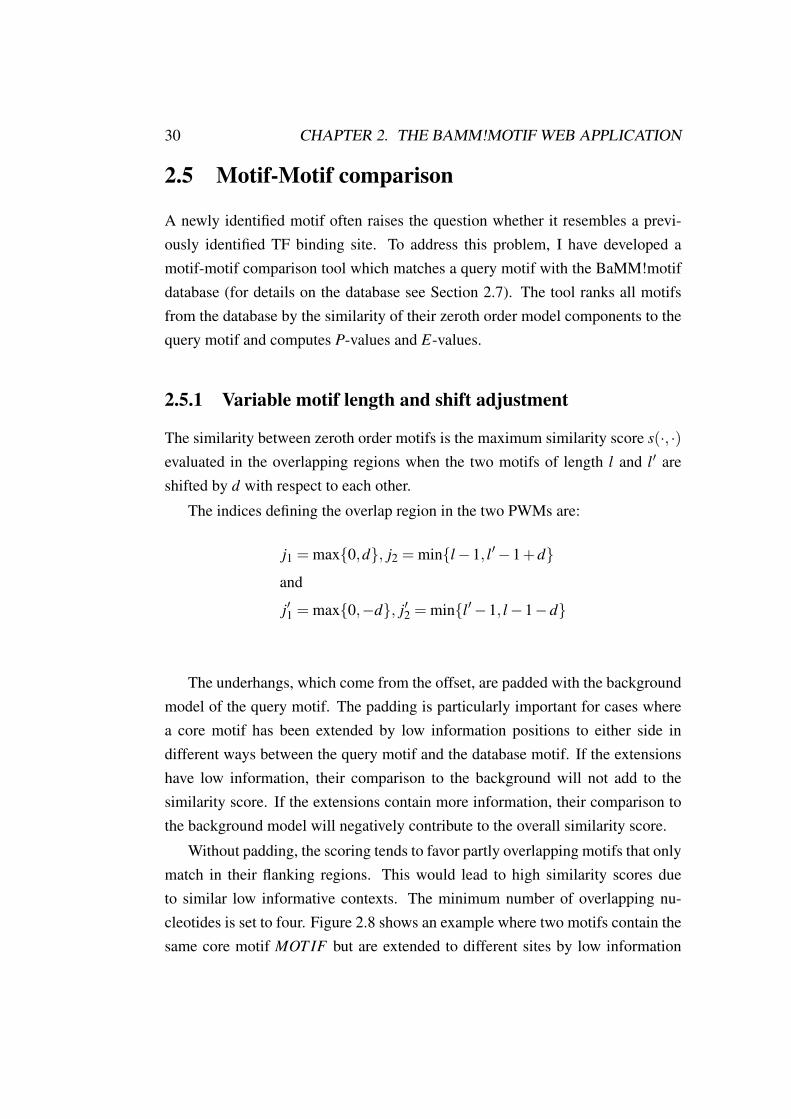
The indices defining the overlap region in the two PWMs are:
j1 = max{0,d}, j2 = min{l−1, l′−1+d}
and
j′1 = max{0,−d}, j′2 = min{l′−1, l−1−d}
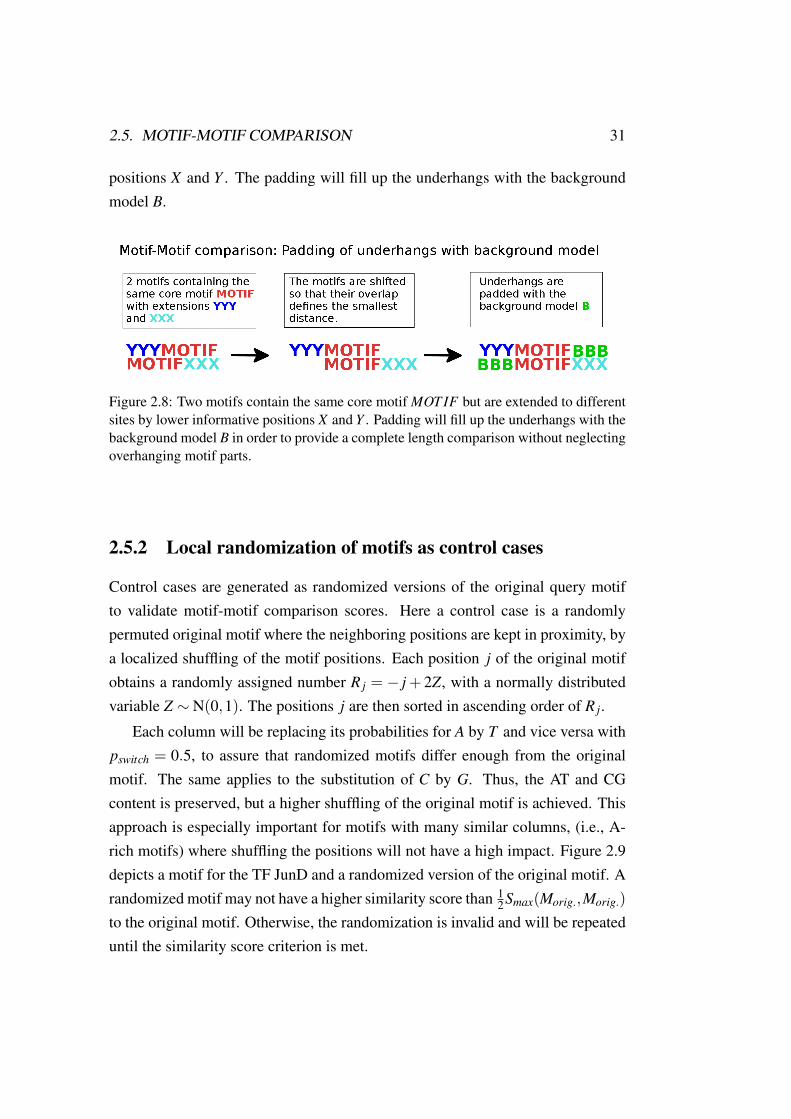
The underhangs, which come from the offset, are padded with the backgroundmodel of the query motif. The padding is particularly important for cases wherea core motif has been extended by low information positions to either side indifferent ways between the query motif and the database motif. If the extensionshave low information, their comparison to the background will not add to thesimilarity score. If the extensions contain more information, their comparison tothe background model will negatively contribute to the overall similarity score.
Without padding, the scoring tends to favor partly overlapping motifs that onlymatch in their flanking regions. This would lead to high similarity scores dueto similar low informative contexts. The minimum number of overlapping nu-cleotides is set to four. Figure 2.8 shows an example where two motifs contain thesame core motif MOT IF but are extended to different sites by low information
2.5. MOTIF-MOTIF COMPARISON 31
positions X and Y . The padding will fill up the underhangs with the backgroundmodel B.
Figure 2.8: Two motifs contain the same core motif MOT IF but are extended to differentsites by lower informative positions X and Y . Padding will fill up the underhangs with thebackground model B in order to provide a complete length comparison without neglectingoverhanging motif parts.
2.5.2 Local randomization of motifs as control cases
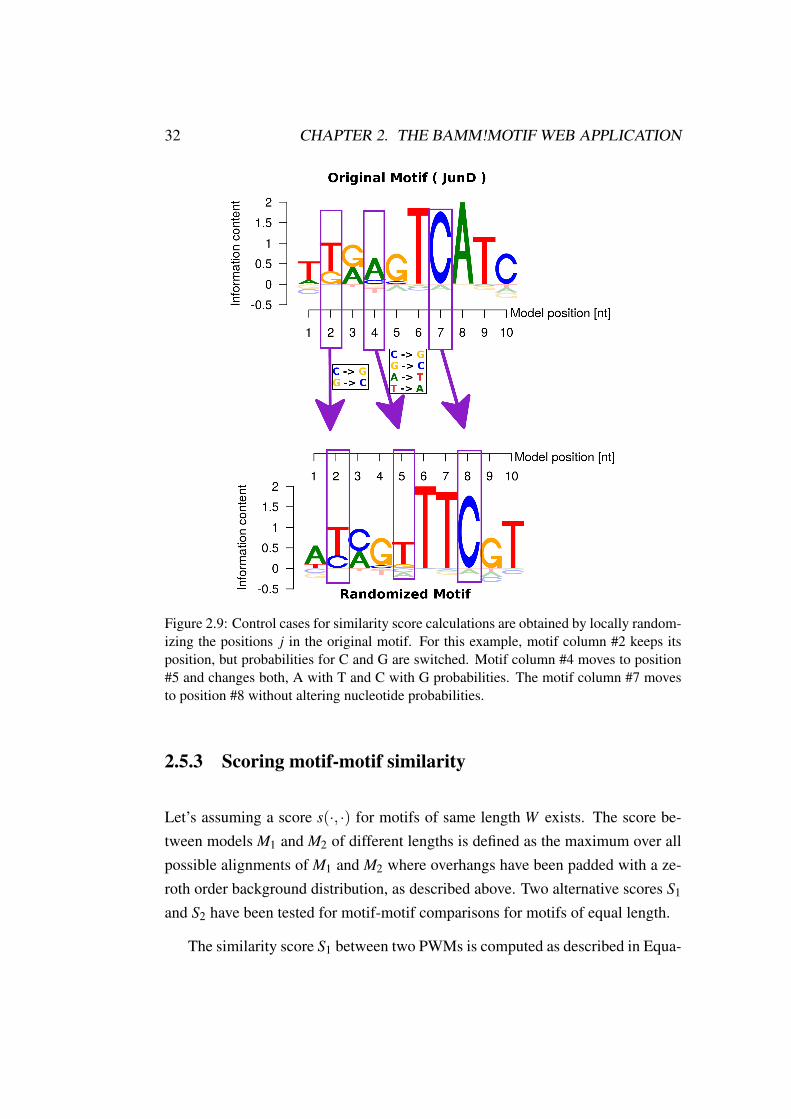
Control cases are generated as randomized versions of the original query motifto validate motif-motif comparison scores. Here a control case is a randomlypermuted original motif where the neighboring positions are kept in proximity, bya localized shuffling of the motif positions. Each position j of the original motifobtains a randomly assigned number R j = − j+ 2Z, with a normally distributedvariable Z ∼ N(0,1). The positions j are then sorted in ascending order of R j.
Each column will be replacing its probabilities for A by T and vice versa withpswitch = 0.5, to assure that randomized motifs differ enough from the originalmotif. The same applies to the substitution of C by G. Thus, the AT and CGcontent is preserved, but a higher shuffling of the original motif is achieved. Thisapproach is especially important for motifs with many similar columns, (i.e., A-rich motifs) where shuffling the positions will not have a high impact. Figure 2.9depicts a motif for the TF JunD and a randomized version of the original motif. Arandomized motif may not have a higher similarity score than 1
2Smax(Morig.,Morig.)
to the original motif. Otherwise, the randomization is invalid and will be repeateduntil the similarity score criterion is met.
32 CHAPTER 2. THE BAMM!MOTIF WEB APPLICATION
Figure 2.9: Control cases for similarity score calculations are obtained by locally random-izing the positions j in the original motif. For this example, motif column #2 keeps itsposition, but probabilities for C and G are switched. Motif column #4 moves to position#5 and changes both, A with T and C with G probabilities. The motif column #7 movesto position #8 without altering nucleotide probabilities.
2.5.3 Scoring motif-motif similarity
Let’s assuming a score s(·, ·) for motifs of same length W exists. The score be-tween models M1 and M2 of different lengths is defined as the maximum over allpossible alignments of M1 and M2 where overhangs have been padded with a ze-roth order background distribution, as described above. Two alternative scores S1
and S2 have been tested for motif-motif comparisons for motifs of equal length.
The similarity score S1 between two PWMs is computed as described in Equa-
2.5. MOTIF-MOTIF COMPARISON 33
tion 2.1:
S1(M1,M2) =j2
∑j= j1
(α
[d(M1 j,M
bg1 )+d(M2 j−d,M
bg1 )]−d(M1 j,M2 j−d)
)(2.1)
Here, Mbg1 is a PWM that contains the zeroth order background model for
query motif M1 in each column. As distance d(M1 j,M1 j′) between two PWMcolumns M1 j and M2 j′ the sum of Jenssen Shannon divergence is used. TheJenssen Shannon divergence is defined as the arithmetic average over the rel-ative entropies of each column with their average distribution M1 ja where a ∈[A,C,G,T ]. (see Equation 2.2).
M1 ja :=M1 ja +M2 j′a
2(2.2)
Hence the distance between PWMs M1 j and M2 j′ is:
d(M1 j,M2 j′) =12(H(M1||M1 j)+H(M2 j′||M1 j)
)=
12
A,C,G,T
∑a
(M1 ja log2 M1 ja +M2 j′a log2 M2 j′a−2M1 ja log2 M1 ja
)(2.3)
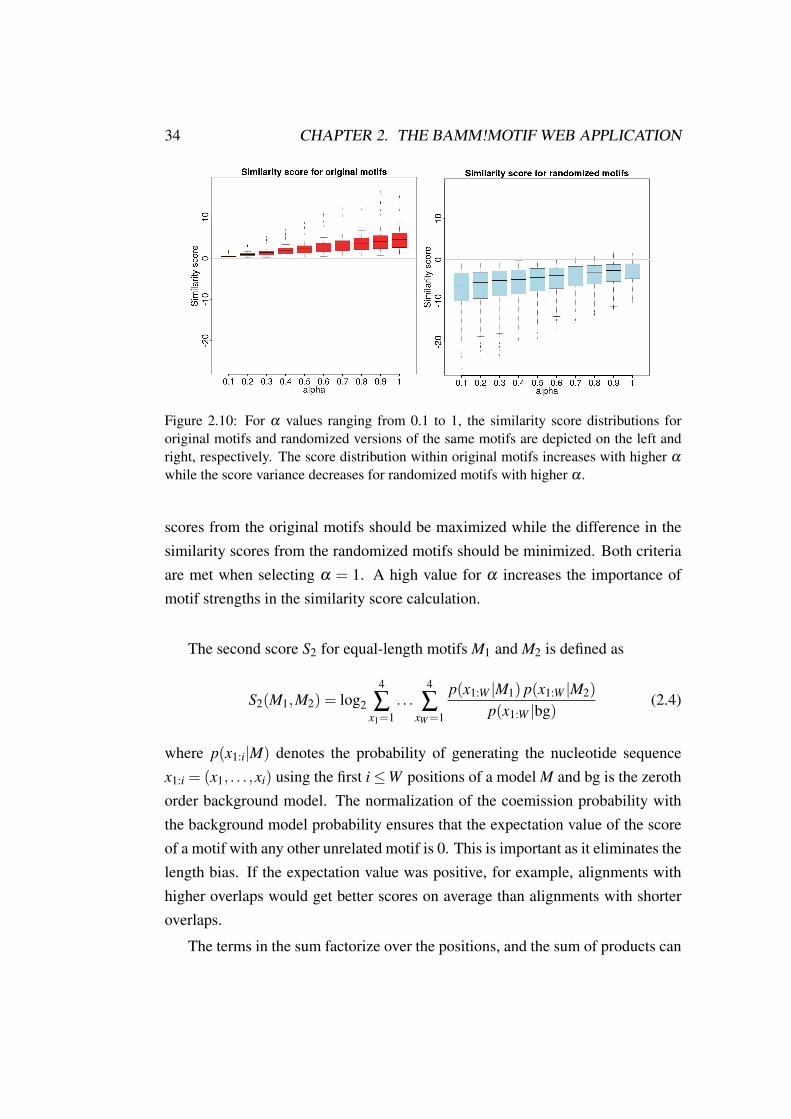
The score S1 depends on the weight of the motif strength to the overall sim-ilarity score, α ( see in Equation 2.1). The higher the α , the higher the impactof the query motif strength. With a too low α , the score tends to report similar-ity based on weak information columns, leading to matches of flanking regions.Figure 2.10 shows the similarity score distributions for a motif-motif comparisonof self-matches (red) and control cases (blue). 446 ENCODE ChIP-seq datasetsfrom 96 distinct TFs were used as search space, and similarity scores of compar-isons for each motif to itself (= self-match; left) and ten randomized versions tothe original motif (= control cases; right) are shown.
For α values in the range 0.1− 1 the variance in similarity scores increasesfor original motifs while decreasing for randomized motif scores. The originalmotifs represent 96 distinct TFs which have no connection to each other. Therandomized motifs all represent nonsense motifs. Thus, the variance of similarity
34 CHAPTER 2. THE BAMM!MOTIF WEB APPLICATION
Figure 2.10: For α values ranging from 0.1 to 1, the similarity score distributions fororiginal motifs and randomized versions of the same motifs are depicted on the left andright, respectively. The score distribution within original motifs increases with higher α
while the score variance decreases for randomized motifs with higher α .
scores from the original motifs should be maximized while the difference in thesimilarity scores from the randomized motifs should be minimized. Both criteriaare met when selecting α = 1. A high value for α increases the importance ofmotif strengths in the similarity score calculation.
The second score S2 for equal-length motifs M1 and M2 is defined as
S2(M1,M2) = log2
4
∑x1=1
. . .4
∑xW=1
p(x1:W |M1) p(x1:W |M2)
p(x1:W |bg)(2.4)
where p(x1:i|M) denotes the probability of generating the nucleotide sequencex1:i = (x1, . . . ,xi) using the first i≤W positions of a model M and bg is the zerothorder background model. The normalization of the coemission probability withthe background model probability ensures that the expectation value of the scoreof a motif with any other unrelated motif is 0. This is important as it eliminates thelength bias. If the expectation value was positive, for example, alignments withhigher overlaps would get better scores on average than alignments with shorteroverlaps.
The terms in the sum factorize over the positions, and the sum of products can
2.5. MOTIF-MOTIF COMPARISON 35
be written as a product of sums:
S2(M1,M2) = log2
4
∑x1=1
. . .4
∑xW=1
W
∏i=1
p(xi|M1) p(xi|M2)
p(xi|bg)
= log2
W
∏i=1
4
∑a=1
p(xi = a|M1) p(xi = a|M2)
p(xi = a|bg)
=W
∑i=1
log2
(4
∑a=1
p(xi = a|M1) p(xi = a|M2)
p(xi = a|bg)
)(2.5)
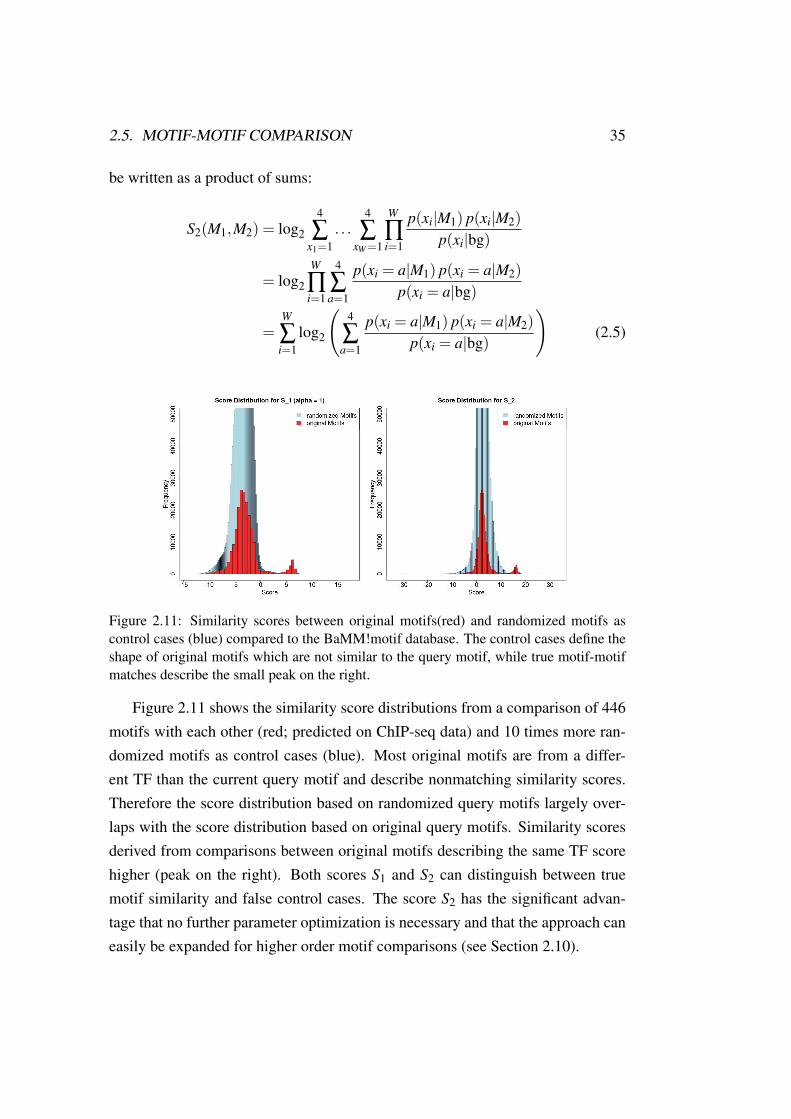
Figure 2.11: Similarity scores between original motifs(red) and randomized motifs ascontrol cases (blue) compared to the BaMM!motif database. The control cases define theshape of original motifs which are not similar to the query motif, while true motif-motifmatches describe the small peak on the right.
Figure 2.11 shows the similarity score distributions from a comparison of 446motifs with each other (red; predicted on ChIP-seq data) and 10 times more ran-domized motifs as control cases (blue). Most original motifs are from a differ-ent TF than the current query motif and describe nonmatching similarity scores.Therefore the score distribution based on randomized query motifs largely over-laps with the score distribution based on original query motifs. Similarity scoresderived from comparisons between original motifs describing the same TF scorehigher (peak on the right). Both scores S1 and S2 can distinguish between truemotif similarity and false control cases. The score S2 has the significant advan-tage that no further parameter optimization is necessary and that the approach caneasily be expanded for higher order motif comparisons (see Section 2.10).
36 CHAPTER 2. THE BAMM!MOTIF WEB APPLICATION
2.5.4 Evaluating scores via E-value
P-values and E-values are computed for the scores S1 and S2 to evaluate the simi-larity strength between a query motif and the database match. Background scoresare generated by performing M = 50 searches with query motifs in which the orig-inal positions have been permuted randomly, as described in Section 2.9. Scoresfrom the original query motif and its permutations are denoted as {S+1 , . . . ,S
+N+}
and {S−1 , . . . ,S−N−}, respectively. The list of N++N− positive- and negative-set
scores are sorted jointly in descending order. The cumulated number of scoresfrom the negative set up to rank l in this list is denoted by FPl . For computingthe P-value of entry l with score Sl in that list, Slower
l = max{S−n : S−n ≤ Sl} andShigher
l = min{S−n : S−n ≥ Sl} are defined as the nearest lower or equally rankedand nearest higher or equally ranked negative scores, respectively. The P-value isinterpolated between these two scores with FPl and FPl +1 false positive counts:
P-value(Sl) =1
N−
(FPl +
Shigherl −Sl
Shigherl −Slower
l + ε
). (2.6)
The ε is very small (10−5) and serves to avoid the fraction being 0 when Sl =
Shigherl = Slower
l .
The estimate becomes inaccurate when only a few or no negatives are higherthan Sl , i.e., for low P-values. In that regime, it is better to rely on a paramet-ric fit of the exponentially falling part of the cumulative distribution. The limitis set, beyond which will be used the exponential extrapolation, at l = ntop =
min{50,0.1×N−}. This ensures that the extrapolation is applied at most to thetop 10% of points, and, if more data are available, only to the top 50. For l ≥ ntop,a maximum-likelihood estimate based on the top ntop data points is used (seeEquation 2.7).
P-value(Sl) =ntop
N−exp(−(Sl−S−ntop
)/λ ) (2.7)
with
λ :=1
ntop
ntop
∑l=1
(Sl−S−ntop
)(2.8)
For Sntop this equation yields P-value(Sntop) =ntopN− , which is the empirical P-
value. The E-values are obtained from the P-value as described in Equation 2.9.
2.5. MOTIF-MOTIF COMPARISON 37
E-value = N+×P-value. (2.9)
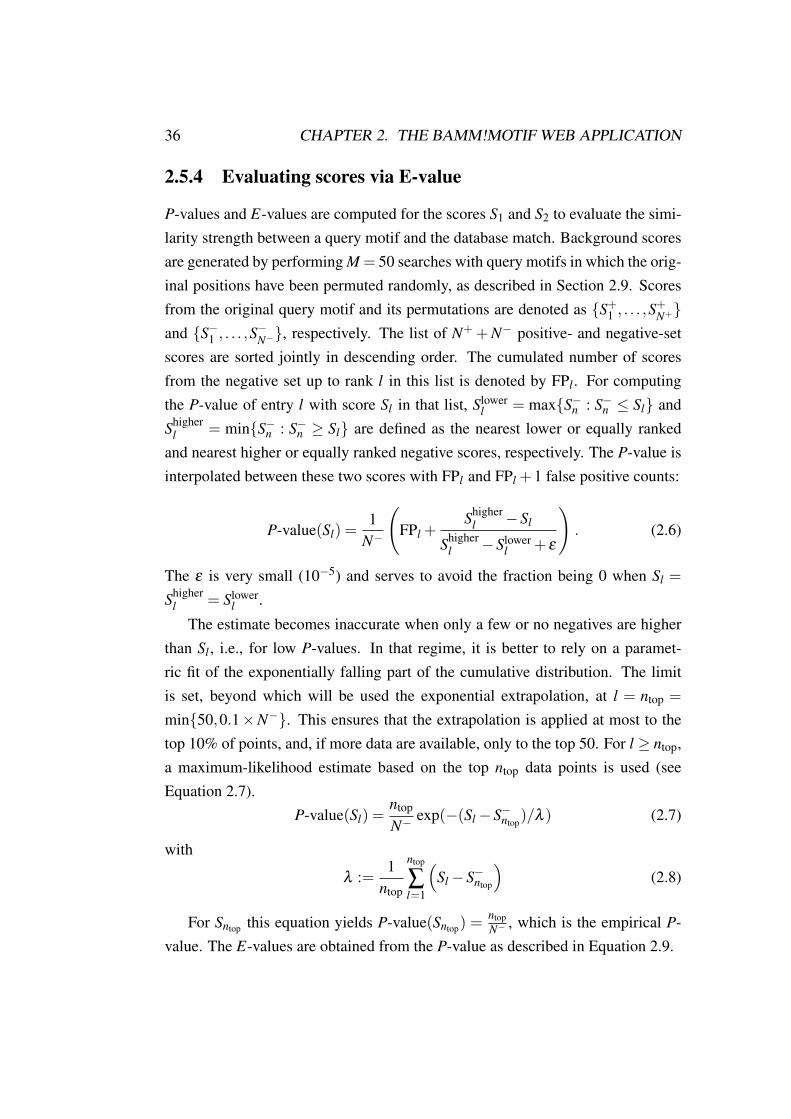
Figure 2.12 shows the performance for the exponential fit of the ntop datapoints for both scores S1 and S2 for two example query motifs Fosl and Gata3.The average distance between the exponential extrapolation and the cumulativedistribution for all 446 query motifs is shown as distance distribution histogram.
Figure 2.12: ntop data points are fitted by an exponential fit (blue: p-value) to the samplednegative distrstibution (red: cumulated sum of false positives). Examples for the TFs Fosland Gata3 for the similarity scores S1 and S2 are shown. The histograms visualize theoverall mean log2 deviation between the cumulated sum of false positives to the com-puted p-values. Extrapolation ensures that P-values stay accurate even if the number ofnegatives that score higher than Sl are sparse.
2.5.5 Validation of the BaMM-match method
For validating the motif-motif comparison, I computed similarity scores for 446ENCODE ChIP-seq datasets. Ranked by their P-value, the number of true posi-
38 CHAPTER 2. THE BAMM!MOTIF WEB APPLICATION
tives (TPs) found before the first false positive (FP) defines the performance. Fora given query motif, I defined all datasets with the same Ensembl target ID as TPs.FPs are scores that come from randomized motifs as explained in Section 2.5.2.Since the amount of TPs varies for TFs, the counts are scaled.
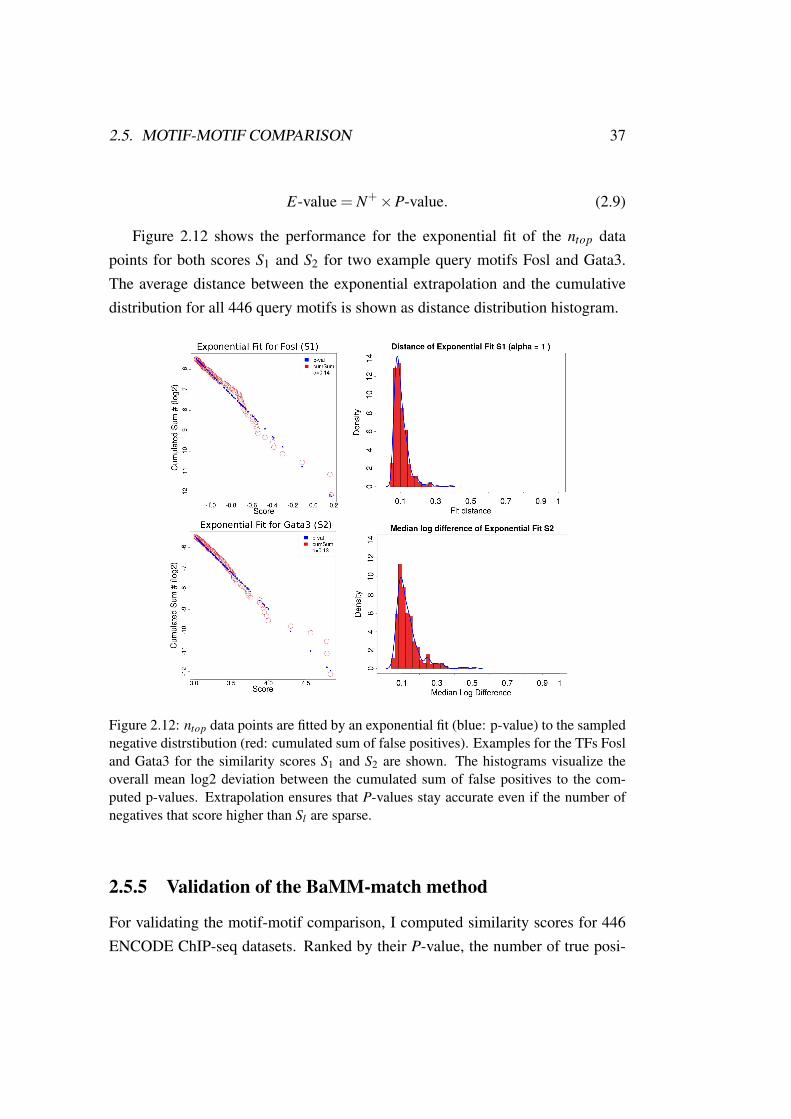
Figure 2.13: The amount of motif-motif comparisons between datasets from the sametranscription factor (TP) that rank higher than the best comparison to randomized motifs(first FP) is shown as the fraction of the total dataset of size N = 446. S2 performs betterthan TOMTOMs P-values based on euclidian distance and equally good as TOMTOMbased on kullback or sandelin distance measures.S1 with α = 1 outperforms TOMTOMfor any available distance measure.
S1 reaches a higher AUC than S2 ( see Figure 2.13, left). In general, a higherα value in the S1 score leads to better performance, which is conform with theanalysis of the score distributions earlier.
Comparing the similarity scores with the most common motif-motif compari-son tool TOMTOM [50] shows that the S2 score performs better than TOMTOMsP-values based on euclidian distance and equally good as TOMTOM based onkullback or sandelin distance measures ( see Figure 2.13, right). S1 score out-performs TOMTOM for any available distance measure. Thus, S2 and S1 offer avaluable addition to the BaMM!motif web application by providing meaningfulmotif-motif comparison information. S2 can be extended to use the full infor-mation of higher order motifs. I expect that this extension of the S2 score willincrease its performance.
2.6. MOTIF ENRICHMENT IN DNA SEQUENCES 39
2.6 Motif enrichment in DNA sequences
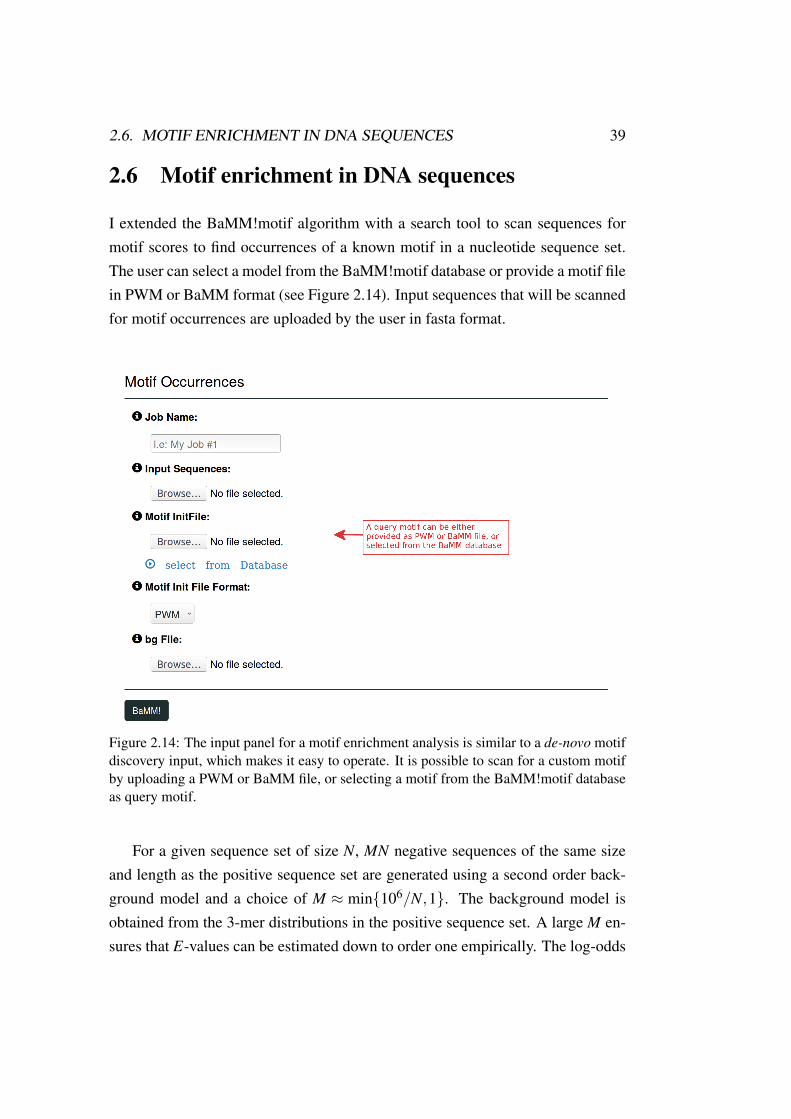
I extended the BaMM!motif algorithm with a search tool to scan sequences formotif scores to find occurrences of a known motif in a nucleotide sequence set.The user can select a model from the BaMM!motif database or provide a motif filein PWM or BaMM format (see Figure 2.14). Input sequences that will be scannedfor motif occurrences are uploaded by the user in fasta format.
Figure 2.14: The input panel for a motif enrichment analysis is similar to a de-novo motifdiscovery input, which makes it easy to operate. It is possible to scan for a custom motifby uploading a PWM or BaMM file, or selecting a motif from the BaMM!motif databaseas query motif.
For a given sequence set of size N, MN negative sequences of the same sizeand length as the positive sequence set are generated using a second order back-ground model and a choice of M ≈ min{106/N,1}. The background model isobtained from the 3-mer distributions in the positive sequence set. A large M en-sures that E-values can be estimated down to order one empirically. The log-odds
40 CHAPTER 2. THE BAMM!MOTIF WEB APPLICATION
score of a motif pmoti f of order K for the sequence x1 . . .xL can be calculated by:
S =L
∑i=1
log2pi(xi|xi−K . . .xi−1)
pbg(xi−B . . .xi−1)(2.10)
Here, B is the order of the backrgound model pbg. N+ = ∑Nn=1(Ln−W +1) scores
are computed from the positive set and N− = M ∑Nn=1(Ln−W + 1) scores from
the negative set. Here, W denotes the motif length and Ln the length of sequencen. Scores from the positive and negative sets are denoted as {S+1 , . . . ,S
+N+} and
{S−1 , . . . ,S−N−}, respectively and ranked together in descending order. P-values and
E-values are computed in the same way as described for motif-motif comparisons(see 2.5.4).
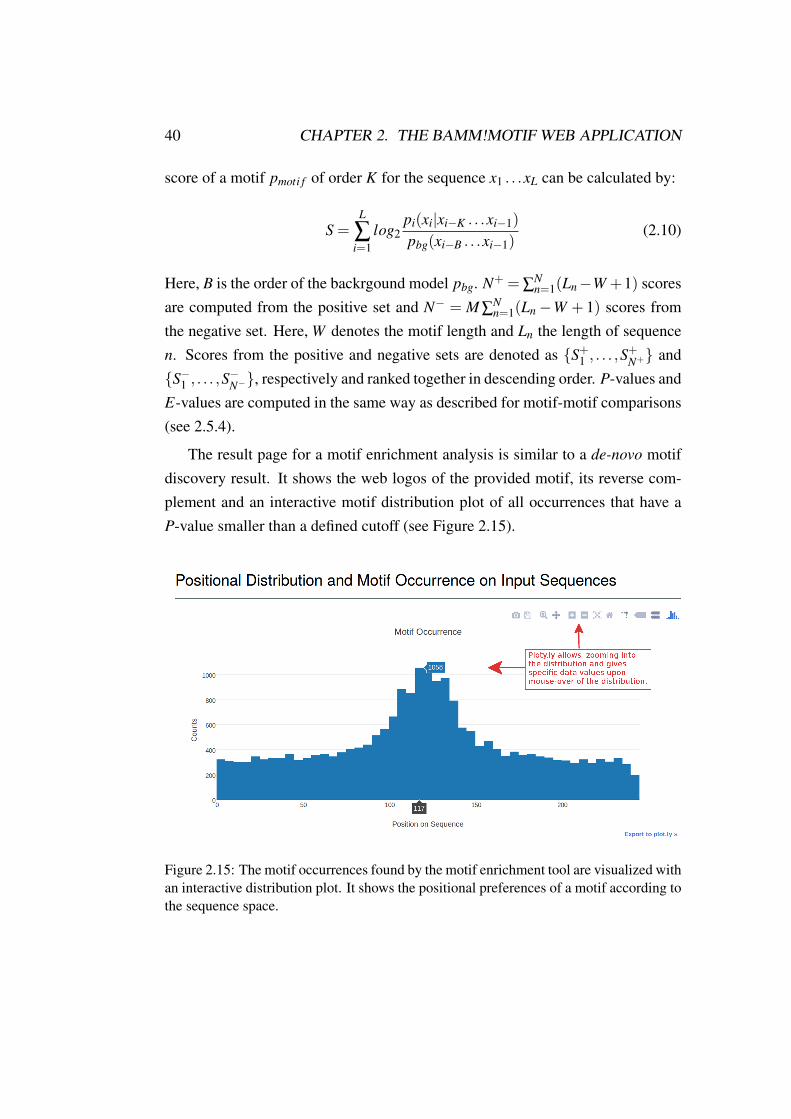
The result page for a motif enrichment analysis is similar to a de-novo motifdiscovery result. It shows the web logos of the provided motif, its reverse com-plement and an interactive motif distribution plot of all occurrences that have aP-value smaller than a defined cutoff (see Figure 2.15).
Figure 2.15: The motif occurrences found by the motif enrichment tool are visualized withan interactive distribution plot. It shows the positional preferences of a motif according tothe sequence space.
2.7. HIGHER ORDER MOTIF DATABASE 41
2.7 Higher order motif database
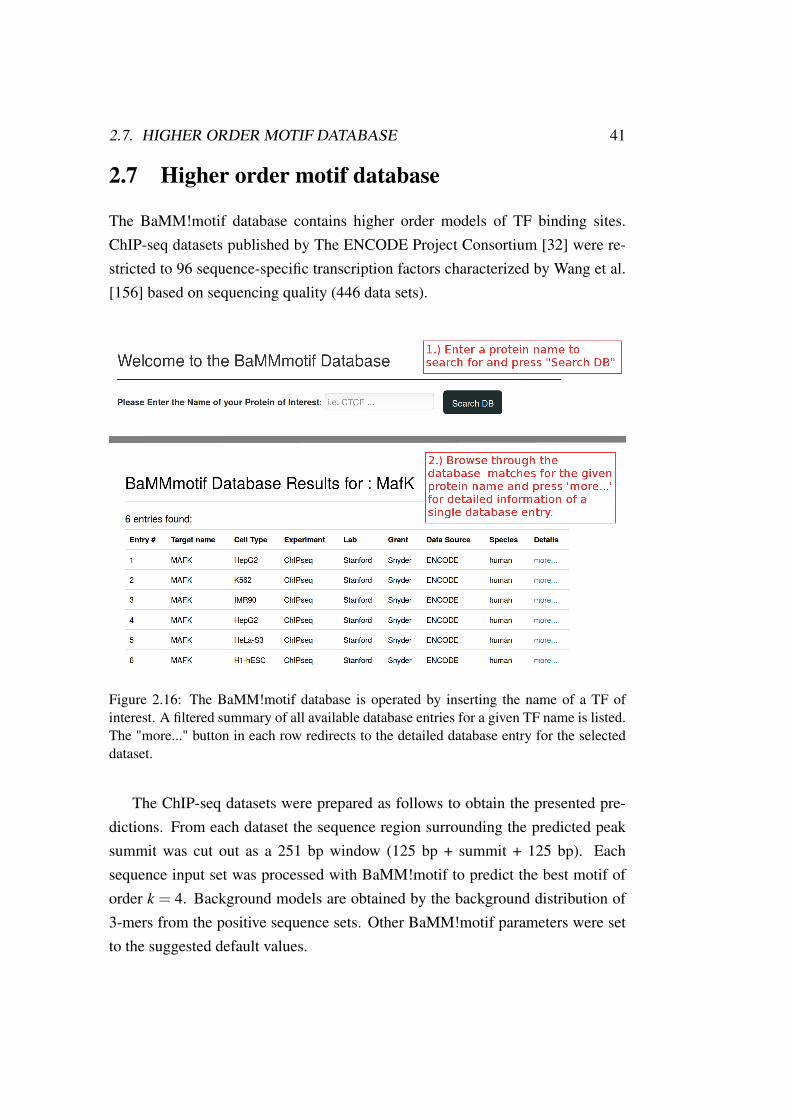
The BaMM!motif database contains higher order models of TF binding sites.ChIP-seq datasets published by The ENCODE Project Consortium [32] were re-stricted to 96 sequence-specific transcription factors characterized by Wang et al.[156] based on sequencing quality (446 data sets).
Figure 2.16: The BaMM!motif database is operated by inserting the name of a TF ofinterest. A filtered summary of all available database entries for a given TF name is listed.The "more..." button in each row redirects to the detailed database entry for the selecteddataset.
The ChIP-seq datasets were prepared as follows to obtain the presented pre-dictions. From each dataset the sequence region surrounding the predicted peaksummit was cut out as a 251 bp window (125 bp + summit + 125 bp). Eachsequence input set was processed with BaMM!motif to predict the best motif oforder k = 4. Background models are obtained by the background distribution of3-mers from the positive sequence sets. Other BaMM!motif parameters were setto the suggested default values.
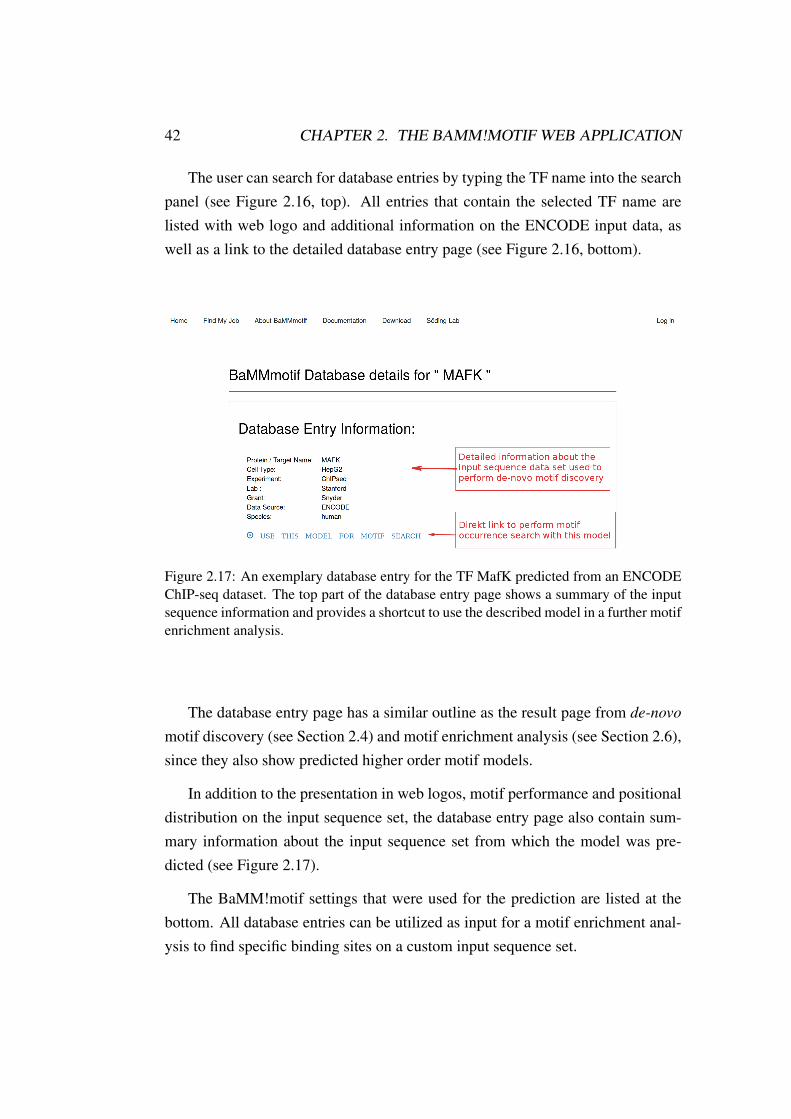
42 CHAPTER 2. THE BAMM!MOTIF WEB APPLICATION
The user can search for database entries by typing the TF name into the searchpanel (see Figure 2.16, top). All entries that contain the selected TF name arelisted with web logo and additional information on the ENCODE input data, aswell as a link to the detailed database entry page (see Figure 2.16, bottom).
Figure 2.17: An exemplary database entry for the TF MafK predicted from an ENCODEChIP-seq dataset. The top part of the database entry page shows a summary of the inputsequence information and provides a shortcut to use the described model in a further motifenrichment analysis.
The database entry page has a similar outline as the result page from de-novo
motif discovery (see Section 2.4) and motif enrichment analysis (see Section 2.6),since they also show predicted higher order motif models.
In addition to the presentation in web logos, motif performance and positionaldistribution on the input sequence set, the database entry page also contain sum-mary information about the input sequence set from which the model was pre-dicted (see Figure 2.17).
The BaMM!motif settings that were used for the prediction are listed at thebottom. All database entries can be utilized as input for a motif enrichment anal-ysis to find specific binding sites on a custom input sequence set.
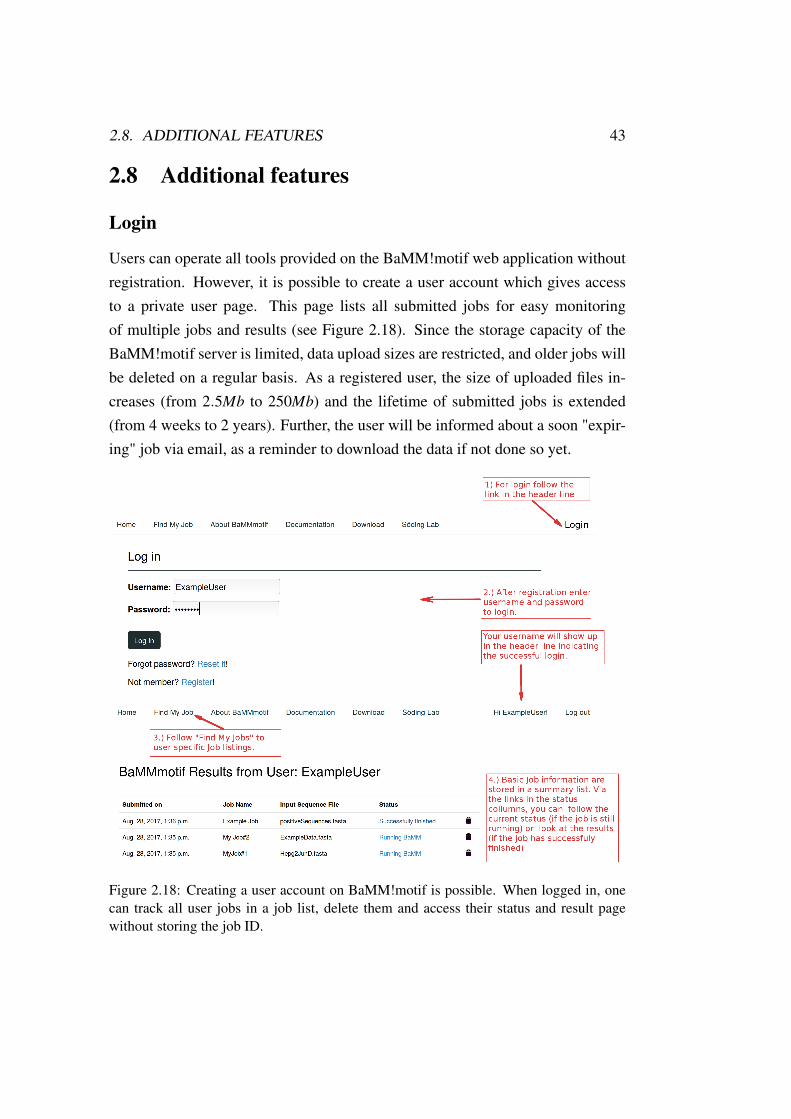
2.8. ADDITIONAL FEATURES 43
2.8 Additional features
Login
Users can operate all tools provided on the BaMM!motif web application withoutregistration. However, it is possible to create a user account which gives accessto a private user page. This page lists all submitted jobs for easy monitoringof multiple jobs and results (see Figure 2.18). Since the storage capacity of theBaMM!motif server is limited, data upload sizes are restricted, and older jobs willbe deleted on a regular basis. As a registered user, the size of uploaded files in-creases (from 2.5Mb to 250Mb) and the lifetime of submitted jobs is extended(from 4 weeks to 2 years). Further, the user will be informed about a soon "expir-ing" job via email, as a reminder to download the data if not done so yet.
Figure 2.18: Creating a user account on BaMM!motif is possible. When logged in, onecan track all user jobs in a job list, delete them and access their status and result pagewithout storing the job ID.
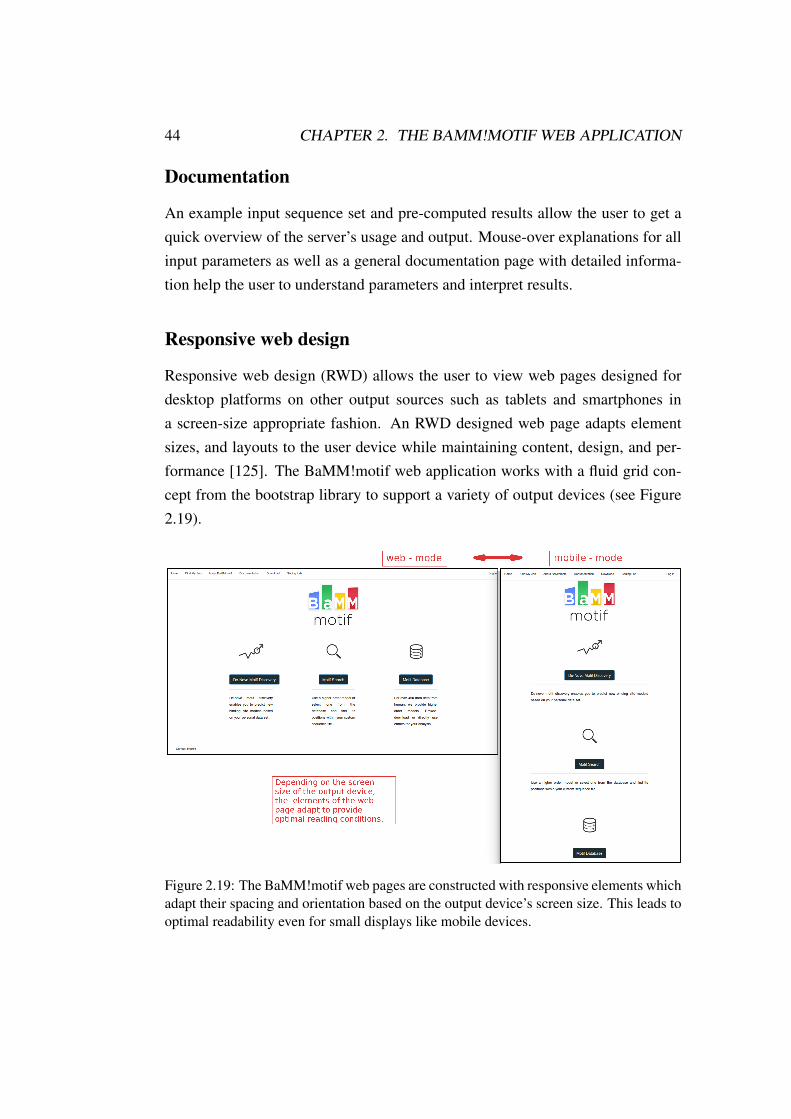
44 CHAPTER 2. THE BAMM!MOTIF WEB APPLICATION
Documentation
An example input sequence set and pre-computed results allow the user to get aquick overview of the server’s usage and output. Mouse-over explanations for allinput parameters as well as a general documentation page with detailed informa-tion help the user to understand parameters and interpret results.
Responsive web design
Responsive web design (RWD) allows the user to view web pages designed fordesktop platforms on other output sources such as tablets and smartphones ina screen-size appropriate fashion. An RWD designed web page adapts elementsizes, and layouts to the user device while maintaining content, design, and per-formance [125]. The BaMM!motif web application works with a fluid grid con-cept from the bootstrap library to support a variety of output devices (see Figure2.19).
Figure 2.19: The BaMM!motif web pages are constructed with responsive elements whichadapt their spacing and orientation based on the output device’s screen size. This leads tooptimal readability even for small displays like mobile devices.
2.9. CONCLUSION 45
2.9 Conclusion
The BaMM!motif web application combines sophisticated higher-order modelingof TF binding sites with valuable downstream analyses such as motif enrichmentsand motif-motif comparisons. The BaMM!motif database contains predicted mo-tif models which have been shown to outperform PWMs in informational contentand precision [132]. The server has a clean interface with well-structured inputand result pages. It is unique in offering higher order de-novo motif discovery andanalysis tools while providing a database of higher order motif models.
2.10 Outlook
The BaMM!motif web application will be extended in several ways. BaMM!motifis currently specialized for using fasta formatted sequences as obtained from ChIP-seq experiments. However, HT-SELEX and PBM data add another level of infor-mation by providing intensities for each single sequence. The BaMM!motif teamaims to extend the algorithm for processing such data and including the givensequence weights. Further, the EM algorithm has an order specific weight forthe interpolated pseudo counts, which is currently set to a fixed value. Experi-ence has shown that this factor is not optimal for all datasets, penalizing higherorder contributions too strongly in some cases. Thus, a new approach using col-lapsed Gibbs sampling for optimizing the pseudo count weights for each datasetindividually is currently investigated and developed. The motif-motif compari-son currently scores motif similarity between zeroth order models. The S2 scorecan be extended to use higher order information for scoring motif-motif similar-ity. We expect this extended score to perform better than scores based on ze-roth order information only. The motif-motif comparison tool is only availableas an add-on to BaMM!motif’s de-novo motif discovery at the moment. The toolwill be extracted and made available as a standalone tool on the web page. TheBaMM!motif database will be expanded to other publicly available data to providea broad range to higher order motif models.

46 CHAPTER 2. THE BAMM!MOTIF WEB APPLICATION
Chapter 3
Influence of linker Histones onhistone modifications
3.1 Introduction
The packaging of DNA into chromatin establishes an essential control mecha-nism of gene expression in eukaryotes. Nucleosome core particles are the basicbuilding blocks of chromatin, with 147 base pairs (bps) of double-stranded DNAwrapped around an octameric protein complex made up of two copies of the fourcore histones H2A, H2B, H3, and H4. Linker DNA of variable length connects in-dividual nucleosome core particles and accommodates binding of linker histones.Nucleosome core particles with additional linker DNA establish the repeating unitof chromatin, termed nucleosomes [91].
Linker histone protein family H1 has the most variable histones in sequenceacross all species. H1 contains a central globular domain, a long C- and a short N-terminal tail [118]. Nuclease digestion and DNA footprinting experiments showedthat the H1 core globular domain localizes close to the nucleosome dyad, whereits binding protects approximately 15-30 bps of DNA [10].
All histones are post-translationally modified (PTM), dynamically and re-versibly. Histone modifications act as transcriptional activators or repressors,influence chromosome packaging, DNA damage, and repair. The N-terminalside chains of histones can be acetylated, methylated, phosphorylated or ubiq-
47
48 CHAPTER 3. HISTONE MODIFICATIONS AND LINKER HISTONES
uitinated. Acetylation is done by the enzymatic addition of an acetyl group (COCH_3), methylation by transferring one to three methyl groups to arginine orlysine residues.
Different PTMs have been found to mark chromatin states as transcriptionallyactive (i.e. H3K4me1, H3K4me3, H3K9ac, H3K27ac, H3K36me3) or repressive(i.e. H3K9me3, H3K27me3). This constitutes a major regulatory layer of chro-matin function. Indeed, different histone PTMs correlate with transcriptionallyactive or repressive chromatin states [12].
The selective incorporation of linker histones represents another mechanism toalter chromatin states on a structural and functional level. In comparison to PTMs,the binding of linker histones to nucleosomes mostly correlates with repressivechromatin states and is thought to impede transcription activity [24, 54, 80].
From a structural point of view, core histones are divided into unstructuredtail regions that flank folded core domains. Since the tails stick out from thenucleosomes and are accessible to modifying enzymes [90], most PTMs reside inthese regions. Out of the four core histones, the N terminus of H3 features themost extended tail sequence ( 35 residues) with more than 30 known modificationevents [12, 29, 151]. Both H3 tails originate from nucleosomes at structurallyequivalent positions close to the entry and exit sites of DNA [90].
Compared to the minimal 147 bps nucleosome core particle, efficient linkerhistone binding requires additional 2 × 20 bp of DNA [162]. This places linkerhistones and H3 tail residues in the same spatial context. Experimental evidencesuggests that a functional relationship between linker histone binding, nucleoso-mal H3 tail architecture [72], and H3 tail PTMs [58] exists.
The sequences of linker histones are more diverse than those of core histones,but they all feature a central, conserved globular domain that is essential for nu-cleosome binding [54]. In humans, 11 genes encode linker histones, with H1.1to H1.5 being the most abundant subtypes in somatic tissues [54]. Linker histonevariants may be positioned differently in nucleosomal contexts, with their glob-ular domains being either at the nucleosomal dyad axis and in contact with bothstretches of linker DNA or in asymmetric configurations with contacts to only oneof the linker DNA elements [103, 145, 167, 168].
Irrespective of core domain binding, linker histones contain extended N- and
3.2. MATERIAL AND METHODS 49
C-terminal segments of variable lengths that are rich in basic amino acids andstructurally disordered [54]. In particular, the C-terminal linker histone domain(CTD) contributes to high-affinity chromatin binding in-vivo [57] and inducesaltered linker DNA conformations in-vitro [15, 43, 52, 103, 145].
Given the spatial proximity of histone H3 tails and linker histones within nu-cleosomes, I set out to obtain insights into the PTM behavior of H3 tail residuesin different nucleosomal contexts.
I show that linker histone incorporation greatly lowers the overall modificationefficiencies of individual H3 sites within nucleosomes on a genome-wide level.These results establish that the presence of linker histones constitutes a basal con-trol layer of H3 modifiability and thereby the functional states of chromatin.
3.2 Material and methods
For investigating the genome-wide influence of linker histone H1 on histone H3PTMs, I processed 15 individual ChIP-seq experiments from four laboratoriescontaining eight different H3 modifications, two H1 linker histone variants, andone H4 control modification.
After preprocessing and data normalization, I applied a batch-effect correctionto eliminate lab-related correlations. A correlation analysis of the log2 IP signalover input ratios was performed on the data sets.
General H3 tail modifications should be reduced in chromosomal regions withhigh linker histone content, based on previous H3 and H1 dynamics analysis[143]. To address this question, I made use of ChIP-seq data from mouse embry-onic stem cells, for which linker histone occupancy and histone PTM occurrencehave been measured [25, 34, 74, 104].
To minimize fluctuations in the different data sets caused by experimental vari-ations, and to compare individual data quality, I selected GEO database entriesthat contained at least two annotated histone PTMs analyzed in the same studyand laboratory.
I partitioned the mouse genome into 500 bp-sized bins and determined theenrichment of linker histones and PTMs in each bin.
50 CHAPTER 3. HISTONE MODIFICATIONS AND LINKER HISTONES
3.2.1 Data sets
Cao et al. [25] established a knock-in system and showed that the N-terminallytagged H1 proteins H1d and H1c in mouse embryonic stem cells (m-ESCs) arefunctionally interchangeable to their endogenous counterparts in-vivo. They pro-vide a high-resolution mapping of these two H1 variants along with H3 PTMsH3K4me3, H3K9me3, and H3K27me3 (Gene Expression Omnibus (GEO) Ac-cession ID GSE46134).
Over four billion bases of sequence from chromatin immunoprecipitated DNAwere used to generate genome-wide chromatin-state maps of m-ESCs for H3K4me3,H3K9me3, H3K27me3, H3K36me3, and H4K20me3 by Mikkelsen et al. [104].The study (GSE12241) provides not only duplicates of Cao’s H3 modificationsbut adds one additional H3 methylations and a control H4 methylation to compareeffects to different nucleosome core histones.
Acetylation of Histone H3 data is provided by Karmodiya et al. [74], addingtwo transcriptional repressive marks H3K9ac and H3K14ac to the analysis (GSE31284).
Creygthon et al. [34] provide the monomethylation of H3 lysine (H3K4me1),a not modified H3 measurement and H3K4me3 as well as H3K27ac (GSE24164).They investigated enhancer activity upon genome-wide binding targets of enhancer-associated H3 modifications.
3.2.2 Data preprocessing
Previously mentioned datasets were downloaded from the Sequence Read Archive(SRA) at NCBI in raw SRA file formats and converted into the fastq format usingthe sra-toolkit [109].
Fastq is a text-based format that contains not only a nucleotide sequence butalso its corresponding quality scores. Fastq format is the standard for storinghigh-throughput sequencing outputs [30].
Depending on the fastqc quality report in each fastq file, adapter trimming,quality filtering (minimal sequencing quality of 20) and removal of leading baseswith abnormal nucleotide distribution was performed using the fastx-toolkit (htt p ://hannonlab.cshl.edu/ f astxtoolkit/index.html). Sequences shorter than 20 baseswere removed.
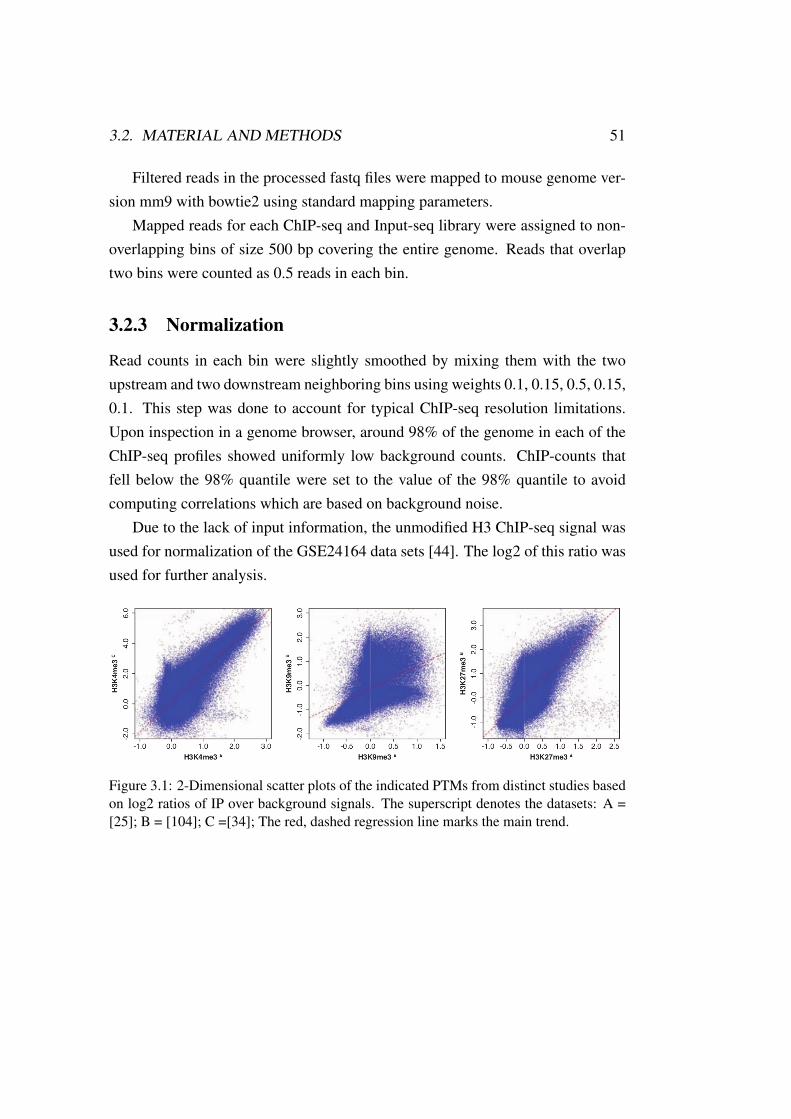
3.2. MATERIAL AND METHODS 51
Filtered reads in the processed fastq files were mapped to mouse genome ver-sion mm9 with bowtie2 using standard mapping parameters.
Mapped reads for each ChIP-seq and Input-seq library were assigned to non-overlapping bins of size 500 bp covering the entire genome. Reads that overlaptwo bins were counted as 0.5 reads in each bin.
3.2.3 Normalization
Read counts in each bin were slightly smoothed by mixing them with the twoupstream and two downstream neighboring bins using weights 0.1, 0.15, 0.5, 0.15,0.1. This step was done to account for typical ChIP-seq resolution limitations.Upon inspection in a genome browser, around 98% of the genome in each of theChIP-seq profiles showed uniformly low background counts. ChIP-counts thatfell below the 98% quantile were set to the value of the 98% quantile to avoidcomputing correlations which are based on background noise.
Due to the lack of input information, the unmodified H3 ChIP-seq signal wasused for normalization of the GSE24164 data sets [44]. The log2 of this ratio wasused for further analysis.
Figure 3.1: 2-Dimensional scatter plots of the indicated PTMs from distinct studies basedon log2 ratios of IP over background signals. The superscript denotes the datasets: A =[25]; B = [104]; C =[34]; The red, dashed regression line marks the main trend.
52 CHAPTER 3. HISTONE MODIFICATIONS AND LINKER HISTONES
3.2.4 Batch-effect correction
For data sets containing more than four different ChIP-seq datasets, lab relatedbatch effects were corrected. Batch effects are technical artifacts that are not as-sociated with the underlying signal. They correspond to unrelated factors, such aslaboratory conditions, reagent lots and laboratory personnel differences. [126].
The mean of all ChIP-seq analysis from one lab was subtracted from eachanalyzed histone PTM [82]. This method increases the correlation between mea-surements of the same histone modification from different laboratories while de-creasing the correlation between measurements coming from the same lab (seeFigure 3.1).
3.2.5 Genome-wide correlation analysis
To analyze in how far H1 linker histone occupancy influences genome-wide hi-stone H3 modifications, the log2 IP over input ratio was calculated and used todefine a Pearson correlation coefficient between binned profiles of all histonemodifications and linker histones. The Pearson correlation coefficient explainsa linear correlation between two variables x and y in the range [−1,1].
A negative Pearson correlation coefficient corresponds to anti-correlation whilea positive value close to 1 illustrates strong correlation. A Pearson correlation co-efficient of 0 defines no correlation between variables x and y.
The Pearson correlation coefficient is calculated by dividing the covariance oftwo variables by the product of their standard deviations.
r =∑
ni=1(xi− x)(yi− y)√
∑ni=1(xi− x)2
√∑
ni=1(yi− y)2
(3.1)
Here n is the number of binned log2 IP over input ratio values, xi defines thei-th value for a specific H3 histone modification and yi the i-th value for a H1histone. x and y are the sample means for each dataset.
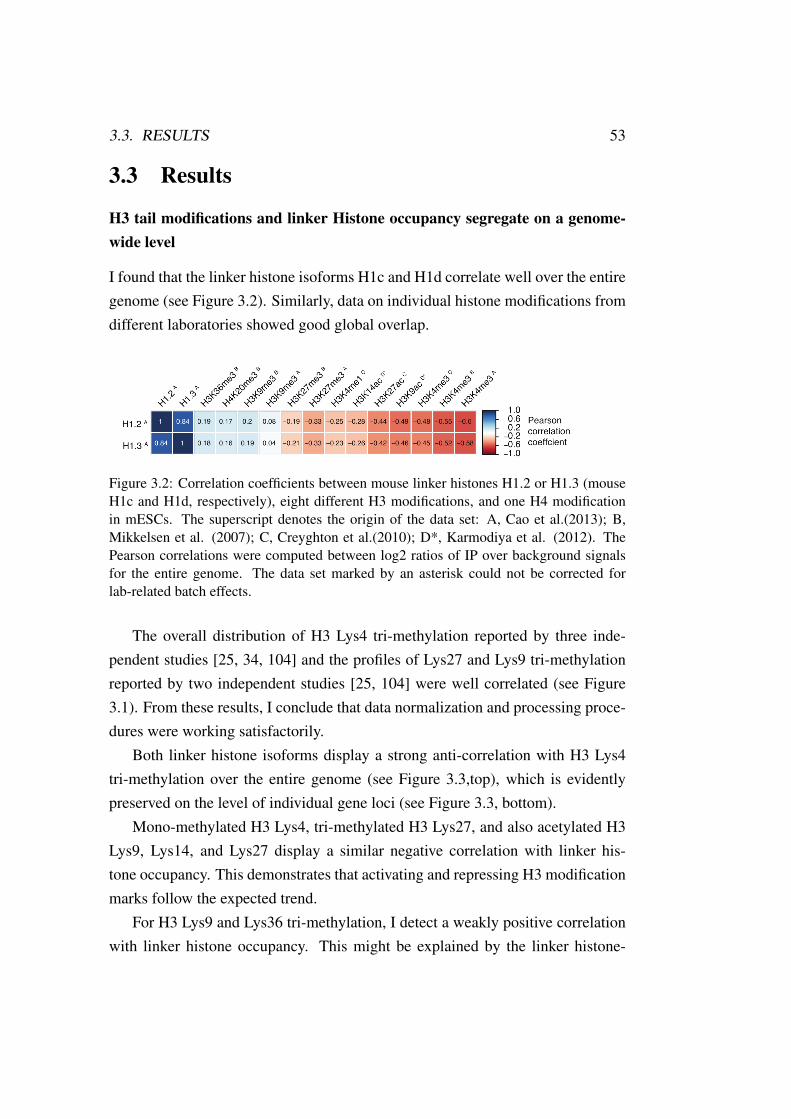
3.3. RESULTS 53
3.3 Results
H3 tail modifications and linker Histone occupancy segregate on a genome-wide level
I found that the linker histone isoforms H1c and H1d correlate well over the entiregenome (see Figure 3.2). Similarly, data on individual histone modifications fromdifferent laboratories showed good global overlap.
Figure 3.2: Correlation coefficients between mouse linker histones H1.2 or H1.3 (mouseH1c and H1d, respectively), eight different H3 modifications, and one H4 modificationin mESCs. The superscript denotes the origin of the data set: A, Cao et al.(2013); B,Mikkelsen et al. (2007); C, Creyghton et al.(2010); D*, Karmodiya et al. (2012). ThePearson correlations were computed between log2 ratios of IP over background signalsfor the entire genome. The data set marked by an asterisk could not be corrected forlab-related batch effects.
The overall distribution of H3 Lys4 tri-methylation reported by three inde-pendent studies [25, 34, 104] and the profiles of Lys27 and Lys9 tri-methylationreported by two independent studies [25, 104] were well correlated (see Figure3.1). From these results, I conclude that data normalization and processing proce-dures were working satisfactorily.
Both linker histone isoforms display a strong anti-correlation with H3 Lys4tri-methylation over the entire genome (see Figure 3.3,top), which is evidentlypreserved on the level of individual gene loci (see Figure 3.3, bottom).
Mono-methylated H3 Lys4, tri-methylated H3 Lys27, and also acetylated H3Lys9, Lys14, and Lys27 display a similar negative correlation with linker his-tone occupancy. This demonstrates that activating and repressing H3 modificationmarks follow the expected trend.
For H3 Lys9 and Lys36 tri-methylation, I detect a weakly positive correlationwith linker histone occupancy. This might be explained by the linker histone-
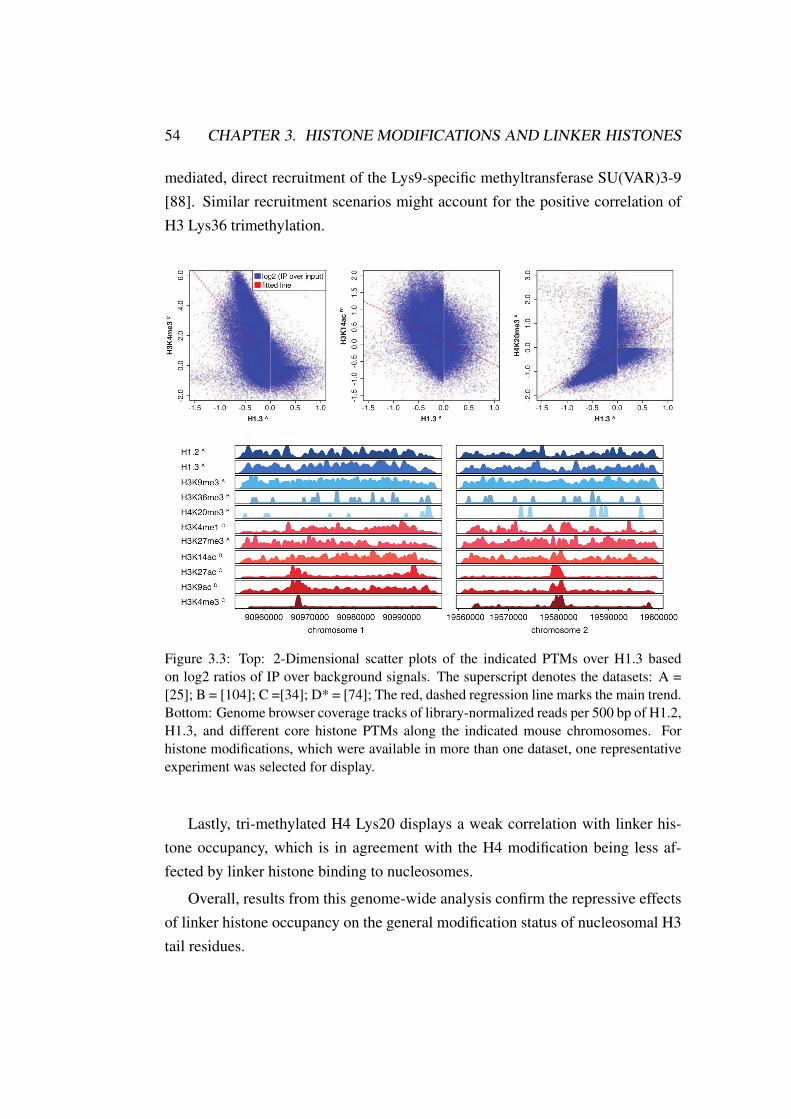
54 CHAPTER 3. HISTONE MODIFICATIONS AND LINKER HISTONES
mediated, direct recruitment of the Lys9-specific methyltransferase SU(VAR)3-9[88]. Similar recruitment scenarios might account for the positive correlation ofH3 Lys36 trimethylation.
Figure 3.3: Top: 2-Dimensional scatter plots of the indicated PTMs over H1.3 basedon log2 ratios of IP over background signals. The superscript denotes the datasets: A =[25]; B = [104]; C =[34]; D* = [74]; The red, dashed regression line marks the main trend.Bottom: Genome browser coverage tracks of library-normalized reads per 500 bp of H1.2,H1.3, and different core histone PTMs along the indicated mouse chromosomes. Forhistone modifications, which were available in more than one dataset, one representativeexperiment was selected for display.
Lastly, tri-methylated H4 Lys20 displays a weak correlation with linker his-tone occupancy, which is in agreement with the H4 modification being less af-fected by linker histone binding to nucleosomes.
Overall, results from this genome-wide analysis confirm the repressive effectsof linker histone occupancy on the general modification status of nucleosomal H3tail residues.
3.4. CONCLUSION 55
3.4 Conclusion
This project needed a major data processing pipeline to provide a robust data setfor a rather simple correlation analysis. The challenge was not in calculating agenome-wide correlation between H1 linker histone occupancy and H3 PTMs incomparison to H4 PTMs, but more in processing the data correctly. Without qual-ity control from the raw data, normalization for library size and experimental res-olution, and batch effect correction to eliminate lab related correlations, a properresult about the connection between linker histones and core histone modificationswould have been imprecise. Due to many replicative data, the corrections and fil-tering steps could be validated. The Pearson correlation analysis then showed thegenome-wide correlation and anti-correlation of eight different histone H3 and H4modifications and linker histone H1 occupancy.
Further details and findings can be found in our MolCell publication Modu-
lations of DNA Contacts by Linker Histones and Post-translational Modifications
Determine the Mobility and Modifiability of Nucleosomal H3 Tails [143].

56 CHAPTER 3. HISTONE MODIFICATIONS AND LINKER HISTONES
Chapter 4
Promoter proximal termination
4.1 Introduction
The Nrd1-Nab3-Sen1 complex directs transcriptional termination of non-codingRNAs. Nrd1 and Nab3 bind to specific RNA sites within the first 1000 base pairsof nascent RNA and initiate promoter proximal termination. Studies have shownthat this pathway also terminates individual coding genes, such as Nrd1 itself[3, 4]. In these cases, the Nrd1 pathway induces transcription attenuation.
Here I investigate if Nrd1 induces transcription attenuation genome-wide oronly on a distinct group of protein-coding RNAs. I integrate ChIP-seq and RNA-seq data from a Nrd1 anchor-away and a control experiment into a genomic anal-ysis of the yeast species Saccharomyces Cerevisiae. Additional PAR-CLIP datais used to define Nrd1 and Nab3 binding sites on the nascent mRNAs. I foundthat transcriptional attenuation is rare and only applies to 32 genes. Further, theproject lead to the discovery of a new type of non-coding RNA, Nrd1-dependentun-terminated transcripts (NUTs), which occur upon Nrd1-depletion from the nu-cleus.
The yeast genome and non-coding RNAs
The yeast genome is annotated extensively, which enables to map experimentaldata to the corresponding genes [5, 144]. The yeast species used in this projectis the baker’s yeast Saccharomyces Cerevisiae. It was the first eukaryotic genome
57
58 CHAPTER 4. PROMOTER PROXIMAL TERMINATION
to be sequenced in 1996 [35]. Its genome is about 12 million base pairs long andcontains roughly 6000 genes. The genome is massively packed with transcribedgenes. It also contains non-coding RNAs, which do not encode for a protein. Newnon-coding RNAs were discovered in yeast. The relevant ones to this project aredescribed below.
Small nuclear and small nucleolar RNAs, or snRNAs and snoRNAs, are shortnon-coding transcripts [96]. They are known to be terminated by the Nrd1-Nab3-Sen1 pathway and are non-polyadenylated transcripts. Unlike that of other non-coding RNAs, the function of snRNA/snoRNAs is known. snoRNAs are neces-sary for RNA silencing and telomerase maintenance [96]. In higher eukaryotes,snoRNAs regulate alternative splicing.
Cryptic unstable transcripts (CUTs) were discovered in Saccharomyces Cere-
visiae in 2005 [163]. CUTs are non-coding transcripts that are unstable andrapidly degraded by the nuclear exosome [165]. In contrast to the degradationof coding transcripts, the CUT degradation is mediated by the Nrd1-Nab3-Sen1-dependent pathway. CUTs derive from unannotated regions widely distributed inthe genome [110]. They are often found on the antisense strand of a coding geneemerging from its promoter region. Thus, CUTs may represent by-products ofdivergent transcription [3]. It has been shown that non-termination of CUTs canreduce gene expression attenuation, transcriptional interference, and alternativestart site selection [165].
Xu et al. discovered another type of non-coding RNA, stable unannotatedor uncharacterized transcripts (SUTs) [165]. SUTs are longer and more stablethan CUTs. SUTs are primarily degraded by cytoplasmic 5’-3’ degradation andnonsense-mediated decay (NMD). SUTs may be processed similar to mRNAs[134].
Xrn1-sensitive unstable transcripts (XUTs) were introduced by van Dijk EL etal. in 2011 [152]. These short non-coding transcripts are polyadenylated. XUTsoccur mainly antisense to open reading frames and are destabilized by the Xrn15’-3’ RNA exonuclease. Genes with antisense XUTs are silenced when XUTtermination is inhibited.
4.1. INTRODUCTION 59
Termination of Polymerase II transcription
In yeast, two different pathways can terminate Polymerase II (Pol II) transcription[62, 105]. Termination of mRNA transcription requires cleavage and polyadeny-lation factors. These factors bind via the polyadenylation signal of the nascentmRNA and introduce termination with the exosome pathway [94]. Terminationof ncRNA transcription depends on the Nrd1-Nab3-Sen1 pathway [137].
Nrd1 and its role in transcription termination
Nrd1 is an essential protein that interacts with Pol II by binding to the serine-5phosphorylated form of the Pol II C-terminal domain (CTD). Nrd1 binds to thenascent RNA near the 5’-end and promotes premature transcription termination[26]. Nrd1 binds RNA in a sequence-specific manner via the RNA recognitionmotif UGUA [33, 137, 153] and interacts with Nab3 and Sen1 [138]. CUTs [4,146] and SUTs are terminated by the Nrd1 pathway [95].
Nrd1-dependent termination restricts antisense transcription from bidirectionalpromoters by terminating divergent transcription and initiating their rapid degra-dation by the exosome [23, 65, 130, 159]. This hypothesis confirmed in-vivo
cross-linking of Nrd1 and Nab3 to CUTs [161].
Nrd1 binds to many mRNAs [33, 161], and is recruited to mRNA according tochromatin immunoprecipitation experiments [101]. Nrd1-dependent terminationto attenuate mRNA transcription has been observed for Nrd1, Hrp1, and Imd2[3, 139], Ura2, Ura8, and Ade12 [77, 146], and Fks2 [76].
Nrd1 is responsible for recruiting termination factors to the promoter proximalregion of some coding-genes and most noncoding regions. So far only the effectof Nrd1 on single genes has been examined. Recently, it was shown that Nrd1is recruited to the 5’-region of all protein-coding mRNAs. This raises the ques-tion whether Nrd1 has a more general function than terminating short non-codingRNAs. Therefore, this project investigated transcriptional changes upon deple-tion of Nrd1 from the nucleus. By combining ChIP-seq, RNA-seq and PAR-CLIPdata, the general function of Nrd1 was investigated.
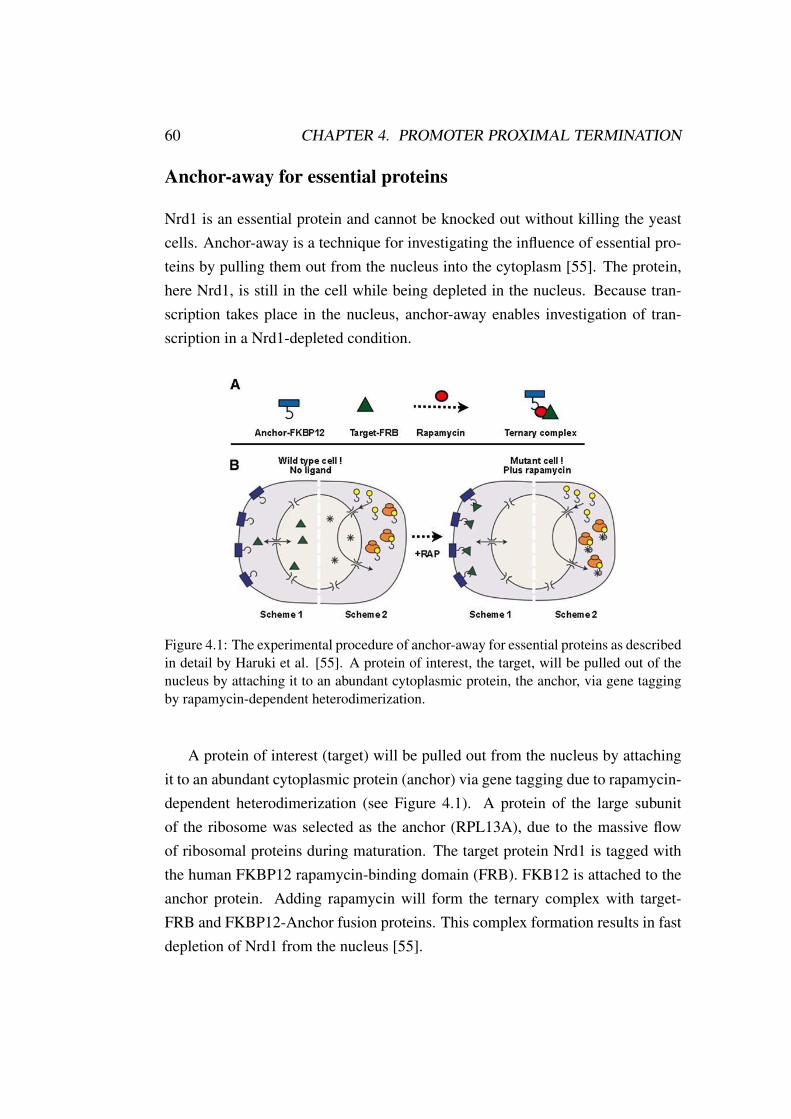
60 CHAPTER 4. PROMOTER PROXIMAL TERMINATION
Anchor-away for essential proteins
Nrd1 is an essential protein and cannot be knocked out without killing the yeastcells. Anchor-away is a technique for investigating the influence of essential pro-teins by pulling them out from the nucleus into the cytoplasm [55]. The protein,here Nrd1, is still in the cell while being depleted in the nucleus. Because tran-scription takes place in the nucleus, anchor-away enables investigation of tran-scription in a Nrd1-depleted condition.
Figure 4.1: The experimental procedure of anchor-away for essential proteins as describedin detail by Haruki et al. [55]. A protein of interest, the target, will be pulled out of thenucleus by attaching it to an abundant cytoplasmic protein, the anchor, via gene taggingby rapamycin-dependent heterodimerization.
A protein of interest (target) will be pulled out from the nucleus by attachingit to an abundant cytoplasmic protein (anchor) via gene tagging due to rapamycin-dependent heterodimerization (see Figure 4.1). A protein of the large subunitof the ribosome was selected as the anchor (RPL13A), due to the massive flowof ribosomal proteins during maturation. The target protein Nrd1 is tagged withthe human FKBP12 rapamycin-binding domain (FRB). FKB12 is attached to theanchor protein. Adding rapamycin will form the ternary complex with target-FRB and FKBP12-Anchor fusion proteins. This complex formation results in fastdepletion of Nrd1 from the nucleus [55].
4.2. MATERIAL AND METHODS 61
4.2 Material and methods
4.2.1 Data sets
The transcriptome is the complete set of transcripts in a cell, and their quantity,for a specific developmental stage or physiological condition. RNA-seq is used toquantify expression levels of transcripts, including non-coding and small RNAs[157]. Comparison between wild-type expression and expression after Nrd1-anchor-away reflects the influence of the Nrd1 complex on expression levels.
To find out where Nrd1 and Nab3 bind specifically in the RNA transcripts,Photoactivatable-Ribonucleoside-Enhanced Crosslinking and Immunoprecipita-tion (PAR-CLIP) [51, 117, 160] experiments were performed. The presence ofa binding site also verifies active transcription, since a protein cannot bind to anon-existing RNA.
RNA Pol II profiles are obtained from ChIP-seq measurements. They indi-cate transcriptional activity. This is important because short transcripts are fastdegraded and may therefore not be visible in RNA-seq profiles. From these PolII profiles, the regions where early termination of transcription is inhibited due toNrd1-depletion are extracted. This is done by investigating differential profilesfrom the two conditions, untreated and Nrd1-depleted.
4.2.2 Normalization
To compare the two conditions, I sum up the read counts from the ChIP-seq in-ferred profiles for each position from both replicates of one condition. One pseudocount is added to prevent singularities.
I calculate a size factor [1] for each condition, based on the open readingframe transcript (ORF-T) regions as described by Xu et al. [165] and divide theread counts by it. This is important to correct for library size and sequencing depthvariations. I choose only to use ORF-T regions for the size factor calculation sincea significant variation in ncRNA expression is observed, which does not representoverall expression variability.
Because I am interested in the change of Pol II behavior between the twoconditions, I calculated differential profiles, as the log2 ratio (see red profile in
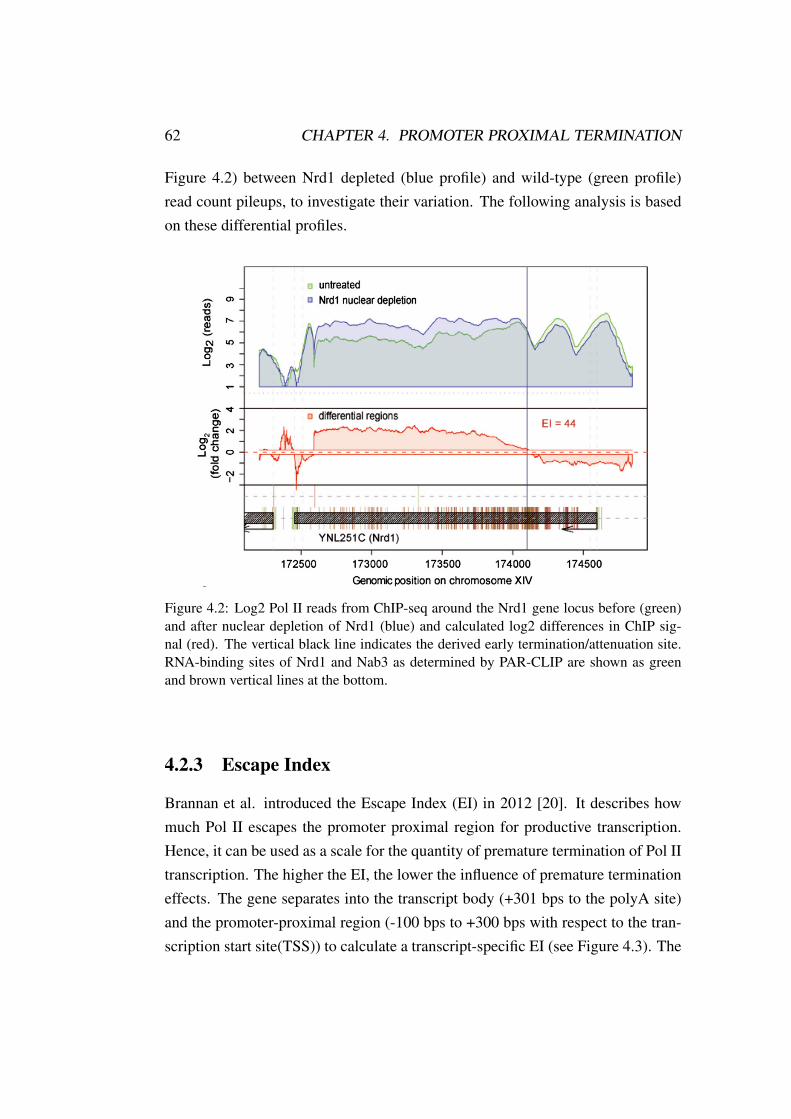
62 CHAPTER 4. PROMOTER PROXIMAL TERMINATION
Figure 4.2) between Nrd1 depleted (blue profile) and wild-type (green profile)read count pileups, to investigate their variation. The following analysis is basedon these differential profiles.
Figure 4.2: Log2 Pol II reads from ChIP-seq around the Nrd1 gene locus before (green)and after nuclear depletion of Nrd1 (blue) and calculated log2 differences in ChIP sig-nal (red). The vertical black line indicates the derived early termination/attenuation site.RNA-binding sites of Nrd1 and Nab3 as determined by PAR-CLIP are shown as greenand brown vertical lines at the bottom.
4.2.3 Escape Index
Brannan et al. introduced the Escape Index (EI) in 2012 [20]. It describes howmuch Pol II escapes the promoter proximal region for productive transcription.Hence, it can be used as a scale for the quantity of premature termination of Pol IItranscription. The higher the EI, the lower the influence of premature terminationeffects. The gene separates into the transcript body (+301 bps to the polyA site)and the promoter-proximal region (-100 bps to +300 bps with respect to the tran-scription start site(TSS)) to calculate a transcript-specific EI (see Figure 4.3). The
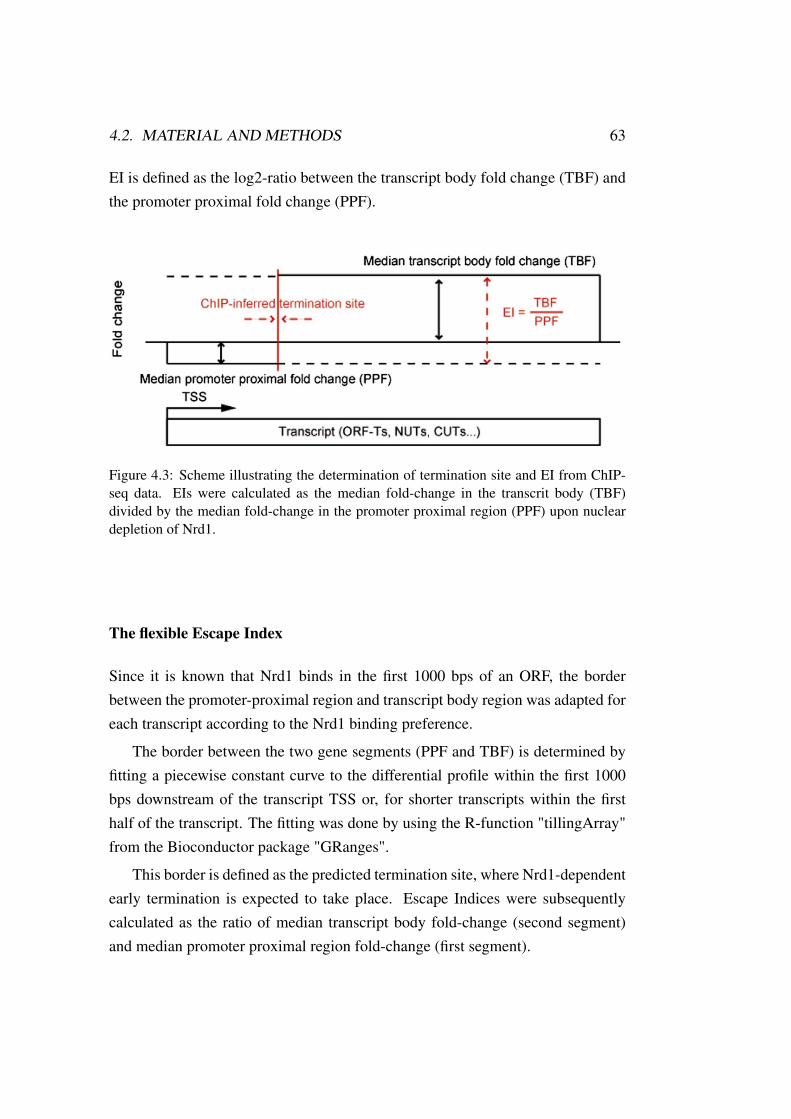
4.2. MATERIAL AND METHODS 63
EI is defined as the log2-ratio between the transcript body fold change (TBF) andthe promoter proximal fold change (PPF).
Figure 4.3: Scheme illustrating the determination of termination site and EI from ChIP-seq data. EIs were calculated as the median fold-change in the transcrit body (TBF)divided by the median fold-change in the promoter proximal region (PPF) upon nucleardepletion of Nrd1.
The flexible Escape Index
Since it is known that Nrd1 binds in the first 1000 bps of an ORF, the borderbetween the promoter-proximal region and transcript body region was adapted foreach transcript according to the Nrd1 binding preference.
The border between the two gene segments (PPF and TBF) is determined byfitting a piecewise constant curve to the differential profile within the first 1000bps downstream of the transcript TSS or, for shorter transcripts within the firsthalf of the transcript. The fitting was done by using the R-function "tillingArray"from the Bioconductor package "GRanges".
This border is defined as the predicted termination site, where Nrd1-dependentearly termination is expected to take place. Escape Indices were subsequentlycalculated as the ratio of median transcript body fold-change (second segment)and median promoter proximal region fold-change (first segment).
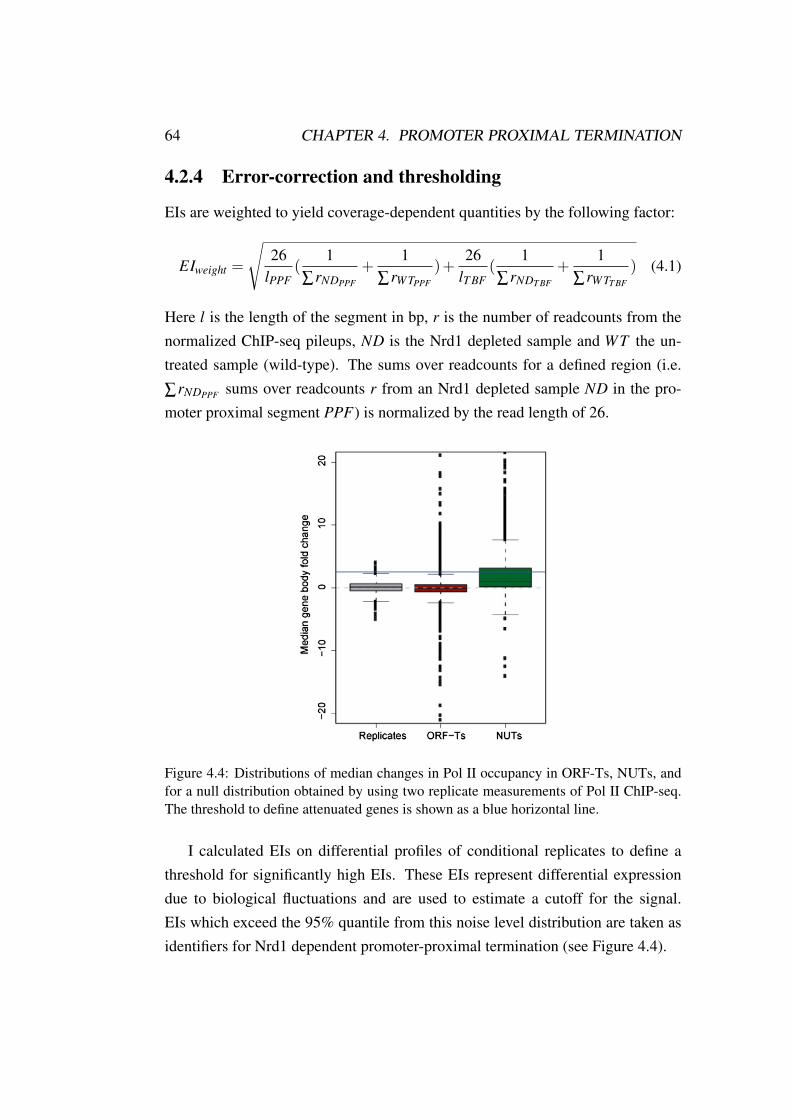
64 CHAPTER 4. PROMOTER PROXIMAL TERMINATION
4.2.4 Error-correction and thresholding
EIs are weighted to yield coverage-dependent quantities by the following factor:
EIweight =
√26
lPPF(
1∑rNDPPF
+1
∑rWTPPF
)+26
lT BF(
1∑rNDT BF
+1
∑rWTT BF
) (4.1)
Here l is the length of the segment in bp, r is the number of readcounts from thenormalized ChIP-seq pileups, ND is the Nrd1 depleted sample and WT the un-treated sample (wild-type). The sums over readcounts for a defined region (i.e.
∑rNDPPF sums over readcounts r from an Nrd1 depleted sample ND in the pro-moter proximal segment PPF) is normalized by the read length of 26.
Figure 4.4: Distributions of median changes in Pol II occupancy in ORF-Ts, NUTs, andfor a null distribution obtained by using two replicate measurements of Pol II ChIP-seq.The threshold to define attenuated genes is shown as a blue horizontal line.
I calculated EIs on differential profiles of conditional replicates to define athreshold for significantly high EIs. These EIs represent differential expressiondue to biological fluctuations and are used to estimate a cutoff for the signal.EIs which exceed the 95% quantile from this noise level distribution are taken asidentifiers for Nrd1 dependent promoter-proximal termination (see Figure 4.4).
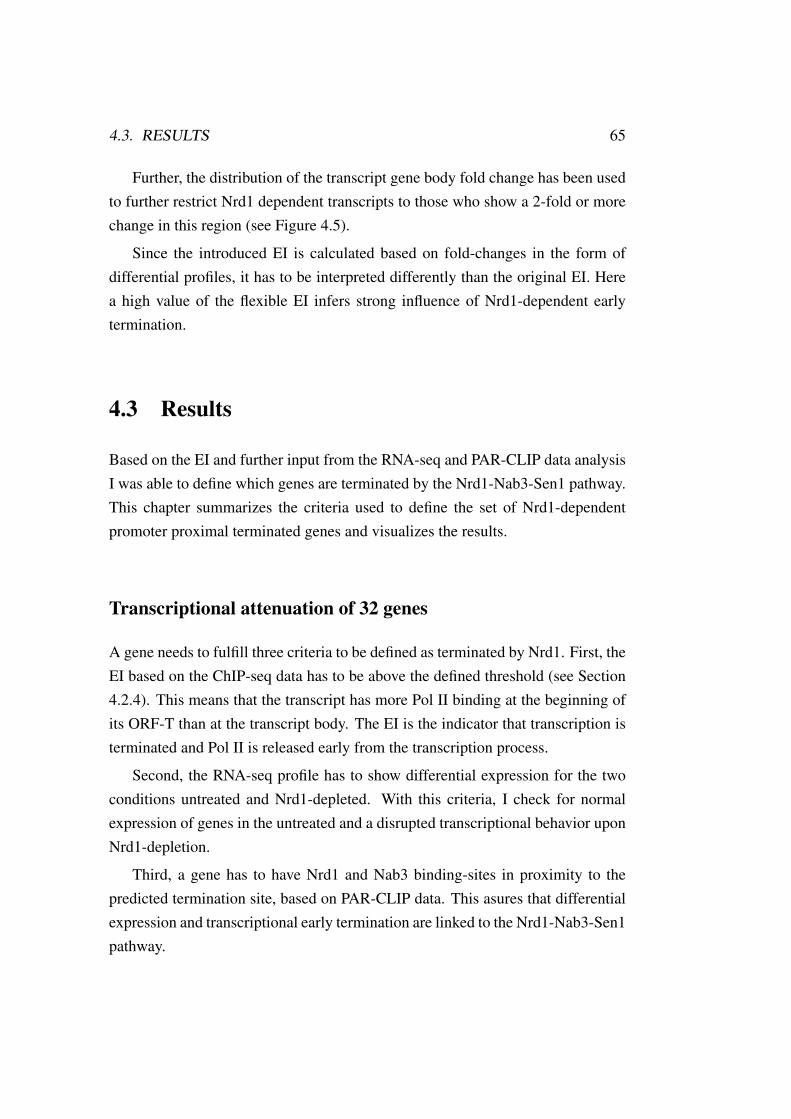
4.3. RESULTS 65
Further, the distribution of the transcript gene body fold change has been usedto further restrict Nrd1 dependent transcripts to those who show a 2-fold or morechange in this region (see Figure 4.5).
Since the introduced EI is calculated based on fold-changes in the form ofdifferential profiles, it has to be interpreted differently than the original EI. Herea high value of the flexible EI infers strong influence of Nrd1-dependent earlytermination.
4.3 Results
Based on the EI and further input from the RNA-seq and PAR-CLIP data analysisI was able to define which genes are terminated by the Nrd1-Nab3-Sen1 pathway.This chapter summarizes the criteria used to define the set of Nrd1-dependentpromoter proximal terminated genes and visualizes the results.
Transcriptional attenuation of 32 genes
A gene needs to fulfill three criteria to be defined as terminated by Nrd1. First, theEI based on the ChIP-seq data has to be above the defined threshold (see Section4.2.4). This means that the transcript has more Pol II binding at the beginning ofits ORF-T than at the transcript body. The EI is the indicator that transcription isterminated and Pol II is released early from the transcription process.
Second, the RNA-seq profile has to show differential expression for the twoconditions untreated and Nrd1-depleted. With this criteria, I check for normalexpression of genes in the untreated and a disrupted transcriptional behavior uponNrd1-depletion.
Third, a gene has to have Nrd1 and Nab3 binding-sites in proximity to thepredicted termination site, based on PAR-CLIP data. This asures that differentialexpression and transcriptional early termination are linked to the Nrd1-Nab3-Sen1pathway.
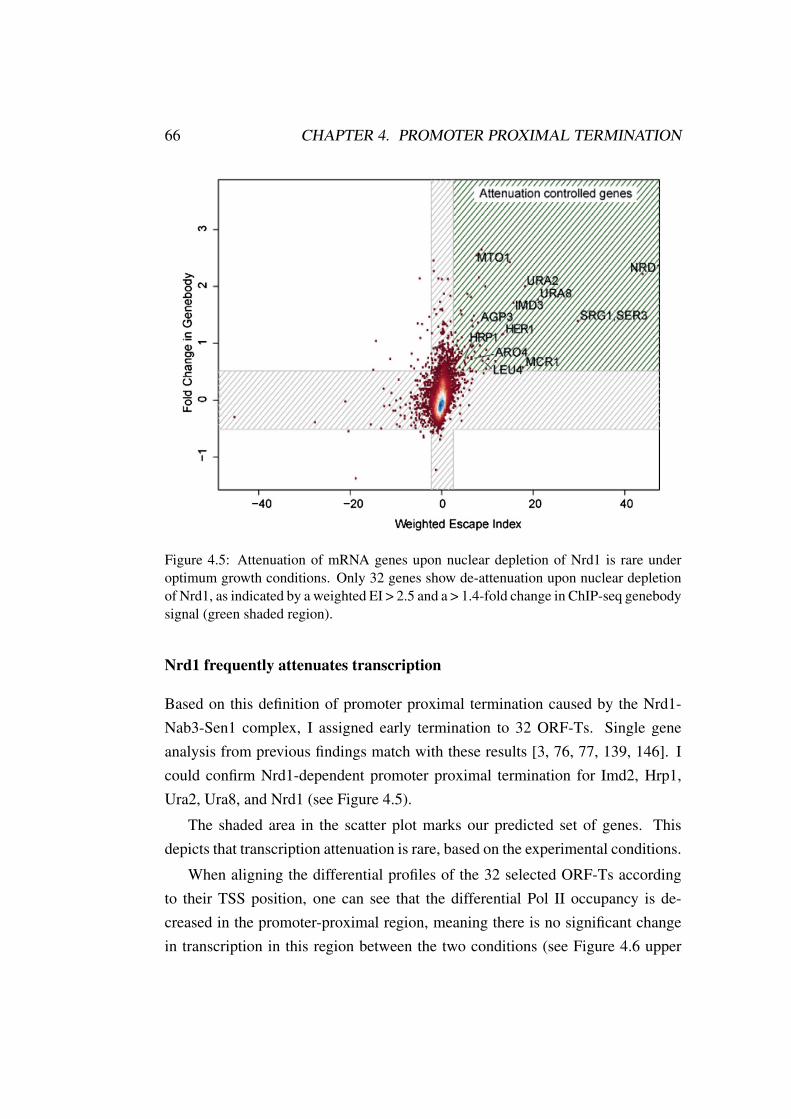
66 CHAPTER 4. PROMOTER PROXIMAL TERMINATION
Figure 4.5: Attenuation of mRNA genes upon nuclear depletion of Nrd1 is rare underoptimum growth conditions. Only 32 genes show de-attenuation upon nuclear depletionof Nrd1, as indicated by a weighted EI > 2.5 and a > 1.4-fold change in ChIP-seq genebodysignal (green shaded region).
Nrd1 frequently attenuates transcription
Based on this definition of promoter proximal termination caused by the Nrd1-Nab3-Sen1 complex, I assigned early termination to 32 ORF-Ts. Single geneanalysis from previous findings match with these results [3, 76, 77, 139, 146]. Icould confirm Nrd1-dependent promoter proximal termination for Imd2, Hrp1,Ura2, Ura8, and Nrd1 (see Figure 4.5).
The shaded area in the scatter plot marks our predicted set of genes. Thisdepicts that transcription attenuation is rare, based on the experimental conditions.
When aligning the differential profiles of the 32 selected ORF-Ts accordingto their TSS position, one can see that the differential Pol II occupancy is de-creased in the promoter-proximal region, meaning there is no significant changein transcription in this region between the two conditions (see Figure 4.6 upper
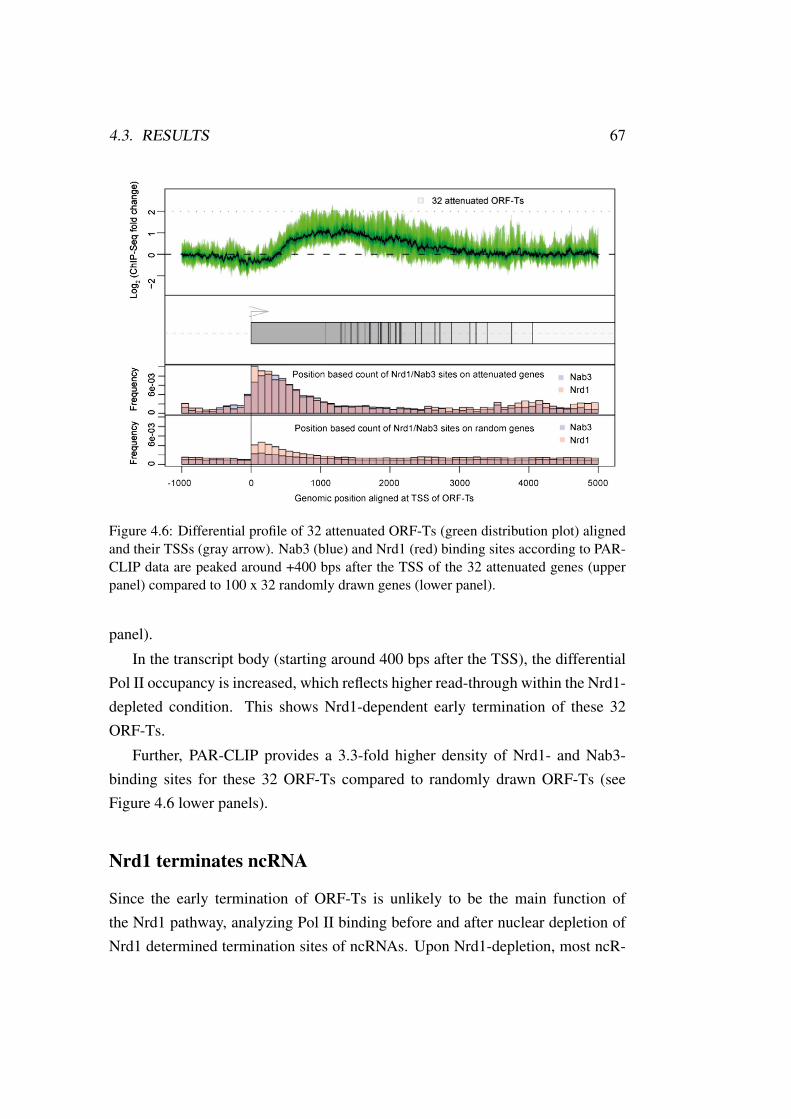
4.3. RESULTS 67
Figure 4.6: Differential profile of 32 attenuated ORF-Ts (green distribution plot) alignedand their TSSs (gray arrow). Nab3 (blue) and Nrd1 (red) binding sites according to PAR-CLIP data are peaked around +400 bps after the TSS of the 32 attenuated genes (upperpanel) compared to 100 x 32 randomly drawn genes (lower panel).
panel).
In the transcript body (starting around 400 bps after the TSS), the differentialPol II occupancy is increased, which reflects higher read-through within the Nrd1-depleted condition. This shows Nrd1-dependent early termination of these 32ORF-Ts.
Further, PAR-CLIP provides a 3.3-fold higher density of Nrd1- and Nab3-binding sites for these 32 ORF-Ts compared to randomly drawn ORF-Ts (seeFigure 4.6 lower panels).
Nrd1 terminates ncRNA
Since the early termination of ORF-Ts is unlikely to be the main function ofthe Nrd1 pathway, analyzing Pol II binding before and after nuclear depletion ofNrd1 determined termination sites of ncRNAs. Upon Nrd1-depletion, most ncR-
68 CHAPTER 4. PROMOTER PROXIMAL TERMINATION
NAs result in elongated transcripts, which run into downstream located ORF-T.These elongated transcripts are named Nrd1-dependent unterminated transcripts,or NUTs.
Therefore I investigated the distances between the predicted termination site ofsense upstream located ncRNAs and downstream ORF-T preinitiation complexes(PICs) (see Figure 4.7). The positions of the downstream ORF-T PICs is based onChIP-exo data of TFIIB [122], a subunit of the Pol II PIC. I could show that Nrd1terminates transcription of ncRNAs before they would interfere with the PIC of adownstream ORF-T.
This reveals that Nrd1 is responsible for terminating transcription of ncRNAsthat would otherwise disrupt transcription of ORF-Ts.
Figure 4.7: Schematic drawing of a sense NUT upstream of an ORF-T (upper panel).Predicted Termination Sites of NUTs are upstream of downstream ORF-T PICs (lowerpanel).
4.4. CONCLUSION 69
4.4 Conclusion
Previous findings document that the Nrd1-Nab3-Sen1 complex is responsible fortermination of snoRNAs, snRNAs, and some ORF-Ts. With this genome-widestudy, a set of 32 genes was identified which is early terminated by the Nrd1-Nab3-Sen1 complex.
Nrd1 terminates non-coding transcripts shortly after transcription initiation inproximity to the promoter to control unwanted transcription. This general role ofNrd1 is essential for proper transcription of genes because these non-coding RNAsand their transcription machinery would otherwise interrupt clean transcription ofdownstream ORF-T regions. Nrd1’s main task as a genome-wide necessary factoris the termination of unwanted transcripts.
The analysis of ChIP-seq, RNA-seq and PAR-CLIP experimental data identi-fied the general role of Nrd1. The diversity of the measured data gave an overallpicture of the processes and helped to validate the hypothesis about the Nrd1-Nab3-Sen1 complex independently. Since all three data sets represent a differentinformation level of the transcription process, the combined message of them isrobust and can be trusted.
Further details and findings, especially those based on the RNA-seq and PAR-CLIP data sets, can be found in our CELL publication Transcriptome surveillance
by selective termination of non-coding RNA synthesis [128].

70 CHAPTER 4. PROMOTER PROXIMAL TERMINATION
Bibliography
[1] Simon Anders and Wolfgang Huber. Differential expression analysis forsequence count data. Genome Biol, 11(10):R106, 2010.
[2] Charles Anderson. Docker [Software engineering]. IEEE Software,32(3):102–c3, 2015.
[3] John T Arigo, Kristina L Carroll, Jessica M Ames, and Jeffry L Corden.Regulation of Yeast< i> NRD1 Expression by Premature Transcription Ter-mination. Molecular cell, 21(5):641–651, 2006.
[4] John T. Arigo, Daniel E. Eyler, Kristina L. Carroll, and Jeffry L. Cor-den. Termination of cryptic unstable transcripts is directed by yeast RNA-binding proteins Nrd1 and Nab3. Molecular cell, 23(6):841–851, 2006.
[5] Christopher D Armour and Pek Yee Lum. From drug to protein: usingyeast genetics for high-throughput target discovery. Curr Opin Chem Biol,9(1):20–24, feb 2005.
[6] G Badis, M F Berger, A A Philippakis, S Talukder, A R Gehrke, S AJaeger, E T Chan, G Metzler, A Vedenko, X Chen, H Kuznetsov, C F Wang,D Coburn, D E Newburger, Q Morris, T R Hughes, and M L Bulyk. Diver-sity and complexity in DNA recognition by transcription factors. Science,324(5935):1720–1723, 2009.
[7] T. L Bailey and C. Elkan. Fitting a Mixture Model by Expectation Maxi-mization to Discover Motifs in Bipolymers. Proceedings of the Second In-
ternational Conference on Intelligent Systems for Molecular Biology, pages28–36, 1994.
71
72 BIBLIOGRAPHY
[8] Timothy L. Bailey. DREME: Motif discovery in transcription factor ChIP-seq data. Bioinformatics, 27(12):1653–1659, 2011.
[9] Timothy L. Bailey, Mikael Boden, Fabian A. Buske, Martin Frith,Charles E. Grant, Luca Clementi, Jingyuan Ren, Wilfred W. Li, andWilliam S. Noble. MEME Suite: Tools for motif discovery and search-ing. Nucleic Acids Research, 37(SUPPL. 2), 2009.
[10] V. V. Bakayev and G. P. Georgiev. Heterogeneity of Chromatin Subunits inVitro and Location of Histone HI. Nucleic Acids Research, 3(2):477–492,1976.
[11] Bastian Ballmann. Inside django security. Informatik-Spektrum,35(3):182–189, 2012.
[12] Andrew J Bannister and Tony Kouzarides. Regulation of chromatin byhistone modifications. Cell Research, 21(3):381–395, 2011.
[13] Artem Barski, Suresh Cuddapah, Kairong Cui, Tae Young Roh, Dustin E.Schones, Zhibin Wang, Gang Wei, Iouri Chepelev, and Keji Zhao. High-Resolution Profiling of Histone Methylations in the Human Genome. Cell,129(4):823–837, 2007.
[14] A. Battle, Z. Khan, S. H. Wang, A. Mitrano, M. J. Ford, J. K. Pritchard,and Y. Gilad. Impact of regulatory variation from RNA to protein. Science,347(6222):664–667, 2014.
[15] J. Bednar, R. A. Horowitz, S. A. Grigoryev, L. M. Carruthers, J. C. Hansen,A. J. Koster, and C. L. Woodcock. Nucleosomes, linker DNA, and linkerhistone form a unique structural motif that directs the higher-order foldingand compaction of chromatin. Proceedings of the National Academy of
Sciences, 95(24):14173–14178, 1998.
[16] Dan Benveniste, Hans-Joachim Sonntag, Guido Sanguinetti, and DuncanSproul. Transcription factor binding predicts histone modifications in hu-man cell lines. Proceedings of the National Academy of Sciences of the
United States of America, 111(37):13367–72, 2014.
BIBLIOGRAPHY 73
[17] Otto G. Berg and Peter H. von Hippel. Selection of DNA binding sites byregulatory proteins. Statistical-mechanical theory and application to opera-tors and promoters. Journal of Molecular Biology, 193(4):723–743, 1987.
[18] Michael F Berger, Anthony A Philippakis, Aaron M Qureshi, He SFangxue, Preston W Estep, and Martha L Bulyk. Compact, universal DNAmicroarrays to comprehensively determine transcription-factor binding sitespecificities. Nature biotechnology, 24(11):1429–1435, 2006.
[19] Mark D. Biggin. Animal Transcription Networks as Highly Connected,Quantitative Continua, 2011.
[20] Kris Brannan, Hyunmin Kim, Benjamin Erickson, Kira Glover-Cutter,Soojin Kim, Nova Fong, Lauren Kiemele, Kirk Hansen, Richard Davis,Jens Lykke-Andersen, and David L Bentley. mRNA decapping factorsand the exonuclease Xrn2 function in widespread premature terminationof RNA polymerase II transcription. Mol Cell, 46(3):311–324, 2012.
[21] Jason D Buenrostro, Paul G Giresi, Lisa C Zaba, Howard Y Chang, andWilliam J Greenleaf. Transposition of native chromatin for fast and sen-sitive epigenomic profiling of open chromatin, DNA-binding proteins andnucleosome position. Nature methods, 10(12):1213–8, 2013.
[22] Martha L Bulyk, Philip L F Johnson, and George M Church. Nucleotides oftranscription factor binding sites exert interdependent effects on the bind-ing affinities of transcription factors. Nucleic Acids Research, 30(5):1255–1261, 2002.
[23] Stephen Buratowski. Progression through the RNA polymerase II CTDcycle. Molecular cell, 36(4):541–546, 2009.
[24] Michael Bustin, Frédéric Catez, and Jae Hwan Lim. The dynamics of his-tone H1 function in chromatin, 2005.
[25] Kaixiang Cao, Nathalie Lailler, Yunzhe Zhang, Ashwath Kumar, KaranUppal, Zheng Liu, Eva K. Lee, Hongwei Wu, Magdalena Medrzycki,Chenyi Pan, Po Yi Ho, Guy P. Cooper, Xiao Dong, Christoph Bock, Eric E.
74 BIBLIOGRAPHY
Bouhassira, and Yuhong Fan. High-resolution mapping of h1 linker histonevariants in embryonic stem cells. PLoS genetics, 9(4):e1003417, 2013.
[26] Kristina L Carroll, Dennis A Pradhan, Josh A Granek, Neil D Clarke, andJeffry L Corden. Identification of cis elements directing termination ofyeast nonpolyadenylated snoRNA transcripts. Molecular and cellular bi-
ology, 24(14):6241–6252, 2004.
[27] Celeryproject. First steps with celery.
[28] Cenzic. Application Vulnerability Trends Report: 2014, 2015.
[29] Ping Chi, C. David Allis, and Gang Greg Wang. Covalent histone modi-fications — miswritten, misinterpreted and mis-erased in human cancers.Nature Reviews Cancer, 10(7):457–469, 2010.
[30] Peter J A Cock, Christopher J. Fields, Naohisa Goto, Michael L. Heuer, andPeter M. Rice. The Sanger FASTQ file format for sequences with qualityscores, and the Solexa/Illumina FASTQ variants. Nucleic Acids Research,38(6):1767–1771, 2009.
[31] Theo Combe, Antony Martin, and Roberto Di Pietro. To Docker or Notto Docker: A Security Perspective. IEEE Cloud Computing, 3(5):54–62,2016.
[32] Encode Project Consortium. An integrated encyclopedia of DNA elementsin the human genome. Nature, 489(7414):57–74, 2013.
[33] Tyler J. Creamer, Miranda M. Darby, Nuttara Jamonnak, Paul Schaugh-ency, Haiping Hao, Sarah J. Wheelan, and Jeffry L. Corden. Transcriptome-wide binding sites for components of the Saccharomyces cerevisiae non-poly (A) termination pathway: Nrd1, Nab3, and Sen1. PLoS genetics,7(10):e1002329, 2011.
[34] Menno P Creyghton, Albert W Cheng, G Grant Welstead, Tristan Kooistra,Bryce W Carey, Eveline J Steine, Jacob Hanna, Michael a Lodato, Gar-rett M Frampton, Phillip a Sharp, Laurie a Boyer, Richard a Young, and
BIBLIOGRAPHY 75
Rudolf Jaenisch. Histone H3K27ac separates active from poised enhancersand predicts developmental state. Proceedings of the National Academy of
Sciences of the United States of America, 107(50):21931–6, 2010.
[35] Lior David, Wolfgang Huber, Marina Granovskaia, Joern Toedling, Curtis JPalm, Lee Bofkin, Ted Jones, Ronald W Davis, and Lars M Steinmetz. Ahigh-resolution map of transcription in the yeast genome. Proceedings of
the National Academy of Sciences, 103(14):5320–5325, 2006.
[36] Abdollah Dehzangi, Yosvany López, Sunil Pranit Lal, GhazalehTaherzadeh, Jacob Michaelson, Abdul Sattar, Tatsuhiko Tsunoda, and AlokSharma. PSSM-Suc: Accurately predicting succinylation using positionspecific scoring matrix into bigram for feature extraction. Journal of Theo-
retical Biology, 425:97–102, 2017.
[37] Django Software Foundation. Django User Guide, 2013.
[38] Docker. Docker Releases.
[39] Docker. Overview of Docker Compose.
[40] Xianjun Dong, Melissa C Greven, Anshul Kundaje, Sarah Djebali, James BBrown, Chao Cheng, Tom R Gingeras, Mark Gerstein, Roderic Guigó,Ewan Birney, and Zhiping Weng. Modeling gene expression using chro-matin features in various cellular contexts. Genome Biology, 13(9):R53,2012.
[41] E. Eden and S. Brunak. Analysis and recognition of 5??? UTR intronsplice sites in human pre-mRNA. Nucleic Acids Research, 32(3):1131–1142, 2004.
[42] Laurence Ettwiller, Benedict Paten, Mirana Ramialison, Ewan Birney, andJoachim Wittbrodt. Trawler: de novo regulatory motif discovery pipelinefor chromatin immunoprecipitation. Nature methods, 4(7):563–565, 2007.
[43] He Fang, David J. Clark, and Jeffrey J. Hayes. DNA and nucleosomesdirect distinct folding of a linker histone H1 C-terminal domain. Nucleic
Acids Research, 40(4):1475–1484, 2012.
76 BIBLIOGRAPHY
[44] Christoffer Flensburg, Sarah A. Kinkel, Andrew Keniry, Marnie E. Blewitt,Alicia Oshlack, Jeffrey T. Leek, Robert B. Scharpf, Héctor Corrada Bravo,David Simcha, Benjamin Langmead, W. Evan Johnson, Donald Geman,Keith Baggerly, and Rafael A. Irizarry. A comparison of control samplesfor ChIP-seq of histone modifications. Frontiers in Genetics, 11(10):733–739, 2014.
[45] Marcel Geertz, David Shore, and Sebastian J Maerkl. Massively parallelmeasurements of molecular interaction kinetics on a microfluidic platform.Proceedings of the National Academy of Sciences, 109(41):16540–16545,2012.
[46] Jason Gertz, Katherine E. Varley, Timothy E. Reddy, Kevin M. Bowling,Florencia Pauli, Stephanie L. Parker, Katerina S. Kucera, Huntington F.Willard, and Richard M. Myers. Analysis of dna methylation in a three-generation family reveals widespread genetic influence on epigenetic regu-lation. PLoS Genetics, 7(8), 2011.
[47] David S Gilmour and John T Lis. Detecting protein-DNA interactions invivo: Distribution of RNA polymerase on specific bacterial genes. Bio-
chemistry, 81:4275–4279, 1984.
[48] Raluca Gordân, Ning Shen, Iris Dror, Tianyin Zhou, John Horton, RemoRohs, and Martha L. Bulyk. Genomic Regions Flanking E-Box BindingSites Influence DNA Binding Specificity of bHLH Transcription Factorsthrough DNA Shape. Cell Reports, 3(4):1093–1104, 2013.
[49] Charles E. Grant, Timothy L. Bailey, and William Stafford Noble. FIMO:Scanning for occurrences of a given motif. Bioinformatics, 27(7):1017–1018, 2011.
[50] Shobhit Gupta, John A Stamatoyannopoulos, Timothy L Bailey, andWilliam Noble. Quantifying similarity between motifs. Genome Biology,8(2):R24, 2007.
BIBLIOGRAPHY 77
[51] Markus Hafner, Markus Landthaler, Lukas Burger, Mohsen Khorshid, JeanHausser, Philipp Berninger, Andrea Rothballer, Manuel Ascano Jr, Anna-Carina Jungkamp, Mathias Munschauer, and Others. Transcriptome-wideidentification of RNA-binding protein and microRNA target sites by PAR-CLIP. Cell, 141(1):129–141, 2010.
[52] A Hamiche, P Schultz, V Ramakrishnan, P Oudet, and A Prunell. Linkerhistone-dependent DNA structure in linear mononucleosomes. Journal of
molecular biology, 257(1):30–42, 1996.
[53] Petter Hammar, Prune Leroy, Anel Mahmutovic, Erik G Marklund, Otto GBerg, and Johan Elf. The lac repressor displays facilitated diffusion inliving cells. Science (New York, N.Y.), 336(6088):1595–8, 2012.
[54] Nicole Happel and Detlef Doenecke. Histone H1 and its isoforms: Contri-bution to chromatin structure and function, 2009.
[55] Hirohito Haruki, Junichi Nishikawa, and Ulrich K Laemmli. The anchor-away technique: rapid, conditional establishment of yeast mutant pheno-types. Molecular cell, 31(6):925–932, 2008.
[56] Qiye He, Jeff Johnston, and Julia Zeitlinger. ChIP-nexus enables improveddetection of in vivo transcription factor binding footprints. Nat Biotechnol,33(4):395–401, 2015.
[57] Michael J. Hendzel, Melody A. Lever, Ellen Crawford, and John P HTh’Ng. The C-terminal Domain Is the Primary Determinant of HistoneH1 Binding to Chromatin in Vivo. Journal of Biological Chemistry,279(19):20028–20034, 2004.
[58] J. E. Herrera, K. L. West, R. L. Schiltz, Y. Nakatani, and M. Bustin. His-tone H1 Is a Specific Repressor of Core Histone Acetylation in Chromatin.Molecular and Cellular Biology, 20(2):523–529, 2000.
[59] Gerald Z Hertz and Gary D. Stormo. Identifying DNA and protein patternswith statistically significant alignments of multiple sequences. Bioinfor-
matics (Oxford, England), 15(7-8):563–77, 1999.
78 BIBLIOGRAPHY
[60] Jay R Hesselberth, Xiaoyu Chen, Zhihong Zhang, Peter J Sabo, RichardSandstrom, Alex P Reynolds, Robert E Thurman, Shane Neph, Michael SKuehn, William S Noble, Stanley Fields, and John A Stamatoyannopoulos.Global mapping of protein-DNA interactions in vivo by digital genomicfootprinting. Nature Methods, 6(4):283–289, 2009.
[61] Adrian Holovaty and Jacob Kaplan-Moss. The Definitive Guide to Django:
Web Development Done Right. Development, 2009.
[62] Jing-Ping Hsin and James L Manley. The RNA polymerase II CTD coor-dinates transcription and RNA processing. Genes Dev, 26(19):2119–2137,2012.
[63] François Jacob and Jacques Monod. Genetic regulatory mechanisms in thesynthesis of proteins. Journal of Molecular Biology, 3(3):318–356, 1961.
[64] Douglas M Jacobsen and Richard Shane Canon. Contain This, UnleashingDocker for HPC. Cray User Group 2015, page 14, 2015.
[65] Alain Jacquier. The complex eukaryotic transcriptome: unexpected per-vasive transcription and novel small RNAs. Nature Reviews Genetics,10(12):833–844, 2009.
[66] Victor X. Jin, Jeff Apostolos, Naga Satya Venkateswara Ra Nagisetty, andPeggy J. Farnham. W-ChIPMotifs: A web application tool for de novomotif discovery from ChIP-based high-throughput data. Bioinformatics,25(23):3191–3193, 2009.
[67] David S Johnson, Ali Mortazavi, Richard M Myers, and Barbara Wold.Genome-wide mapping of in vivo protein-DNA interactions. Science (New
York, N.Y.), 316(5830):1497–502, 2007.
[68] Arttu Jolma, Teemu Kivioja, Jarkko Toivonen, Lu Cheng, Gonghong Wei,Martin Enge, Mikko Taipale, Juan M. Vaquerizas, Jian Yan, Mikko J. Sil-lanpää, Martin Bonke, Kimmo Palin, Shaheynoor Talukder, Timothy R.
BIBLIOGRAPHY 79
Hughes, Nicholas M. Luscombe, Esko Ukkonen, and Jussi Taipale. Multi-plexed massively parallel SELEX for characterization of human transcrip-tion factor binding specificities. Genome Research, 20(6):861–873, 2010.
[69] Arttu Jolma, Jian Yan, Thomas Whitington, Jarkko Toivonen, Kazuhiro R.Nitta, Pasi Rastas, Ekaterina Morgunova, Martin Enge, Mikko Taipale,Gonghong Wei, Kimmo Palin, Juan M. Vaquerizas, Renaud Vincentelli,Nicholas M. Luscombe, Timothy R. Hughes, Patrick Lemaire, Esko Ukko-nen, Teemu Kivioja, and Jussi Taipale. DNA-binding specificities of humantranscription factors. Cell, 152(1-2):327–339, 2013.
[70] Marko Jovanovic, Michael S Rooney, Philipp Mertins, Dariusz Przybyl-ski, Nicolas Chevrier, Rahul Satija, Edwin H Rodriguez, Alexander PFields, Schraga Schwartz, Raktima Raychowdhury, Maxwell R Mumbach,Thomas Eisenhaure, Michal Rabani, Dave Gennert, Diana Lu, Toni De-lorey, Jonathan S Weissman, Steven A Carr, Nir Hacohen, and Aviv Regev.Immunogenetics. Dynamic profiling of the protein life cycle in response topathogens. Science (New York, N.Y.), 347(6226):1259038, 2015.
[71] Ann Mary Joy. Performance comparison between Linux containers and vir-tual machines. In Conference Proceeding - 2015 International Conference
on Advances in Computer Engineering and Applications, ICACEA 2015,pages 342–346, 2015.
[72] P.-Y. Kan, X. Lu, J. C. Hansen, and J. J. Hayes. The H3 Tail DomainParticipates in Multiple Interactions during Folding and Self-Associationof Nucleosome Arrays. Molecular and Cellular Biology, 27(6):2084–2091,2007.
[73] Rosa Karlic, Ho-Ryun Chung, Julia Lasserre, Kristian Vlahovicek, andMartin Vingron. Histone modification levels are predictive for gene ex-pression. Proceedings of the National Academy of Sciences of the United
States of America, 107(7):2926–2931, 2010.
[74] Krishanpal Karmodiya, Arnaud R Krebs, Mustapha Oulad-Abdelghani, Hi-roshi Kimura, and Laszlo Tora. H3K9 and H3K14 acetylation co-occur at
80 BIBLIOGRAPHY
many gene regulatory elements, while H3K14ac marks a subset of inac-tive inducible promoters in mouse embryonic stem cells. BMC Genomics,13(1):424, 2012.
[75] Jens Keilwagen and Jan Grau. Varying levels of complexity in transcriptionfactor binding motifs. Nucleic Acids Research, 43(18), 2015.
[76] Ki-Young Kim and David E Levin. Mpk1 MAPK association with the Paf1complex blocks Sen1-mediated premature transcription termination. Cell,144(5):745–756, 2011.
[77] Jason N Kuehner and David A Brow. Regulation of a eukaryotic gene byGTP-dependent start site selection and transcription attenuation. Mol Cell,31(2):201–211, jul 2008.
[78] Ivan V. Kulakovskiy, Ilya E. Vorontsov, Ivan S. Yevshin, Anas-tasiia V. Soboleva, Artem S. Kasianov, Haitham Ashoor, Wail Ba-Alawi, Vladimir B. Bajic, Yulia A. Medvedeva, Fedor A. Kolpakov, andVsevolod J. Makeev. HOCOMOCO: Expansion and enhancement of thecollection of transcription factor binding sites models. Nucleic Acids Re-
search, 44(D1):D116–D125, 2016.
[79] Jamie C. Kwasnieski, Christopher Fiore, Hemangi G. Chaudhari, andBarak A. Cohen. High-throughput functional testing of ENCODE segmen-tation predictions. Genome Research, 24(10):1595–1602, 2014.
[80] P J Laybourn and J T Kadonaga. Role of nucleosomal cores and his-tone H1 in regulation of transcription by RNA polymerase II. Science,254(5029):238–45, 1991.
[81] Nguyen Quoc Khanh Le, Quang Thai Ho, and Yu Yen Ou. Incorporat-ing deep learning with convolutional neural networks and position specificscoring matrices for identifying electron transport proteins, 2017.
[82] Jeffrey T. Leek, Robert B. Scharpf, Héctor Corrada Bravo, David Simcha,Benjamin Langmead, W. Evan Johnson, Donald Geman, Keith Baggerly,and Rafael A. Irizarry. Tackling the widespread and critical impact of batch
BIBLIOGRAPHY 81
effects in high-throughput data. Nature Reviews Genetics, 11(10):733–739,2010.
[83] Avraham Leff and James T. Rayfield. Web-application development us-ing the Model/View/Controller design pattern. In Proceedings - 5th IEEE
International Enterprise Distributed Object Computing Conference, 2001.
[84] Michal Levo and Eran Segal. In pursuit of design principles of regulatorysequences. Nature reviews. Genetics, 15(7):453–68, 2014.
[85] J J Li and M D Biggin. Statistics requantitates the central dogma: Tran-scription, not translation, chiefly determines protein abundance in mam-mals. Science, 347(6226):1066–1067, 2015.
[86] Qunhua Li, James B. Brown, Haiyan Huang, and Peter J. Bickel. Mea-suring reproducibility of high-throughput experiments. Annals of Applied
Statistics, 5(3):1752–1779, 2011.
[87] Xiao Li, Hilal Kazan, Howard D. Lipshitz, and Quaid D. Morris. Findingthe target sites of RNA-binding proteins, 2014.
[88] X. Lu, S. N. Wontakal, H. Kavi, B. J. Kim, P. M. Guzzardo, A. V.Emelyanov, N. Xu, G. J. Hannon, J. Zavadil, D. V. Fyodorov, and A. I.Skoultchi. Drosophila H1 Regulates the Genetic Activity of Heterochro-matin by Recruitment of Su(var)3-9. Science, 340(6128):78–81, 2013.
[89] Sebastian Luehr, Holger Hartmann, and Johannes Söding. The XXmotifweb server for eXhaustive, weight matriX-based motif discovery in nu-cleotide sequences. Nucleic Acids Research, 40(W1), 2012.
[90] K Luger, A W Mäder, R K Richmond, D F Sargent, and T J Richmond.Crystal structure of the nucleosome core particle at 2.8 A resolution. Na-
ture, 389(6648):251–60, 1997.
[91] Karolin Luger, Mekonnen L. Dechassa, and David J. Tremethick. Newinsights into nucleosome and chromatin structure: an ordered state or adisordered affair? Nature Reviews Molecular Cell Biology, 13(7):436–447,2012.
82 BIBLIOGRAPHY
[92] Sebastian J Maerkl and Stephen R Quake. A systems approach to measur-ing the binding energy landscapes of transcription factors. Science (New
York, N.Y.), 315(5809):233–237, 2007.
[93] T K Man and G D Stormo. Non-independence of Mnt repressor-operatorinteraction determined by a new quantitative multiple fluorescence rela-tive affinity (QuMFRA) assay. Nucleic acids research, 29(12):2471–2478,2001.
[94] Corey R Mandel, Yun Bai, and Liang Tong. Protein factors in pre-mRNA3 -end processing. Cellular and Molecular Life Sciences, 65(7-8):1099–1122, 2008.
[95] Sebastian Marquardt, Dane Z Hazelbaker, and Stephen Buratowski. Dis-tinct RNA degradation pathways and 3’extensions of yeast non-codingRNA species. Transcription, 2(3):145–154, 2011.
[96] A Gregory Matera, Rebecca M Terns, and Michael P Terns. Non-codingRNAs: lessons from the small nuclear and small nucleolar RNAs. Nat Rev
Mol Cell Biol, 8(3):209–220, 2007.
[97] Anthony Mathelier, Oriol Fornes, David J. Arenillas, Chih Yu Chen, Gré-goire Denay, Jessica Lee, Wenqiang Shi, Casper Shyr, Ge Tan, RebeccaWorsley-Hunt, Allen W. Zhang, François Parcy, Boris Lenhard, AlbinSandelin, and Wyeth W. Wasserman. JASPAR 2016: A major expansionand update of the open-access database of transcription factor binding pro-files. Nucleic Acids Research, 44(D1):D110–D115, 2016.
[98] Anthony Mathelier and Wyeth W. Wasserman. The Next Generation ofTranscription Factor Binding Site Prediction. PLoS Computational Biol-
ogy, 9(9), 2013.
[99] Anthony Mathelier, Xiaobei Zhao, Allen W. Zhang, François Parcy, Re-becca Worsley-Hunt, David J. Arenillas, Sorana Buchman, Chih Yu Chen,Alice Chou, Hans Ienasescu, Jonathan Lim, Casper Shyr, Ge Tan, MichelleZhou, Boris Lenhard, Albin Sandelin, and Wyeth W. Wasserman. JASPAR
BIBLIOGRAPHY 83
2014: An extensively expanded and updated open-access database of tran-scription factor binding profiles. Nucleic Acids Research, 42(D1), 2014.
[100] V Matys, O V Kel-Margoulis, E Fricke, I Liebich, S Land, A Barre-Dirrie,I Reuter, D Chekmenev, M Krull, K Hornischer, N Voss, P Stegmaier,B Lewicki-Potapov, H Saxel, A E Kel, and E Wingender. TRANSFAC andits module TRANSCompel: transcriptional gene regulation in eukaryotes.Nucleic acids research, 34(Database issue):D108–10, 2006.
[101] Andreas Mayer, Martin Heidemann, Michael Lidschreiber, AmelieSchreieck, Mai Sun, Corinna Hintermair, Elisabeth Kremmer, Dirk Eick,and Patrick Cramer. CTD tyrosine phosphorylation impairs terminationfactor recruitment to RNA polymerase II. Science, 336(6089):1723–1725,2012.
[102] Dirk Merkel. Docker: lightweight Linux containers for consistent develop-ment and deployment, 2014.
[103] Sam Meyer, Nils B. Becker, Sajad Hussain Syed, Damien Goutte-Gattat,Manu Shubhdarshan Shukla, Jeffrey J. Hayes, Dimitar Angelov, Jan Bed-nar, Stefan Dimitrov, and Ralf Everaers. From crystal and NMR struc-tures, footprints and cryo-electron-micrographs to large and soft structures:Nanoscale modeling of the nucleosomal stem. Nucleic Acids Research,39(21):9139–9154, 2011.
[104] Tarjei S. Mikkelsen, Manching Ku, David B. Jaffe, Biju Issac, ErezLieberman, Georgia Giannoukos, Pablo Alvarez, William Brockman, Tae-Kyung Kim, Richard P. Koche, William Lee, Eric Mendenhall, AislingO’Donovan, Aviva Presser, Carsten Russ, Xiaohui Xie, Alexander Meiss-ner, Marius Wernig, Rudolf Jaenisch, Chad Nusbaum, Eric S. Lander, andBradley E. Bernstein. Genome-wide maps of chromatin state in pluripotentand lineage-committed cells. Nature, 448(7153):553–560, 2007.
[105] Hannah E Mischo and Nick J Proudfoot. Disengaging polymerase: Termi-nating RNA polymerase II transcription in budding yeast. Biochimica et
84 BIBLIOGRAPHY
Biophysica Acta (BBA)-Gene Regulatory Mechanisms, 1829(1):174–185,jan 2013.
[106] Tatsuya Morisaki, Waltraud G Müller, Nicole Golob, Davide Mazza, andJames G McNally. Single-molecule analysis of transcription factor bindingat transcription sites in live cells. Nature communications, 5:4456, 2014.
[107] Florian Mueller, Timothy J Stasevich, Davide Mazza, and James G Mc-Nally. Quantifying transcription factor kinetics: at work or at play? Crit
Rev Biochem Mol Biol, 48(5):492–514, 2013.
[108] Daniel Nations. Improve Your Understanding of Web Applications, 2016.
[109] Ncbi. SRA-toolkit.
[110] Helen Neil, Christophe Malabat, Yves D.Aubenton-Carafa, Zhenyu Xu,Lars M Steinmetz, and Alain Jacquier. Widespread bidirectional pro-moters are the major source of cryptic transcripts in yeast. Nature,457(7232):1038–1042, 2009.
[111] Shane Neph, Jeff Vierstra, Andrew B Stergachis, Alex P Reynolds,Eric Haugen, Benjamin Vernot, Robert E Thurman, Sam John, RichardSandstrom, Audra K Johnson, Matthew T Maurano, Richard Humbert,Eric Rynes, Hao Wang, Shinny Vong, Kristen Lee, Daniel Bates, Mor-gan Diegel, Vaughn Roach, Douglas Dunn, Jun Neri, Anthony Schafer,R Scott Hansen, Tanya Kutyavin, Erika Giste, Molly Weaver, TheresaCanfield, Peter Sabo, Miaohua Zhang, Gayathri Balasundaram, RachelByron, Michael J MacCoss, Joshua M Akey, M A Bender, Mark Grou-dine, Rajinder Kaul, and John A Stamatoyannopoulos. An expansive hu-man regulatory lexicon encoded in transcription factor footprints. Nature,489(7414):83–90, 2012.
[112] Nginx. Nginx documentation, 2015.
[113] Ariel Ortiz. Web development with python and django. Proceedings of the
43rd ACM technical symposium on Computer Science Education - SIGCSE
’12, page 686, 2012.
BIBLIOGRAPHY 85
[114] Mikhail Pachkov, Piotr J. Balwierz, Phil Arnold, Evgeniy Ozonov, and ErikVan Nimwegen. SwissRegulon, a database of genome-wide annotations ofregulatory sites: Recent updates. Nucleic Acids Research, 41(D1), 2013.
[115] Giulio Pavesi, Paolo Mereghetti, Federico Zambelli, Marco Stefani, Gian-carlo Mauri, and Graziano Pesole. MoD Tools: Regulatory motif discoveryin nucleotide sequences from co-regulated or homologous genes. Nucleic
Acids Research, 34(WEB. SERV. ISS.), 2006.
[116] Mark Ptashne. The chemistry of regulation of genes and other things, 2014.
[117] Michal Rabani, Joshua Z Levin, Lin Fan, Xian Adiconis, Raktima Ray-chowdhury, Manuel Garber, Andreas Gnirke, Chad Nusbaum, Nir Haco-hen, Nir Friedman, and Others. Metabolic labeling of RNA uncovers prin-ciples of RNA production and degradation dynamics in mammalian cells.Nature biotechnology, 29(5):436–442, 2011.
[118] V. Ramakrishnan, J. T. Finch, V. Graziano, P. L. Lee, and R. M. Sweet.Crystal structure of globular domain of histone H5 and its implications fornucleosome binding. Nature, 362(6417):219–223, 1993.
[119] Redis. Introduction to Redis.
[120] B Ren, F Robert, J J Wyrick, O Aparicio, E G Jennings, I Simon,J Zeitlinger, J Schreiber, N Hannett, E Kanin, T L Volkert, C J Wilson,S P Bell, and R A Young. Genome-wide location and function of DNAbinding proteins. Science, 290(5500):2306–2309, 2000.
[121] Ho Sung Rhee and B. Franklin Pugh. Comprehensive genome-wideprotein-DNA interactions detected at single-nucleotide resolution. Cell,147(6):1408–1419, 2011.
[122] Ho Sung Rhee and B Franklin Pugh. Genome-wide structure and organi-zation of eukaryotic pre-initiation complexes. Nature, 483(7389):295–301,2012.
86 BIBLIOGRAPHY
[123] Remo Rohs, Xiangshu Jin, Sean M West, Rohit Joshi, Barry Honig, andRichard S Mann. Origins of specificity in protein-DNA recognition. Annual
review of biochemistry, 79:233–69, 2010.
[124] Steven L. Salzberg, Arthur L. Deicher, Simon Kasif, and Owen White.Microbial gene identification using interpolated Markov models. Nucleic
Acids Research, 26(2):544–548, 1998.
[125] Amy Schade. Responsive Web Design (RWD) and User Experience, 2014.
[126] Andreas Scherer. Batch Effects and Noise in Microarray Experiments:
Sources and Solutions. Wiley Blackwell, 2009.
[127] Thomas D. Schneider and R. Michael Stephens. Sequence logos: Anew way to display consensus sequences. Nucleic Acids Research,18(20):6097–6100, 1990.
[128] Daniel Schulz, Bjoern Schwalb, Anja Kiesel, Carlo Baejen,Philipp Phillipp Torkler, Julien Gagneur, Johannes Soeding, PatrickCramer, Baejen Carlo, Philipp Phillipp Torkler, Julien Gagneur, JohannesSoeding, and Patrick Cramer. Transcriptome surveillance by selectivetermination of non-coding RNA synthesis. Cell, 155(5):1075–1087, nov2013.
[129] B Schwanhausser, D Busse, N Li, G Dittmar, J Schuchhardt, J Wolf,W Chen, and M Selbach. Global quantification of mammalian gene ex-pression control. Nature, 473(7347):337–342, 2011.
[130] Amy C Seila, Leighton J Core, John T Lis, and Phillip A Sharp. Divergenttranscription: a new feature of active promoters. Cell Cycle, 8(16):2557–2564, 2009.
[131] Eilon Sharon, Shai Lubliner, and Eran Segal. A feature-based approach tomodeling protein-DNA interactions. PLoS Computational Biology, 4(8),2008.
BIBLIOGRAPHY 87
[132] Matthias Siebert and Johannes Soeding. Bayesian Markov models con-sistently outperform PWMs at predicting motifs in nucleotide sequences.Nucleic Acids Research, 44(13):6055–6069, 2016.
[133] Trevor Siggers and Raluca Gordân. Protein-DNA binding: Complexitiesand multi-protein codes. Nucleic Acids Research, 42(4):2099–2111, 2014.
[134] Navjot Singh, Zhuo Ma, Trent Gemmill, Xiaoyun Wu, Holland De-figlio, Anne Rossettini, Christina Rabeler, Olivia Beane, Randall H Morse,Michael J Palumbo, and Steven D Hanes. The Ess1 prolyl isomerase is re-quired for transcription termination of small noncoding RNAs via the Nrd1pathway. Mol Cell, 36(2):255–266, 2009.
[135] S. Sinha and M. Tompa. YMF: a program for discovery of novel transcrip-tion factor binding sites by statistical overrepresentation. Nucleic Acids
Research, 31(13):3586–3588, 2003.
[136] Matthew Slattery, Tianyin Zhou, Lin Yang, Ana Carolina Dantas Machado,Raluca Gordân, and Remo Rohs. Absence of a simple code: How tran-scription factors read the genome, 2014.
[137] E J Steinmetz and D A Brow. Repression of gene expression by an ex-ogenous sequence element acting in concert with a heterogeneous nuclearribonucleoprotein-like protein, Nrd1, and the putative helicase Sen1. Mol
Cell Biol, 16(12):6993–7003, 1996.
[138] Eric J Steinmetz, Nicholas K Conrad, David A Brow, and Jeffry L Corden.RNA-binding protein Nrd1 directs poly (A)-independent 3 -end formationof RNA polymerase II transcripts. Nature, 413(6853):327–331, 2001.
[139] Eric J Steinmetz, Christopher L Warren, Jason N Kuehner, Bahman Pan-behi, Aseem Z Ansari, and David A Brow. Genome-wide distribution ofyeast RNA polymerase II and its control by Sen1 helicase. Molecular cell,24(5):735–746, 2006.
[140] Gary D. Stormo. Modeling the specificity of protein-DNA interactions.Quantitative biology, 1(2):115–130, 2013.
88 BIBLIOGRAPHY
[141] Gary D. Stormo, Thomas D. Schneider, Larry Gold, and Andrzej Ehren-feucht. Use of the ’perceptron’ algorithm to distinguish translational initi-ation sites in E. coli. Nucleic Acids Research, 10(9):2997–3011, 1982.
[142] Gary D Stormo and Yue Zhao. Determining the specificity of protein-DNAinteractions. Nature reviews. Genetics, 11(11):751–60, 2010.
[143] Alexandra Stützer, Stamatios Liokatis, Anja Kiesel, Dirk Schwarzer,Remco Sprangers, Johannes Söding, Philipp Selenko, and Wolfgang Fis-chle. Modulations of DNA Contacts by Linker Histones and Post-translational Modifications Determine the Mobility and Modifiability ofNucleosomal H3 Tails. Molecular Cell, 61(2):247–259, 2016.
[144] Erin Styles, Ji-Young Youn, Mojca Mattiazzi Usaj, and Brenda Andrews.Functional genomics in the study of yeast cell polarity: moving in the rightdirection. Philos Trans R Soc Lond B Biol Sci, 368(1629):20130118, 2013.
[145] Sajad Hussian Syed, Damien Goutte-gattat, Nils Becker, Sam Meyer, andManu Shubhdarshan. Single-base resolution mapping of H1–nucleosomeinteractions and 3D organization of the nucleosome. Proceedings of the
National Academy of Sciences, 107(21):1–6, 2010.
[146] Marilyne Thiebaut, Elena Kisseleva-Romanova, Mathieu Rougemaille, Jo-celyne Boulay, and Domenico Libri. Transcription termination and nucleardegradation of cryptic unstable transcripts: a role for the nrd1-nab3 path-way in genome surveillance. Molecular cell, 23(6):853–864, 2006.
[147] Morgane Thomas-Chollier, Olivier Sand, J. V. Turatsinze, R. Janky,Matthieu Defrance, Eric Vervisch, Sylvain Brohée, and Jacques vanHelden. RSAT: regulatory sequence analysis tools. Nucleic acids research,36(Web Server issue), 2008.
[148] William A. Thompson, Lee A. Newberg, Sean Conlan, Lee Ann McCue,and Charles E. Lawrence. The gibbs centroid sampler. Nucleic Acids Re-
search, 35(SUPPL.2), 2007.
BIBLIOGRAPHY 89
[149] Robert E Thurman, Eric Rynes, Richard Humbert, Jeff Vierstra, Matthew TMaurano, Eric Haugen, Nathan C Sheffield, Andrew B Stergachis, HaoWang, Benjamin Vernot, Kavita Garg, Sam John, Richard Sandstrom,Daniel Bates, Lisa Boatman, Theresa K Canfield, Morgan Diegel, Dou-glas Dunn, Abigail K Ebersol, Tristan Frum, Erika Giste, Audra K John-son, Ericka M Johnson, Tanya Kutyavin, Bryan Lajoie, Bum-Kyu Lee,Kristen Lee, Darin London, Dimitra Lotakis, Shane Neph, Fidencio Neri,Eric D Nguyen, Hongzhu Qu, Alex P Reynolds, Vaughn Roach, AlexiasSafi, Minerva E Sanchez, Amartya Sanyal, Anthony Shafer, Jeremy M Si-mon, Lingyun Song, Shinny Vong, Molly Weaver, Yongqi Yan, ZhanchengZhang, Zhuzhu Zhang, Boris Lenhard, Muneesh Tewari, Michael ODorschner, R Scott Hansen, Patrick A Navas, George Stamatoyannopoulos,Vishwanath R Iyer, Jason D Lieb, Shamil R Sunyaev, Joshua M Akey, Pe-ter J Sabo, Rajinder Kaul, Terrence S Furey, Job Dekker, Gregory E Craw-ford, and John A Stamatoyannopoulos. The accessible chromatin landscapeof the human genome. Nature, 489(7414):75–82, 2012.
[150] Bryan M Turner. Defining an epigenetic code. Nature Cell Biology, 9(1):2–6, 2007.
[151] Bryan M. Turner. Nucleosome signalling; An evolving concept, 2014.
[152] E L Van Dijk, C L Chen, Y D Aubenton-Carafa, S Gourvennec,M Kwapisz, V Roche, C Bertrand, M Silvain, P Legoix-Ne, S Loeillet,and Others. XUTs are a class of Xrn1-sensitive antisense regulatory non-coding RNA in yeast. Nature, 475(7354):114–117, 2011.
[153] Lidia Vasiljeva, Minkyu Kim, Hannes Mutschler, Stephen Buratowski, andAnton Meinhart. The Nrd1–Nab3–Sen1 termination complex interacts withthe Ser5-phosphorylated RNA polymerase II C-terminal domain. Nature
structural & molecular biology, 15(8):795–804, 2008.
[154] P H von Hippel and O G Berg. On the specificity of DNA-protein interac-tions. Proc. Natl. Acad. Sci. U.S.A., 83(6):1608–1612, 1986.
90 BIBLIOGRAPHY
[155] Peter H von Hippel. From "simple" DNA-protein interactions to the macro-molecular machines of gene expression. Annual review of biophysics and
biomolecular structure, 36:79–105, 2007.
[156] Jie Wang, Jiali Zhuang, Sowmya Iyer, XinYing Lin, Troy W. Whitfield,Melissa C. Greven, Brian G. Pierce, Xianjun Dong, Anshul Kundaje, YongCheng, Oliver J. Rando, Ewan Birney, Richard M. Myers, William S. No-ble, Michael Snyder, and Zhiping Weng. Sequence features and chromatinstructure around the genomic regions bound by 119 human transcriptionfactors. Genome Research, 22(9):1798–1812, 2012.
[157] Zhong Wang, Mark Gerstein, and Michael Snyder. RNA-Seq: a revolution-ary tool for transcriptomics. Nat Rev Genet, 10(1):57–63, jan 2009.
[158] Christopher L Warren, Natasha C S Kratochvil, Karl E Hauschild, ShaneFoister, Mary L Brezinski, Peter B Dervan, George N Phillips, andAseem Z Ansari. Defining the sequence-recognition profile of DNA-binding molecules. Proceedings of the National Academy of Sciences of
the United States of America, 103(4):867–72, 2006.
[159] Wu Wei, Vicent Pelechano, Aino I Järvelin, and Lars M Steinmetz.Functional consequences of bidirectional promoters. Trends in Genetics,27(7):267–276, 2011.
[160] Lukas Windhager, Thomas Bonfert, Kaspar Burger, Zsolt Ruzsics, Ste-fan Krebs, Stefanie Kaufmann, Georg Malterer, Anne L’Hernault, MarkusSchilhabel, Stefan Schreiber, and Others. Ultrashort and progressive 4sU-tagging reveals key characteristics of RNA processing at nucleotide resolu-tion. Genome Research, 22(10):2031–2042, 2012.
[161] Wiebke Wlotzka, Grzegorz Kudla, Sander Granneman, and David Toller-vey. The nuclear RNA polymerase II surveillance system targets poly-merase III transcripts. EMBO J, 30(9):1790–1803, 2011.
[162] Christopher L. Woodcock, Arthur I. Skoultchi, and Yuhong Fan. Role oflinker histone in chromatin structure and function: H1 stoichiometry andnucleosome repeat length. Chromosome Research, 14(1):17–25, 2006.
BIBLIOGRAPHY 91
[163] Françoise Wyers, Mathieu Rougemaille, Gwenaël Badis, Jean-ClaudeRousselle, Marie-Elisabeth Dufour, Jocelyne Boulay, Béatrice Régnault,Frédéric Devaux, Abdelkader Namane, Bertrand Séraphin, and Others.Cryptic pol II transcripts are degraded by a nuclear quality control path-way involving a new poly (A) polymerase. Cell, 121(5):725–737, 2005.
[164] Xiaonuo Gantan. Writing simple views for your first python django appli-cation, 2013.
[165] Zhenyu Xu, Wu Wei, Julien Gagneur, Fabiana Perocchi, Sandra Clauder-Münster, Jurgi Camblong, Elisa Guffanti, Françoise Stutz, Wolfgang Hu-ber, and Lars M Steinmetz. Bidirectional promoters generate pervasivetranscription in yeast. Nature, 457(7232):1033–1037, 2009.
[166] Nicolae Radu Zabet and Boris Adryan. Estimating binding properties oftranscription factors from genome-wide binding profiles. Nucleic Acids
Research, 43(1):84–94, 2015.
[167] B.-R. Zhou, H. Feng, H. Kato, L. Dai, Y. Yang, Y. Zhou, and Y. Bai. Struc-tural insights into the histone H1-nucleosome complex. Proceedings of the
National Academy of Sciences, 110(48):19390–19395, 2013.
[168] Bing Rui Zhou, Jiansheng Jiang, Hanqiao Feng, Rodolfo Ghirlando, T. SamXiao, and Yawen Bai. Structural Mechanisms of Nucleosome Recognitionby Linker Histones. Molecular Cell, 59(4):628–638, 2015.
Related Documents


