Salim Janbeh Physical Infrastructure Consultant [email protected] PANDUIT Understanding Power Usage Effectiveness (PUE) & Data Center Infrastructure Management (DCIM)

Understanding Power Usage Effectiveness (PUE) & Data ... · Salim Janbeh Physical Infrastructure Consultant [email protected] PANDUIT Understanding Power Usage Effectiveness (PUE)
Jul 19, 2018
Welcome message from author
This document is posted to help you gain knowledge. Please leave a comment to let me know what you think about it! Share it to your friends and learn new things together.
Transcript
Salim Janbeh
Physical Infrastructure Consultant
PANDUIT
Understanding Power Usage Effectiveness (PUE) &
Data Center Infrastructure Management (DCIM)
You Can’t Manage What You Don’t Measure: A Predictive Approach to Energy Efficiency
2
3
Agenda:
1. Data Center Challenges
2. Power Usage Effectiveness Overview
3. Data Center Infrastructure Management Software Requirement
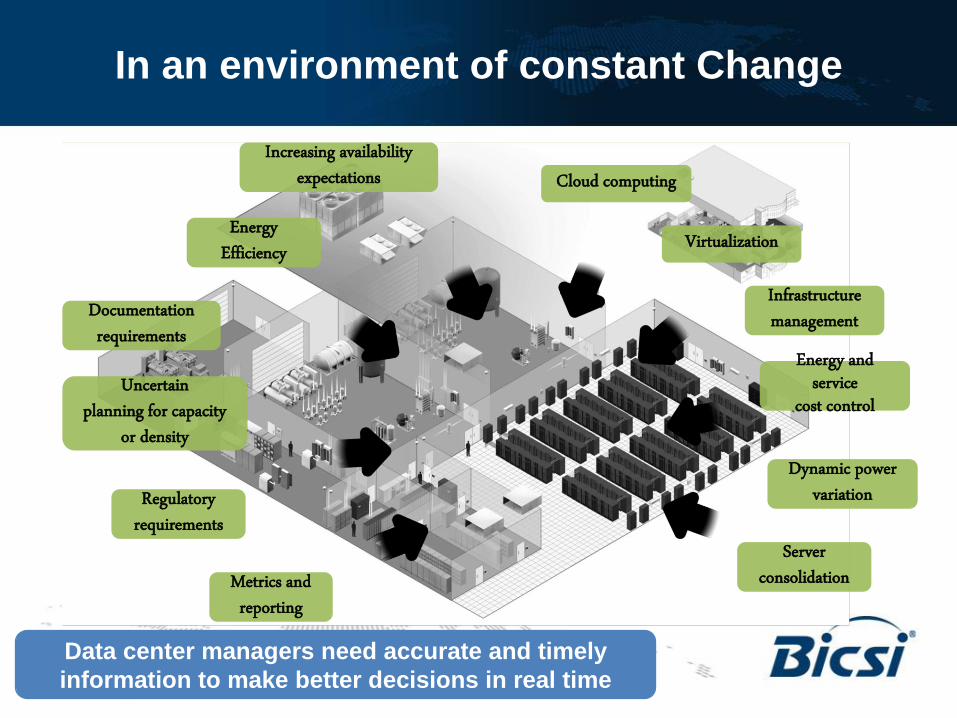
In an environment of constant Change
Data center managers need accurate and timely
information to make better decisions in real time
Server consolidation
Dynamic power variation
Energy and service
cost control
Virtualization
Increasing availability expectations
Energy Efficiency
Regulatory requirements
Metrics and reporting
Infrastructure management
Cloud computing
Uncertain planning for capacity
or density
Documentation requirements
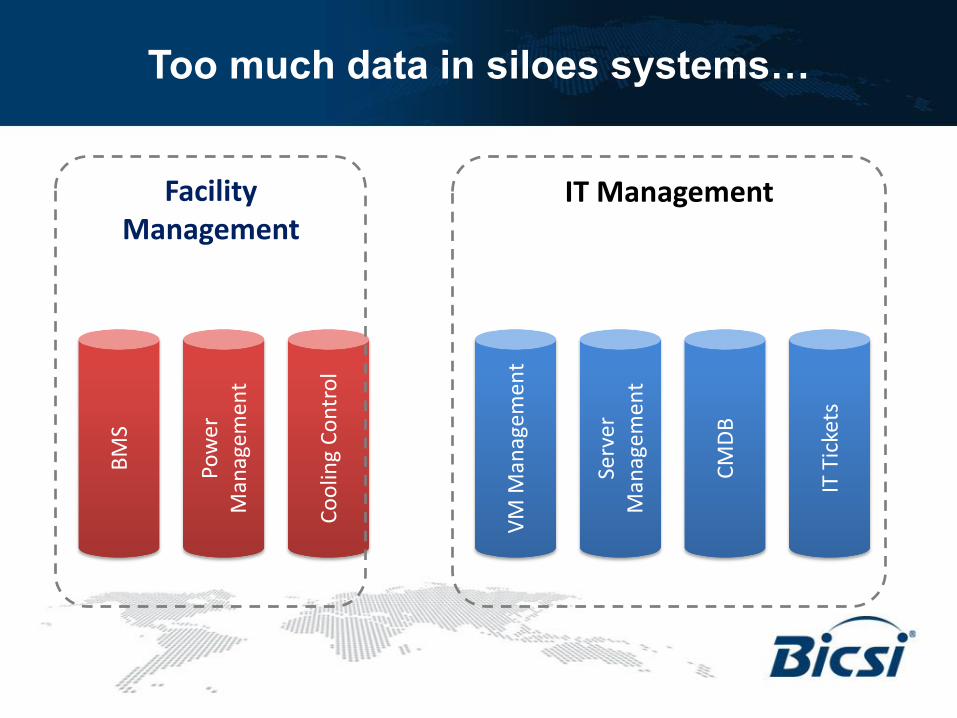
Too much data in siloes systems…
BM
S
Pow
er
Man
agem
ent
VM
Man
agem
ent
CM
DB
IT T
icke
ts
Serv
er
Man
agem
ent
Co
olin
g C
on
tro
l
Facility Management
IT Management
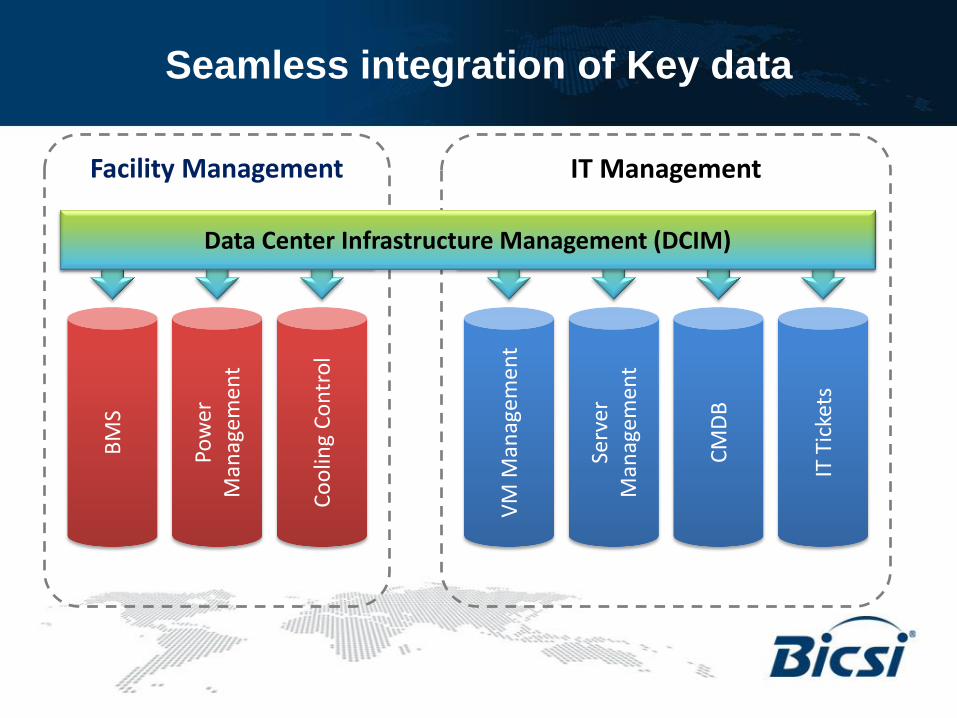
Seamless integration of Key data B
MS
Pow
er
Man
agem
ent
VM
Man
agem
ent
CM
DB
IT T
icke
ts
Serv
er
Man
agem
ent
Co
olin
g C
on
tro
l
Facility Management IT Management
Data Center Infrastructure Management (DCIM)
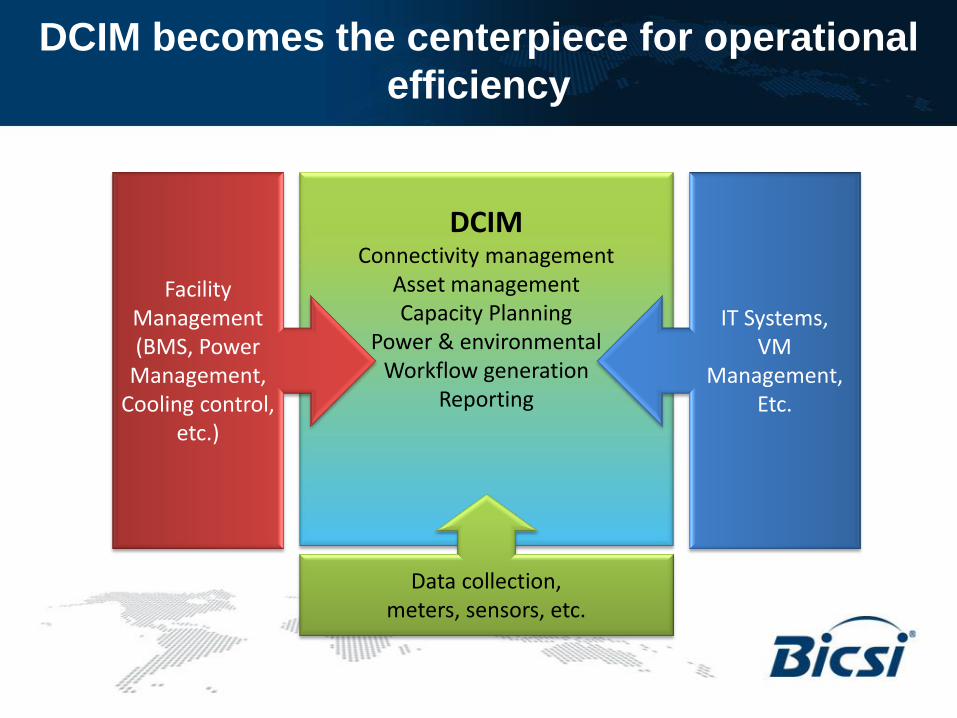
DCIM Connectivity management
Asset management Capacity Planning
Power & environmental Workflow generation
Reporting
DCIM becomes the centerpiece for operational
efficiency
Data collection, meters, sensors, etc.
IT Systems, VM
Management, Etc.
Facility Management (BMS, Power
Management, Cooling control,
etc.)
8
Agenda:
1. Data Center Challenges
2. Power Usage Effectiveness Overview
3. Data Center Infrastructure Management Software Requirement

9
About the Green Grids
A not-for-profit global consortium focused on driving
energy efficiency in the computing ecosystem.
Developing meaningful and user-centric metrics to
help IT and Facilities better manage their
computing resources.
Developing and promoting standards,
measurements, methods, best practices and
technologies that support these metrics.
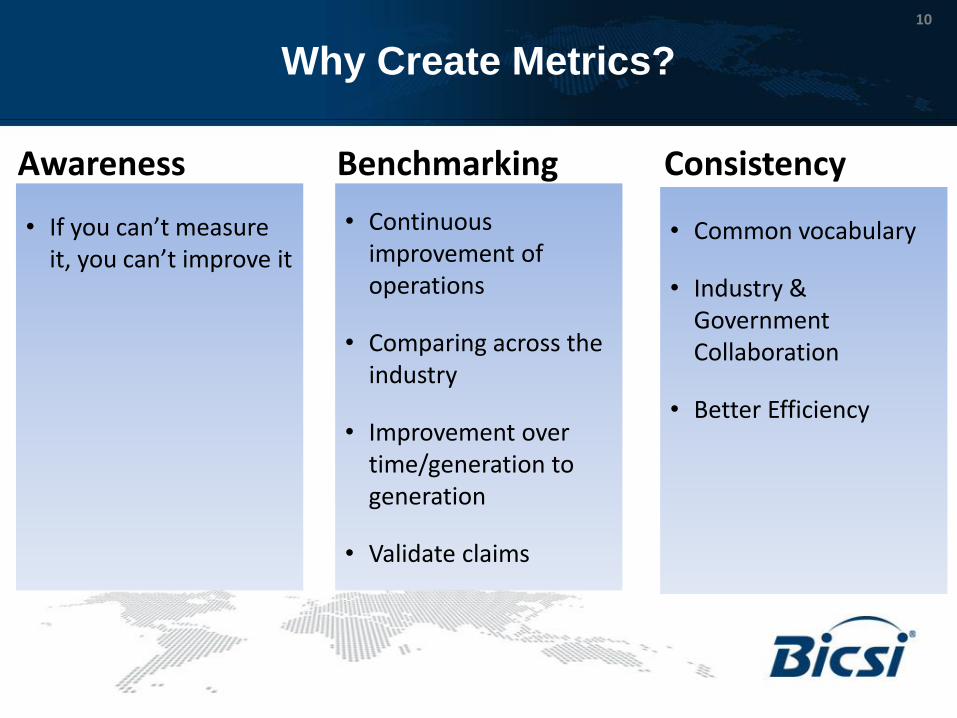
Awareness
10
Why Create Metrics?
• If you can’t measure it, you can’t improve it
Benchmarking
• Continuous improvement of operations
• Comparing across the industry
• Improvement over time/generation to generation
• Validate claims
Consistency
• Common vocabulary
• Industry & Government Collaboration
• Better Efficiency
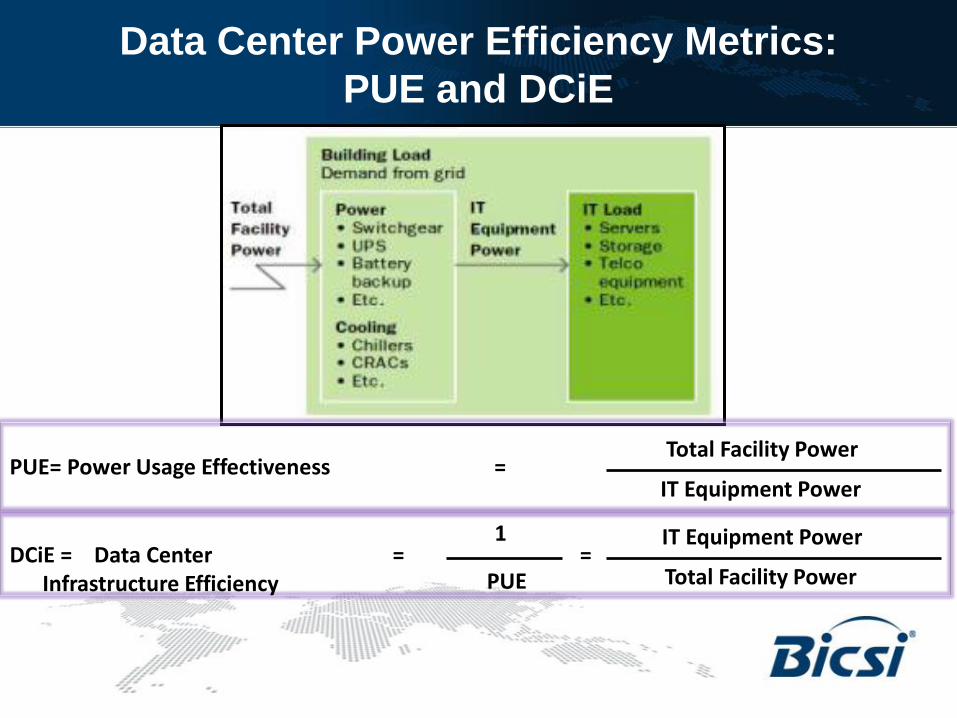
Data Center Power Efficiency Metrics:
PUE and DCiE
PUE= Power Usage Effectiveness = Total Facility Power
IT Equipment Power
DCiE = Data Center = = Infrastructure Efficiency
IT Equipment Power
Total Facility Power
1
PUE
12
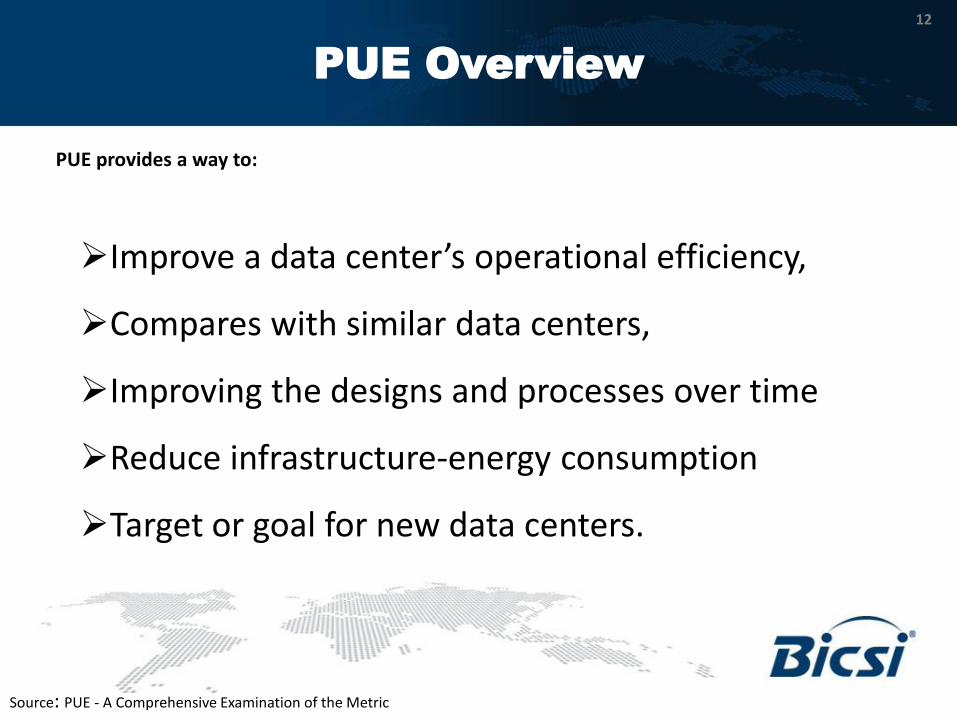
PUE provides a way to:
Improve a data center’s operational efficiency,
Compares with similar data centers,
Improving the designs and processes over time
Reduce infrastructure-energy consumption
Target or goal for new data centers.
Source: PUE - A Comprehensive Examination of the Metric
PUE Overview
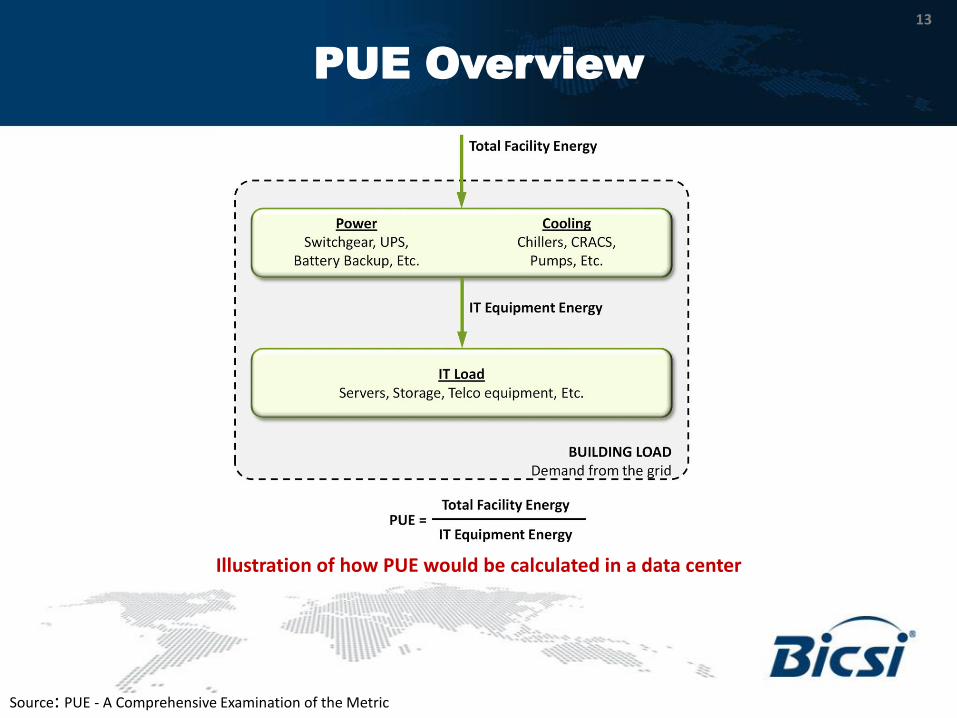
13
Illustration of how PUE would be calculated in a data center
Source: PUE - A Comprehensive Examination of the Metric
PUE Overview
14
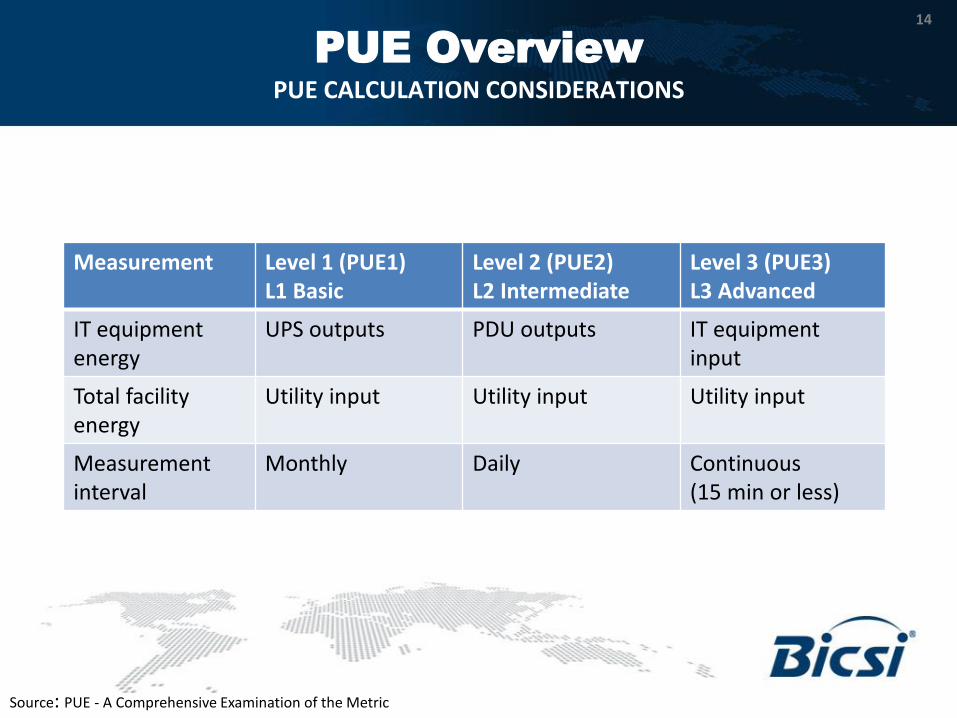
Measurement Level 1 (PUE1) L1 Basic
Level 2 (PUE2) L2 Intermediate
Level 3 (PUE3) L3 Advanced
IT equipment energy
UPS outputs PDU outputs IT equipment input
Total facility energy
Utility input Utility input Utility input
Measurement interval
Monthly Daily Continuous (15 min or less)
Source: PUE - A Comprehensive Examination of the Metric
PUE Overview
PUE CALCULATION CONSIDERATIONS
15
Source: PUE - A Comprehensive Examination of the Metric
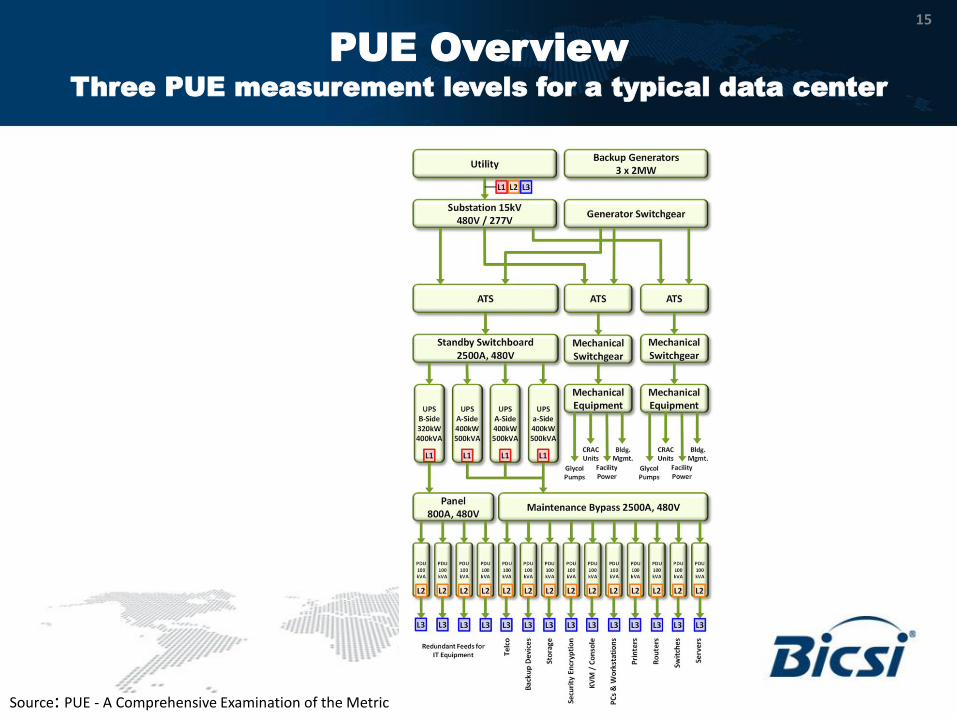
PUE Overview
Three PUE measurement levels for a typical data center
16
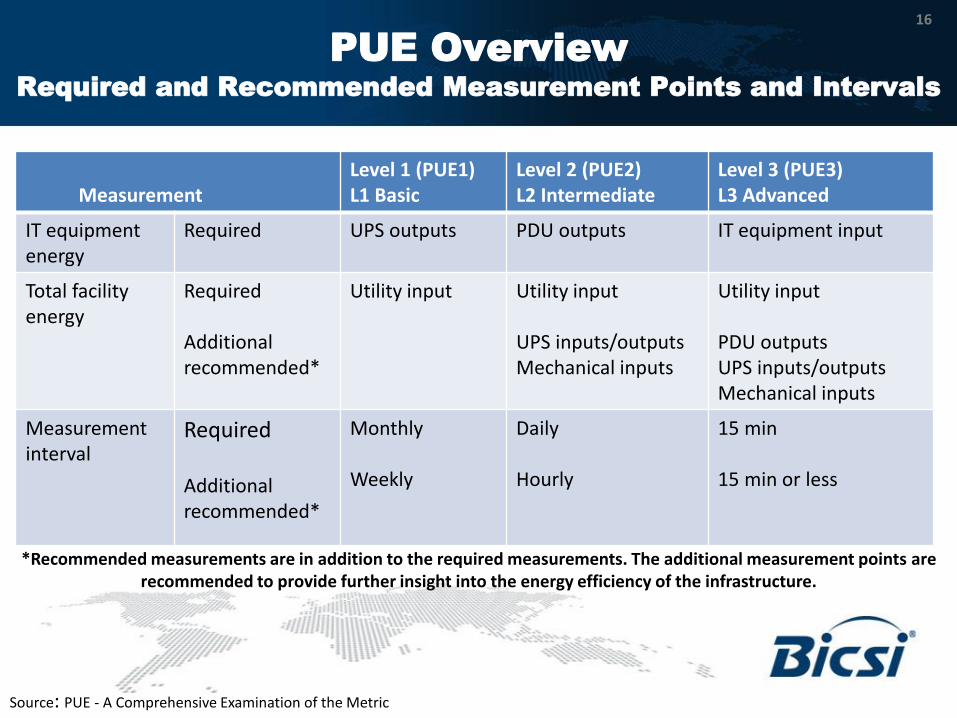
Measurement
Level 1 (PUE1) L1 Basic
Level 2 (PUE2) L2 Intermediate
Level 3 (PUE3) L3 Advanced
IT equipment energy
Required UPS outputs PDU outputs IT equipment input
Total facility energy
Required Additional recommended*
Utility input Utility input UPS inputs/outputs Mechanical inputs
Utility input PDU outputs UPS inputs/outputs Mechanical inputs
Measurement interval
Required Additional recommended*
Monthly Weekly
Daily Hourly
15 min 15 min or less
*Recommended measurements are in addition to the required measurements. The additional measurement points are recommended to provide further insight into the energy efficiency of the infrastructure.
Source: PUE - A Comprehensive Examination of the Metric
PUE Overview
Required and Recommended Measurement Points and Intervals

17
Source: PUE - A Comprehensive Examination of the Metric
PUE Overview
Required and Recommended Measurement Points
18
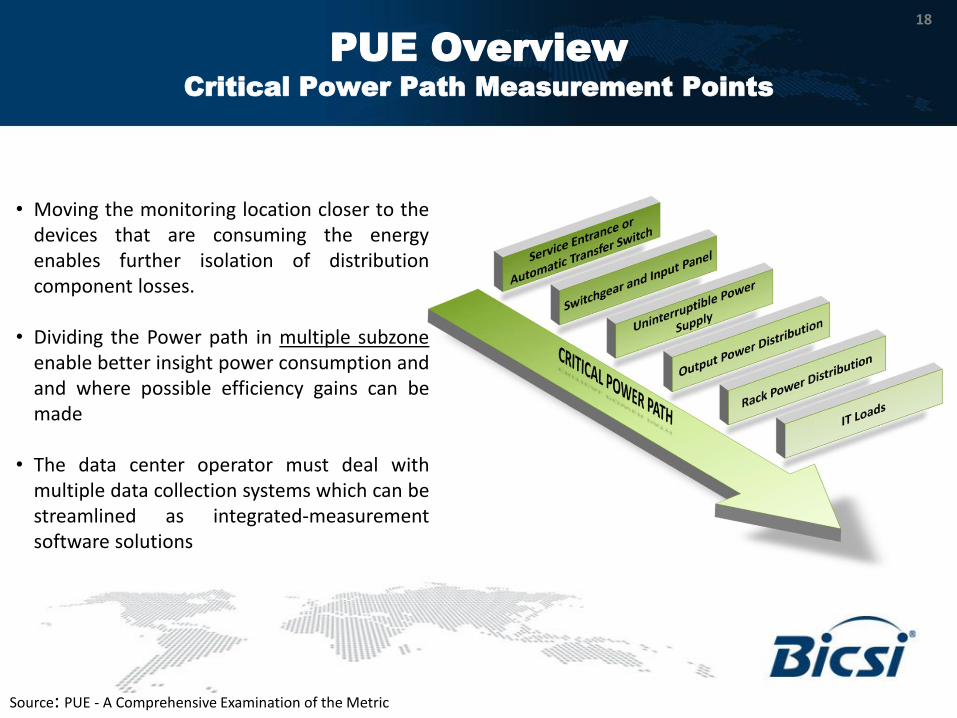
• Moving the monitoring location closer to the devices that are consuming the energy enables further isolation of distribution component losses.
• Dividing the Power path in multiple subzone enable better insight power consumption and and where possible efficiency gains can be made
• The data center operator must deal with multiple data collection systems which can be streamlined as integrated-measurement software solutions
Source: PUE - A Comprehensive Examination of the Metric
PUE Overview
Critical Power Path Measurement Points
19
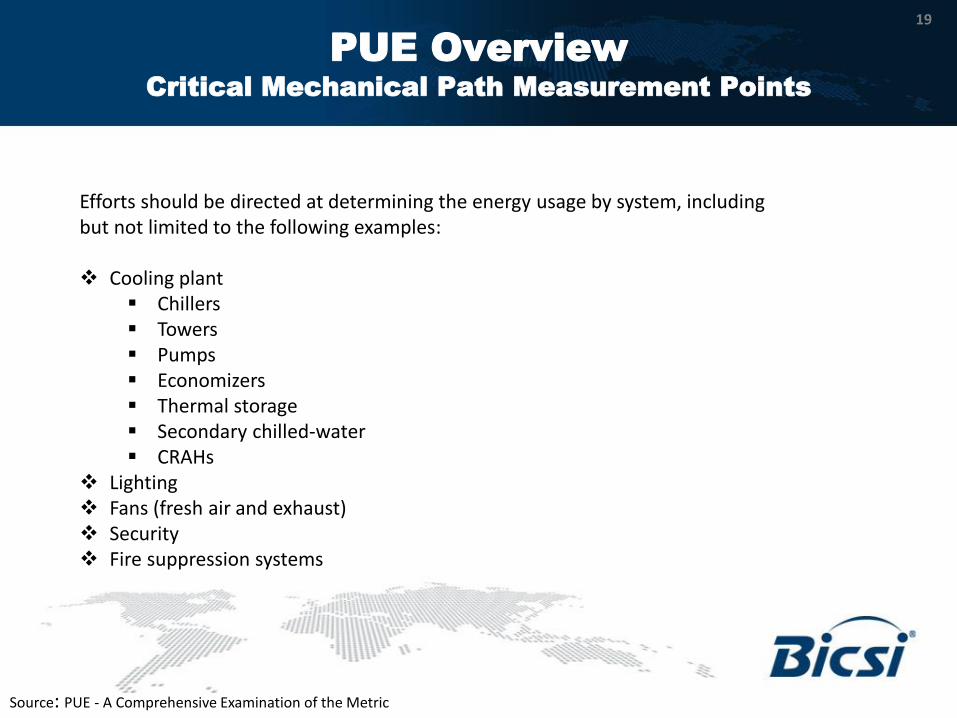
Efforts should be directed at determining the energy usage by system, including but not limited to the following examples:
Cooling plant
Chillers Towers Pumps Economizers Thermal storage Secondary chilled-water CRAHs
Lighting Fans (fresh air and exhaust) Security Fire suppression systems
Source: PUE - A Comprehensive Examination of the Metric
PUE Overview
Critical Mechanical Path Measurement Points
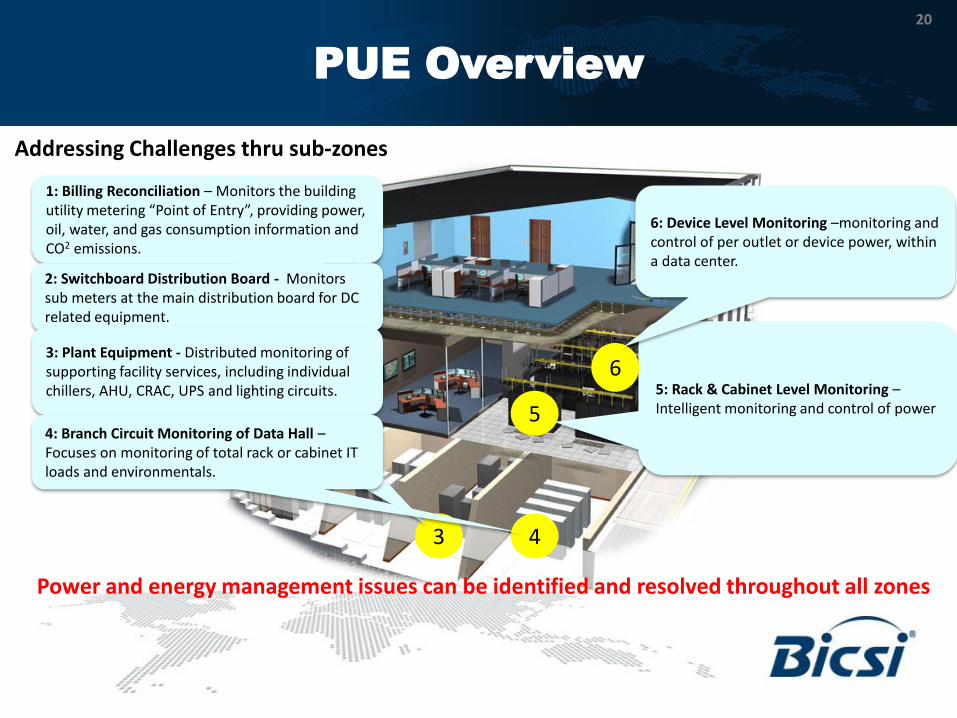
Addressing Challenges thru sub-zones
Power and energy management issues can be identified and resolved throughout all zones
20
1
1: Billing Reconciliation – Monitors the building utility metering “Point of Entry”, providing power, oil, water, and gas consumption information and CO2 emissions.
2
2: Switchboard Distribution Board - Monitors sub meters at the main distribution board for DC related equipment.
3
3: Plant Equipment - Distributed monitoring of supporting facility services, including individual chillers, AHU, CRAC, UPS and lighting circuits.
4
4: Branch Circuit Monitoring of Data Hall – Focuses on monitoring of total rack or cabinet IT loads and environmentals.
5 5: Rack & Cabinet Level Monitoring – Intelligent monitoring and control of power
6
6: Device Level Monitoring –monitoring and control of per outlet or device power, within a data center.
PUE Overview
21
3
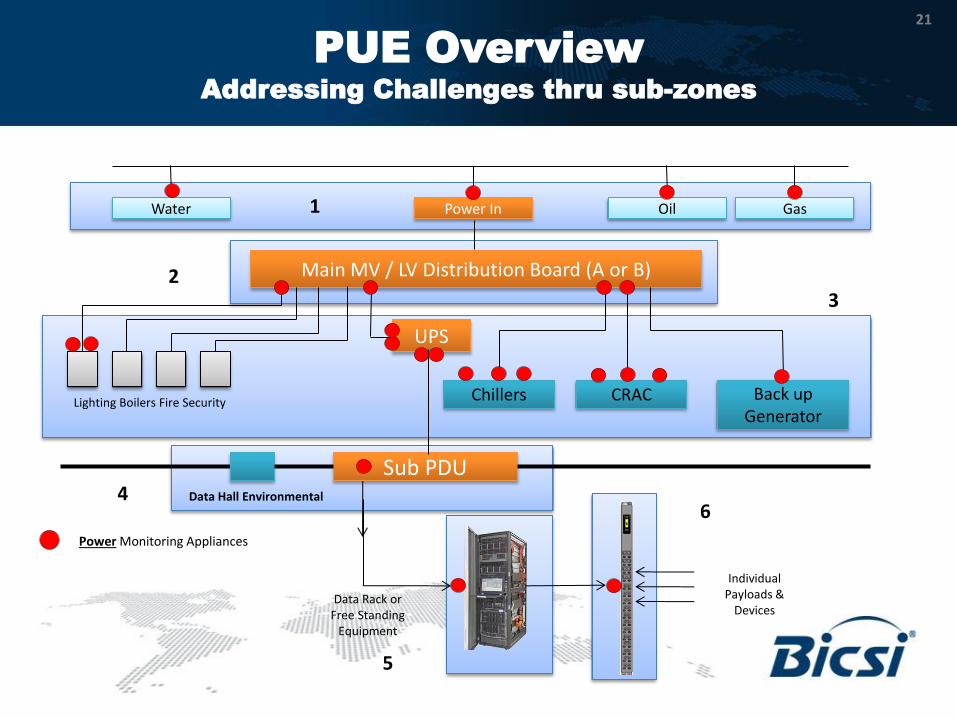
Water Power In Gas
Main MV / LV Distribution Board (A or B)
Lighting Boilers Fire Security CRAC Chillers Back up Generator
UPS
Sub PDU Data Hall Environmental
Data Rack or Free Standing
Equipment
Individual Payloads &
Devices
Power Monitoring Appliances
1
2
4
5
6
Oil
PUE Overview
Addressing Challenges thru sub-zones
22
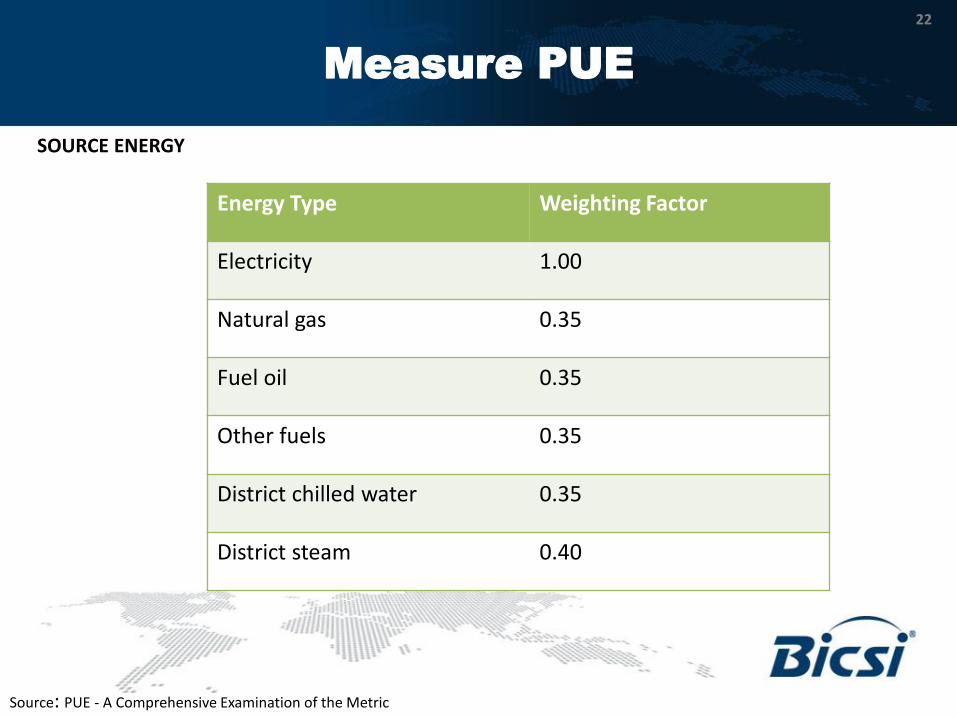
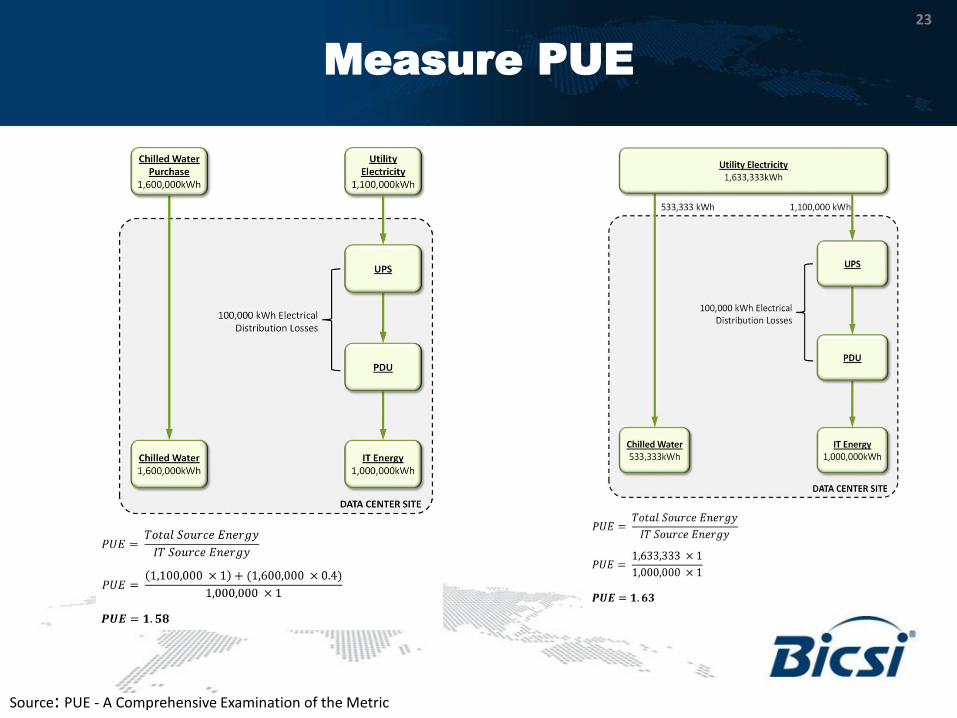
SOURCE ENERGY
Energy Type Weighting Factor
Electricity 1.00
Natural gas 0.35
Fuel oil 0.35
Other fuels 0.35
District chilled water 0.35
District steam 0.40
Source: PUE - A Comprehensive Examination of the Metric
Measure PUE
23
Measure PUE
Source: PUE - A Comprehensive Examination of the Metric
24
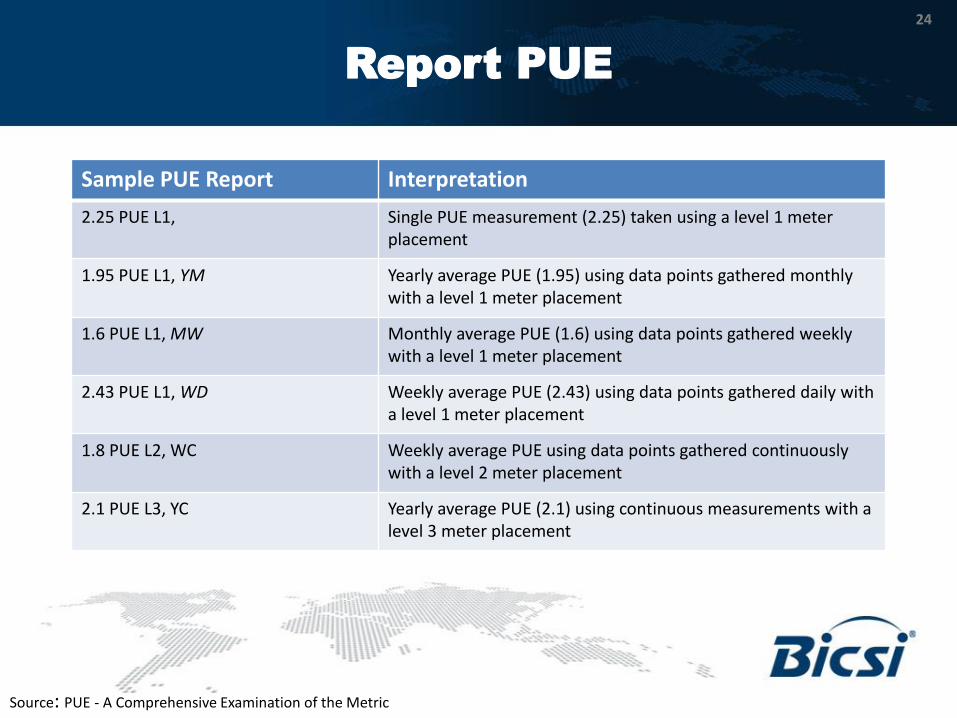
Report PUE
Source: PUE - A Comprehensive Examination of the Metric
Sample PUE Report Interpretation
2.25 PUE L1, Single PUE measurement (2.25) taken using a level 1 meter placement
1.95 PUE L1, YM Yearly average PUE (1.95) using data points gathered monthly with a level 1 meter placement
1.6 PUE L1, MW Monthly average PUE (1.6) using data points gathered weekly with a level 1 meter placement
2.43 PUE L1, WD Weekly average PUE (2.43) using data points gathered daily with a level 1 meter placement
1.8 PUE L2, WC Weekly average PUE using data points gathered continuously with a level 2 meter placement
2.1 PUE L3, YC Yearly average PUE (2.1) using continuous measurements with a level 3 meter placement
25
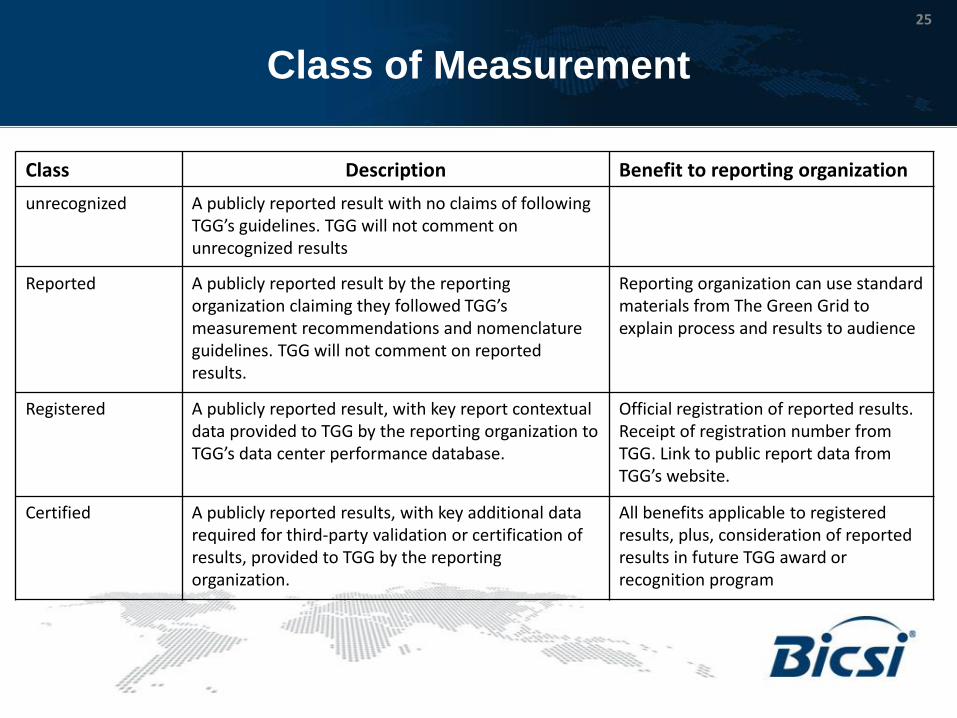
Class of Measurement
Class Description Benefit to reporting organization
unrecognized A publicly reported result with no claims of following TGG’s guidelines. TGG will not comment on unrecognized results
Reported A publicly reported result by the reporting organization claiming they followed TGG’s measurement recommendations and nomenclature guidelines. TGG will not comment on reported results.
Reporting organization can use standard materials from The Green Grid to explain process and results to audience
Registered A publicly reported result, with key report contextual data provided to TGG by the reporting organization to TGG’s data center performance database.
Official registration of reported results. Receipt of registration number from TGG. Link to public report data from TGG’s website.
Certified A publicly reported results, with key additional data required for third-party validation or certification of results, provided to TGG by the reporting organization.
All benefits applicable to registered results, plus, consideration of reported results in future TGG award or recognition program

26
Agenda:
1. Data Center Challenges
2. Power Usage Effectiveness Overview
3. Data Centre Infrastructure Management Software Requirements
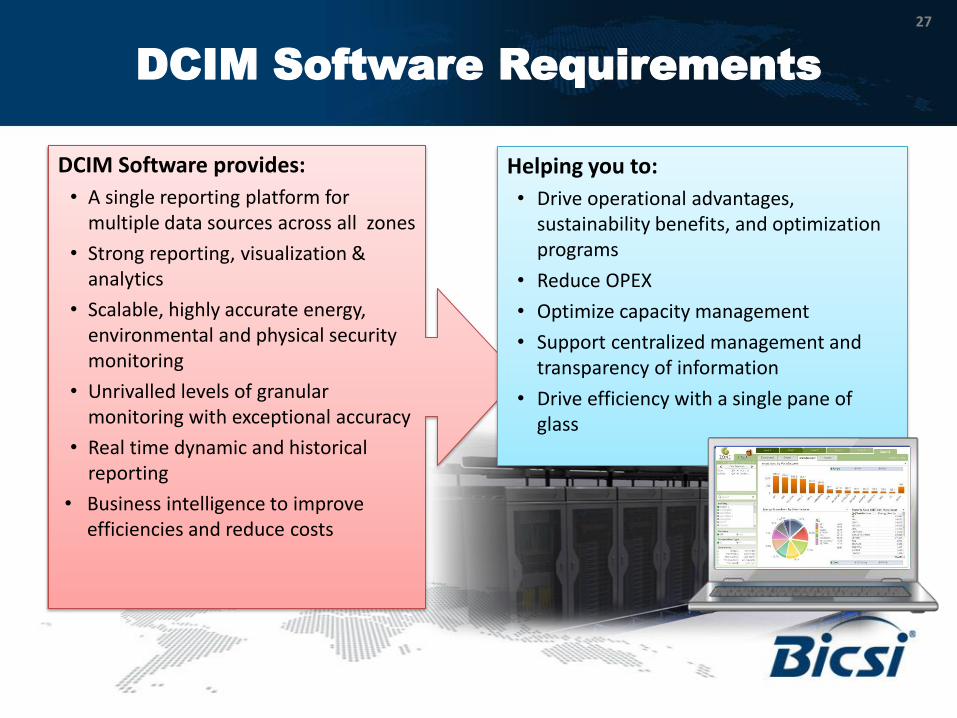
DCIM Software provides:
• A single reporting platform for multiple data sources across all zones
• Strong reporting, visualization & analytics
• Scalable, highly accurate energy, environmental and physical security monitoring
• Unrivalled levels of granular monitoring with exceptional accuracy
• Real time dynamic and historical reporting
• Business intelligence to improve efficiencies and reduce costs
27
Helping you to:
• Drive operational advantages, sustainability benefits, and optimization programs
• Reduce OPEX
• Optimize capacity management
• Support centralized management and transparency of information
• Drive efficiency with a single pane of glass
DCIM Software Requirements
• PUE is the right metric to measure the efficiency of the data centre
• DCIM is the way to eliminate risks in Data Center
operation by proactive Capacity Planning
• DCIM supports you in rightsizing your energy equation across Facility and IT
• Full featured DCIM suites supports your decision making with knowledge rather then information overload
To summarize:

building a smarter, unified business foundation
29
Related Documents


![· 2015-09-11 · pue spa(oud luewdopnep pue 140]eeseJ Kô]eua qqemeuêJ êleOS-lteWS„ pue „spe(0Jd 101!d pue 'suone]êdo Kmenqel 'luauudopnap pue 140]eeseJ epos-news, u'ôunapow](https://static.cupdf.com/doc/110x72/5eb2a5d6d419683a4856032a/2015-09-11-pue-spaoud-luewdopnep-pue-140eesej-keua-qqemeuj-leos-ltewsa.jpg)
