Understanding nutrition transition among internal rural-to- urban migrant women in Kenya Remco Pieter Johan Peters Submitted in accordance with the requirements for the degree of Doctor of Philosophy (PhD) The University of Leeds Leeds Institute of Health Sciences The Nuffield Centre for International Health and Development August, 2020

Welcome message from author
This document is posted to help you gain knowledge. Please leave a comment to let me know what you think about it! Share it to your friends and learn new things together.
Transcript
Understanding nutrition transition among internal rural-to-
urban migrant women in Kenya
Remco Pieter Johan Peters
Submitted in accordance with the requirements for the degree of
Doctor of Philosophy (PhD)
The University of Leeds
Leeds Institute of Health Sciences
The Nuffield Centre for International Health and Development
August, 2020
II
The candidate confirms that the work submitted is his own, except where work
which has formed part of jointly-authored publications has been included. The
contribution of the candidate and the other authors to this work has been explicitly
indicated below. The candidate confirms that appropriate credit has been given
within the thesis where reference has been made to the work of others.
The work in Chapter 4 of the thesis has appeared in publication as follows:
Peters, R., Amugsi, D., Mberu, B., Ensor, T., Hill, A., Newell, J., & Elsey, H.
(2019). Nutrition transition, overweight and obesity among rural-to-urban migrant
women in Kenya. Public Health Nutrition, 22(17), 3200-3210.
doi:10.1017/S1368980019001204.
I conceived and designed the study, analysed the data, interpreted the results,
wrote the first draft of the manuscript and contributed to revision of the manuscript
D.A., B.M., T.E., A.H., J.N. and H.E. contributed to study design, data
interpretation and critical revision of the manuscript.
This copy has been supplied on the understanding that it is copyright material
and that no quotation from the thesis may be published without proper
acknowledgement.
The right of Remco Pieter Johan Peters to be identified as Author of this work
has been asserted by him in accordance with the Copyright, Designs and Patents
Act 1988.
© 2020 The University of Leeds and Remco Pieter Johan Peters

III
Acknowledgements
First and foremost, I wish to express my gratitude to the study participants. Time
is precious and they have provided theirs to tell their story and share their
experiences. I have learned much from them, and I hope I can translate this
knowledge into action in the near future.
I am deeply grateful to my supervisors Dr Helen Elsey, Professor Andrew J Hill,
and Professor James Newell for their guidance, untiring support and thought-
provoking comments throughout the PhD. Your positive attitude, enthusiasm, and
wisdom were inspiring. I would also like to give my thanks to Dr Joseph Hicks.
Your supervision in the final third was invaluable. I consider myself lucky to have
had such a wonderful supervision team. I would also like to acknowledge
Professor Tim Ensor for his thoughtful suggestions on my research at the early
stages of my research.
I am thankful to the staff of both the African Population Health Research Centre
and Carolina for Kibera in Nairobi for their warm hospitality and support. I would
like to especially thank Professor Blessing Mberu and Mark Muasa for welcoming
me to APHRC and CfK respectively. I am grateful to Peterrock Muriuki and Esther
Anono who were instrumental in the smooth realisation of my research in Nairobi.
I also wish to thank APHRC’s data wizard Marylene Wamukoya who helped me
understand and work effectively with the vast amount of wonderful data APHRC
provided. I would also like to thank Faith Lang’at from Amref Health Africa for her
time, insights and assistance with the research activities in Kibera.
I am equally thankful to the research team members Judith Achieng, Sophia
Wairimu, Lucy Wairimu, Sheila Luvaha, Esther Opana and Frank Kaburia for their
devotion, flexibility and quality interviewing and planning.
I consider myself privileged to have had the opportunity to work with all of you.
Last but not least, I am grateful to my family for their infinite support and love.
IV
Abstract
Evidence suggests that urbanisation in Kenya is fueling nutrition transition
culminating in increased obesity rates among the urban poor, especially women.
Mechanisms underlying this transition are poorly understood. I therefore
examined nutrition transition among rural-to-urban migrant women to better
understand obesity in Kenya.
I employed a sequential explanatory mixed methods design. In the quantitative
phase I used individual and household secondary-data from the 2014 Kenyan
Demographic and Health Survey (n=6,171) and the 2008/2009 Nairobi Urban
Health and Demographic Surveillance System (NUHDSS) (n=5,422) to identify
characteristics associated with nutrition transition and obesity risk among migrant
women. The NUHDSS analysis informed the interview guide and sampling in
qualitative research in three Nairobi slum neighbourhoods, with 6 key informant
interviews, 7 focus groups, 28 in-depth interviews and 3 PhotoVoice groups. A
mixed-methods results synthesis led to the formulation of several key meta-
inferences.
First, both quantitative studies showed no clear differences between rural-to-
urban migrant women’s and urban non-migrants’ diets. The qualitative findings
concurred with this as migrant women, despite having mixed attitudes, perceived
their diets to be similar to those of local residents. While they appreciated
accessibility and diversity of cheap, sweet and animal-sourced food, they had
more trust in home-cooked food. Second, economic circumstances were salient
on nutrition transition. Household wealth and self-employment were positively
associated with having obesity. Wealthier migrant women, and those who sold
obesogenic foods, consumed these in larger portions either at home or pre-
prepared due to economic insecurity, time scarcity, family responsibilities and/or
convenience. Lastly, repeated exposure to obesogenic food and social pressure
to conform to community nutrition patterns drove nutrition transition irrespective
of individual deprivation.
These findings indicate the need for a local systems approach which considers
the complex interplay between economic and time insecurity, and socio-cultural
norms to address nutrition transition and obesity in slum neighbourhoods.
V
Table of Contents
Acknowledgements .................................................................................... III
Abstract ...................................................................................................... IV
Table of Contents ........................................................................................ V
List of Figures ........................................................................................... XII
List of Tables ............................................................................................ XIII
Abbreviations ............................................................................................ XV
Chapter 1 Introduction ................................................................................ 1
1.1 Background ...................................................................................... 1
1.1.1 Obesity and nutrition transition ................................................... 1
1.1.2 Food system and environment .................................................... 5
1.1.3 Socio-economic status and nutrition transition ............................ 6
1.2 Urbanisation and nutrition transition in Sub-Saharan Africa ................ 6
1.2.1 Urbanisation and slum expansion ............................................... 6
1.2.2 Rural-urban differences and socio-economic disparities for obesity and food intake ........................................................................ 7
1.3 Rural-to-urban migration, nutrition transition and obesity risk ............. 8
1.4 Sex disparities for obesity and diets .................................................. 11
1.5 Research context: Kenya and Nairobi ............................................... 12
1.5.1 Nutrition transition and obesity in Kenya ................................... 15
1.5.2 Nairobi’s urban poor .................................................................. 17
1.5.2.1 Informal food environment ................................................ 19
1.5.3 Political response ...................................................................... 20
1.5.3.1 Policies and interventions in Nairobi’s slums .................... 21
1.6 Significance of this research ............................................................. 22
1.7 Overall research aim and specific research objectives ..................... 24
1.8 Organisation of this thesis ................................................................. 24
Chapter 2 Literature review ....................................................................... 26
2.1 Literature search strategy ................................................................. 26
2.2 Behaviour and migration theories ..................................................... 27
2.2.1 Individual behavioural theories ................................................. 27
2.2.2 Socio-ecological perspective .................................................... 28
2.2.2.1 Ecological framework on eating and nutrition ................... 28
2.2.3 Migration theories ..................................................................... 29
2.2.3.1 The healthy migrant effect ................................................ 30
2.2.3.2 Life-course perspective ..................................................... 30
VI
2.2.3.3 Acculturation ..................................................................... 32
2.2.4 Food environment research ...................................................... 34
2.3 Migration and environmental influences on obesity risk and nutrition transition ......................................................................................... 36
2.3.1 Changes in socio-economic circumstances .............................. 36
2.3.1.1 Migration and food insecurity ............................................ 38
2.3.1.2 Income-generating activity and time scarcity .................... 40
2.3.2 Changes in food environment ................................................... 40
2.3.2.1 Urban food deserts and swamps ...................................... 41
2.3.3 Changes in social and cultural environments ............................ 43
2.3.3.1 Changes in social networks .............................................. 43
2.3.3.2 Social contagion and pressure .......................................... 44
2.3.3.3 Changes in body image and its linkage to diet .................. 45
2.4 Conceptual framework for this research study .................................. 47
Chapter 3 Research methodology ............................................................ 50
3.1 Research approach: mixed methods ................................................ 50
3.1.1 Sequential explanatory design .................................................. 51
3.2 Selected research methods .............................................................. 52
3.2.1 Quantitative phase of research: Secondary data analysis ........ 52
3.2.1.1 Kenyan Demographic and Health Survey (KDHS) 2014 ... 52
3.2.1.2 Nairobi Urban Health and Demographic Surveillance System (NUHDSS) 2008/2009 ................................................... 53
3.2.1.3 Data analysis .................................................................... 53
3.2.2 Qualitative phase of research ................................................... 54
3.3 Integration of data ............................................................................. 54
3.3.1 Integration at the interpretation and reporting level ................... 56
3.4 Quality criteria in mixed methods research ....................................... 56
3.4.1 Separate procedures to assess quality ..................................... 56
3.4.2 Participants’ qualitative and quantitative strands ...................... 56
3.5 Research context of quantitative and qualitative phases .................. 57
3.5.1 Nairobi slum context ................................................................. 57
Chapter 4 Nutrition transition and obesity among rural-urban migrant women in Kenya (DHS) ..................................................................... 60
4.1 Context of this analysis ..................................................................... 60
4.2 Analysis objectives ............................................................................ 61
4.3 Methods ............................................................................................ 61
4.3.1 Study population ....................................................................... 61
VII
4.3.2 Study outcomes ........................................................................ 62
4.3.3 Key independent variable ......................................................... 63
4.3.4 Socio-economic and demographic characteristics .................... 64
4.3.4.1 Measurement of independent variables ............................ 64
4.3.5 Statistical analysis ..................................................................... 66
4.3.5.1 Descriptive analysis .......................................................... 66
4.3.5.2 Bivariate analysis on associations between weight status and socio-economic and demographic characteristics among rural-to-urban migrant women ....................................... 66
4.3.5.3 Testing for multi-collinearity .............................................. 66
4.3.5.4 Ordinal regression analysis ............................................... 67
4.4 Results .............................................................................................. 69
4.4.1 Descriptive analysis .................................................................. 69
4.4.2 Obesity risk (vs overweight/normal weight) by migration status 72
4.4.3 Nutrition transition ..................................................................... 72
4.4.3.1 Rural-to-urban migrants versus rural non-migrants .......... 72
4.4.3.2 Rural-to-urban migrants versus urban non-migrants ........ 73
4.4.4 Factors associated with obesity ................................................ 77
4.5 Discussion ........................................................................................ 78
4.5.1 Nutrition transition and obesity risk per migration status ........... 78
4.5.2 Demographic and socio-economic characteristics associated with obesity risk ............................................................................ 80
4.5.3 Limitations of the analysis ......................................................... 81
4.6 Next steps ......................................................................................... 83
Chapter 5 Obesity risk and food intake among rural-to-urban migrant women in Nairobi’s slums (NUHDSS) .............................................. 84
5.1 Introduction ....................................................................................... 84
5.2 Aim of analysis .................................................................................. 85
5.3 Methods ............................................................................................ 86
5.3.1 Data sources ............................................................................. 86
5.3.1.1 Final study population ....................................................... 87
5.3.1.2 Ethical approval ................................................................ 87
5.3.2 Research population ................................................................. 87
5.3.3 Dependent variables ................................................................. 88
5.3.3.1 Weight status .................................................................... 88
5.3.3.2 Food intake ....................................................................... 88
5.3.4 Selection and measurement of rural-to-urban migrants’ characteristics ....................................................................... 89
VIII
5.3.5 Data analysis ............................................................................ 92
5.4 Results .............................................................................................. 93
5.4.1 Descriptive analysis .................................................................. 93
5.4.1.1 Outcome variables per migration status............................ 93
5.4.1.2 Descriptive analysis for outcome variables per migration status ............................................................................. 95
5.4.2 Differences between rural-to-urban migrant women and urban born women for weight status and food intake ...................... 97
5.4.3 Characteristics and behaviour associated with having obesity among rural-to-urban migrants .............................................. 98
5.4.4 Characteristics associated with red meat, sugary drink, fruit and vegetable intake in rural-to-urban migrants ......................... 101
5.4.4.1 Red meat intake .............................................................. 101
5.4.4.2 Sugary drink intake ......................................................... 103
5.4.4.3 Fruit and vegetable intake ............................................... 105
5.5 Discussion ...................................................................................... 109
5.5.1 Differences for obesity risk and food intake ............................ 109
5.5.2 Individual, household and environment characteristics associated with obesity risk and food intake ......................................... 110
5.5.2.1 Obesity risk ..................................................................... 110
5.5.2.2 Food intake ..................................................................... 112
5.5.3 Strengths and limitations of this analysis ................................ 115
5.6 Next steps and implications for the qualitative data collection ........ 116
Chapter 6 Qualitative research methods ............................................... 117
6.1 Chapter introduction ........................................................................ 117
6.2 Study sample and setting ................................................................ 117
6.3 Method selection ............................................................................. 118
6.4 Enhancing quality of qualitative findings ......................................... 120
6.4.1 Reflexivity ............................................................................... 120
6.4.2 Divergent case sampling and analysis .................................... 122
6.4.3 Member checking.................................................................... 122
6.4.4 Triangulation ........................................................................... 123
6.5 Recruitment and data collection ...................................................... 123
6.5.1 Participant recruitment ............................................................ 123
6.5.2 Locations of data collection ..................................................... 124
6.5.3 Semi-structured interview guides ............................................ 124
6.5.4 Ethical considerations ............................................................. 125
6.5.4.1 Informed consent process and withdrawal ...................... 125
IX
6.5.5 Key-informant interviews ......................................................... 126
6.5.6 Focus-group discussions ........................................................ 127
6.5.7 Individual interviews ................................................................ 129
6.5.8 PhotoVoice ............................................................................. 130
6.6 Analytical process ........................................................................... 132
6.6.1 Data management .................................................................. 132
6.6.2 Thematic analysis with framework approach .......................... 133
6.7 Reflection on techniques to maintain quality and rigour .................. 135
6.7.1 Reflexivity ............................................................................... 135
6.7.2 Divergent case analysis .......................................................... 135
6.8 Reflection on framework ................................................................. 136
Chapter 7 Qualitative findings and discussion ..................................... 138
7.1 Presentation of the findings ............................................................ 138
7.2 Findings .......................................................................................... 139
7.2.1 Characteristics of participants ................................................. 139
7.2.1.1 Rural-to-urban migrants and Nairobi-born participants ... 140
7.2.2 Key changes in dietary behaviour and food sources ............... 142
7.2.2.1 Nutrition transition ........................................................... 142
7.2.2.2 Key changes in food sources .......................................... 146
7.2.3 Changes in community food environment ........................... 147
7.2.3.1 Availability and accessibility ............................................ 147
7.2.3.2 Unhygienic community food environment ....................... 156
7.2.4 Changes in economic circumstances ...................................... 161
7.2.4.1 Unsteady income and household responsibilities ........... 161
7.2.5 Changes in socio-cultural environment ................................... 169
7.2.5.1 Integration into the village community ............................. 169
7.2.5.2 Household dynamics and food preferences .................... 175
7.2.5.3 Social support ................................................................. 180
7.2.5.4 Body size and connection with diet ................................. 181
7.2.6 Changes in information environment ...................................... 186
7.3 Discussion ...................................................................................... 190
7.3.1 Nutrition transition ................................................................... 190
7.3.2 Environment-individual interactions ........................................ 192
7.3.2.1 Changes in food environment ......................................... 192
7.3.2.2 Changes in economic circumstances and time scarcity .. 196
7.3.2.3 Integration in the village community ................................ 198
X
7.3.2.4 Nutrition and diet awareness with rural-to-urban migration .................................................................................... 202
7.3.2.5 Convenience ................................................................... 203
7.3.3 Strengths and limitations ......................................................... 204
Chapter 8 Overall discussion .................................................................. 206
8.1 Integration of findings ...................................................................... 206
8.2 Meta-inferences .............................................................................. 213
8.2.1 Nutrition transition among rural-to-urban migrant women ....... 213
8.2.2 Economic circumstances of rural-to-urban migrant women are salient in nutrition transition and obesity risk ....................... 214
8.2.3 A desire for convenience ........................................................ 217
8.2.4 Changes in diet with improved food and nutrition knowledge and awareness ........................................................................... 220
8.2.5 Potential neighbourhood effects on nutrition transition ........... 221
8.3 Generalisability and transferability of my findings ........................... 224
8.4 Reflection on my conceptual framework ......................................... 226
8.4.1 Measurement of outcomes ..................................................... 226
8.4.1.1 Obesity risk ..................................................................... 226
8.4.1.2 Dietary outcomes ............................................................ 227
8.4.2 Reflection on the socio-ecological model and body image perception ........................................................................... 229
8.4.2.1 Socio-ecological model ................................................... 229
8.4.2.2 Body image perception ................................................... 231
8.5 Methodological considerations ..................................................... 231
8.5.1 Sequential explanatory design ............................................ 231
Chapter 9 Conclusions ............................................................................ 233
9.1 Summary of key findings ................................................................. 233
9.2 Implications of the findings for policy and practice .......................... 236
9.2.1 Urban context ......................................................................... 238
9.2.1.1 City-level interventions .................................................... 238
9.2.1.2 Community-level interventions ........................................ 240
9.2.1.3 Individual and household interventions ........................... 244
9.2.2 Rural revitalisation .................................................................. 248
9.3 Contribution of my study’s findings ................................................. 249
9.4 Directions for future research .......................................................... 250
9.4.1 Longitudinal studies ................................................................ 250
9.4.2 Improvement and expansion of measurement tools ............... 251
XI
9.4.3 Research and evaluation of proposed interventions ............... 253
List of References .................................................................................... 256
Appendix A Questionnaires and interview guides ................................ 284
A.1 Pre-questionnaires ....................................................................... 284
A.2 Interview guides ........................................................................... 286
A.2.1 Key informant interview guide ............................................. 286
A.2.2 Focus group discussion guide ............................................. 288
A.2.3 In-depth interview guide ...................................................... 292
A.2.4 PhotoVoice guide ................................................................ 295
Appendix B Ethical certificates of approval .......................................... 298
B.1 University of Leeds ethical certificate of approval ......................... 298
B.2 AMREF ethical certificate of approval .......................................... 299
Appendix C Template study information and ethical form................... 300
C.1 Information sheet and consent for FGD........................................ 300
XII
List of Figures
Figure 1.1 The final three stages of the nutrition transition ............................ 2
Figure 1.2 Urbanisation trends in Kenya (1950-2050) ................................. 13
Figure 1.3. Map of Kenya representing the eight administrative provinces including the Nairobi province .............................................................. 14
Figure 2.1 Adapted version of the ecological framework depicting the multiple influences on what people eat by Story et al. (2008) ........................... 29
Figure 2.2 Conceptual framework adapted from the dietary acculturation model ............................................................................................................. 49
Figure 3.1 Visual model of the thesis research design and procedures ....... 55
Figure 3.2 A map showing the locations of the Kibera, Kiambui (neighbouring Korogocho) and Viwandani slums in Nairobi, relative to the central business district (CBD) ........................................................................ 58
Figure 5.1 Conceptual framework including individual, household and environment characteristics influencing food intake and obesity risk, adapted from Satia-Abouta et al. (2002) .............................................. 90
Figure 6.1 The process of adaptation to a new dietary pattern after migration. ........................................................................................................... 137
Figure 8.1 Conceptual view of key multilevel influences of urban slum exposure on obesogenic dietary behaviour among rural-to-urban migrant women ............................................................................................... 219
Figure 9.1 Adapted CEB framework which presents intervention targets and settings for preventing and addressing nutrition transition among rural-to-urban migrant women ........................................................................ 238
XIII
List of Tables
Table 4.1 Fifteen food groups used to define nutrition transition ................. 63
Table 4.2 Descriptive analysis of respondents' characteristics by migration status .................................................................................................. 70
Table 4.3 Descriptive analysis of household food group intake by migration status .................................................................................................. 71
Table 4.4 Multiple ordinal regression model for the associations between weight status (overweight/obesity vs normal weight) and migration status .................................................................................................. 72
Table 4.5 Multiple ordinal regression model for the associations between weekly main stables and legume intake and household migration status .................................................................................................. 74
Table 4.6 Multiple ordinal regression model for the associations between weekly fruit, vegetable intake and household migration status ........... 75
Table 4.7 Multiple ordinal regression model for the associations between weekly ASF intake and household migration status ............................ 76
Table 4.8 Multiple ordinal regression model for the associations between weekly oil, fat and butter, and sugary foods and beverages intake and household migration status ................................................................. 77
Table 4.9 Multiple ordinal regression analysis between socio-economic and demographic predictive factors and obesity (vs no-obesity) among rural-to-urban migrant women ............................................................. 78
Table 5.1 Presentation of operational definitions of the selected variables for analysis .......................................................................................... 92
Table 5.2 Descriptive analysis of weight category and dietary behaviour among rural-to-urban migrant women and women not born in rural areas ................................................................................................... 94
Table 5.3 Descriptive statistics for fruit and vegetable intake among rural-to-urban migrant women and women born in urban areas .................. 94
Table 5.4 Descriptive results of individual, household and environment characteristics stratified by rural-to-urban migrant and urban born women ................................................................................................ 96
Table 5.5 Ordinal and negative binomial regression analyses on differences in obesity risk, nutrition and diet outcomes between rural-to-urban migrant and urban born women .......................................................... 98
Table 5.6 Adjusted odds ratios from ordered logistic regression analysis of individual, household and environment characteristics associated with obesity (vs overweight or not overweight/obese) among rural-to-urban migrant women (n =1,507) .................................................................. 99
XIV
Table 5.7 Adjusted odds ratios from ordered logistic regression analysis of individual, household and environment characteristics associated with frequency of red meat (Less than monthly, weekly, daily) intake among rural-to-urban migrant women (n=1,514) ............................... 102
Table 5.8 Adjusted odds ratios from ordered logistic regression analysis of individual, household and environment characteristics associated with frequency of sugary drink intake (less than once a month/monthly/weekly or more) among rural-to-urban migrant women (n =1,514) .......................................................................................... 104
Table 5.9 Adjusted rate ratios from negative binomial regression analysis of individual, household and environment characteristics associated with weekly vegetable intake (servings/week) among rural-to-urban migrant women (n=1500) .................................................................. 107
Table 5.10 Adjusted rate ratios from negative binomial regression analysis of individual, household and environment characteristics associated with weekly fruit intake among rural-to-urban migrant women (n=1511) .......................................................................................................... 108
Table 7.1 Participant characteristics of the KI conducted in three slum communities in Nairobi, Kenya .......................................................... 139
Table 7.2 Number of research activities and participants in each slum neighbourhood .................................................................................. 140
Table 7.3 Migratory, socio-economic and demographic characteristics participants stratified per migration status ......................................... 141
Table 8.1 A joint display of the mixed methods findings ............................ 208
XV
Abbreviations
APHRC African Population Health and Research Centre
ASF Animal source foods
BMI Body mass index
CFK Carolina for Kibera
CHV Community health volunteer
CHW Community health worker
DHS Demographic and Health Survey
FGD Focus group discussion
HIC High-income countries
IDI In-depth interview
KI Key informant
LMIC Low- and middle-income countries
NCD Non-communicable disease
PHV PhotoVoice
PR Participatory research
SES Socio-economic status
SSA Sub-Saharan Africa
STEPS STEPwise approach to Surveillance
WHO World Health Organisation
1
Chapter 1 Introduction
1.1 Background
1.1.1 Obesity and nutrition transition
Obesity has become a major public health problem globally. According to the
World Health Organization (WHO), in 2016, nearly 650 million people
worldwide had obesity, about 13% of all adults worldwide (World Health
Organisation, 2020). Obesity is an important risk factor for the development
of non-communicable diseases (NCDs) such as cardiovascular disease, type
2 diabetes mellitus, musculoskeletal disorders and several cancers (World
Health Organisation, 2020). NCDs were responsible for 41 million (71%) of
the world’s 57 million deaths in 2016, with the burden being greatest in low-
and middle-income countries (LMICs) (Baker et al., 2018; World Health
Organisation, 2020). In addition to having an impact on health and mortality,
obesity also poses a significant financial burden on healthcare systems in
LMICs which are already ill-prepared to manage NCDs (Di Cesare et al.,
2013). There is a strong push to address all types of malnutrition, including
obesity and NCDs, through commitments made globally such as the
Sustainable Development Goals (SDGs), the United Nations (UN) Decade of
Action on Nutrition 2016–2025 and the Milan Global Nutrition Summit in 2017.
However, thus far, there has been insufficient progress in their reduction or
stabilisation (Development Initiatives, 2018).
A major immediate contributor to the increasing levels of obesity in LMICs is
people changing their lifestyles, most importantly, the changing of dietary
behaviour. One feature of this is nutrition transition. This transition is a
complex phenomenon as a wide array of underlying determinants contribute
to its existence on an individual, household and societal level. Globalisation
of the food distribution system, high income growth and falling food prices,
advances in technology, and urbanisation have been identified as key
underlying determinants (Popkin, 2015).
Nutrition transition is characterised by the replacement of traditional diets high
in cereals, legumes, pulses, fruits, vegetables and fibre to diets high in
saturated fat, sugar, (ultra) processed energy dense foods and edible oils
(Drewnowski and Popkin, 1997). This is parallel to a higher frequency of
eating outside of home which is found a risk factor for higher fat intake (Global
Panel on Agriculture and Food Systems for Nutrition, 2016; Popkin, 2015).
Nutrition transition consequently can lead to the individual’s energy intake
2
exceeding their energy expenditure. In this situation, positive energy balance
occurs, resulting in fat mass accumulation, weight gain and thus obesity. The
changing dietary behaviour has resulted, co-concurrent with physical
inactivity, in an increasing prevalence of obesity among LMICs (Popkin et al.,
2012).
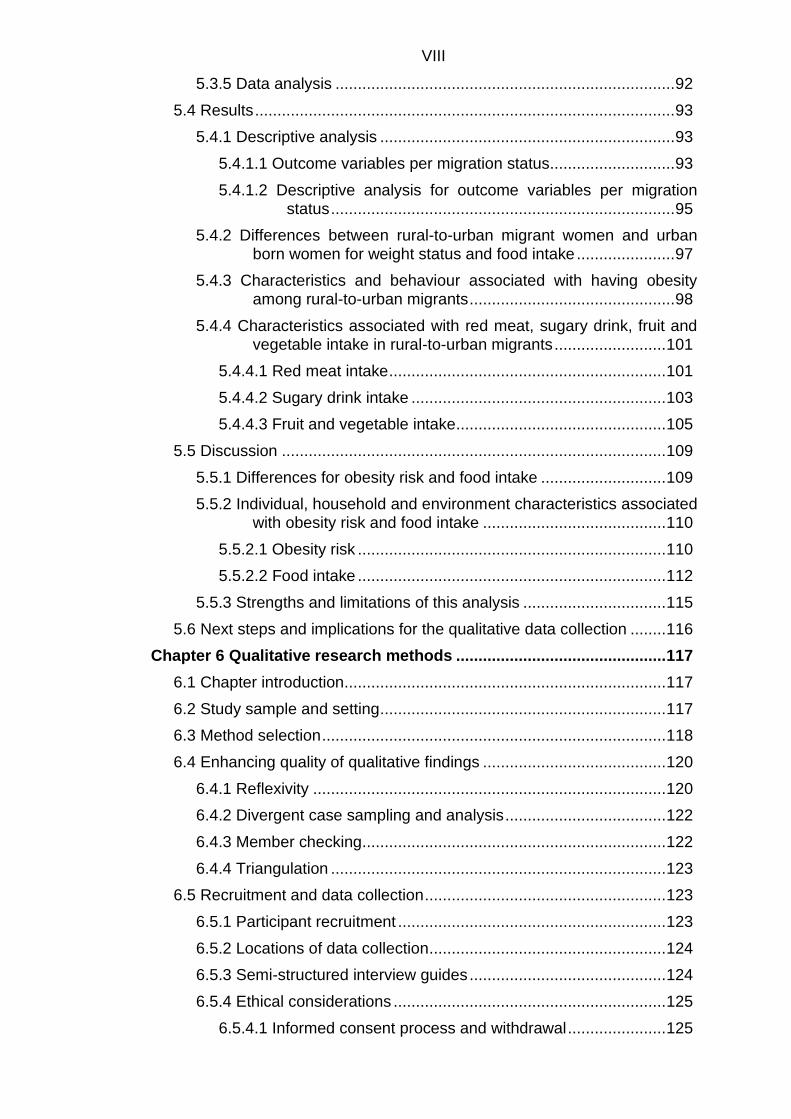
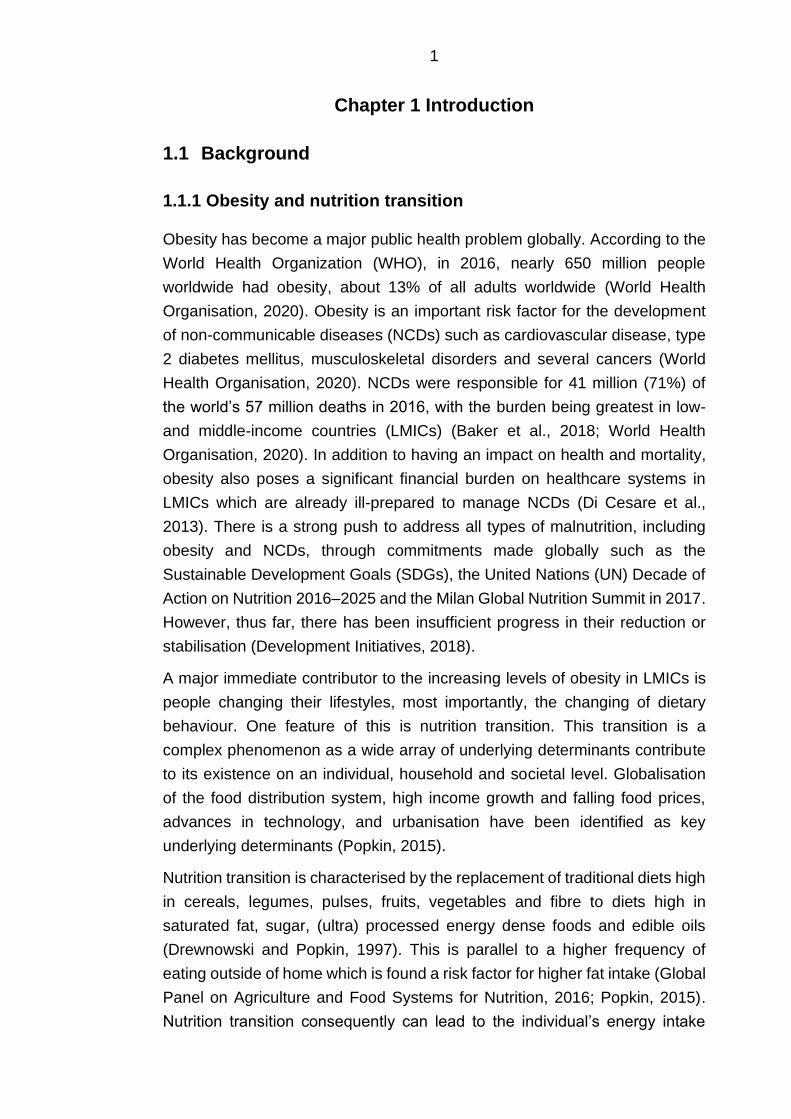
The term “nutrition transition” was first coined in the 1990s by Barry Popkin.
He describes this transition occurring in five stages (Popkin, 1993). During the
first stage (hunter-gatherer), diets are high in carbohydrates, fibre, and low in
(saturated) fat. During this stage, physical activity levels are high, and obesity
levels are low. The second stage refers to a period of famine characterised by
food scarcity and low dietary diversity. These changes reflect a shift towards
crops cultivation and keeping of livestock. The third stage reflects receding
famine. In context of more productive and technically advanced agriculture
development, carbohydrate diet content decreases, and fruit, vegetables and
protein intake increases. This goes paired with decreased physical activity
levels. The fourth stage (nutrition-related non-communicable disease) is
characterised by a diet high in fat, (ultra) processed carbohydrates and sugar,
and low in fibre. Physical activity levels are low, and obesity levels increase.
The final stage reflects behavioural change, which occurs due to a desire to
prolong health and delay or prevent degenerative diseases. The intake of
complex carbohydrates, fruit and vegetables increases, while the intake of fat,
processed foods, meat and dairy products reduces (Popkin et al., 2002).
Figure 1.1 represents the final three stages of the nutrition transition theory.
Figure 1.1 The final three stages of the nutrition transition (Popkin et al., 2002)
3
My research focusses on the changes from pattern three to pattern four. In
LMICs, many countries are arguably moving from the third pattern to the
fourth, as diets become more energy-dense and undernutrition and obesity
occurring simultaneously within communities, households and individuals
(Popkin, 2015). The co-occurrence of both under- and overnutrition is also
referred to as the double burden of malnutrition (Abdullah, 2015).
Since Barry Popkin introduced this model, its application has been widespread
in both high-income countries (HICs) and LMICs (Hawkes et al., 2015;
Kimenju and Qaim, 2016; Himmelgreen et al., 2014). This model has proven
useful to describe dietary changes in a modern area on a country level.
Furthermore, it is relatively easy to apply when there is available data on key
exposures such as income, dietary intake and technology use, and outcomes
such as obesity (Ulijaszek et al., 2012), although some argued recently that
measuring these types of exposures and outcomes is not sufficient to capture
nutrition transition (Walls et al., 2018). This model has also received critiques.
It descended from countries’ experiences which already passed through this
transition. The model is then projected on countries following a similar route.
However, it is not yet apparent whether similar endpoints of this transition are
or will be reached by other countries (Ulijaszek et al., 2012; Wade, 2003).
Furthermore, while Popkin (2002) emphasised nutrition transition is non-linear
and varies greatly for different geographic and demographic groups, the
model itself may be less applicable to understand dietary variations among
country sub-populations. In addition, there has been a lack of agreement on
the key unit of transition (country, community, individual) and level of analysis
required to understand this transition (Hawkes, 2006; Himmelgreen et al.,
2014; Ulijaszek et al., 2012).
Nutrition transition is a broad pattern. In general, it represents a shift from a
traditional diet towards a more “Westernised” diet. Some definitions include
animal source foods (ASF) due to a higher saturated fatty acid content. Others
emphasise the intake of highly processed food, and the increased intake of
sugary drinks (Steyn and McHiza, 2014). The concepts of traditional diets and
foods share similar sentiments. Traditional diet is a broad concept that is
highly sensitive to temporal, geographical and cultural factors (Oyewole and
Atinmo, 2015; Raschke and Cheema, 2008). There is limited literature which
provides a widely adopted definition of a traditional diet or traditional foods.
The European Food Information Resource Network project (EuroFIR) defined
traditional foods as practices or specifications which distinguish from other
similar products of the same category in terms of the use of “traditional
4
ingredients” (raw materials or primary products) or “traditional composition” or
“traditional type of production and/or processing” (Trichopoulou et al., 2007,
p.424). These are practices and specifications which were established prior
to the Second World War. This period was chosen as it preceded an era of
mass food production in which a large-scale introduction of technological
innovations altered food production processes (Trichopoulou, 2012;
Trichopoulou et al., 2007).
Kuhnlein et al. (2009) introduced a definition which links a traditional diet to
Indigenous people and traditional food systems. They defined the traditional
diet as a diet which consists of foods that Indigenous people have access to
locally, without having to purchase them, and within traditional knowledge and
the natural environment from farming or wild harvesting. In some
circumstances, Indigenous people may exchange some of their culturally
based traditional foods from others who are in the position to harvest these
(Kuhnlein et al., 2009).
Traditional foods in LMICs often refer to fibre-rich foods, including cereals,
legumes, roots, fruits and vegetables, but also wild animals which are un-
processed and/or home cooked (Drewnowski and Popkin, 1997; High Level
Panel of Experts on Food Security and Nutrition, 2017; Lee et al., 2002;
Raschke and Cheema, 2008). Generally, traditional diets are associated with
healthy foods and practices. However these may also be homogenous rich in
staple foods which lack dietary diversity for economic, geographic and
seasonality reasons (Ford et al., 2017; Kuhnlein and Receveur, 1996; Popkin,
2004). The above definitions and literature share the absence of (ultra-)
processed energy-dense food products.
Hence, the concepts of nutrition transition and traditional diet may not be
straightforward and may very much depend on its context as different
subgroups of people eat different food types acquired at different food
sources, sellers and stores within different food environments (Global Panel
on Agriculture and Food Systems for Nutrition, 2016; Hawkes, 2006). It is
evident that additional models, measurements and indicators are required
which allow for investigation of the complex mechanisms driving variations of
nutrition transition within countries.
In addition to the nutrition transition literature, other population-based studies
identify the described dietary patterns with energy-dense or obesogenic diets
(Romieu et al., 2017). My research focused on the specific food and
behavioural components of nutrition transition as these are considered
obesogenic. Obesogenic foods are considered as having a high energy-
5
density (i.e., an energy content of more than about 225–275 kcal per 100
gram). Street and fast foods can be considered as obesogenic foods as these
are energy-dense micronutrient-poor foods often high in saturated and trans-
fatty acids, processed starches and added sugars. Population-based studies
have shown that energy-dense diets are characterised by high intakes of fat,
sugary drinks, and low intakes of water-holding factors, such as fibre, fruit and
vegetables (Romieu et al., 2017). At the outset of my research, traditional food
was defined as food that people have access to locally, without having to
purchase them, and within traditional knowledge and the natural environment
from farming or wild harvesting (Kuhnlein et al., 2009).
1.1.2 Food system and environment
Of the many systems contributing to nutrition transition, an important role is
reserved for the food system. The food system represents the organisation of
food production, processing, distribution and intake and the contribution of its
parts to diets. The food system interplays between political, environmental,
health and social dimensions (High Level Panel of Experts on Food Security
and Nutrition, 2017). The term “food system” is sometimes referred to in
relation to a specific locality or context. However, there may also exist many
different food systems in different localities and contexts which acknowledge
the diversity of food systems (Owuor et al., 2017).
The food environment is posited to play a central role in this system as it
connects all components of the food system such as agriculture, food
distribution, food processing, formal and informal food retail sectors with the
consumer (Turner et al., 2017). Urban food environments in LMICs are
believed to be obesogenic (Popkin et al., 2012; Swinburn et al., 2011). An
environment is obesogenic if it influences or promotes obesity in individuals
or populations. This includes all surroundings, opportunities, or life conditions
that lead to obesity (Swinburn et al., 1999). It is not long since researchers
and policy makers were focusing mainly on undernutrition in rural areas
(Bloem and de Pee, 2017). An urban focus is increasingly warranted as it
appears that obesity is increasing more rapidly in urban areas and
disproportionately affecting the urban poorest (Ruel et al., 2017).
Only a small number of LMICs have however implemented policies to improve
urban food environments. By 2015, only 10% of LMICs had implemented such
policies (International Food Policy Research Institute, 2015).
6
1.1.3 Socio-economic status and nutrition transition
Socio-economic status (SES) has been argued to play an important role in
nutrition transition and increasing rates of obesity in LMICs (Dinsa et al., 2012;
Mayén et al., 2014; Neuman et al., 2013). SES is a broad term referring to the
social and economic factors that affect the position of individuals or groups
hold within society (Howe et al., 2012). HICs are proposed to be heading
towards the fifth pattern as higher SES groups undergo behavioural change
that occurs with the intention to prevent degenerative diseases. Lower SES
groups are disproportionally affected in part due to exposure to an obesogenic
food environment as it promotes high intakes of cheap and convenient energy-
dense food (Popkin et al., 2012; Swinburn et al., 2015). In HICs, deprived
areas are proposed to be situated in an environment with a higher
concentration of fast food outlets (Townshend and Lake, 2017).
Studies have long argued for a strong positive relationship between energy-
dense diets, obesity and high socioeconomic status (SES) in LMICs in
contrast to HIC (Bhurosy and Jeewon, 2014; Giskes et al., 2010; Wang et al.,
2011). However, similar patterns are now seen in LMICs as obesity shifts
towards the urban poor with changes in GDP per capita, urbanisation,
technology, food systems and other interrelated transitions (Ford et al., 2017;
Popkin et al., 2012).
1.2 Urbanisation and nutrition transition in Sub-Saharan
Africa
1.2.1 Urbanisation and slum expansion
The Sub-Saharan African (SSA) region is the last to undergo nutrition
transition. As is the case for other regions, a rapid urbanisation is one of the
key drivers of nutrition transition and obesity in SSA (Haggblade et al., 2016;
Vorster et al., 2011). This region is observed the be amongst the most rapid
as urban populations are growing by an average of 4.1% per year according
to the latest World Bank estimates (World Bank, 2020b).
While urbanisation is generally associated with increased economic
development, it also goes hand in hand with increased socio-economic
inequality and proliferation of urban slums (Ezeh et al., 2017; Zulu et al.,
2011). Around 881 million people worldwide live in slums, an increase of
almost 200 million people since 1990 (United Nations Human Settlements
7
Programme, 2016b; United Nations Human Settlements Programme, 2016a).
According to the UN, roughly 55% of urban residents in SSA resided in slum
in 2015 (World Bank, 2020a).
Currently there is no complete agreement on how to identify and define a slum.
Multiple definitions are used which differ by country (Ezeh et al., 2017). The
most widely used, by the United Nations Human Settlements Programme
(UN-Habitat), is based on households where a slum household is a group of
individuals that live under the same roof that lack one or more of the following
conditions; access to improved water, access to improved sanitation, sufficient
living space, durability of housing and secure tenure (Ezeh et al., 2017). The
Lancet series on urban slum health provide several critiques of this definition.
Most important is that a spatial construct is not included in the definition, even
though people intuitively think of slums as collections of dwellings. They opt
for slums to be viewed as spatial entities (Ezeh et al., 2017).
Spatial characteristics such as overcrowding, poor infrastructure unsuitable
for four-wheel transport, garbage accumulation due to poor or absent waste
management, and crime may affect health and social outcomes irrespective
of individual and household-level characteristics. These are however not
always negative. In contrary to poor households in non-slum neighbourhoods,
slum residents may have relatively easy access to health facilities due to the
high presence of non-governmental organisations (United Nations Human
Settlements Programme, 2016b). This is also referred to as neighbourhood
effects. The concept of neighbourhood effects refers to factors that affect
health at the community level independent of individual household level
factors, including individual household levels of poverty or deprivation (Ezeh
et al., 2017). There is ongoing work on how to best distinguish slum from non-
slum areas (Elsey et al., 2018). At the time of setting up my research, I
considered slums (UN-Habitat on households) as neighbourhoods, with an
emphasis on space, which share the characteristics as stated in the above
definition (Ezeh et al., 2017).
1.2.2 Rural-urban differences and socio-economic disparities for
obesity and food intake
Generally, there are large rural-urban differences for diet and health outcomes
in SSA countries, with urban populations tending to have higher intakes of fat,
sugar, and ASF and obesity rates than their rural counterparts (Agyemang et
al., 2016; Steyn and McHiza, 2014; Tschirley et al., 2015).
8
In addition to differences in food environments, infrastructure, transportation
and physical activity, socio-economic differences play an important role in
rural-urban differences for diet and obesity (Ford et al., 2017; Madise and
Letamo, 2017; Neuman et al., 2013; Steyn and McHiza, 2014). Studies which
analysed SSA demographic health surveys (DHS) showed that while the
mean BMI is generally higher in urban areas, the size of the association
between urban residence and unhealthy weight outcomes substantially
reduced after controlling for SES (household assets) in comparison with rural
areas (Madise and Letamo, 2017; Neuman et al., 2013).
There is also much variation for food intake and obesity within SSA cities due
to socio-economic disparities (Battersby and Crush, 2014; Neuman et al.,
2013). SSA literature observed obesity to increase with SES, though obesity
is also prevalent among the poorer segments of the urban population as they
reside in obesogenic environments where they exposed to energy-dense food
options (Ruel et al., 2008; Tschirley et al., 2015). Adult overweight and obesity
is also prevalent in urban slums, even though food insecurity is high (Ezeh et
al., 2017). A study in India by Gaur et al. (2013) has shown that the slum areas
of Indian megacities have almost equal proportions of underweight and
overweight women (23% and 24%, respectively). Other studies show similar
findings with obesity levels at 19.8% of women in an Indian slum and 17% of
women in a Brazilian slum (Alves et al., 2011; Anuradha et al., 2011). In SSA,
data on obesity epidemiology in the slum context predominantly originates
from cross-sectional studies in Kenya and South Africa. A cross-sectional
study in Nairobi slums observed 24.2% and 10.4% of 2156 women to be
overweight and have obesity respectively in 2008/2009 (Dominguez-Salas et
al., 2016; Joshi et al., 2014; Kimani-Murage et al., 2015b).
1.3 Rural-to-urban migration, nutrition transition and obesity
risk
Urbanisation in SSA is primarily the outcome of internal (net) migration from
rural to urban areas (Tacoli et al., 2015). Internal migration refers to the
“movement of people from one area of a country to another for the purpose or
with the effect of establishing a new residence” which may be temporary or
permanent (International Organization for Migration, 2011, p.51). Generally,
this type of movement is fuelled by larger rates of population growth, improved
infrastructure, transportation and services, people seeking to replace farming
for income-generating activities, education opportunities and the social
9
excitement of the city (Mberu, 2016). Other so-called push (supply) factors
such as famine, environment degradation, ethnic violence and displacement
due to developmental projects (e.g. construction of dams), and pull (demand)
factors such as an existing social network and economic opportunities in the
city have been identified to fuel this type of movement (Ezeh et al., 2017;
Mberu, 2016).
The present evidence suggests urban environments in SSA to be obesogenic
in comparison to their rural counterparts. Hence, it can be assumed that
people are prone to experience nutrition transition and weight gain with rural-
to-urban migration (Steyn and McHiza, 2014). Indeed, internal rural-to-urban
migration studies in LMICs observed the adoption of ASF, an energy-dense
diet that is high in fat and low in dietary fibre dietary with increased risk of
overweight and obesity, but also an increase in fruit and vegetables intake
(Bernabe-Ortiz et al., 2010; Bowen et al., 2011; Carrillo-Larco et al., 2015;
Ebrahim et al., 2010; Hernández et al., 2012; Oyebode et al., 2015; Torun et
al., 2002; Varadharajan et al., 2013). This may occur rapidly. For example,
Kinra et al. (2011) showed that the change in adiposity was strongest in the
first decade of urban life and then appeared to level off. A potential explanation
for this is that rural-to-urban migrants adopt an obesogenic diet rapidly after
migration.
Similar observations were made in SSA countries for both BMI, nutrient and
food intake (de Brauw et al., 2017; Sobngwi et al., 2004; Unwin et al., 2010).
A study in Cameroon assessed the association between lifetime exposure to
urban environment and BMI. They observed that subjects who recently settled
in a city (less than two years) had a higher mean BMI than rural dwellers with
less than two years exposure to an urban environment (Sobngwi et al., 2004).
Bourne et al. (2002) examined dietary intake of black adults (N=649) residing
in Cape Town. With increased time lived in the city (having moved from rural
areas), carbohydrate intake decreased from 61.4% of energy intake to 52.8%
of energy intake, while fat intake increased from 23.8% to 31.8%. Their dietary
fibre intake also decreased from 20.7 to 16.7 grams (Bourne et al., 2002).
More recent longitudinal rural-to-urban migration studies in Tanzania and
Ethiopia illustrated nuances in nutrition transition. Rural-to-urban migrants in
Tanzania reported increases in red meat and soft drink in the year following
migration. Interestingly, fruit and vegetable also increased significantly (Unwin
et al., 2010). In Ethiopia, researchers only recorded ASF intake among rural-
to-urban migrants and compared this with non-migrants. They observed a
10
significantly higher intake of ASF among rural-to-urban migrants (de Brauw et
al., 2017).
While migration from rural-to-urban areas in SSA is consistently associated
with key aspects of nutrition transition, there is less certainty concerning
migration to urban slums. Rural migration to urban slums may lead to
detrimental health and lifestyle outcomes. Urban slum dwellers do worse in
terms of health outcomes in comparison to their rural and urban counterparts
which could be caused in part due to neighbourhood effects (Ezeh et al., 2017;
Mberu and Mutua, 2015). Hence, it can be safely assumed that migration to
the urban slums may be precarious in terms of nutrition and dietary outcomes.
This may be especially true for those who remain in slums and who get stuck
into so-called (spatial) poverty traps from which escape is difficult (Allen and
Sachs, 2012; Grant, 2010; Marx et al., 2013).
Previous studies have shown the health outcomes of slum residents to be
worse than their rural and urban counterparts (Mberu and Mutua, 2015).
Evidence from Peru showed a positive correlation between duration of
residence and obesity in peri-urban slum settings (Antiporta et al., 2016). Peri-
urban areas represent the physical expansion of metropolitan regions, as
cities extend to rural areas. These areas are often a result of urban poverty
and a lack of urban planning (Goodfellow, 2013; Tacoli, 2003). Rural-to-urban
migrants had a 12% higher prevalence with each increase in 10-year unit of
residence. The suggested explanation for a significant increase in body-mass
index (BMI) after migration was the adoption of an obesogenic lifestyle
(reduced physical activity and energy-dense diets). The authors argue that
migration factors such as low birthweight and/or child malnutrition in the rural
area further predispose adults to overweight and obesity after energy-dense
food intake (Antiporta et al., 2016).
Only one identified study in India has looked at the diet of rural-urban slum
migrants. Here, they did observe a greater intake of a high fat energy-derived
diet with low dietary fibre intake after rural-to-urban migration. There was also
increased dietary diversity and intake of ASF (Misra et al., 2001). One
comparative study in India measured differences between rural, urban and
slum areas for BMI and food intake (Yadav and Krishnan, 2008). They showed
women residing in slums had a higher mean BMI than women in rural areas.
A larger percentage of women used saturated fat as a main medium for
cooking. Women in urban slums also had a higher mean number of servings
of fruits and/or vegetables per day and there was a smaller number of women
with no intake of fruits or vegetables in comparison with rural women. Urban
11
slum health is a topic that has been gaining more recognition over the years.
While an increasing body of literature indicates obesity to be highly prevalent
in a slum context, its underlying drivers are however not fully understood
(Ezeh et al., 2017; Lilford et al., 2017).
1.4 Sex disparities for obesity and diets
The impact of urbanisation seems to also disproportionally affect women in
terms of both obesity and diet. The levels of obesity and energy-dense diets
are consistently higher among women in SSA across the socio-economic
spectrum (Agyemang et al., 2016; Ouedraogo et al., 2008; Unwin et al., 2010).
A range of economic, social and cultural influences have been proposed to
drive this disparity globally (Wells et al., 2012). A longitudinal study done in
the United States (US) found that food insecure mothers are more likely than
child-free men and women and food insecure fathers to be overweight or
obese and to gain more weight over 4 years. The risks are greater for single
mothers relative to mothers in married or cohabiting relationships (Martin and
Lippert, 2012).
Rural-to-urban migrant women may have advantages over their rural
counterparts in terms of gender inequality, especially in slums, as a greater
proportion of women are working outside the home. A 2013 urban health
survey in Bangladesh which interviewed 14,806 households identified that
one in three women in urban slums worked full time as compared to one in six
in non-slum areas which is often out of economic need. Slums in this survey
were measured as settlements with a minimum of 10 households which have
a very high population density/crowding, predominantly poor housing
conditions, poor water and sewerage conditions, and finally poor and very
poor socioeconomic conditions (National Institute of Population Research and
Training et al., 2015).
A range of gender inequalities may persist with rural-to-urban migration as
there are unequal opportunities in the labour market for women. Often women
get involved in the informal economy, which is characterised by long and
irregular working hours, and are paid less which may affect energy balance
behaviours such as food choice and physical activity (Tacoli, 2013). In many
societies, women act as primary caregivers. They decide on the household’s
diet and, especially in context of food insecurity, they may not nourish
themselves adequately enough (Allen and Sachs, 2012).
12
Other mechanisms which may explain sex disparities for obesity and are not
necessarily directly related to dietary behaviour are the existing socio-cultural
beliefs and values around physical activity and body image (BeLue et al.,
2009; Micklesfield et al., 2013). However, whether this is a reason for sex
differences within obesity is less clear. Other SSA non-migrant qualitative and
quantitative literature has found that heavier men were seen to be well-fed by
their wives or perceived as imposing and having authority (Kiawi et al., 2006;
Puoane et al., 2006).
1.5 Research context: Kenya and Nairobi
My research focuses on Kenya, a lower middle-income country in Eastern
Africa, as the research context. Kenya illustrates the current challenges of
rapid urbanisation, increased rates of obesity, and diet related NCDs
(Raschke and Cheema, 2008; Steyn et al., 2011b).
Kenya has an estimated total population of 41.8 million inhabitants. Kenya’s
population more than tripled from 10.9 million in 1969 to 38.6 million in 2009
and is projected to reach 65.9 million in 2030. In 2009, Kenya had an urban
population growth rate of 4.3% annually. Around 19% of Kenya’s residents
were living in urban areas in 2000, increasing to 31% in 2010 (International
Organization for Migration, 2015). The proportion of the urban population is
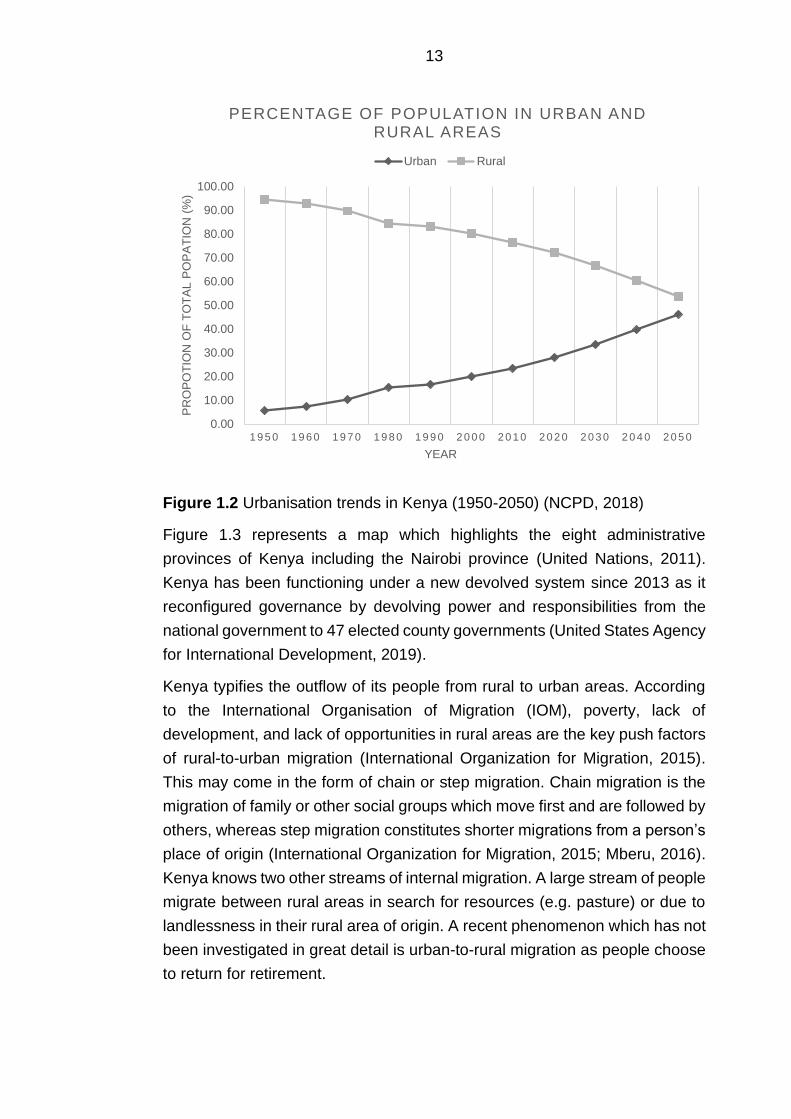
projected to reach nearly 46% by 2030 (NCPD, 2018). Figure 1.2 presents the
projected urbanisation trends in Kenya. The proportion points from 2010
onward represent projections (NCPD, 2018).
Nairobi is Kenya’s capital or primate city1 and national economic hub. Nairobi
has been rapidly urbanising; it has seen its population grow from 120,000 in
1948 to 3,138,369 in 2009. The annual growth rate was about 5% between
1989 and 1999, and 4% during the decade of 1999-2009. By 2025, the
population is expected to be 6.2 million and approximately 10 million by 2038
(Kenya National Bureau of Statistics, 2010). The second largest city is
Mombasa with 1.2 million residents in 2018 and can be classified as a
secondary city. Other urban areas, also considered secondary towns, are
small and count less than 500,000 residents. Kenya is projected to have seven
urban settlements with a total more than 500,000 residents in 2030
(International Organization for Migration, 2015; NCPD, 2018).
1 Largest city in the country (often the capital) (Bloem & de Pee, 2017)
13
Figure 1.2 Urbanisation trends in Kenya (1950-2050) (NCPD, 2018)
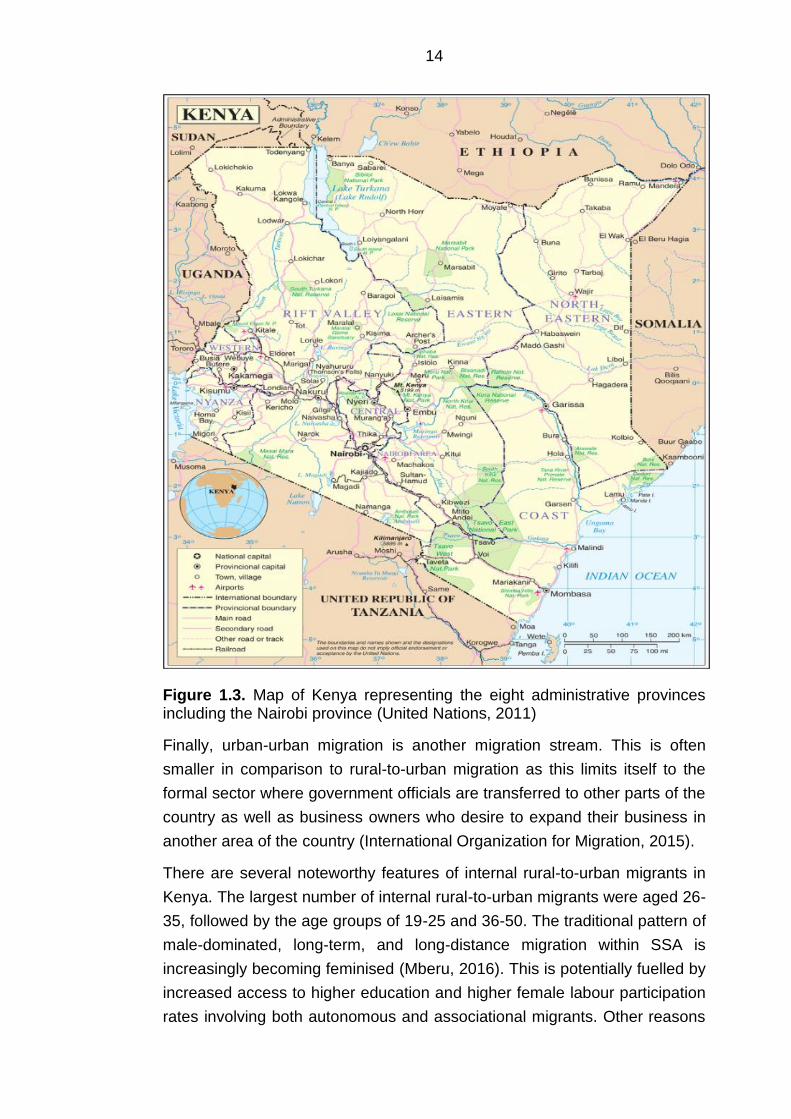
Figure 1.3 represents a map which highlights the eight administrative
provinces of Kenya including the Nairobi province (United Nations, 2011).
Kenya has been functioning under a new devolved system since 2013 as it
reconfigured governance by devolving power and responsibilities from the
national government to 47 elected county governments (United States Agency
for International Development, 2019).
Kenya typifies the outflow of its people from rural to urban areas. According
to the International Organisation of Migration (IOM), poverty, lack of
development, and lack of opportunities in rural areas are the key push factors
of rural-to-urban migration (International Organization for Migration, 2015).
This may come in the form of chain or step migration. Chain migration is the
migration of family or other social groups which move first and are followed by
others, whereas step migration constitutes shorter migrations from a person’s
place of origin (International Organization for Migration, 2015; Mberu, 2016).
Kenya knows two other streams of internal migration. A large stream of people
migrate between rural areas in search for resources (e.g. pasture) or due to
landlessness in their rural area of origin. A recent phenomenon which has not
been investigated in great detail is urban-to-rural migration as people choose
to return for retirement.
0.00
10.00
20.00
30.00
40.00
50.00
60.00
70.00
80.00
90.00
100.00
1 9 5 0 1 9 6 0 1 9 7 0 1 9 8 0 1 9 9 0 2 0 0 0 2 0 1 0 2 0 2 0 2 0 3 0 2 0 4 0 2 0 5 0
PR
OP
OT
ION
OF
TO
TA
L P
OP
AT
ION
(%
)
YEAR
PERCENTAGE OF POPULATION IN URBAN AND RURAL AREAS
Urban Rural
14
Figure 1.3. Map of Kenya representing the eight administrative provinces including the Nairobi province (United Nations, 2011)
Finally, urban-urban migration is another migration stream. This is often
smaller in comparison to rural-to-urban migration as this limits itself to the
formal sector where government officials are transferred to other parts of the
country as well as business owners who desire to expand their business in
another area of the country (International Organization for Migration, 2015).
There are several noteworthy features of internal rural-to-urban migrants in
Kenya. The largest number of internal rural-to-urban migrants were aged 26-
35, followed by the age groups of 19-25 and 36-50. The traditional pattern of
male-dominated, long-term, and long-distance migration within SSA is
increasingly becoming feminised (Mberu, 2016). This is potentially fuelled by
increased access to higher education and higher female labour participation
rates involving both autonomous and associational migrants. Other reasons
15
may be to reduce the absolute dependence on agriculture and looking for new
opportunities as a response to a failed marriage, in which a divorce is not
possible (Mberu, 2016). There is an increasing importance of the rural-to-
urban migration of females in SSA countries (Mberu et al., 2017). In Kenya
most of the migrants have previously been males, a pattern that traces back
to the colonial times. However, the gender distribution is more balanced now,
a fact reflected in the male-to-female ratio, which has been reducing from one
generation to the next. For example, a larger proportion of women (53%)
migrated to Nairobi in comparison with men (47%) in 2009 (International
Organization for Migration, 2015). This may be partly driven due to land
inequality in Kenya which has led to an increased probability of both young
men and women choosing rural-to-rural and rural-to-urban migration to find
better economic opportunities (Oyvat and wa Gĩthĩnji, 2019). Many of the
migrants are young adults, usually migrating after secondary school. A
majority of them do so due to vocational or higher education reasons. Around
73.6% of recent migrants have never been married, and the majority have
completed primary school or higher levels of education (Kenya National
Bureau of Statistics, 2010).
1.5.1 Nutrition transition and obesity in Kenya
Nutrition transition in Kenya is well underway and is paired with increasing
rates of obesity, mainly in its urban areas (Raschke and Cheema, 2008; Steyn
et al., 2011b). According to the WHO, in 2016, 33% of adult women in Kenya
were overweight, and 11% had obesity, against 15% and 3% of adult men.
The Kenyan Demographic Health Surveys (KDHS) have shown an increase
in obesity among women, with 7.1% of adult women having obesity in
2008/2009 and 10.1% in 2014 (ICF, 2012). Furthermore, the KDHS showed
higher obesity prevalence in urban areas (14.7%), in comparison with rural
areas (7.0%) (Kenya National Bureau of Statistics et al., 2015).
Diet and food habits in Kenya and wider Eastern Africa have undergone
significant changes over time (Raschke and Cheema, 2008). The earliest food
crops derived from agriculture in East Africa included sorghum, finger and
pearl millets, hyacinth (lablab) beans, bambara groundnuts, bottle gourds,
cowpeas and yams. East African communities also have a long history of
using wild green leafy vegetables such as amaranth which complemented the
starchy staples (Chweya and Eyzaguirre, 1999; Raschke and Cheema, 2008).
In the 14th century, dietary habits started to shift strongly. Through trade with
16
Asia, East African farmers acquired a number of crops, such as plantain,
banana, cocoyam, coconut and sugar cane, which were rapidly assimilated.
In addition, trade with Colombia led to the introduction of ecologically
sustainable staple crops from the Latin American region. These included
maize, rice, peanut (groundnut), tomato, sweet potato, English potato, kidney
bean, pumpkin, cassava (manioc), European cabbage and kale (Sumuka wiki)
and led to reduced utilisation of nutrient dense indigenous crops including
varieties of millet and sorghum (Raschke and Cheema, 2008).
In the 19th century, commodities such as East African grown staple crops were
exported to the global North due to the influence of colonial powers such as
Portugal and Great Britain. Parallel to this, cash-crop agriculture was
introduced and intensified which led to the production of coffee, copra, cotton,
sesame, peanuts and sugar in the Eastern African region which were also
mainly grown for exportation (Raschke and Cheema, 2008).
Since the early 1990s, macroeconomic trade policy reforms further displaced
indigenous crops (e.g. millets, pulses and starchy roots) and import of other
crops such as wheat and rice, and edible vegetable oils rose sharply in Kenya
and wider Eastern Africa. Both processed foods and edible vegetable oils
became widely available in urban areas as global fast food companies and
comparable organisations settled and expanded (Raschke and Cheema,
2008; Tschirley et al., 2015).
Rural and urban food and nutrient intake patterns in Kenya are still observed
to be very different. Steyn et al. conducted a dietary survey with 1008 women
in a nationally representative sample where they observed that women in the
urban areas (7049 kilojoules (kJ)) had the highest mean energy intake. Total
fat intake was 34.5% of energy intake in urban areas and 29.7% energy intake
in rural areas (Steyn et al., 2011b). Modest differences have been observed
for fruit and vegetable intake, though with a higher intake in urban areas,
especially compared to other SSA countries (Ruel et al., 2005).
Whereas in Kenya’s urban residents are mainly dependent on food
purchases, in the rural areas people generally depend on their own production
for food. Most ethnic groups depend on starchy staple foods such as maize,
sorghum and millet which are often complemented with vegetables,
tubers/legumes, fish, milk and poultry. There are however within country
differences for staple and complementary foods due to the heterogenic land
area and differing agricultural potential. For example, the North Eastern
province is largely inhabited by pastoralist groups whose dependency lies on
milk and other ASF, whereas groups Western Kenya liver close to the lakes
17
which have fish as their staple food (Hansen et al., 2011; Kuhnlein et al., 2009;
Oduol, 1986).
People in rural areas of Kenya may also depend on food purchases. This
could be from their neighbours such as milk, eggs and vegetables, nearby
kiosks in villages and trading centres. Kiosks sell few commodities such as
sugar, vegetable fat, cereal flours, locally fried-foods such as mandazi (fried
doughnut) which are prepared at nearby trading centres. Sporadically, kiosks
also sell international brands such as sodas and margarine. Generally,
commodities from kiosks are more expensive (in monetary terms) compared
to nearby urban areas. The trading centres have a greater variety of (energy-
dense) food products and beverages as they have wet markets, butcheries
and restaurants (including mini-fast food joints) depending on the road
conditions and proximity to adjacent towns and/or production areas. Still, the
variety is limited in comparison with the retail sector in urban areas (Eriksen
et al., 2005; High Level Panel of Experts on Food Security and Nutrition, 2017;
Rischke et al., 2015).
1.5.2 Nairobi’s urban poor
Most of my research focuses on Nairobi. Nairobi is an ethnically diverse city
where all of Kenya’s major ethnic groups reside, including Kikuyu, Luo, Luhya
and Kamba (Kenya National Bureau of Statistics et al., 2015). Nairobi
exemplifies the current challenges of rapid urbanisation and increased rural-
to-urban migration as this is paired with a large expansion of urban slums and
the associated array of urban health and poverty problems. Spread over 200
settlements, there are approximately 2.5 million slum dwellers (around 60% of
the city population) in Nairobi (African Population and Health Research
Centre, 2014). Slum populations are highly mobile, which is characterised by
the high rates of in-and out-migration. People move in between slums and
back and forth to rural areas. However, a large proportion of people eventually
settle in slums or stay there for a substantial amount of time (>10 years)
(Beguy et al., 2010; Zulu et al., 2011).
Recent research in Nairobi shows that half of residents in urban slums are
severely food-insecure and 35% are mildly/moderately food-secure, leaving
only 15% as food secure (based on the household food insecurity access
scale) (Kimani-Murage et al., 2014). Even though approximately one in five
households in Nairobi’s slums are observed to be food secure, high rates of
overweight and obesity are observed (Dominguez-Salas et al., 2016; Ettarh
18
et al., 2013; Joshi et al., 2014; Kimani-Murage et al., 2015b). Sex differences
for obesity among the urban poorest were noted. For example, in one cross-
sectional study a total of 5190 adults from two of Nairobi’s slums had their
height and weight measured and BMI calculated (Korogocho, Viwandani).
Female participants had significantly higher proportions of overweight (24.2%)
and obesity (10.4%) compared to male participants of whom 11.5% were
overweight and 1.4% had obesity (Kimani-Murage et al., 2015b). A population-
based household survey in Kibera, a large informal settlement in Nairobi,
which used the WHO instrument for stepwise surveillance (STEPS) of chronic
disease risk factors found sex differences as well. Out of 2061 enrolled adults,
most males had a normal BMI and waist circumference, whereas a third of
females were measured to be overweight or have obesity. Roughly 40% of
measured women had central obesity (Joshi et al., 2014).
In Nairobi, food intake patterns vary considerably by income. The lower-
income households were less likely to consume meat and dairy products
(Owuor et al., 2017). Another study based on 2005–06 Kenyan household
survey data observed that households in the highest income quintile
consumed annually nearly three times more of beef, chicken and eggs (46 kg
per capita) as the households in the lowest quintile (16 kg per capita)
(Cornelsen et al., 2016).
A wide range of food sources in the formal food environment are visited by
Nairobi’s households. A recent Nairobi city level household survey found that
the most frequently visited shops within neighbourhood were: small shops
(82% of respondents), kiosks (69%) and supermarkets (79%) (Owuor, 2018).
Supermarkets are emerging as key food system actors which progressively
by-pass smallholder farmers and traditional markets to obtain their food
supplies. The number of supermarkets in Kenya owned by the five largest
chains increased from less than 10 in 1991 to over 60 in 2003 (Neven and
Reardon, 2004). However, supermarkets (and greengrocers) tend to be
mainly visited by higher-income groups. Enclosed and open-air markets
across the city run by the Nairobi City Council were patronised by 51% of the
households and visited at least once a week by the survey’s respondents to
acquire food in bulk (Owuor, 2018).
19
1.5.2.1 Informal food environment
Women in Nairobi’s slums rely predominantly on purchasing their food and
are mainly active in an informal food environment. The informal environment
largely consists of traditional informal markets (informal, wholesale or wet
markets2), street food vendors, kiosks and hotels (restaurants) (Owuor et al.,
2017). A survey of 660 vendors in three slums (including Kibera) observed
that 42% were selling fruit and vegetables, 34% were selling prepared food
such as githeri (maize mixed with beans), chips, rice, chapatti (flatbread) or
mandazi (fried doughnuts), 12% meat products and only 7% uncooked food
such as sweet potatoes, arrow root or cereals (Ahmed et al., 2015).
Very few people are in the position to continue performing agriculture,
particularly in slum areas. Land availability is an important constraining factor.
A response to this is sack gardening. Sack gardening allows people to grow
food within a limited space by planting crops into both the top and sides of the
sack. Sack gardening has been spread greatly since 2008 due to the
availability of free seedlings and technical advice from Solidarite’s Farmers, a
NGO. This was not accessible to all however as costly inputs such as
fertilisers and water had to be purchased. One study investigated urban sack
gardening initiatives in Kibera. While this did not have any effect on food
security through dietary diversity, the authors did find that farmers had other
benefits such as a higher social capital and consumed a wider variety of leafy
green vegetables intake, including traditional/indigenous vegetables (Gallaher
et al., 2013).
In 2013-2014, a study of 205 low-income households in Korogocho (slum) and
Dagoretti North (low-income neighbourhood) observed that around 29% of
households kept livestock. This however decreased with lower income and
was less than half in Korogocho in comparison with Dagoretti (Dominguez-
Salas et al., 2016). In Korogocho, only 22.9% owned livestock against 53% of
households in Dagoretti. The most commonly kept livestock by households
were poultry (22.9%) which do not take much space. Of the households that
reported having one or more livestock species, 61.6 % reported to have
animals mainly for subsistence, 53.3 % reported to have species which were
mainly for selling, 13.3 % had horses, donkeys or cattle for the purpose of
2 Markets that are typically covered or open and run by local or municipal authorities. These markets consist of tens to hundreds of small kiosks, tables or spaces on the floor where food and/or other products are sold (Owuor, S. et al. 2017).
20
draft and other work, and one household reported to have cattle for bull
fighting (Dominguez-Salas et al., 2016).
In the context of urbanisation and nutrition transition, Nairobi is an ideal city in
which to better understand the influence of rapid urbanisation on dietary and
nutrition changes among the urban poorest in SSA. In addition, considering
the high prevalence of obesity among women in both Nairobi’s slums and
wider rural-to-urban migrant literature, and the lack of explanation for this
phenomenon, my research focusses on rural-to-urban migrant women.
1.5.3 Political response
The Government of Kenya recognises the rising burden of obesity and
nutrition and diet related NCDs. Kenya released its country development
programme “Kenya Vision 2030” in 2008 which is being implemented through
a series of successive five-year Medium-Term Plans (Government of Kenya,
2020). This long-term development blueprint aims to transform the country
into a newly industrialising, globally competitive, and prosperous upper
middle-income country with a high quality of life for all citizens by 2030. The
nutrition section is aligned to World Health Assembly child nutrition targets by
2025. The third medium term plan (2018-2022) includes the initiative of
ensuring that all citizens enjoy food security and improved nutrition by 2022,
primarily through nutrition-sensitive agricultural policies and programmes.
Despite the progress on improving nutritional status of children, the
development programme needs to recognise nutrition as a major social pillar.
In addition, the prevention, control and management of NCDs was not
explicitly mentioned in this document (Covic and Hendriks, 2015; Government
of Kenya, 2020).
In 2012, the Kenyan Ministry of Health released a health policy where the
problems of NCDs were fully recognised. One of its six strategic objectives
was to halt and reverse the rising burden of NCDs. Furthermore, the policy
includes several interventions to reduce and manage the burden and disease
which are based on the nature of the risks (Ministry of Health Kenya, 2014).
This was accompanied by the development of the National Nutrition Action
Plan (2012-2017), and a Kenya National Strategy for the prevention and
control of non-communicable disease which was implemented on both a
national and county level (2015–2020). The first included the reduction of
overweight and obesity among women of reproductive age as an outcome
indicator on the county level. The second aimed to provide direction to ensure

21
that there will be a significant reduction of preventable burden of NCDs in
Kenya through promotion of healthy lifestyles and implementing interventions
to reduce the modifiable risk factors for NCDs. Unhealthy diets are recognised
and included as one of the key risk factors, and include prevention of diabetes
and obesity. Further, the promotion of research and surveillance for the
prevention and control of non-communicable diseases life were key targets of
this strategy (Asiki et al., 2018b; Ministry of Health Kenya, 2015).
In 2015, the Nairobi City County Assembly implemented the Urban Agriculture
Promotion and Regulation Act in Nairobi which allows food to be grown in the
city and sets standards for organic waste management, food safety and
environment protection, with priority given to residents of high density and
informal settlements (slums). The Act allows aspects of urban agriculture such
as wall gardens, sack gardens, and the keeping of small animals and multi-
storey gardens (Nairobi City County, 2015).
There is minimal political activity regarding migration. Despite the large influx
of rural-to-urban migrants, there are currently no specific policies related to
internal migration in Kenya, though there are recent discussions on
mainstreaming migration in urban policy (International Organization for
Migration, 2018).
1.5.3.1 Policies and interventions in Nairobi’s slums
Slum areas are generally areas of policy neglect, hence there is little
investment to improve nutrition and living conditions. Due to their informal
nature these may not be considered eligible for urban planning or public
upgrading projects by policy makers (Fox, 2014). In addition, there may be
legal complexities of granting land titles, or government corruption pertaining
use of land which discourages investments. In the scenario of political intent,
it may prove difficult to plan political interventions due to enumeration
problems which may lead to undercounting of populations. Moreover, there
may be competing interests of people who oversee slums in an unofficial
capacity (Bird et al., 2017; Elsey et al., 2016b; Marx et al., 2013).
In Nairobi however, there have been interventions led by the Kenyan
Government. These are mainly slum upgrading programmes which often
involve participation of multiple stakeholders and focus primarily on the
physical environment in slums such as housing and infrastructure. The Kenya
Slum Upgrading Programme (KENSUP) and the Kenya Informal Settlement
Improvement Project (KISIP) are two of such programmes which both focus
22
on participatory urban planning, housing and infrastructure. In 1996, the
Kenyan Federation of Slum Dwellers titled “Muungano wa Wanavijiji” (‘united
slum dwellers’ in Kiswahili) was founded which organises communities around
issues affecting them and mobilises through savings schemes, conducts
community-led enumeration, propagates cross-settlement learning and
sharing through periodic exchanges and that implements community driven
housing and infrastructure projects. They are affiliated with the Akiba
Mashinani Trust, the Kenyan urban poor fund, a housing development and
finance agency, and Slum Dwellers International (SDI) Kenya, a network of
community-based organisations of the urban poor and operate through 30
regional networks that are active in 14 Kenyan counties. Together they aim to
influence changes in practice and policy for urban development. In
collaboration with the Nairobi City Council they are involved in slum upgrading
programmes that represent the community voice (Weru et al., 2018). These
programmes do however not include nor evaluate the health outcomes, let
alone changes in nutrition and diet (Corburn and Sverdlik, 2017).
Within Nairobi’s slums most health services are made available by non-
governmental organisations (NGOs) or the private sector (Bazant and Koenig,
2009; Zulu et al., 2011). In Nairobi, there has been a response by the African
Population and Health Research Centre (APHRC) by implementing a
community-based prevention and treatment programme on cardiovascular
disease (CVD). Public health regulations and policies in these settings are
currently weak (van de Vijver et al., 2016).
1.6 Significance of this research
Rural-to-urban migration will not stop in the near future. A lack of financial
opportunities in Kenya’s rural areas will keep on pushing women (and men)
from the countryside to large urban cities such as Nairobi. In addition, the city
pull-factors remain strong as many perceive the city to be full of opportunities
(Ezeh et al., 2017). As a large proportion of the migrants end up in slum
settlements, and many may intend to stay for a longer period, focussing on
the urban poorest will be particularly valuable (Zulu et al., 2011). Slums
present a difficult comparison with other (poor) urban areas as they may exert
neighbourhood effects and migrants get into poverty traps which affects
behaviour and health differently (Elsey et al., 2016b; Grant, 2010; Lilford et
al., 2017).

23
The focus on rural-to-urban migration, obesity and nutrition transition in Kenya
is predicated by the fact that nutrition transition is most evident in urban
environments, which are perceived to be obesogenic in the current state of
economic development in Kenya (Madise and Letamo, 2017). Intervening
now, while Kenya is still at an early stage of nutrition transition, is deemed
important since prevention can still be introduced (Abrahams et al., 2011;
Haggblade et al., 2016). With the rapid urbanisation occurring globally, in-
depth understanding is warranted as to how urban food environments drive
dietary changes and obesity development.
While there appears to be an association between nutrition transition and
urbanisation in Kenya (Steyn et al., 2011b), the underlying mechanisms are
still poorly understood. Furthermore, there is a lack of context-specific
evidence on the factors and environmental context that drive this among rural-
to-urban migrant women, particularly in slums. While globally there is
increasing convergence of intake of a small number of food commodities,
according to the dietary convergence–divergence theory there is widening
divergence in local intake resulting from demographic, socio-economic and
environmental context that create dietary preferences and behaviour, hence
to understand the context-specific evidence is required (Hawkes, 2006).
Furthermore, there is a paucity of studies which aim to understand interactions
between the individual’s characteristics, environments and dietary behaviour,
especially in SSA (Pitt et al., 2017). Greater emphasis on how individual
migrants and environmental factors interact in the food environment may
develop a stronger understanding on how environments can halt nutrition
transition in context of rapid urbanisation.
A mixture of quantitative and qualitative evidence on these factors and context
may help us better understand the effect of urbanisation on nutrition transition
among the urban poor living in slums and assist in further differentiating rural-
to-urban migrant women particularly at risk of developing obesity. This to
effectively include rural-to-urban migrant women in urban policies and
interventions, thereby tackling and preventing obesity among this vulnerable
group.
Finally, women seem to be disproportionately affected by the impact of rural-
to-urban migration on obesity. The consequences of migration and
urbanisation on women’s nutrition is an important topic which merits further
attention, particularly given the importance of maternal nutrition for health of
the offspring (Godfrey et al., 2017).
24
1.7 Overall research aim and specific research objectives
Taking all of the above into consideration, the overall aim of my research was
to examine nutrition transition among rural-to-urban migrant women in order
to better understand obesity risk in Nairobi’s slums.
To address this aim, I formulated several specific research objectives:
➢ To identify characteristics associated with obesity risk and nutrition
transition among rural-to-urban migrant women on both a national level
and in Nairobi’s slums
➢ To explore the social, cultural and environmental context in which nutrition
transition occurs among rural-to-urban migrant women in Nairobi’s slums
➢ To examine the experiences and perceptions of rural-to-urban migrant
women towards their current food environment, and changes in diet in
Nairobi’s slums
To achieve this, I employed a sequential explanatory mixed methods research
study which had an initial quantitative phase and a secondary qualitative
phase to help deepen understanding and extend the quantitative findings.
1.8 Organisation of this thesis
This thesis is organised into nine chapters. With Chapter 1 I have provided a
comprehensive introduction of the broader problem and its importance in
Kenya, the research context, and overall research aim of my research. In
Chapter 2 I review the theoretical and empirical literature which sets up a
conceptual framework to guide my mixed methods research. I used a
combination of the dietary acculturation and an adapted version of the socio-
ecological approach to investigate obesity risk and nutrition transition among
rural-to-urban migrant women.
In Chapter 3 I describe and provide a rationale of selecting the sequential
mixed methods design that I used to address the set research objectives. I
conclude with a description of the research study settings. I present the
qualitative and quantitative methods, results and discussion separately, albeit
I integrate these in the discussion in Chapter 8.
Chapter 4 and Chapter 5 represent the quantitative phase of my mixed
methods research. In Chapter 4 I present the analysis and discussion of cross-
sectional data from the DHS programme. With this analysis I aimed to better
understand nutrition transition and population weight gain in Kenya in the

25
context of urbanisation. In Chapter 5 I present an analysis of data from the
Nairobi Urban Health and Demographic Surveillance System (NUHDSS),
managed by APHRC. With this analysis I aimed to examine obesity risk and
food intake (red meat, sugary drink, fruit and vegetable intake) among rural-
to-urban migrant women in Nairobi’s slums.
Chapter 6 and Chapter 7 represent the qualitative phase. I linked the findings
from the first phase to the qualitative phase in the form of participant selection
and follow-up explanations. In the qualitative phase I explored the
environmental context in which nutrition transition among rural-to-urban
migrant women occurs, and I examined the rural-to-urban migrant women’s
experiences and perceptions on their current food environment and changes
in diet. APHRC and Carolina for Kibera (CfK) assisted in the data collection
by acting as gatekeepers. In Chapter 6, I provide a justification for the method
selection of qualitative interviewing methods and participatory research (PR)
techniques. I then further outline the measures I used to ensure rigour and
validity and I conclude this Chapter with my used analysis approach.
In Chapter 7 I outline the findings and discussion of the qualitative study. The
findings include the characteristics of both the key informants and rural-to-
urban migrant women recruited for this study. I then continue with an outline
of the main changes in dietary behaviour and perceived rural-urban
differences in food environment, and key themes on changes in food
environment, diet and body image.
In Chapter 8, I present the combination of the mixed methods findings. I then
outline and discuss five meta-inferences which I derived from this
combination. I then reflect the generalisability and transferability of my
research findings to other contexts. I conclude this chapter by reflecting on the
strengths and limitations of methodology and conceptual framework in my
research. The ninth and final chapter (Chapter 9) concludes my thesis. I start
this chapter by presenting a summary of the mixed methods meta-inferences.
Subsequently, I present the implications of the findings for future policies and
interventions. Following this I summarise and present my research findings’
contribution to the field. In conclusion, I present the directions for future
research.

26
Chapter 2 Literature review
I undertook a literature review to establish a conceptual framework. I did this
in order to better understand the association between rural-to-urban migration,
nutrition transition, and obesity and how the interaction with the new urban
food environment functions in this association. This framework incorporates
relevant theoretical and empirical literature to ensure that understanding this
phenomenon is multifaceted. The determinants of nutrition and eating
behaviour is central to more than 10 disciplines and a large literature body has
evolved of the last 60 years which has emphasised the importance of a large
number of biological, psychological and environmental predictors a large
number of disciplines (Symmank et al., 2017). In addition, a recent systematic
mapping review encompassed a wide array of migratory, individual and
environmental influences of migration on changes in diets (Osei-Kwasi et al.,
2016).
2.1 Literature search strategy
For the purpose of this research I limited my review of the theoretical literature
to migration, dietary behaviour and obesity. In addition, I undertook a
comprehensive review of the empirical and grey literature on individual and
environmental determinants of (obesogenic) dietary behaviour and obesity in
SSA context.
I set multiple inclusion and exclusion criteria for the literature search. I limited
the search to human studies from inception up to 2017, written in English. This
included literature reviews, and mixed methods, quantitative and qualitative
studies and excluded conference and poster abstracts, letters, commentaries
and editorials. For empirical literature I limited my search to the SSA and wider
LMIC regions, whereas for theoretical literature I also included literature
derived from HIC context.
I undertook searches of the health and social sciences literature using
electronic databases (Embase, Global Health, MEDLINE and PUBMED) up to
2017, in order to find relevant empirical and grey migrant and non-migrant
literature on individual and environmental determinants of (obesogenic)
dietary behaviour and obesity in SSA and wider LMIC context. I gave a
preference to literature on slums and other low socio-economic settings. I
used the initial search terms and relevant synonyms in combination relating
to: dietary behaviour/behavior; nutrition transition; obesity; rural urban
27
migration; urbanisation/urbanization; slums (and synonyms such as informal
settlements based on search strategy by Ezeh et al. 2017); food environment;
Kenya; Sub-Saharan Africa; low middle income country; and body image. I
applied the same search terms to google scholar. I included additional non-
diet and obesity specific migration and slum literature which covered
processes between rural-to-urban migration and social/health behaviour. I
followed-up references of appropriate included literature reviews to
complement my literature review. Lastly, I set auto-alerts in order to stay
updated with any new research.
I managed searches in Endnote X7. For the initial search I screened the titles
and abstracts of the retrieved literature. I only excluded literature which did
not meet to inclusion criteria related to the population, context and outcome.
2.2 Behaviour and migration theories
2.2.1 Individual behavioural theories
Over the years, a number of theories and models have been used to explain
food choices and to inform prevention and treatment programmes concerning
weight gain (Baranowski et al., 2003). Researchers wishing to better
understand how individuals process new information and its effect on their
behaviour have often applied individual theories such as the Social Cognitive
Theory, Health Belief Model and the Theory of Planned Behaviour
(Baranowski et al., 2003). While these theories have shown their applicability
in understanding and promoting health and dietary behaviours and weight
prevention, a well-recognised limitation is the lack of attention to broader
environmental factors (Baranowski et al., 2009; Chan and Woo, 2010). Some
individual theories do make a distinction between individual and
environmental factors. For example, in the Theory of Planned Behaviour, the
subjective norm and existing social norms are recognised as important
constructs (Ajzen, 2002). Despite this recognition, these theories do not
adequately incorporate the broader structure and interactions which exist
between the environment’s influence and the individual’s dietary behaviour
and weight outcome (Baranowski et al., 2003).
Remaining individually focussed is also not entirely justified as population
levels of obesity keep increasing (International Food Policy Research Institute,
2015). There is an increasing consensus that we will only halt this trend by
identifying and addressing environmental factors in combination with
28
individual level factors to promote healthy dietary behaviour and prevent
weight gain (Roberto et al., 2015).
2.2.2 Socio-ecological perspective
Socio-ecological models (SEM) go further as they consider the connections
between people and their environments. These models view behaviour as
affecting and being affected by multiple levels of influence. SEM suggest that
these levels (or systems) are interrelated (Bronfenbrenner, 1979; McLeroy et
al., 1988) and have proven to be useful to conceptualise the interdependence
between people, their health and behaviour, and their environment. Over the
past decade, the socio-ecological perspective has gained much influence, as
environmental determinants of dietary behaviour, including obesogenic
dietary intake, have been studied most extensively during this period of time
(Sleddens et al., 2015). Parallel to this, a wide range of SEM have been
developed in HIC, and increasingly in LMICs, to dissect the influences of the
environment on obesity and/or dietary behaviour (Kremers et al., 2006; Lynch
and Batal, 2011; Scott et al., 2012; Story et al., 2008; Swinburn et al., 1999;
Verstraeten et al., 2014). SEM commonly consist of five nested, hierarchical
levels: individual, interpersonal, community, organisational, and
policy/enabling environment.
2.2.2.1 Ecological framework on eating and nutrition
One SEM is the ecological framework on healthy eating and nutrition (Story
et al., 2008). This model is widely applied and developed on an evidence basis
of HIC studies. It reflects the individual-level, social environmental, physical
environmental, and macro-environmental factors associated with nutrition and
eating behaviour. Individual-level factors include cognitions, behaviours,
biological and demographic factors. These individual factors may affect
dietary behaviour through characteristics such as personal motivation, self-
efficacy, outcome expectations, and behavioural capability. The social
environment in this model includes interactions with family, friends, peers, and
others in the community and may influence dietary behaviour through
mechanisms such as role modelling, social support, and social norms. The
physical environment includes the multiple settings where people eat or
procure food such as the home, work environment, restaurants, and
supermarkets. These settings determine food availability and may create
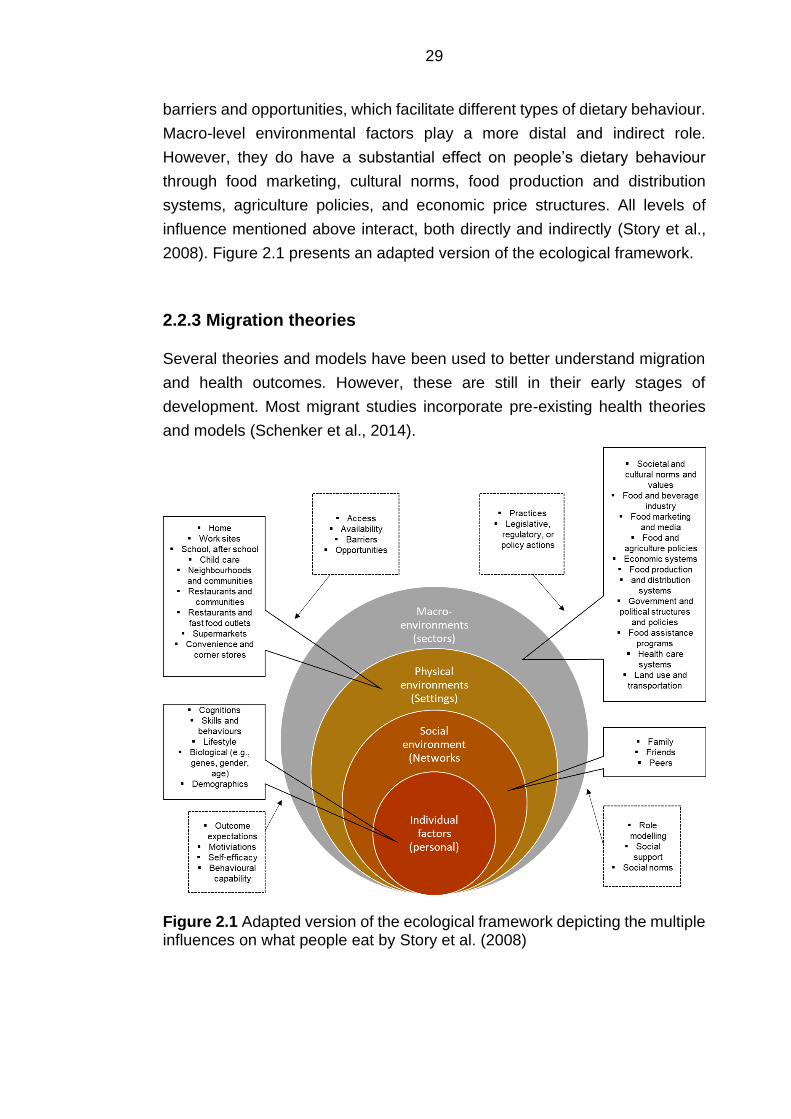
29
barriers and opportunities, which facilitate different types of dietary behaviour.
Macro-level environmental factors play a more distal and indirect role.
However, they do have a substantial effect on people’s dietary behaviour
through food marketing, cultural norms, food production and distribution
systems, agriculture policies, and economic price structures. All levels of
influence mentioned above interact, both directly and indirectly (Story et al.,
2008). Figure 2.1 presents an adapted version of the ecological framework.
2.2.3 Migration theories
Several theories and models have been used to better understand migration
and health outcomes. However, these are still in their early stages of
development. Most migrant studies incorporate pre-existing health theories
and models (Schenker et al., 2014).
Figure 2.1 Adapted version of the ecological framework depicting the multiple influences on what people eat by Story et al. (2008)
30
2.2.3.1 The healthy migrant effect
The most-utilised model concerning migration and health is the “healthy
migrant effect” (Urquia and Gagnon, 2011). This model focuses mainly on
international movement of migrants from LMICs to HICs. It proposes that
often-observed health advantages of migrants compared to the major
proportion of the host population could be attributed to the positive self-
selection of migrants from LMICs to HICs. This normally applies to the health
advantages of the minority migrant groups and the majority population of the
host country (Spallek et al., 2011). Persons who are particularly fit and healthy
may be more willing to cope with the risks of migration to a new environment
(Urquia and Gagnon, 2011). An alternative explanation to the healthy migrant
effect is the “salmon bias” hypothesis. It states that the healthy migrant effect
is overestimated due to selective return-migration of elderly migrants or
migrants with less healthy profiles but frequently remain registered in study’s
databases Internal migration studies in SSA described processes of return-
migration as their health in the migration destinations deteriorates (Ginsburg
et al., 2016; Urquia and Gagnon, 2011).
Newer models have been developed that try to explain health of migrant
populations besides the selection effect and salmon bias. Models such as the
“healthy transition” expand with the incorporation of differences in genetic
background, and influences of physical and social environments post-
migration on disease risks and places more emphasis on gene-environment
interactions. However, these models are static in their understanding of health
and behaviour outcomes as they miss the tracking of the migrants’ health and
its determinants over time. These models are based on international migration
from LMICs and HICs (Schenker et al., 2014). The postulated mechanisms
between migration and health outcomes may be applicable to internal rural-
to-urban migration. Often migrant women in the immigration literature
departed from rural areas in their home countries and ended up in urban areas
in HIC. Hence, the context in which this transition occurred may share some
similarities in relation to internal rural-to-urban migration as these immigrant
women may follow a similar nutrition transition pattern (Murphy et al., 2017).
2.2.3.2 Life-course perspective
A life-course perspective is becoming increasingly used within the field of
public health in better understanding people’s dietary behaviour (Devine,
2005). It has also received increasing attention in context of migration (Spallek
31
et al., 2011). According to the life-course model, first generation migrant
groups have different exposures across three periods: (1) the period before
migration; (2) the period during the migration process itself; and (3) the period
after migration. All the different exposures during these periods may affect the
health of the migrant in its new destination. The period during migration
includes in utero exposure and the critical phase of early childhood, as well as
other exposures at the place of birth to occupational, environmental, food and
infectious agents (Schenker et al., 2014).
When trying to understand obesity among rural-to-urban migrants, the period
prior to migration may be particularly worthy of consideration. Early life
malnutrition may predispose individuals to adult obesity (Godfrey et al., 2017).
Rural and urban areas in Kenya differ considerably in nutrition status and
dietary patterns (Steyn et al., 2012). In addition, data on child malnutrition
showed stunting of children’s growth to still be a major problem in Kenya’s
rural areas (ICF, 2012; Pawloski et al., 2012). Hence, the risk to developing
obesity may be enforced with migrating to urban environments where its
residents consume fatty, energy-dense, roadside foods in excess (Abrahams
et al., 2011). Interestingly, evidence from South Africa observed that nutrition
deprivation in childhood has been found to be a risk for obesity in women but
not in men (Case and Menendez, 2009; Kruger et al., 2004). An explanation
for this could be that boys received better nutrition as infants and babies than
girls (Micklesfield et al., 2013).
The period during rural-to-urban migration may be a sensitive one. The
migration process may produce stress, which might in turn lead to risky health
outcomes such as mental or CVD. A longitudinal observational migrant study
in Kenya followed up both rural-to-urban migrants and rural non-migrant
controls multiple times between three months and two years. The mean
weight and systolic blood pressure of migrants was significantly higher than
that of controls throughout the study. These did however converge over time
(Poulter et al., 1990).
While this approach has a temporal perspective on influences of migration on
dietary behaviour, it does not however consider multiple migration between
rural and urban areas such as circular or return migration (Mberu, 2016).
Multiple migration makes it difficult to distinguish the influence of the host
environment on health outcomes and behaviours. A major challenge with
testing the healthy migrant effect and the different life-course stages is the
unavailability of longitudinal data to test its major postulations. This requires
32
costly and time-consuming longitudinal study designs (Beauchemin and
Schoumaker, 2016).
2.2.3.3 Acculturation
For the past several decades, acculturation theories have been used to better
understand diet and health outcomes after migration (Ayala et al., 2008;
Delavari et al., 2013; Himmelgreen et al., 2014). Acculturation entails the
social and psychological changes that take place (e.g. behaviours, beliefs,
language, religion) when a group migrates to a new setting and interacts with
individuals from different cultures (Berry, 1997; Cabassa, 2003). Berry (1997)
proposed four acculturation options which describe the individual’s level of
adaptation into their host society: assimilation, integration, marginalisation
and segregation. Assimilation is the total disregard of one’s own culture and
full adaptation to the culture of the host society. At the other extreme,
segregation occurs when individuals want to keep their own culture and either
refuse to make contact or avoid contact with the host culture (Berry, 1997).
There are multiple instruments and ways to measure acculturation depending
on the different underlying conceptual models and ethnic groups of study. This
is referred to as a limitation in measuring acculturation in migration research
as it only allows limited comparison with other acculturation literature
(Cabassa, 2003; Satia-Abouta, 2003).
Acculturation has often been related to obesity in the immigration literature.
Previous research which explored the association between obesity and
acculturation often employed single or a combination of surrogate measures
such as length of residence in the host country, place of birth or language
used, instead of standardised acculturation scales. An advantage of these
scales are that these are relatively simple and useful to include within larger
surveys without greatly increasing the respondents’ burden (Alidu and
Grunfeld, 2018). The length of stay at a host location is particularly often used
as a surrogate measure of acculturation in relation to obesity. However,
acculturation is perceived to be a complex and multidirectional concept which
can be difficult to measure by single proxy indicators (Delavari et al., 2013).
Moreover, studies often do not assess enculturation (e.g. marginalisation or
segregation). However, studies which use standardised uni- or bi-directional
acculturation scales seemed to present more consistent findings as opposed
to studies using different surrogates of acculturation. Uni-directional scales
assume that it is not possible for immigrants to maintain their original habits if
33
they get in touch with the host culture. This is a process which can be
represented as a linear change. Equally, the bi-directional scale suggests that
the interaction with the traditional habits and host culture plays an important
role in the process of acculturation (Cabassa, 2003; Delavari et al., 2013).
When acculturation is mentioned in relation to dietary changes, this is also
referred to as dietary acculturation (Satia-Abouta et al., 2002). Dietary
acculturation provides a mechanism for understanding the role of migration
on diet and health. This model was formerly applied in LMICs to HICs
migration literature (Satia-Abouta et al., 2002). Dietary acculturation refers to
the process that occurs when members of a minority group adopt the eating
patterns/food choices of the host country. Dietary acculturation agrees with
the perspective that acculturation consists of multiple dimensions which are
dynamic, and complex, and where a person does not move linearly from one
continuum (traditional) to the other (acculturated). The theory posits that there
is a complex and dynamic relationship between socioeconomic, demographic,
and cultural factors with exposure to the host culture. According to this theory,
not all dietary changes associated with acculturation are detrimental to health
(Satia-Abouta et al., 2002). The model also posits that there are three different
patterns of dietary intake post-migration: 1.) Maintenance of traditional eating
patterns, 2.) Adoption of host country eating patterns, and 3.) Bicultural eating
patterns which entail maintenance of traditional eating patterns at certain
meals or occasions with incorporation of host country eating patterns at other
meals or occasions (Satia-Abouta, 2003).
To the best of my knowledge, the dietary acculturation model has not been
formerly applied to internal rural-to-urban migration. In the international
migration literature, the model is predominantly used to examine dietary
acculturation of an ethnic minority group whose culture is substantially
different from the dominant host diet culture (Ayala et al., 2008; Satia-Abouta
et al., 2002). In the case of Nairobi this comparison may not be as
straightforward. Nairobi has long been a migration hub where many different
ethnicities come together and may enjoy greater culture diversity in contrast
to rural areas (Macharia, 1988; van 't Riet et al., 2001; van de Vijver et al.,
2015). Cultural diversity in urban areas was suggested to be one of the key
factors depicting increased dietary diversity and suggests adoption of different
cultural cuisines (Ruel et al., 1999). However, while slums are certainly not
homogenous, rural-to-urban migrants may settle in slum villages which are
inhabited by people of their own ethnic group (van 't Riet et al., 2001; van de
Vijver et al., 2015).
34
2.2.4 Food environment research
The association between the food environment and dietary intake and weight
status is a research area that has received increased attention over the past
decade in LMICs (Turner et al., 2017). Food environments include
supermarkets, small retail outlets, markets, street-food stalls, coffee shops,
tea houses, school canteens, restaurants and all the other venues where
people procure and/or eat food (Pitt et al., 2017). Food environment research
builds on socio-ecological theory and is considered an important factor in
over-eating (and reduced physical activity). In the obesity literature this is
referred to as an obesogenic environment as mentioned in Chapter 1 (Glanz
et al., 2005; Swinburn et al., 2015). The food environment has seen multiple
definitions over the years. Most research on food environments has taken
place in HICs (within modern food system types) (Lytle and Sokol, 2017;
Swinburn et al., 2013; Turner et al., 2018). The ecological framework for
healthy eating and nutrition by Story et al. (2008) is based on the pioneering
conceptual framework by Glanz et al. (2005) which described four types of
nutrition environment. These are the community nutrition environment (type &
location of food outlets such as stores and restaurants, organisational nutrition
environment (home, work, school, other), consumer nutrition environment
(availability healthy options, product price, promotion and placement) and the
information environment (media, advertising). The effects of these
environmental sectors can be moderated or mediated by demographic,
psychosocial, or perceived environment variables. Environmental, social, and
individual factors influence eating patterns, which in turn affect risk of many
chronic diseases (Glanz et al., 2005; Story et al., 2008).
A recent paper aimed to define and conceptualise the food environment
suitable for use in LMICs, where food environments are located in traditional
or mixed and more complex food system types (Turner et al., 2018). Based
on earlier work (Black et al., 2014; Caspi et al., 2012; Food and Agriculture
Organization of the United Nations, 2016; Herforth and Ahmed, 2015; Penney
et al., 2014) they have proposed that the food environment is the interface that
mediates people’s food acquisition and intake within the wider food system.
The food environment in their definition encompasses external dimensions
such as the availability, price, vendor and product properties, and promotional
information; and personal dimensions such as the accessibility, affordability,
convenience, and desirability of food sources and products (Turner et al.,
2018). There is huge complexity in measuring the food environment in LMICs
as they host a wide variety of market and non-market based (own production,

35
and rural food remittances), food sources that operate at multiple scales which
can be further divided into formal and informal markets (Turner et al., 2018).
In HIC, the built food environment (availability, accessibility) has received
attention in relation to obesity, especially in socio-economically disadvantaged
areas (Cobb et al., 2015; Townshend and Lake, 2017). These reviews have
concluded that there is poor evidence of the association between the local
food environment and obesity, but also remark on the wide range of different
food environment measures used and sub-optimal study designs. Objective
measures have long been given preference for the better understanding of the
effect of the food environment on obesity and dietary behaviour. However, a
series of reviews have indicated that the associations between environments
and behaviour are stronger when subjective self-report measures of
environments are used. They also show that perceptions of availability and
price of healthy foods are more strongly associated with food choice than with
objective availability and price (Brug et al., 2008). However, there is even
inconsistency between quantitative studies on the associations between food
environment perceptions and food intake (Lytle and Sokol, 2017).
Residents’ perceptions are typically elicited from interviews, and objective
measures derived from systematic observations (audits) or calculated from
existing spatial data using geographic information systems (GIS) (Brug et al.,
2008). Recent reviews of food environment studies agree on and advocate for
the use of both subjective and objective measurements to better understand
the built environmental impact as one should not assume that proximity to and
quality of food in stores is directly related to food purchasing behaviour or
dietary patterns (Lytle and Sokol, 2017; Roda et al., 2016; Turner et al., 2018).
36
2.3 Migration and environmental influences on obesity risk
and nutrition transition
2.3.1 Changes in socio-economic circumstances
Urbanisation in SSA is associated with increased wealth in terms of household
assets and rising incomes (Ruel et al., 2017). Having more disposable income
is believed to be one of the key influences on obesity and obesogenic dietary
behaviour. It may also have more beneficial outcomes such as a higher dietary
diversity, and greater fruit and vegetable intake (Ruel et al., 2005). Whereas
in rural areas people can produce their own food, urban residents are
dependent on food purchases. In addition, the costs of traditional staple foods
in urban areas are generally higher than the cost of heavily processed food
(Raschke and Cheema, 2008). This makes income and individual perceptions
of affordability highly influential factors on dietary behaviour (Cohen and
Garrett, 2010; Maxwell, 2000). Income fluctuations may have a particularly
significant impact on household consumption among the urban poorest
resulting in the adoption of coping strategies such as reduced food intake or
cheaper less nutritious foods (Kimani-Murage et al., 2014). There is the
general notion that healthy diets are more expensive than unhealthy diets (e.g.
lack of fruits, vegetables and fibre, and high intake of processed obesogenic
foods). A couple of South African studies measured the costs of a “healthy”
versus an “unhealthy” diet. They showed healthy diets to be unaffordable for
most residents in urban areas. However, this was based on market-based
food sources (supermarkets, corner stores). They acknowledge that the costs
of healthy diets might be less of a problem to those who grow food or purchase
food directly from the farmers, and that there is low generalisability of these
findings due to different food prices and food environments in other SSA
countries (Temple and Steyn, 2011).
The SES of individuals or households in SSA is argued to be associated with
women’s obesity risk (Neuman et al., 2013). Much has been written about the
measurement of SES in HIC, however much less so in LMICs (Howe et al.,
2012). Several measures of SES have been utilised in epidemiological
studies. The aspects of SES captured by these measures and the pathways
through which they may affect health and diets are likely to be slightly different
but overlapping. Previous literature has however shown household
expenditure to be an important marker of dietary behaviour, whereas
household assets are a reflection of income. By some, consumption is
preferred to income, as households will for example attempt to regulate their
37
food intake throughout the year, regardless of seasonal influences on income
or food availability (Howe et al., 2012). Both could influence obesogenic food
choice, and disruption of traditional diets could be due to the smaller living
spaces, lack of storage and cooking facilities which could contribute to an
increased reliance on foods requiring less or no preparation (Raschke and
Cheema, 2008; van 't Riet et al., 2001). Household expenditures may
fluctuate, and therefore only provide a transitory reflection of socio-economic
status. This is less the case for household assets. Instead this might be a
better measure of long-term wealth as it may represent past expenditures and
current wealth status. Household assets may however be less predictive of
food intake than household expenditure (Booysen et al., 2008; Hulme and
McKay, 2013). Other measures such as education and employment may
overlap as well. Education attempts to capture knowledge-based assets is
strongly related to other aspects of SES such as income and occupation
(Abuya et al., 2012). However, as many women are active in an informal
economy in urban cities in SSA, the type of income-generating activity may
have different implications on dietary habits, snacking patterns and nutrition.
Salaried labour may provide the respondent with a regular income in contrast
to casual labour which may be important in relation to food security and
nutrition (Kimani-Murage et al., 2014). In context of poverty, multiple socio-
economic indicators are therefore required to predict how changes in wealth
influence behaviour (Mberu et al., 2014).
There is limited evidence on the role of socio-economic factors in obesity and
nutrition transition in context of rural-to-urban migration. Two Peruvian rural-
to-urban migrant study analyses explored the relationship between socio-
economic status and obesity (Carrillo-Larco et al., 2015; Hilmers et al., 2016).
One of these was a cross-sectional analysis which investigated whether SES
and acculturation (language use and proficiency, ethnic social relations, and
media usage) predicted overweight/obesity risk among rural-to-urban migrant
men and women at baseline (2007). SES in this study was based on a multi-
deprivation index, which included education, household income and
household assets per individual. They found that acculturation was not
significantly associated with BMI after controlling for SES for either male or
female rural-to-urban migrants (Hilmers et al., 2016). Socio-economic
changes post-migration may prove more influential on obesity than
acculturation. The other analysis estimated the risk of obesity and central
obesity among rural-to-urban migrants at both baseline (2007) and follow up
(2012/2013). At follow-up this analysis found richer rural-to-urban migrants to
38
be at a higher risk of having obesity, independent of physical activity and sex
(Carrillo-Larco et al., 2015).
2.3.1.1 Migration and food insecurity
Rural-to-urban migrant women may become or remain food insecure post-
migration. Previous literature has found food insecurity to be prevalent among
women in Nairobi’s slums with the lack of income suggested as the main
challenge (Ezeh et al., 2017; Faye et al., 2011; Kimani-Murage et al., 2014).
Female headed households may be particularly vulnerable as their income is
generally lower and especially in the earlier stages there may be a lack of
social support. A recent longitudinal data analysis in Nairobi’s slums found
significant gender disparities in the lowest income quintiles, with female-
headed household earning 62% compared with male-headed households
(Beyer et al., 2016).
At the World Food Summit in 1996, food security was defined as, “when all
people, at all times, have physical, social and economic access to sufficient,
safe and nutritious food which meets their dietary needs and food preferences
for an active and healthy life” (Food and Agriculture Organization, 2003, p.28).
Household food security is the application of this concept to the family level,
with individuals within households as the focus of concern. The definition
encompasses the following four hierarchical dimensions which are integral to
achieving food security: availability, accessibility, utilisation, and stability
(Gross et al., 2000). Availability, accessibility and utilisation are seen as
physical dimensions which represent the food flow. Availability is achieved
when adequate food is ready to have at people’s disposal. Access is achieved
when all individuals within the household have sufficient resources to obtain
appropriate foods for a nutritious diet. Adequate utilisation refers to the human
body’s ability to ingest and metabolise food. Stability is the temporal
dimension of food and nutrition security which affects all other dimensions,
and which determines whether there is transitory, seasonal or chronic food
insecurity (Gross et al., 2000). The components are hierarchical, with
availability necessary but not enough to ensure access, and accessibility
necessary but not enough for effective utilisation. If one of these conditions is
not met, food insecurity is said to exist (Webb et al., 2006).
Some suggest food insecurity to be an important determinant of obesity and
obesogenic dietary behaviour. Being food insecure could put women at a risk
of being overweight or having obesity as they are more likely to consume
39
cheap obesogenic foods as a coping strategy. A recent review examined this
association in LMICs (including SSA). Affordability of energy-dense,
processed foods, reduced quantity & diversity of fibrous food, spatial-temporal
access to nutritious food, and interpersonal distribution of food and non-
dietary behaviours were mechanisms proposed to explain this association.
They observed contradictory findings (Farrell et al., 2017). Among the studies
which showed a positive association between food insecurity and obesity risk
affordability of high energy, processed foods was identified as a main
mechanism (Farrell et al., 2017). These contradictory findings could be
explained by key differences (e.g. country, stage of nutrition transition), and
variation in use of food security scales and definitions (Farrell et al., 2017).
The findings of Eastern African studies oppose the proposed food insecurity-
obesity association. One cross-sectional study investigated the linkages
between food security and body composition in urban Kampala, Uganda. After
controlling for socio-economic factors including household income, food
security was no longer associated with BMI, overweight or obesity (Chaput et
al., 2007). Another cross-sectional study in Narok County, Kenya investigated
the association between food security and overweight among both rural and
urban women of child-bearing age. They concluded that a food secure
household does not predict underweight but does predict overweight among
women. This analysis was also controlled for standard of living (assets,
income and expenditure) (Keino et al., 2014).
The association between food security and obesity is difficult to measure as
migrant and non-migrant women in Nairobi’s slums seem to move back and
forth into food insecurity over a longer period of time due to unsteady incomes.
According to one study, income levels seem to remain stable among
households that have lived in the slum for 16 years on average, and incomes
do not increase (nor decrease) with the duration of residency (Marx et al.,
2013). It may therefore be that the household’s assets is a more accurate
determinant of obesity development (BeLue et al., 2009). Energy-dense street
food intake seems to be prevalent among different socio-economic groups in
SSA’s urban areas. One study in urban Ghana saw almost 40 % of the total
household food budget spent on street foods in the lowest expenditure
quintile, and still 25 % in the highest expenditure quintile (Maxwell, 2000). The
importance of street foods in urban dwellers’ diets is emphasised in a more
recent SSA study which used data from the Living Standards Measurement
Study (LSMS) data sets across five countries of Eastern and Southern Africa
(Ethiopia, Uganda, Tanzania, Mozambique and Malawi) and from the 2010
Income and Expenditure Survey data. Their analysis showed that the poorest
40
(0-2$/day) and vulnerable middle-class (2-4$/day) households had high price
elasticities for highly processed foods (Tschirley et al., 2015).
2.3.1.2 Income-generating activity and time scarcity
One of the possible consequences of rural-to-urban migration is the lack of
time for the preparation of (traditional) food. One qualitative rural-to-urban
migrant study in Mexico found migrant women to experience a lack of time for
cooking due to having employment outside of the home (Bojorquez et al.,
2014). This may not come as a surprise as urbanisation in SSA is also linked
with socio-cultural changes as women become increasingly engaged in
income-generating activity (IGA) and bear the main responsibility for domestic
work (van 't Riet et al., 2003). For low-income households engaging in income
generating activities is seen as a necessity (Ruel et al., 1999).
Often this activity is in the informal sector which is characterised by long,
irregular working hours and commuting distances. This may contribute to
increased intake of energy-dense already prepared food, and shorter food
preparation times which in turn leads to less frequent cooking of traditional
diets at home and preference for convenient starchy staple food (Afolabi et
al., 2004; Crush and Frayne, 2011; Levin et al., 1999). The increased
preference for food that saves preparation time is illustrated by an earlier
Kenyan study that showed urban households to have a strong demand for
bread. The increased economic value of women’s time appeared to be an
important factor in contrary to traditional staple foods, which took a longer time
to prepare (Kennedy and Reardon, 1994).
This is exacerbated in slums settings, as physical environmental
characteristics such as inadequate access to water, lack of space and
overcrowding may make it challenging for migrant households to cook at
home (Kimani-Murage et al., 2014; van 't Riet et al., 2001).
2.3.2 Changes in food environment
In SSA there is a dearth of literature which assesses the association between
the built food environment, dietary behaviour and obesity, particularly in
context of migration. Qualitative rural-to-urban migrant studies in South Africa
and Mexico have noted nutrition transition and weight gain among rural-to-
urban migrants. The participants said there to be a high availability of foods
rich in fat and sugar in the urban area (Stern et al., 2010), and the
41
unavailability of traditional food ingredients (Bojorquez et al., 2014). One
Ghanaian study showed the built food environment to be influential on BMI in
socio-economically deprived and densely populated districts of Accra (Dake
et al., 2016). While this is not a migrant study, one of the included districts is
composed of large migrant communities. The density of convenience stores
(selling energy-dense processed food) was positively associated with BMI,
irrespective of controlling for individual (socio-demographic characteristics
and lifestyle behaviours) and communal characteristics (crime, social
cohesion, and trust among community members).
2.3.2.1 Urban food deserts and swamps
Extensive SSA literature reports urban areas to be characterised by the high
availability and accessibility of cheap obesogenic foods (Raschke and
Cheema, 2008; Steyn and McHiza, 2014). The availability of convenient and
energy-dense food in Kenya is fuelled by the spread of supermarkets, street
and fast food outlets in urban areas which offer processed energy-dense food
(Rischke et al., 2015). Supermarkets may increase both dietary diversity and
quality, and offer cheap processed energy-dense foods, particularly in the low
socio-economic neighbourhoods (Demmler et al., 2017; Kimenju et al., 2015).
High availability and accessibility may directly increase eating outside the
home, and less food preparation and cooking at home. In addition, distribution
systems and persuasive food marketing in urban areas make food much more
convenient and culturally accepted (Haggblade et al., 2016; Vorster et al.,
2011). Fast and street foods in SSA are known to make a significant
contribution to the urban dweller’s diet (Steyn et al., 2014). Fast foods are sold
from outlets in formal structures such as buildings and malls and frequently
operate as a franchise (Steyn et al., 2011a). As for street foods, a review of
the nutritional content of street foods in a SSA context found these also to
strongly contribute to energy, (trans) fat and sugar intake (Steyn et al., 2014).
There are different types of street food vending. The street vendor may
prepare food at home and bring it to the food stall to sell. Alternatively, foods
sold are prepared by industrial factories and are brought to the stall for sale.
These generally include packets of crisps or other energy-dense food, and
sugary drinks.
There is however a high probability that rural-to-urban migrants who end up
in slums do not have frequent access to formal market-based sources such
as supermarkets. Indeed, Nairobi’s urban poor rely on the informal food
42
environment as these provide food close to where they live and work. Informal
food sellers can provide credit, small quantities can be purchased, and many
items are sold more cheaply than at formal outlets such as supermarkets
(Owuor et al., 2017). In addition, there is less certainty on how far reaching
and influential marketing and advertisement of energy-dense foods and drinks
are within slum settings. Rural-to-urban migrant women may resort to buying
from street and kiosk foods since these are in abundance in Nairobi’s slums
(van 't Riet et al., 2001). Street foods in slum contexts are associated with
high-energy density, unhealthy fats (hydrogenated oils) and low in nutritional
content due to refined flour (Gupta et al., 2016; Mwangi et al., 2002). In
addition, smaller living spaces and lack of refrigeration and cooking facilities,
paired with poor access to natural fuel sources and clean water contributes to
intake of already prepared food (Tacoli, 2017; van 't Riet et al., 2001). These
can also be referred to as food swamps. In literature from the USA and Mexico
low socio-economic neighbourhoods are urban food swamps when street and
fast foods topple the healthy alternatives (Bridle-Fitzpatrick, 2015).
Urban areas are also characterised by a wider diversity and availability of fruits
and vegetables, though these may not be accessible to everyone due to their
relatively high costs (Kimani-Murage et al., 2014). This is linked to the
disappearance of indigenous food markets, which discourages traditional food
intake, particularly in less affluent neighbourhoods which may have limited
access to food sources rich in nutritious food (Hawkes, 2006; Popkin et al.,
2012; Swinburn et al., 2011). An increasing body of literature speaks of African
food deserts, a concept applied to low SES neighbourhoods in European and
North American urban areas. This type of food environment describes a lack
of access to food and low dietary diversity due to the absence of modern retail
outlets such as supermarkets. Obesogenic dietary behaviour may not just be
an issue of household poverty, but also one of structural and spatial
environmental barriers that affect accessibility (Battersby and Crush, 2014).
Battersby and Crush (2014) also define African food deserts as poor, often
informal, urban neighbourhoods characterised by high food insecurity and low
dietary diversity, with multiple market and non-market food sources but
variable household access to food (Battersby and Crush, 2014). While
distances in rural areas to food sources such as to a food market are thought
to be even further (Herforth and Ahmed, 2015), most rural-to-urban migrant
women are dependent now on food purchases which may have extra
repercussions on traditional food intake.
43
2.3.3 Changes in social and cultural environments
2.3.3.1 Changes in social networks
With rural-to-urban migration, differences in social networks and dynamics
may occur (Loret de Mola et al., 2012b). These encourage changes in diet
and nutrition outcomes (Bojorquez et al., 2014; Stern et al., 2010). In HIC
settings, evidence is accumulating that the social context of dietary behaviour
may be an important factor determining the development and maintenance of
obesity (Higgs and Thomas, 2016). Generally, urbanisation in SSA has been
suggested to transform social relations such as cultural and/or ethnic diversity
and gender dynamics with both potential positive and negative consequences.
Rural-to-urban migration may increase or decrease their social capital. Social
capital refers to the resources (social support, information, and also economic
resources) to which individuals and groups have access through their social
networks (Moore and Kawachi, 2017). On the one hand, as women migrate
from rural to urban areas longstanding social networks may be disrupted with
the consequence of facing increased isolation (Scott et al., 2012). Migrant
women may end up in ethnically diverse slum neighbourhoods as these may
contain characteristics of small communities. On the other hand, informal food
sectors and activities are associated with strong community relationships,
especially among women, but also shared ethnic groups (Grant, 2010; Owuor
et al., 2017). Slums are also seen as communities in which there is much
social cohesion. This offers opportunities to build social capital which in turn
may lead to information, communal activities, social support and economic
resources. Strong social networks and support mechanisms have been shown
to enhance health status among adolescents and the elderly and household
food security in slum settings (Zulu et al., 2011). Furthermore, a non-migrant
study found urban sack gardening to have a positive influence on social capital
as multiple households support each other through this activity and have a
more diverse intake of green leafy vegetables, including traditional vegetables
(Gallaher et al., 2013).
Rural-urban remittances
Several studies have observed rural-to-urban migrants to uphold ties with their
friends and relatives in the rural area (Frayne, 2004; Mberu et al., 2013).
Those most recently migrated may maintain close links with relatives in rural
areas. While this may serve as a safety net, it has been proposed that it may
also contribute to lower livelihoods in the urban area (Tacoli, 2013).
44
Even though urban households may receive food from the rural area, the
money that they send in return to the rural area is believed to put a strain on
urban households (Crush et al., 2012). In a Kenyan context, studies have also
found urban poor households in secondary cities to be increasingly reliant on
food transfers and income from rural businesses to supplement their own
livelihoods (Foeken and Owuor, 2008; Owuor, 2007). The importance of rural-
urban remittances in the context of obesity and urban slums is however
unclear. This may contribute to lower incomes among urban slum migrant
women, which in turn may lead to lack of variety and quantity of nutritious food
and increased intake of energy-dense fatty food (Farrell et al., 2017).
However, according to a survey of 6000 low-income urban households
conducted by the African Food Security Urban Network (AFSUN) in 11
Southern African cities, generally, only 5% of urban households received food
from the rural area at least once a week and only 40% of urban households
received food at least once or twice a month. In addition, of the 753 urban
households, all received cereals/grains, and less than half would receive other
types of food (Frayne et al., 2010). Furthermore, rural studies in nine SSA
countries (including Kenya) showed rural–urban food remittances to vary with
the proximity and size of the destination. This occurred less frequently
between rural areas and the Capital city in comparison with secondary cities
(Djurfeldt, 2015).
2.3.3.2 Social contagion and pressure
Previous qualitative rural-to-urban migration studies explored the potential
role of changes in social networks and household composition on nutrition
transition among rural-to-urban migrants. One rural-to-urban migrant study
investigated the social determinants of dietary changes post rural-to-urban
migration in Mexico (Bojorquez et al., 2014). Rural-to-urban migration was
accompanied by an increase in processed food intake. Changing family
dynamics had an influence on changes in their dietary behaviour. Families
consumed pre-prepared food products without women being able to cook at
home. Women who were working at home preserved a meal pattern similar to
that of their place of origin. Women in this study changed their food intake
patterns according to what the spouse and children desired. The changing
ways of cooking and eating food were driven by differing social dynamics
within the household and community and were felt by the participants to be
instrumental in the reduced intake of a traditional diet (Bojorquez et al., 2014).

45
With rural-to-urban migration women may also develop a desire for “Western
foods” and a reduced preference for traditional food products. For example,
an previously mentioned qualitative rural-to-urban migrant study in Cape
Town, SA showed migrants (45 women, 10 men) to have a positive attitude
towards the dietary changes after migration. Specifically, the uptake of fast
foods and foods high in sugar and fats was perceived as progress from their
rural diets (Stern et al., 2010). Another qualitative study in South Africa also
observed that with migration both men and women adopt foods that are
associated with status such as meat, and fast foods, even the poorer versions
such as chicken’s skin and pig’s feet. Intake of traditional foods such as corn,
beans, green vegetables and root plants were associated with poverty among
these participants. However, women did also adhere to traditional dietary
habits (Puoane et al., 2006). Indeed, migration could also be paired with
positive aspects as rural-to-urban migrant women wish to maintain their
culture after arriving in a new place (Himmelgreen et al., 2014). This is a
pattern which is seen from qualitative research on African immigrants in HIC
(Garnweidner et al., 2012; Regev-Tobias et al., 2012; Renzaho, 2004).
2.3.3.3 Changes in body image and its linkage to diet
Another concept which is closely linked to food culture and potential weight
gain is body image perception (Okop, 2017). To reiterate Chapter 1, body
image perception has been named as an important factor of female obesity in
SSA (Micklesfield et al., 2013; BeLue et al., 2009). Women may desire to be
overweight or with obesity due to socio-cultural factors such as beauty, wealth,
happiness, respect and authority (McHiza et al., 2011; Mvo, 1999; Puoane et
al., 2005; Renzaho, 2004). The influence of the social environment (peers,
family and community norms) may play an important role as well (Okop et al.,
2016). Several qualitative studies in South Africa which explored the social
norms existing on body ideals within the household and community found
these to be influential on women’s body image perception. For example, one
study in a low-income township revealed that female adults chose an
overweight silhouette as this is what their families would desire of them
(McHiza et al., 2011). Community norms and values and conflict with media
portrayals which may further build on this as a social acceptance of being
overweight and/or having obesity is created (Puoane et al., 2010). On the
other end of the spectrum, losing and being low weight is associated with
poverty or with diseases such as human immunodeficiency virus (HIV)
(Matoti-Mvalo, 2006; Renzaho, 2004). In Kenya, one cross-sectional study
46
determined the prevalence of overweight and obesity and examined
perceptions of ideal body image differentiated by sex and other factors among
slum dwellers in Nairobi (Ettarh et al., 2013). They found that around 35% of
women who were overweight or had obesity underestimated their weight. In
addition, roughly 40% of women preferred to be overweight or have obesity
based on the different body image silhouettes used in the study (Ettarh et al.,
2013).
Rapid urbanisation could drive changes in body image perception due to the
multi-ethnic and multi-cultural nature of urban areas, in combination with
media portrayals of western body ideals (Gitau et al., 2014). With rural-to-
urban migration, shifts in ideal body image perception may occur alongside
changes in diet. However, a more recent mixed methods rural-to-urban
migrant study in Cameroon found out that rural traditions and perceptions of
weight persisted on migration to the city and both men and women valued
women’s weight gain after marriage. This was a sign of the husband taking
care of his wife (Cohen et al., 2017; Toselli et al., 2016). These perceptions
may however not be uniform across all migrant groups and depend on
ethnicity, gender, age at the time of migration, period of residency and socio-
economic status (Paeratakul et al., 2002; Toselli et al., 2016).
Few SSA studies have investigated the awareness of women on the
connection between body weight and diet. One cross-sectional population
study among Senegalese women of higher economic status (in terms of
household assets) showed that while they generally had adequate knowledge
about obesity as a risk factor of cardiovascular disease, there was less
awareness on the role of diet and obesity development (Holdsworth et al.,
2006). Furthermore, a qualitative study from South Africa (SA) found that only
some young black African low-income women were aware of the connection
between an excessive amount of food intake and overweight (Puoane et al.,
2006). Another SA study among low-income women found contrasting
findings as all their participants were aware of the influence of eating too much
fatty and starchy food, and consuming less red meat, oil, and fried or junk food
on overweight (Okop et al., 2016). These contrasting findings may reflect the
different time periods in which these were conducted.
47
2.4 Conceptual framework for this research study
The theoretical and empirical literature reviewed above argues that a multi-
factor conceptual framework is required to further investigate the association
between rural-to-urban migration and nutrition transition. As illustrated earlier,
the current literature does not lack conceptual frameworks to understand the
broader determinants of obesogenic dietary behaviour. A model specific to my
research objectives may however be more effective than generic behavioural
and migration models as determinants of dietary behaviour among rural-to-
urban migrant women can differ from those of energy-balance and health in
general populations (Richard et al., 2011).
Figure 2.2 presents a conceptual framework which represents key concepts
of the dietary acculturation model and socio-ecological framework on eating
and nutrition. To conceptualise the influences of migration on nutrition
transition the dietary acculturation model by Satia-Abouta et al. (2002) was
selected to inform my research. This model is integrated with the ecological
framework on healthy eating and nutrition. This model emphasises the
conceptualisation of the food environment and conditions that influence food
choices, and highlights mechanisms through which the other environmental
influences drive individual food choice (Story et al., 2008). While
environmental changes are well considered in the dietary acculturation model,
the socio-ecological framework adds to this model by considering changes in
social environment (networks) and macro-environment influences.
Furthermore, the model provides more guidance on the food environment
post-exposure as it is inspired by the community nutrition environment
conceptualised by Glanz et al. (2005) (Story et al., 2008). These are less
expressed in the dietary acculturation model.
The majority of the theoretical frameworks mentioned earlier do not include
gender as an underlying determinant. Dietary behavioural constructs may
however not apply equally to men and women. The different specified
environments of influence may also differ by gender (Sobal and Bisogni, 2009;
Wells et al., 2012). While my research focusses on women, gender disparities
for obesity and food intake are considered and postulated as an important
socio-cultural determinant in this conceptual framework.
The framework recognises socio-economic and demographic characteristics,
and environmental factors in the rural area to be influential on nutrition
transition and obesity risk. It also recognises the importance of the life stages
prior to- and during migration on someone’s dietary behaviour and nutritional
status. Socio-economic and demographic characteristics of the participants
48
and their households are potential moderators of associations between
environmental and individual factors and dietary behaviour pre- and post-
migration. In addition, pre-migration factors such as cultural beliefs, attitudes
and values and religiosity may shape a preference for foods established
during their youth. Changes in environment (area- and household levels) may
drive individual taste preferences, diet- and disease related knowledge,
attitudes, beliefs and perceptions of time and food environment.
The interplay of pre- and post-migration interplay of individual and
environmental factors influence nutrition transition which includes obesogenic
dietary behaviour and traditional food intake. This is however by no means a
linear process. and may change with life-events post-migration. The term
‘dietary behaviour’ has been used inconsistently within and across different
disciplines and research traditions which hinders comparability between
findings and hampers our understanding of the determinants of dietary
behaviour (Stok et al., 2018). A European interdisciplinary working group was
established to standardise terminology, facilitate interdisciplinary
collaboration, knowledge sharing, and data pooling. As a result, dietary
behaviour is viewed as an umbrella term for food choices, eating behaviour,
and dietary intake/nutrition (Stok et al., 2018). My research uses these terms
to improve consistency and comparability between the findings of my research
and future studies. While not illustrated in Figure 2.2, dietary behaviour also
interacts with the energy-balance behaviour physical activity and other health-
related lifestyle choices. The changes in dietary behaviour may increase the
risk of having obesity (Romieu et al., 2017).
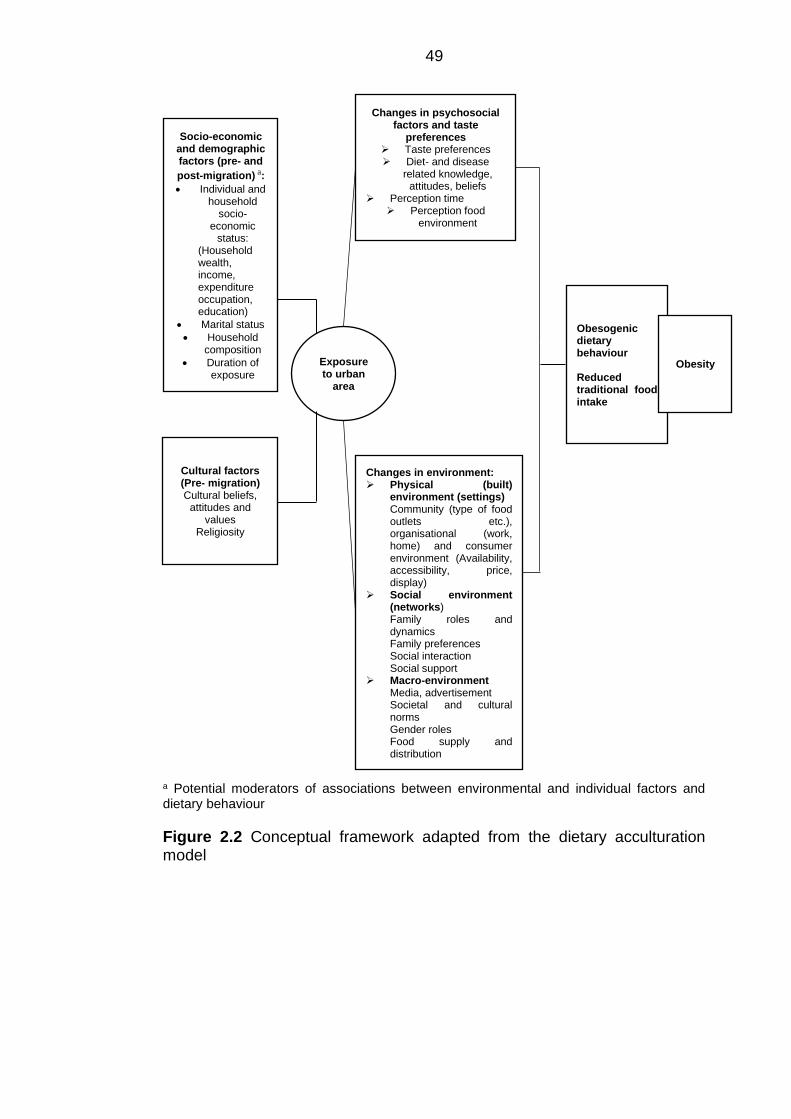
49
a Potential moderators of associations between environmental and individual factors and dietary behaviour
Figure 2.2 Conceptual framework adapted from the dietary acculturation model
Socio-economic and demographic factors (pre- and
post-migration) a:
• Individual and household
socio-economic
status: (Household wealth, income, expenditure occupation, education)
• Marital status
• Household composition
• Duration of exposure
Changes in psychosocial factors and taste
preferences ➢ Taste preferences ➢ Diet- and disease
related knowledge, attitudes, beliefs
➢ Perception time ➢ Perception food
environment
Changes in environment: ➢ Physical (built)
environment (settings) Community (type of food outlets etc.), organisational (work, home) and consumer environment (Availability, accessibility, price, display)
➢ Social environment (networks) Family roles and dynamics Family preferences Social interaction Social support
➢ Macro-environment Media, advertisement Societal and cultural norms Gender roles Food supply and distribution
Cultural factors (Pre- migration) Cultural beliefs,
attitudes and values
Religiosity
Exposure to urban
area
Obesogenic dietary behaviour Reduced traditional food intake
Obesity
50
Chapter 3 Research methodology
In this chapter I describe and provide a rationale for selecting a sequential
mixed methods design to address the set research objectives. I conclude with
a description of the research study settings in which I highlight the
heterogeneity between the different areas of data collection.
3.1 Research approach: mixed methods
Mixed methods research is an approach where researchers collect and
analyse both quantitative and qualitative data within the same overall
investigation. Quantitative research is employed to assess the magnitude and
frequency of concepts, and qualitative research is used to explore the
meaning and understanding of these concepts (Creswell et al., 2011).
The main reason I chose to utilise both quantitative and qualitative methods
is that I deemed neither quantitative nor qualitative methods were deemed
enough by themselves to effectively understand nutrition transition and
obesity risk among rural-to-urban migrant women. When used in combination,
both types of methods complement each other and allow for a more
comprehensive analysis as both strengths and weaknesses are taken
advantage of (Ivankova et al., 2006). Employing both types of methods may
also enhance the integrity of the findings, also referred to as credibility
(Bryman et al., 2008). I was also pragmatic in my decision for mixed methods
research. The quantitative household survey data that I use in this thesis do
not contain information on neighbourhood-level factors. With the qualitative
component of my research I was able to further explore the influence of
changes in environment on the rural-to-urban migrant women’s dietary
behaviour.
A research paradigm is referred to as the lens which researchers use to
approach their own research, study participants, or individuals external to the
study (Creswell and Clark, 2017). The main paradigms that are traditionally
considered as being fundamentally opposed are those of positivism and
constructivism. The positivist believes that the only truth that is out there will
be discovered by objective and value-free inquiry which underpins quantitative
research methods. It is contrasted with the idea that there is no such thing as
a single objective reality and for that reason constructivists favour qualitative
research methods (Creswell and Clark, 2017). In mixed methods, researchers
often adopt diverse philosophical positions that bridge positivist, constructivist
51
and pragmatic paradigms. However, the approach most commonly associated
with mixed methods research is pragmatism (Teddlie and Tashakkori, 2009).
This paradigm offers an alternative worldview to those of post-positivism and
constructivism as it focuses on the problem to be researched and the
consequences of the research (Creswell and Clark, 2017). It does not conform
to an abstract set of philosophical beliefs as these place practical restrictions
on worldviews. Instead, pragmatism is geared towards how a phenomenon
can be best understood and addressed (Teddlie and Tashakkori, 2009).
Trying to better understand nutrition transition with the long-term aim to
address the transition to obesogenic dietary behaviour among migrant women
was at the front of shaping the research design and applying mixed methods
to properly address it.
3.1.1 Sequential explanatory design
There are several typologies for classifying and identifying types of mixed
methods strategies: convergent parallel mixed methods, sequential
explanatory mixed methods, and sequential exploratory mixed methods
(Creswell and Clark, 2017). These can be further categorised into three
advanced mixed methods research designs that represent a mixture of
elements of the former three basic structures (Creswell and Clark, 2017).
For my research, a sequential explanatory design was chosen. It had two
distinct phases: a quantitative and then a qualitative phase. In this design, a
researcher first analyses the quantitative (numeric) data. The qualitative text
and visual data are collected and analysed second in the sequence and help
explain, or elaborate on, the quantitative results obtained in the first phase
(Creswell and Clark, 2017). In this design, more weight is typically devoted to
the quantitative data. In my research, the quantitative and qualitative are
equally weighted. The secondary data analysis allowed only a limited number
of concepts to be tested. In addition, due to the limited evidence on the
environmental influence on nutrition transition in the context of migration, the
qualitative phase is also explorative and not solely explanatory.
Multiple secondary datasets were available during the first and second year
of my research study. These allowed me to obtain a general understanding of
the (risk) factors of obesity and food intake in context of urbanisation.
Secondary data analysis as a research technique involves the analysis of data
by a researcher who may not have engaged in the data collection process
(Bryman, 2016). Due to time, and particularly financial constraints, I did not
52
deem it feasible to collect survey data. Moreover, the use of secondary data
has several advantages. For instance, it is more ethical to use existing large
datasets than collecting new data as research participants usually give up
their time without a reward. In addition, many of the datasets employed for
secondary data analysis are of high quality due to rigorous sampling
procedures, large sample sizes, and validated questions (Bryman, 2016).
As the literature review pointed out there is a lack of empirical evidence on
this topic, particularly in urban slum context. The primary qualitative data
collection was an excellent opportunity to find explanations for the quantitative
findings, give rise to new hypotheses, and provide a contextual understanding
(Bryman, 2006). Additionally, the study period of three years allowed me to
conduct a sequential explanatory design, instead of having to do the
quantitative and qualitative phases around roughly the same time.
3.2 Selected research methods
3.2.1 Quantitative phase of research: Secondary data analysis
3.2.1.1 Kenyan Demographic and Health Survey (KDHS) 2014
Few data sets exist in SSA generally, and Kenya specifically, that allow for
detailed study on migration, and changes in nutrition status and dietary
behaviour (de Brauw et al., 2014). However, the KDHS offers this opportunity
as it aimed to understand health and population trends and includes basic
indicators of maternal and child health (Rutstein and Rojas, 2006). The 2014
KDHS permits exploration of the complex mechanisms between the nutrition
transition, obesity and urbanisation on a national level. The 2014 KDHS was
designed to produce representative estimates for most of the survey indicators
at the national level, for urban and rural areas separately, at the regional level,
and for selected indicators at the county level. The sample was designed to
have 40,300 households from 1,612 clusters spread across the country, with
995 clusters in rural areas and 617 in urban areas. In the KDHS, urban areas
are defined as large cities (capital cities and cities with over 1 million
population), small cities (population between 50,000 and 1 million), and towns
(other urban areas) (International Organization for Migration, 2015).
Samples were selected independently in each sampling stratum, using a two-
stage design. In the first stage, all clusters were selected with equal probability
from the National Sample Survey and Evaluation Program (NASSEP) V
53
frame. This frame is used by the Kenyan National Bureau of Statistics (KNBS)
for conducting household surveys. The second stage involved the systematic
sampling of households listed in each cluster. From each cluster 25
households were selected. The objective of the second stage of sampling was
to ensure adequate numbers of completed individual interviews in order to
provide estimates for key indicators with the acceptable precision. All men and
women aged 15–59 and 15–49 years, respectively, in the randomly selected
households (men in half of the households) were eligible to participate in the
survey. The data collection occurred between May and October 2014.
3.2.1.2 Nairobi Urban Health and Demographic Surveillance System
(NUHDSS) 2008/2009
In the KDHS, the urban poorest are underrepresented and the Nairobi sample
is too small for subpopulation analysis. Building on this, and the evidence that
a large portion of the rural-to-urban migrants in Kenya ends up in urban slums
(Zulu et al., 2011), a second analysis was conducted. Anonymised secondary
datasets were freely obtained from APHRC. These datasets were all nested
in the NUHDSS, a pioneering urban health and demographic surveillance
system in SSA. This system has been made operational by APHRC since
2002. Every four months data are collected which include key demographic
and health information (births, deaths [including verbal autopsy data], in- and
out-migration, immunisation) and other information that characterises living
conditions in the Korogocho and Viwandani slums (e.g. household amenities
and possessions). The NUHDSS follows around 75,000 individuals in
approximately 24,000 households (Beguy et al., 2015). More on the specific
dataset that I used for this analysis can be found in Chapter 5.
3.2.1.3 Data analysis
For both secondary data analyses, descriptive statistics were utilised to look
at relationship between the selected outcome and determinants. To test the
associations between the selected characteristics and BMI and food intake
outcomes among rural-to-urban migrant women, regression modelling was
performed. Further information on the selected dependent and independent
variables, study population and analysis process are presented in Chapter 4
and Chapter 5.
54
3.2.2 Qualitative phase of research
In the qualitative phase I conducted interviewing techniques and PR methods
in Nairobi’s slums: Kibera, Korogocho and Viwandani. I chose to employ the
following interviewing methods: focus group discussions (FGDs), individual in-
depth interviews (IDIs), while incorporating PR techniques to obtain a rich
dataset. The interviewing methods were facilitated and enriched by using PR
methods such as problem trees and food environment mapping. Of these
techniques, PhotoVoice (PHV) had a more prominent role in the participatory
data collection activities. PHV is a community-based PR method which
enables the participants to identify, represent, and enhance their community
and life circumstances through photography (Skovdal and Cornish, 2015;
Wang and Burris, 1997).
The locations of the qualitative data collection expanded to include the Kibera
slum. This decision builds on the heterogeneity of slums worldwide and in
Nairobi in terms of socio-economic, demographic and infrastructure
characteristics of its population (Beguy et al., 2015; Ezeh et al., 2017; Snyder
et al., 2014; Zulu et al., 2011).
More detail on the study sampling, data collection methods, and analysis and
ethical considerations are included in Chapter 6.
3.3 Integration of data
Integration of the data in mixed method studies may occur at several stages:
data collection, data analysis, interpretation, or at all three phases (Creswell
et al., 2011). In a sequential explanatory design, researchers typically connect
the two phases while selecting the participants for the qualitative follow-up
analysis based on the quantitative results from the first phase. There are
however no established guidelines as to how researchers should proceed with
selecting the cases for the follow-up qualitative analysis or the steps to follow
(Ivankova et al., 2006).
In my thesis, the quantitative and qualitative phases integrated through
connection (sample selection), building (interview guide development), and
through a joint display. In the past, researchers have integrated the data
through joint displays to draw out new insights beyond the information gained
from the separate quantitative and qualitative results (Guetterman et al.,
2015).
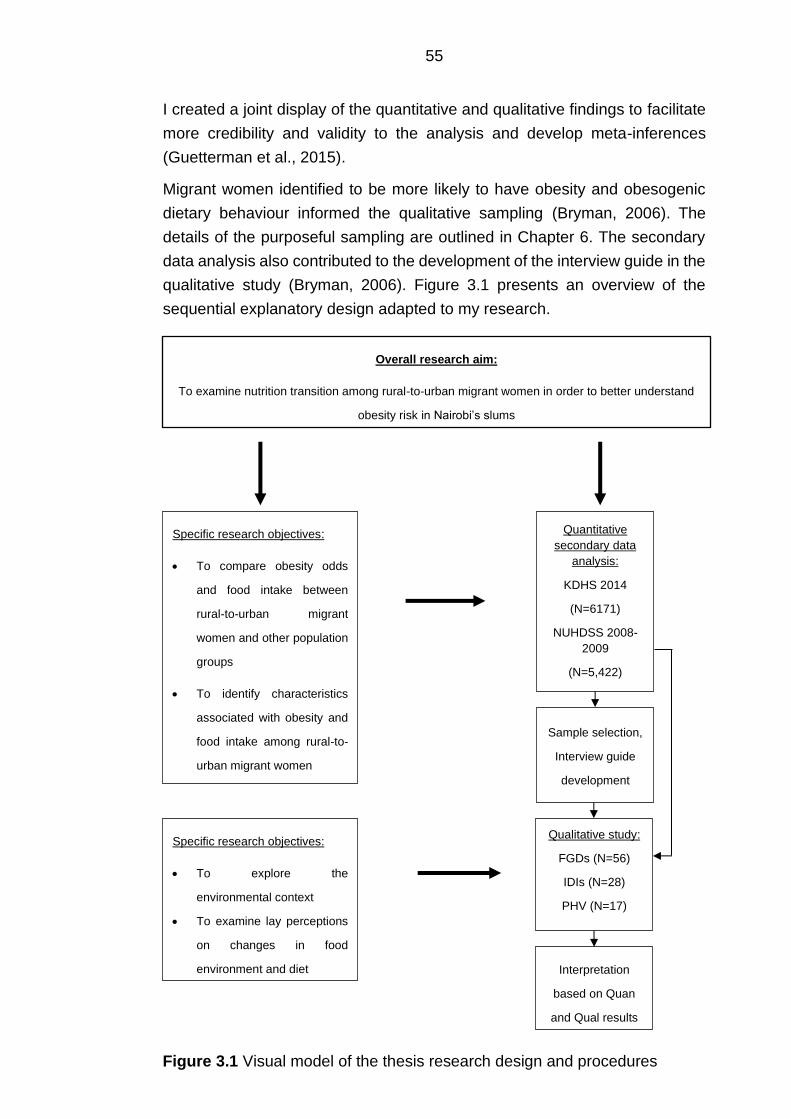
55
I created a joint display of the quantitative and qualitative findings to facilitate
more credibility and validity to the analysis and develop meta-inferences
(Guetterman et al., 2015).
Migrant women identified to be more likely to have obesity and obesogenic
dietary behaviour informed the qualitative sampling (Bryman, 2006). The
details of the purposeful sampling are outlined in Chapter 6. The secondary
data analysis also contributed to the development of the interview guide in the
qualitative study (Bryman, 2006). Figure 3.1 presents an overview of the
sequential explanatory design adapted to my research.
Overall research aim:
To examine nutrition transition among rural-to-urban migrant women in order to better understand
obesity risk in Nairobi’s slums
Specific research objectives:
• To explore the
environmental context
• To examine lay perceptions
on changes in food
environment and diet
Specific research objectives:
• To compare obesity odds
and food intake between
rural-to-urban migrant
women and other population
groups
• To identify characteristics
associated with obesity and
food intake among rural-to-
urban migrant women
Quantitative
secondary data
analysis:
KDHS 2014
(N=6171)
NUHDSS 2008-
2009
(N=5,422)
Sample selection,
Interview guide
development
Qualitative study:
FGDs (N=56)
IDIs (N=28)
PHV (N=17)
Interpretation
based on Quan
and Qual results
Figure 3.1 Visual model of the thesis research design and procedures
56
3.3.1 Integration at the interpretation and reporting level
Integration also occurred at the interpretation and reporting level. Empirical
mixed methods studies of research in health show a lack of integration
between components, even though it is considered an important aspect of
mixed methods research. Multiple authors have proposed techniques for
facilitating the integration and interpretation of mixed methods research
findings in health research (O’Cathain et al., 2010; Fetters et al., 2013).
3.4 Quality criteria in mixed methods research
I employed several strategies which are specific to the sequential explanatory
design to ensure the quality of meta-inferences based on the conclusions from
both the quantitative and qualitative study (Ivankova, 2013). A ‘meta-
inference’ is a conclusion generated through an integration of the inferences
that have been obtained from the results of both types of research methods in
a mixed methods study (Teddlie and Tashakkori, 2009).
3.4.1 Separate procedures to assess quality
I used separate procedures to assess the reliability and validity of the
quantitative data and results and the quality and rigour of the qualitative data
and findings. These will be further elaborated on in the respective chapters.
3.4.2 Participants’ qualitative and quantitative strands
Each study included different participants. It has been argued that
respondents should participate in both study strands. Selecting new
participants could lead to divergent views and cause inconsistencies in the
inferences derived from the analysis of the quantitative and qualitative data
(Teddlie and Tashakkori, 2009). In my research this was however not deemed
feasible due to the time availability, and frequent moving between and within
slums. To tackle this, I applied a maximum variation sampling in the qualitative
phase to get a substantial number of different combinations in socio-economic
and demographics.
57
3.5 Research context of quantitative and qualitative phases
3.5.1 Nairobi slum context
Nairobi’s slums are experiencing exponential growth (Beguy et al., 2015).
Figure 3.2 represents a map which includes the data collection sites.
Korogocho is the fourth largest informal settlement in Nairobi with an
estimated population of 150,000 and is comprised of nine villages (Githiri et
al., 2016). It is located north-east of Nairobi, about 12km from the Nairobi
Central Business District (CBD). Korogocho is one of the most congested
slum areas of Nairobi, with over 250 dwelling units per hectare. On average,
households with a size of about three persons occupy one rentable room.
Korogocho has a relatively stable and settled population, with residents having
lived there for several decades on average (Beguy et al., 2015).
Viwandani is located 7 km south from the CBD. The slum was established in
1973 on land that had been left by the City Council as a reserve area on the
bank of Ngong River. The settlement is located on 129 acres of land, with
approximately 21,000 households spread over thirteen villages. In Swahili,
`Viwandani’ means `at the industrial zones’ (Githiri et al., 2016). In contrast to
Korogocho, Viwandani attracts a higher flow of young people coming to the
city in search of job opportunities in the nearby industries (Zulu et al., 2011).
Findings show that the majority of the slum residents were born outside
Nairobi city, to which they migrated from rural areas in search of better
livelihood opportunities. Data from 2012 from Korogocho and Viwandani
showed that those aged 15-64 years constituted 64% and 70% females and
males.
Kibera is considered to be one of the largest slums in Nairobi and is located
five kilometres from CBD. It has grown from a population of 3,000 in 1960 to
287,000 in 1999. In late 2013, Kibera had an estimated population of 341,493
residents (Ahmed et al., 2015). The original settlers were Nubian (people from
the Kenyan/Sudanese border with the majority being Muslim) and represented
about 15% of those in Kibera. As in Korogocho, residents in Kibera seem more
inclined to settle due to unaffordable house rent elsewhere. Like Korogocho,
multiple generations reside here (African Population and Health Research
Centre, 2014; Kibera UK, 2020).
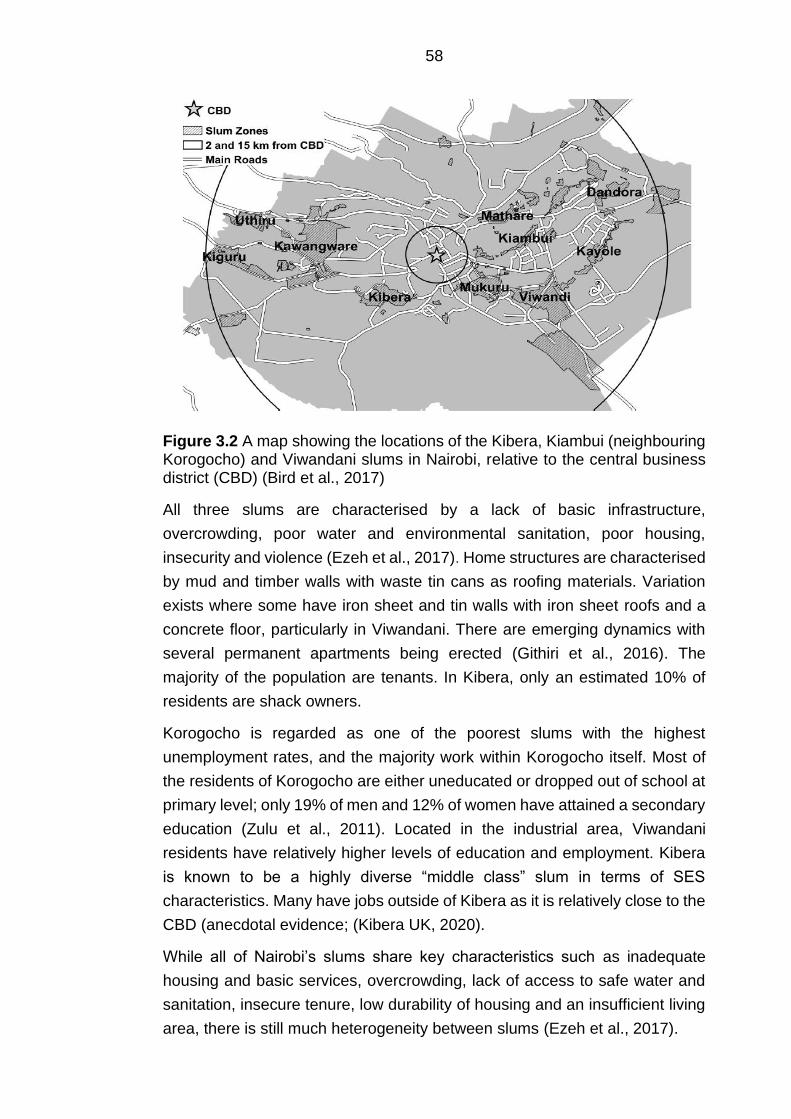
58
Figure 3.2 A map showing the locations of the Kibera, Kiambui (neighbouring Korogocho) and Viwandani slums in Nairobi, relative to the central business district (CBD) (Bird et al., 2017)
All three slums are characterised by a lack of basic infrastructure,
overcrowding, poor water and environmental sanitation, poor housing,
insecurity and violence (Ezeh et al., 2017). Home structures are characterised
by mud and timber walls with waste tin cans as roofing materials. Variation
exists where some have iron sheet and tin walls with iron sheet roofs and a
concrete floor, particularly in Viwandani. There are emerging dynamics with
several permanent apartments being erected (Githiri et al., 2016). The
majority of the population are tenants. In Kibera, only an estimated 10% of
residents are shack owners.
Korogocho is regarded as one of the poorest slums with the highest
unemployment rates, and the majority work within Korogocho itself. Most of
the residents of Korogocho are either uneducated or dropped out of school at
primary level; only 19% of men and 12% of women have attained a secondary
education (Zulu et al., 2011). Located in the industrial area, Viwandani
residents have relatively higher levels of education and employment. Kibera
is known to be a highly diverse “middle class” slum in terms of SES
characteristics. Many have jobs outside of Kibera as it is relatively close to the
CBD (anecdotal evidence; (Kibera UK, 2020).
While all of Nairobi’s slums share key characteristics such as inadequate
housing and basic services, overcrowding, lack of access to safe water and
sanitation, insecure tenure, low durability of housing and an insufficient living
area, there is still much heterogeneity between slums (Ezeh et al., 2017).

59
The above section presents substantial differences in socio-economic and
demographic characteristics, particularly in relation to duration of residence,
the type of IGA, relative levels of income, spatial accessibility to other food
sources, and ethnic make-up (Beguy et al., 2015; Kibera UK, 2020).
Even within the slum neighbourhoods, the villages represent different
communities with different ethnic profiles. In this thesis I adopt the definition
of community as a group of people with diverse characteristics who are linked
by social ties, and engage in joint action in geographical locations or settings
(MacQueen et al., 2001).
60
Chapter 4 Nutrition transition and obesity among rural-urban
migrant women in Kenya (DHS)
This chapter outlines a secondary analysis using nationally representative
data provided by the DHS program in Kenya. To reiterate Chapter 1, Kenya is
undergoing nutrition transition which reflects community and population shifts
in dietary patterns typified by a reduction in fibre-rich foods such as coarse
grains, legumes, fruits and vegetables, and an increase in ASF, edible oils,
sugar, and energy-dense refined foods (Raschke and Cheema, 2008; Steyn
et al., 2011b). The SSA literature indicates that, to date, nutrition transition is
most apparent in its urban areas, hence rural-to-urban migration has the
potential to fuel national obesity levels with the consequence that Kenya faces
a double burden of malnutrition (i.e. both under- and over-nutrition) (Pawloski
et al., 2012). Migrant and non-migrant studies in SSA have shown that
prolonged urban living was associated with higher obesity risk (Sobngwi et al.,
2004; Unwin et al., 2010).
Detailed knowledge about rural-to-urban migration and changes in diet and
weight status is therefore important to better understand the impact of
urbanisation on obesity and identify appropriate interventions to target this
group in Kenya. My literature review implied that there is a lack of country-
specific information available on rural-to-urban migrant women at risk of
having obesity. Wider non-migrant literature in Kenya and SSA identified
some of the socio-economic and demographic characteristics of women prone
to having obesity (Mbochi et al., 2012; Steyn et al., 2011b; Ziraba et al., 2009).
4.1 Context of this analysis
Rural and urban food intake patterns in Kenya are observed to be very
different (Steyn et al., 2012). Fundamental to these differences in behaviours
and health outcomes may be the socio-economic differences between rural
and urban areas. The 2014 KDHS indicated large rural-urban differences in
agricultural practice. This report indicated that 79% of rural households and
48 % of urban households owned land. More than three-quarter of the rural
population owned farm animals, against 43% in urban areas. Moreover, the
large differences in household wealth between rural, migrant and urban
households may strongly contribute to the variation in diet and cooking
behaviours.
61
The most common source of drinking water in urban areas was water piped
into the dwelling, yard or plot. Almost half (46%) of households used this
source. The most common source of drinking water in rural areas was surface
water (24%). Over 9 in 10 rural households continue to use solid fuels
(coal/lignite, charcoal, wood, straw/shrubs/grass, and agricultural crops).
Households that do not use solid fuels mostly use gas or kerosene.
Furthermore, most households in urban areas had electricity (68%), against
only 13% of rural households. A refrigerator was available in 13% of urban
households and only 2% of rural households (Kenya National Bureau of
Statistics et al., 2015).
4.2 Analysis objectives
With this analysis I addressed several objectives. The first objective of this
analysis was to examine nutrition transition and population weight gain in
Kenya in the context of urbanisation. This was done by comparing rural-to-
urban migrant women with rural and urban non-migrant women for weight
status and household food intake. The second objective of this analysis was
to identify the socio-economic and demographic characteristics of rural-to-
urban migrant women prone to having obesity.
4.3 Methods
4.3.1 Study population
The study population comprised a nationally representative cross-sectional
weighted sample of 6,171 non-pregnant women aged 18-49 who provided
complete data on weight and height. All women aged 15-49 years were
eligible to participate in the survey. I limited the analysis to non-pregnant
women in order to avoid bias, as pregnant women are likely to weigh more
than their normal weight.
62
4.3.2 Study outcomes
The outcome variables of the analysis were women’s BMI (kg/m2) and
nutrition transition. I derived BMI by dividing weight (in kilograms) by height
(in metres) squared.
I then classified BMI of female participants as normal weight (18.5-24.9
kg/m2), overweight (25.0-29.9 kg/m2), or having obesity (≥30.0 kg/m2)(WHO,
2018). In the KDHS, trained field technicians used standard techniques to
measure height and weight objectively. Weight measurements were taken
using an electronic scale (SECA scale), while standing height measurements
were taken using height/length (Shorr) boards (Kenya National Bureau of
Statistics et al., 2015).
I used 15 of 16 available household food intake categories to define nutrition
transition in this study. Each household was asked for the number of days a
certain food was consumed in the past 7 days. Therefore, each food group
outcome variable takes values from 0-7. I excluded the food group
“condiments” (main source of condiments and spices such as tea, coffee, salt,
garlic) was excluded from this analysis as it is not deemed to be a key
characteristic of nutrition transition and weight gain in LMICs and SSA
literature. These questions were developed by the World Food Programme
(WFP) (World Food Programme, 2008).
Following the common description of nutrition transition (Popkin, 2015) in this
analysis it was taken to mean rural-to-urban migrants having a lower intake of
coarse grains, legumes, fruits and vegetables (cereals and grains, roots and
tubers, pulses/nuts, and all vegetable and fruit groups), and a higher intake of
ASF (meat, organ meats, fish or shellfish, eggs, milk and other dairy products),
oils (fats), and sugary energy-dense foods and beverages (sweets) compared
with rural non-migrants, while having a similar food group intake to urban non-
migrants. Table 4.1 presents the fifteen food groups to define nutrition
transition.
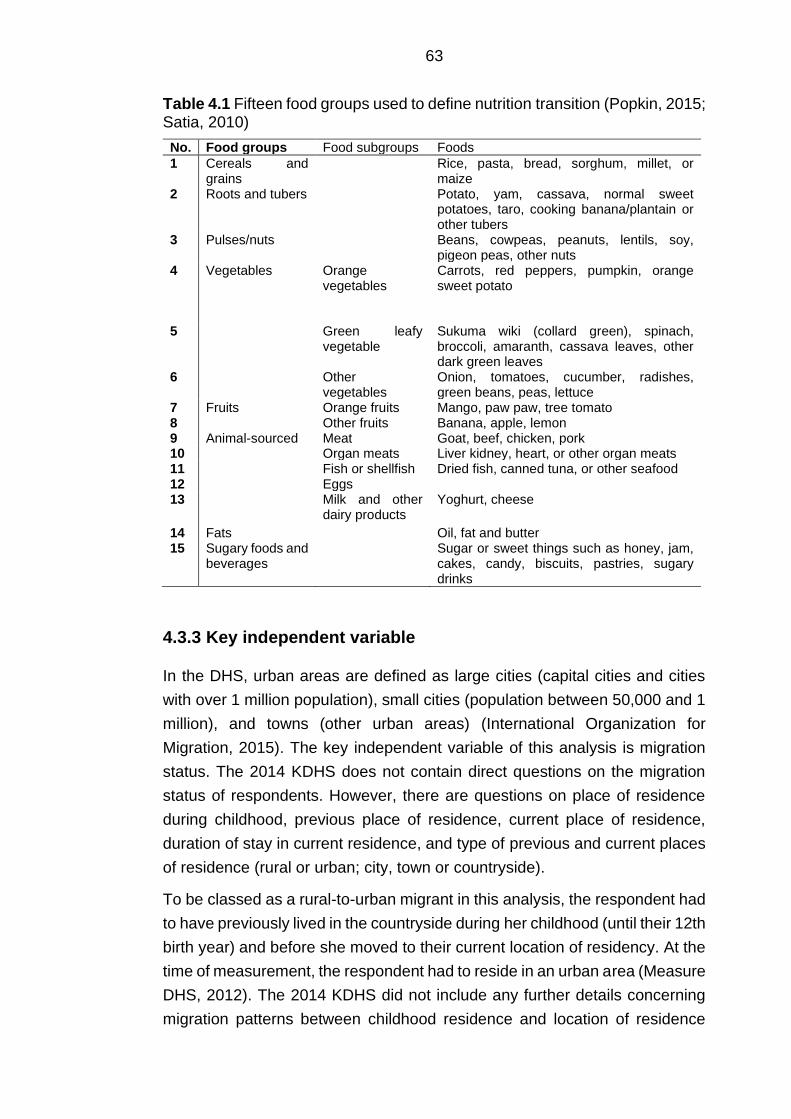
63
Table 4.1 Fifteen food groups used to define nutrition transition (Popkin, 2015; Satia, 2010)
No. Food groups Food subgroups Foods
1 Cereals and grains
Rice, pasta, bread, sorghum, millet, or maize
2 Roots and tubers Potato, yam, cassava, normal sweet potatoes, taro, cooking banana/plantain or other tubers
3 Pulses/nuts Beans, cowpeas, peanuts, lentils, soy, pigeon peas, other nuts
4 Vegetables Orange vegetables
Carrots, red peppers, pumpkin, orange sweet potato
5 Green leafy vegetable
Sukuma wiki (collard green), spinach, broccoli, amaranth, cassava leaves, other dark green leaves
6 Other vegetables
Onion, tomatoes, cucumber, radishes, green beans, peas, lettuce
7 Fruits Orange fruits Mango, paw paw, tree tomato 8 Other fruits Banana, apple, lemon 9 Animal-sourced Meat Goat, beef, chicken, pork 10 Organ meats Liver kidney, heart, or other organ meats 11 Fish or shellfish Dried fish, canned tuna, or other seafood 12 Eggs 13 Milk and other
dairy products Yoghurt, cheese
14 Fats Oil, fat and butter 15 Sugary foods and
beverages Sugar or sweet things such as honey, jam,
cakes, candy, biscuits, pastries, sugary drinks
4.3.3 Key independent variable
In the DHS, urban areas are defined as large cities (capital cities and cities
with over 1 million population), small cities (population between 50,000 and 1
million), and towns (other urban areas) (International Organization for
Migration, 2015). The key independent variable of this analysis is migration
status. The 2014 KDHS does not contain direct questions on the migration
status of respondents. However, there are questions on place of residence
during childhood, previous place of residence, current place of residence,
duration of stay in current residence, and type of previous and current places
of residence (rural or urban; city, town or countryside).
To be classed as a rural-to-urban migrant in this analysis, the respondent had
to have previously lived in the countryside during her childhood (until their 12th
birth year) and before she moved to their current location of residency. At the
time of measurement, the respondent had to reside in an urban area (Measure
DHS, 2012). The 2014 KDHS did not include any further details concerning
migration patterns between childhood residence and location of residence
64
before arriving in the urban area. I considered respondents as “urban non-
migrants” and “rural non-migrants” if they responded “always” to the question
on duration of stay in current residence. A proportion of non-migrants (2.7 %
of rural-non-migrants and 38.6 % of urban non-migrants) did however have
their place of birth in a different geographical area (rural or urban) from their
current residence.
4.3.4 Socio-economic and demographic characteristics
The differences in household food intake and weight status between rural non-
migrants, rural-to-urban migrants and urban non-migrants were controlled for
socio-economic and demographic characteristics with a forward stepwise
procedure. I did this to explore which characteristics modify the association
between nutrition transition and migration status, and to control for
confounding due to important determinants of food intake and weight status
other than migration status which may differ between migrants and non-
migrants. Based on the dietary acculturation model (Satia-Abouta et al.,
2002), the following characteristics selected for control were: women’s age,
women’s occupation, women’s education, women’s religion, women’s
ethnicity, marital status, household number of children under five years of age
and household wealth.
Based on availability in the KDHS, and non-migrant literature in Kenya and
SSA I selected socio-economic and demographic characteristics which are
potentially related to being overweight/having obesity (Mbochi et al., 2012;
Steyn and McHiza, 2014; Ziraba et al., 2009). These characteristics included
women’s age, women’s employment, women’s education, marital status,
household number of children under five years of age, and household wealth.
I also included duration of residence in the urban area to gain more detail on
the effect of prolonged exposure to urban areas on obesity risk.
4.3.4.1 Measurement of independent variables
For age, women were asked in what month and year they were born. I
calculated the number of years from these measurements. The variable age
consisted of the following three categories: 1.) 15-29; 2.) 30-39; and 3.) 40-
49.
I determined women’s education attainment by combining two questions. The
first was whether they had ever attended school. If the respondents gave a
65
positive answer, they were asked for the highest level of school they attended.
The respondents were able to choose from primary, post-primary/vocational,
secondary, college (middle level) and university. I combined the initial
categories primary and post-primary, and the categories secondary, college
and university due to low cell counts in some of the categories.
I derived the women’s occupation variable from multiple questions. The first
question asked the respondent what her occupation was or what kind of work
she mainly did in the last 12 months. Furthermore, she was asked whether
she did this work for a member of her family, for someone else, or whether
she was self-employed. From this question the category self-employment was
derived. The final question addressed whether she was paid in cash or kind
for this work or whether she was paid at all. I recoded these questions to a
variable which consists of the groups “not paid”, “cash only”, and “cash in
kind”.
I created a variable for both women’s religion and ethnicity from one question.
Ethnicity included all groups which did not have to be collapsed to allow for
subpopulation analysis. Religious affiliation was categorised as Roman
Catholic, protestant/other Christian or Muslim based on the questioning in the
survey’s interview tool. The category “no religion” was exempt from this
analysis due to low cell count.
Women were also asked for their current marital status. I used three questions
to derive women’s marital status. The first two questions established whether
they were in union. They were asked whether they are currently married or
living with a man if they gave a positive answer to the first question. The final
question identified whether women were widowed, divorced or separated.
Based on these questions I categorised marital status as never married,
married/living together, and divorced/separated/widowed.
I derived information on the number of children under five years from the
household questionnaire. I recoded the provided number of children into four
separate categories in order to obtain a similar number of observations across
categories.
In the DHS, household wealth is a composite measure of a household’s
assets. The wealth index in the 2014 KDHS is an improved version of the
index used in previous surveys as it takes the urban-rural differences into
account. The first and second step were done separately for urban and rural
areas prior to creating a national wealth index in the final step. Additional detail
66
on the construction of household wealth in the KDHS is described elsewhere
(Kenya National Bureau of Statistics et al., 2015).
4.3.5 Statistical analysis
4.3.5.1 Descriptive analysis
I used descriptive statistics to summarise weight status, nutrition transition and
the socio-economic and demographic characteristics of the rural non-
migrants, rural-to-urban migrants, and urban non-migrants. I presented
nutrition transition based on the reported days of week each food group is
consumed on average.
4.3.5.2 Bivariate analysis on associations between weight status and
socio-economic and demographic characteristics among rural-
to-urban migrant women
I conducted bivariate analysis (chi-square tests) for the identification of
demographic and socio-economic factors associated with obesity among
rural-to-urban migrants. I set the significance levels at 0.20 for the univariate
analysis to do not lose potentially important variables for the model building.
When the outcome studied is relatively novel and important factors may not
be known, purposeful selection of covariates or factors may be applied
(Hosmer Jr et al., 2013). I therefore conducted bivariate analysis to test the
simple associations between the socio-economic and demographic
characteristics and obesity among rural-to-urban migrant women. When one
considers a model with many variables, significant associations may be
obtained from “noise” variables unrelated to the outcome variable (Hosmer Jr
et al., 2013).
4.3.5.3 Testing for multi-collinearity
I assessed predictive factors which were significantly associated with obesity
risk for collinearity using Pearson’s correlation coefficient. This test measures
the strength of the association between the two variables. The estimates for a
regression model cannot be uniquely computed when there is a perfect linear
association between the variables. When the degree of collinearity increases,
the regression model estimates may become unstable and standard errors of
67
coefficients may be inflated (Hosmer Jr et al., 2013). Positive or negative
correlations greater than 0.9 indicate problematic correlation. In this case, one
of the two predictors could be removed from the model, or partial least squares
regression (PLS) or principal component analysis (PCA) could be applied to
generate a smaller set of variables with uncorrelated components (Hosmer Jr
et al., 2013). None of the results suggested a presence of problematic
collinearity.
4.3.5.4 Ordinal regression analysis
I performed multiple ordinal regression analyses to measure how the
likelihood of weight status (normal, overweight or obesity) was related to
migration status (rural non-migrants, rural-to-urban non migrants, urban non-
migrants) whilst either controlling for a range of potentially confounding
variables or competing exposures or while not controlling for these variables.
I also used these to measure how, for each food group, the likelihood of
consuming that food group for 0-7 days per week was related to migration
status (rural non-migrants, rural-to-urban non migrants, urban non-migrants)
whilst either controlling for a range of potentially confounding variables or
competing exposures or not controlling for these variables. The procedures
for controlment were that one socio-economic or demographic variable was
added to explore how the association with migration status changed. I added
household wealth last to the models due to its potential importance on obesity
and household food intake (Carrillo-Larco et al., 2015; Madise and Letamo,
2017; Mbochi et al., 2012; Neuman et al., 2013).
Finally, I performed a stepwise backward ordinal regression analysis to
assess the association between the selected socio-economic and
demographic characteristics and weight status among rural-to-urban
migrants. I chose ordinal regression analysis over binary or multinomial
regression. The latter would ignore the information conveyed by the ordered
nature of the outcome variable and could potentially lead to a loss of efficiency
(Peterson and Harrell, 1990).
I completed the analysis in Stata v14, with svyset commands to apply inverse
probability weights which account for oversampling of urban primary sampling
units (PSU) and stratification by district. I reported means, standard deviations
(SD), odds ratios (OR) and 95% confidence intervals (CI) throughout the
analysis. I used a p-value of < 0.05 to indicate statistical significance.
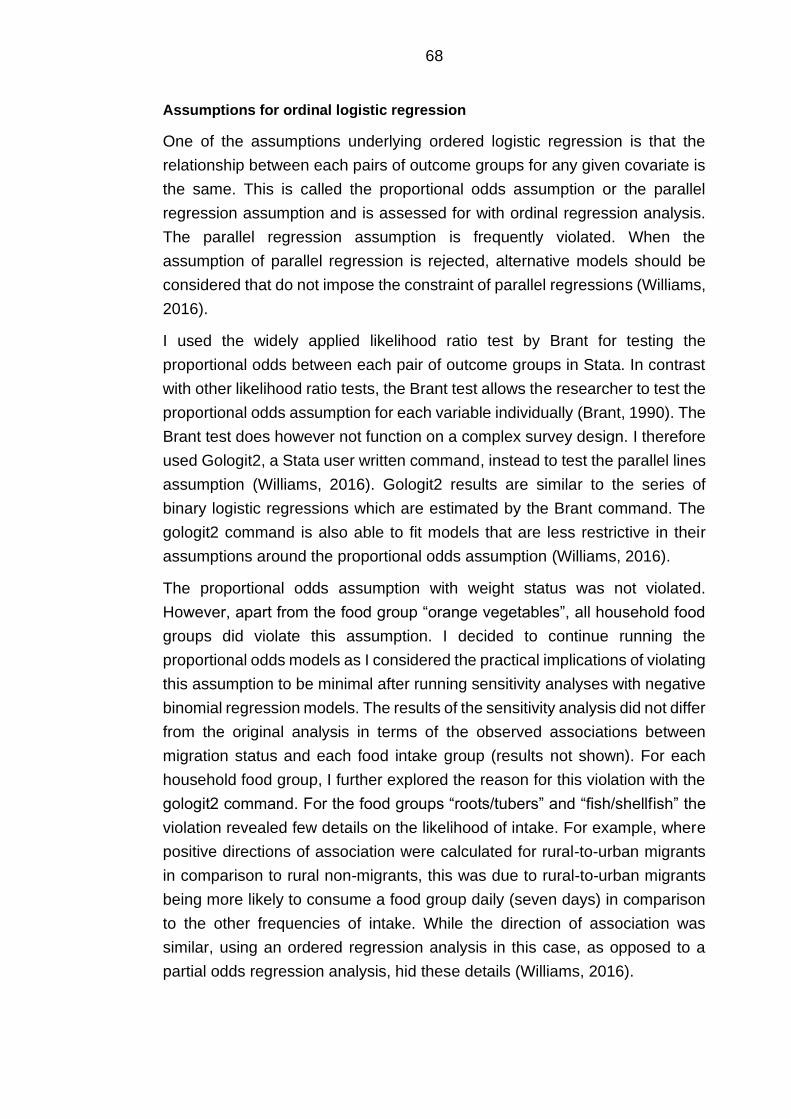
68
Assumptions for ordinal logistic regression
One of the assumptions underlying ordered logistic regression is that the
relationship between each pairs of outcome groups for any given covariate is
the same. This is called the proportional odds assumption or the parallel
regression assumption and is assessed for with ordinal regression analysis.
The parallel regression assumption is frequently violated. When the
assumption of parallel regression is rejected, alternative models should be
considered that do not impose the constraint of parallel regressions (Williams,
2016).
I used the widely applied likelihood ratio test by Brant for testing the
proportional odds between each pair of outcome groups in Stata. In contrast
with other likelihood ratio tests, the Brant test allows the researcher to test the
proportional odds assumption for each variable individually (Brant, 1990). The
Brant test does however not function on a complex survey design. I therefore
used Gologit2, a Stata user written command, instead to test the parallel lines
assumption (Williams, 2016). Gologit2 results are similar to the series of
binary logistic regressions which are estimated by the Brant command. The
gologit2 command is also able to fit models that are less restrictive in their
assumptions around the proportional odds assumption (Williams, 2016).
The proportional odds assumption with weight status was not violated.
However, apart from the food group “orange vegetables”, all household food
groups did violate this assumption. I decided to continue running the
proportional odds models as I considered the practical implications of violating
this assumption to be minimal after running sensitivity analyses with negative
binomial regression models. The results of the sensitivity analysis did not differ
from the original analysis in terms of the observed associations between
migration status and each food intake group (results not shown). For each
household food group, I further explored the reason for this violation with the
gologit2 command. For the food groups “roots/tubers” and “fish/shellfish” the
violation revealed few details on the likelihood of intake. For example, where
positive directions of association were calculated for rural-to-urban migrants
in comparison to rural non-migrants, this was due to rural-to-urban migrants
being more likely to consume a food group daily (seven days) in comparison
to the other frequencies of intake. While the direction of association was
similar, using an ordered regression analysis in this case, as opposed to a
partial odds regression analysis, hid these details (Williams, 2016).
69
I also considered binary outcome and multinomial regression. However,
collapsing the days per week intake with binary outcome modelling would
have led to a substantial loss of ordinal information. Multinomial regression
may be difficult to interpret and is considered to be less parsimonious (Long
and Freese, 2014; Williams, 2016).
4.4 Results
4.4.1 Descriptive analysis
Table 4.2 presents weight status, and socio-economic and demographic
characteristics of 6,171 (weighted total) rural-non-migrant, rural-to-urban
migrant and urban non-migrant women in the sample. I identified in total,
2,269 (36.8%) women as rural-to-urban migrants, 2,915 (47.2%) as rural non-
migrants, and 987 (16.0%) as urban non-migrants (Table 4.2).
Of the rural non-migrants, 16% and 5% were overweight and with obesity
respectively, against 30% and 16% of rural-to-urban migrants. Of the urban
non-migrants, 23% and 18% were overweight and with obesity respectively
(Table 4.2).
A little over half (57%) of the rural-to-urban migrant women were aged 15-29,
while 62% were married or living together. Only 5% of the female rural non-
migrants were in the richest household wealth quintile, compared to 52% of
the female rural-to-urban migrants and 51% of the female urban non-migrants
(Table 4.2).
70
Table 4.2 Descriptive analysis of respondents' characteristics by migration status
Rural non-migrants
Rural-to-urban migrants
Urban non-migrants
n* % n* % n* %
Total number 2,915 47.2 2,269 36.8 987 16.0
Characteristics
Weight status Healthy weight (18.5-25 kg/m2) Overweight (25-29.9 kg/m2) Obese (≥ 30.0 kg/m2) Total
1,890 378 130
2,398
78.8 15.8
5.4
1,133 624 322
2,079
54.5 30.0 15.5
517 222 117 856
60.4 25.9 13.7
Women’s age 15-29 30-39 40-49 Total
2,021 510 384
2,915
69.3 17.5 13.2
1,286 690 293
2,269
56.7 30.4 12.9
664 189 133 986
67.3 19.2 13.5
Women’s occupation Not working outside the home Self-employment Employed, any cash Employed, in kind only Total
1,545 442 868
58 2,913
53.0 15.2 29.8
2.0
607 118
1,522 20
2,267
26.8 5.2
67.1 0.9
446 67
469 4
986
45.2 6.8
47.6 0.4
Women’s education No education Primary Secondary or higher Total
330 1,573 1,012 2,915
11.3 54.0 34.7
66 1,025 1,177 2,268
2.9 45.2 51.9
54 345 588 987
5.5 34.9 59.6
Marital status
Never married Married/living together Divorced/Separated/widowed Total
1,676 953 286
2,915
57.5 32.7
9.8
563 1,399
307 2,269
2.8 61.7 13.5
490 385 112 987
49.6 39.0 11.4
Number of children under 5 in household
0 1 2 3+ Total
1,160 963 528 264
2,915
39.8 33.0 18.1
9.2
867 939 396
66 2,268
38.2 41.4 17.5
2.9
480 346 109
51 986
48.7 35.1 11.0
5.2
Religion
Protestant/other Christian Roman catholic Muslim Total
2,038 595 222
2,855
71.4 20.8
7.8
1,685 483
82 2,250
74.9 21.5
3.6
606 218 152 976
62.1 22.3 15.6
Ethnicity Kikuyu Kalenjin Kamba Luhya Luo Mijikenda/swahili Somali Other Total
393 592 391 355 151 142 108 783
2,915
13.5 20.3 13.4 12.2
5.2 4.8 3.7
26.9
672 191 377 340 198
73 19
399 2,269
29.6 8.4
16.6 15.0
8.7 3.2 0.9
17.6
277 76 65
129 164
55 67
153 986
28.0 7.7 6.6
13.1 16.7
5.6 6.8
15.5
Household wealth quintiles Poorest Poorer Middle Richer Richest Total
831 741 770 438 135
2,915
28.5 25.4 26.4 15.0
4.7
98 164 215 617
1,175 2,269
4.3 7.2 9.5
27.2 51.8
81 98 88
212 508 987
8.2 9.9 8.9
21.5 51.5
*Weighted
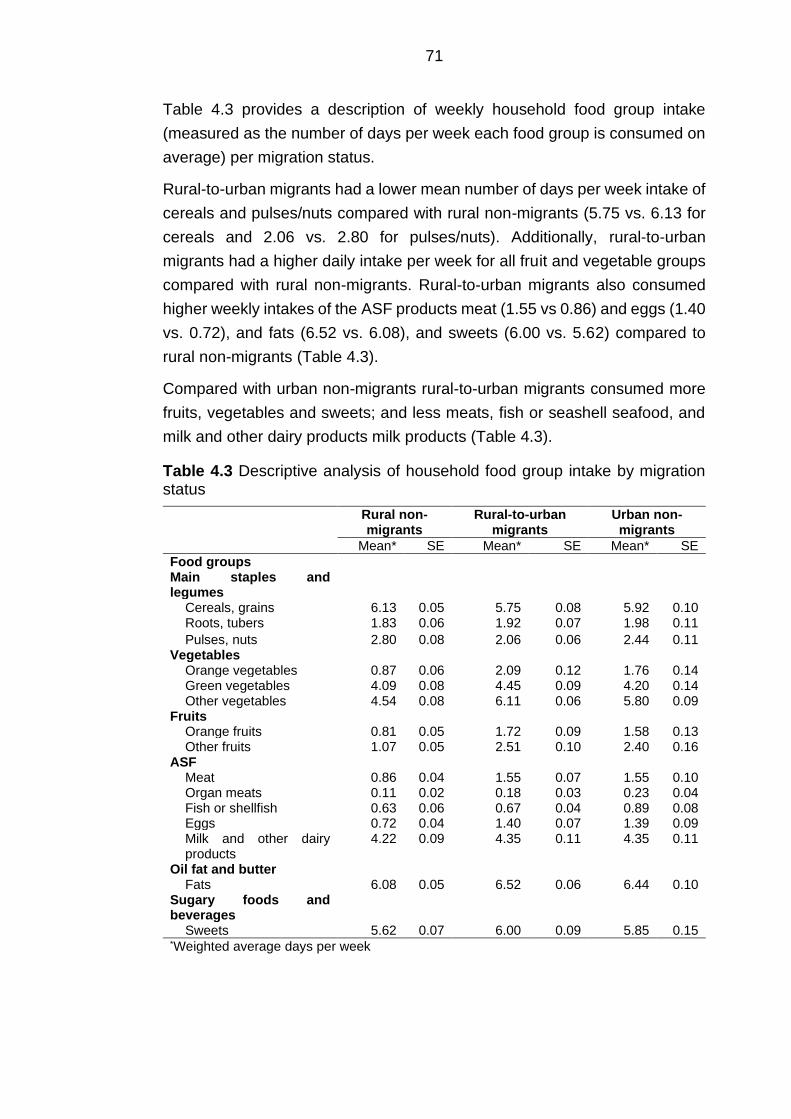
71
Table 4.3 provides a description of weekly household food group intake
(measured as the number of days per week each food group is consumed on
average) per migration status.
Rural-to-urban migrants had a lower mean number of days per week intake of
cereals and pulses/nuts compared with rural non-migrants (5.75 vs. 6.13 for
cereals and 2.06 vs. 2.80 for pulses/nuts). Additionally, rural-to-urban
migrants had a higher daily intake per week for all fruit and vegetable groups
compared with rural non-migrants. Rural-to-urban migrants also consumed
higher weekly intakes of the ASF products meat (1.55 vs 0.86) and eggs (1.40
vs. 0.72), and fats (6.52 vs. 6.08), and sweets (6.00 vs. 5.62) compared to
rural non-migrants (Table 4.3).
Compared with urban non-migrants rural-to-urban migrants consumed more
fruits, vegetables and sweets; and less meats, fish or seashell seafood, and
milk and other dairy products milk products (Table 4.3).
Table 4.3 Descriptive analysis of household food group intake by migration status
Rural non-migrants
Rural-to-urban migrants
Urban non-migrants
Mean* SE Mean* SE Mean* SE
Food groups Main staples and legumes
Cereals, grains 6.13 0.05 5.75 0.08 5.92 0.10 Roots, tubers 1.83 0.06 1.92 0.07 1.98 0.11
Pulses, nuts 2.80 0.08 2.06 0.06 2.44 0.11 Vegetables
Orange vegetables 0.87 0.06 2.09 0.12 1.76 0.14 Green vegetables 4.09 0.08 4.45 0.09 4.20 0.14 Other vegetables 4.54 0.08 6.11 0.06 5.80 0.09
Fruits Orange fruits 0.81 0.05 1.72 0.09 1.58 0.13 Other fruits 1.07 0.05 2.51 0.10 2.40 0.16
ASF Meat 0.86 0.04 1.55 0.07 1.55 0.10 Organ meats 0.11 0.02 0.18 0.03 0.23 0.04 Fish or shellfish 0.63 0.06 0.67 0.04 0.89 0.08 Eggs 0.72 0.04 1.40 0.07 1.39 0.09 Milk and other dairy products
4.22 0.09 4.35 0.11 4.35 0.11
Oil fat and butter Fats 6.08 0.05 6.52 0.06 6.44 0.10
Sugary foods and beverages
Sweets 5.62 0.07 6.00 0.09 5.85 0.15 *Weighted average days per week
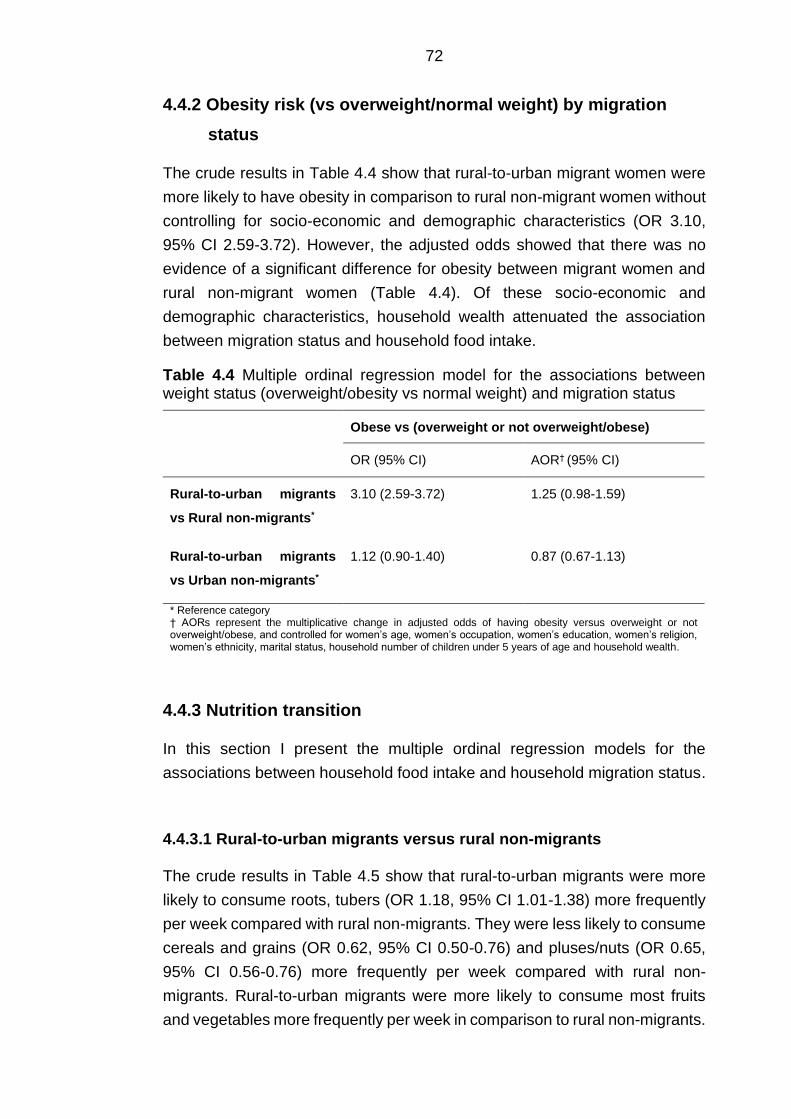
72
4.4.2 Obesity risk (vs overweight/normal weight) by migration
status
The crude results in Table 4.4 show that rural-to-urban migrant women were
more likely to have obesity in comparison to rural non-migrant women without
controlling for socio-economic and demographic characteristics (OR 3.10,
95% CI 2.59-3.72). However, the adjusted odds showed that there was no
evidence of a significant difference for obesity between migrant women and
rural non-migrant women (Table 4.4). Of these socio-economic and
demographic characteristics, household wealth attenuated the association
between migration status and household food intake.
Table 4.4 Multiple ordinal regression model for the associations between weight status (overweight/obesity vs normal weight) and migration status
Obese vs (overweight or not overweight/obese)
OR (95% CI) AOR† (95% CI)
Rural-to-urban migrants
vs Rural non-migrants*
3.10 (2.59-3.72) 1.25 (0.98-1.59)
Rural-to-urban migrants
vs Urban non-migrants*
1.12 (0.90-1.40) 0.87 (0.67-1.13)
* Reference category † AORs represent the multiplicative change in adjusted odds of having obesity versus overweight or not overweight/obese, and controlled for women’s age, women’s occupation, women’s education, women’s religion, women’s ethnicity, marital status, household number of children under 5 years of age and household wealth.
4.4.3 Nutrition transition
In this section I present the multiple ordinal regression models for the
associations between household food intake and household migration status.
4.4.3.1 Rural-to-urban migrants versus rural non-migrants
The crude results in Table 4.5 show that rural-to-urban migrants were more
likely to consume roots, tubers (OR 1.18, 95% CI 1.01-1.38) more frequently
per week compared with rural non-migrants. They were less likely to consume
cereals and grains (OR 0.62, 95% CI 0.50-0.76) and pluses/nuts (OR 0.65,
95% CI 0.56-0.76) more frequently per week compared with rural non-
migrants. Rural-to-urban migrants were more likely to consume most fruits
and vegetables more frequently per week in comparison to rural non-migrants.
73
An increased likelihood was observed for orange fruits (OR 2.75, 95% CI 2.26-
3.33) and vegetables (OR 3.22, 95% CI 2.62-3.96), other fruits (OR 3.65, 95%
CI 3.03-4.39) and vegetables (OR 3.77, 95% CI 3.13-4.55) and green leafy
vegetables (OR 1.27, 95% CI 1.07-1.51) (Table 4.6). Rural-to-urban migrants
were also more likely to consume the ASF meat (OR 2.45, 95% CI 2.06-2.93),
organ meats (OR 1.78 95% CI 1.36-2.35), fish or shellfish (OR 1.55, 95% CI
1.26-1.89) and eggs (OR 2.92, 95% CI 2.46-3.45) more frequently per week
in comparison to rural non-migrants (Table 4.7). Furthermore, rural-to-urban
migrant women were more likely to consume fats (OR 2.45, 95% CI 1.87-3.22)
and sweets (OR 1.63, 95% CI 1.28-2.07) more frequently per week in
comparison to rural non-migrants (Table 4.8).
The adjusted results in Table 4.5 show that rural-to-urban migrant women
were still less likely to consume cereals, grains (AOR 0.69, 95% CI 0.54-0.88)
and pulses, nuts (AOR 0.51, 95% CI 0.41-0.62) more frequently per week in
comparison to rural non-migrant women. After controlling for household
wealth, in addition to other characteristics, rural-to-urban migrants were now
also less likely to consume roots and tubers (AOR 0.80, 95% CI 0.66-0.96)
more frequently per week compared with rural non-migrants (Table 4.5). As
for weekly vegetable and fruit intake, distinct differences between rural-to-
urban migrant women and rural non-migrant women were observed. Rural-to-
urban migrant women were more likely to orange vegetables (AOR 1.35, 95%
CI 1.10-1.67), other vegetables (AOR 1.39, 95% CI 1.09-1.77), orange fruits
(AOR 1.44, 95% CI 1.17-1.78) and other fruits (AOR 1.60, 95% CI 1.32-1.95)
more frequently per week. The respective effect sizes reduced substantially
after controlling for household wealth (Table 4.6). Of these socio-economic
and demographic characteristics, household wealth attenuated the
association between migration status and most ASF, oil fat and butter, and
sweets (Table 4.7 and Table 4.8).
4.4.3.2 Rural-to-urban migrants versus urban non-migrants
There were no distinct differences in weekly intake of most food groups
between rural-to-urban migrants and urban non-migrants before and after
controlling for socio-economic and demographic characteristics.
Rural-to-urban migrants were more likely to consume orange (OR 1.28, 95%
CI 1.09-1.77) and other (OR 1.39, 95% CI 1.09-1.77) vegetables more
frequently per week in comparison to urban non-migrants (Table 4.6). The
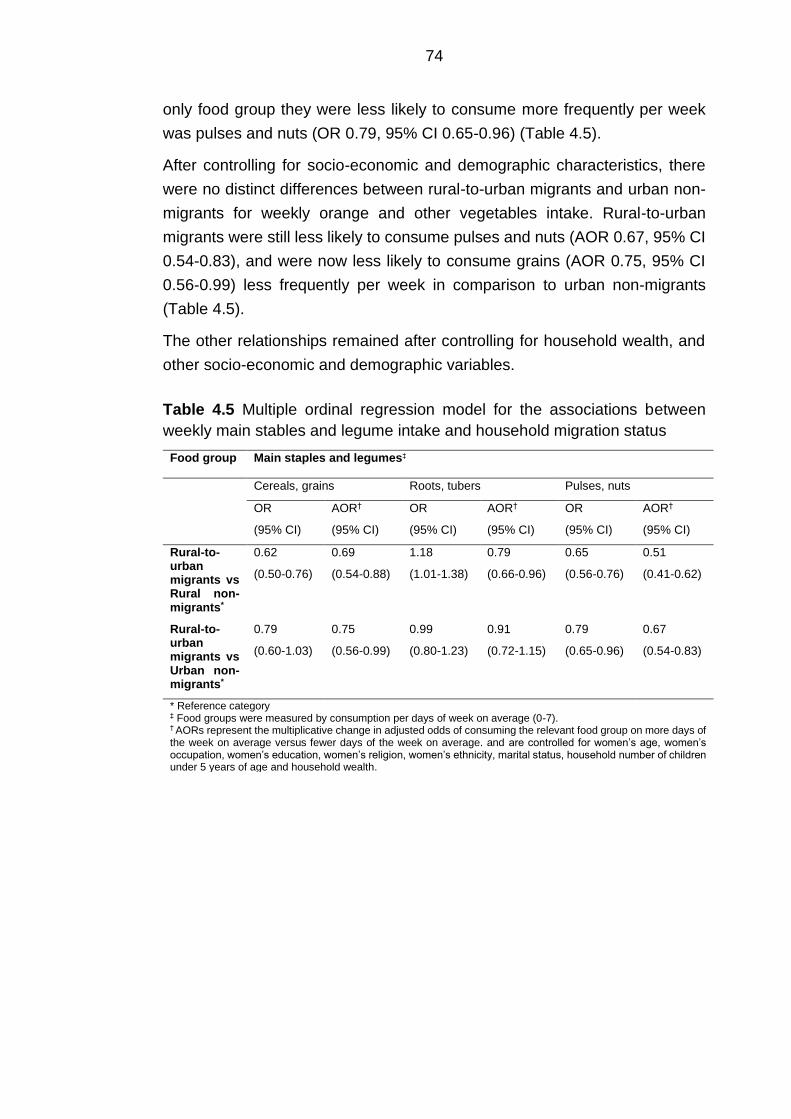
74
only food group they were less likely to consume more frequently per week
was pulses and nuts (OR 0.79, 95% CI 0.65-0.96) (Table 4.5).
After controlling for socio-economic and demographic characteristics, there
were no distinct differences between rural-to-urban migrants and urban non-
migrants for weekly orange and other vegetables intake. Rural-to-urban
migrants were still less likely to consume pulses and nuts (AOR 0.67, 95% CI
0.54-0.83), and were now less likely to consume grains (AOR 0.75, 95% CI
0.56-0.99) less frequently per week in comparison to urban non-migrants
(Table 4.5).
The other relationships remained after controlling for household wealth, and
other socio-economic and demographic variables.
Table 4.5 Multiple ordinal regression model for the associations between
weekly main stables and legume intake and household migration status
Food group Main staples and legumes‡
Cereals, grains Roots, tubers Pulses, nuts
OR
(95% CI)
AOR†
(95% CI)
OR
(95% CI)
AOR†
(95% CI)
OR
(95% CI)
AOR†
(95% CI)
Rural-to-urban migrants vs Rural non-migrants*
0.62
(0.50-0.76)
0.69
(0.54-0.88)
1.18
(1.01-1.38)
0.79
(0.66-0.96)
0.65
(0.56-0.76)
0.51
(0.41-0.62)
Rural-to-urban migrants vs Urban non-migrants*
0.79
(0.60-1.03)
0.75
(0.56-0.99)
0.99
(0.80-1.23)
0.91
(0.72-1.15)
0.79
(0.65-0.96)
0.67
(0.54-0.83)
* Reference category ‡ Food groups were measured by consumption per days of week on average (0-7). † AORs represent the multiplicative change in adjusted odds of consuming the relevant food group on more days of the week on average versus fewer days of the week on average. and are controlled for women’s age, women’s occupation, women’s education, women’s religion, women’s ethnicity, marital status, household number of children under 5 years of age and household wealth.
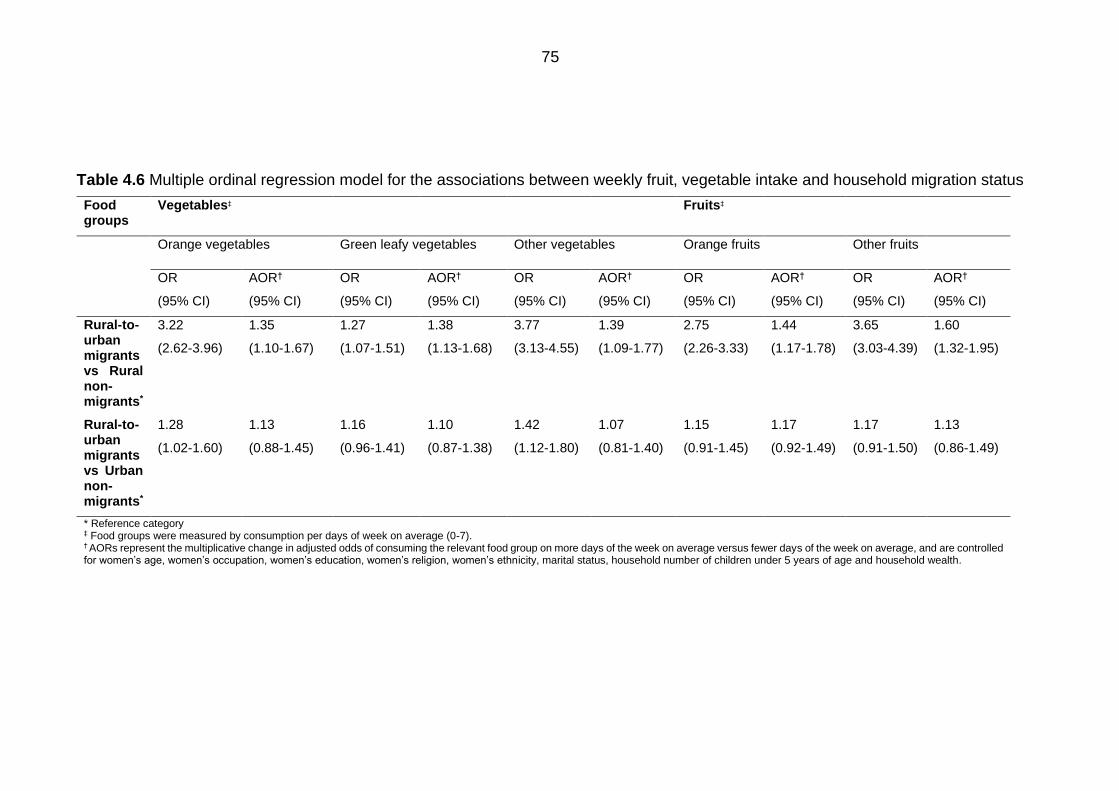
75
Table 4.6 Multiple ordinal regression model for the associations between weekly fruit, vegetable intake and household migration status
Food groups
Vegetables‡ Fruits‡
Orange vegetables Green leafy vegetables Other vegetables Orange fruits Other fruits
OR
(95% CI)
AOR†
(95% CI)
OR
(95% CI)
AOR†
(95% CI)
OR
(95% CI)
AOR†
(95% CI)
OR
(95% CI)
AOR†
(95% CI)
OR
(95% CI)
AOR†
(95% CI)
Rural-to-urban migrants vs Rural non-migrants*
3.22
(2.62-3.96)
1.35
(1.10-1.67)
1.27
(1.07-1.51)
1.38
(1.13-1.68)
3.77
(3.13-4.55)
1.39
(1.09-1.77)
2.75
(2.26-3.33)
1.44
(1.17-1.78)
3.65
(3.03-4.39)
1.60
(1.32-1.95)
Rural-to-urban migrants vs Urban non-migrants*
1.28
(1.02-1.60)
1.13
(0.88-1.45)
1.16
(0.96-1.41)
1.10
(0.87-1.38)
1.42
(1.12-1.80)
1.07
(0.81-1.40)
1.15
(0.91-1.45)
1.17
(0.92-1.49)
1.17
(0.91-1.50)
1.13
(0.86-1.49)
* Reference category ‡ Food groups were measured by consumption per days of week on average (0-7). † AORs represent the multiplicative change in adjusted odds of consuming the relevant food group on more days of the week on average versus fewer days of the week on average, and are controlled for women’s age, women’s occupation, women’s education, women’s religion, women’s ethnicity, marital status, household number of children under 5 years of age and household wealth.
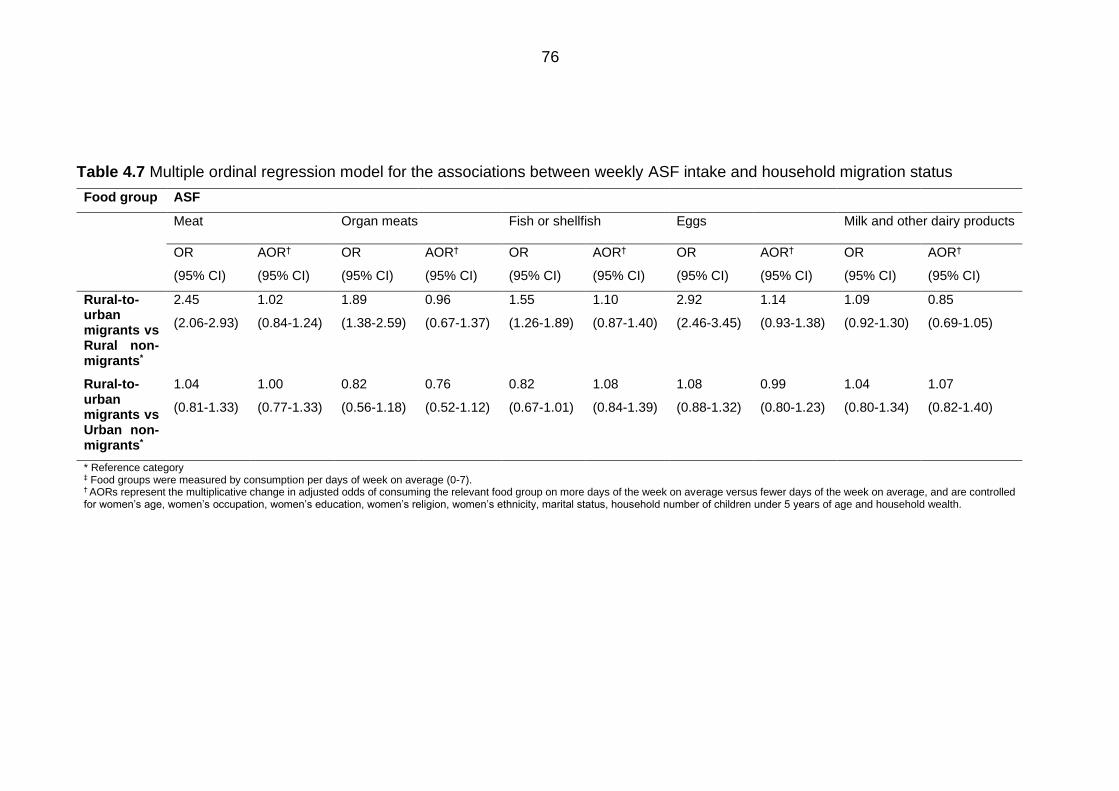
76
Table 4.7 Multiple ordinal regression model for the associations between weekly ASF intake and household migration status
Food group ASF
Meat Organ meats Fish or shellfish Eggs Milk and other dairy products
OR
(95% CI)
AOR†
(95% CI)
OR
(95% CI)
AOR†
(95% CI)
OR
(95% CI)
AOR†
(95% CI)
OR
(95% CI)
AOR†
(95% CI)
OR
(95% CI)
AOR†
(95% CI)
Rural-to-urban migrants vs Rural non-migrants*
2.45
(2.06-2.93)
1.02
(0.84-1.24)
1.89
(1.38-2.59)
0.96
(0.67-1.37)
1.55
(1.26-1.89)
1.10
(0.87-1.40)
2.92
(2.46-3.45)
1.14
(0.93-1.38)
1.09
(0.92-1.30)
0.85
(0.69-1.05)
Rural-to-urban migrants vs Urban non-migrants*
1.04
(0.81-1.33)
1.00
(0.77-1.33)
0.82
(0.56-1.18)
0.76
(0.52-1.12)
0.82
(0.67-1.01)
1.08
(0.84-1.39)
1.08
(0.88-1.32)
0.99
(0.80-1.23)
1.04
(0.80-1.34)
1.07
(0.82-1.40)
* Reference category ‡ Food groups were measured by consumption per days of week on average (0-7). † AORs represent the multiplicative change in adjusted odds of consuming the relevant food group on more days of the week on average versus fewer days of the week on average, and are controlled for women’s age, women’s occupation, women’s education, women’s religion, women’s ethnicity, marital status, household number of children under 5 years of age and household wealth.
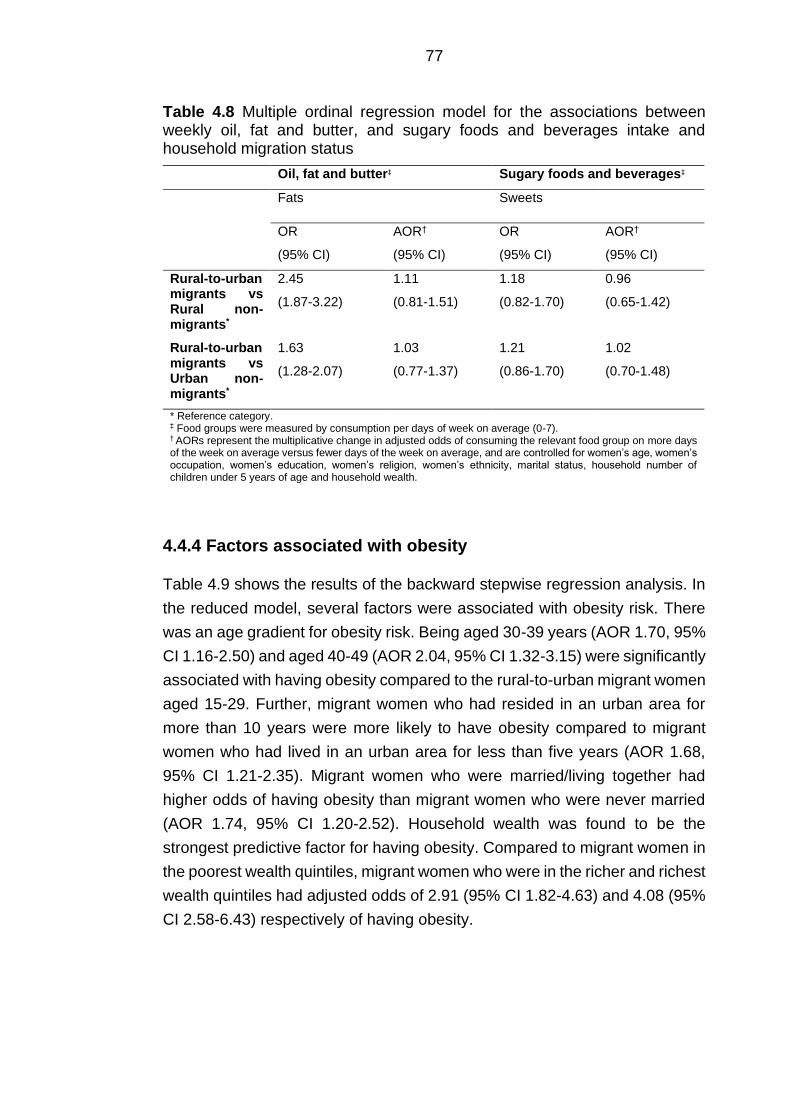
77
Table 4.8 Multiple ordinal regression model for the associations between weekly oil, fat and butter, and sugary foods and beverages intake and household migration status
Oil, fat and butter‡ Sugary foods and beverages‡
Fats Sweets
OR
(95% CI)
AOR†
(95% CI)
OR
(95% CI)
AOR†
(95% CI)
Rural-to-urban migrants vs Rural non-migrants*
2.45
(1.87-3.22)
1.11
(0.81-1.51)
1.18
(0.82-1.70)
0.96
(0.65-1.42)
Rural-to-urban migrants vs Urban non-migrants*
1.63
(1.28-2.07)
1.03
(0.77-1.37)
1.21
(0.86-1.70)
1.02
(0.70-1.48)
* Reference category. ‡ Food groups were measured by consumption per days of week on average (0-7). † AORs represent the multiplicative change in adjusted odds of consuming the relevant food group on more days of the week on average versus fewer days of the week on average, and are controlled for women’s age, women’s occupation, women’s education, women’s religion, women’s ethnicity, marital status, household number of children under 5 years of age and household wealth.
4.4.4 Factors associated with obesity
Table 4.9 shows the results of the backward stepwise regression analysis. In
the reduced model, several factors were associated with obesity risk. There
was an age gradient for obesity risk. Being aged 30-39 years (AOR 1.70, 95%
CI 1.16-2.50) and aged 40-49 (AOR 2.04, 95% CI 1.32-3.15) were significantly
associated with having obesity compared to the rural-to-urban migrant women
aged 15-29. Further, migrant women who had resided in an urban area for
more than 10 years were more likely to have obesity compared to migrant
women who had lived in an urban area for less than five years (AOR 1.68,
95% CI 1.21-2.35). Migrant women who were married/living together had
higher odds of having obesity than migrant women who were never married
(AOR 1.74, 95% CI 1.20-2.52). Household wealth was found to be the
strongest predictive factor for having obesity. Compared to migrant women in
the poorest wealth quintiles, migrant women who were in the richer and richest
wealth quintiles had adjusted odds of 2.91 (95% CI 1.82-4.63) and 4.08 (95%
CI 2.58-6.43) respectively of having obesity.
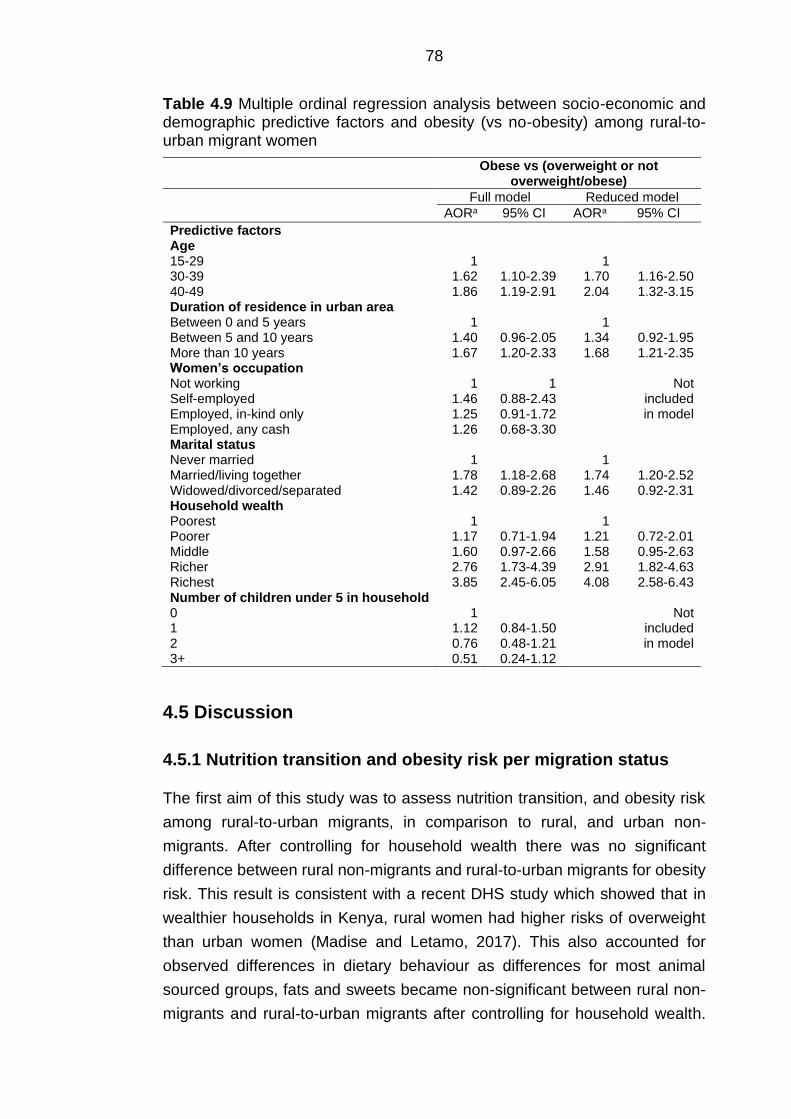
78
Table 4.9 Multiple ordinal regression analysis between socio-economic and demographic predictive factors and obesity (vs no-obesity) among rural-to-urban migrant women
Obese vs (overweight or not overweight/obese)
Full model Reduced model AORa 95% CI AORa 95% CI
Predictive factors Age 15-29 30-39 40-49
1 1.62 1.86
1.10-2.39 1.19-2.91
1 1.70 2.04
1.16-2.50 1.32-3.15
Duration of residence in urban area Between 0 and 5 years Between 5 and 10 years More than 10 years
1 1.40 1.67
0.96-2.05 1.20-2.33
1 1.34 1.68
0.92-1.95 1.21-2.35
Women’s occupation Not working Self-employed Employed, in-kind only Employed, any cash
1 1.46 1.25 1.26
1 0.88-2.43 0.91-1.72 0.68-3.30
Not included in model
Marital status Never married Married/living together Widowed/divorced/separated
1 1.78 1.42
1.18-2.68 0.89-2.26
1 1.74 1.46
1.20-2.52 0.92-2.31
Household wealth Poorest Poorer Middle Richer Richest
1 1.17 1.60 2.76 3.85
0.71-1.94 0.97-2.66 1.73-4.39 2.45-6.05
1 1.21 1.58 2.91 4.08
0.72-2.01 0.95-2.63 1.82-4.63 2.58-6.43
Number of children under 5 in household 0 1 2 3+
1 1.12 0.76 0.51
0.84-1.50 0.48-1.21 0.24-1.12
Not included in model
4.5 Discussion
4.5.1 Nutrition transition and obesity risk per migration status
The first aim of this study was to assess nutrition transition, and obesity risk
among rural-to-urban migrants, in comparison to rural, and urban non-
migrants. After controlling for household wealth there was no significant
difference between rural non-migrants and rural-to-urban migrants for obesity
risk. This result is consistent with a recent DHS study which showed that in
wealthier households in Kenya, rural women had higher risks of overweight
than urban women (Madise and Letamo, 2017). This also accounted for
observed differences in dietary behaviour as differences for most animal
sourced groups, fats and sweets became non-significant between rural non-
migrants and rural-to-urban migrants after controlling for household wealth.
79
This suggests that ASF foods are not fully accessible and affordable to all SES
groups within urban areas. It is consistent with other work in Kenya that
showed women in the upper income group to have a significantly higher intake
of fat compared to the lower income group (Steyn et al., 2011b).
Rural-to-urban migrants showed signs of nutrition transition as they were less
likely to consume cereals and pulses/nuts (and thus fibre) after controlling for
socio-economic and demographic characteristics. It is noteworthy that
migrants were more likely to consume fruits and most vegetable groups as
opposed to rural non-migrants after controlling for household wealth and other
socio-economic and demographic characteristics. These findings for fruit and
vegetable intake agreed with the migrant studies by Bowen et al. (2011) and
Unwin et al. (2010) as fruit and vegetable intakes showed differences between
groups, with an increasing trend from rural to migrant to urban. After
controlling for household wealth, these associations remained significant
suggesting that overall, fruits and vegetables are more accessible to migrants
in urban areas compared to rural non-migrants irrespective of any differences
in their socio-economic and demographic characteristics This could be
explained by increased income or accessibility which facilitates acquirement
of higher value foods such as fresh fruits and vegetables other than staples
(Haggblade et al., 2016). For green leafy vegetables this might not come as a
surprise as Nairobi literature informed us that local collard greens (sukuma
wiki in Kiswahili) are highly accessible in urban settings (Kimani-Murage et al.,
2014; Owuor et al., 2017). Vegetable intake in Kenya is particularly high in
urban areas compared to other SSA countries (Ruel et al., 2005). As the food
categories contained a wide array of different food products it is however
difficult to determine what specifically the respondent consumed. After
controlling for household wealth, there were no clear intrinsic differences
between rural-to-urban migrants and urban non-migrants for intake of most
vegetable groups. Socio-economic and spatial-temporal factors such as the
availability of a wider range of food in urban markets, and the availability of
storage facilities may drive the differences in intake (Ruel et al., 2005).
Compared with urban non-migrants, rural-to-urban migrants consumed
cereals and pulses/nuts less often per week, and consumed orange and other
vegetables more often per week. No significant differences were observed for
the other food group categories which suggests that, based on this analysis,
rural-to-urban migrants’ diets are similar to those of urban non-migrants.
80
4.5.2 Demographic and socio-economic characteristics
associated with obesity risk
The second aim of this study was to identify demographic and socio-economic
characteristics which were associated with obesity risk among female rural-
to-urban migrants. The analysis showed that the odds of having obesity was
higher in the older age groups, among migrant women resident in the urban
area for more than 10 years, among the richer and richest household groups
and being married or living with a partner. Of all identified characteristics,
belonging to the richer and richest group was seen to put rural-to-urban
migrants at the highest odds of having obesity. Similar results were found
among internal rural-to-urban migrants from the Peru Migrant study, where
migrants with a lower SES had lower odds of having obesity (Hilmers et al.,
2016). These findings suggest that household wealth plays a major role in this,
something previously observed within Kenya (Steyn et al., 2011b). Other
literature reviewing the association between SES and obesity among non-
migrants in LMICs supports this. A review showed that the size of the
association between urban residence and BMI in LMICs is reduced
substantially after controlling for SES (household wealth index), suggesting
that much of the difference between urban and rural dwellers is driven by the
socio-economic composition of the urban areas (Neuman et al., 2013).
However, in the DHS, no identification of the migrant’s residency within urban
areas is possible. Urban areas are strongly heterogeneous environments,
including urban slums, and the poorest migrants may therefore not have been
included in the DHS analysis (Elsey et al., 2016b). In this study, rural-to-urban
migrants were wealthier in comparison to rural non-migrants. As no reasons
for migration to urban areas were provided in the KDHS, I can only speculate.
As I mentioned in Chapter 1, one of the main reasons for women in Kenya to
migrate from rural to urban areas in Kenya is to escape rural poverty
(International Organization for Migration, 2015). After arrival, many migrants
face unemployment, especially women, which lead them to residing in slums
as they cannot afford rent (Zulu et al., 2011). This suggests that the sample
represented in the KDHS may not be covering a proportion of the migrants.
The results of this analysis should therefore be interpreted with caution.
The results also showed that migrant women who had resided in an urban
area for more than 10 years were at a higher odds of having obesity compared
to migrant women who had lived in an urban area for less than five years.
Studies in India, Peru and Tanzania showed similar results as they observed
a positive correlation between duration of residence and development of
81
obesity among rural-to-urban migrants (Ebrahim et al., 2010; Kinra et al.,
2011; Unwin et al., 2010). A potential explanation could be that as time
passes, exposure to the urban environment and changing lifestyles may
stimulate weight gain as rural-to-urban migrants increase their energy intake,
consume low-cost food high in fat and sugar, and reduce their energy
expenditure. There is evidence that longer times spent in urban areas are
positively associated with fat intake (Steyn et al., 2016).
Finally, marital status was found to be significantly associated with
overweight/obesity. Independent of socio-economic and demographic
characteristics, women who were married and/or living together were more
likely to have obesity relative to women who had never been in union. Mixed
results were observed in the non-migrant literature. While a Nairobi study did
not observe a significant association between being married and
overweight/obesity, other literature from national and urban Ghana, and peri-
urban Uganda indicated married women to be at a higher odds of being
overweight or obese (Ajayi et al., 2016; Benkeser et al., 2012; Dake et al.,
2011). Potential explanations provided were socio-cultural perception about
fatness being associated with beauty, and husbands and wives eating ready-
to-eat-food together.
4.5.3 Limitations of the analysis
There are some limitations intrinsic to the DHS data. As with all surveys of this
type, their cross-sectional design precludes conclusions regarding causal
processes, particularly around the temporal sequence of cause and effect.
Information on the household food intake groups collected in these surveys
are potentially subject to reporting and recall bias. Furthermore, there is the
possibility of residual confounding which cannot be eliminated due to the
study’s cross-sectional nature (Porta, 2016).
Importantly, there was no direct measure of rural-to-urban migration in the
KDHS data. Rural-to-urban migration in this study only reflects their childhood
residence and movement between their current and previous place of
residence. This classification does not account for migration experiences
between their childhood place of residence and last migration and may
therefore limit the study’s estimation of the migration effect. This does
however not hinder the clear distinction between migrants and non-migrants.
Furthermore, I was not able to control the association between migrant status
and household food intake for duration of residence. The independent effect

82
of migration may diminish as the presented odds ratios only represent an
average of rural-to-urban migrants of different durations of residence.
Additionally, many of the present rural areas have acquired characteristics
that were previously associated with urban areas. These include increased
access to services and amenities associated with urban settlements,
becoming so-called peri-urban areas (Dorélien et al., 2013). The 2014 KDHS
has classified these areas as rural areas (Measure DHS, 2012). This might be
important to consider for future analysis as peri-urban areas seem to be a risk
factor for obesity in SSA (Kirunda et al., 2015; Mayega et al., 2012).
No food categories existed for obesogenic street foods, which are deemed as
important in the development of obesity. They are easily available and make
a major contribution to the diet of many living in SSA (Steyn et al., 2014). In
addition, food intake was measured per household; no distinction could be
made between women and men in their food choices and intake (Kenya
National Bureau of Statistics et al., 2015). This may bias the dietary
information as women could have reported primarily what their husband
and/or children consumed (Varadharajan et al., 2013). While these limitations
are important to consider for future studies, the wide array of food groups
included in this analysis does provide sufficient detail to assess the differences
in dietary behaviour.
And lastly, even though wealth index measurement by the DHS reflects long-
term wealth and provides inter-country comparison, it does not include
household income and expenditure which is seen as an important indicator for
food intake. When people’s income is low, they may resort to obesogenic
dietary behaviour such as the intake of street food and cheap energy dense
food products to satisfy their hunger (Hawkes, 2006). There are difficulties in
measuring wealth in urban areas as it may represent both monetary and non-
monetary indicators on individual, household, community levels and wider.
These indicators in turn can have independent influences on different health
and nutrition outcomes (Bag and Seth, 2018; Howe et al., 2012). Despite its
limitations, this analysis expands our knowledge on nutrition transition and
identified rural-to-urban migrant women in Kenya prone to have obesity in
Kenya.
83
4.6 Next steps
While this analysis is highly informative on the associations between rural-to-
urban migration, obesity and nutrition transition, the urban poor are
underrepresented in such surveys (Elsey et al., 2018). Building on the
evidence that a large portion of the rural-to-urban migrants in Kenya end up
in urban slums (Zulu et al., 2011), I investigate these associations in-depth in
Nairobi’s slums in Chapter 5.
84
Chapter 5 Obesity risk and food intake among rural-to-urban
migrant women in Nairobi’s slums (NUHDSS)
5.1 Introduction
Rural migration to urban slums may lead to detrimental health and lifestyle
outcomes (Mberu and Mutua, 2015). Studies in the Nairobi slum settlements
have highlighted significant disadvantages faced by the urban poor with
respect to food insecurity, malnutrition, and poor-quality diets (Faye et al.,
2011; Haregu et al., 2016b; Kimani-Murage et al., 2014). A double burden of
malnutrition among the urban poorest in Nairobi is evident as obesity presents
amongst problems such as stunting and micronutrient deficiencies (Kimani-
Murage et al., 2015b). Moving to these settings may predispose migrant
women to similar urban adverse outcomes such as obesity due to the adoption
of obesogenic dietary behaviour, as migrants may adopt ASF, and consume
energy-dense foods rich in fat, sugar and energy, sugary drinks while reducing
their intake of traditional nutritious and fibrous food including legumes, fruit
and (root) vegetables (Antiporta et al., 2016; Misra et al., 2001). It can be
hypothesised that in areas with potentially pervasive neighbourhood effects
and poverty, rural-to-urban migrant women may adopt urban dietary habits
and share similar obesity risk profiles of the local community with prolonged
residence (Antiporta et al., 2016; Ezeh et al., 2017; Unwin et al., 2010).
A growing body of literature recognises a wide variety of socio-economic and
demographic drivers of obesity and poor diets among the urban poorest in
Nairobi (Cornelsen et al., 2016; Dominguez-Salas et al., 2016; Kimani-Murage
et al., 2015a; Mbochi et al., 2012; Mutisya et al., 2016). However, the specific
characteristics of rural-to-urban migrants and the factors which make rural-to-
urban migrant women at risk of weight gain and adopt poor diets are not well-
documented.
Changes in physical, social and information environments post-migration may
also influence the adoption of urban dietary patterns. Migrants depend heavily
on the informal food environment after arrival. Less affluent neighbourhoods
such as slums may have limited access to food sources rich in affordable
nutritious food. Cheap, convenient, pre-prepared food items with high energy-
density and low nutritional value are more rapidly consumed in this context
(Battersby and Crush, 2014). In some literature these low socio-economic
neighbourhoods are also referred to as food swamps (Bridle-Fitzpatrick,
2015). Changes in social networks after migration might also be of importance
in relation to adverse nutrition and diet outcomes (Bojorquez et al., 2014; Loret
85
de Mola et al., 2012a; Stern et al., 2010). Strong social networks and support
mechanisms have been shown to enhance health status among adolescents
and the elderly, and household food security, in slum settings (Maxwell, 2000;
Zulu et al., 2011). Changes in information environments may raise individual
knowledge and awareness on health and diet which in turn may play an
important role in changing demands and perceptions of food (Grant, 2010;
Puoane et al., 2006; Stern et al., 2010). Marketing and advertising of high-
energy, processed food and beverages has been named, particularly with
television, as one of underlying determinants of obesity and nutrition transition
in SSA urban environments (Haggblade et al., 2016; McHiza et al., 2013;
Vorster et al., 2011).
The impact of these individual and environmental influences on obesity risk
and dietary behaviour has been understudied in urban slums, particularly in
the context of rural-to-urban migration. In regard to future interventions it is
necessary to identify characteristics and behaviours associated with obesity
risk among rural-to-urban migrant women. In addition, to address obesity, it is
essential to understand characteristics of rural-to-urban migrant women who
report high intakes of obesogenic food such as red meat and sugary drinks,
but also report healthier foods such as fruit and vegetables. The DHS proved
to be highly informative on obesity and nutrition transition among rural-to-
urban migrants on a national level, particularly among the higher socio-
economic groups in urban areas. However, not much is known on these
associations among the urban poor living in slums. APHRC established the
NUHDSS in 2002. It is a rich longitudinal research platform, set up in the
Korogocho and Viwandani slum settlements in Nairobi, Kenya.
5.2 Aim of analysis
Access to this data has provided me with the opportunity to examine obesity
risk and food intake among rural-to-urban migrant women in Nairobi’s slums.
The first objective of this analysis was to compare rural-to-urban migrant
women with women born in urban areas for obesity risk and different types of
food intake while controlling for additional variables.
The second objective was to identify individual, household and environment
characteristics of rural-to-urban migrant women prone to having obesity and
whom are associated with higher intakes of red meat, sugary drink, fruit and
vegetables.
86
5.3 Methods
5.3.1 Data sources
I combined multiple datasets to obtain information on BMI, a set of food
groups, and individual, household and environment characteristics. The
combining of these datasets also allowed me to identify the migration
background of the slum residents.
The main dataset I used was a cross-sectional study conducted in 2008-2009
to assess the linkages between socioeconomic status, perceived personal
risk, and risk factors for cardiovascular and related non-communicable
diseases in a population of slum dwellers in Nairobi, Kenya. This was a
Welcome Trust funded cross-sectional population-based study conducted by
APHRC in the slums Korogocho and Viwandani. This study aimed to
contribute to knowledge on the epidemiology of NCDs in SSA by exploring the
linkages between factors in the socio-economic and socio-cultural
environments, perceived risk for getting CVD and health-related behaviour
among slum dwellers to inform intervention programs (African Population and
Health Research Centre, 2001). The main dataset used the sampling frame
of the NUHDSS. This is a stratified sampling strategy which is based on the
WHO STEPwise protocol. A random sample of individuals was selected
according to the slum of residence, gender and age group to constitute 20
strata each with 250 respondents. In each stratum, a sampling frame was
generated from the NUHDSS database and a computer-based program (Stata
statistical software) used to randomly select eligible individuals (Oti et al.,
2013).
To identify the geographical area of birth (rural, urban) in the CVD dataset, I
merged the main study with another survey entitled: “Migration and
Employment History Survey”. This survey was part of the Urbanization,
Poverty and Health Dynamics (UPHD) project in SSA. The UPHD project was
conducted between 2006 and 2010, with the overarching research aim to
examine the dynamic inter-linkages between migration, poverty, and ill health
in the slum setting. The survey included the respondents' characteristics on
migratory history such as where the respondent was born and migrated to
afterwards, and the timing of current and first migration to Nairobi. Information
was collected from a random panel sample of close to 8,200 households from
the two slums (5,200 in Viwandani and 3,000 in Korogocho).
87
The inclusion criteria of this study were participants aged 18 years and above
and who were not physically or mentally incapacitated. All data were already
weighted (African Population and Health Research Centre, 2001).
5.3.1.1 Final study population
I matched the total number of respondents with the other datasets
corresponding years 2008-2009 by a shared household identifier (ID). This led
a final random sample of 5,437 adults. The combination of the different studies
did not lead to a loss in sample size.
After I took missing responses (n=1), refusals (n=5) and uninterpretable
responses (n=9) into consideration, the analytical sample consisted of 5,422
participants.
5.3.1.2 Ethical approval
The datasets I used in this analysis are owned by APHRC. They gained
approval from the Ethical Review Board of the Kenya Medical Research
Institute (KEMRI) prior to conducting the three studies. They obtained written
informed consent from all respondents. APHRC has a data sharing policy that
enables other researchers to access datasets. Data may be accessed through
APHRC’s microdata portal (African Population and Health Research Centre,
2001).
5.3.2 Research population
Rural-to-urban migrant women aged 18-49 were the main group of interest in
this analysis. I based the classification of rural-to-urban migrant women on
their response to whether they were born in a rural area. The comparative
group were women who responded that they did not originate from a rural
area. While more information on migratory history (year of first-time migration
to Nairobi, location of migration after childhood residence, and if current stay
at Nairobi was the first time) was available in the UPHD study, I was not able
to use these variables to classify rural-to-urban migrants for several reasons.
Selecting migrant women based on these questions would have decreased
the sample size, with the consequence of not being able to include all the
selected variables in the analysis. In this analysis I gave preference to test
influences on the outcomes with a wide spectrum of individual and
88
environmental factors. In addition, the interview dates of both studies could
vary by four years (between 2006 and 2010).
5.3.3 Dependent variables
5.3.3.1 Weight status
One of the outcome variables of the analysis was women’s weight
classification. As for the KDHS, I converted BMI of the female participants into
a categorical variable and classified as underweight or normal weight (<24.9
kg/m2), overweight (25.0–29.9 kg/m2), or having obesity (≥30.0 kg/m2 (WHO,
2018). Each person’s weight and height were measured with a Seca
stadiometer and weighing scale (see: APHRC microdata portal).
5.3.3.2 Food intake
I selected several food intake groups as outcomes: 1) frequency of red meat
intake; 2) frequency of sugary drink intake 3) weekly intake of fruit servings,
and 4) weekly intake of vegetable servings. The food intake questions in the
main study were based on the WHO STEP-wise approach to Surveillance
(STEPS) to collect data and measure NCD risk factors (World Health
Organisation). I selected these food groups as they allow for representation
of food intake groups typical of nutrition transition (Popkin, 2015).
Respondents were asked how often they consumed red meat: “How often do
you eat red meat (beef, pork, lamb, goat, game)?” In this study, red meat
represented meat other than fish or chicken. The original categories were: 1.)
Daily, 2.) 5-6 days per week, 3.) 1-4 days per week, 4.) 1-3 days per month,
5.) less than once a month, 6.) 2-3 times a year, 7.) once a year, and 8.) never.
I collapsed several categories due to low cell counts. The new categories are:
1.) Monthly or less; 2.) Weekly; and 3.) Daily.
Respondents were also asked how often they consumed at least one sugary:
“In the past 12 months, how frequently have you had at least one soft drink?”
The original response categories were the same as for red meat intake. As for
red meat intake, I collapsed several categories to obtain more equally
distributed frequencies. The new categories are: 1.) Quarterly or less; 2.)
Monthly; and 3.) Weekly or more.
Finally, respondents were asked how many days they consumed fruits and
vegetables independently in a typical week. Frequency of fruit and vegetable
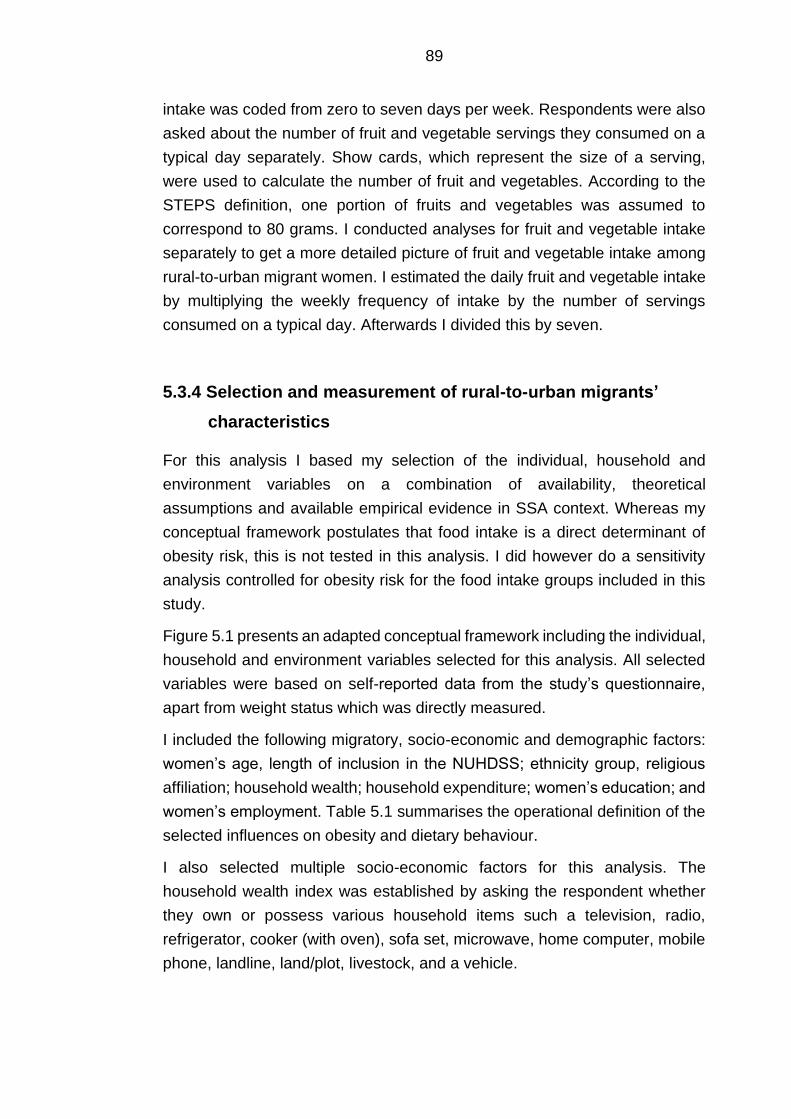
89
intake was coded from zero to seven days per week. Respondents were also
asked about the number of fruit and vegetable servings they consumed on a
typical day separately. Show cards, which represent the size of a serving,
were used to calculate the number of fruit and vegetables. According to the
STEPS definition, one portion of fruits and vegetables was assumed to
correspond to 80 grams. I conducted analyses for fruit and vegetable intake
separately to get a more detailed picture of fruit and vegetable intake among
rural-to-urban migrant women. I estimated the daily fruit and vegetable intake
by multiplying the weekly frequency of intake by the number of servings
consumed on a typical day. Afterwards I divided this by seven.
5.3.4 Selection and measurement of rural-to-urban migrants’
characteristics
For this analysis I based my selection of the individual, household and
environment variables on a combination of availability, theoretical
assumptions and available empirical evidence in SSA context. Whereas my
conceptual framework postulates that food intake is a direct determinant of
obesity risk, this is not tested in this analysis. I did however do a sensitivity
analysis controlled for obesity risk for the food intake groups included in this
study.
Figure 5.1 presents an adapted conceptual framework including the individual,
household and environment variables selected for this analysis. All selected
variables were based on self-reported data from the study’s questionnaire,
apart from weight status which was directly measured.
I included the following migratory, socio-economic and demographic factors:
women’s age, length of inclusion in the NUHDSS; ethnicity group, religious
affiliation; household wealth; household expenditure; women’s education; and
women’s employment. Table 5.1 summarises the operational definition of the
selected influences on obesity and dietary behaviour.
I also selected multiple socio-economic factors for this analysis. The
household wealth index was established by asking the respondent whether
they own or possess various household items such a television, radio,
refrigerator, cooker (with oven), sofa set, microwave, home computer, mobile
phone, landline, land/plot, livestock, and a vehicle.
90
Figure 5.1 Conceptual framework including individual, household and environment characteristics influencing food intake and obesity risk, adapted from Satia-Abouta et al. (2002)
These items were transformed into an index by APHRC by using the principal
component analysis method, commonly used by the DHS programme (Vyas
and Kumaranayake, 2006). I estimated household monthly expenditures by
adding up the expenditures during the month, with the weekly expenditure
multiplied by 4.2857 to get the estimate for the month. The equivalent
household composition was computed using three different criteria; taking a
child to be equivalent to: 3.75 years; 7.5 years; 11.25 years; and 15 years.
Female employment was measured by asking the question what type of IGA
they perform. I distributed salaried and casual labour to separate categories.
I also selected ethnicity for this analysis. It may represent the different cultural
norms and values on dietary behaviour and obesity (Christensen et al., 2009;
Crawford et al., 2010). It may however also depict the migrants’ origins.
Socio-economic and
demographic characteristics (pre- and post-
migration):
• Duration of inclusion in NUHDSS individual
• Province of origin
individual (Ethnicity)
• Household expenditures
• Household wealth index
• Individual education
• Individual income-
generating activity
Psychosocial characteristics
➢ Perception walking time to food sources
Changes in environment: ➢ Physical (built)
environment (settings)
➢ Social environment characteristics (networks) Attending union meetings Number of close friends
➢ Macro-environment characteristics (marketing and media-exposure) Awareness of nutrition and dietary promotion Frequency of television watching
Cultural characteristics (Pre- migration
and post-migration)
Ethnicity Religion
Exposure to urban
area
Red meat Sugary drink Fruit Vegetable
BMI status
91
Kenya’s rural areas are still assumed to predominantly consist of one (or a
couple of) dominant ethnic groups per geographical area (van 't Riet et al.,
2001). I categorised ethnicity as followed: 1.) Kikuyu; 2.) Luo; 3.) Luhya; 4.)
Kamba; and 5.) Other. I based the categorisation on the largest four ethnic
groups (Kenya National Bureau of Statistics et al., 2015). Other groups had to
be collapsed into the “other group” to allow comparison between different
ethnic groups. This group included ethnic groups which were the following:
Meru, Embu, Kisii, Mijikenda, Swahili, Somali, Taita, Masaai, Kalenjin, Garre
and Borana. Religious affiliation was categorised as having no religion,
catholic, protestant or other Christian, Pentecostal/charismatic or Muslim as
based on the questioning in the study’s interview tool.
I selected variables concerning the perception of walking time to retail food
and restaurants to examine associations between the individual’s perception
of the food environment and, obesity and food intake. Participants were asked
how long it would take them to walk to the nearest fast food stand, market or
restaurant. I chose to categorise these variables in this manner in order to
obtain a similar number of observations across categories.
I derived information on rural-to-urban migrant women’s social support and
networks from the questions which addressed their marital status, number of
people they considered as close friends, and how often in the last four months
they had attended any group, club, society, union or organisational meeting,
and their marital status. The final category of attending a society was “other”,
as specified in the questionnaire. I kept this category in the analysis to
maintain a similar number of observations. Finally, I recoded the variables
number of reported close friends, and frequency of attending social meetings
to obtain a similar number of observations across categories.
I measured the influence of the information environment on obesity risk and
food intake with two variables: nutrition and dietary promotion, and frequency
of watching television. I created a nutrition and diet promotion variable by
collapsing four independent questions. The respondents were asked whether
they had read, heard or seen advice on reducing weight, fat intake, or to
increase fruit and vegetable intake. I collapsed these four categories into one
composite variable depicting whether they had heard or not heard of any
promotion messages in relation to nutrition or diet. Lastly, I obtained
information on the respondents’ frequency of television watching.
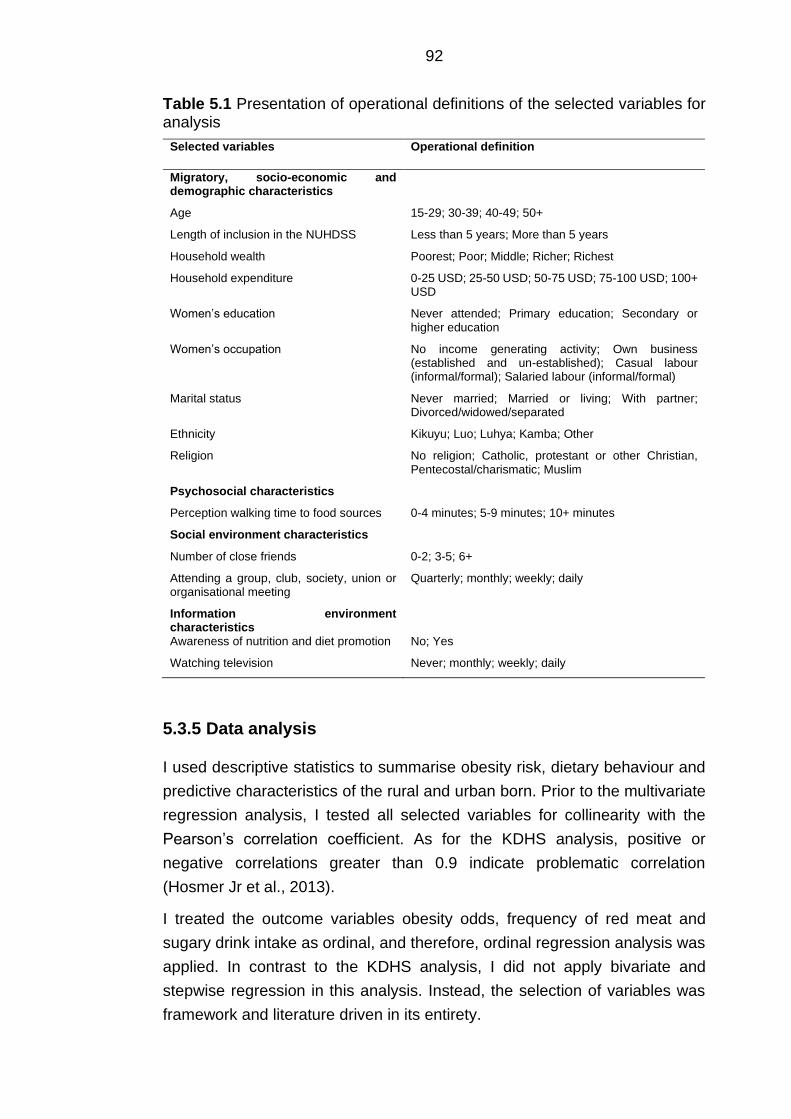
92
Table 5.1 Presentation of operational definitions of the selected variables for analysis
Selected variables Operational definition
Migratory, socio-economic and demographic characteristics
Age 15-29; 30-39; 40-49; 50+
Length of inclusion in the NUHDSS Less than 5 years; More than 5 years
Household wealth Poorest; Poor; Middle; Richer; Richest
Household expenditure 0-25 USD; 25-50 USD; 50-75 USD; 75-100 USD; 100+ USD
Women’s education Never attended; Primary education; Secondary or higher education
Women’s occupation No income generating activity; Own business (established and un-established); Casual labour (informal/formal); Salaried labour (informal/formal)
Marital status Never married; Married or living; With partner; Divorced/widowed/separated
Ethnicity Kikuyu; Luo; Luhya; Kamba; Other
Religion No religion; Catholic, protestant or other Christian, Pentecostal/charismatic; Muslim
Psychosocial characteristics
Perception walking time to food sources 0-4 minutes; 5-9 minutes; 10+ minutes
Social environment characteristics
Number of close friends 0-2; 3-5; 6+
Attending a group, club, society, union or organisational meeting
Quarterly; monthly; weekly; daily
Information environment characteristics
Awareness of nutrition and diet promotion No; Yes
Watching television Never; monthly; weekly; daily
5.3.5 Data analysis
I used descriptive statistics to summarise obesity risk, dietary behaviour and
predictive characteristics of the rural and urban born. Prior to the multivariate
regression analysis, I tested all selected variables for collinearity with the
Pearson’s correlation coefficient. As for the KDHS analysis, positive or
negative correlations greater than 0.9 indicate problematic correlation
(Hosmer Jr et al., 2013).
I treated the outcome variables obesity odds, frequency of red meat and
sugary drink intake as ordinal, and therefore, ordinal regression analysis was
applied. In contrast to the KDHS analysis, I did not apply bivariate and
stepwise regression in this analysis. Instead, the selection of variables was
framework and literature driven in its entirety.
93
For this analysis I assessed the proportional odds assumption of the ordinal
regression models using the Brant test (Williams, 2016). The models
predicting frequency and quantity of both vegetable and fruit intake violated
this assumption for some independent variables. To improve interpretation,
instead of collapsing fruit and vegetable categories and using partial
proportional odds models or continue running ordinal regression analysis, I
chose to analyse the outcome as a count variable and use appropriate count
regression analysis techniques. I used negative binomial regression for both
fruit and vegetable intake as the relevant Poisson models indicated over
dispersion (Hilbe, 2011).
I controlled all p-values for multiple comparisons according to the Holm
procedure to avoid multiplicity errors (Holm, 1979). I reported OR, rate ratios
(RR), 95% CI throughout this analysis. I used a p-value of ≤ 0.05 to indicate
statistical significance. I performed the statistical analyses using Stata version
15.
5.4 Results
5.4.1 Descriptive analysis
5.4.1.1 Outcome variables per migration status
Table 5.2 and Table 5.3 show the descriptive results of the outcome variables
for rural and urban born participants. Minor differences were observed for
weight status. Of the rural-to-urban migrant women, 17.2% were reported as
having obesity compared to 14.2% of urban born women. Minor differences
between rural-to-urban migrant women and urban born women were observed
for reported dietary behaviour. Only 8.0 % of rural-to-urban migrants reported
a daily red meat intake and 18.2% reported sugary drink intake on a weekly
or more frequent basis (Table 5.3).
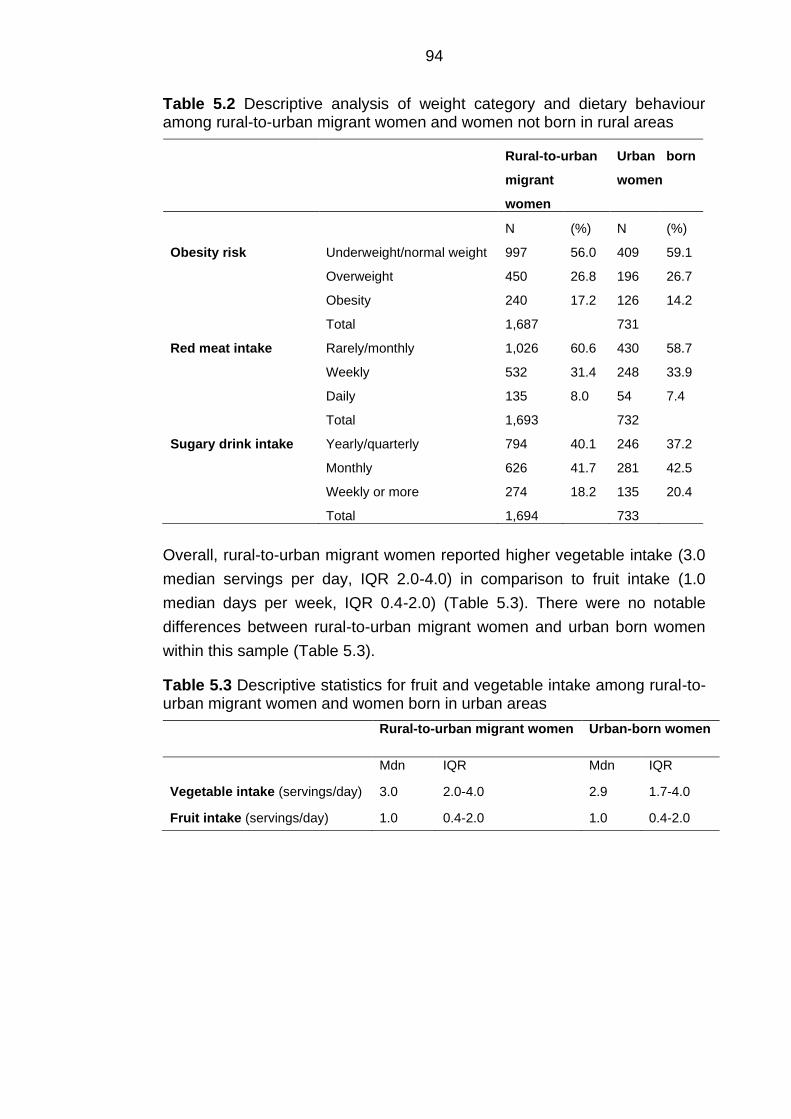
94
Table 5.2 Descriptive analysis of weight category and dietary behaviour among rural-to-urban migrant women and women not born in rural areas
Rural-to-urban
migrant
women
Urban born
women
N (%) N (%)
Obesity risk Underweight/normal weight
Overweight
Obesity
Total
997
450
240
1,687
56.0
26.8
17.2
409
196
126
731
59.1
26.7
14.2
Red meat intake Rarely/monthly
Weekly
Daily
Total
1,026
532
135
1,693
60.6
31.4
8.0
430
248
54
732
58.7
33.9
7.4
Sugary drink intake Yearly/quarterly
Monthly
Weekly or more
Total
794
626
274
1,694
40.1
41.7
18.2
246
281
135
733
37.2
42.5
20.4
Overall, rural-to-urban migrant women reported higher vegetable intake (3.0
median servings per day, IQR 2.0-4.0) in comparison to fruit intake (1.0
median days per week, IQR 0.4-2.0) (Table 5.3). There were no notable
differences between rural-to-urban migrant women and urban born women
within this sample (Table 5.3).
Table 5.3 Descriptive statistics for fruit and vegetable intake among rural-to-urban migrant women and women born in urban areas
Rural-to-urban migrant women Urban-born women
Mdn IQR Mdn IQR
Vegetable intake (servings/day) 3.0 2.0-4.0 2.9 1.7-4.0
Fruit intake (servings/day) 1.0 0.4-2.0 1.0 0.4-2.0
95
5.4.1.2 Descriptive analysis for outcome variables per migration status
Table 5.4 shows descriptive results for individual, household and environment
characteristics of both rural-to-urban migrant women and urban born women.
Comparative analysis
In total, 1,696 (69.8%) of women were identified as having been born in a rural
area (referred to as rural-to-urban migrant women), and 733 (30.2%) were
born in an urban area (Table 5.4). Differences in age and location of residence
between rural-to-urban migrant women and urban born women were reported.
Around one-third of rural-to-urban migrant women (32.6%) were 50+ years of
age in comparison to 19.2% of the urban born women who were categorised
in this group. However, the opposite pattern was observed for the 40-49 age
group. Slightly more than half of rural-to-urban migrant women (54.7%) in this
sample were included in the NUHDSS for more than 5 years, whereas 85%
of urban born women were included in the NUHDSS for more than 5 years
(Table 5.4). No major differences between rural-to-urban migrant women and
urban born women were identified. A higher proportion of urban born women
(46.1%) were self-employed in comparison with rural-to-urban migrant women
(36.8%). While a higher proportion of rural-to-urban migrant women had no
IGA (36.0%) as compared with urban born women (28.5%) (Table 5.4).
Characteristics of rural-to-urban migrant women
More than half of rural-to-urban migrant women reported living less than five
minutes walking time away from the nearest fast food outlet (61.4%), and from
the nearest restaurant (66.3%). Almost one-third (74%) of rural-to-urban
migrant women reported living within 5 minutes walking time of the nearest
market. Nearly three quarter (74.4%) of rural-to-urban migrant women had not
heard, seen or read anything concerning nutrition and dietary promotion.
Furthermore, approximately one-third of rural-to-urban migrant women
reported watching television daily (Table 5.4).
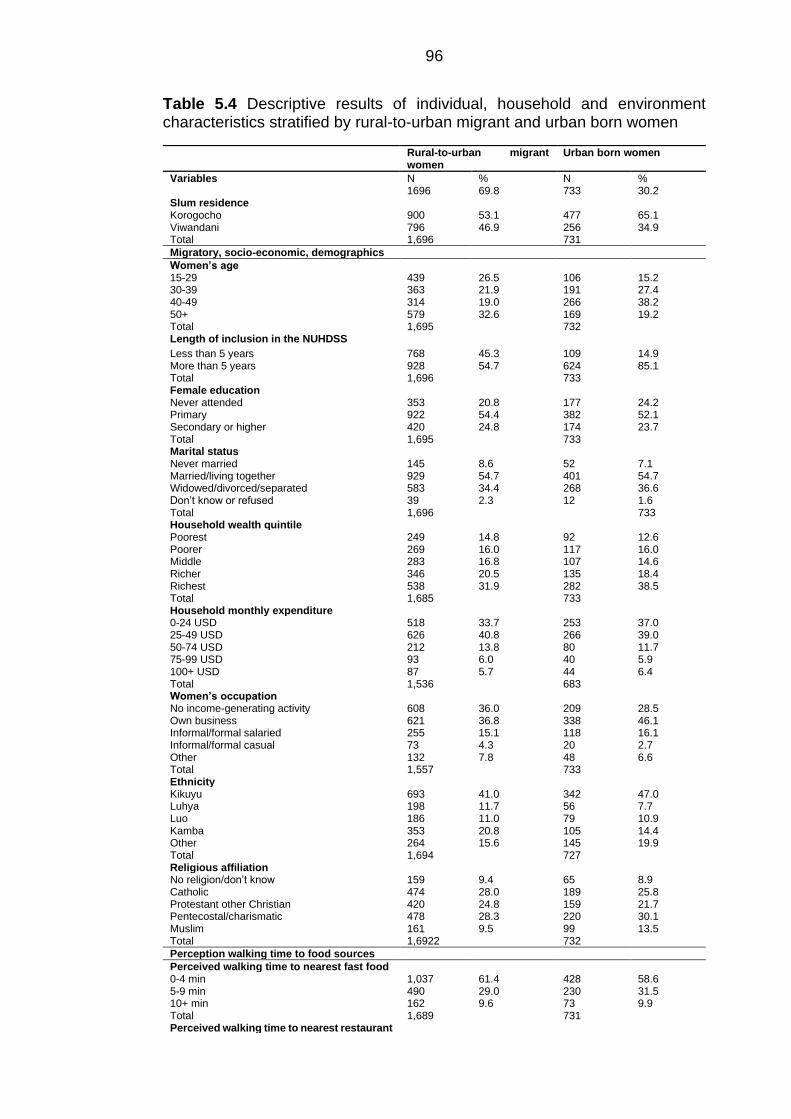
96
Table 5.4 Descriptive results of individual, household and environment characteristics stratified by rural-to-urban migrant and urban born women
Rural-to-urban migrant women
Urban born women
Variables N % N % 1696 69.8 733 30.2 Slum residence Korogocho Viwandani Total
900 796 1,696
53.1 46.9
477 256 731
65.1 34.9
Migratory, socio-economic, demographics
Women’s age 15-29 30-39 40-49 50+ Total
439 363 314 579 1,695
26.5 21.9 19.0 32.6
106 191 266 169 732
15.2 27.4 38.2 19.2
Length of inclusion in the NUHDSS
Less than 5 years More than 5 years Total
768 928 1,696
45.3 54.7
109 624 733
14.9 85.1
Female education Never attended Primary Secondary or higher Total
353 922 420 1,695
20.8 54.4 24.8
177 382 174 733
24.2 52.1 23.7
Marital status Never married Married/living together Widowed/divorced/separated Don’t know or refused Total
145 929 583 39 1,696
8.6 54.7 34.4 2.3
52 401 268 12
7.1 54.7 36.6 1.6 733
Household wealth quintile Poorest Poorer Middle Richer Richest Total
249 269 283 346 538 1,685
14.8 16.0 16.8 20.5 31.9
92 117 107 135 282 733
12.6 16.0 14.6 18.4 38.5
Household monthly expenditure 0-24 USD 25-49 USD 50-74 USD 75-99 USD 100+ USD Total
518 626 212 93 87 1,536
33.7 40.8 13.8 6.0 5.7
253 266 80 40 44 683
37.0 39.0 11.7 5.9 6.4
Women’s occupation No income-generating activity Own business Informal/formal salaried Informal/formal casual Other Total
608 621 255 73 132 1,557
36.0 36.8 15.1 4.3 7.8
209 338 118 20 48 733
28.5 46.1 16.1 2.7 6.6
Ethnicity Kikuyu Luhya Luo Kamba Other Total
693 198 186 353 264 1,694
41.0 11.7 11.0 20.8 15.6
342 56 79 105 145 727
47.0 7.7 10.9 14.4 19.9
Religious affiliation No religion/don’t know Catholic Protestant other Christian Pentecostal/charismatic Muslim Total
159 474 420 478 161 1,6922
9.4 28.0 24.8 28.3 9.5
65 189 159 220 99 732
8.9 25.8 21.7 30.1 13.5
Perception walking time to food sources
Perceived walking time to nearest fast food 0-4 min 5-9 min 10+ min Total
1,037 490 162 1,689
61.4 29.0 9.6
428 230 73 731
58.6 31.5 9.9
Perceived walking time to nearest restaurant
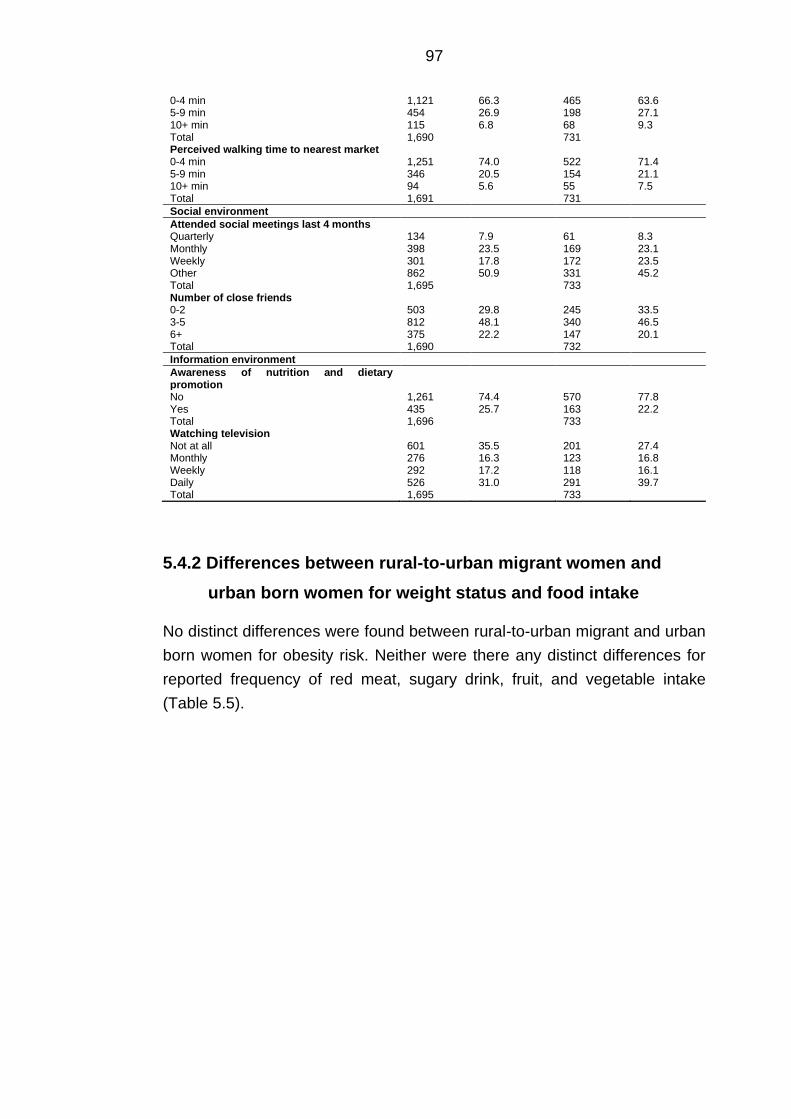
97
5.4.2 Differences between rural-to-urban migrant women and
urban born women for weight status and food intake
No distinct differences were found between rural-to-urban migrant and urban
born women for obesity risk. Neither were there any distinct differences for
reported frequency of red meat, sugary drink, fruit, and vegetable intake
(Table 5.5).
0-4 min 5-9 min 10+ min Total
1,121 454 115 1,690
66.3 26.9 6.8
465 198 68 731
63.6 27.1 9.3
Perceived walking time to nearest market 0-4 min 5-9 min 10+ min Total
1,251 346 94 1,691
74.0 20.5 5.6
522 154 55 731
71.4 21.1 7.5
Social environment
Attended social meetings last 4 months Quarterly Monthly Weekly Other Total
134 398 301 862 1,695
7.9 23.5 17.8 50.9
61 169 172 331 733
8.3 23.1 23.5 45.2
Number of close friends 0-2 3-5 6+ Total
503 812 375 1,690
29.8 48.1 22.2
245 340 147 732
33.5 46.5 20.1
Information environment
Awareness of nutrition and dietary promotion
No Yes Total
1,261 435 1,696
74.4 25.7
570 163 733
77.8 22.2
Watching television Not at all Monthly Weekly Daily Total
601 276 292 526 1,695
35.5 16.3 17.2 31.0
201 123 118 291 733
27.4 16.8 16.1 39.7
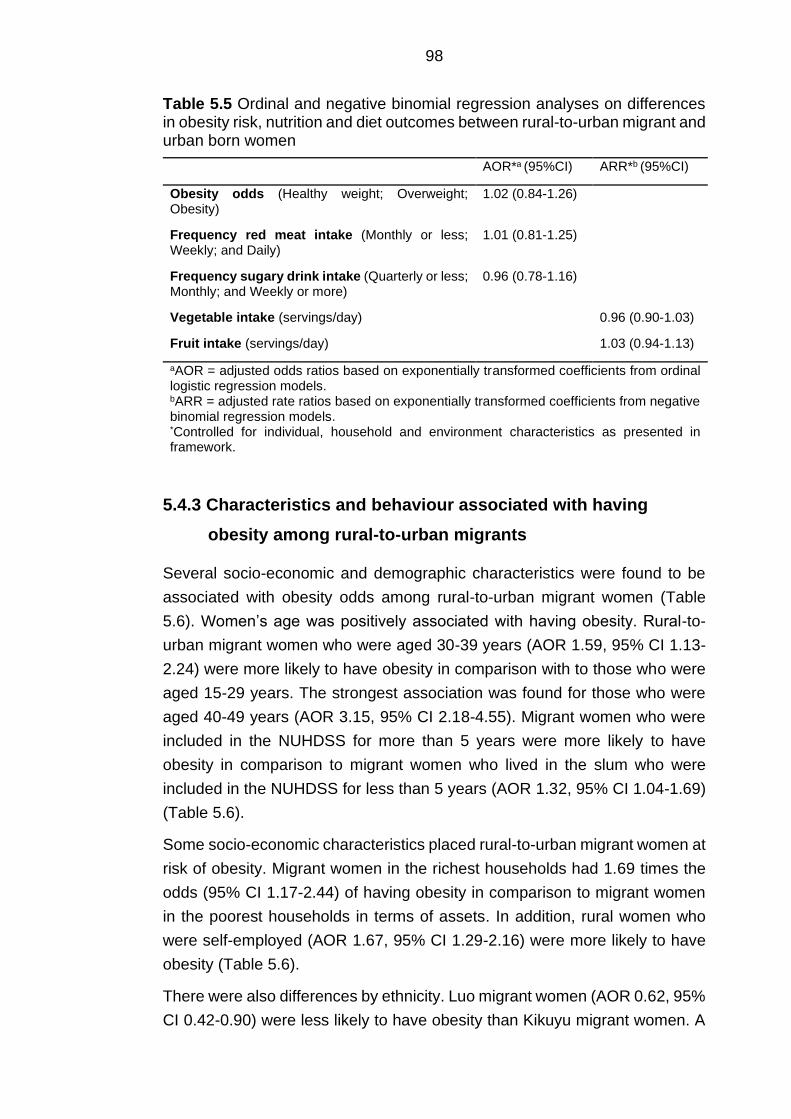
98
Table 5.5 Ordinal and negative binomial regression analyses on differences in obesity risk, nutrition and diet outcomes between rural-to-urban migrant and urban born women
AOR*a (95%CI) ARR*b (95%CI)
Obesity odds (Healthy weight; Overweight; Obesity)
1.02 (0.84-1.26)
Frequency red meat intake (Monthly or less; Weekly; and Daily)
1.01 (0.81-1.25)
Frequency sugary drink intake (Quarterly or less; Monthly; and Weekly or more)
0.96 (0.78-1.16)
Vegetable intake (servings/day)
0.96 (0.90-1.03)
Fruit intake (servings/day)
1.03 (0.94-1.13)
aAOR = adjusted odds ratios based on exponentially transformed coefficients from ordinal logistic regression models. bARR = adjusted rate ratios based on exponentially transformed coefficients from negative binomial regression models. *Controlled for individual, household and environment characteristics as presented in framework.
5.4.3 Characteristics and behaviour associated with having
obesity among rural-to-urban migrants
Several socio-economic and demographic characteristics were found to be
associated with obesity odds among rural-to-urban migrant women (Table
5.6). Women’s age was positively associated with having obesity. Rural-to-
urban migrant women who were aged 30-39 years (AOR 1.59, 95% CI 1.13-
2.24) were more likely to have obesity in comparison with to those who were
aged 15-29 years. The strongest association was found for those who were
aged 40-49 years (AOR 3.15, 95% CI 2.18-4.55). Migrant women who were
included in the NUHDSS for more than 5 years were more likely to have
obesity in comparison to migrant women who lived in the slum who were
included in the NUHDSS for less than 5 years (AOR 1.32, 95% CI 1.04-1.69)
(Table 5.6).
Some socio-economic characteristics placed rural-to-urban migrant women at
risk of obesity. Migrant women in the richest households had 1.69 times the
odds (95% CI 1.17-2.44) of having obesity in comparison to migrant women
in the poorest households in terms of assets. In addition, rural women who
were self-employed (AOR 1.67, 95% CI 1.29-2.16) were more likely to have
obesity (Table 5.6).
There were also differences by ethnicity. Luo migrant women (AOR 0.62, 95%
CI 0.42-0.90) were less likely to have obesity than Kikuyu migrant women. A
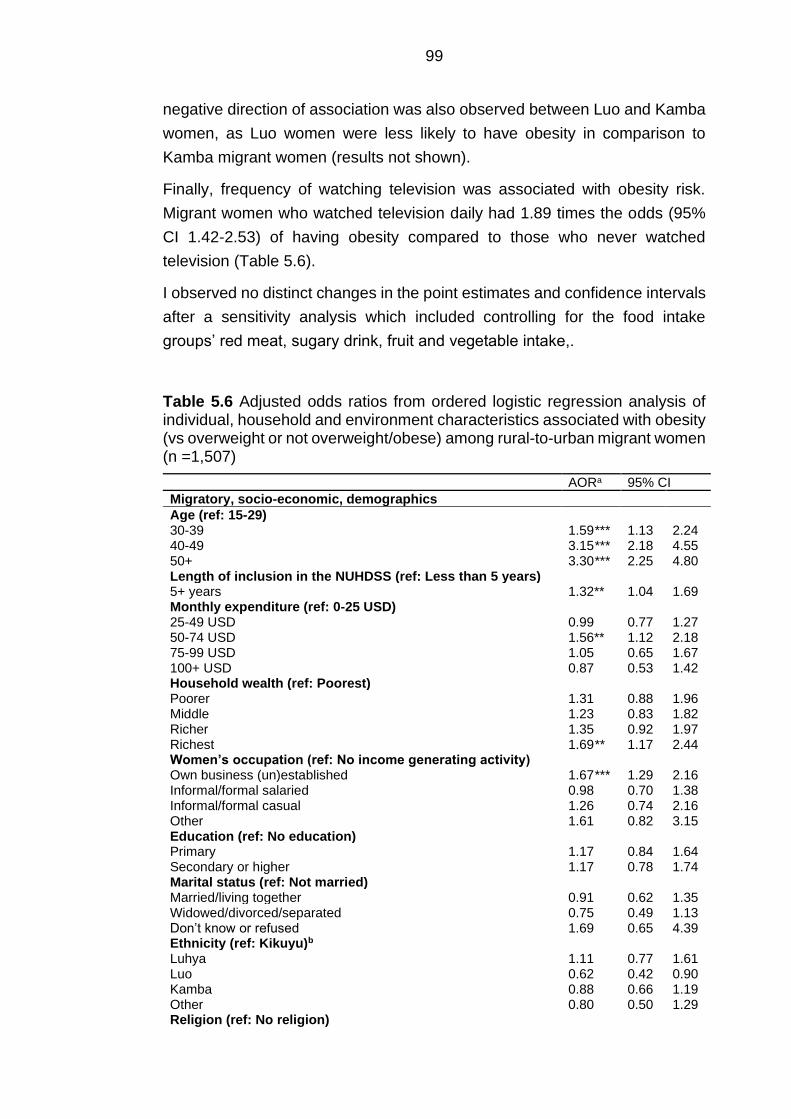
99
negative direction of association was also observed between Luo and Kamba
women, as Luo women were less likely to have obesity in comparison to
Kamba migrant women (results not shown).
Finally, frequency of watching television was associated with obesity risk.
Migrant women who watched television daily had 1.89 times the odds (95%
CI 1.42-2.53) of having obesity compared to those who never watched
television (Table 5.6).
I observed no distinct changes in the point estimates and confidence intervals
after a sensitivity analysis which included controlling for the food intake
groups’ red meat, sugary drink, fruit and vegetable intake,.
Table 5.6 Adjusted odds ratios from ordered logistic regression analysis of individual, household and environment characteristics associated with obesity (vs overweight or not overweight/obese) among rural-to-urban migrant women (n =1,507)
AORa 95% CI
Migratory, socio-economic, demographics
Age (ref: 15-29) 30-39 1.59*** 1.13 2.24 40-49 3.15*** 2.18 4.55 50+ 3.30*** 2.25 4.80 Length of inclusion in the NUHDSS (ref: Less than 5 years) 5+ years 1.32** 1.04 1.69 Monthly expenditure (ref: 0-25 USD) 25-49 USD 0.99 0.77 1.27 50-74 USD 1.56** 1.12 2.18 75-99 USD 1.05 0.65 1.67 100+ USD 0.87 0.53 1.42 Household wealth (ref: Poorest) Poorer 1.31 0.88 1.96 Middle 1.23 0.83 1.82 Richer 1.35 0.92 1.97 Richest 1.69** 1.17 2.44 Women’s occupation (ref: No income generating activity) Own business (un)established 1.67*** 1.29 2.16 Informal/formal salaried 0.98 0.70 1.38 Informal/formal casual 1.26 0.74 2.16 Other 1.61 0.82 3.15 Education (ref: No education) Primary 1.17 0.84 1.64 Secondary or higher 1.17 0.78 1.74 Marital status (ref: Not married) Married/living together 0.91 0.62 1.35 Widowed/divorced/separated 0.75 0.49 1.13 Don’t know or refused 1.69 0.65 4.39 Ethnicity (ref: Kikuyu)b Luhya 1.11 0.77 1.61 Luo 0.62 0.42 0.90 Kamba 0.88 0.66 1.19 Other 0.80 0.50 1.29 Religion (ref: No religion)
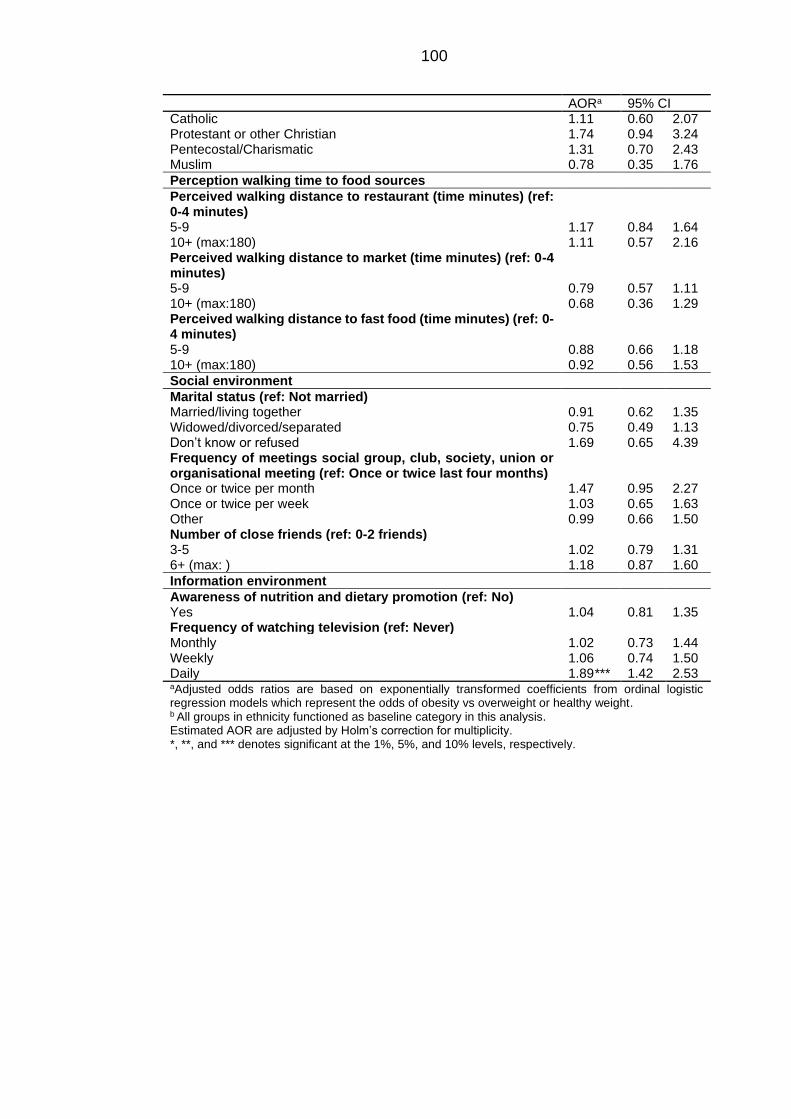
100
AORa 95% CI Catholic 1.11 0.60 2.07 Protestant or other Christian 1.74 0.94 3.24 Pentecostal/Charismatic 1.31 0.70 2.43 Muslim 0.78 0.35 1.76
Perception walking time to food sources
Perceived walking distance to restaurant (time minutes) (ref: 0-4 minutes)
5-9 1.17 0.84 1.64 10+ (max:180) 1.11 0.57 2.16 Perceived walking distance to market (time minutes) (ref: 0-4 minutes)
5-9 0.79 0.57 1.11 10+ (max:180) 0.68 0.36 1.29 Perceived walking distance to fast food (time minutes) (ref: 0-4 minutes)
5-9 0.88 0.66 1.18 10+ (max:180) 0.92 0.56 1.53
Social environment
Marital status (ref: Not married) Married/living together 0.91 0.62 1.35 Widowed/divorced/separated 0.75 0.49 1.13 Don’t know or refused 1.69 0.65 4.39 Frequency of meetings social group, club, society, union or organisational meeting (ref: Once or twice last four months)
Once or twice per month 1.47 0.95 2.27 Once or twice per week 1.03 0.65 1.63 Other 0.99 0.66 1.50 Number of close friends (ref: 0-2 friends) 3-5 1.02 0.79 1.31 6+ (max: ) 1.18 0.87 1.60
Information environment
Awareness of nutrition and dietary promotion (ref: No) Yes 1.04 0.81 1.35 Frequency of watching television (ref: Never) Monthly 1.02 0.73 1.44 Weekly 1.06 0.74 1.50 Daily 1.89*** 1.42 2.53 aAdjusted odds ratios are based on exponentially transformed coefficients from ordinal logistic regression models which represent the odds of obesity vs overweight or healthy weight. b All groups in ethnicity functioned as baseline category in this analysis. Estimated AOR are adjusted by Holm’s correction for multiplicity. *, **, and *** denotes significant at the 1%, 5%, and 10% levels, respectively.
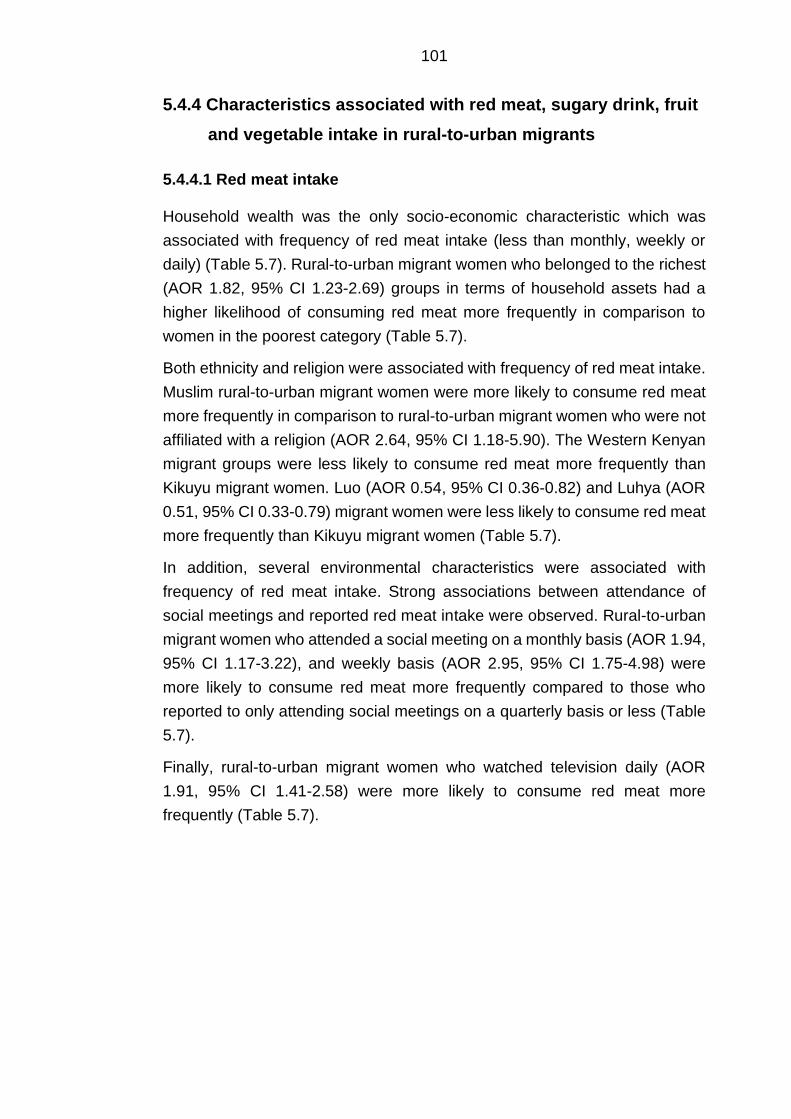
101
5.4.4 Characteristics associated with red meat, sugary drink, fruit
and vegetable intake in rural-to-urban migrants
5.4.4.1 Red meat intake
Household wealth was the only socio-economic characteristic which was
associated with frequency of red meat intake (less than monthly, weekly or
daily) (Table 5.7). Rural-to-urban migrant women who belonged to the richest
(AOR 1.82, 95% CI 1.23-2.69) groups in terms of household assets had a
higher likelihood of consuming red meat more frequently in comparison to
women in the poorest category (Table 5.7).
Both ethnicity and religion were associated with frequency of red meat intake.
Muslim rural-to-urban migrant women were more likely to consume red meat
more frequently in comparison to rural-to-urban migrant women who were not
affiliated with a religion (AOR 2.64, 95% CI 1.18-5.90). The Western Kenyan
migrant groups were less likely to consume red meat more frequently than
Kikuyu migrant women. Luo (AOR 0.54, 95% CI 0.36-0.82) and Luhya (AOR
0.51, 95% CI 0.33-0.79) migrant women were less likely to consume red meat
more frequently than Kikuyu migrant women (Table 5.7).
In addition, several environmental characteristics were associated with
frequency of red meat intake. Strong associations between attendance of
social meetings and reported red meat intake were observed. Rural-to-urban
migrant women who attended a social meeting on a monthly basis (AOR 1.94,
95% CI 1.17-3.22), and weekly basis (AOR 2.95, 95% CI 1.75-4.98) were
more likely to consume red meat more frequently compared to those who
reported to only attending social meetings on a quarterly basis or less (Table
5.7).
Finally, rural-to-urban migrant women who watched television daily (AOR
1.91, 95% CI 1.41-2.58) were more likely to consume red meat more
frequently (Table 5.7).
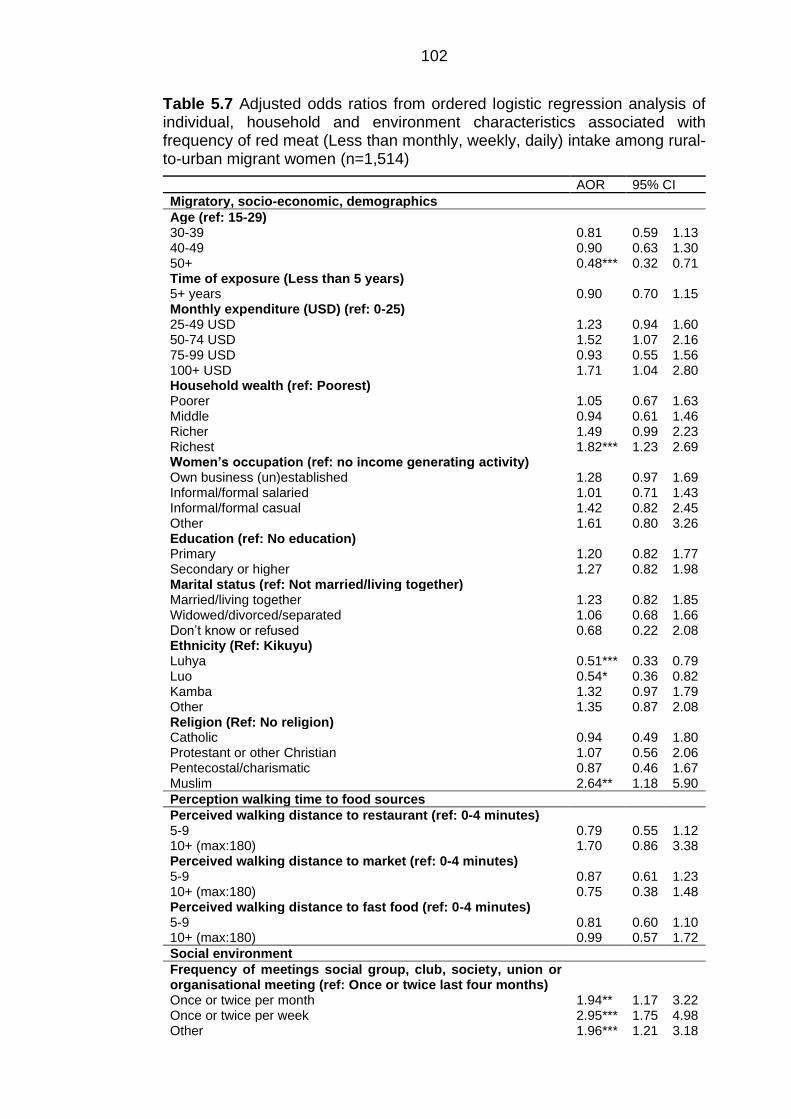
102
Table 5.7 Adjusted odds ratios from ordered logistic regression analysis of individual, household and environment characteristics associated with frequency of red meat (Less than monthly, weekly, daily) intake among rural-to-urban migrant women (n=1,514)
AOR 95% CI
Migratory, socio-economic, demographics
Age (ref: 15-29) 30-39 0.81 0.59 1.13 40-49 0.90 0.63 1.30 50+ 0.48*** 0.32 0.71 Time of exposure (Less than 5 years) 5+ years 0.90 0.70 1.15 Monthly expenditure (USD) (ref: 0-25) 25-49 USD 1.23 0.94 1.60 50-74 USD 1.52 1.07 2.16 75-99 USD 0.93 0.55 1.56 100+ USD 1.71 1.04 2.80 Household wealth (ref: Poorest) Poorer 1.05 0.67 1.63 Middle 0.94 0.61 1.46 Richer 1.49 0.99 2.23 Richest 1.82*** 1.23 2.69 Women’s occupation (ref: no income generating activity) Own business (un)established 1.28 0.97 1.69 Informal/formal salaried 1.01 0.71 1.43 Informal/formal casual 1.42 0.82 2.45 Other 1.61 0.80 3.26 Education (ref: No education) Primary 1.20 0.82 1.77 Secondary or higher 1.27 0.82 1.98 Marital status (ref: Not married/living together) Married/living together 1.23 0.82 1.85 Widowed/divorced/separated 1.06 0.68 1.66 Don’t know or refused 0.68 0.22 2.08 Ethnicity (Ref: Kikuyu) Luhya 0.51*** 0.33 0.79 Luo 0.54* 0.36 0.82 Kamba 1.32 0.97 1.79 Other 1.35 0.87 2.08 Religion (Ref: No religion) Catholic 0.94 0.49 1.80 Protestant or other Christian 1.07 0.56 2.06 Pentecostal/charismatic 0.87 0.46 1.67 Muslim 2.64** 1.18 5.90
Perception walking time to food sources
Perceived walking distance to restaurant (ref: 0-4 minutes) 5-9 0.79 0.55 1.12 10+ (max:180) 1.70 0.86 3.38 Perceived walking distance to market (ref: 0-4 minutes) 5-9 0.87 0.61 1.23 10+ (max:180) 0.75 0.38 1.48 Perceived walking distance to fast food (ref: 0-4 minutes) 5-9 0.81 0.60 1.10 10+ (max:180) 0.99 0.57 1.72
Social environment
Frequency of meetings social group, club, society, union or organisational meeting (ref: Once or twice last four months)
Once or twice per month 1.94** 1.17 3.22 Once or twice per week 2.95*** 1.75 4.98 Other 1.96*** 1.21 3.18
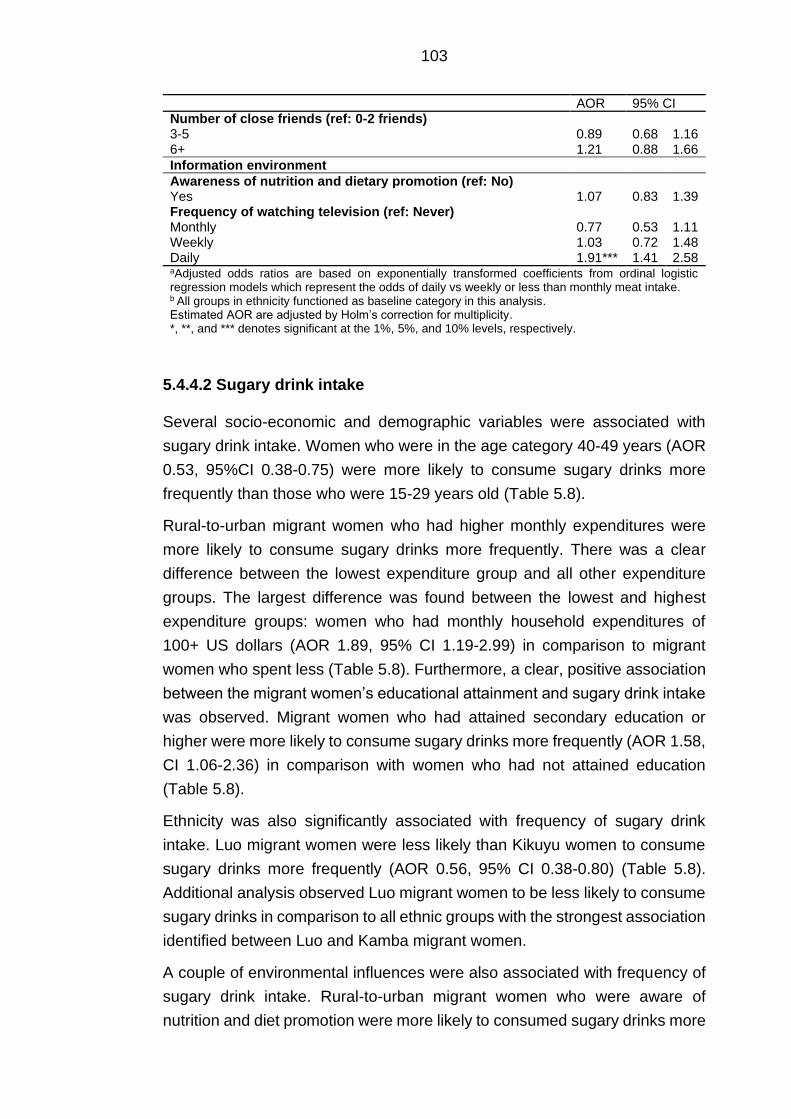
103
AOR 95% CI Number of close friends (ref: 0-2 friends) 3-5 0.89 0.68 1.16 6+ 1.21 0.88 1.66
Information environment
Awareness of nutrition and dietary promotion (ref: No) Yes 1.07 0.83 1.39 Frequency of watching television (ref: Never) Monthly 0.77 0.53 1.11 Weekly 1.03 0.72 1.48 Daily 1.91*** 1.41 2.58 aAdjusted odds ratios are based on exponentially transformed coefficients from ordinal logistic regression models which represent the odds of daily vs weekly or less than monthly meat intake. b All groups in ethnicity functioned as baseline category in this analysis. Estimated AOR are adjusted by Holm’s correction for multiplicity. *, **, and *** denotes significant at the 1%, 5%, and 10% levels, respectively.
5.4.4.2 Sugary drink intake
Several socio-economic and demographic variables were associated with
sugary drink intake. Women who were in the age category 40-49 years (AOR
0.53, 95%CI 0.38-0.75) were more likely to consume sugary drinks more
frequently than those who were 15-29 years old (Table 5.8).
Rural-to-urban migrant women who had higher monthly expenditures were
more likely to consume sugary drinks more frequently. There was a clear
difference between the lowest expenditure group and all other expenditure
groups. The largest difference was found between the lowest and highest
expenditure groups: women who had monthly household expenditures of
100+ US dollars (AOR 1.89, 95% CI 1.19-2.99) in comparison to migrant
women who spent less (Table 5.8). Furthermore, a clear, positive association
between the migrant women’s educational attainment and sugary drink intake
was observed. Migrant women who had attained secondary education or
higher were more likely to consume sugary drinks more frequently (AOR 1.58,
CI 1.06-2.36) in comparison with women who had not attained education
(Table 5.8).
Ethnicity was also significantly associated with frequency of sugary drink
intake. Luo migrant women were less likely than Kikuyu women to consume
sugary drinks more frequently (AOR 0.56, 95% CI 0.38-0.80) (Table 5.8).
Additional analysis observed Luo migrant women to be less likely to consume
sugary drinks in comparison to all ethnic groups with the strongest association
identified between Luo and Kamba migrant women.
A couple of environmental influences were also associated with frequency of
sugary drink intake. Rural-to-urban migrant women who were aware of
nutrition and diet promotion were more likely to consumed sugary drinks more
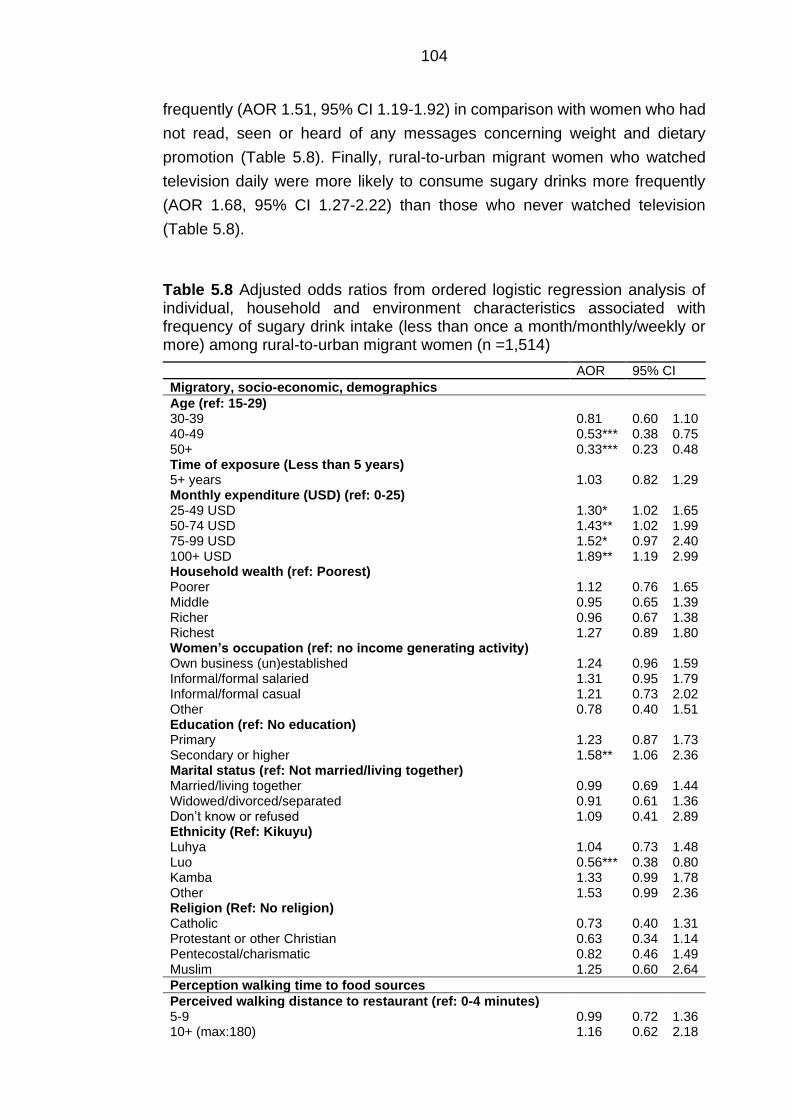
104
frequently (AOR 1.51, 95% CI 1.19-1.92) in comparison with women who had
not read, seen or heard of any messages concerning weight and dietary
promotion (Table 5.8). Finally, rural-to-urban migrant women who watched
television daily were more likely to consume sugary drinks more frequently
(AOR 1.68, 95% CI 1.27-2.22) than those who never watched television
(Table 5.8).
Table 5.8 Adjusted odds ratios from ordered logistic regression analysis of individual, household and environment characteristics associated with frequency of sugary drink intake (less than once a month/monthly/weekly or more) among rural-to-urban migrant women (n =1,514)
AOR 95% CI
Migratory, socio-economic, demographics
Age (ref: 15-29) 30-39 0.81 0.60 1.10 40-49 0.53*** 0.38 0.75 50+ 0.33*** 0.23 0.48 Time of exposure (Less than 5 years) 5+ years 1.03 0.82 1.29 Monthly expenditure (USD) (ref: 0-25) 25-49 USD 1.30* 1.02 1.65 50-74 USD 1.43** 1.02 1.99 75-99 USD 1.52* 0.97 2.40 100+ USD 1.89** 1.19 2.99 Household wealth (ref: Poorest) Poorer 1.12 0.76 1.65 Middle 0.95 0.65 1.39 Richer 0.96 0.67 1.38 Richest 1.27 0.89 1.80 Women’s occupation (ref: no income generating activity) Own business (un)established 1.24 0.96 1.59 Informal/formal salaried 1.31 0.95 1.79 Informal/formal casual 1.21 0.73 2.02 Other 0.78 0.40 1.51 Education (ref: No education) Primary 1.23 0.87 1.73 Secondary or higher 1.58** 1.06 2.36 Marital status (ref: Not married/living together) Married/living together 0.99 0.69 1.44 Widowed/divorced/separated 0.91 0.61 1.36 Don’t know or refused 1.09 0.41 2.89 Ethnicity (Ref: Kikuyu) Luhya 1.04 0.73 1.48 Luo 0.56*** 0.38 0.80 Kamba 1.33 0.99 1.78 Other 1.53 0.99 2.36 Religion (Ref: No religion) Catholic 0.73 0.40 1.31 Protestant or other Christian 0.63 0.34 1.14 Pentecostal/charismatic 0.82 0.46 1.49 Muslim 1.25 0.60 2.64
Perception walking time to food sources
Perceived walking distance to restaurant (ref: 0-4 minutes) 5-9 0.99 0.72 1.36 10+ (max:180) 1.16 0.62 2.18

105
AOR 95% CI Perceived walking distance to market (ref: 0-4 minutes) 5-9 1.24 0.91 1.70 10+ (max:180) 1.16 0.64 2.11 Perceived walking distance to fast food (ref: 0-4 minutes) 5-9 0.93 0.71 1.22 10+ (max:180) 0.91 0.56 1.49
Social environment
Frequency of meetings social group, club, society, union or organisational meeting (ref: Once or twice last four months)
Once or twice per month 0.85 0.56 1.27 Once or twice per week 1.12 0.73 1.72 Other 0.70 0.48 1.02 Number of close friends (ref: 0-2 friends) 3-5 1.16 0.91 1.48 6+ 1.17 0.87 1.56
Information environment
Awareness of nutrition and dietary promotion (ref: No) Yes 1.51*** 1.19 1.92 Frequency of watching television (ref: Never) Monthly 1.00 0.73 1.38 Weekly 1.11 0.81 1.53 Daily 1.68*** 1.27 2.22 aAdjusted odds ratios are based on exponentially transformed coefficients from ordinal logistic regression models which represent the odds of weekly or more vs monthly or less than once a month sugary drink intake. b All groups in ethnicity functioned as baseline category in this analysis. Estimated AOR are adjusted by Holm’s correction for multiplicity. *, **, and *** denotes significant at the 1%, 5%, and 10% levels, respectively.
5.4.4.3 Fruit and vegetable intake
The results from the regression analyses on individual and environmental
factors of vegetable and fruit intake are presented in Table 5.9 and Table 5.10
respectively.
As for vegetable intake, a positive gradient by household monthly
expenditures was observed for vegetable intake. The strongest association
was identified for migrant women who reported spending more than 100+ USD
(ARR 1.43, CI 1.23-1.68) per month and had greater frequency of vegetable
intake in comparison with migrant women who spent 0-25 USD per month
(Table 5.9). IGA was only associated with fruit intake, and with a small effect
size. Rural-to-urban migrant women who were self-employed reported greater
intake of fruit servings (ARR 1.19, 95% CI 1.04-1.35) in comparison to those
who did not have an IGA (Table 5.10). In response to this finding I set the self-
employment category as baseline. There were no distinct differences in fruit
intake between self-employed women and women who had casual IGA,
whereas salaried women reported a lower fruit intake in comparison to self-
employed migrant women.
106
There was an association between education and vegetable intake. Rural-to-
urban migrant women who had attained primary education (ARR 0.89, 95%
CI 0.80-0.98) reported consuming fewer vegetable servings compared with
those who had no education (Table 5.9). Furthermore, a weak association
was found between marital status and vegetable intake was observed. Migrant
women who were married (ARR 0.85, 95% CI 0.75-0.97) reported lower
vegetable intakes in comparison with those who were single (Table 5.9).
This analysis also identified potential differences in reported fruit intake
between several ethnic groups. Luo migrant women (ARR 0.79, 95% CI 0.66-
0.95) reported a lower intake of fruit servings in comparison to Kikuyu rural-
to-urban migrant women. Just as for obesity odds, Luo migrant women also
reported lower fruit intake in comparison with Kamba migrant women (Table
5.10).
There was a weak association between rural-to-urban migrant women’s
reported walking time to the nearest market and reported vegetable intake.
Migrant women who reported that they had to walk 5-9 minutes to the market
reported a lower intake of vegetable servings (ARR 0.83, 95% CI 0.75-0.92),
compared to those who reported to live within 5 minutes walking distance to
the market (Table 5.9).
With regards to media exposure, both nutrition and dietary promotion and
watching television were associated with both fruit and vegetable intake.
Rural-to-urban migrant women who had read, seen or heard of any messages
on nutrition and diet promotion reported a higher intake of both vegetable
(ARR 1.10, 95% CI 1.01-1.20) and fruit (ARR 1.17, 95% CI 1.05-1.30) in
comparison with those who had not read, seen or heard of any messages
concerning nutrition and dietary promotion (Table 5.9 and Table 5.10). Lastly,
rural-to-urban migrant women who watched television on a daily basis
consumed a higher number of fruit servings (ARR 1.16, 95% CI 1.00-1.34) in
comparison to those who never watched television (Table 5.10).
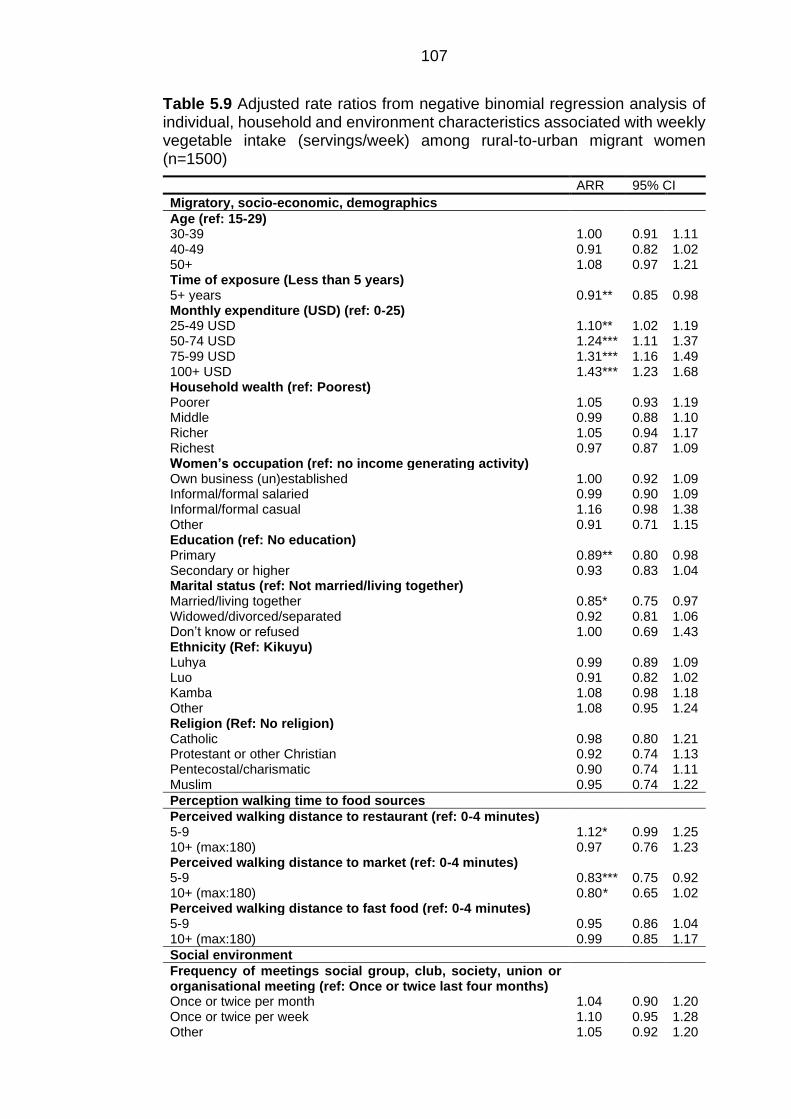
107
Table 5.9 Adjusted rate ratios from negative binomial regression analysis of individual, household and environment characteristics associated with weekly vegetable intake (servings/week) among rural-to-urban migrant women (n=1500)
ARR 95% CI
Migratory, socio-economic, demographics
Age (ref: 15-29) 30-39 1.00 0.91 1.11 40-49 0.91 0.82 1.02 50+ 1.08 0.97 1.21 Time of exposure (Less than 5 years) 5+ years 0.91** 0.85 0.98 Monthly expenditure (USD) (ref: 0-25) 25-49 USD 1.10** 1.02 1.19 50-74 USD 1.24*** 1.11 1.37 75-99 USD 1.31*** 1.16 1.49 100+ USD 1.43*** 1.23 1.68 Household wealth (ref: Poorest) Poorer 1.05 0.93 1.19 Middle 0.99 0.88 1.10 Richer 1.05 0.94 1.17 Richest 0.97 0.87 1.09 Women’s occupation (ref: no income generating activity) Own business (un)established 1.00 0.92 1.09 Informal/formal salaried 0.99 0.90 1.09 Informal/formal casual 1.16 0.98 1.38 Other 0.91 0.71 1.15 Education (ref: No education) Primary 0.89** 0.80 0.98 Secondary or higher 0.93 0.83 1.04 Marital status (ref: Not married/living together) Married/living together 0.85* 0.75 0.97 Widowed/divorced/separated 0.92 0.81 1.06 Don’t know or refused 1.00 0.69 1.43 Ethnicity (Ref: Kikuyu) Luhya 0.99 0.89 1.09 Luo 0.91 0.82 1.02 Kamba 1.08 0.98 1.18 Other 1.08 0.95 1.24 Religion (Ref: No religion) Catholic 0.98 0.80 1.21 Protestant or other Christian 0.92 0.74 1.13 Pentecostal/charismatic 0.90 0.74 1.11 Muslim 0.95 0.74 1.22
Perception walking time to food sources
Perceived walking distance to restaurant (ref: 0-4 minutes) 5-9 1.12* 0.99 1.25 10+ (max:180) 0.97 0.76 1.23 Perceived walking distance to market (ref: 0-4 minutes) 5-9 0.83*** 0.75 0.92 10+ (max:180) 0.80* 0.65 1.02 Perceived walking distance to fast food (ref: 0-4 minutes) 5-9 0.95 0.86 1.04 10+ (max:180) 0.99 0.85 1.17
Social environment
Frequency of meetings social group, club, society, union or organisational meeting (ref: Once or twice last four months)
Once or twice per month 1.04 0.90 1.20 Once or twice per week 1.10 0.95 1.28 Other 1.05 0.92 1.20
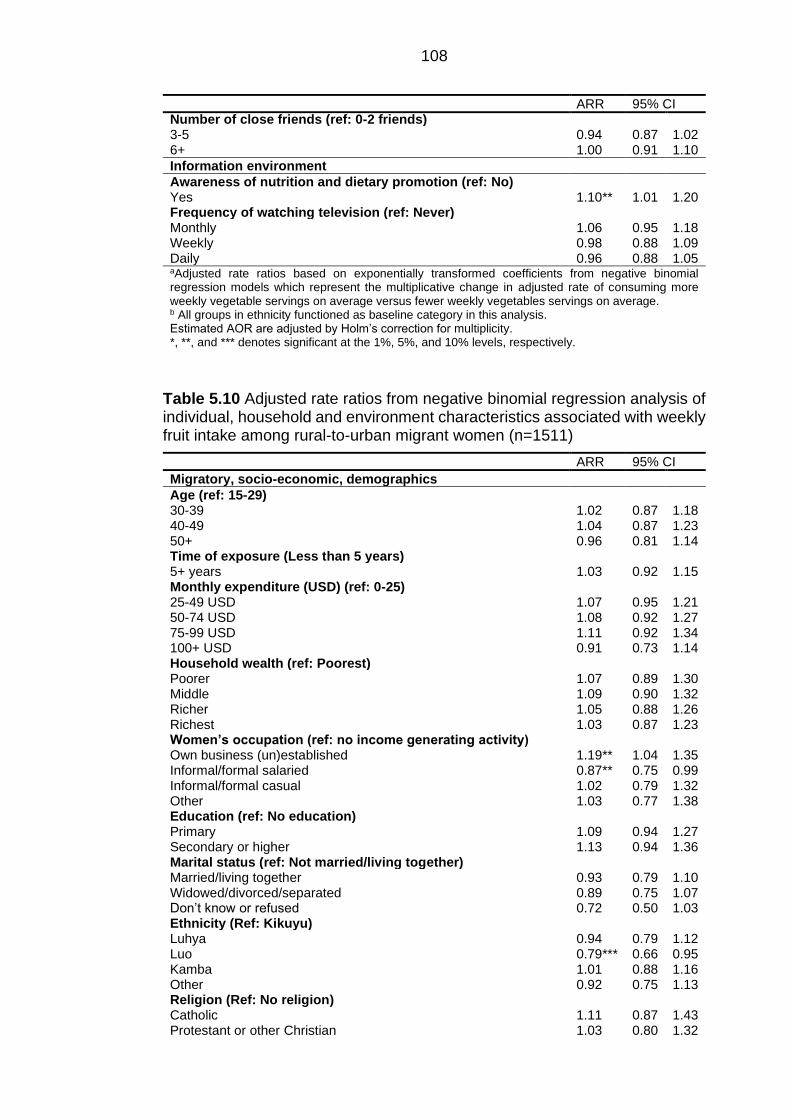
108
ARR 95% CI Number of close friends (ref: 0-2 friends) 3-5 0.94 0.87 1.02 6+ 1.00 0.91 1.10
Information environment
Awareness of nutrition and dietary promotion (ref: No) Yes 1.10** 1.01 1.20 Frequency of watching television (ref: Never) Monthly 1.06 0.95 1.18 Weekly 0.98 0.88 1.09 Daily 0.96 0.88 1.05 aAdjusted rate ratios based on exponentially transformed coefficients from negative binomial regression models which represent the multiplicative change in adjusted rate of consuming more weekly vegetable servings on average versus fewer weekly vegetables servings on average.
b All groups in ethnicity functioned as baseline category in this analysis.
Estimated AOR are adjusted by Holm’s correction for multiplicity. *, **, and *** denotes significant at the 1%, 5%, and 10% levels, respectively.
Table 5.10 Adjusted rate ratios from negative binomial regression analysis of individual, household and environment characteristics associated with weekly fruit intake among rural-to-urban migrant women (n=1511)
ARR 95% CI
Migratory, socio-economic, demographics
Age (ref: 15-29) 30-39 1.02 0.87 1.18 40-49 1.04 0.87 1.23 50+ 0.96 0.81 1.14 Time of exposure (Less than 5 years) 5+ years 1.03 0.92 1.15 Monthly expenditure (USD) (ref: 0-25) 25-49 USD 1.07 0.95 1.21 50-74 USD 1.08 0.92 1.27 75-99 USD 1.11 0.92 1.34 100+ USD 0.91 0.73 1.14 Household wealth (ref: Poorest) Poorer 1.07 0.89 1.30 Middle 1.09 0.90 1.32 Richer 1.05 0.88 1.26 Richest 1.03 0.87 1.23 Women’s occupation (ref: no income generating activity) Own business (un)established 1.19** 1.04 1.35 Informal/formal salaried 0.87** 0.75 0.99 Informal/formal casual 1.02 0.79 1.32 Other 1.03 0.77 1.38 Education (ref: No education) Primary 1.09 0.94 1.27 Secondary or higher 1.13 0.94 1.36 Marital status (ref: Not married/living together) Married/living together 0.93 0.79 1.10 Widowed/divorced/separated 0.89 0.75 1.07 Don’t know or refused 0.72 0.50 1.03 Ethnicity (Ref: Kikuyu) Luhya 0.94 0.79 1.12 Luo 0.79*** 0.66 0.95 Kamba 1.01 0.88 1.16 Other 0.92 0.75 1.13 Religion (Ref: No religion) Catholic 1.11 0.87 1.43 Protestant or other Christian 1.03 0.80 1.32
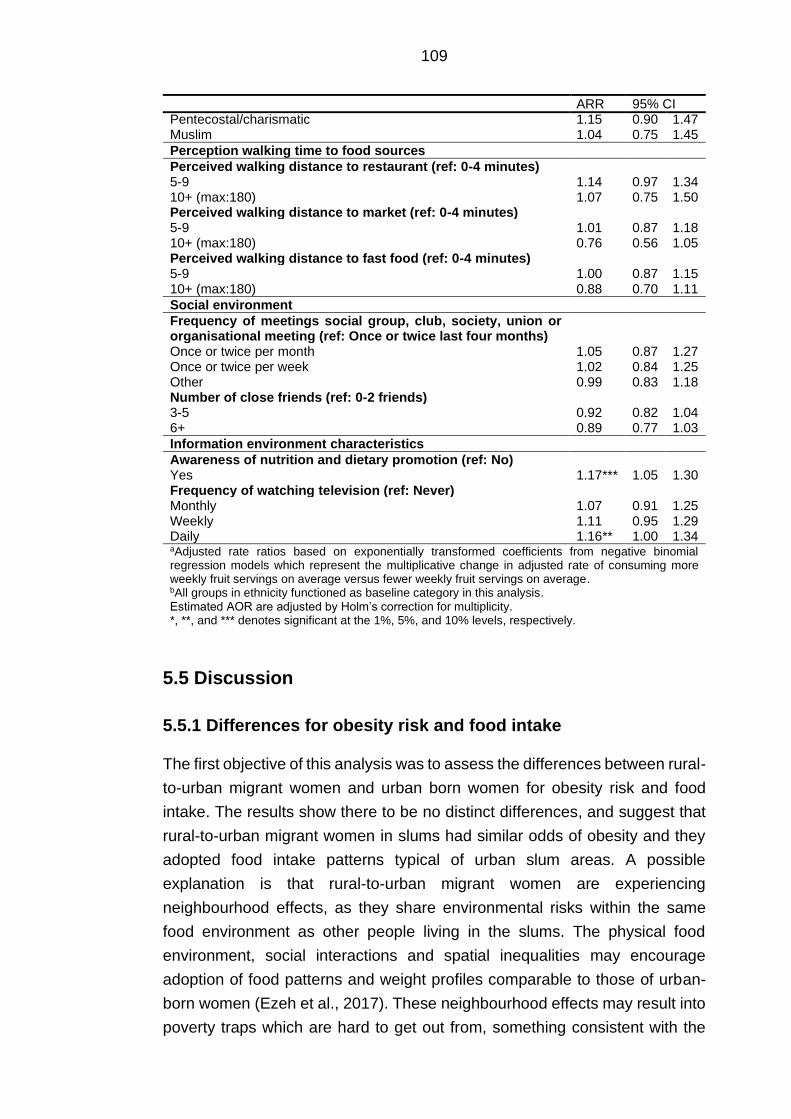
109
ARR 95% CI Pentecostal/charismatic 1.15 0.90 1.47 Muslim 1.04 0.75 1.45
Perception walking time to food sources
Perceived walking distance to restaurant (ref: 0-4 minutes) 5-9 1.14 0.97 1.34 10+ (max:180) 1.07 0.75 1.50 Perceived walking distance to market (ref: 0-4 minutes) 5-9 1.01 0.87 1.18 10+ (max:180) 0.76 0.56 1.05 Perceived walking distance to fast food (ref: 0-4 minutes) 5-9 1.00 0.87 1.15 10+ (max:180) 0.88 0.70 1.11
Social environment
Frequency of meetings social group, club, society, union or organisational meeting (ref: Once or twice last four months)
Once or twice per month 1.05 0.87 1.27 Once or twice per week 1.02 0.84 1.25 Other 0.99 0.83 1.18 Number of close friends (ref: 0-2 friends) 3-5 0.92 0.82 1.04 6+ 0.89 0.77 1.03
Information environment characteristics
Awareness of nutrition and dietary promotion (ref: No) Yes 1.17*** 1.05 1.30 Frequency of watching television (ref: Never) Monthly 1.07 0.91 1.25 Weekly 1.11 0.95 1.29 Daily 1.16** 1.00 1.34 aAdjusted rate ratios based on exponentially transformed coefficients from negative binomial regression models which represent the multiplicative change in adjusted rate of consuming more weekly fruit servings on average versus fewer weekly fruit servings on average. bAll groups in ethnicity functioned as baseline category in this analysis. Estimated AOR are adjusted by Holm’s correction for multiplicity. *, **, and *** denotes significant at the 1%, 5%, and 10% levels, respectively.
5.5 Discussion
5.5.1 Differences for obesity risk and food intake
The first objective of this analysis was to assess the differences between rural-
to-urban migrant women and urban born women for obesity risk and food
intake. The results show there to be no distinct differences, and suggest that
rural-to-urban migrant women in slums had similar odds of obesity and they
adopted food intake patterns typical of urban slum areas. A possible
explanation is that rural-to-urban migrant women are experiencing
neighbourhood effects, as they share environmental risks within the same
food environment as other people living in the slums. The physical food
environment, social interactions and spatial inequalities may encourage
adoption of food patterns and weight profiles comparable to those of urban-
born women (Ezeh et al., 2017). These neighbourhood effects may result into
poverty traps which are hard to get out from, something consistent with the
110
observed similarity of diets of different population groups within slums (Grant,
2010). A recent longitudinal analysis on NUHDSS datasets presented the
difficulty of escaping these poverty traps. Many urban households, including
migrant households, remained in chronic poverty (below the median of a
poverty index which includes income and assets for the study period of four
years), particularly female headed households (Mberu et al., 2014).
Rural-to-urban migrant women who were included in the NUHDSS for less
than five years were more likely to have obesity than women who had resided
there longer than five years, although this association was weak. It is noted
that the NUHDSS was only set up in 2002, and the survey spanned only seven
years. In a previous study in peri-urban slum settings differences for obesity
risk were found only for those who stayed in this area longer than 10 years
(Antiporta et al., 2016). This does signal that prolonged urban living carries
increased odds to gain weight. A popular explanation for this is that as time
passes, migrant women increasingly consume low-cost food high in fat and
sugar and reduce their total energy expenditure, while engaging in more
sedentary lifestyles (Antiporta et al., 2016; Bourne, 1996; Unwin et al., 2010).
5.5.2 Individual, household and environment characteristics
associated with obesity risk and food intake
5.5.2.1 Obesity risk
The second objective of this analysis was to identify individual, household and
environment characteristics associated with obesity risk and a greater intake
of red meat, sugary drink, fruit and vegetable intake among rural-to-urban
migrant women in Nairobi’s slums. As previous Nairobi slum studies have
indicated, obesity is common among urban slum dwellers. Almost one fifth of
rural-to-urban migrant women had obesity, and another one fourth were
overweight (Kimani-Murage et al., 2015b). Predominantly economic factors
seem to drive variation in obesity risk among rural-to-urban migrant women.
Rural-to-urban migrant women who were part of the richest household had a
higher likelihood of having obesity in comparison to those who were part of
the poorest household. These findings align with two recent Nairobi slum
studies in Korogocho and Viwandani which showed that women who belonged
to a richer household (also in terms of assets) to have higher levels of
measured BMI (Asiki et al., 2018a; Haregu et al., 2018). One study in the
Kibera division of Nairobi Province also found household wealth (determined
111
in this study by residential area, income and expenditure, number of
household assets, number of rooms in the house) to be positively associated
with overweight and obesity among women. The explanation they offered was
that convenience and fast foods become more available but are only
affordable by the high SES groups and may still be out of the price range of
the lower income group (Mbochi et al., 2012). However, household wealth
may not necessarily represent a higher individual income. Many of the
household possessions may not be of the participant but instead of her
husband. Furthermore, there may be overlap between sedentary behaviour
and obesogenic food intake in the association between household wealth and
obesity odds. Migrant women in the richest household groups may also have
protective behaviours. They have higher levels of dietary fibre and fresh fruit
and vegetables as they have more opportunities to store these foods (Ruel et
al., 2005). Much of the variation in obesity among rural-to-urban migrant
women could be explained by a more sedentary lifestyle (Keino et al., 2014).
Another noteworthy economic characteristic relating to obesity odds was the
type of income generating activity. Rural-to-urban migrant women were more
likely to have obesity when self-employed than those who were not involved
in IGA or were involved in salaried IGA (results not shown). One possible
explanation for this could be time pressure. A qualitative study of rural-to-
urban migrant women in Mexico noted that self-employed women felt they did
not have time to cook due to having long hours of work outside of the home
(Bojorquez et al., 2014). A predominance of women in Nairobi are active in
the informal food environment selling fruit, vegetables and pre-prepared
obesogenic food (Owuor et al., 2017). This may have adverse consequences
in regard to obesity risk. A non-migration study investigated nutrition status,
activity patterns, and energy intake of market women in an urban area in
Nigeria. While a large part of their diet consisted of roots, tubers, cereals and
legumes, their diet was also prominent with fried foods which were widely
available within their work environment. Market women reported to resort to
fried foods out of perceived time scarcity to cook at home (Afolabi et al., 2004).
112
5.5.2.2 Food intake
With urbanisation and rising incomes in SSA, red meat intake and sugary
drinks are expected to increase as well (de Brauw et al., 2017; Okop et al.,
2019; Unwin et al., 2010). However, as the descriptive results show, for many
migrant women in this study red meat and sugary drinks were not eaten daily
or even weekly. Inferential statistics imply food intake to be predominantly
associated with economic characteristics of migrant women. The associations
between socio-economic characteristics and obesity risk and food intake
support previous research which advocates that different measures of SES to
be predictive on different aspects of dietary behaviour and nutrition (Howe et
al., 2012; Kamphuis et al., 2006; Landais et al., 2015).
The richest migrant women more frequently consumed red meat in this
analysis, and there was a clear positive association between household
monthly expenditures and sugary drink intake. The findings are consistent with
a qualitative rural-to-urban migrant study in Southern Africa in which its
population associated meat with high SES and therefore desired to consume
it frequently (Puoane et al., 2006). Furthermore, a cross-sectional study
among 205 randomly selected households in Nairobi’s low-income areas
explored determinants of ASF intake (Cornelsen et al., 2016). Slum dwellers
in Nairobi perceived high prices to be the main barrier for red meat intake.
Food expenditure elasticity (with respect to total food expenditure) was
highest for beef, meaning preference towards meat and meat products if the
food budget were to increase. The study did however assume equal intra-
household allocation (Cornelsen et al., 2016). Whether demand for red meat
was driven by the women, or by other household members deserves scrutiny.
Another interesting observation was the lack of association between fruit
intake and different economic factors among migrant women (e.g. household
wealth, and expenditures). A previous African study also observed that
women belonging to the higher economic groups reported higher fruit intakes
(Landais et al., 2015). It was not clear however whether the respondents lived
in slums. A potential explanation for the findings could be that fruit may not be
perceived as high value foods, and migrant women choose other (food)
products instead when they have more money to spend. To reiterate points
made in Chapter 4, nationally representative household expenditure surveys
(from the 1990s) have shown there to be a stronger socio-economic gradient
for vegetables than for fruits. This suggests that with rising prosperity more
will be spent on vegetables than on fruits as these are the basis for staple food
and main meals (Kimani-Murage et al., 2014; Ruel et al., 2005).
113
Self-employed rural-to-urban migrant women did report a higher fruit intake in
comparison with women working at home and salaried women. A potential
explanation for this could be that women ate their own food wares. This
behaviour has been observed among low-income women in multiple LMICs
(not including African countries) (Floro and Bali Swain, 2013). In Nairobi, the
leading IGA for women in slum areas is selling fruit and vegetables (Owuor et
al., 2017). Furthermore, single fruit items may be perceived as affordable and
a convenient snack. A previous study in Nairobi’s settlements examined that
46% of 1,775 households were involved in food retail including fruit and
vegetable sellers (Gulyani and Talukdar, 2010).
Though statistically weak, the migrant women’s level of education attainment
was associated with vegetable intake. Education may also be a proxy for
income, with those educated beyond primary having more disposable income
(Abuya et al., 2012). Migrant women who arrive in urban slums may not find
a job which reflects their education level.
Red meat was the only food group which was associated with any of the
included social environment characteristics. Meat is seen as a luxury good
and therefore its intake is culturally desired (Cornelsen et al., 2016; Renzaho,
2004). Attending these visits may increase meat intake through social support
and aspiration mechanisms (Powell et al., 2015). Furthermore, the study by
Cornelsen et al. (2016) showed taste to be one of the most important reasons
for slum dwellers to consume red meat. Hence, with social and economic
means migrant women may eat red meat more frequently due to its
palatability.
Another noteworthy finding were the differences between ethnic groups for
food intake. Ethnic groups have different traditional food customs with different
food preferences (Landais et al., 2015). For example, Luhya rural-to-urban
migrant women were less likely to consume red meat on a daily basis in
comparison to other ethnic groups. The Luhyas migrate mainly from Western
Kenya which is close to Lake Victoria. Hence, fish may be a staple food within
their diet (Hansen et al., 2011). It can be expected that they try to keep
consuming fish post-migration. Qualitative studies with African immigrant
women who migrated to HIC emphasised the importance of culture to their
traditional food habits (Regev-Tobias et al., 2012; Renzaho and Burns, 2006).
Differences between Luo and Kamba/Kikuyu migrant women were observed.
Kamba and Kikuyu migrant women have their origins in Central and Eastern
Kenya, provinces which are relatively close to Nairobi. To the best of my
knowledge there are no studies which explicitly look at the differences
114
between ethnic groups for food in intake. Again, these differences in food
intake may be driven by socio-economic and/or spatial differences (Mberu et
al., 2014).
Previous literature showed that urban centres in SSA and Mexico share
characteristics of food swamps. In addition to healthy options, many unhealthy
options are present due to the informal nature of the food environment in which
limited regulation takes place (Ahmed et al., 2015; Bridle-Fitzpatrick, 2015;
Dake et al., 2016; Owuor et al., 2017). Indeed, descriptive analysis showed
that most rural-to-urban migrant women (between 60 and 70%) reported
themselves to be within 5 minutes walking time to restaurants and street food
outlets. Reported travel times to the nearest market was weakly associated
with vegetable intake. Another Nairobi slum study suggested that urban slum
dwellers diverted to other food sources when the “main market” was perceived
to be farther away (van 't Riet et al., 2003). This is an interesting finding when
considering that in the rural area women may have had to walk for at least an
hour to get to the market (Herforth and Ahmed, 2015). With migration women
may value convenience more highly, especially in the context of poor
infrastructure and having other food sources close to their homes (Dake et al.,
2016). The magnitude and direction of associations between reported walking
times to the nearest market and fruit intake suggest this may be an important
influence even though the survey evidence showed no statistical significance.
In addition to socio-economic characteristics, the perception of proximity of
food sources may have explanatory power on food intake varieties among
rural-to-urban migrant women. Furthermore, the lack of safety of the route to
food sources may discourage migrant women to travel to the market on foot.
Residents of slums, in particular women, face violence. Physical barriers such
as the absence of street lightning may also prohibit women to travel far during
specific hours during the day (Corburn and Hildebrand, 2015).
Finally, the analysis revealed that very few women were aware of nutrition and
dietary promotion through the media. Weak associations between awareness
of nutrition and dietary promotion through media and fruit and vegetable
intakes were observed. Women who reported greater intakes may also have
been more likely to recall these promotions as fruit and vegetables were
already an important part of their diet. Surprisingly, migrant women who had
been exposed to nutrition and diet promotion were more likely to consume
sugary drinks. There seems to be more going on than mere awareness.
Perhaps more telling is that nearly three quarter of respondents had not heard,
read or seen anything on nutrition and dietary promotion. SSA literature
115
stressed the association between urbanisation and marketing and/or
advertising of high-energy, processed food and beverages. However, the
frequency of exposure may be different in urban slum neighbourhoods as
formal food companies may not reach migrant women with their advertisement
(Haggblade et al., 2016; McHiza et al., 2013; Vorster et al., 2011).
5.5.3 Strengths and limitations of this analysis
A main strength of this analysis was the large sample size which allowed me
to investigate a broad range of factors. This allowed for an inclusive and
comprehensive analysis on the influences of individual, household and
environment characteristics on weight status and food intake.
I interpreted the results bearing in mind several limitations. As was the case
for the KDHS analysis, there is the strong possibility of residual confounding
which cannot be eliminated due to the study’s cross-sectional nature (Porta,
2016). A further limitation to this analysis was the classification of rural-to-
urban migration. This only identified women as being born in rural areas which
may have over included women as migrants. A great deal of information on
the effect of migration is lost as this classification does not include the age at
which migration took place, their former migratory patterns, and where they
lived prior moving to Nairobi. The migration classification may not be entirely
accurate. Rural-to-urban migrant women who spent their childhood in the
urban food environment may have different perception, knowledge, and
attitudes towards the urban diet and food products compared to women who
migrated at a different life-course stage (Devine, 2005; Spallek et al., 2011).
In addition, the food intake groups did not contain detail on the different types
of meat, fruits and vegetables. This makes interpretation of the extent of
nutrition transition challenging, as there was no specific information available
about ultra-processed food, different types of ASF, traditional vegetables and
other rural foods. Further, while information was found on the type of edible
oil used for cooking, it was not possible to test this in the quantitative analysis.
Regarding street food intake, no measurable food categories existed for
energy-dense starchy street foods, which are deemed as important in context
of nutrition transition and the development of obesity (Steyn et al., 2014; Walls
et al., 2018).

116
Finally, the interpretation of these findings should be positioned in context of
the post-election period in 2008 which was marked by political unrest, hunger
strikes of 2007-2008 which increased food prices and inflation, and a
prolonged spell of drought which Kenya experienced during that period
(Kimani-Murage et al., 2014; Mutisya et al., 2016).
5.6 Next steps and implications for the qualitative data
collection
Notwithstanding the mentioned limitations, these data allowed me to obtain a
better understanding of individual, household and environment characteristics
that place rural-to-urban migrant women at risk of having obesity. The results
suggest rural-to-urban migrant women’s diets and obesity risk to be similar to
those of urban born women. Economic characteristics were clearly associated
with obesity risk and food intake in this analysis. Household wealth, daily
television watching, and type of IGA may also be proxies of a more sedentary
lifestyle in combination with higher intake of obesogenic food. Noteworthy are
the ethnic differences for obesity risk and levels of food intake. Results also
imply rural-to-urban migrant women’s perception of walking time to the
nearest market to be associated with different levels of vegetable intake. And
finally, positive associations between awareness of nutrition and dietary
promotion through media and fruit and vegetable intakes were observed.
The results of this analysis had implications for the primary qualitative data
collection. The analysis informed the interview guide prior to and during the
early stages of data collection, and affected participant sampling. Important
migratory, socio-economic, and demographic characteristics of rural-to-urban
migrant women at risk of having obesity and more likely to consume red meat
and sugary drinks more frequently informed the sampling strategy.
117
Chapter 6 Qualitative research methods
6.1 Chapter introduction
With Chapter 6 and Chapter 7 I present the qualitative phase of this thesis. In
Chapter 6 I outline the qualitative research methods chosen. I then present
the findings and discussion of the qualitative data synthesis in Chapter 7.
The aim was to explore the environmental context in which nutrition transition
among rural-to-urban migrants occurs, and to examine the rural-to-urban
migrant women’s experiences and perceptions of their current food
environment and changes in diet. In doing so, I sought links with the APHRC
analysis results, and I further explored concepts which could not be tested in
the quantitative studies were further explored. There is relatively little attention
paid in the literature to understanding interactions between the individual’s
characteristics, environments and dietary behaviour (Pitt et al., 2017). A
greater emphasis on how individual and environmental factors interact in the
food environment field was given to develop a stronger understanding of how
environments can limit nutrition transition.
While my main was to explore nutrition transition this is not always
straightforward. Little evidence is collected from urban slum settings. The key
interests I had prior to the start of data collection were changes in food
intake/preparation, changes in eating/meal patterns, and eating occasions
(eating at home, or outside of home) in regard to obesogenic and traditional
food intake.
6.2 Study sample and setting
I selected participants for all qualitative research activities through purposive
sampling (Creswell, 2013). I viewed purposive sampling as appropriate for
selecting participants who were at risk of obesity and obesogenic food intake,
and who would supply rich information (Patton, 2014; Robinson, 2014). For
the FGDs, I used a maximum variation sampling technique to capture a range
of perspectives related to changes in diet and food environment. Each
participant represented a pre-specified combination of variables based on
demographics (Sandelowski, 1995). Here researchers control the number of
sampling units required to achieve informational redundancy or theoretical
saturation by deciding which category of variation to maximise and minimise.
For the subsequent research activities I purposefully selected participants
118
based on socio-economic and demographic criteria which were identified in
the quantitative study to be associated with obesity and high levels of food
intake, and on the content provided in the FGDs. Data collection was
conducted until I considered there to be enough data collected which would
adequately address the set research objectives (Baker and Edwards, 2012;
Guest et al., 2006).
The study sample included key informants and rural-to-urban migrant women
living within Nairobi’s slums. The main inclusion criteria were being female,
aged 18-49 at the time of the interview, rural-to-urban migrant women who
had resided at least three months in the slum, and having lived in a rural area
before migration to Nairobi. The study participants migrated from all seven
provinces, with the exception of Nairobi itself. I looked at migration from all
provinces to allow for further exploration of how the migrants’ origin may
influence current dietary behaviour in the slums.
6.3 Method selection
I chose to employ the qualitative interviewing methods FGDs, IDIs, and the
PR method PHV in order to accord with the research objectives and to obtain
a rich dataset. I describe this in more depth below. I chose to employ multiple
methods as it adds to the quality and credibility of the data on determinants of
nutrition transition among rural-to-urban migrant women (Mays and Pope,
2000; Patton, 2014).
FGD had the objective of exploring the social, cultural and physical
environmental context in which nutrition transition occurred among rural-to-
urban migrant women. In this study, I conducted FGDs to explore the key
differences in dietary behaviour before and after migration, while trying to
capture social and cultural environments in which nutrition transition takes
place (Morgan and Kreuger, 1993). This may have proved more difficult when
solely interviewing individuals (Ritchie et al., 2013). Further, FGDs invite a
dynamic of attitiudes and opinions in the context of the interaction that occurs
between participants, and may encourage a greater degree of spontaneity in
the expression of views (Morgan and Kreuger, 1993).
The second qualitative interviewing method that I employed were IDIs. I
selected this method as it may generate more detailed information than most
other qualitative methods (Creswell, 2013). I therefore primarily used IDIs to
better understand the perceptions and experiences of rural-urban migrant
women on their current food environment, their changes in diet, and links to
119
body image and weight gain. The moderator directed the questions towards
obesogenic dietary behaviour during the interview. The secondary data
analysis and arising themes from the FGDs would inform the participant
selection criteria for the IDIs. The IDIs also lend themselves to potentially
divergent cases based upon the NUHDSS results and discourses of the
FGDs. These are also referred to as negative cases in the literature (Emmel,
2013; Patton, 2014). Exploration of divergent cases that may contradict the
reported key influences on adoption of obesogenic dietary behaviour among
rural-to-urban migrant women improve the credibility and validity of qualitative
research claims (Patton, 2002).
I used PR methods such as problem trees and food environment mapping to
enrich and facilitate the interviewing methods. PR includes a combination of
approaches, tools, attitudes, and behaviours that allowed participants to take
an active role in the production of knowledge (Skovdal and Cornish, 2015).
PR methods find their origin in rural development (Chambers, 1994), however
are increasingly being used in urban settings in relation to diet and health
lifestyles (Elsey et al., 2016a). PR methods generally assist the participant in
talking more openly about the topic of interest. Furthermore, visualisation
reveals much that would otherwise be hidden by verbal communication alone
(Chambers, 1994).
PHV is a community-based PR method which enables the participants to
identify, represent, and enhance their community and life circumstances
through photography (Skovdal and Cornish, 2015; Wang and Burris, 1997).
Whereas the problem trees and food environment drawing were integrated
into the interviewing techniques, PHV were conducted as separate sessions
with new participants. Visual methods are a well-established qualitative
research approach to data collection, especially for providing insights on
environmental and contextual factors (Keller et al., 2008). This PR method
has also been increasingly utilised to explore African immigrants’ dietary
behaviour in HIC settings (Turk et al., 2015), and has already been applied in
urban slum settings for in-depth knowledge gathering and programme
evaluation (Elsey et al., 2016a). PHV provides more in-depth data and has the
potential for yeilding additional information which may not emerge during
conventional interviewing methods between participant and investigator
(Cornwall and Jewkes, 1995). Further, since the majority of the participants
were expected to be semiliterate at best, PHV could be a particularly
appropriate method for this research (Cooper and Yarbrough, 2010; Wang
and Burris, 1997).
120
6.4 Enhancing quality of qualitative findings
I selected several techniques to enhance the quality and credibility of the
qualitative data collection and analysis. These include reflexivity, member
checking (also known as respondent validation) clear description of data
collection and analysis, and paying attention to divergent (or negative) cases
(Mays and Pope, 2000; Patton, 2014). In addition, I used the consolidated
criteria for reporting qualitative research (COREQ) to ensure quality to report
the important aspects of qualitative research reporting (Tong et al., 2007).
6.4.1 Reflexivity
The relationship between the primary researcher, research team and the
participants in terms of personal views, assumptions and experiences may
have an impact on data collection (Mays and Pope, 2000). Therefore,
throughout the preparation and implementation of the qualitative fieldwork, I
practised reflexive thinking. Reflexivity is to reflect about how biases, values,
and personal background, such as gender, history, culture, and SES, shape
the interpretations formed during research (Patton, 2014).
I planned to do this by leaving an audit trail, doing member checking, analysing
and reporting of divergent cases. I kept a journal documenting experiences,
viewpoints and interpretations based on my personal experience with the aim
to encourage my reflexive thinking and reflect on my position during this
research study.
Furthermore, I was aware that my gender, social and cultural background may
influence the interview and analysis processes. I therefore recruited Kenyan
female research assistants to conduct the interviews. The research assistants
both had extensive experience with research and/or community work in this
context. We formed two research teams which both consisted of four persons.
The research team active in Korogocho and Viwandani was composed of
independent researchers who were, excluding myself, active in APHRC’s
research projects in the past. The second research team active in Kibera
consisted of staff of the non-governmental organisation (NGO) Carolina for
Kibera (CFK)1 staff (plus myself). Where APHRC’s main focus lies on
conducting research, CFK is an NGO which runs health programmes and
community-based facilities. CFK and partners with the United States Centres
1 CFK is an international non-governmental organization (NGO) based in the Kibera slum of Nairobi (https://www.carolinaforkibera.org/)
121
for Disease Control and Prevention (CDC) also run the Tabitha Health Clinic.
This is a community-based medical clinic where they provide services such
as HIV/AIDS testing and counselling, cervical cancer screening,
immunisations, and family planning counselling (Carolina for Kibera, 2019).
The head research assistant of the APHRC affiliated team also took a
prominent role in the data collection activities in Kibera due to prior experience
with qualitative research. Aside from the head research assistant at CFK, the
research team members in Kibera were not experienced in qualitative
interviewing. They did have experience in conducting health and nutrition
surveys and were knowledgeable on community-based nutrition and health.
All research assistants had obtained a diploma, BSc degree or higher in
nutrition, social or a relevant discipline.
Both research teams received training prior to the data collection. During this
training, the research assistants were informed about the study’s objectives
and short practical exercises were given to introduce the PR methods. The
research assistants affiliated with APHRC already had prior experience with
implementation of FGDs, IDIs and PhotoVoice. The essence of the training
was to inform them on the research objectives, to cover the interview guides
and to practice the participatory methods. The interview guides were reviewed
with the head research assistants of both respective teams prior to the data
collection activities with the aim to prevent sensitive or upsetting discussions
for the participants. I acted as an observer during the majority of the interviews
and discussions as she followed the note taking of the research assistant to
ask questions post interview. I interrupted the conversation at times to direct
the interview, however, this was uncommon. I preferred a fluent
conversation/discussion. The interview guides were used by the research
assistants to ensure that important sub-topics were explored. While the
interview guides changed over time, the key topics were maintained to ensure
consistency in topics across participants.
Throughout the data collection, regular meetings with the research teams
were held to discuss the key findings from the interviews. I took an iterative
approach and subsequently adapted interview guides to further explore
emergent main themes while maintaining the overall structure of the interview
guide to allow for case comparisons (Patton, 2014). Each research activity
comprised a minimum of three investigators, including myself. The head
research assistants carried out the questioning and guided the majority of the
FGD and PhotoVoice sessions. Meetings were held regularly between the PI
122
and research teams to evaluate and further discuss findings to justify the
decision-making process between data collection activities.
Qualitative research presupposes power dynamics. This is often encouraged
through hierarchical and heterogeneous composition of research groups, and
disproportionate power dynamics between the researcher and research
participants. These may affect the way in which knowledge is generated. In
addition to obtaining richer data, PR activities would also redress the power
balance. PR aims to actively address many of these dynamics by encouraging
the research participants to collect their own data and highlight potential
issues within the research topic. Using interactive techniques, PR places the
focus on maximising participation and encourages the participants to express
their voice within the research context (Baum et al., 2006; Gallacher and
Gallagher, 2008). PR methods can help to redress some of the skewed power
dynamics that occur when outside researchers interact with participants.
In addition to the research team, the relationships of the community health
volunteers (CHV) and workers (CHW) who recruited the participants in the
slums may have influenced selection of the participants with the consequence
that participants were knowledgeable on health and diet-related behaviours.
To address this, we would further prompt on the sources of their believes,
awareness and knowledge on health and nutrition topics.
6.4.2 Divergent case sampling and analysis
Closely related to the testing of alternative constructs is the search for
negative or divergent cases. As mentioned above, divergent cases were
considered in both the participant recruitment process and data analysis. This
is consistent with the notion that our understanding of identified patterns is
increased by considering the cases that do not conform to this pattern. These
may be exceptions that prove, broaden, change or cast doubt on the “rule”
altogether (Patton, 2014). I applied this during the recruitment process of IDI
and PHV after there was already an initial understanding established of the
variation between rural-to-urban migrant women in the FGD (Emmel, 2013).
6.4.3 Member checking
During the individual interviews the moderator performed member checking.
The interview guides included several questions to establish respondent
validation. The head research assistant would provide a detailed summary
123
after each section as to confirm that the participant’s answers were correctly
interpreted. Additionally, the interview ended with an open question about
what the participant felt was the most important part of the conversation. We
applied member checking during the FGD and PHV to seek confirmation or
rejection of the attendees on the statements of one of the participants. With
this, the validity procedure shifts from the researchers to participants in the
study and therefore enhances credibility to the analysis (Patton, 2014).
6.4.4 Triangulation
I planned several triangulation strategies to enhance credibility of the findings.
First, by selecting both consumers (rural-to-urban migrant women) and key
informants (nutritionists and CHW) I selected multiple data sources.
Furthermore, I planned to use multiple observers and analysts throughout the
data collection which allows for more directly assessing the consistency of the
data obtained and hence enhances credibility of the analysis and encourages
reflective practice. Lastly, I selected different study sites which varied in socio-
economic and demographic characteristics to enhance transferability to other
slum contexts (Patton, 2014).
6.5 Recruitment and data collection
6.5.1 Participant recruitment
The local partners CFK and APHRC facilitated recruitment of the participants.
CFK provided access to the Kibera slum while the Korogocho and Viwandani
slums were being surveyed by the APHRC through the NUHDSS (Beguy
(Beguy et al., 2015). The local partners functioned as ‘gatekeepers’, a term
for people who can authorise and facilitate access to a specific setting and
people since they possess the register required to identify the relevant
research participants (Skovdal and Cornish, 2015). The affiliated CHV and
CHW with whom the interviews were conducted were responsible for the
recruitment of the study sample. The interviews familiarised them with the
research objectives. I did not invite any of the participants in this study for
more than one of the selected qualitative methods. I did this with the aim to
get a wide range of perspectives and to do not overburden the participants.
124
6.5.2 Locations of data collection
I conducted the data collection between November 2017 and May 2018.
Discussions and interviews were either held at an NGO within the premises
of the Korogocho Chief’s Camp, the APHRC site offices near Korogocho and
Viwandani, or the Tabitha Health Clinic in Kibera. All locations were deemed
safe for both the participants and researchers. The Chief’s Camp was built by
an NGO for youth benefit programmes (United Nations Human Settlements
Programme, [no date]). APHRC has two site offices located on the border of
Korogocho (in Kariobangi County) and Viwandani (Lunga Lunga road) from
where their field activities operate. The offices are located in secure buildings
and are well accessible to the participants.
I acquainted myself with the recruiter (CHV/CHW) prior to the interviews to
make participants feel at ease as the recruiter enjoyed a good reputation as a
project worker within the community (Oti et al., 2013). In addition, the research
assistants introduced me to the participants in Kiswahili, and they explained
the purpose of the interview. Beforehand, the research assistants asked
participants whether they felt comfortable with my presence. Being an outsider
could also have had an inhibiting effect. The slums can be tight communities
where people are aware of each other’s actions. Talking to an outsider may
have let them feel more at ease knowing their answers would not be directly
communicated to other slum residents (anecdotal evidence). However, in all
cases, my presence at the interview was not raised as an issue.
6.5.3 Semi-structured interview guides
All interview guides were semi-structured. This allowed for direction of the
interview which increased understanding of the pre-set influencing factors
from the quantitative secondary data analysis and preceding qualitative
activities. In addition, this method allowed for further probing and modification
of interview guides in the course of the study after identification of potential
new insights (Ritchie et al., 2013).
All interview and PHV guides included a section on demographic and socio-
economic characteristics. Questions concerning these characteristics were all
open-ended. This information was collected for several reasons. First, to
check whether participants met the key inclusion and exclusion criteria.
Second, to examine the intersections between different individual
characteristics and whether these pre-dispose migrants to differing dietary
habits. These questions identified the participants’ birthplace and place of
125
residence prior to rural-to-urban migration, their duration of living in the
specific slum and their reason for migrating to Nairobi. Additional information
was noted in the case of circular migration (multiple migrations between rural
and urban areas). I included an additional scale to capture the degree of
dietary change as perceived by the migrant. They were asked how much they
felt their diet had changed after rural-to-urban migration. The participants were
asked to fill in a scale from 0 “No difference” to 10 “Extremely different”. With
these techniques, I made an effort to capture their migratory background at
the start of the interview, and to facilitate interpretation of the migrants’
experiences and perceptions of their diet.
To measure the persons’ socio-economic status, I asked for information on
the migrants’ current income-generating activities, level of obtained education
and their total monthly household expenditure. Their primary type of IGA was
recorded as migrant women in this setting may be involved in multiple income-
generating activities (United Nations Human Settlements Programme,
2016b). I used total monthly household expenditure to categorise the migrants
into the different wealth quintiles. This socio-economic indicator was selected
on advice of the experienced field staff as household income was proven to
be a sensitive matter for participants in the past and did not lead to accurate
estimations.
6.5.4 Ethical considerations
6.5.4.1 Informed consent process and withdrawal
The research assistants informed the participants that approval by the local
authorities would not mandate any participation in this research. Participation
was on a voluntary and consensual basis. The option to participate in the study
was introduced to all potential participants including a thorough description of
the consent form prior to the start of the interviews. The research staff asked
the participants if they agreed to consent to audio-recording and, if not, the
research staff would take detailed field-notes instead. There were no risks
facing the research participants apart from their lost time in participating in the
research activity.
Prior to the interview, the participant was assured by the moderator that she
had the rights to an appropriate and proportionate opportunity to give consent
to participate, withdraw from, or refuse to take part in this research project
without inducement or adverse consequence. Participants were also
126
repeatedly reminded by the moderator that the interview was strictly
confidential. As part of the introduction, the moderator communicated and
explained the topic of the research to the study participants. Prior to the
interview it was emphasised that this interview was solely conducted to better
understand the migrants’ experiences and perceptions. Additional information
on the rationale and outcomes of the study was always provided when the
participant showed interest in knowing more. The CHV/CHW did communicate
prior to recruitment that the interview would not directly lead to subsequent
interventions or programmes.
The used interview tools were translated to Kiswahili as most of the
participants did not feel comfortable expressing themselves in English. The
research assistants all spoke Kiswahili and were therefore able to explain the
research study content and consent from the participants. Participants from
all ethnic groups were able to communicate in Kiswahili. All migrant women
provided written consent with a signature. To compensate the participants for
their time, each participant was given a sum of 300 shillings (approximately 3
U.S. dollars). Women who participated in the FGD and PHV were also
provided with snacks (fruit), and a loaf of bread and packaged milk after each
session to take home with them. These incentives aligned with APHRC’s
research protocol (anecdotal evidence).
The informed consent form can be found in Appendix C.1.
6.5.5 Key-informant interviews
I initially planned to only interview community healthy workers to obtain their
perspective on how migrant populations operate within the community, their
perspectives on the most influential factors stimulating obesogenic dietary
behaviour, and which interventions were currently in place to address
unhealthy diets and obesity. The CHV/CHW were raised within the respective
communities and at the time of data collection were also residents. The
CHV/CHW themselves proved to be well-informed on the activities of rural-to-
urban migrant women within the respective communities. I recruited
community and clinical nutritionists afterwards to obtain a more detailed
picture of the nutrition and dietary changes among migrant women. The
nutritionists provided more detail on the obesity risk of rural-to-urban migrants
and associated dietary behaviour they adopted post-migration. They were in
a position to provide more information of the current health and diet promotion
127
interventions and suggest potential solutions to prevent obesogenic dietary
behaviour.
The KIs perspective on the perception and experiences of migrants towards
their dietary behaviour was used as a frame of reference when analysing the
migrants’ interviews and discussions. In total, six KIIs were held with two in
each slum. The data collection was initiated with KIIs in Korogocho and
Viwandani.
The KII guide can be found in Appendix A.2.
6.5.6 Focus-group discussions
The KIIs were followed by FGDs. The FGDs included participants who
represented a diversity in terms of their socio-economic and demographics.
The sampling strategy for the FGDs was to obtain a wide variety of socio-
economic and demographic characteristics which were explored in the
NUHDSS analysis. I selected participants with the purpose to have diversity
in education, ethnicity, total monthly expenditure, current IGA, rural
background (farming, province of origin) and household composition. There
are alternative perspectives reported about the impact of heterogenity and
homogenity groups on the interviewing process (Kitzinger, 1995). While
homogenous groups may foster the expression of views better than groups
composed of dissimilar socio economic and cultural context (Kitzinger, 1994).
I decided to recruit more heterogeonous groups to facilitate a wider range of
perspectives to follow up on in the IDIs. A potential limitation of this approach
could be that the lack of friends in the group may inhibit openness in the
discussion on sensitive diet and nutrition issues. On the other hand,
confidentiality issues in groups may also undermine individual freedom of
opinion (Kitzinger, 1995). The role of the moderator was therefore important
in managing the group discussion and to highlight the emerging perspectives
of all participating women (Sim, 1998). To realise this, the moderators created
a safe space for the participants to talk and share their experiences. Prior to
the discussion she introduced herself, myself and the other research to the
participants. At the start we emphasised that everybody was free to speak and
there would be no judgements on their opinions.
Each FGD included eight women who represented a varied sample of socio-
economic and demographic characteristics. We held two FGDs in each slum,
with the exception of Kibera where we held three FGDs due to recruitment
problems in the second FGD. The main difference between the first and
128
second FGD in each slum was the participants’ duration of residence in each
slum. I included this characteristic in the sampling to further investigate the
duration of exposure to the urban slum environment on dietary change and its
underlying determinants. The higher number of FGDs in Kibera was chosen
due to a miscommunication between the recruiter and the research team for
the first FGD. This activity had a sample including several Nairobi-born
participants who had their homes near the Tabitha health clinic (insert
description). I included the data for analysis as the mixture of both rural-to-
urban migrant and urban non-migrant women led to valuable insights on the
similarities in diet of the two groups.
The FGDs started with a wider exploration of social, cultural and
environmental topics. Please see appendix A.2.2 for the interview guide which
covered the concepts of the conceptual framework. The first section of this
discussion focussed on key dietary changes with migration, and why these
changes occurred. The second section focussed on the environmental context
in which these changes occurred. We closed the discussion with the “problem
tree” activity which summarised and highlighted the key factors depicting
changes in their diet and perceived consequences for their well-being.
One of the participatory methods that I selected to facilitate the focus group
discussion was the “problem tree”. Problem (and solution) trees have been
used extensively in LMICs. They assist in determining the root causes of the
main problem and identify the effects and possible solutions (Snowdon et al.,
2008). They have also been recommended and used to assess diet and
nutrition problems (Callens and Seiffert, 2003). In this study, I used problem
trees to provide the participants with the opportunity to list the determinants
on current and changes in dietary behaviour, and the perceived
consequences of these changes in diet. While the focus of the problem tree
was on generating knowledge regarding their perceptions on determinants of
their current diet, several participants provided possible solutions to these
determinants. This method has proven useful for generating possible solutions
from the community’s perspective (Snowdon et al., 2008). In addition, during
FGDs the participants may at times discuss what they find interesting to
discuss, and not necessarily, what they find important (Morgan, 1995). The
problem tree provided an opportunity to guide the discussion on the
determinants of changes in dietary behaviour they perceived to be important.
Moreover, the perceived consequences of their diet on health were further
explored.
129
6.5.7 Individual interviews
I followed up the FGDs by IDIs in both Korogocho and Viwandani. Twenty-
eight IDIs were held, with ten in both Korogocho and Viwandani, and eight in
Kibera. The sampling and interview guide development of IDIs was partly
informed by the socio-economic and demographic characteristics of rural-to-
urban migrant women prone to have obesity and higher levels of reported food
intake. I made efforts to include mothers from various socio-economic levels
(reported monthly expenditures, type of IGA), household compositions and
differed rural backgrounds in order to capture subgroup differences in dietary
behaviour post-migration. In relation to obesogenic dietary behaviour and
traditional food intake, I deemed it to be particularly important to sample
migrant women with different types of income-generating activity, different
household composition and living close or far away from the market.
After a pair of interviews in Viwandani, it proved challenging to capture the
participants’ perceptions of the food environment, and how these perceptions
influenced their dietary behaviour. Hence, during the succeeding IDIs we
asked the participant to describe their community food environment. This idea
stems from the community mapping method which enables community
members to draw their community and highlight places, boundaries, people,
infrastructure, or resources of importance (Skovdal and Cornish, 2015). The
moderator drew basic images following the respondents descriptions. This
exercise would allow for more probing on the perceptions of the migrant on
their food environment in context of their daily lives. The food environment
was subjectively determined by the participant with no specific geographic
boundaries. This participatory technique was used in the second section of
the interview to both encourage participants to open up and to achieve a better
understanding of their interactions with the food environment. By including a
participatory activity the aim was to encourage active responding. I did not
intend for the drawings to be output for dissemenation but mainly to encourage
discussion and generate knowledge.
The IDIs lasted between 60 and 90 minutes. The first section was a one-on-
one interview with the participants. Afterwards, the head moderator and the
participant drew the participants’ food environment together. The IDI guide
was adapted continuously to further explore key themes in-depth. Questions
which sought explanations for the quanitative findings were also included. We
placed special attention on whether they could recall when and how dietary
changes occurred.
The IDI guide used for the initial interviews can be found in Appendix A.2.3.
130
6.5.8 PhotoVoice
I concluded the data collection with three PHV sessions, one in each slum
neighbourhood. I derived the prompts from FGD and IDI transcript analysis.
The prompts were as follows: (1) take a picture of something or somebody
that/who encourages you not to cook at home; (2) take a picture of something
or somebody that/who does not encourage you to eat traditional vegetables
and rural foods; (3) take a picture of something or somebody that/who does
not encourage you to eat at the roadside; (4) take a picture of something or
somebody that/who does not encourage you to go to the market; and (5) take
a picture of what you see as an ideal body image.
During each PHV session participants were asked to present their pictures.
This was followed by further probing by the moderator and ultimately
channelled back to the rest of the group. An adapted version of the SHOWED
method was utilised to further probe on the presented stories of the
participants. The SHOWED method represents a line of questioning2 which
may encourage the participants to reflect on the meaning of the photographs
and suggest recommendations for actions. Wang and Burris (1997) suggested
this line of questioning as it may encourage participants to reflect on the
meaning of photographs and suggest recommendations for action. Finally, the
questions were adjusted to the context and answers of the participant.
The first FGD, and first pair of IDIs served as pilot activities in the field. These
were majorly successful and were therefore included in the data analysis. The
PHV guide was pilot tested in Leeds, United Kingdom. I tested this guide at
the refugee centre Positive Action for Refugees and Asylum Seekers
(PAFRAS) in Leeds, United Kingdom. I interviewed an African refugee from
Zimbabwe. The photographs he made represented current dietary patterns in
Leeds and former dietary patterns in Zimbabwe. No pictures were taken of
environmental barriers and promoters. The results showed that the provided
prompts were challenging to interpret. I therefore adapted the prompts to
make these easier for the participants to interpret. The SHOWED method was
only loosely followed and the questioning relied on a wider set of probing
questions to investigate in-depth the meaning behind the photographs (Wang
and Burris, 1997). The PhotoVoice guide can be found in Appendix A.2.4.
2 The SHOWED methods consists of the following questions: “What do you See here?”; “What is really Happening?”; “How does this relate to Our lives?”; “Why does this situation exist?”; and “What can we Do about it?” (Wang and Burris, 1997)
131
The Korogocho and Viwandani sessions included six rural-to-urban migrant
women. The Kibera PHV included five women as one participant dropped out
due to personal circumstances. I made the decision to include six rural-to-
urban migrant women in order to allow for all desired selection criteria to be
selected, but to prevent from having too many pictures to discuss. My intent
was to recruit variation among rural-to-urban migrant women for the duration
of residence, type of IGA, household composition and economic status
(household monthly expenditure). We sampled participants from multiple slum
villages. Due to safety issues, time and budget constraints we made the
decision to do one-week sessions. The research team anticipated this time
duration to be appropriate to capture the women’s weekly habits. All sessions
included weekend days as eating and shopping routines may differ throughout
the week. A duration of a week’s time would allow participants to take pictures
in differing weather conditions during the rainy season. Differing weather
conditions could affect the participants’ perceptions on barriers and facilitators
of dietary behaviour. While it is argued that a longer period including multiple
meetings is ideal for greater reflection and empowerment of the participants,
it has been suggested that there is no single ideal duration. In addition, it is
recommended that researchers ask the participants prior to the discussion
how much time they can contribute (Skovdal and Cornish, 2015).
On the first day of PHV, we introduced the participants to the study objectives
and we held a discussion to encourage women to reflect on their dietary
behaviour and food environment. Afterwards they received instructions on the
operation of the digital camera and, depending on the participants’ availability,
were given a total of 3 or 4 days to take photographs based on five different
prompts. The photography task was not prescriptive. Rather, participants were
encouraged to freely interpret barriers and promotors of their dietary
behaviour, and how these could be best captured in photographs to best
portray these. In order to capture their daily life, they then took the camera for
one or 2 days in addition. Out of precaution, each evening the cameras were
given to the CHW who were well-respected in the community. Everybody
came together after one or two days for the second meeting to check whether
the participants understood the prompts.
After 3 days, including a weekend day, the research team and participants
gathered to browse and select the pictures for printing. Portable printers were
used at the meeting point. Participants selected one picture per prompt. When
the participant had a hard time deciding which influence was more important,
two were selected.
132
During this meeting the cameras were collected, and the research team
printed all photographs under approval of the participants. All pictures and
their meanings were placed on white charts for in-depth discussion with the
research team and other participants. The fourth and final meeting was set for
discussion among all participants. The PHV activities lasted from three to five
hours. Due to the long duration, we incorporated several breaks in which the
participants received refreshments.
6.6 Analytical process
6.6.1 Data management
I sent audio files to experienced translators/transcribers who had been
employed by APHRC on numerous occasions. The files were translated
verbatim from Kiswahili to English. Research funds did not allow for back
translations. The head research assistants did however check the first
transcripts on their compliance with the audio files. In addition, the transcripts
were checked to see whether they matched the notes taken during the
interviews.
I anonymised transcripts with a unique identifier and I stored these safely on
the secure University of Leeds m:drive and OneDrive directly after each data
collection activity to avoid the use of an encrypted external disk. I deleted the
audio files from the digital recorder directly after storing the data. The
University of Leeds OneDrive is a cloud system which has the required levels
of encryption and protection. Any data on the personal laptop was wiped
directly using appropriate data destruction software.
At first, I read and coded each transcript in Word. Afterwards, I imported all
transcripts (n=38), field notes, and PhotoVoice pictures into the qualitative
data analysis software NVivo version 12 in order to make the analysis more
systematic (Ritchie et al., 2013).
133
6.6.2 Thematic analysis with framework approach
I chose to conduct a thematic analysis with a framework approach. This has
similarities to the standard thematic analysis method, especially in terms of
identifying recurring and significant themes. Using the framework technique
stresses transparency of data analysis by managing a systematic and
transparent audit trail which adds to the rigour and validity of the findings
(Ritchie et al., 2013; Smith and Firth, 2011).
I derived a set of influencing factors on dietary behaviour and nutrition in
different contexts from a scoping review of theoretical and empirical literature
and my secondary data analysis of the NUHDSS datasets. However, I
anticipated that new influences on dietary behaviour would become known
during the data collection. I therefore chose this approach as it allowed the
integration of several factors in a structured manner which provide a clear
overview of the large volume of influencing factors which represent the
complexity of nutrition transition and obesity. It is an analytical technique
known for its flexibility as it can be used with multiple qualitative approaches
that aim to generate and structure themes and adaptation of both an inductive
and deductive type of qualitative analysis (Gale et al., 2013). The analysis
underwent seven stages following the conventional framework analysis
approach.
The first three stages consisted of the transcription, familiarisation and coding
of the transcripts. I repeated these three stages during the data collection to
subsequently inform new IDIs and PHV sessions. I generated key themes
during the interpretation of the transcripts and analytical notes. I also recorded
thoughts and impressions in NVivo to support new sequences of data
collection. Concurrently, I coded the transcripts which included a mixture of
both inductive and deductive processes. The deductive coding followed a
socio-ecological perspective of diet and nutrition by distributing the factors to
the different levels of influence while allowing new themes which were not pre-
set by the framework to be embedded. Subcategories under the themes were
created which were particularly relevant to nutrition transition while situating
this in a migratory context by cross-referencing between rural and urban
areas. I then coded the majority of lines in the transcripts to ensure important
aspects of the data were not missed. Subsequently, I developed a working
analytical framework.
In stage four, I distributed several transcripts that represented a varied sample
and different research methods to the Kenyan head research assistants, and
a colleague of the Nuffield centre for International Health and Development at
134
the University of Leeds. We compared the key themes derived from our
analyses to reflect on the framework and to add credibility to the analysis. In
stage five, I applied the analytical framework to the remainder of the
transcripts by indexing subsequent transcripts using the existing categories
and codes.
In the sixth stage I charted the key themes in the framework per individual
case and discussion. This charting process included references to interesting
quotations and appropriate pictures of the PHV which represented the key
findings. This stage allowed summarisation of the data per case in order to
identify differences for experiences and perspectives between cases of
different socio-economic and demographic groups. I used the participants’
photographs to complement the thematic analysis of the interview data. The
analysis focused only on the dialogue associated with these photographs. The
selected photographs represented the influences of importance to the
participant (Skovdal and Cornish, 2015).
During the seventh and final stage I interpreted the data in line with the
framework in order to address the research objectives and provide follow-up
explanations of the quantitative results. The characteristics of, and differences
between, the data were identified which led to the generation of more context
appropriate themes and explanations.
Throughout this process, I did not rely on the frequency of reference to
determine the importance of themes. While it has been argued that counting
does have a place in qualitative research, particularly with determining
typologies (Silverman, 2006). This may be misleading as each element may
not necessarily have the same value or weight (Sim, 1998).
135
6.7 Reflection on techniques to maintain quality and rigour
6.7.1 Reflexivity
As planned, I kept a record of reflection on the qualitative findings. I also used
memos in the analytical software NVivo version 12 to record my thoughts and
perceptions on the findings. Even though an audit trail allows transparency in
the decision-making process guiding the research, it does not necessarily
ensure quality and soundness of the primary investigator’s decisions (Patton,
1999).
Throughout the data collection I included other researchers in the production
of knowledge and interpretation of the qualitative findings to facilitate my
reflexive thinking. I held several meetings with the research teams after the
initial FGDs and IDIs. In these meetings we discussed the emergent themes
and dietary patterns of the participants.
Furthermore, many participants seemed to possess some knowledge on
nutrition and healthy diets through the CHWs/CHVs. Further probing on where
on the origins of their knowledge revealed this. This was taken into
consideration during the interpretation of the findings.
This allowed me to check whether my interpretations of the interviews and
discussions were robust. Furthermore, we reviewed the first IDIs and explored
the possibility of using the food environment mapping technique.
6.7.2 Divergent case analysis
Divergent cases in my research represented rural-to-urban migrant women
with socio-economic and demographic characteristics whom I expected to not,
or less frequently, engage in certain behaviours typical of nutrition transition,
such as cooking at home, or visiting the wholesale market frequently. During
data analysis I recorded memos to assist me in recognising divergent cases
early in the study.
Lastly, I included multiple analysists to analyse a set of transcripts and
compare their findings with mine to measure interrater reliability including an
analyst from the Nuffield Centre who is not directly associated with my project
in order to add credibility to the analysis (Patton, 2014). However, I completed
the majority of the coding which limits the assessment of inter-coder reliability.
136
6.8 Reflection on framework
During the analytical process (stage four and five), I found overlap between
the different environmental influences. I therefore chose to cluster social and
cultural influences in the socio-cultural environment, inspired by the analysis
grid for environments linked to obesity (ANGELO) framework (Swinburn et al.,
1999). The basic framework is a 2 by 4 grid that dissects the environment into
environmental size and types. The environmental components are the
physical (what is available), economic (what are the costs), political (what are
the “rules”), and sociocultural (what are the attitudes and beliefs) types. These
types can be split into micro- and macro-sizes. I also took inspiration from the
Environmental Research framework for weight Gain prevention (EnRG
framework) for the write-up of the findings. Within this grid, the factors which
influence food intake and physical activity are characterised as obesogenic
(Kremers et al., 2006).
The framework which initially guided my study does consider changes in
psychosocial factors and the influence of the individual and households’ socio-
economic and demographic characteristics on nutrition transition. The EnRG
framework (which incorporates the ANGELO framework) incorporates
environment-individual interactions. It also highlights the influence of
demographic moderators (and other factors such as personality, awareness,
involvement, habit strength and clustering) and cognitive mediators
(constructs derived from the Theory of Planned Behaviour) of energy-balance
related behaviours (Kremers et al., 2006). The framework posits that
environmental factors may have a direct impact on obesogenic behaviours,
but these environmental influences are also likely to be mediated and
moderated by individual level factors (Kremers et al., 2006).
At a later stage of my research I identified a model developed by Kockturk-
Runefors (1991) in the international immigration literature. This is presented
in Figure 6.1 (Dekker et al., 2011). Kockturk-Runefors (1991) developed a
dietary model to enhance our understanding of food combination patterns in
different cultures and the process of adaptation to new dietary patterns and is
applied to a European context (Holmboe-Ottesen and Wandel, 2012; Osei-
Kwasi et al., 2017). This model categorises food into staple, complementary
and accessory foods along an axis where identity and taste form the two
extreme poles. The model postulates that dietary changes after migration start
with accessory foods (edible oil, spices, herbs and spices) and are followed
up by the introduction of new complimentary foods and ultimately staple foods
from the local food culture. The model also predicts that migrants will continue
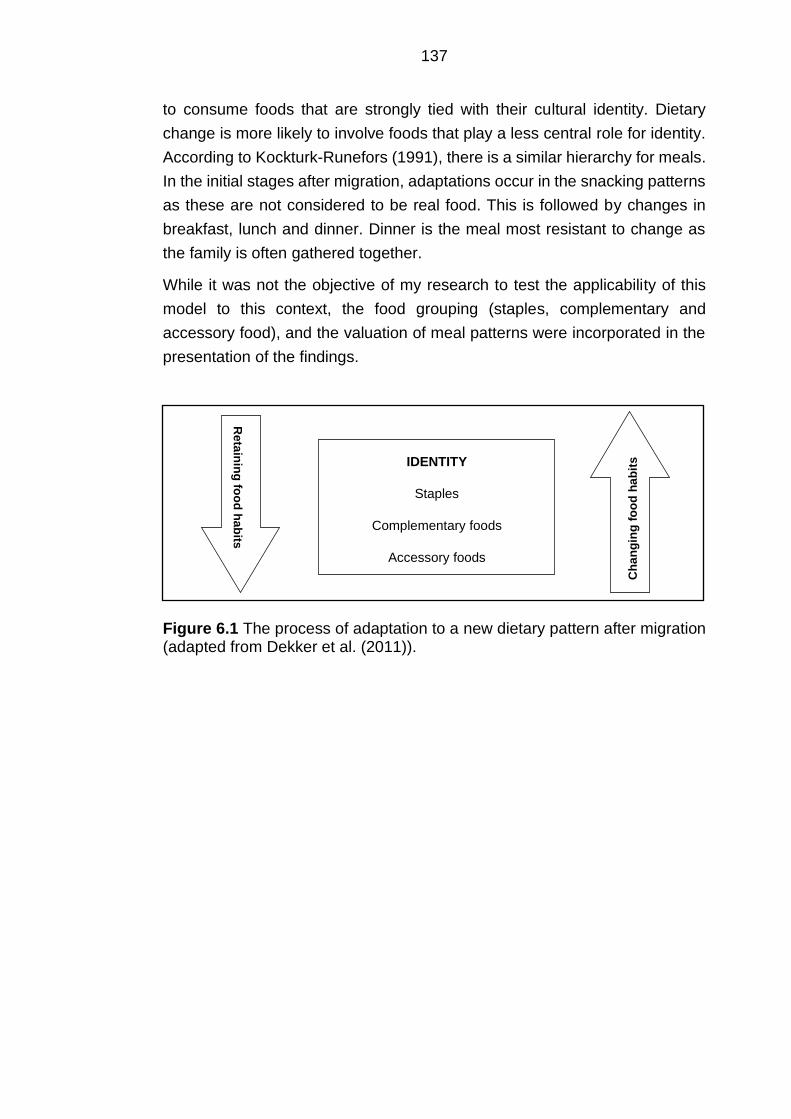
137
to consume foods that are strongly tied with their cultural identity. Dietary
change is more likely to involve foods that play a less central role for identity.
According to Kockturk-Runefors (1991), there is a similar hierarchy for meals.
In the initial stages after migration, adaptations occur in the snacking patterns
as these are not considered to be real food. This is followed by changes in
breakfast, lunch and dinner. Dinner is the meal most resistant to change as
the family is often gathered together.
While it was not the objective of my research to test the applicability of this
model to this context, the food grouping (staples, complementary and
accessory food), and the valuation of meal patterns were incorporated in the
presentation of the findings.
Figure 6.1 The process of adaptation to a new dietary pattern after migration (adapted from Dekker et al. (2011)).
IDENTITY
Staples
Complementary foods
Accessory foods R
eta
inin
g fo
od
ha
bits
Ch
an
gin
g f
oo
d h
ab
its
138
Chapter 7 Qualitative findings and discussion
7.1 Presentation of the findings
In this chapter I outline the findings and discussion of the qualitative phase of
my research. In the first section I highlight the characteristics of both the key
informants and rural-to-urban migrant women recruited for this study. The
second section starts with an outline of the main changes in dietary behaviour
and perceived rural-urban differences in food environment. After this section,
I present the key themes on changes in food environment, diet and body
image. Although I acknowledge that the identified themes interplay in a
complex manner, I wrote these out separately to facilitate the presentation of
the findings. Participants discussed individual level changes in diet, body
image perception, attitudes and believes, as well as environmental level
changes (e.g. economic, physical, socio-cultural and other) that occurred after
migration. I highlighted the influence of the environmental conditions on
individual food preferences, attitudes and perceptions within the respective
environment sections. Most themes refer to the microenvironment, as this was
consistent with what the participants shared.
The presented findings apply to most of the rural-to-urban migrant women. I
mentioned divergent cases and potential socio-economic and demographic
moderators where applicable to provide more insight into how the urban slum
environment influenced rural-to-urban migrant women differently. In addition,
I incorporated the key informants’ perceptions and insights on the manner in
which migrant women operated within the slum neighbourhoods, and how this
may have influenced their obesogenic dietary behaviour. I did this to present
context and to convey both diversity and uniformity on perceived influences
on changes in diet. While the presented themes are recurrent in all slums, I
present evident nuances between slums.
I support the findings with verbatim quotations. With the selection of the
quotations I built on experiences and views of experienced and qualified
qualitative researchers (Corden and Sainsbury, 2006). The main role of the
quotations are to facilitate presentation of the findings through illustration and
amplification of the identified key themes. Several quotations represent group
discussions to showcase the diversity of experiences, perceptions and
attitudes, and contrasting views among participants. In addition, I included
passages from the PhotoVoice sessions to enable voice to the participants
when they expressed key drivers of dietary behaviour and to facilitate their
illustration of an ideal body image. Another role of the quotations were to
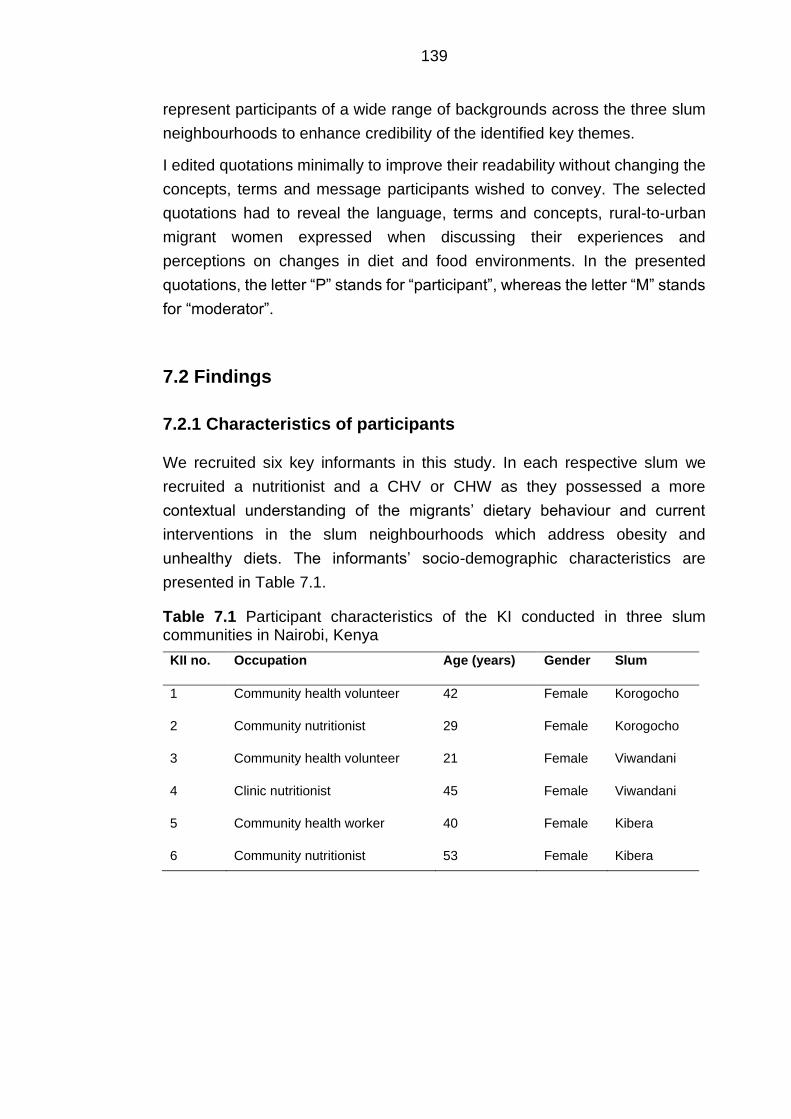
139
represent participants of a wide range of backgrounds across the three slum
neighbourhoods to enhance credibility of the identified key themes.
I edited quotations minimally to improve their readability without changing the
concepts, terms and message participants wished to convey. The selected
quotations had to reveal the language, terms and concepts, rural-to-urban
migrant women expressed when discussing their experiences and
perceptions on changes in diet and food environments. In the presented
quotations, the letter “P” stands for “participant”, whereas the letter “M” stands
for “moderator”.
7.2 Findings
7.2.1 Characteristics of participants
We recruited six key informants in this study. In each respective slum we
recruited a nutritionist and a CHV or CHW as they possessed a more
contextual understanding of the migrants’ dietary behaviour and current
interventions in the slum neighbourhoods which address obesity and
unhealthy diets. The informants’ socio-demographic characteristics are
presented in Table 7.1.
Table 7.1 Participant characteristics of the KI conducted in three slum communities in Nairobi, Kenya
KII no. Occupation Age (years) Gender Slum
1 Community health volunteer 42 Female Korogocho
2 Community nutritionist 29 Female Korogocho
3 Community health volunteer 21 Female Viwandani
4 Clinic nutritionist 45 Female Viwandani
5 Community health worker 40 Female Kibera
6 Community nutritionist 53 Female Kibera
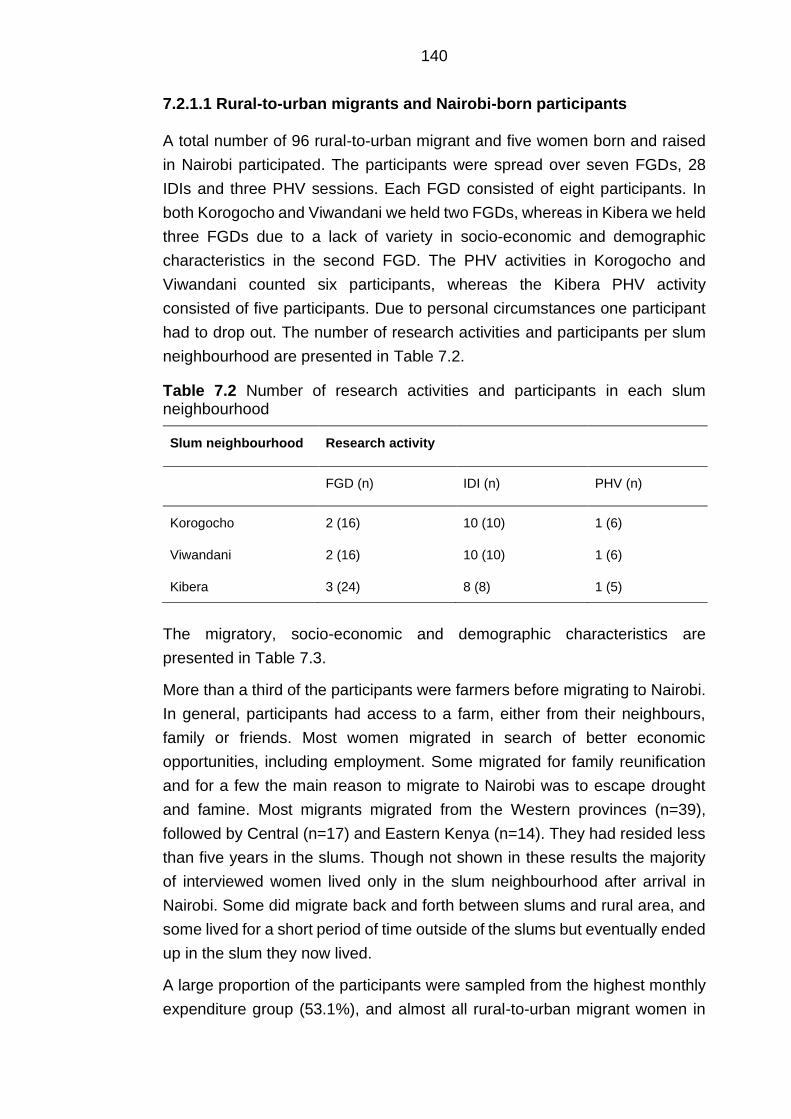
140
7.2.1.1 Rural-to-urban migrants and Nairobi-born participants
A total number of 96 rural-to-urban migrant and five women born and raised
in Nairobi participated. The participants were spread over seven FGDs, 28
IDIs and three PHV sessions. Each FGD consisted of eight participants. In
both Korogocho and Viwandani we held two FGDs, whereas in Kibera we held
three FGDs due to a lack of variety in socio-economic and demographic
characteristics in the second FGD. The PHV activities in Korogocho and
Viwandani counted six participants, whereas the Kibera PHV activity
consisted of five participants. Due to personal circumstances one participant
had to drop out. The number of research activities and participants per slum
neighbourhood are presented in Table 7.2.
Table 7.2 Number of research activities and participants in each slum neighbourhood
Slum neighbourhood Research activity
FGD (n) IDI (n) PHV (n)
Korogocho 2 (16) 10 (10) 1 (6)
Viwandani 2 (16) 10 (10) 1 (6)
Kibera 3 (24) 8 (8) 1 (5)
The migratory, socio-economic and demographic characteristics are
presented in Table 7.3.
More than a third of the participants were farmers before migrating to Nairobi.
In general, participants had access to a farm, either from their neighbours,
family or friends. Most women migrated in search of better economic
opportunities, including employment. Some migrated for family reunification
and for a few the main reason to migrate to Nairobi was to escape drought
and famine. Most migrants migrated from the Western provinces (n=39),
followed by Central (n=17) and Eastern Kenya (n=14). They had resided less
than five years in the slums. Though not shown in these results the majority
of interviewed women lived only in the slum neighbourhood after arrival in
Nairobi. Some did migrate back and forth between slums and rural area, and
some lived for a short period of time outside of the slums but eventually ended
up in the slum they now lived.
A large proportion of the participants were sampled from the highest monthly
expenditure group (53.1%), and almost all rural-to-urban migrant women in
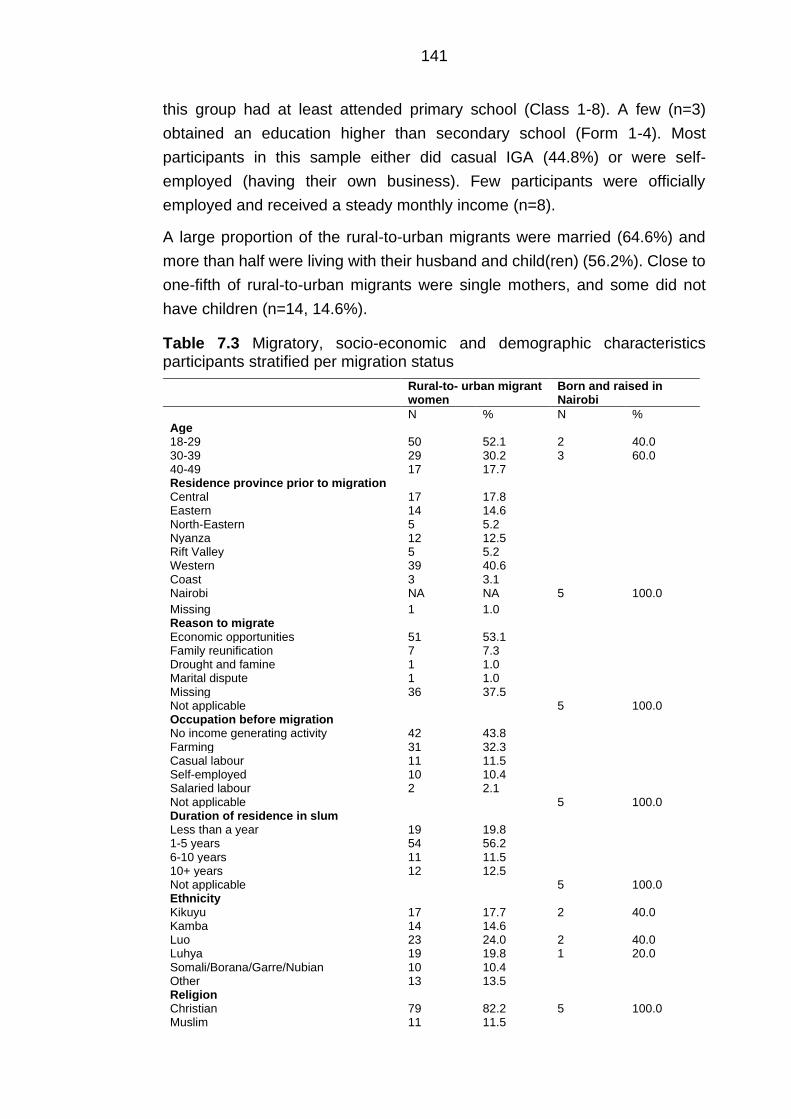
141
this group had at least attended primary school (Class 1-8). A few (n=3)
obtained an education higher than secondary school (Form 1-4). Most
participants in this sample either did casual IGA (44.8%) or were self-
employed (having their own business). Few participants were officially
employed and received a steady monthly income (n=8).
A large proportion of the rural-to-urban migrants were married (64.6%) and
more than half were living with their husband and child(ren) (56.2%). Close to
one-fifth of rural-to-urban migrants were single mothers, and some did not
have children (n=14, 14.6%).
Table 7.3 Migratory, socio-economic and demographic characteristics participants stratified per migration status
Rural-to- urban migrant women
Born and raised in Nairobi
N % N % Age 18-29 50 52.1 2 40.0 30-39 29 30.2 3 60.0 40-49 17 17.7 Residence province prior to migration Central 17 17.8 Eastern 14 14.6 North-Eastern 5 5.2 Nyanza 12 12.5 Rift Valley 5 5.2 Western 39 40.6 Coast 3 3.1 Nairobi NA NA 5 100.0
Missing 1 1.0 Reason to migrate Economic opportunities 51 53.1 Family reunification 7 7.3 Drought and famine 1 1.0 Marital dispute 1 1.0 Missing 36 37.5 Not applicable 5 100.0 Occupation before migration No income generating activity 42 43.8 Farming 31 32.3 Casual labour 11 11.5 Self-employed 10 10.4 Salaried labour 2 2.1 Not applicable 5 100.0 Duration of residence in slum Less than a year 19 19.8 1-5 years 54 56.2 6-10 years 11 11.5 10+ years 12 12.5 Not applicable 5 100.0 Ethnicity Kikuyu 17 17.7 2 40.0 Kamba 14 14.6 Luo 23 24.0 2 40.0 Luhya 19 19.8 1 20.0 Somali/Borana/Garre/Nubian 10 10.4 Other 13 13.5 Religion Christian 79 82.2 5 100.0 Muslim 11 11.5
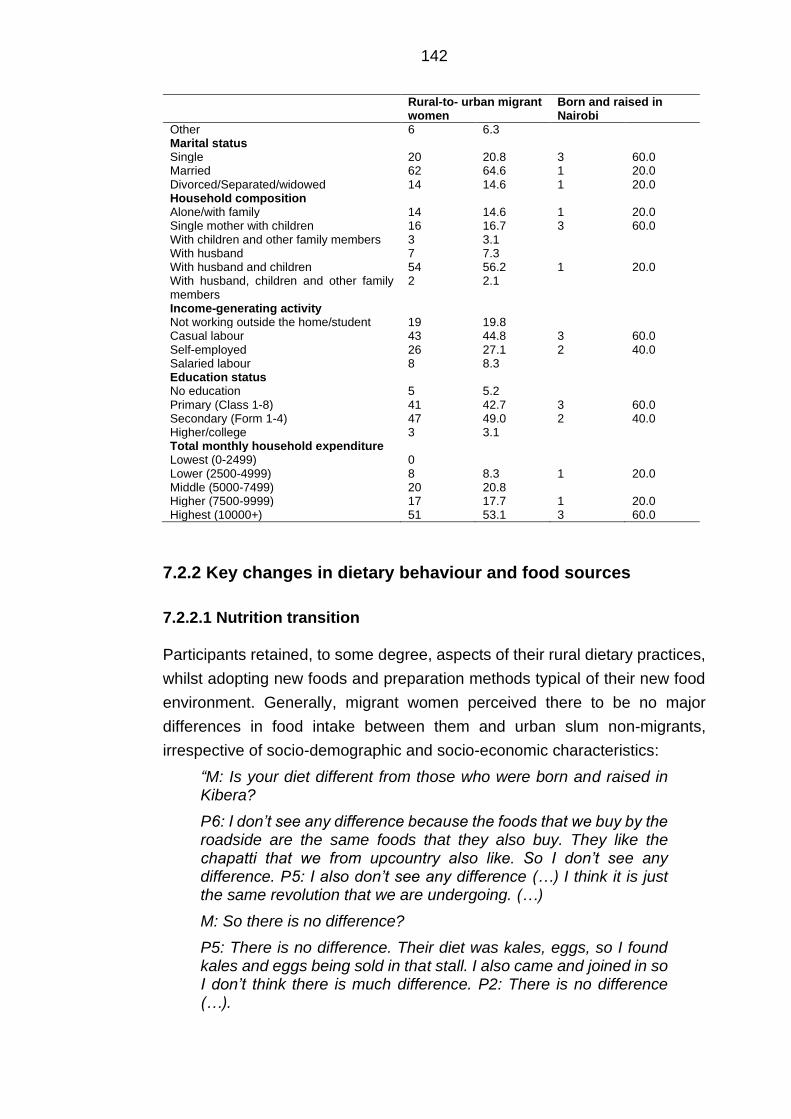
142
Rural-to- urban migrant women
Born and raised in Nairobi
Other 6 6.3 Marital status Single 20 20.8 3 60.0 Married 62 64.6 1 20.0 Divorced/Separated/widowed 14 14.6 1 20.0 Household composition Alone/with family 14 14.6 1 20.0 Single mother with children 16 16.7 3 60.0 With children and other family members 3 3.1 With husband 7 7.3 With husband and children 54 56.2 1 20.0 With husband, children and other family members
2 2.1
Income-generating activity Not working outside the home/student 19 19.8 Casual labour 43 44.8 3 60.0 Self-employed 26 27.1 2 40.0 Salaried labour 8 8.3 Education status No education 5 5.2 Primary (Class 1-8) 41 42.7 3 60.0 Secondary (Form 1-4) 47 49.0 2 40.0 Higher/college 3 3.1 Total monthly household expenditure Lowest (0-2499) 0 Lower (2500-4999) 8 8.3 1 20.0 Middle (5000-7499) 20 20.8 Higher (7500-9999) 17 17.7 1 20.0 Highest (10000+) 51 53.1 3 60.0
7.2.2 Key changes in dietary behaviour and food sources
7.2.2.1 Nutrition transition
Participants retained, to some degree, aspects of their rural dietary practices,
whilst adopting new foods and preparation methods typical of their new food
environment. Generally, migrant women perceived there to be no major
differences in food intake between them and urban slum non-migrants,
irrespective of socio-demographic and socio-economic characteristics:
“M: Is your diet different from those who were born and raised in Kibera?
P6: I don’t see any difference because the foods that we buy by the roadside are the same foods that they also buy. They like the chapatti that we from upcountry also like. So I don’t see any difference. P5: I also don’t see any difference (…) I think it is just the same revolution that we are undergoing. (…)
M: So there is no difference?
P5: There is no difference. Their diet was kales, eggs, so I found kales and eggs being sold in that stall. I also came and joined in so I don’t think there is much difference. P2: There is no difference (…).
143
Now if I compare this to upcountry, you would only hear of chapatti maybe on Saturday or Sunday that is when you would get it but here it’s like a daily meal. Now because you arrived from upcountry you need to adjust to this environment of taking every day chapatti. P4: I also think that we are just eating the same as we found them eating and we copied that.”
(Kibera FGD 03, P2: age 23, 10-months residence; P4: age 42, 1-year residence; P5: age 32, 7-months residence; P6:age 33, 7-months residence)
Pre-prepared obesogenic food intake
Overall, the rural-to-urban migrant women in this study ate novel energy-
dense starch foods such as chips [fries], bhajia [deep fried potatoes slices
mixed with other accessory foods including onions and other spices] and
mandazi [deep-fried African doughnut]: acquired from vendors at the street or
cooked at home. Adoption of these foods was paired with increased edible oil
intake as many of the pre-prepared street foods were deep-fried:
“When she cooks her ‘bhajia’, she normally boils her potatoes, peels them and then dips them in the oil.”
(Kibera PHV, age 24, 1-year residence)
Street foods considered in these findings refer to (deep) fried food. Street
foods are a broader category which may also include food such as githeri
(maize and beans) which are at times boiled instead of fried according to the
participants’ accounts. Key informants confirmed the adoption of novel deep-
fried starchy food:
“M: The people who were born and raised in Viwandani and those who have moved to Viwandani, is there a difference in how they eat or it is the same?
P: Those who have been born in Viwandani are the ones who eat badly because the ones who come here they just adapt. They eat the bad things chips, bhajia, soda, cake, mabuyu (baobab seeds cooked in sugar syrup), the sweet things.”
(Viwandani KII 02, community nutritionist)
From boiling to frying food
Greater intake of edible vegetable cooking oils was preferred at home. When
the participants cooked at home, they often fried their food, whereas in the
rural area they were boiling their food:
144
“Here in Nairobi, most people must fry the ‘mrenda’ [traditional vegetable] as in the rural area, traditional vegetables such as ‘sagaa’ and ‘sukaa’ are rarely fried. Unless life has changed these days, but when I lived in the rural area, I used to see my grandmother cook the vegetables with just some salt and we eat. (…) In the rural area, and in the past, people only boiled cassava but here in Nairobi you will find someone frying cassava. Today you will even find someone fry sweet potatoes and arrow roots and these Irish potatoes.”
(Kibera FGD 01, age 32, 12-years residence)
In addition, another habit mentioned by some participants was the adding of
edible oil to pre-prepared food at home.
Changing between different staple foods
The main dishes used starchy staple food, and often this was one of the only
foods cooked. Diversity in their diets was often a switch between staple foods.
For most, ugali [cornmeal porridge] or githeri [boiled or fried mixture of maize
and beans], were the main staples, as these were also consumed in their rural
homes. This did depend on the region they migrated from. Other traditional
staples such as milled flour, arrowroot and sweet potatoes declined post-
migration. New staple foods such as rice, chapatti [flatbread], and mukomi
[mash of green peas or beans, potatoes, maize, and pumpkin leaves or
spinach] were incorporated into their diet after migration. Another key
difference mentioned by the rural-to-urban migrant women were the changes
from posho mill derived maize flour to refined packaged maize flour.
Introduction of new complementary foods and accessory foods
Migrant women encountered different types of ASF, fruits and vegetables.
Again, this depended on the migrants’ demographics prior to migration. Luo
and Luhya participants who originated from the coastal and lake areas had a
more frequent intake of complementary foods such as fish. For the majority,
ASF such as red meat, chicken and fish were not part of their dietary habits in
the rural area. Generally, rural-to-urban migrant women said that their intake
of traditional vegetables and fruits and starchy staples declined post-migration
and would instead be replaced by other products.
145
Rural-to-urban migrant women moved towards the cheaper and widely
available “urban vegetables” cabbages and kales as a replacement for
traditional vegetables:
“So, when I came here from the rural area, I started taking kales on daily basis. From the beginning of the week I bought kales, Tuesday I bought kales, Thursday I bought kales up to Saturday. So, I wonder, will I only be eating kales? Are there no other vegetables?”
(Korogocho IDI 05, age 30, 5-years residence)
Generally, when the term “traditional” was introduced to the conversation
migrant women associated this with foods and beverages that they grew up
with in the rural area. Interestingly, both the participants and key informants
linked the term “traditional” to vegetables.
Some rural-to-urban migrant women even mentioned there to be limited
changes in terms of the type of foods they ate. Often, it was solely the
preparation of rural foods which had changed. As noted previously, rural
staple foods and vegetables were (deep) fried instead of boiled which was
perceived to be one of the key changes.
Urbanisation of meal patterns
Migrant women also ate more often away from their homes. This went
alongside changes in meal patterns as rural-to-urban migrants either skipped
meals or went for pre-prepared street foods. In the rural area women already
had a daily three meal pattern breakfast, lunch, and supper. However, for
some they already skipped breakfast and lunch in the rural area due to farming
activities. In the urban area, the importance of cooking lunch also diminished.
Breakfast and dinner were seen as must have meals. Breakfast and lunch
however often consisted of (ultra-)processed street foods and tea. Other rural-
urban differences were snacking behaviour and purchasing take-away. Intake
of street and at times fast foods occurred in between meals. Eating became
more individualistic and many mentioned to have switched from preparing
meals for a couple of days to having one-day meals soon after migration.
Timing of changes in diet
Generally, migrant women changed their cooking methods and adopted pre-
prepared street food within the first couple of months after arrival due to both
socio-economic and physical environmental constraints.
146
The participant narratives highlighted nuances in the timing of changes
depending on the type of food which was discussed. Several migrant women
were suspicious of specific foods and only started consuming these a couple
of months after arrival. For example, migrant women were reluctant in
consuming “urban vegetables” such as kales and cabbage or other rural food
which was sold in the urban area due to due to differing aesthetics or poor
hygiene.
7.2.2.2 Key changes in food sources
Generally, the main source of food acquirement in the rural area was their
shamba [farm]. They only went to the town market once in a while as it was
far in distance. In the urban slum, their main food sources were street food
vendors, smaller food vendors, kiosks, either butchers or hotels [small
neighbourhood restaurants] or the main markets where cheap (traditional) fruit
and vegetables and pulses or roots were sold. The main markets in this study
are also referred to as wholesale and wet markets in the literature (Owuor et
al. 2017). A couple said to purchase food from food hawkers who would deliver
a wide range of packaged and/or pre-cult food to their doorstep. Vegetables
and fruits at the kiosks which were nearby were perceived to be more
expensive and sold in smaller portions.
Some participants from Kibera and Viwandani mentioned they shopped at a
supermarket. The presence of supermarkets adjacent to the slum
neighbourhoods was confirmed by one of the key informants:
“There are supermarkets within the locality, nowadays the supermarkets are everywhere. For example, Naivas [Kenyan supermarket chain] is here, there is Tuskys [Kenyan supermarket chain] so they are not far from the supermarkets.”
(Viwandani KII 01, community health volunteer)
However, most participants either did not mention acquiring food at
supermarkets or were not frequently shopping there due to distance or the
inability to purchase food products in bulk. When migrant women mentioned
supermarkets, these were smaller versions which supplied energy-dense food
products such as crisps, cakes, and mandazi [deep-fried African doughnut].
The self-employed participants sold a wide range of different products. Some
of them sold food, including street foods such as mandazi and chapatti. One
participant explained that she started selling mandazi as she realised that this
is what people in her neighbourhood desired.
147
7.2.3 Changes in community food environment
7.2.3.1 Availability and accessibility
Participants highlighted the changes from a farming and borrowing food
environment to a cash-based food environment to be the most influential on
their changes in dietary behaviour. Changes in availability and accessibility
were perceived by the participants to be highly influential on their food intake
and eating occasions. Accessibility in this context includes both physical
(distance) and economic dimensions (food price). Food prices and
perceptions of affordability became key drivers of food choice post-migration.
In contrast with the rural area, where women had to travel far distances, in the
urban slum there was always the possibility of purchasing food within their
community food environment as food sellers were within view of their homes:
“M: You have said that in upcountry [common term for rural area] the shops were a bit far but here, how have the surroundings affected changes in your diet?
P: Here they are close, and they are many. You get somebody, like a neighbour who keeps chickens, so they lay eggs, you hear that she is selling, and she sells at a cheaper price. You will find that one egg she is selling to you is seven or eight bob [slang word for Kenyan Shillings] (…) So you see, you don’t go anywhere. Food is brought to your door. Plus, even if you lack there, you just get out to the road shop and ask: “Are there eggs here?” Then you will get. Also, butcheries are all over.”
(Kibera IDI 03, age 21, 1-year residence)
Participants mentioned street foods to be in abundance, close to their homes,
in their work environment, and on their way back from work. Repeated
exposure to pre- prepared street food motivated intake, and for some the mere
presence of this food was enough to wake up desire:
“Most of the time everything is available here and when you see it, then you desire it. For instance, chicken. That craving comes to you the moment you see it but if I haven’t seen it, you will not even think about chicken.”
(Korogocho IDI 10, age 25, 2-years residence)
Rural-to-urban migrant women were exposed to the sight and smell of the
neighbours cooking which led to the participant purchasing these foods, or
stimulated their appetite for sweet things:
148
“The nose is very sensitive. Perhaps you have been eating vegetables and then you smell an aroma coming from the neighbours. Tomorrow you will see her cleaning utensils outside the house. You will ask her: ‘Where do you buy this?’ And she will enlighten you. Thus, you find there is a way she pulls you to her routine because when you smell the aroma it is enticing. Thus, you will have to join that routine to feel the sweetness that they feel.”
(Korogocho FGD 02, participant unknown)
Much of the street food intake took place within the work environment.
Participants who did not have enough time to prepare and cook food at home,
either skipped lunch or resorted to energy-dense street food of which there
was an abundance. Self-employed migrant women who had their own food
selling business ate their own produce, often energy-dense and fatty food
such as mandazi or chapatti:
“Sometimes when you come from the shamba, you don’t start cooking immediately. You have to sweep the house and the cows need to be taken out. At lunch time is when you can make something that you can eat. However, here in Nairobi there is a change because in the morning when I wake up to go and sell ‘mandazi’, I can have a taste of my ‘mandazi’ as I cook if I feel hungry. It is not like in upcountry where I could stay without food until lunch time; that is when I would eat something. So here in Nairobi I feel there is some change.”
(Kibera IDI 05, age 34, 1-year residence)
The high availability and accessibility of street foods also had direct
implications for not cooking at home, particularly for migrant women who were
not providing for a family. One participant mentioned that the intake of street
foods on their way back from work lowered her appetite with the result of not
wishing to cook anymore at home. There were diverse opinions on the ability
of families to acquire pre-prepared food at the roadside as the following
discussion illustrates:
“P2: You start with chips as you go along heading to your house. And, as you go further you get moshogi [chicken head]. By the time you get to the house, you are already full. (…) P1: It is just a few people.
M: It is just a few people doing what?
P1: Someone who has a family cannot manage something like that.
M: Why do you say that?
P1: Will you eat chips and your child is waiting for you in the house? You can’t.
M: So what do the people with families do?
P1: People with families are forced to cook in the house.
149
M: You are forced to cook in the house?
P4: You are forced to cook in the house because other household members are waiting for you. (…)
M: People with families, do they still buy the food that is available on the streets?
P4: They can. Say you wanted to cook rice, you will get it there (…). Sometimes you have to buy what is already cooked along the way.
M: Why should people buy food that is sold along the way? (…)
P7: I see it is a loss for me, sometimes if I have something like 30 shillings, I would rather buy the raw so that I cook and it can be enough for me and children.”
(Viwandani FGD 01, P1: age 27, 5-years residence P2: age 25, 3-years residence; P4: age 49, 10-years residence P7: age 31, 3-months residence)
In general, participants perceived pre-prepared street food to be the cheapest
within their community food environment and hence this was frequently
consumed. While some participants with a family explained they had to cook
for their families, others who lived with a larger family and had little to spend
on a monthly basis said to be particularly dependent on pre- prepared street
food.
Those in the highest monthly expenditure group also consumed obesogenic
street food more frequently or in larger portions. One rural-to-urban participant
elaborated on this. She stated that while she was in a position where these
foods were not a necessity anymore, she ate them as it would save her money
for potential future crises. While a relatively smaller portion of their total
income would be spent on food, street foods would remain a crucial part of
their diet. Street foods were therefore generally appreciated. Migrant women
mentioned that in the rural area, they were only able to acquire food in bulk.
For some of the more affluent participants street foods were also desired for
their convenience.
In comparison to upcountry, (leftover) meat became part of the daily or weekly
diet in the city. ASF were widely available, either at street food vendors or at
the butchery. Particularly red meat and chicken were hard to resist whenever
they would pass by it on the street. ASF being within proximity of their home
seemed to entice them even more:
150
“I consume them because I can see them nearby. You know when you see something then you want to eat it and at times, you have some money on your hand so you will buy and eat. In the village, you would only get it if you go to the shopping centre and maybe it is far. Here it is near you can see them so when you have some money you buy.”
(Korogocho IDI 10, age 25, 2-years residence)
A facilitator for more frequent intake was the option to purchase cheap meat
in the street. The lower quality meat, often added to soup, would better align
with the migrant women’s livelihood. Migrant women in the highest monthly
expenditure group groups mentioned spending more money on the higher
quality versions such as roasted meat and chicken at the butcher within their
community food environment.
Only a few participants mentioned acquiring sugary drinks. Still, these were
perceived to be too expensive by the participating women to consume
frequently:
“P: I buy soda and cake. However, I do not buy on daily basis; I only buy this on Saturdays.
M: So, you only buy on Saturdays?
P: Yes.
M: Ok. So, on these other days, when you come home late, what do you do?
P: Sometimes I am forced to just eat in the house because you cannot keep on buying soda and cake; you also look at the expenditure.”
(Kibera PHV, age 25, 6-years residence)
Even though she was one of the wealthier participants (in terms of monthly
expenditures), soda and cake were still perceived to be luxury foods and could
not be consumed frequently.
Generally, traditional foods were not easily accessible in the urban area. Many
felt they were not able to afford these, or these were too expensive to justify
their purchase, irrespective of the economic resources available to them.
These feelings were emphasised due to their previous experiences in the rural
area. They were able to get water and, in many cases, traditional food freely
in their rural area:
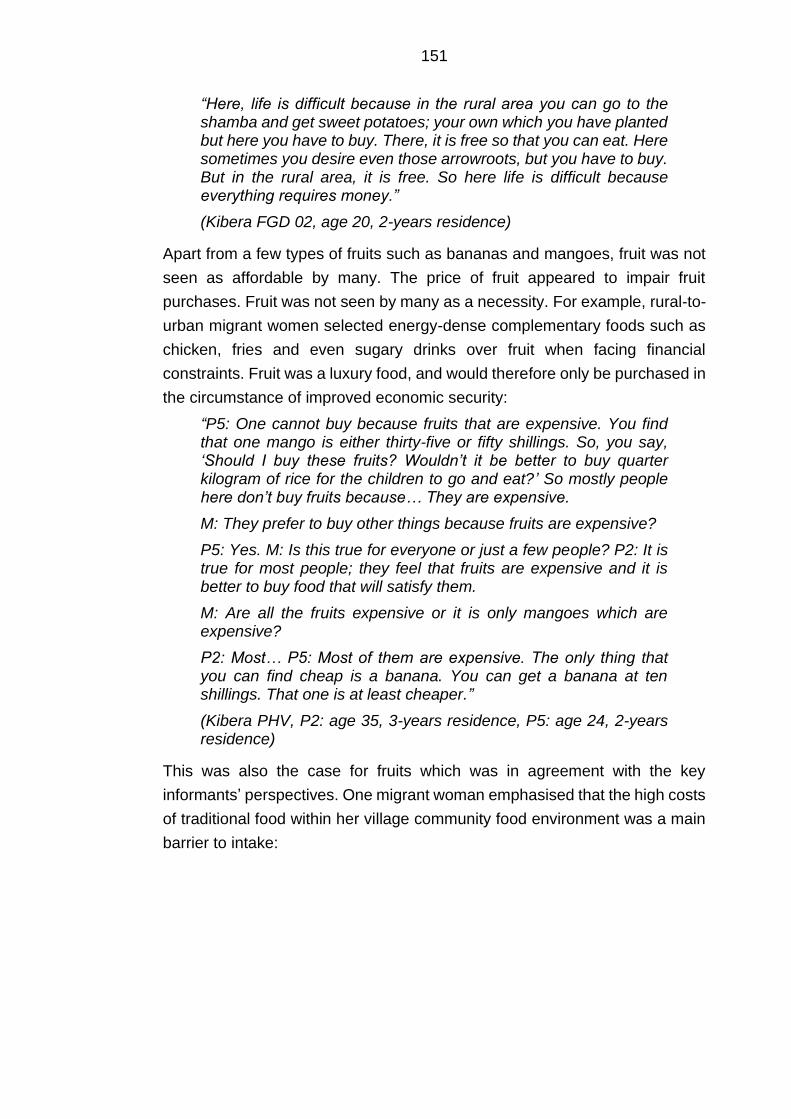
151
“Here, life is difficult because in the rural area you can go to the shamba and get sweet potatoes; your own which you have planted but here you have to buy. There, it is free so that you can eat. Here sometimes you desire even those arrowroots, but you have to buy. But in the rural area, it is free. So here life is difficult because everything requires money.”
(Kibera FGD 02, age 20, 2-years residence)
Apart from a few types of fruits such as bananas and mangoes, fruit was not
seen as affordable by many. The price of fruit appeared to impair fruit
purchases. Fruit was not seen by many as a necessity. For example, rural-to-
urban migrant women selected energy-dense complementary foods such as
chicken, fries and even sugary drinks over fruit when facing financial
constraints. Fruit was a luxury food, and would therefore only be purchased in
the circumstance of improved economic security:
“P5: One cannot buy because fruits that are expensive. You find that one mango is either thirty-five or fifty shillings. So, you say, ‘Should I buy these fruits? Wouldn’t it be better to buy quarter kilogram of rice for the children to go and eat?’ So mostly people here don’t buy fruits because… They are expensive.
M: They prefer to buy other things because fruits are expensive?
P5: Yes. M: Is this true for everyone or just a few people? P2: It is true for most people; they feel that fruits are expensive and it is better to buy food that will satisfy them.
M: Are all the fruits expensive or it is only mangoes which are expensive?
P2: Most… P5: Most of them are expensive. The only thing that you can find cheap is a banana. You can get a banana at ten shillings. That one is at least cheaper.”
(Kibera PHV, P2: age 35, 3-years residence, P5: age 24, 2-years residence)
This was also the case for fruits which was in agreement with the key
informants’ perspectives. One migrant woman emphasised that the high costs
of traditional food within her village community food environment was a main
barrier to intake:
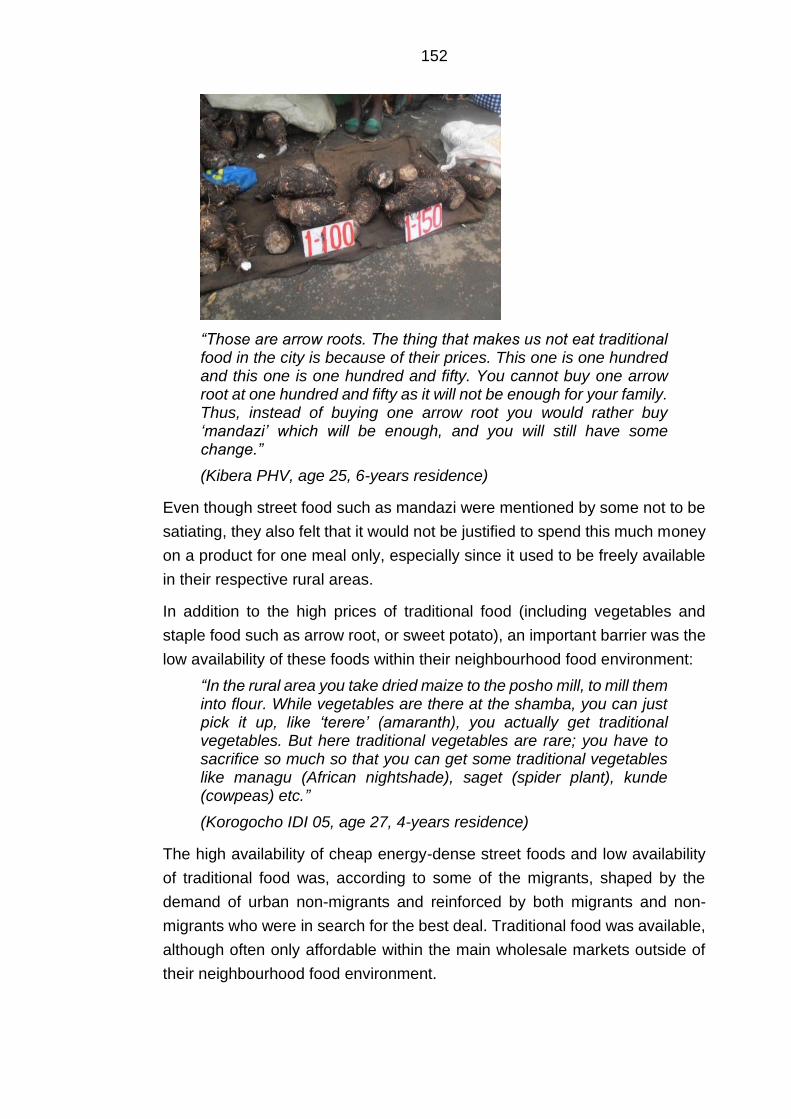
152
“Those are arrow roots. The thing that makes us not eat traditional food in the city is because of their prices. This one is one hundred and this one is one hundred and fifty. You cannot buy one arrow root at one hundred and fifty as it will not be enough for your family. Thus, instead of buying one arrow root you would rather buy ‘mandazi’ which will be enough, and you will still have some change.”
(Kibera PHV, age 25, 6-years residence)
Even though street food such as mandazi were mentioned by some not to be
satiating, they also felt that it would not be justified to spend this much money
on a product for one meal only, especially since it used to be freely available
in their respective rural areas.
In addition to the high prices of traditional food (including vegetables and
staple food such as arrow root, or sweet potato), an important barrier was the
low availability of these foods within their neighbourhood food environment:
“In the rural area you take dried maize to the posho mill, to mill them into flour. While vegetables are there at the shamba, you can just pick it up, like ‘terere’ (amaranth), you actually get traditional vegetables. But here traditional vegetables are rare; you have to sacrifice so much so that you can get some traditional vegetables like managu (African nightshade), saget (spider plant), kunde (cowpeas) etc.”
(Korogocho IDI 05, age 27, 4-years residence)
The high availability of cheap energy-dense street foods and low availability
of traditional food was, according to some of the migrants, shaped by the
demand of urban non-migrants and reinforced by both migrants and non-
migrants who were in search for the best deal. Traditional food was available,
although often only affordable within the main wholesale markets outside of
their neighbourhood food environment.
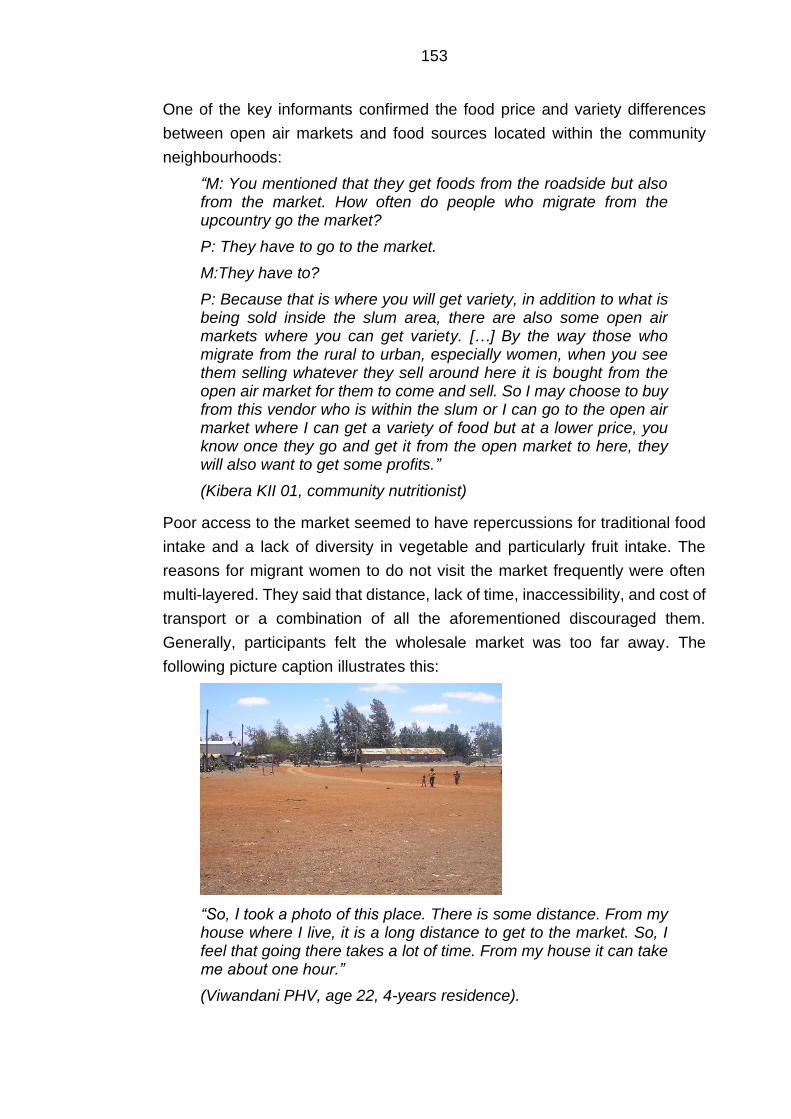
153
One of the key informants confirmed the food price and variety differences
between open air markets and food sources located within the community
neighbourhoods:
“M: You mentioned that they get foods from the roadside but also from the market. How often do people who migrate from the upcountry go the market?
P: They have to go to the market.
M:They have to?
P: Because that is where you will get variety, in addition to what is being sold inside the slum area, there are also some open air markets where you can get variety. […] By the way those who migrate from the rural to urban, especially women, when you see them selling whatever they sell around here it is bought from the open air market for them to come and sell. So I may choose to buy from this vendor who is within the slum or I can go to the open air market where I can get a variety of food but at a lower price, you know once they go and get it from the open market to here, they will also want to get some profits.”
(Kibera KII 01, community nutritionist)
Poor access to the market seemed to have repercussions for traditional food
intake and a lack of diversity in vegetable and particularly fruit intake. The
reasons for migrant women to do not visit the market frequently were often
multi-layered. They said that distance, lack of time, inaccessibility, and cost of
transport or a combination of all the aforementioned discouraged them.
Generally, participants felt the wholesale market was too far away. The
following picture caption illustrates this:
“So, I took a photo of this place. There is some distance. From my house where I live, it is a long distance to get to the market. So, I feel that going there takes a lot of time. From my house it can take me about one hour.”
(Viwandani PHV, age 22, 4-years residence).
154
Inter-individual differences were observed for wholesale market accessibility.
Generally, participants from Korogocho mentioned they went more frequently
to the main market as many of them were within short walking distance.
Participants who lived in Viwandani mentioned the local wet market being too
far away with travel times up 1 hour with public transport which was often
perceived to be unaffordable and/or time-consuming. The interviews showed
that participants who were living closely to the market were also going more
often, regardless of socio-economic and demographics characteristics.
Regular visits allowed them to make small purchases as the participants had
more time to plan and would be able to cope with the lack of refrigeration.
Poor road conditions during the rainy season were a further challenge, even
for those close to markets highlighting the influence of poor infrastructure:
“P3: We do have a market nearby. But at a time like this when it is raining a lot, there is a lot of mud. If you do not have gumboots, [wellington boots] you cannot manage. That is why I buy the things that are nearby. I can buy but if I have the time I normally go to buy there. (…)
M: Number 6, where do you prefer to buy from; the kiosks or the market?
P6: Time is what makes me buy from the kiosks because they are near. A time like now, there is a lot of mud so when you think about going to the market you feel you might even fall down so you prefer to just buy from the kiosks.”
(Kibera PHV, P3: age 30, 3-years residence, P6: age 25, 6-years residence)
In addition to the high prices of raw traditional foods such as tubers and
legumes, these were also perceived to be too expensive to cook. In the rural
area most participants had free access to firewood, however this was not
feasible to use in the urban slum. Participants in Korogocho and Kibera
mentioned that it was affordable, but hard to get. In Viwandani it was widely
available according to one of the PhotoVoice participants. However, cooking
with firewood would cause smoke and hence was not feasible for personal
intake. The participants did seem to prefer using it as it would cook traditional
food such as sweet potato quicker. Street vendors who prepared githeri
(maize and beans mixture) would often use firewood for cooking. Generally,
participants switched to charcoal or kerosene stoves post-migration. Stoves
were however felt to be an ineffective tool to prepare traditional food which
made many resort to pre- prepared street food. Other cooking methods such
as gas or electricity were perceived to be unaffordable or dangerous within
such close spaces. Some did however have a positive attitude towards the
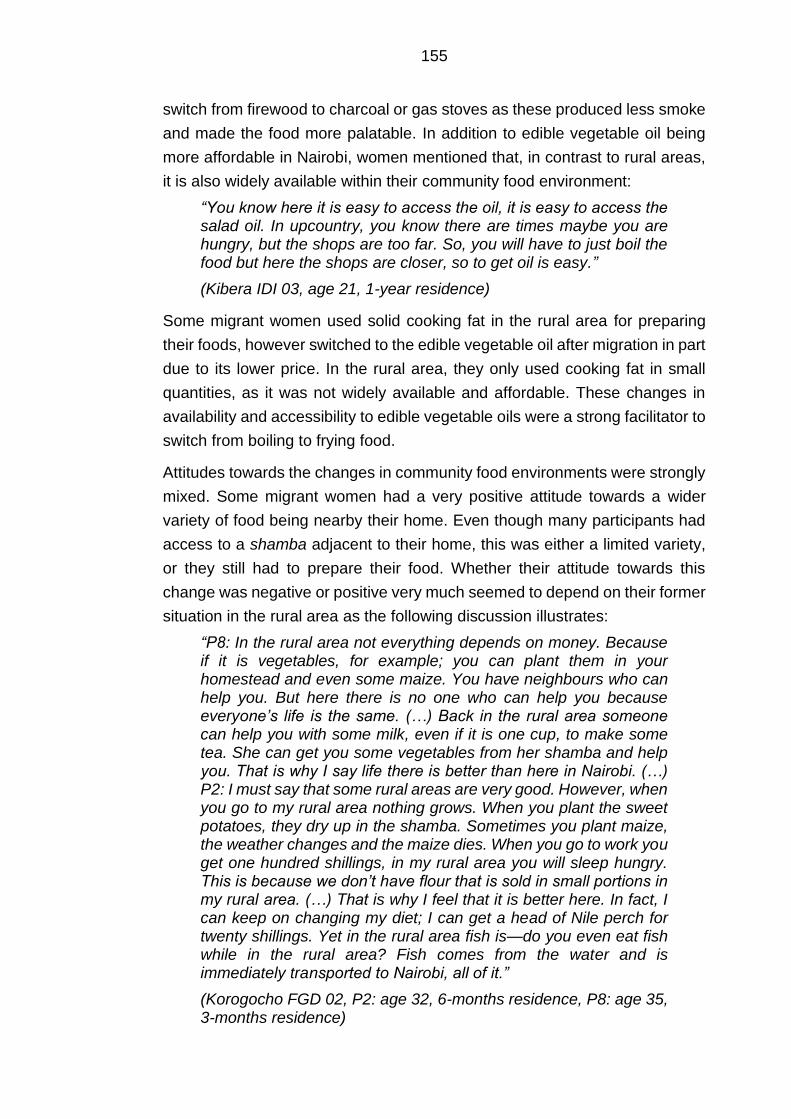
155
switch from firewood to charcoal or gas stoves as these produced less smoke
and made the food more palatable. In addition to edible vegetable oil being
more affordable in Nairobi, women mentioned that, in contrast to rural areas,
it is also widely available within their community food environment:
“You know here it is easy to access the oil, it is easy to access the salad oil. In upcountry, you know there are times maybe you are hungry, but the shops are too far. So, you will have to just boil the food but here the shops are closer, so to get oil is easy.”
(Kibera IDI 03, age 21, 1-year residence)
Some migrant women used solid cooking fat in the rural area for preparing
their foods, however switched to the edible vegetable oil after migration in part
due to its lower price. In the rural area, they only used cooking fat in small
quantities, as it was not widely available and affordable. These changes in
availability and accessibility to edible vegetable oils were a strong facilitator to
switch from boiling to frying food.
Attitudes towards the changes in community food environments were strongly
mixed. Some migrant women had a very positive attitude towards a wider
variety of food being nearby their home. Even though many participants had
access to a shamba adjacent to their home, this was either a limited variety,
or they still had to prepare their food. Whether their attitude towards this
change was negative or positive very much seemed to depend on their former
situation in the rural area as the following discussion illustrates:
“P8: In the rural area not everything depends on money. Because if it is vegetables, for example; you can plant them in your homestead and even some maize. You have neighbours who can help you. But here there is no one who can help you because everyone’s life is the same. (…) Back in the rural area someone can help you with some milk, even if it is one cup, to make some tea. She can get you some vegetables from her shamba and help you. That is why I say life there is better than here in Nairobi. (…) P2: I must say that some rural areas are very good. However, when you go to my rural area nothing grows. When you plant the sweet potatoes, they dry up in the shamba. Sometimes you plant maize, the weather changes and the maize dies. When you go to work you get one hundred shillings, in my rural area you will sleep hungry. This is because we don’t have flour that is sold in small portions in my rural area. (…) That is why I feel that it is better here. In fact, I can keep on changing my diet; I can get a head of Nile perch for twenty shillings. Yet in the rural area fish is—do you even eat fish while in the rural area? Fish comes from the water and is immediately transported to Nairobi, all of it.”
(Korogocho FGD 02, P2: age 32, 6-months residence, P8: age 35, 3-months residence)
156
Some migrated, from rural areas, in particular from Western and Northern
Kenya, where they did not have access to freely available vegetables and
other commodities.
For some rural-to-urban migrant women, the socio-economic differences
within neighbourhoods exacerbated their attitude towards changes in their
food environment:
“P: This is because when I look at [food] here, I might desire something sometimes, but I don’t have the money to buy it. The neighbour makes me desire because sometimes she might cook something that I desire to eat but I can’t. I don’t have the money to buy that thing. So, I am not satisfied with that life.
M: Yes. Be free. What is it?
P: Sometimes she may make roast goat and I don’t have the money to buy the goat and come and prepare. So it gives me desire for the food.”
(Kibera FGD 02, age 24, 3-years residence)
7.2.3.2 Unhygienic community food environment
A key recurring theme in the interviews was the poor hygiene conditions of the
urban food environment. This discouraged (traditional) staple and vegetable
intake or cooking and preparing food at home.
Poor selling and growing conditions in community food environment
PhotoVoice participants reflected on how the unhygienic conditions within
their food environment took away their desire for traditional food, particularly
vegetables as one migrant woman illustrated this with her picture and caption:
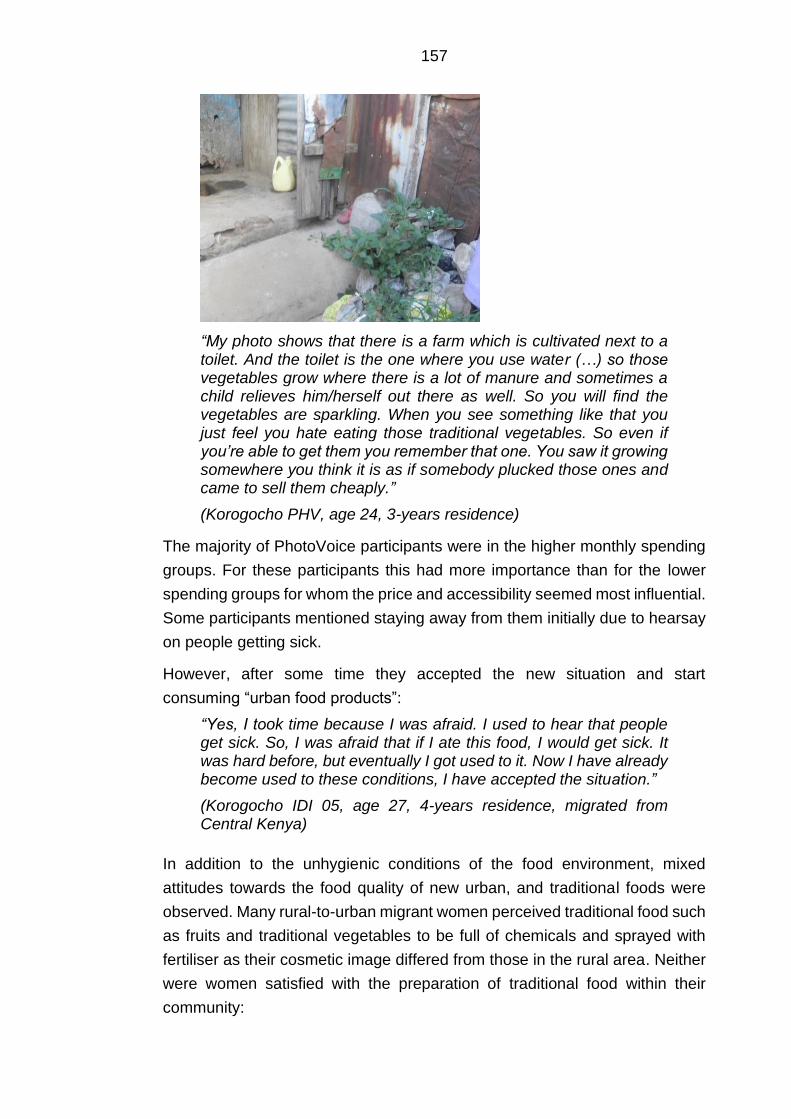
157
“My photo shows that there is a farm which is cultivated next to a toilet. And the toilet is the one where you use water (…) so those vegetables grow where there is a lot of manure and sometimes a child relieves him/herself out there as well. So you will find the vegetables are sparkling. When you see something like that you just feel you hate eating those traditional vegetables. So even if you’re able to get them you remember that one. You saw it growing somewhere you think it is as if somebody plucked those ones and came to sell them cheaply.”
(Korogocho PHV, age 24, 3-years residence)
The majority of PhotoVoice participants were in the higher monthly spending
groups. For these participants this had more importance than for the lower
spending groups for whom the price and accessibility seemed most influential.
Some participants mentioned staying away from them initially due to hearsay
on people getting sick.
However, after some time they accepted the new situation and start
consuming “urban food products”:
“Yes, I took time because I was afraid. I used to hear that people get sick. So, I was afraid that if I ate this food, I would get sick. It was hard before, but eventually I got used to it. Now I have already become used to these conditions, I have accepted the situation.”
(Korogocho IDI 05, age 27, 4-years residence, migrated from Central Kenya)
In addition to the unhygienic conditions of the food environment, mixed
attitudes towards the food quality of new urban, and traditional foods were
observed. Many rural-to-urban migrant women perceived traditional food such
as fruits and traditional vegetables to be full of chemicals and sprayed with
fertiliser as their cosmetic image differed from those in the rural area. Neither
were women satisfied with the preparation of traditional food within their
community:
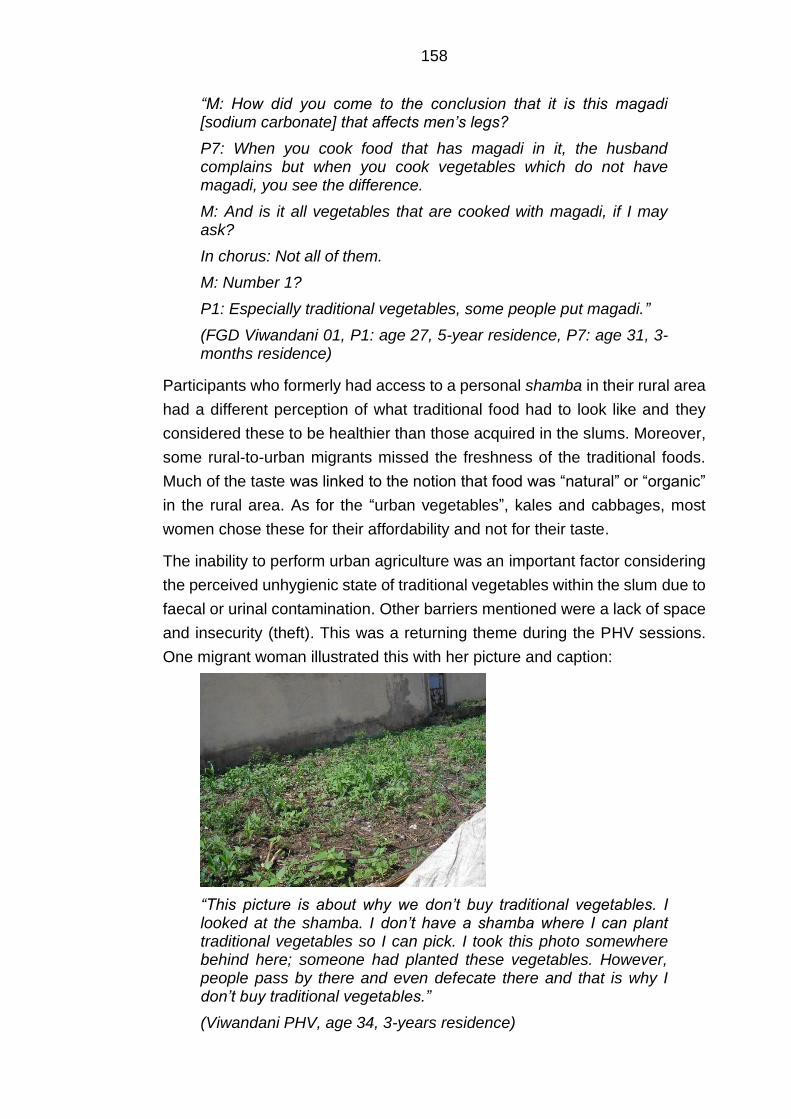
158
“M: How did you come to the conclusion that it is this magadi [sodium carbonate] that affects men’s legs?
P7: When you cook food that has magadi in it, the husband complains but when you cook vegetables which do not have magadi, you see the difference.
M: And is it all vegetables that are cooked with magadi, if I may ask?
In chorus: Not all of them.
M: Number 1?
P1: Especially traditional vegetables, some people put magadi.”
(FGD Viwandani 01, P1: age 27, 5-year residence, P7: age 31, 3-months residence)
Participants who formerly had access to a personal shamba in their rural area
had a different perception of what traditional food had to look like and they
considered these to be healthier than those acquired in the slums. Moreover,
some rural-to-urban migrants missed the freshness of the traditional foods.
Much of the taste was linked to the notion that food was “natural” or “organic”
in the rural area. As for the “urban vegetables”, kales and cabbages, most
women chose these for their affordability and not for their taste.
The inability to perform urban agriculture was an important factor considering
the perceived unhygienic state of traditional vegetables within the slum due to
faecal or urinal contamination. Other barriers mentioned were a lack of space
and insecurity (theft). This was a returning theme during the PHV sessions.
One migrant woman illustrated this with her picture and caption:
“This picture is about why we don’t buy traditional vegetables. I looked at the shamba. I don’t have a shamba where I can plant traditional vegetables so I can pick. I took this photo somewhere behind here; someone had planted these vegetables. However, people pass by there and even defecate there and that is why I don’t buy traditional vegetables.”
(Viwandani PHV, age 34, 3-years residence)
159
Several migrant women said social relationships to be an important coping
strategy for accessing desirable traditional food. Some were acquainted with
food sellers in the main market who originated from their county. They trusted
the traditional food they sold to be of good quality and safe:
“P: There are those women who I know bring their vegetables from upcountry. That is where I normally buy them. The moment they arrive I buy those or I receive them from home.
M: So here in Nairobi if you want to eat traditional vegetables it is either you receive them from home or you buy from those women who you know?
P: There are women whom I know that bring them from upcountry.”
(Kibera PHV, age 30, 3-years residence)
The unhygienic state of both fried and non-fried street foods was also an
important theme for the participants. Even though these were valued as
cheap, tasty and accessible, migrant women generally had a negative attitude
towards the conditions in which they were sold, the lack of transparency of
their preparation, the use of dirty water to wash fruit and vegetables and
mistrusting the adding of sodium bicarbonate. Due to the high availability of
street and other food vendors within their neighbourhood environment, they
did have the flexibility to choose the street- and fast food outlet they would
perceive to be hygienic. Some migrant women expressed the need to satisfy
their hunger, which would often lead to neglecting their concerns on how the
street foods were prepared. For popular staple foods (e.g. githeri) and ASF
they would make an exception. Their desire for this food was stronger than
the unknown origins and preparation to satisfy their needs:
“P4: When you look at the water that they bring to cook this githeri with [laughter] eih! When you eat that githeri, you are not supposed to remember where you got the githeri from and don’t even bother to know who cooked it and who drew the water. [Laughter] No. Just take the githeri and eat it and kill your hunger.
M: Yes, number 2?
P2: The chicken that people eat; the ones that go round on the windows; when they get spoilt, they take them and sell them by the roadside. They fry them again. You come and find it enticing and you buy and yet it is something that has expired; something that should not be consumed.”
(Korogocho FGD 02, P2: age 32, 6-months residence, P4: age 37, 4-months residence).
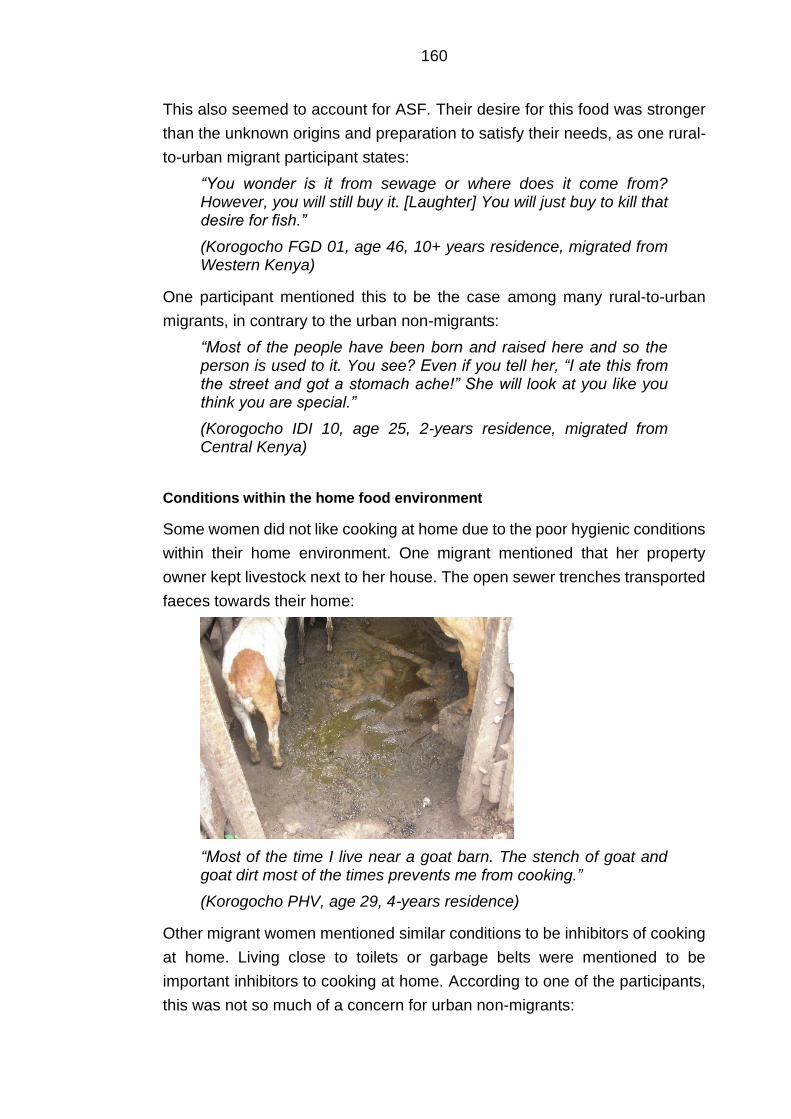
160
This also seemed to account for ASF. Their desire for this food was stronger
than the unknown origins and preparation to satisfy their needs, as one rural-
to-urban migrant participant states:
“You wonder is it from sewage or where does it come from? However, you will still buy it. [Laughter] You will just buy to kill that desire for fish.”
(Korogocho FGD 01, age 46, 10+ years residence, migrated from Western Kenya)
One participant mentioned this to be the case among many rural-to-urban
migrants, in contrary to the urban non-migrants:
“Most of the people have been born and raised here and so the person is used to it. You see? Even if you tell her, “I ate this from the street and got a stomach ache!” She will look at you like you think you are special.”
(Korogocho IDI 10, age 25, 2-years residence, migrated from Central Kenya)
Conditions within the home food environment
Some women did not like cooking at home due to the poor hygienic conditions
within their home environment. One migrant mentioned that her property
owner kept livestock next to her house. The open sewer trenches transported
faeces towards their home:
“Most of the time I live near a goat barn. The stench of goat and goat dirt most of the times prevents me from cooking.”
(Korogocho PHV, age 29, 4-years residence)
Other migrant women mentioned similar conditions to be inhibitors of cooking
at home. Living close to toilets or garbage belts were mentioned to be
important inhibitors to cooking at home. According to one of the participants,
this was not so much of a concern for urban non-migrants:
161
“For someone who has immigrated here from upcountry, these trenches smell a lot during the hot season, and so it becomes a problem for people to cook. However, those who were born here always felt that things are normal. In fact, you can see someone drop something but picks it up and puts it in the mouth; they see it as a normal thing. So for people who have come from upcountry like us who have come from the village to settle here, we have a problem coping with that life.”
(Kibera PHV, age 32, 5-years residence)
7.2.4 Changes in economic circumstances
Changes in the economic circumstances with rural-to-urban migration were
perceived by both key informants and the participants to be highly influential
on their changes in dietary behaviour. These changes also had implications
on their interaction within and outside of their neighbourhood community food
environments.
7.2.4.1 Unsteady income and household responsibilities
After arrival, the interviewed rural-to-urban migrant women went into a wide
range of different informal jobs such as washing clothes, or starting their own
business (self-employed), which did not provide them with a steady income.
This was in accordance with key informants’ observations in all slum
neighbourhoods.
One key informant in Kibera confirmed that migrant women are pre-
dominantly active in the informal economy. One informant emphasised that
migrant women were particularly struggling in the beginning:
“M: When they move to Nairobi do you see that they are behaving differently compared to the women who have been living here for a longer time or how do you see it?
P: The women who stayed here for a longer time—they are used now to their daily lives so they know where to get these [casual] jobs; they will wake up and go and look for those jobs rather than women who have just come in. The women who have just come in, if they are not going to their husbands, they will have to face some challenges. So those who have lived here for a long time they know where to get these small casual jobs in order for them to survive.
M: Yes. And then you see changes in their diet?

162
P: Yes. Also, sometimes they don’t come with their children. They leave their small children with their mothers at home. So they come here first. When they get jobs they start to bring their children. That is the way they normally start.”
(Viwandani KII, community health worker)
Rural-to-urban migrant women emphasised that their dietary behaviour
changed substantially after they got engaged in more frequent IGA. However,
the lack of steady IGA and income was perceived to be a strong driver of
obesogenic street- and or packaged food intake. Generally, there was little
change over time due to poor financial conditions. Within the first year after
migration they seem to stick to the acquired eating habits as they had many
other competing priorities. Generally, women perceived to stick to their eating
habits as it was time and energy consuming to plan with an unsteady income.
Their priority was to find a place to live or look for employment opportunities.
Hence, pre-prepared food was incorporated directly whereas more expensive
animal-sourced food was incorporated after having engaged in IGA.
Participants valued having IGA as it increased their food choice autonomy.
However, devoting long and irregular hours to work led some women to
choose for convenient pre- prepared street and other fast foods over preparing
their own meals. When women could not find work, or would not get paid
enough, they would feel particularly pressured to buy cheap pre-prepared
foods as they had to feed themselves, and in most cases, their families for
that day. Migrant women who were washing clothes or were self-employed in
other ways mentioned not having time to prepare food for lunch or dinner as
one migrant illustrated:
“Depending on the hustle that is in Nairobi, and the way the economy is at that moment, there is no time for sure. This is because you are always on the rush looking for the money. You see. Maybe you are seated, and someone calls. She asks: ‘Where are you? I need one top [item of clothing which covers the chest].’ And maybe it is around noon. Will you tell her to wait for you to cook? No. you will just leave and go.”
(Korogocho IDI 10, age 25, 2-years residence)
Generally, participants who were involved in IGA expressed having scarce
time to cook, though it seemed to affect some more than others. Migrant
women who were self-employed felt they did not have enough time to cook at
home. This feeling was encouraged by the high competition for jobs within the
community, which prevented them from taking time off to cook:

163
“First, I am a business lady. I wake up and I have a small child, of one year and 3 months. I have to prepare breakfast to eat together so that I get energy for doing the business. After I wake up, I prepare for my child something like porridge and we will eat it together. Then I start my business. So, when I start that business, I do not have time to go and cook because if I don’t open my business in the morning, customers cannot come… So, you see, instead of staying hungry I rather take the chips that is available at the street.”
(Korogocho PHV, age 24, 3-years residence)
Participants reported not having time to leave their business to go home to
cook and would come home late. Also salaried labourers mentioned having
little time for cooking:
“M: And at what time do you normally start preparing your evening meal?
P: Around 5pm, when I am coming back from work, I come buy vegetables, when I reach home I just start to cook (…). On weekends is when I take 1 hour. Monday to Friday I do not have time to take 1hour, it is just minutes. (…) If I am from work, I hurry for this child not to sleep without eating, you see. So around 20 minutes on a weekday.”
(Viwandani IDI 09, age 26, 1-year residence)
Participants who already lived here for a longer period of time mentioned that,
in addition to getting engaged in IGA, their diets changed with increased family
sizes. Particularly single mothers mentioned struggling with working long
irregular hours and taking care of their children which drove them to pre-
prepared street foods:
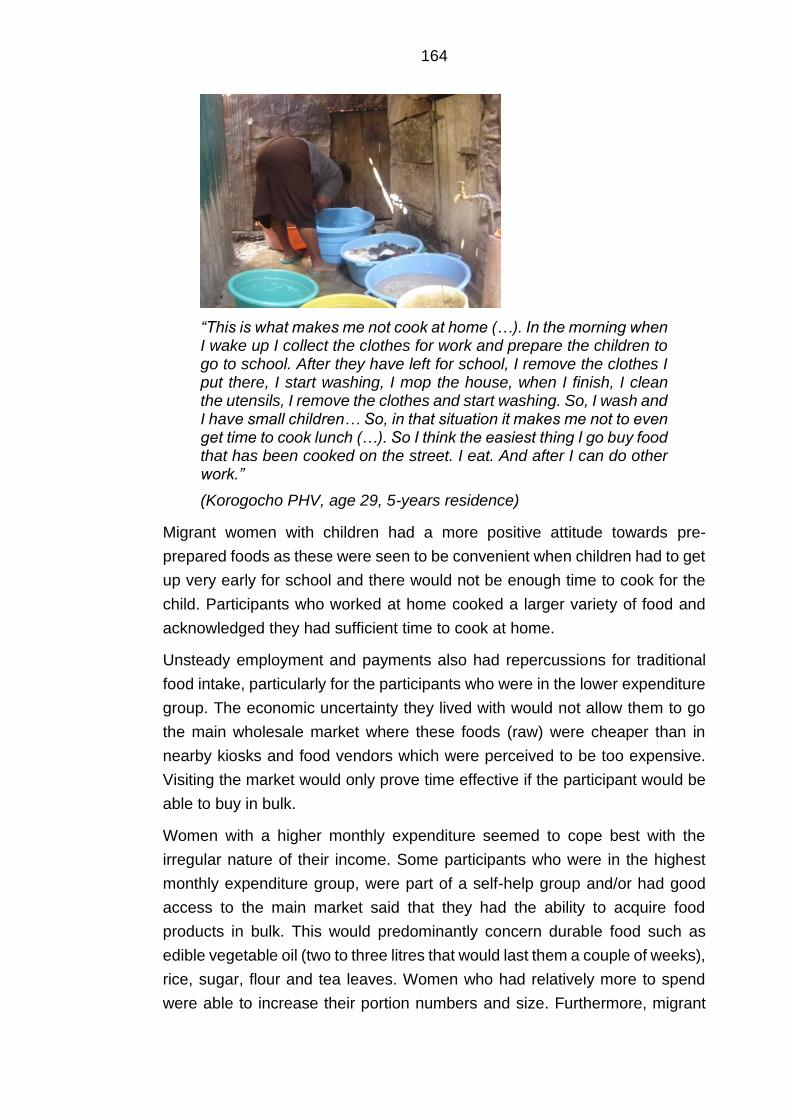
164
“This is what makes me not cook at home (…). In the morning when I wake up I collect the clothes for work and prepare the children to go to school. After they have left for school, I remove the clothes I put there, I start washing, I mop the house, when I finish, I clean the utensils, I remove the clothes and start washing. So, I wash and I have small children… So, in that situation it makes me not to even get time to cook lunch (…). So I think the easiest thing I go buy food that has been cooked on the street. I eat. And after I can do other work.”
(Korogocho PHV, age 29, 5-years residence)
Migrant women with children had a more positive attitude towards pre-
prepared foods as these were seen to be convenient when children had to get
up very early for school and there would not be enough time to cook for the
child. Participants who worked at home cooked a larger variety of food and
acknowledged they had sufficient time to cook at home.
Unsteady employment and payments also had repercussions for traditional
food intake, particularly for the participants who were in the lower expenditure
group. The economic uncertainty they lived with would not allow them to go
the main wholesale market where these foods (raw) were cheaper than in
nearby kiosks and food vendors which were perceived to be too expensive.
Visiting the market would only prove time effective if the participant would be
able to buy in bulk.
Women with a higher monthly expenditure seemed to cope best with the
irregular nature of their income. Some participants who were in the highest
monthly expenditure group, were part of a self-help group and/or had good
access to the main market said that they had the ability to acquire food
products in bulk. This would predominantly concern durable food such as
edible vegetable oil (two to three litres that would last them a couple of weeks),
rice, sugar, flour and tea leaves. Women who had relatively more to spend
were able to increase their portion numbers and size. Furthermore, migrant
165
households with a fridge had the opportunity to store fruits and vegetables for
a longer period:
“For things such as vegetables and fruits, there are few people who buy them in bulk; those who have fridges. They can boil the vegetables and store in the fridge to be using in portions but for those who don’t have they buy what they will eat there and then, and it gets finished.”
(Kibera PHV, age 30, 3-years residence)
This was in agreement with one of the key informants who emphasised that it
was not an issue of availability, but more of purchasing power:
“Some foods are not around, yes, but you know this is a town, this is an urban area, you can get everything, everything is available (..) what will limit someone from getting it is the purchasing power, if you don't have the purchasing power then you will be limited but if you have the purchasing power, you have finance with you then you can eat whatever you want. As long as you’re are aware of the importance of healthy food because somebody may like eating a lot of junk foods. (…) So even though, those who have the purchasing power, they also need to be directed on the correct nutritional practices in order to do not find themselves with lifestyle diseases.”
(Kibera KII 02, community nutritionist)
Having less time due to the long (irregular) hours of work led to a reduced
intake of traditional foods such as legumes and roots which took longer to
prepare. The participants also felt that the long and irregular working hours
did not allow them to go to the informal main market, especially if this was not
on their way home from work:
“You know most people go to work from 7 o’clock in the morning until 6 o’clock in the evening. With that you cannot find time to go to the market. Thus, if it is work it should be for example you go to work at 7 o’clock in the morning and by 3 o’clock in the afternoon you are already back home so that you get the time to go to the market.”
(Kibera PHV, age 25, 1-year residence)
Some migrant women mentioned they had abundant work in the rural area,
either on the farm or at a nearby town or village. Regardless it did allow them
to cook food which required more time such as legumes, pulses and roots.
However, in the urban environment many did not find it cost and time-effective
to cook traditional food at home despite their positive attitude towards this
behaviour for both social and food safety reasons.
Many participants mentioned family size to be an important influence on
changes in their diet, and their food decision-making. Migrant women who had
166
resided in the slum neighbourhood for a couple of years said that their diet
became more monotonous with having children as they proposed a lack of
family planning to be a barrier to having a balanced diet. Perceived
affordability could be strongly linked to the value individuals ascribed to foods.
Some participants felt they were however able to get a balanced diet in their
neighbourhood. There was some disagreement. Some participants mentioned
that when one has a big family, they would not be able to get a balanced diet.
Instead, they would have to go to the street foods or cook small portions to
satisfy her family. Other apparently contradicting results were found for larger
families and cooking at home. One participant in Viwandani described going
more often for convenience food as she did not see the need to purchase
cooking supplies just for herself. With a larger family she would be forced to
cook because she would not be able to go and eat with her family at a hotel.
“M: So everyone in this community is affected by money in terms of what to eat?
P8: What I know is that you may not have a lot of money but still be able to eat a balanced diet. It’s not a must for you to eat chicken or fish or I don’t know what. You can eat… here they boil beans by the street; you can go and buy those beans for ten shillings; that is proteins. You can buy spinach for ten shillings; it is quite a lot. These are vitamins. You then buy some little rice or perhaps you have it cooked in the house. That is a balanced diet. Then you can buy an orange or a banana for five shillings. I don’t see… M: You don’t think money can bring a hindrance?
P8: Yes.
M: Is there anyone with different views?
P3: Let me correct her. You may… If you have a big family, beans worth ten shillings and two bunches of spinach will not be enough. There are many children and it will not be enough.
M: As for you, your view is that it is not enough?
P3: It is not enough. M: If I understand, correctly, money is a big hindrance to a balanced diet if you have a big family. In chorus: Yes.”
(Viwandani FGD 01, P3: age 40, 10-years residence, P8: age 25, 9-years residence)
167
Generally, migrant women who had more to spend chose convenience over
quantity and diversity. Fruits and vegetables were often pre-cut. These were
however more expensive:
“If I lived near a market, I would buy all of them from the market. I would not buy from the stalls; the stalls will sell to me at an expensive price. In the market I will buy at a cheaper price.”
(Viwandani IDI 06, age 34, 3-years residence)
Hence, for several women time costs and convenience appeared to be more
important factors than lower food prices. Participants who reported higher
monthly expenditures mentioned this often as they had a sufficient livelihood
to go to nearby kiosks, and felt that this was justified after a long day of work.
Some participants took this further and emphasised that the urban
environment encouraged laziness over time. Laziness encouraged them and
others to consume pre- prepared street food and pre-cut fruits and vegetables,
irrespective of economic status:
“P: Even now there are those that prepare onions, tomatoes. So, it is just taking these and put them in the pan directly. So that one now contributes to that point I told you: laziness. Because it is not that I cannot prepare those vegetables but since I feel ‘this is the work she is doing’. So, you give her money to prepare for you vegetables, you go seat relaxing waiting for the time to come pick vegetables, laziness.
M: So, laziness contributes to food choices?
P: It contributes in a big way here in Nairobi.”
(Korogocho PHV, age 39, 4-years residence)
This lack of effort seems to be partly influenced by possession of luxury goods.
One of the participants mentioned being addicted to watching programmes on
her television, with the consequence of being too lazy to prepare food in her
home and instead resort to street food next door:
“P6: For me most of the time I am a business lady. But if I get time I often spend it watching TV. That is what makes me buy these street foods.
M: And is it normal to get many people here maybe watching television? Is it something common?
In chorus: Yes. P4: Not easily. It is something common to those people who don't have work. For me I don't think I can get that time to go and watch TV and I am busy. So you see there are those people who wait for food to be brought, those ones get that time to watch TV.”
(Korogocho PHV, P4: age 24, 3-years residence, P6: age 24, 3-years residence)
168
Several participants highlighted that they were lazy as they frequently resorted
to street foods on a consistent basis:
“M: So you are saying that if you have money it can influence you to cook for yourself in the house?
P: Yes.
M: You will stop buying the ones sold by the roadside?
P: The laziness will also end because you will not be rushing to buy these foods to avoid this.”
(Korogocho FGD 02, age 26, 1-year residence)
However, multiple participants who had none or few children said it was not
time- (or cost-) effective to cook at home. Migrant women still resorted to street
food intake. Street food portion sizes would increase with extra financial
resources.
There were a few divergent cases who reported to frequently cook at home
and would rarely resort to street foods. One migrant woman was still able to
cook at home and get her daily intake of vegetables (e.g. kales, cabbages,
onions and tomatoes) even though she lacked a steady income and she was
a single mother of three children. Instrumental in this was her commitment to
travel to one of the wholesale markets, which was on a 30-minute walking
distance:
“I can get onions because they are different from here or tomatoes; you get them at a cheaper price than here because they get from there and come and sell here so they sell expensively. So, if you go there you will chose good ones. If you have fifty shillings you can buy tomatoes that can last you even three days including other things.”
(Kibera IDI 02, age 40, widow, living with three children, half a year residence, casual labour, lower monthly expenditure group)
The market was also conveniently placed next to a gas station, where she
would be able to afford cooking fuel. She would only resort to street foods as
a backup when she did not gain enough income of the casual IGA she did that
week. She had to visit the health clinic frequently. Here, they advised her not
to consume street foods and cook more frequently at home.
169
7.2.5 Changes in socio-cultural environment
Based on the participants’ narratives, physical and economic environmental
influences were tightly interwoven with changes in their socio-cultural
environment. Changes in their social networks and the existent food/body
image norms within their respective village neighbourhoods and households
were important influences on changes in their dietary behaviour.
Whereas in the rural area availability and family traditions were perceived by
the participants themselves to be key in shaping their diets post-migration,
their direct neighbours and children’s preferences were considered to be the
most influential social influences on their own food intake, food preparation
and meal patterns. Migrant women’s social ties with upcountry was not
mentioned in relation rural-urban food remittances. One of the key informants
in Kibera did mention that migrant communities from counties neighbouring
Nairobi had more access to a diverse diet as they frequently received food
from their rural area:
“When you find a community like Kikuyu or Kambas, them they can go home and come back so they come with some things from upcountry. So you find their diet is at least good because they have brought some things from home. They can go on the weekend and come back the same day (…) Some even come to sell their products here and they go back home. They are a bit nearer so you can find them their diet is good because they come with things from home.”
(Kibera KII 02, community health worker).
Participants who migrated from Western Kenya and received food from their
rural area mentioned this to occur sporadically. Migrant women said that
economic costs were a barrier for sending food frequently.
7.2.5.1 Integration into the village community
Changes in dietary behaviour among the participants had to do with
integration into city life and socialising with local people. They generally
perceived that residents born and raised in Nairobi had different attitudes
towards dietary behavior. However, many said that their diets and food
sources were similar to those of the residents within their respective villages.
Initially there was not much social integration in the early post-migration
stages.
170
One key informant confirmed this and mentioned that it may take some time
before they eventually start mingling with others:
“Some come with the mentality that Nairobi people are thieves; Nairobi people are not good, so I am not supposed to mingle with them; I have to understand them. Therefore, that is the reason why they seclude themselves until they get to know the community well. Maybe after three months, four months, and five months; that is when you see them maybe outside starting to mingle with others. Yes.”
(Viwandani KII 01, community health worker)
Generally, both the key informants and migrant women expressed that rural-
to-urban migrant women followed the example of the community residents:
“M: Have you seen any differences between the migrant women, or, and the women who have been living here their whole life. Have you seen any differences in their diet?
P: The migrants who come from the rural area, may not influence a lot, because the ones who have come, they have to adapt a lot more than those who have been there for quite some time. Because they are not bringing in something from upcountry or from the rural area. They are joining the team which is here so they have to adapt to the team.”
(Korogocho KII 02, community nutritionist)
Their direct neighbours were said to be particularly influential in their food
purchases and preparation through cooking activities, information provision,
contagion and the need to adhere to the urban norms on cooking methods to
prevent embarrassment:
“P5: I feel I have changed my cooking methods because in our rural area we are used to mixing.
M: Are you the one who changed yourself or what made you change such that you don’t cook these foods together?
P4: “It is just neighbours. When you host a self-help group in your house and the women find that you have cooked for them mixed up foods! No. [Laughter] When you go to another woman’s house and you see how she has served the food, it is really smart, and you also desire that. It is the neighbours who make you change.
M: So, neighbours make you change the way you sometimes cook?
P4: You don’t want that when you serve people food, the talk tomorrow saying that you don’t know how to cook. So you have to look at the standard of the people you are with.”
(Viwandani FGD 02, P4: age 33, 10-months residence; P5: age 27, 10-months residence)
171
This was in agreement with key informants’ perspectives. Some emphasised
that rural-to-urban migrant women were dependent on their neighbours for
navigating the urban food environment. This did vary among rural-to-urban
migrant women. In particular women who migrated by themselves were
perceived to be more dependent on their neighbours’ guidance.
In some cases, direct neighbours had a positive influence on changes in their
diet, as they would introduce them to new fruits and different ways of preparing
vegetables:
“M: And why have you taught yourself to eat these fruits?
P: Because I have been told that this is a good fruit, that it is good for the body.
M: And who has taught you how to eat this?
P: My neighbours. M: So, your neighbours have taught you to eat fruit?
P: Yes, because they know them and maybe there are grown in their upcountry (outside of Nairobi). So they tell you that this is good for your body and you try and feel that it is really sweet and so you continue eating.”
(Viwandani FGD 01, age 49, 10-years residence)
In addition, participants and key informants said that in addition to their
neighbours, friends (who were often their neighbours) were influential on pre-
prepared food intake. Especially younger, single participants were strongly
influenced by friends to consume street and fast food more frequently:
“M: What influences you to buy the foods that you eat, what you eat?
P: I can say friends or the people that you live with.
M: You have mentioned friends, how?
P: Like say we are walking, and my friend goes to buy say bhajia [deep fried potatoes], obviously even me I have to buy because I will not walk with her as I look at her as she eats. So, she makes me also want to buy.”
(Kibera FGD 03, age 23, 10-months residence)
Participants revealed there to be strong village community (neighbourhoods
within the slums) food and body image norms. Generally, staple food such as
chapatti, ugali, and rice enjoyed status within the different communities and
villages.
172
Participants had the aspiration to consume and/or learn how to prepare this
food:
“Even cooking chapatti, they have taught me, in upcountry you can eat chapatti even once per year or twice but the people from here they know how to cook more than those upcountry.”
(Viwandani IDI 07, age 42, 4-years residence)
Other foods that enjoyed status in the community were ASF, in particular
meat. As mentioned in the previous theme, women would purchase ASF such
as roasted meat, chicken, or higher quality red meat from the butcher should
their income increase. Some migrant women were willing to travel further for
this as well. Red meat was seen as a luxury food. Some felt it would improve
their social standing if others within the village would see her eating meat. The
source of the meat did not seem to prevent the participants from consuming
meat:
“You cannot buy the 1000-shilling quarter meat. If you buy these street ones worth 20 shillings and you fry these with spices, the neighbour will hear you frying. Your child will get out and shout: ‘In our house we are cooking meat!’. The neighbour will not know if it is butchery meat or the street one, all of them are meat. So, people here believe that people who are frying meat, even if it is the 20 shillings one, they are eating better than me who is buying eggs.”
(Korogocho PHV, age 24, 5-years residence).
The narratives also indicated that migrant women felt socially pressured to
adhere to food preparation norms. One participant who mentioned the
following illustrated this:
“Sometimes someone may pass by and see you cooking the traditional way and they will exclaim saying: ‘This is Nairobi!’. To that food should be added such and such a thing.”
(Kibera PHV, age 30, 3-years residence)
Cooking with edible vegetable oil or adding this to pre-prepared food was
highly valued in the different villages. Some participants felt pressured to
incorporate this into their eating habits, even if they were aware of the negative
consequences or disliked it. The preparation and cooking of food were also
particularly strong among different ethnic groups.
173
One participant felt pressured to integrate into her husbands’ food culture:
“I feel my diet is not very healthy because of how I prepare it. I feel sometimes I want to boil my food or use less oil, but because of my culture I am not able to do that. So, I just eat it, but I feel it is not healthy for me. Sometimes I would want to eat boiled githeri or just boiled sweet potatoes, but they don’t like that (…) If you don’t use a lot of oil then you bring up issues in the family and they will say that you don’t know how to cook. So, to avoid a lot of politics, you just prepare the way they like.”
(Kibera IDI 07, age 28, 2-years residence)
Some village communities were heterogeneous in terms of ethnicity. This
situation encouraged social interaction between different tribes, which for
some changed their perceptions of food and led to the introduction of new
starchy staple foods. Some ethnic groups were marginalised in terms of
cooking and preparation methods:
“P: Here I live near the Somalis who are my neighbours. When they cook their foods, I see how they cook. For example, the spaghetti and I really like it. So, I learnt how to cook the spaghetti there and realized it is also sweet so it is food that I can also eat. I used to think it was just their food, but it is for everyone.“
M: And have you taught them anything?
P: They don’t like our foods and even how we cook they don’t like it. They just cook their own way.”
(Korogocho IDI 01, age 40, half a year residence)
Participants who were living in more ethnically homogenous villages seemed
to adopt food intake and food preparation methods of that ethnic group. One
Luo participant who integrated in the Nubian community illustrates this:
“I usually do what is done in rural areas when I am there and when am in Nairobi I do what Nubian community does. I cannot take the Nairobi style to my upcountry and I cannot bring the style of upcountry here in Nairobi.”
(Kibera IDI 07, age 28, 10-years residence)
Generally, women adhered to the social norms and values in their villages.
However, participants also kept consuming traditional staple foods such as
ugali, or fish (depending on the rural-to-urban migrants’ origin) which enjoyed
a protected status due to sentimental value and/or perceived health benefits.
This was however often facilitated by their social surroundings who belonged
to the same ethnic tribe. In the urban area, rice seemed to be the main staple
and very much enjoyed by the participants’ children.
174
Many of the consumed foods were also linked to ethnic groups, as one
participant illustrates:
“M: What has made you to like ‘omena’ [silver cyprinid] with ugali [cornmeal]?
P: I don't know what is. You know we Luhyas like silver cyprinid a lot.
M: So, is it your tribe that makes you like silver cyprinid?
P: Now we have grown eating that, so now you have that appetite.”
(Korogocho PHV, age 29, 5-years residence)
For some, rural/ethnic traditions appeared to be particularly strong
determinants of maintaining traditional eating habits or staying away of new
food:
“Yes, like goat and sheep, from where I come from, we never used to eat them. So I don’t eat such. My family never used to eat them, so I don’t even eat them even when I am married.”
(Korogocho IDI 02, age 43, one-year residence)
This may not only have implications for the types of foods consumed, but also
for the portion sizes served. In addition to economic circumstances within the
urban environment, hardships in the rural area may shape dietary habits which
participants continue in the urban area, as one participant illustrated:
“M: I heard you say that you buy few vegetables. Why are vegetable portions small and 'ugali' portions big?
P: The difference is that these women fear spending. (…) Also, we have a problem; when we were being raised back in the rural area we can blame our parents because they used to serve us little vegetables. There was a time when vegetables were hard to get back in upcountry. You would be served with little vegetables and a big 'ugali' and then you are told: “Take some little vegetables and get full.” There is a way we put it in our language. In quotes in my language we say [speaks in dholuo] which means you eat little vegetables and a big 'ugali' so that you may get full. So it is a problem we have come with from upcountry to the city.
M: So some of them are cultural? You have learnt to eat…
P: Little vegetables. You can be served with only two small pieces of meat but with a lot of soup. So you eat a lot of 'ugali' to get full but the food is less.”
(Kibera PHV, age 32, 5-years residence)

175
As aforementioned, migrant women had negative attitudes towards traditional
food in the urban area as these were perceived to be unaffordable, poorly
accessible, unsafe and/or unappealing. However, generally migrant women
missed traditional vegetables and other staples as they were raised with these
foods.
Whereas socio-cultural environmental influences encouraged use of edible oil
and intake of pre-prepared obesogenic food, participants also expressed they
enjoyed the sweeter taste as one participants describes:
“M: You have told me you used to eat ‘githeri (a mixture of maize and beans) in upcountry?
P: In upcountry I eat and here I still eat but that one of upcountry and here, the one here when I go to buy I go to fry, I add potatoes, everything, my things, that is why it is sweeter than that of upcountry because the one in upcountry just boiling beans together, you just add salt and eat but here I put everything then I eat while it is sweeter than the upcountry one.”
(Viwandani PHV, age 26, 7-years residence)
The urban environment enabled them to use edible oil and consume fatty and
sugary foods as these became accessible and affordable in contrary to the
rural area.
7.2.5.2 Household dynamics and food preferences
For the participants in my study, having children and/or husband who were
integrated into the local way of eating was a strong incentive to adopt novel
urban foods. The child’s preferences were especially influential in obesogenic
dietary behaviour. Whereas many came here when they were single, some
joined their husbands. In some households, children would migrate from the
rural area at a later stage. Also on this level influence, mechanisms of social
pressure, often in relation with economic ones reported above, played an
important role in obesogenic dietary behaviour and traditional food intake.
176
The influence of their children on their daily food choices, and in particular
obesogenic food intake, was a returning influence:
“M: And what makes you cook the foods that you cook in your house?
P7: You just change. You keep on changing.
M: What makes you keep changing food?
P7: The children.
M: The children?
P7: Yes.
M: What do the children do?
P7: They say: ‘Mother, we don’t want this today, please don’t cook for us this food every day, change the food for us.’
M: So the children make you change the foods that you cook in the house?
P7: Yes. M: What foods do your children prefer? P7: They love rice so much. P4: To contribute to that, the children don’t know that food left over from yesterday is supposed to be eaten. They will feel that instead of eating a cold 'ugali' I better rush for mandazi. When you compare with the rural area, if there is some 'ugali' leftover there is no wastage; that is breakfast in the morning. When you compare with the children here, they are not as strong as the children in the rural area. (…) Here when the child eats he just sits on the sofa with a TV remote at hand, you find that the 'ugali' that you thought they would eat for lunch he prefers to stay hungry or rush for some chips there or cook some rice; simple.”
(Viwandani FGD 02, P4: Age 33, 10-months residence; P7: Age 25, 1-year residence)
Children seemed to prefer starchy staple foods such as rice, and pre-
prepared deep-fried street foods such as fries, samosa [triangular-shape
savoury pastry fried in oil] and bhajia. Whenever they would come across
something new on the street, they would pressure the participant to purchase
this food. Some mothers gave an indication of children quickly adopting new
urban foods, and they expressed a desire to incorporate this into their daily
diets.
In the rural area, children did not have a specific preference due to the limited
diversity of food within in their surroundings. Even when a child would see
other food, the participant could not afford it. One of the key informants’
responses revealed that this pattern may not differ in the urban environment,
as the mother is financially constrained:
177
“M: How did the children influence the diet of the mother?
P: The children—they eat what they have been given.
M: Okay.
P: Yes. If the mother has decided to cook this, it is that or that. But when you see—sometimes the mother can get good money. When she cooks that different diet everyone is happy. For example when you cook chapatti and beans; that is a celebration to the children. They will even start spreading the good news around. So you see—you know that that house today is a celebration day.”
(Kibera KII 02, community nutritionist)
In general, this perception differed from the participants’ experiences.
Participants appeared submissive to children’s demands for a wide array of
reasons. Most importantly they wished to please their children.
Participants mentioned being eager to comply with the requests and desires
of their children, when financially able:
“The youngest one will push you to buy yoghurt and other things and you will be forced to buy, even if you don’t have the money for that. If you don’t have it you tell her: “When I get the money I will buy it for you.”
(Viwandani IDI 08, age 45, 4-years residence).
In addition to satisfying their children, some participants mentioned safety and
security to be important for sufficing to their children’s desires. Some migrant
women were afraid of letting the children run off to their neighbours or into the
wider community:
“P1: You will find that a child smells, say omena (silver cyprinid fish) from the neighbour’s place. The children here are naughty sometimes, so you will find that he/she wants to go to the neighbour’s house and yet here in Nairobi people buy food according to your family size. So that is why I said, you will find a child has gone to eat at the neighbour’s house. To avoid that, you use 50 shillings, go to the street, and you afford to buy for your child.
M: Yes, number 4.
P4: Yes, I have also said it is the children because sometimes they are the ones that will give you that force: ‘Mum we want this, mum we want this’. So you just decide to buy for them.”
(Kibera FGD 03, P1: age 29, 1-year residence, P4: age 42, 1-year residence)
One participant mentioned giving food to prevent her child from crying when
hungry. Short-term solutions such as pre-prepared street foods were deemed
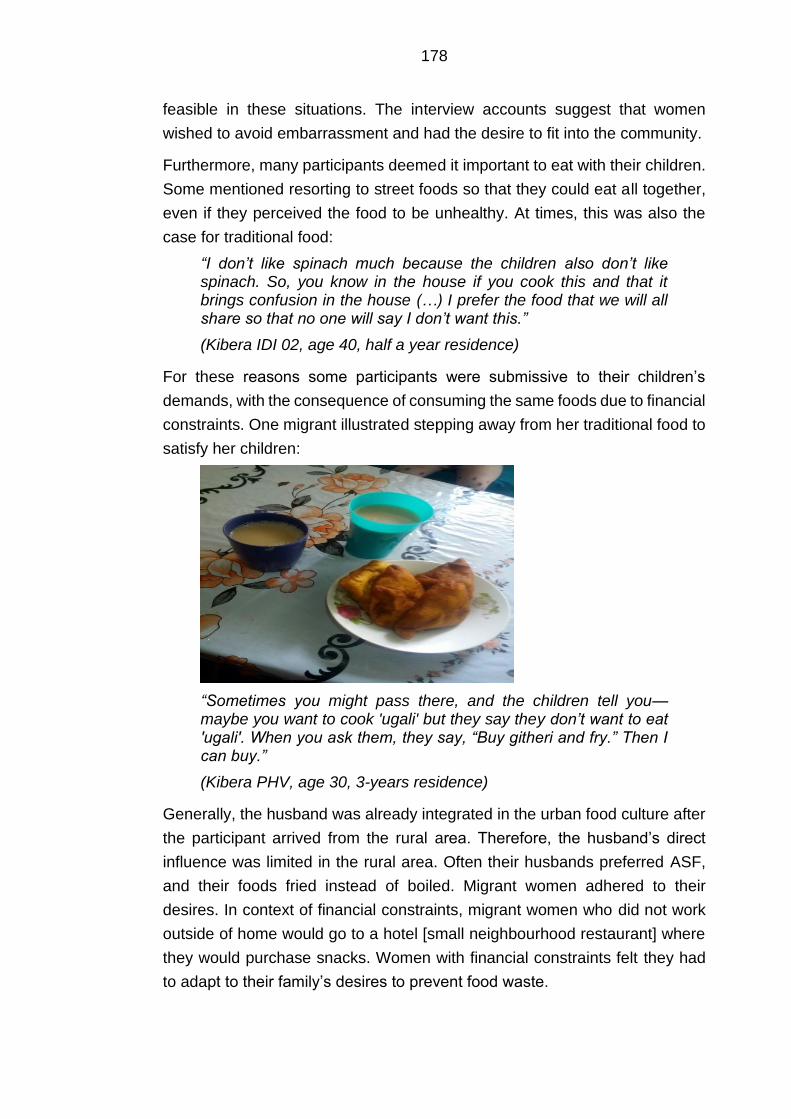
178
feasible in these situations. The interview accounts suggest that women
wished to avoid embarrassment and had the desire to fit into the community.
Furthermore, many participants deemed it important to eat with their children.
Some mentioned resorting to street foods so that they could eat all together,
even if they perceived the food to be unhealthy. At times, this was also the
case for traditional food:
“I don’t like spinach much because the children also don’t like spinach. So, you know in the house if you cook this and that it brings confusion in the house (…) I prefer the food that we will all share so that no one will say I don’t want this.”
(Kibera IDI 02, age 40, half a year residence)
For these reasons some participants were submissive to their children’s
demands, with the consequence of consuming the same foods due to financial
constraints. One migrant illustrated stepping away from her traditional food to
satisfy her children:
“Sometimes you might pass there, and the children tell you—maybe you want to cook 'ugali' but they say they don’t want to eat 'ugali'. When you ask them, they say, “Buy githeri and fry.” Then I can buy.”
(Kibera PHV, age 30, 3-years residence)
Generally, the husband was already integrated in the urban food culture after
the participant arrived from the rural area. Therefore, the husband’s direct
influence was limited in the rural area. Often their husbands preferred ASF,
and their foods fried instead of boiled. Migrant women adhered to their
desires. In context of financial constraints, migrant women who did not work
outside of home would go to a hotel [small neighbourhood restaurant] where
they would purchase snacks. Women with financial constraints felt they had
to adapt to their family’s desires to prevent food waste.
179
Some participants with higher monthly expenditures and engagement in IGA
referred to being able to satisfy their own and their child’s food desires. One
participant mentioned being able to cook different staple foods for her children
and for herself and husband:
“P: Like now that rice, when I don't want it is when they want it. You see, now let's say supper they want to eat rice and I don't want to eat rice.
M: What do you do?
P: Now they have to cook that rice and I cook ‘ugali’.
M: Will the ‘ugali’ be yours alone or?
P: And my husband.”
(Viwandani IDI 10, age 38, 2-years residence)
Household rules on income seemed to play an important role, even though
this was not directly mentioned to be an influence by the participants. One
participant who had relatively more to spend mentioned that only her income
would be spent on food for the household:
“No because we agreed that I will be paying for food and him maybe rent, electricity, that is, these other things he takes care of them but food because he is a person who is paid at end month, so you see we cannot stay like that, my little income is what we use to eat and he pays for rent and electricity, those things.”
(Kibera IDI 03, age 21, 1-year residence)
In most households in this study women were the main responsible for food
purchasing and preparation. The member composition during family meals
differed among the participants with no clear differences between ethnic
communities. This was also highlighted by one of the key informants:
“M: How do you see the function of the family in the migrants’ diet?
P: There are certain communities whereby, I don't know whether it is the whole of North rift, it is men first. A mother cooks food, instead of serving the children first, the man will be given the priority. After the man is given the priority then the children then the woman, you know an African woman is a woman with a lot of burden especially these days. (…) Some men feel they should be taken care of first even if he is the one who is providing, so he is providing then he has to be taken care of properly, then the children then women in some households. It is like that in some households they treat everyone equal. So it is a house to house thing and it is also community to community, there are communities where children are first, men first, women first, like that or everybody together.”
(Kibera KII 02, community nutritionist)
180
Some participants mentioned the husband to exert a strong influence on what
had to be prepared. In some households this led to a lower intake of street
foods as their husbands were against this eating habit.
Many women did prefer to cook at home, if not for reasons of hygiene, also
for portion size. Another reason for the participants who did have time to cook
mentioned that it was not deemed necessary to cook lunch if her family was
not present, hence they would acquire pre-prepared street food as one
participant illustrates:
“I think what makes someone cook most of the time are children and if the children are not there, they are at school. I don't see the need of somebody cooking when there is food here on the road. It is cheap and it is available every time.”
(Korogocho PHV, age 24, 3-years residence)
This seemed to be linked to the value women had towards daily meal patterns.
Breakfast and dinner were regarded as more important in the urban area,
whereas only dinner was perceived to be really important in the rural area due
to the daily activities. Lunch in the urban area was not perceived as cost- and
or time-effective. Money and time would be saved for dinner when everybody
was together.
7.2.5.3 Social support
The importance of the migrants’ neighbours did not only translate into
information and exchange of appeasing food preparation methods. Migrant
women mentioned that supporting their neighbours and friends businesses
had both social and economic benefits. This was also seen to be an important
incentive for some to go to the kiosk instead of directly to the market to acquire
food:
“We call Njeri’s kiosk a market. TherSel is no place, where vegetables are brought in bulk like they do in a market; the kiosk’s owners normally go to the market and then purchase to sell at these kiosks. The kiosks are many but I normally go to buy at her place because she is my friend.”
(Korogocho IDI 08, age 34, 7-months residence)
The participants mentioned not going often enough to the market to build up
a relationship with the food seller. This was particularly important, as they
would be able to access food on credit in times of need. Key informants saw
this mechanism repeatedly among rural-to-urban migrant women as they
struggled with unsteady incomes.
181
This did however not differ much in comparison to the rural area, as
neighbours in upcountry were also a source of support, as one rural-to-urban
migrant explains:
“You would get them, but it would take time. In my rural area the shopping centre is quite far and so if we want something like rice, we would have to wait for someone who is coming from there to bring it to us. (…) In the rural area I will just go into my shamba and I know I have planted some African night shade somewhere, kales are there and if I don’t have, my neighbour supports me. Thus, I will go to her and she will get some for me and we sort each other.”
(Korogocho IDI 08, age 43, 7-months residence)
Several migrant women said their involvement in merry-go-rounds (saving
groups) to be an important influence on changes in their diet. According to the
participants there were both food and savings merry-go-rounds. In the first
type, migrant women often ate together and were introduced to new food
preparation methods and the mixing of food. The savings merry-go-round
assisted them in purchasing ASF, buying foods in bulk and avoid marital
tensions on the food budget:
“M: Which foods have you started to use?
P: I will still go back to my chicken; I love it especially the way I marinate it.
M: Okay. So when you receive money from the merry go round you buy it?
P: Yes. The chicken and if I get the money from the merry go round I will not buy for one hundred; I will buy either for four hundred or three hundred.”
(Kibera IDI 05, age 34, 1-year residence)
As mentioned earlier, some divergent cases mentioned there to be little social
interaction with their neighbours. Often this was due to economic differences
between the households.
7.2.5.4 Body size and connection with diet
Conform to village community body image ideals
Generally, women felt pressured by both rural and urban communities to
adhere to body image ideals. Overall, a larger body size was preferred within
the different slum village communities. Especially after marriage, women were
expected to conform to the village community body ideals as this was as a
sign of the husband taking care of them well. One rural-to-urban migrant
182
woman mentioned the strong influence of the community on body image and
that this puts pressure on herself and her husband:
“You know the society contributes also. The society also influences because maybe you are married, if you grow thin your husband or other family members will start wondering if there is a problem. The husband will start being told upon: “What have you started doing to her that she has started growing thin”, you see. So, he finds it better to maintain the body shape of his wife or even if it is me, and I live where people are used to see it like that.”
(Korogocho PHV, age 39, 4-years residence)
Participants also felt pressured by rural body ideals. In the urban area women
felt they were not able to lose weight. Community members would spread the
message that the participant is marked with disease.
One participant explained this:
“Since I came to Nairobi, I noticed my body changed. I had to now start loving myself. Those who are in the rural area, they will start saying “for sure that woman is okay,” you see. So, if I make a slight mistake again, I slim, they will say: ‘There she is, disease has hit her’. If I grow fat than that they will start saying: ‘There are antiretroviral drugs, she has started using’, you see. So that is why we want somebody to maintain the weight she has. (…) So, you just maintain this weight.”
(Korogocho PHV, age 39, 4-years residence)
Changes in body size or weight would be perceived as dangerous, before and
after marriage. Due to social control within the slum, losing weight was
undesirable as others might think she had a disease such as being HIV+.
Hence, there were rules and timings when she, like other women, was allowed
to gain weight, and other times in her life when she was not allowed.
There were however inter-community village differences. There appeared to
be body image preferences for different ethnic groups. For example,
participants of the Luhya and Kikuyu ethnic groups preferred a larger body
shape. Also, within ethnic groups there were differences for body image
perception but even within a group, this might differ:
“There are those from Marsabit, who say: ‘I don’t want that big body, I just want a small body’. You see, that is what I have said, and they are all Boranas still.”
(Viwandani IDI 09, age 26, 1-year residence, migrated from Eastern Kenya, Borana ethnic group)
There was also a mixed attitude towards weight gain among the participants.
A few wanted to continue gaining weight, as one rural-to-urban migrant
woman illustrates:
183
“P: I want to gain weight and really become fat.
M: Why is that?
P: That is what I like. I don’t like being skinny and that is why I really eat so I can become fat.”
(Korogocho IDI 07, age 29, 4-years residence)
Migrant women who had resided in the urban area for a longer period of time
repeatedly described having gained too much weight and that they would like
to lose weight. Some said this happened uncontrollably. Furthermore, for
some individuals, ideal body size perceptions changed with prolonged living
in the urban area:
“You know, if somebody leaves upcountry, she/he just wants to come and grow fat, to feel that he/she is fat. But now somebody like me when I go home, now I think that medium size is alright.”
(Viwandani IDI 10, age 38, 2-years residence)
Their neighbourhood community also had a pervasive influence on their
perceptions of a healthy body weight. Some participants mentioned that
community members started favouring smaller body sizes as the direct
consequences of NCDs were felt. One participant illustrated this:
“In the past people used to believe that being fat is being healthy but these days because of the diseases that come with body size they now know that being light weight is good.”
(Viwandani PHV, age 22, 6-years residence)
The participants who had a positive attitude reported being malnourished prior
to migration and saw weight gain as a positive change. Overall, participants
mentioned they preferred a body shape which was “in the middle” in their own
words. A thin body shape seemed to be associated with a malnourished state,
as one rural-to-urban migrant exemplifies:
“M: What is skinny in your perception?
P: Someone who is thin and with a small body.
M: What is a small body?
P: You can have a small body, but you are healthy and energetic. What I mean is someone who is thin and is not healthy.
M: This person with a small body, how do they look?
P: A thin body and you can see bones popping out, this is someone who isn’t healthy and may be sick.”
(Viwandani IDI 07, age 42, 4-years residence)
184
Women who preferred having a larger body shape associated this with wealth,
eating properly (though no specific foods were referred to) and/or leading a
stress-free life. Even though bigger body shapes were associated with health
and respect, among many participants the most important aspect was to be
physically active and to have the ability to do work.
The PhotoVoice sessions gave more insight into what the participants meant
with body images which were “in the middle”:
“I am pleased with my body the way it is. It is medium, not fat and not thin. I can do anything.”
(Korogocho PHV, age 27, 5-years residence)
Many women associated an ideal and healthy body with the ability to do hard
work without getting tired.
“I loved that body because if something comes up, I can run. As you can see, she is carrying two jerry cans of water and she has drawn that water from far. This means that she is active, and she can do her work very fast. She cannot get sick with blood pressure. Moreover, even if there is no water—in Kibera there are times when we buy water at those sides where the showground is and if they bring you water to the house, one jerry can is thirty shillings. So, I like it because if people were to go for water at the showground, for example she can go five rounds.”
(Kibera PHV, age 24, 1-year residence)
185
The above pictures reflect the mixed perceptions on what constitutes a healthy
or “medium” body size. As mentioned earlier, eating properly was often seen
in relation to changes in body shape. In addition to mixed perceptions of the
ideal body image, rural-to-urban migrant women also attributed a wide range
of different causes to weight gain. Some migrant women linked weight gain to
street foods and edible vegetable oil intake, while others did not have a
specific food in mind. There was also much confusion on the topic. The
question asked by many was why some are bigger than others within their
community. The following quotation exemplifies this confusion:
“M: What do you think influences one to have a big body?
P5: When one eats fatty foods. You find that someone eats too much meat.
M: Does eating too much meat make one fat?
P5: Yes as well as chips. M: Is there anything else that can contribute to having a big body? P2: Let me add to that. Sometimes heredity; you find that one is born with a big body and as you grow your body continues to be like that. Take me for example; I don’t eat meat or the chips that people are talking about all the time. In fact, I can take a whole month without eating chips, but my body is big.”
(Viwandani PHV, P2: age 24, 4-years residence, P5: age 34, 3-years residence)
This led to some of the participants believing that food was not linked to weight
gain, as one migrant woman illustrates:
“You know, nowadays you cannot be certain about the causes of people’s weight gain because nowadays people are injected with drugs. You may find that one is fat, and it is not because of eating; no. It may be because of the injections. You may find a healthy person; she has a very thin body, but she always eats smart. So I cannot say that [laughs], you cannot say that you will eat smart so that you may get fat; no.”
(Korogocho IDI 06, age 30, 5-years residence)
Based on their own experiences, many participants came to the conclusion
that one does not only have to eat fatty foods to gain weight. Some participants
pointed towards family planning methods for example. Hence, there was much
uncertainty among the participants concerning the determinants of weight
gain.
186
7.2.6 Changes in information environment
Sectoral influences such as the healthcare system, and media played a distal
but important role in raising awareness and knowledge among the participants
and explained much of the inter-individual differences. In the rural area,
women spoke about having limited awareness of healthy diets and nutrition,
where there was low exposure to media, and limited access to healthcare.
Many mentioned the requirement to have a balanced diet which was a concept
they returned to in all interviews. When rural-to-urban migrant women got a
job and more income they desired to have a balanced diet. Some participants
learned about this concept in primary school back in the rural area, while
others heard about it after arrival in Nairobi through the media, clinic or
hearsay within their community.
In the rural area, knowledge of a balanced diet depended on the individual.
One rural-to-urban migrant woman from Western Kenya mentioned that
people were not thinking about a balanced diet in the rural area:
“P: We never used to think about that. When you are in upcountry you eat what has been served. You don’t have to think about a balanced diet; I have come to see that here.
M: What was preventing you from eating a balanced diet in upcountry yet here you try to adhere?
P: Here if for instance you go to hospital, you will be told the things you are supposed to eat or you learn by yourself. You are told you are supposed to eat this and that. In upcountry there is nothing of the sort. In upcountry you just eat.”
(Kibera PHV, age 25, 6-years residence)
For many, in the rural area it was a matter of what was available and tradition
which would drive food acquirement and intake. However, in the urban area
the participants felt that it was necessary to have a balanced diet due to the
dietary and lifestyle changes. The majority mentioned a balanced diet to
include protein, carbohydrates and vitamins. There were however inter-
individual differences on the interpretations of a balanced diet. Some women
said that just the ability to change their food daily would be a balanced diet.
One rural-to-urban migrant illustrates this by saying the following:
187
“If you have the ability you will balance. You will say today I have eaten rice, tomorrow I will cook ugali [cornmeal].”
(Korogocho PHV, age 29, 5-years residence)
Hence, a balanced diet was not necessarily associated with the health aspects
of food groups. Having a balanced diet stood for many as a varied diet. There
was no consensus on which foods were part of a balanced diet. Most
mentioned just a few food groups, often with vegetables being included. One
nutritionist in Viwandani mentioned many of them learning about a balanced
diet in primary school.
Regardless, they would either forget or misinterpret his:
“There is ignorance and a lack of information. Even people who are educated up to form four [high school] cannot tell what a balanced diet is, or she does not know where the proteins are taken from. She cannot tell you as she says that she has forgotten. If you ask what kind of food she is eating, she will tell you that she is eating bananas plus spinach. When you ask her what spinach does, she says that it builds the body. That is what she tells you. When you ask her about potatoes, or any other food, she tells you that it also builds up the body. So, you see that it is ignorance because these things she knew them even when she was in school. But now she has forgotten this.”
(Viwandani KII 02, clinical nutritionist)
Most of the rural-to-urban migrants’ awareness and knowledge about healthy
diets and body image were shaped by the healthcare system. Participants
who were struggling with a disease, or were pregnant, had access to nutrition
and health information:
“If you are in upcountry truly you are strong but when we came here, you increase growing fat, you wonder is it these salads [edible vegetable oil] or what? The chips, you see, when you go to the doctor you are forbidden, you are told you are eating a lot of fat.”
(Kibera FGD 01, age 33, 23-years residence)
The source of messages concerning diet and nutrition carried much weight
among migrant women. Women mentioned taking up messages from health
institutions and regarded them to be important and trustworthy. One
participant valued the clinics advice more than that of her friends’.
188
Also, the way the message was conveyed seemed to carry much importance
as one participant illustrates:
“There are those nutritionists who go around educating people. I think they are liars because I get very shocking information… They have a lot of negativity. They keep saying eating this or that will cause this, like spinach could have something. So, you wonder what you will eat. Like tea leaves will give you cancer for example… I just ignore them because if they say that everything is bad, what can I do? Should I starve?”
(Viwandani FGD 01, age 40, 10-years residence)
Rural-to-urban migrant women mentioned having heard and read about diets
and nutrition in the newspaper, on the radio and television. They
predominantly talked about television programmes, which focussed on
healthy cooking methods and balanced diets:
“Nowadays in other radio stations they air health programs. Even on the television, like Citizen, there is something. On Mondays, you get what is called ‘Dokezo la Afya’ (health tip). It airs issues of 'hisia na maumbile' (feelings and body structure/shape) on how you are supposed to be living and that you should be eating this kind of food.”
(Korogocho PHV, age 39, 4-years residence)
Key informants confirmed this, and mentioned that both rural-to-urban migrant
and non-migrant women were watching television programmes which
educated them on diet and health issues:
“In many cases you will find that they access the TV’s, even from the neighbourhood. They are interested to hear on the health issues, which affects most women. Once you they see such a thing, they do not want to be how they look like, and they want to hear what it is. So these women are there and they are interested.”
(Korogocho KII 02, community nutritionist).
A few of the richer participants reported having access to the internet and
being part of social media (e.g. WhatsApp groups) which informed them about
healthy eating. One participant confirmed the KII’s statements that there is
interest in health and diet promotion:
“I am a Facebook fan as well as WhatsApp groups. In these forums, someone might share or forward some messages creating awareness about diseases e.g. cancer and what causes cancer or diseases like hypertension and the foods associated with these foods (…) I am a fan of internet and sometimes you will find articles on healthy eating. Documentaries contribute as well.”
(Kibera IDI 07, age 28, 2-years residence)
189
Another source of information which was mentioned to be influential were the
weekly gatherings at the church. While religion was not mentioned to be an
important explanation for variation of diets within slum neighbourhoods, some
participants did bring up church gatherings to raise awareness on the need to
reduce weight and increase fruit and vegetable intake.
However, many of the participant narratives’ suggested that while they
increased their nutrition knowledge and became more aware of body image,
they were either having a hard time changing their dietary behaviour and/or
losing weight due to the different environmental influences. This was paired
with ineffective messaging of nutrition and dietary promotion.
Sporadically there were nutrition and cooking promotion seminars and Bora
Afya (volunteering groups teaching on healthy diets) within the slums which
focussed on prevention of diseases. However, the participants’ narratives
seemed to indicate that migrant women only had the intention to change when
in touch with disease. This was illustrated by one of the KI:
“Maybe somebody migrated from the rural area when they were young, every day we need to stress them to change their lifestyle, even though they come and the type of foods which are junk are a bit cheap (…). The only problem we have is people only seek for information when they are in it. For example, when there is a community mobilisation, people are passing and will just look at them and say: “Oh! What are they doing?” and then they pass by. So, you find they care much about what happens until I am affected that is when I will look for that information with more determination.”
(Kibera KII 02, community nutritionist)
190
7.3 Discussion
The aims of the qualitative phase of my research were to explore the social,
cultural and environmental context in which nutrition transition among rural-
to-urban migrant women occurred, and to examine their experiences and
perceptions on their current food environment, and changes in diet.
The majority of women in this sample migrated to Nairobi to look for economic
opportunities which aligns with previous literature (International Organization
for Migration, 2015; Zulu et al., 2011). There is also a similarity to this study’s
participant sample and the sampled populations of the Nairobi Cross-sectional
Slums Survey 2012 on multiple socio-economic and demographic
characteristics. The NCSS survey was held in eight of Nairobi’s slums
(including Kibera) (African Population and Health Research Centre, 2014). A
large proportion of rural-to-urban migrant women in this group had attended
at least primary school (42,7%) or secondary school (49%). In the NCSS
survey a third of adult women had completed primary education (31.3%), and
more than half (50.5%) had secondary education or higher. Further, in both
my study sample and the NCSS sample a large proportion of women were
married. In my sample 20.8% never married, in contrast 64.6% who were
married in comparison to 27.9% and 60.6% respectively in the NCSS survey
(African Population and Health Research Centre, 2014). Noteworthy is a
strong contrast between this sample and the NCSS survey for occupation.
Around one-fifth did not have IGA (19.8%) in comparison with 51.7% who did
not have IGA in the NCSS survey (African Population and Health Research
Centre, 2014). The NCSS survey did not contain information on monthly
expenditures. The proportion of migrant women who spend more than 100
USD (53.1%) is substantially higher than the proportion of respondents in the
NUHDSS analysis (5.7%) (Chapter 5.4.1).
7.3.1 Nutrition transition
This analysis showed that rural-to-urban migrant women retained aspects of
their rural diet, whilst adopting new foods and preparation methods typical of
their new food environment. Generally, rural-to-urban migration was
accompanied by an increased intake of street food, ASF, and a decreased
intake of traditional food (e.g. vegetables, roots/tubers), depending on origin
of migration. The participants had incorporated a wider range of starchy staple
food, and they diverted towards the cheaper and widely available “urban
vegetables” cabbages and kales. In addition, migrant women switched from
191
milled flour to refined packaged flour. Measurements of food supplies globally
indicated refined grains to contribute a lot to increased energy-intakes
(Drewnowski and Specter, 2004). Accessory foods such as edible vegetable
oil, herbs and spices were incorporated by all participants. Generally, migrant
women adapted to the way that local residents within their respective village
neighbourhoods were eating. This could be described as obesogenic due to
the inclusion of obesogenic street and fast food and increased use of edible
vegetable oil.
These findings are consistent with previous qualitative and quantitative
internal and international rural-to-urban migration studies which have
highlighted bi-cultural diets, including an increased intake of processed
energy-dense foods among migrant women (Cockx et al., 2018; Garnweidner
et al., 2012; Osei-Kwasi et al., 2017; Regev-Tobias et al., 2012; Unwin et al.,
2010). Moreover, the wider Nairobi and SSA literature has emphasised street
(and fast food) to constitute an important part of the slum residents’ diet
(Goudet et al., 2017; Kimani-Murage et al., 2014; Steyn et al., 2016).
Interestingly, many similarities with the Koctürk model for dietary changes with
migration were noted as staple foods seemed to change last due to their
cultural importance. The use of herbs, spices and oils was adopted by all
participants as these enhanced the taste of complementary foods such as
urban vegetables which were not especially tasty (Kockturk-Runefors, 1991).
There were also key changes in meal timing and food preparation methods
which were illustrative of the city life. Overall, women said that it was essential
in Nairobi to have breakfast. Dinner was however still the most valued meal
of the day. Lunch was less important for most of the participants. Rural-to-
urban migrant women often consumed street foods during breakfast and
lunch, predominantly due to a perceived lack of time, income or absence of
family members during the day. Hence, they did not perceive it to be cost-
effective to cook for themselves. Participants who had a bit more money to
spend on food also started snacking. This is a meal pattern which was not
common in the rural area. Other qualitative SSA rural-to-urban migrant studies
in Cameroon and SA also observed that with migration, eating occasions are
more individualised and consists of snacking behaviour (Cohen et al., 2017;
Puoane et al., 2006). This is also a worrying pattern, particularly in context of
poverty where community cooking and sharing could be good coping
mechanisms.

192
7.3.2 Environment-individual interactions
This analysis highlights that the adoption of obesogenic dietary behaviour is
influenced by an interplay of economic, physical, socio-cultural, and
information environmental characteristics. Some of these environmental
characteristics were perceived by the participants to have a more prominent
influence on certain aspects of nutrition transition than others.
7.3.2.1 Changes in food environment
Economic and physical characteristics of the new food environment were
perceived by the participants as a driver of nutrition transition (e.g. obesogenic
and traditional food intake). This may perhaps be an obvious finding as
women switched from a farming to a cash-based food system where there is
little opportunity to engage in agriculture.
Indeed, in general, non-market food sources such as urban agriculture or
rural-urban remittances did not seem to play a considerable role in the
participants’ diets. Migrant women in the PHV sessions provided multiple
explanations, including a lack of space and contamination, for not engaging in
urban agriculture. These findings are in accord with other Nairobi research
which found a lack of space to be an important barrier to urban agriculture in
slums (Crush et al., 2011). A study in Kibera found several benefits of an urban
agriculture technique named sack gardening which would mitigate this barrier.
Rural-to-urban migrant women did not mention any engagement sack
gardening. In this study, one of its benefits was an increased intake of
traditional/indigenous food intake (Gallaher et al., 2013). As for rural-urban
food remittances, one possible explanation may be that most participants in
this sample were already involved in income-generating activity and/or were
in the higher expenditure groups. Furthermore, many migrant women
originated from regions farther away from Nairobi. Migrant women said that
this did not allow for frequent remittances which is in accordance with previous
SSA literature. Studies in rural context observed rural–urban food remittances
to occur less frequently between rural areas and the Capital city in comparison
with secondary cities (Djurfeldt, 2015). An AFSUN survey on urban food
security in 11 Southern African cities showed that approximately 5% of urban
households received food from the rural area at least once a week and only
40% of urban households received food at least once or twice a month. In
addition, a large percentage of remittances concerned starchy staple food
(Frayne et al., 2010). One of the key informants in this study did however
193
suggest migrant populations in Kenya who migrated from neighbouring
counties to have a more diverse diets. This deserves further scrutiny.
Some participants said there was consistent temptation to eat both sweet and
fatty food, either due to the neighbours’ cooking or the abundance of street
food vendors within their village, work food environment and on the commute
between work and home. Previous rural-to-urban migration studies have also
reported the availability of obesogenic foods to be an important influence on
women’s post-migration diet (Bojorquez et al., 2014; Stern et al., 2010).
Cooking was often perceived to be unaffordable, or not worth spending money
on, even among the wealthier participants in terms of monthly expenditures.
A previous study in the Korogocho and Viwandani slums aligns with these
findings as the participants considered street foods to be cheaper than
cooking as they had to buy raw food and fuel which turned out to be expensive
(Kimani-Murage et al., 2014). As was the case in this study, paraffin or
charcoal stove was the main method for cooking. However, cooking on a stove
with gas or electricity which were faster were also more expensive or
perceived to be dangerous as they had no experience with this.
Particularly noteworthy was the seemingly automated influence of the physical
environment on obesogenic food intake irrespective of the individual and/or
households material wealth (cooking tools and storage). When probing why
they resort to street food intake, some participants explained that often mere
availability of ASF and street foods triggered intake. Behaviour can be the
result of direct 'automatic' responses to environmental cues, in which they do
not utilise cognitive effort, elaboration or capacity engaging in a particular act
(Kremers, 2010). Some studies have found this potential association between
the food environment and the individual’s dietary behaviour in HIC settings
(Jilcott et al., 2009). There is limited mentioning of this in the migration
literature. In context of obesity and the built food environment these
automated pathways have however gained support in a multitude of
disciplines including behavioural economics and social psychology (Cohen,
2008; Drewnowski and Kawachi, 2015).
Poor access to main markets was a main barrier to traditional food intake and
diverse fruit and vegetable intake. The barriers reported by participants build
on the suggestion made by Owuor et al. (2017) in a recent report on Nairobi’s
urban food systems. A lack of money for transportation impedes poor
consumers from purchasing a greater variety of food products from food
sellers that were outside of walking distance. Therefore, the degree of nutrition
transition (e.g. high intake of obesogenic food, and reduced intake of
194
traditional food) seemed to be intertwined with spatial factors. Wealthier
migrant women were living in a slum village in which food supply was partly
shaped by the poorest and therefore shapes an abundance of cheap foods.
Furthermore, many wealthier migrant women lived on the outskirts of slum
neighbourhoods and had access to larger obesogenic food portions at the
neighbourhood convenience stores or supermarkets (smaller retail versions)
(anecdotal evidence; Owuor et al. (2017). There is spatial inequality due to
the geographical position of some villages within slum neighbourhoods.
Unequal access to food sources outside of their villages had consequences
on traditional food intake, fruit and vegetable portion sizes as perceptions of
cost- and time-effectiveness turned out to be particularly important in their
food decision-making. Previous literature stated long distances to the market
to be a problem in rural areas (Herforth and Ahmed, 2015). This is however
also an issue in the urban environment as some participants mention
wholesale and/or wet markets to be at a one-hour walking distance from their
home. Therefore, conditions in terms of travel distance did not necessarily
change with rural-to-urban migration.
Supermarket (smaller versions) visits were only sporadically undertaken.
Some participants reported having access to several supermarkets on the
outskirts of the slum. However, in agreement with the wider SSA literature,
these are smaller versions which seem to sell cheaper energy-dense food
products and do not give much access to (affordable) fresh produce
(Battersby and Crush, 2014; Demmler et al., 2017; Kimenju et al., 2015).
Another key recurring theme was food safety and the poor state of their food
environment in terms of unhygienic growing and selling conditions. The
participants felt discouraged to eat (traditional) staples and vegetables or cook
and prepare food at home. Due to economic constraints some felt they had to
accept it and get used to the new conditions. To the best of my knowledge, no
internal rural-to-urban migration studies have investigated or identified
perception of food safety as a determinant of dietary change post-migration.
This may not come as a surprise as previously studies may not have recruited
migrants from slum areas which are characteristic for having poor water and
sanitation conditions (United Nations Human Settlements Programme,
2016b). Another more recent study which investigated the perception of
mothers on child undernutrition in the same slum communities (Korogocho
and Viwandani) also showed WASH (water, sanitation and hygiene) to be an
important risk factor on health (Goudet et al., 2017). However, through the
195
eyes of the migrant women, urban non-migrants were used to the situation
and/or did not perceive there to be any risks.
As for street foods, participants shared concerns about the use of sodium
carbonate (magadi in Kiswahili), a lack of transparency, and unhygienic food
preparation practices. While it led to some avoiding street foods, most did find
a street and/or fast food seller who they approved of. And some had to resort
to these out of economic necessity. A previous study in the Korogocho slum
found safety and health to be frequently mentioned as a reason why urban
slum residents did not buy street foods (van 't Riet et al., 2001). In this study
they did not distinguish between migrants and non-migrants. This suggests
that it might be a more common opinion in the slums. However, some of the
participants observed clear differences between them and urban non-migrant
women in their attitude towards the unhygienic conditions of street foods. In
addition, many participants also took a negative view of food quality in the
urban area. This may well be more a response to the cultural meaning these
foods had for migrant women as rural foods differed in cosmetic appearance
(Bojorquez et al., 2014). Food safety is getting increased attention in LMICs
as an important pathway between the informal food environment and
individual’s traditional food intake (Food and Agriculture Organization of the
United Nations, 2016; Global Panel on Agriculture and Food Systems for
Nutrition, 2016). The pathways described by the participants align with the
proposed pathway between unsafe food in the food environment and
decreased intake of nutritious (traditional) food. Migrant women reported that
they would eventually overcome these food fears or avoid
unsafe/contaminated food in its entirety and substitute these with (ultra-)
processed food such as bread or other vegetables (Food and Agriculture
Organization of the United Nations, 2016).
A previous study in non-slum areas of Nairobi investigated consumer
willingness to pay for safer vegetables (kale) in urban markets. Here they
found a positive association between hygiene and safety, and a willingness-
to-pay for kale at the roadside and traditional open-air market. However, the
willingness-to-pay for food safety among consumers was lower at traditional
markets than high-end market outlets, as to be expected given these
consumers had lower incomes (Lagerkvist et al., 2013a). A later study by the
same authors found that consumer experience with farming was the most
important determinant of perceived risk of street and open-air market food
(Lagerkvist et al., 2013b). However, these studies did not report participant
migration background. Apart from these studies, evidence on the consumer’s
196
awareness and perceptions towards food safety and hygiene in both Kenya
and wider SSA is limited (Alimi, 2016; Global Panel on Agriculture and Food
Systems for Nutrition, 2016; Ruel et al., 2017). Whereas access to the main
wholesale or wet markets should be improved, traditional markets in informal
food economies typically have poor levels of hygiene and sanitation,
something which was noted as well by the participants (Global Panel on
Agriculture and Food Systems for Nutrition, 2016).
In the present study, there were mixed attitudes towards the changes in food
environment, depending on the area they migrated from. While many women
were satisfied with the shorter travel times to get a more varied diet including
ASF, several had a negative attitude towards the safety and quality aspects
of food in the urban environment. In addition, the inaccessibility of food
sources such as from the main market was perceived to be a barrier. There
are currently very few studies which have examined the perception of internal
migrants on the food environment. One exception is a recent intra-SSA
migration study among Congolese, Somalis and Zimbabweans in Cape Town
that explored their perception of the changes in food environment. A lack of
affordable and accessible nutrient dense foods were highlighted among the
participants. They also found certain food sources beyond walking distance to
be inaccessible (Hunter-Adams, 2017). Whereas availability of food was not
a key issue among the participants in my qualitative study, a lack of affordable
and accessible traditional food was.
7.3.2.2 Changes in economic circumstances and time scarcity
Changes in the economic circumstances with rural-to-urban migration were
perceived by the participants to be instrumental in their changes in diet. As
presented in other rural-to-urban migration studies, getting a job and having
an income is regarded as an important determinant of dietary change post-
migration (Bojorquez et al., 2014; Puoane et al., 2006; Stern et al., 2010). The
findings of this study support a recent panel study among rural-to-urban
migrants in Tanzania. This study concluded that a substantial part of the
impact of migrating to an urban area on differences in dietary behaviour (oils
and fats, ASF and dietary diversity score) was related to income differences
between rural-to-urban migrants and rural non-migrants (Cockx et al., 2018).
With migration there was food insecurity. Even though food security was not
formally measured in my sample, previous studies in Nairobi slums have
observed that less than one in five households are food secure (Faye et al.,
197
2011; Kimani-Murage et al., 2015b). The participant excerpts did indicate that
women with lower monthly expenditures were most at risk of food insecurity
as some had to skip meals to feed their children. Most women in this sample
had relatively more to spend, however none of them had consistent access to
the food they desired (e.g. safe and diverse), which was especially limited
shortly after migration when they were still looking for jobs. Inconsistent results
exist on the association between different forms of food insecurity and
overweight/obesity in LMICs, and comparison of these studies is challenging
due to the different measures used in different contexts. In the USA severe
food insecurity is associated with underweight (Martin and Lippert, 2012). In
line with statistics from the Kenyan National Bureau of Statistics (KNBS), most
participants migrated in search of opportunities and, depending on where they
migrated from, became relatively more food secure due to the availability of
cheap street foods (Kenya National Bureau of Statistics, 2010). The adoption
of prepared obesogenic food intake was accelerated after migration due to the
lack of income and cooking tools. Constant availability within proximity of the
home made this food purchasing pattern become a strong habit post-
migration.
In addition to spatial mismatch for economic opportunities, one of the KI’s
highlighted the influence of community gender roles on IGA. This turned out
to be an important structural driver of obesogenic dietary behaviour. The
participants’ narratives insinuated that they engaged in food enterprise
activities as these are driven by gender expectations within communities.
While this may well be a mitigator to food insecurity, it also had implications
for obesogenic food intake (Floro and Bali Swain, 2013). Selling of fatty street
foods was preferred as this was experienced to be most profitable due to the
high demand for fatty and convenient food by the local community. Rural-to-
urban migrant women, particularly single mothers, said to be also under time
pressure as they combined (unsteady) work and incomes with household
chores, which did not allow them to cook regularly for their families. These
findings are consistent with other migration studies, and a wider SSA
literature, which consistently shows that busier lifestyles come at the cost of
time reserved for preparing (traditional) food at home (Bojorquez et al., 2014;
Goudet et al., 2017; Ruel et al., 1999; van 't Riet et al., 2003). The participants
mentioned that the rural lifestyle allowed them to better plan this due to
different preparation methods (e.g. using firewood and cooking larger portions
for multiple days). Indeed, time became an increasingly important with
engagement in IGAs post-migration as this meant that women worked long
and irregular hours. This change of perception went rapidly. Illustrative is that
198
rural-to-urban migrant women had a positive attitude towards the changes in
travel times (both with and without a farmer’s background). This is not new.
Previous internal and LMICs to HIC migration studies among African
immigrant women have observed this pattern as women would get engaged
in IGA (Bojorquez et al., 2014; Ngongalah et al., 2018; Renzaho, 2004).
With time scarcity, women also commented on feeling stressed and hence
preferred to acquire pre-prepared food. The function of stress in the food
choices-obesity relationship is receiving increased attention in SSA literature
and may lead to a better understanding of the differences in responses on
diets between different groups (Scott et al., 2012). A recent review theorised
that stress could be an important mediator of unhealthy weight gain in migrant
groups due increased food intake, as well as potentially physiological effects
of stress on metabolism. There is however little current evidence available
(Murphy et al., 2017). When participants cope with feelings of stress, they
redefined meaning and reduced expectations for food and eating. They also
set priorities and traded off food and eating against other family needs. A
structural driver of this could be feelings of safety. Though neighbourhood
security was not represented in this qualitative study as a key theme, migrant
women did sometimes mention security to play an important role in relation to
their children and pre-prepared food intake, or travel to the wholesale or wet
market which was perceived to be unsafe due to high grass and snakes. A
lack of safety is an important theme in urban slum context due to the presence
of criminal gangs and lack of infrastructure such as lighting (Corburn and
Sverdlik, 2019; van de Vijver et al., 2015).
7.3.2.3 Integration in the village community
The physical and economic influences on nutrition transition were tightly
interwoven with changes in their socio-cultural environment. This was
apparent in frying instead of boiling foods, shifting of meal patterns and desire
for high value foods such as ASF and chapatti. Previous qualitative studies of
internal migrants have shown changes in social relationships and the existing
norms in the city to influence on women’s food intake and preparation
methods (Bojorquez et al., 2014; Puoane et al., 2006; Stern et al., 2010). The
importance of the family and wider village community on nutrition transition
came to light here through processes of social contagion and pressure.
One key perceived social influence on changes in diet were children’s food
preferences which interacted with economic and physical environmental
199
influences. This is a factor which has consistently been found to be important
on migrant women’s diet in other studies (Bojorquez et al., 2014; Garnweidner
et al., 2012; Mellin-Olsen and Wandel, 2005). Women in the present study
often had to consume the same foods as their children as they either would
not have had the means to buy the food they wanted to eat or felt it to be a
waste of money if they had to throw food away due to a lack of proper storage
possibilities. These findings align with the sacrifice theory as migrant women
resort to obesogenic food intake to nourish (and appease) their children
(Franklin et al., 2012). There was a different situation in the rural area as
children would eat what was being given to them. This was often emphasised
as a social factor, but also a lack of economic means and absence of food
variety. This is consistent with the findings of a recent qualitative study
conducted in Addis Ababa, Ethiopia. Here mothers (including those of low-
income) adopted a child driven diet, often out of fear that they would not eat
anything at all (Berhane et al., 2018).
Many migrant women settled in village communities within the slums where
their ethnic group was the dominant one. Even women of different ethnic
groups started incorporating foods from the dominant ethnic group in the
village as these were widely available. Within this context there was only
limited access to supermarkets and the main food markets (e.g. wholesale
and wet markets). Hence integration was facilitated quickly. As mentioned
earlier, migrant women maintained their intake of some foods prior to
migration (particularly staple foods). However, most of the food products they
purchased reflected those from their village. In my sample it also became
apparent that there was a good deal of exchange between different ethnic
groups in heterogeneous villages. Indeed, past literature has highlighted that
major ethnic groups may coexist (van de Vijver et al., 2015). This is a pattern
that has also been noted among rural-to-urban migrant women in HIC. As is
the case in this study, the dietary culture in the destination of migrants is not
as homogenous as is sometimes assumed. Instead, it consists of a mixture of
food traditions with the consequence of having bi-cultural dietary patterns
post-migration, especially among second generation migrants who may be
less attached to their traditional food (Bojorquez et al., 2018; Ngongalah et al.,
2018). Generally, there is limited evidence that distinguishes the associations
or influences of migration on diets by ethnic background. Based on the
interview accounts, rural areas in Kenya were ethnically homogenous, where
rural-to-urban migrant women had ethnic traditions, with no clear indication of
this changing.
200
The interviews revealed social pressure to be an important mechanism
between their new community environment and obesogenic food intake,
traditional food preparation, and body image perception. Participants believed
that other people within the village may evaluate them negatively as they
differentiate themselves from the community. Furthermore, based on the
participants’ narratives there seemed to be a process of mirroring/copying as
migrant women adapted to the community’s dietary behaviour through family,
peers and other community members with the absence of any pressure felt.
In addition, migrant women aspired to consume foods (e.g. ASF and pre-
prepared starchy obesogenic food) which were held in high regards within the
community. As for pre-prepared food, due to economic and physical factors
these were up taken shortly after migration and seemed to be normalised
within their community village. Some participants and/or their husbands
moralised these foods however as these were associated with laziness or
were seen as an unhealthy replacement for home cooking.
One aspect of changing dietary behaviour to highlight was the increased
intake of edible oil. Their edible oil intake increased substantially as women
either felt pressured to fry their foods, found it very tasty, or found it
challenging to maintain food preparation for economic and spatial reasons.
These changes in food preparation methods may not come as a surprise. This
has been well established as one of the main components of nutrition
transition in SSA and other LMICs and has been coined as one of the key
contributors to higher caloric diets and higher trans-fat intake (Gupta et al.,
2016; McHiza et al., 2013; Popkin, 2015; Steyn et al., 2014). In addition to the
adoption of cheap energy-dense street food and fast foods/beverages with
increasing money available, this is worrying in relation to obesity risk. Long-
term dietary exposure to sugar and fat may have permanent metabolic
consequences on the individual (Drewnowski and Specter, 2004).
During this study, social support to and from food sellers (often their friends)
kept returning as an important driver of food source choices. While this is not
an influence inherent to migration as migrant women reported similar social
mechanisms in their rural area, it may have implications for market visits as
market sellers could not function as social and economic safety nets. Whereas
some migrant women did mention it to be an important factor to access food,
it may also limit their freedom to pursue other food source options. The social
support and economic resources interacted in complex ways in their food
source decision making. Its connections with economic influences, and lack
of economic institutions was apparent.
201
Illustrative of the double-edged nature of social support may well be the
engagement in social safety nets post-migration which allowed women to deal
with household budget tensions and allowed them to acquire food in bulk.
Although this was a good mitigator of mild and severe food insecurity it did
however also encourage purchasing starchy energy-dense food and
condiments such as maize meal, sugar and oil for reasons of socio-cultural
nature, palatability and storage.
As for body image perception, while there were mixed attitudes and
perceptions towards changes in weight and the ideal body image, larger body
shapes seemed to be preferred. Generally, participants perceived a larger
body to be sign of the husband taking good care of her and having a stress-
free life. Some also felt that they would gain respect by the community if they
would have a larger body image. These reflected body ideals of both the
village and rural area. Migrant women mentioned their body size was fine as
long as they were able to remain physically active and feel strong. This is in
line with a recent mixed methods study in urban Senegal where rural-to-urban
migrant women shared the socio-cultural value of being overweight. They
observed overweight to be highly valued among rural-to-urban migrant women
for similar reasons highlighted by the participants in my research (Cohen et
al., 2017).
A noteworthy finding was that women felt they had to retain the same body
shape after having gained weight with marriage. Any weight gain or loss after
this point was not desired as this would lead to negative feedback from others
in the community. Specifically, whereas losing weight was associated with
disease, gaining weight was also an issue as it was linked to using ART for
HIV. Linkages between HIV and body image trace back a couple of decades
and could have contributed to the preference for a big body size among sub-
Saharan Africans and among migrants from sub-Saharan Africa who find
refuge in developed countries (Matoti-Mvalo, 2006; Renzaho, 2004). More
recent qualitative studies from South Africa found similar patterns as three
quarters of the girls associated thinness with ill health particularly HIV and
AIDS, and tuberculosis (Okop et al., 2016; Puoane et al., 2010).
Interestingly, some migrant women expressed the desire to lose weight after
having resided in the urban environment for a longer period as they started to
feel weak and noticed health issues. Some migrant women said that there
was a shift in community body ideals towards slimmer body images within their
respective villages due to a growing awareness and prevalence of diet related
NCDs. These findings are consistent with qualitative findings from another
202
urban study in Senegal noted a shift as well towards slimness, in this case
amongst the younger urban women (Cohen et al., 2018). Overall, the findings
reflect the results of a review on body image perception in African countries.
The authors highlighted there to be differences between body image
perceptions between rural and urban residents. Rural residents favoured
larger body images. Within urban areas there were mixed body ideals (Toselli
et al., 2016).
7.3.2.4 Nutrition and diet awareness with rural-to-urban migration
With rural-to-urban migration there was also an increased awareness of
nutrition, diet and disease. While price, affordability, time, food safety and
socio-cultural aspects were important for rural-to-urban migrant women,
health and nutrition became increasingly important to their food-decision
making. There were however misconceptions regarding diet. While the
majority of migrant women regarded a balanced diet to be healthy, their
interpretation of what constituted a balanced diet was not consistent. Several
participants believed that this was characterised by a heterogeneous diet.
Healthy eating was also perceived as eating a variety of meals, and not the
same meal twice a day, and not more than three times a week. One study in
urban Cameroon found similar findings. Most of the interviewed women had
heard of healthy and/or balanced diets. There were similar mixed responses
as to what this constituted, with some defining a balanced diet as one that
consist of elements of all food groups (Kiawi et al., 2006).
One of the key transitions with rural-to-urban migration was the shift from
boiling to frying of food as edible oils became affordable, widely available and
culturally desired. In one recent study in Accra, Ghana researchers examined
the lay understanding of healthy and unhealthy food practices among male
and female residents of three poor urban communities (including one slum
community). One of these communities predominantly consisted of rural-to-
urban migrants. Interestingly, they found foods which were processed and
fried less healthy than the traditional Ghanaian diet due to the excess of oil.
The participants do however comment that pre-cooked food such as instant
noodles and fried rice became popular foods due to their taste (Boatemaa et
al., 2018). In my research, there were mixed perceptions on frying of food and
health or weight gain. Migrant women who were aware of the mechanisms
between fried food, excess oil and health had received this information from
health clinics. Overall, there appeared to be confusion about the association
203
between diet and body shape. Some migrant women did associate fatty street
foods and oil use with weight gain.
Access to the healthcare system was identified to play an important role
among the participants who showed awareness of healthy diets and body
shape. In addition, with migration there was increased exposure to media such
as the television. While there is a scarcity of information on the role of
increased awareness with migration on dietary outcomes, several urban SSA
studies have investigated the nutrition-related broadcasting from major
sources of information. A multi-methods study in urban South Africa found that
almost three-quarter of urban women were receiving nutrition information from
the media (television and radio), which was then followed by friends and
family. Obtaining health advice from a health professional was the most
credible information source according to the participants (Charlton et al.,
2004). However, healthcare for obesity and NCDs is not always accessible or
equitable in these communities which may explain the variety in knowledge
and awareness amongst participants (van de Vijver et al., 2015).
In summary, while awareness of disease and healthy diets appeared to be
strong psychological drivers for willingness to change diets, due to the above
mentioned economic, physical and socio-cultural barriers, migrant women in
this sample found it hard to adhere to healthier diets and reducing their weight.
A few divergent cases did suggest there to be nutrition resilience as they were
diagnosed with disease. Nutrition resilience in the HIC literature refers to
achievement of high quality diets among people of lower socio-economic
status who have positive food-related attitudes and are able to achieve higher
quality diets despite the economic constraints they have (Aggarwal et al.,
2016).
7.3.2.5 Convenience
For most rural-to-urban migrant women, convenience played an important role
in the way they valued food. Convenience holds multiple meanings and is not
a clearly defined concept. It does usually involve making something easier,
saving time or mental effort at various phases of meal preparation including
planning, preparation, eating and cleaning up afterwards (Jackson and
Viehoff, 2016). Participants who had been in the urban area for a prolonged
period expressed their desire for convenience foods as they felt weak, lazy or
tired after work, in contrast to the rural area where they had a more active
lifestyle. Furthermore, participants also chose for convenience due to security,
204
feelings of tiredness, saving mental effort, and addressing preferences of
children. While the rural-to-urban migrant women who had more to spend
were able to afford convenience by acquiring their fruits and vegetables within
their community food environment pre-prepared obesogenic food intake was
encouraged due to its cheap price. This aspect of convenience deserves more
scrutiny in relation to socio-technological advancements, changing socio-
cultural norms (e.g. normalisation of pre-prepared food) and obesity risk
(Jackson and Viehoff, 2016).
7.3.3 Strengths and limitations
A main strength of this study was the combination of different qualitative and
PR methods which created a rich data set regarding nutrition transition among
rural-to-urban migrant women. The inclusion of the participatory method
PhotoVoice particularly enhanced the findings. Picture taking provided a depth
of participants’ perception of the food environment and how this influenced
specific dietary behaviours related to obesogenic and tradtional food intake.
This could not have been derived from the conventional interviewing methods
between participant and investigator. While only 17 participants were recruited
for the PhotoVoice study, dietary behaviours were selected which were
considered most important in context of nutrition transition. It is of note that a
review by Catalani and Minkler (2009) found 13 was the median number of
community participants in the 37 PhotoVoice studies included (with a range
from four to 122 participants). Furthermore, the overlap in picture selection
and (dis) agreement during the group discussions provided the opportunity to
gain a comprehensive view of the environment-behaviour interactions, and
extra topics were further explored during the discussions.
Another strength was that the data were collected in three slum communities
each with different socio-economic and demographic characteristics and
positioned in different geographical areas of Nairobi. Korogocho included the
poorest residents and a diverse cultural group. Viwandani is located next to
industries, and therefore provided the opportunity to interview women who
earned a monthly income. Kibera had a wealthier population group (in terms
of monthly expenditures) in comparison to the other slums, and multiple
participants worked outside of Kibera. Overall, more than half of the
interviewed women were in the highest expenditure group (>100$ per month)
reflecting income levels suggesting the vulnerable middle class as defined by
Tschirley et al. (2015).
205
My research also offered a contrast to the existing evidence by focussing on
a rural-to-urban migrant group which represents a greater heterogeneity in
socio-economic and demographic status. This study allowed the capture of
ethnic diversity within and between the slums. Each slum had different access
to food sources hence this was captured as well. The above enhances the
generalisability of the findings to slum communities elsewhere, but also
informs on the intra-slum differences for food access and socio-cultural food
and body image norms and values.
This qualitative phase to my research was not without limitations. One
limitation was the possibility that translation bias might have been introduced
as most interviews were conducted in “Kiswahili”. Translation is known to
potentially introduce bias through incorrect interpretations (Temple and
Young, 2004). To tackle this, translators were recruited with experience in
Kiswahili-to-English translation. Furthermore, note taking during the
interviews was performed by one of the research assistants for additional
control. Furthermore, it is important to bear in mind the possible bias in the
participants’ responses. Many who were interviewed had already been in
touch with the CHV/CHW and may be more aware of healthy diets. I aimed to
address this by prompting where they obtained their knowledge from.
Further, the set data collection period (from January to July) was a potential
limitation. The PhotoVoice sessions were held during the rainy season which
could have guided the participants towards environmental issues which did
not represent the daily routine. For example, for some of the PhotoVoice
participants, identified muddy roads as barriers to market access. This may
well have been different during the dry season as some of the participant were
living only a short distance from these sites.
Lastly, it would have been useful to categorise socio-economic status on
household assets rather than on estimates of monthly expenditure. Such
estimates are subject to recall bias, and monthly expenditures can be over- or
-underestimated (Hulme and McKay, 2013; Willett, 2012). Furthermore,
assets such as a refrigerator and television may strongly influence dietary
behaviour (Ruel et al., 2005; Steyn and McHiza, 2014). However, assessing
multiple assets would have been time-consuming, with the risk of tiring the
participant and cutting the interview short. Despite this limitation, socio-
economic status was reasonably well observed in participants’ educational
attainment, the type of IGA they engaged in, and their estimate of household
monthly expenditure.

206
Chapter 8 Overall discussion
In this chapter I combine and discuss the mixed methods findings. I describe
the integration and I present a perspective which amalgamates the
quantitative and qualitative findings, and the mixed methods meta-references.
I then present and discuss the meta-inferences derived from the integration. I
conclude this chapter by reflecting on the generalisability and transferability of
my findings, and the methodology and conceptual framework which I used in
my research.
8.1 Integration of findings
As I explained in the methodology chapter, I already connected the
quantitative and qualitative phases through sample selection and building
processes (interview guide development). I did discuss the findings of each
study In Chapter 4, 5 and 7 in their respective sections. However, I have yet
to discuss these findings in combination and consider the respective
implications in a broader context. I therefore combine the quantitative and
qualitative findings by using a joint display which is a widely used mixed
methods integration technique (Guetterman et al., 2015). As I mentioned in
Chapter 3, bringing the data together through visualisation may draw out new
insights beyond the information gained from the separate quantitative and
qualitative results. The technique allows a systematic comparison of the
quantitative and qualitative findings. This display may also facilitate more
credibility and validity to the analysis and develop meta-inferences
(Guetterman et al., 2015).
Table 8.1 highlights the key mixed methods findings and meta-inferences. In
this table I structured the quantitative and qualitative findings per key topic: 1.)
Nutrition transition among rural-to-urban migrant women; 2.) Characteristics
of rural-to-urban migrant women prone to have obesity and associated with
higher intakes of red meat, sugary drink, fruit and vegetables; and 3.)
Environmental context of nutrition transition among rural-to-urban migrant
women. In the first column of each topic the key quantitative findings are
selected and presented (Table 8.1). The second column presents the
qualitative findings. This includes potential interpretations of the quantitative
findings and presents an expansion on the environmental context in which
nutrition transition among rural-to-urban migrant women occurs (Table 8.1).
Some of the quantitative results and qualitative findings do not match due to

207
the inductive nature of the data collection. This is highlighted in the joint
display. The third column presents the meta-inferences derived from the
mixed methods findings (Table 8.1).
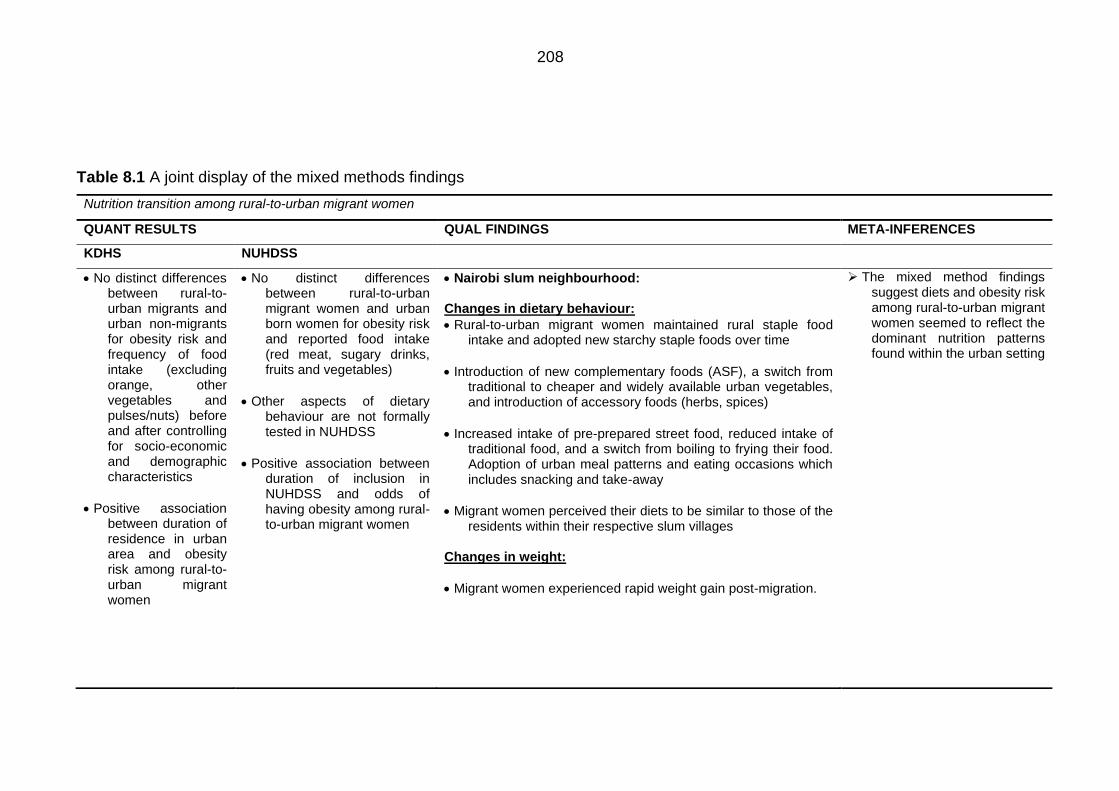
208
Table 8.1 A joint display of the mixed methods findings
Nutrition transition among rural-to-urban migrant women
QUANT RESULTS QUAL FINDINGS META-INFERENCES
KDHS NUHDSS
• No distinct differences between rural-to-urban migrants and urban non-migrants for obesity risk and frequency of food intake (excluding orange, other vegetables and pulses/nuts) before and after controlling for socio-economic and demographic characteristics
• Positive association between duration of residence in urban area and obesity risk among rural-to-urban migrant women
• No distinct differences between rural-to-urban migrant women and urban born women for obesity risk and reported food intake (red meat, sugary drinks, fruits and vegetables)
• Other aspects of dietary behaviour are not formally tested in NUHDSS
• Positive association between duration of inclusion in NUHDSS and odds of having obesity among rural-to-urban migrant women
• Nairobi slum neighbourhood: Changes in dietary behaviour:
• Rural-to-urban migrant women maintained rural staple food intake and adopted new starchy staple foods over time
• Introduction of new complementary foods (ASF), a switch from traditional to cheaper and widely available urban vegetables, and introduction of accessory foods (herbs, spices)
• Increased intake of pre-prepared street food, reduced intake of traditional food, and a switch from boiling to frying their food. Adoption of urban meal patterns and eating occasions which includes snacking and take-away
• Migrant women perceived their diets to be similar to those of the residents within their respective slum villages
Changes in weight:
• Migrant women experienced rapid weight gain post-migration.
➢ The mixed method findings suggest diets and obesity risk among rural-to-urban migrant women seemed to reflect the dominant nutrition patterns found within the urban setting
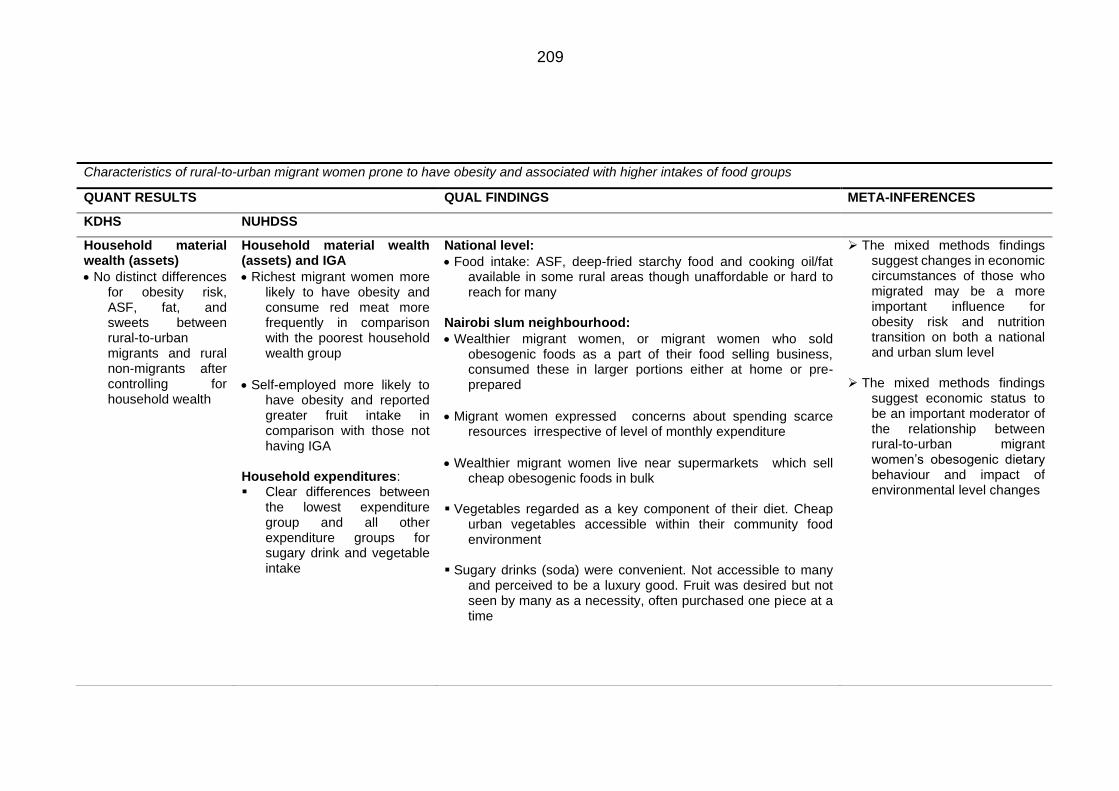
209
Characteristics of rural-to-urban migrant women prone to have obesity and associated with higher intakes of food groups
QUANT RESULTS QUAL FINDINGS META-INFERENCES
KDHS NUHDSS
Household material wealth (assets)
• No distinct differences for obesity risk, ASF, fat, and sweets between rural-to-urban migrants and rural non-migrants after controlling for household wealth
Household material wealth (assets) and IGA
• Richest migrant women more likely to have obesity and consume red meat more frequently in comparison with the poorest household wealth group
• Self-employed more likely to have obesity and reported greater fruit intake in comparison with those not having IGA
Household expenditures: ▪ Clear differences between
the lowest expenditure group and all other expenditure groups for sugary drink and vegetable intake
National level:
• Food intake: ASF, deep-fried starchy food and cooking oil/fat available in some rural areas though unaffordable or hard to reach for many
Nairobi slum neighbourhood:
• Wealthier migrant women, or migrant women who sold obesogenic foods as a part of their food selling business, consumed these in larger portions either at home or pre-prepared
• Migrant women expressed concerns about spending scarce resources irrespective of level of monthly expenditure
• Wealthier migrant women live near supermarkets which sell cheap obesogenic foods in bulk
▪ Vegetables regarded as a key component of their diet. Cheap
urban vegetables accessible within their community food environment
▪ Sugary drinks (soda) were convenient. Not accessible to many
and perceived to be a luxury good. Fruit was desired but not seen by many as a necessity, often purchased one piece at a time
➢ The mixed methods findings suggest changes in economic circumstances of those who migrated may be a more important influence for obesity risk and nutrition transition on both a national and urban slum level
➢ The mixed methods findings
suggest economic status to be an important moderator of the relationship between rural-to-urban migrant women’s obesogenic dietary behaviour and impact of environmental level changes
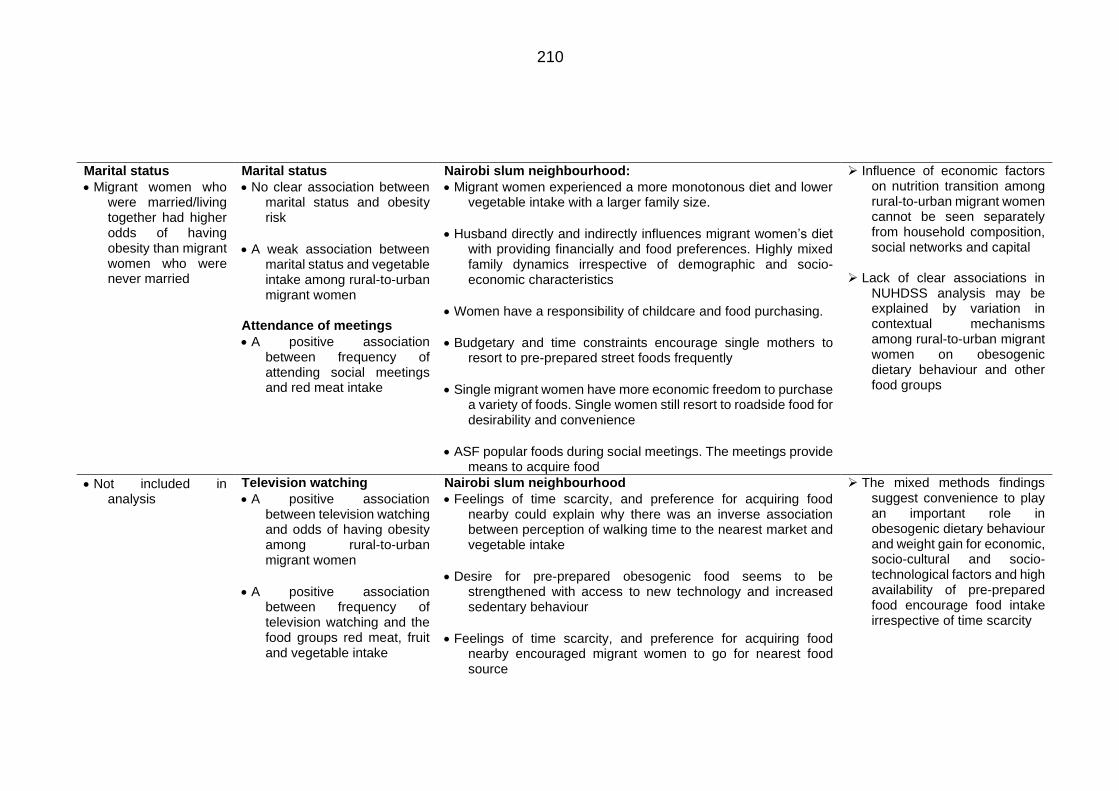
210
Marital status
• Migrant women who were married/living together had higher odds of having obesity than migrant women who were never married
Marital status
• No clear association between marital status and obesity risk
• A weak association between marital status and vegetable intake among rural-to-urban migrant women
Attendance of meetings
• A positive association between frequency of attending social meetings and red meat intake
Nairobi slum neighbourhood:
• Migrant women experienced a more monotonous diet and lower vegetable intake with a larger family size.
• Husband directly and indirectly influences migrant women’s diet with providing financially and food preferences. Highly mixed family dynamics irrespective of demographic and socio-economic characteristics
• Women have a responsibility of childcare and food purchasing.
• Budgetary and time constraints encourage single mothers to resort to pre-prepared street foods frequently
• Single migrant women have more economic freedom to purchase a variety of foods. Single women still resort to roadside food for desirability and convenience
• ASF popular foods during social meetings. The meetings provide means to acquire food
➢ Influence of economic factors on nutrition transition among rural-to-urban migrant women cannot be seen separately from household composition, social networks and capital
➢ Lack of clear associations in
NUHDSS analysis may be explained by variation in contextual mechanisms among rural-to-urban migrant women on obesogenic dietary behaviour and other food groups
• Not included in analysis
Television watching
• A positive association between television watching and odds of having obesity among rural-to-urban migrant women
• A positive association between frequency of television watching and the food groups red meat, fruit and vegetable intake
Nairobi slum neighbourhood
• Feelings of time scarcity, and preference for acquiring food nearby could explain why there was an inverse association between perception of walking time to the nearest market and vegetable intake
• Desire for pre-prepared obesogenic food seems to be strengthened with access to new technology and increased sedentary behaviour
• Feelings of time scarcity, and preference for acquiring food nearby encouraged migrant women to go for nearest food source
➢ The mixed methods findings suggest convenience to play an important role in obesogenic dietary behaviour and weight gain for economic, socio-cultural and socio-technological factors and high availability of pre-prepared food encourage food intake irrespective of time scarcity
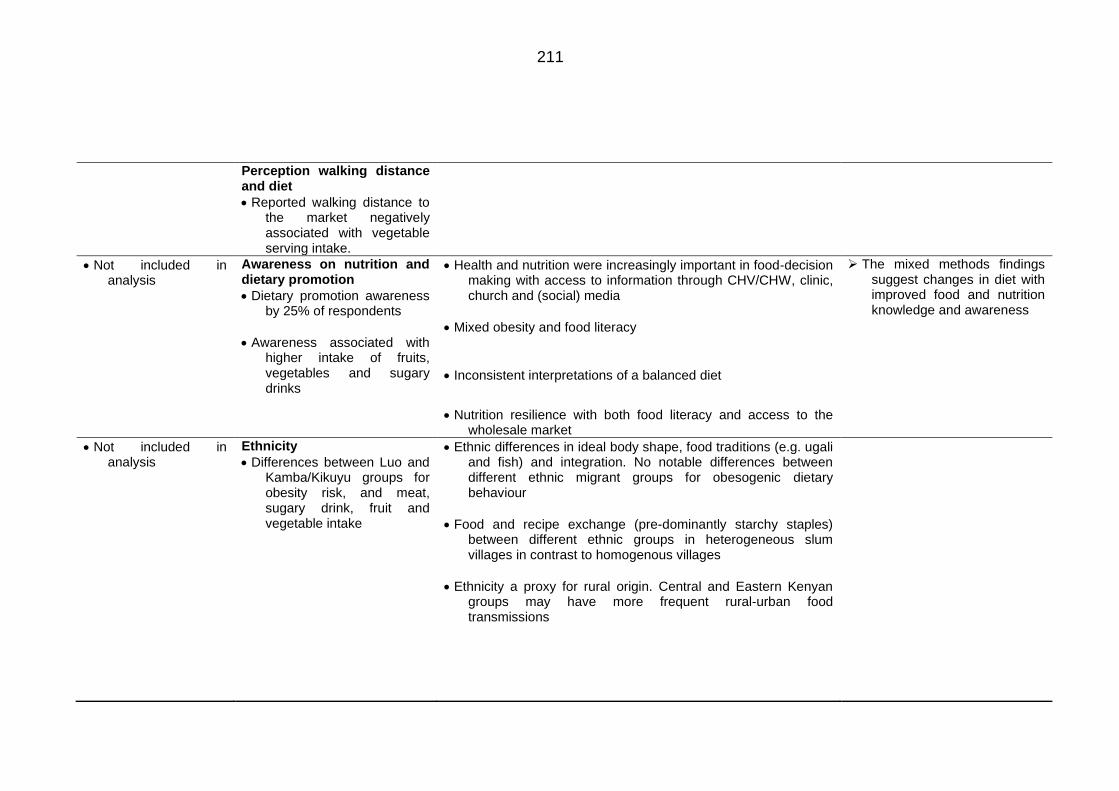
211
Perception walking distance and diet
• Reported walking distance to the market negatively associated with vegetable serving intake.
• Not included in analysis
Awareness on nutrition and dietary promotion
• Dietary promotion awareness by 25% of respondents
• Awareness associated with higher intake of fruits, vegetables and sugary drinks
• Health and nutrition were increasingly important in food-decision making with access to information through CHV/CHW, clinic, church and (social) media
• Mixed obesity and food literacy
• Inconsistent interpretations of a balanced diet
• Nutrition resilience with both food literacy and access to the wholesale market
➢ The mixed methods findings suggest changes in diet with improved food and nutrition knowledge and awareness
• Not included in analysis
Ethnicity
• Differences between Luo and Kamba/Kikuyu groups for obesity risk, and meat, sugary drink, fruit and vegetable intake
• Ethnic differences in ideal body shape, food traditions (e.g. ugali and fish) and integration. No notable differences between different ethnic migrant groups for obesogenic dietary behaviour
• Food and recipe exchange (pre-dominantly starchy staples) between different ethnic groups in heterogeneous slum villages in contrast to homogenous villages
• Ethnicity a proxy for rural origin. Central and Eastern Kenyan groups may have more frequent rural-urban food transmissions
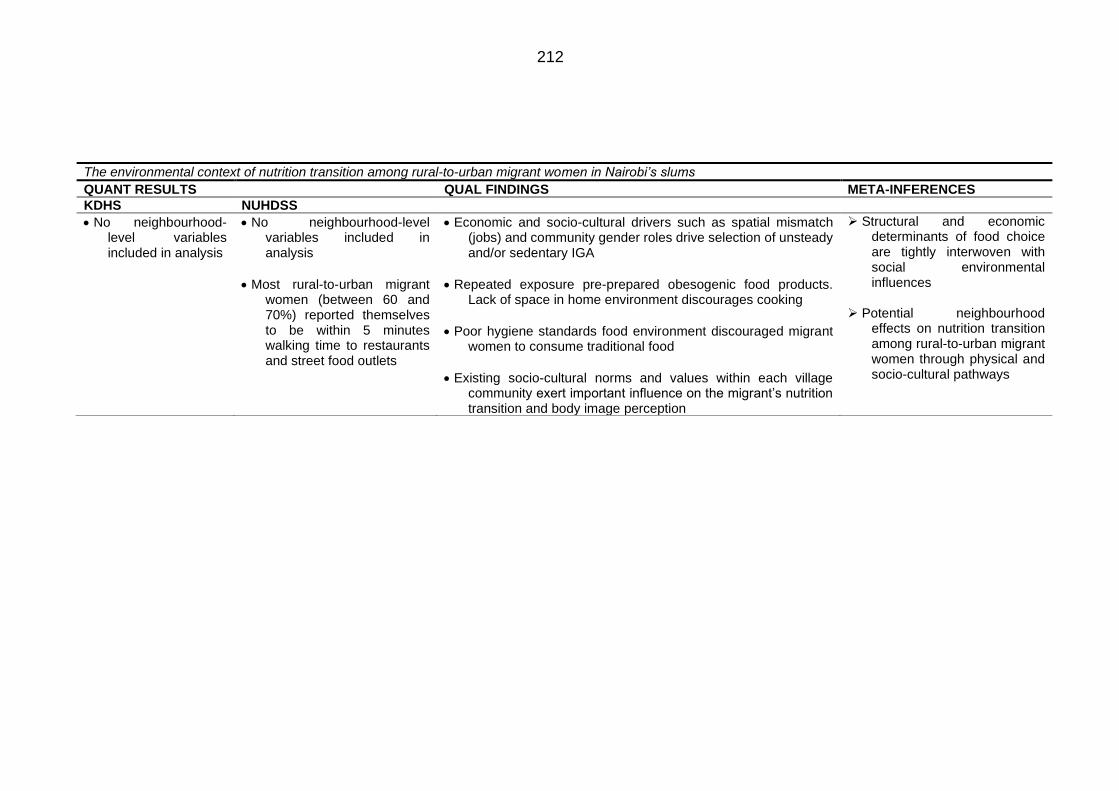
212
The environmental context of nutrition transition among rural-to-urban migrant women in Nairobi’s slums
QUANT RESULTS QUAL FINDINGS META-INFERENCES
KDHS NUHDSS
• No neighbourhood-level variables included in analysis
• No neighbourhood-level variables included in analysis
• Most rural-to-urban migrant women (between 60 and 70%) reported themselves to be within 5 minutes walking time to restaurants and street food outlets
• Economic and socio-cultural drivers such as spatial mismatch (jobs) and community gender roles drive selection of unsteady and/or sedentary IGA
• Repeated exposure pre-prepared obesogenic food products. Lack of space in home environment discourages cooking
• Poor hygiene standards food environment discouraged migrant women to consume traditional food
• Existing socio-cultural norms and values within each village community exert important influence on the migrant’s nutrition transition and body image perception
➢ Structural and economic determinants of food choice are tightly interwoven with social environmental influences
➢ Potential neighbourhood
effects on nutrition transition among rural-to-urban migrant women through physical and socio-cultural pathways
213
8.2 Meta-inferences
8.2.1 Nutrition transition among rural-to-urban migrant women
As presented in Table 8.1, the mixed method findings suggest diets and
obesity risk among rural-to-urban migrant women seemed to align with the
dominant nutrition diet patterns found within the urban setting. The KDHS
analysis suggested that there were no distinct differences between rural-to-
urban migrant households and urban non-migrant households for most food
groups, irrespective of socio-economic and demographic characteristics on a
national level. Secondary data from Nairobi slums implied that there were no
distinct differences between rural-to-urban migrant women and urban born
women for obesity risk and food intake (meat, sugary drink, fruits and
vegetables). The qualitative study supported these findings and expanded on
them. While participants generally perceived that residents born and raised in
Nairobi had different attitudes towards dietary behavior, many said that their
diets and food sources were similar to those of the residents within their
respective villages. The qualitative study also identified important dietary shifts
related to obesogenic dietary behavior including the corporation of pre-
prepared obesogenic food in their daily diet, use of edible vegetable oil in food
preparation, and a more individualised dietary behaviour which involved
snacking. Similar patterns have been seen among rural-to-urban migrants
elsewhere in SSA and other LMICs (Bojorquez et al., 2014; Cockx et al., 2018;
Cohen et al., 2017; Puoane et al., 2006; Stern et al., 2010).
Both the KDHS and NUHDSS analyses also indicated positive associations
between duration of urban residence and obesity risk as has been shown in
other SSA rural-to-urban migrant studies (e.g. Unwin et al. 2010) (Table 8.1).
In the qualitative study the majority of rural-to-urban migrant women said they
experienced rapid weight gain post-migration. The NUHDSS analysis showed
there to be a positive association when comparing women who were included
in this study for at least 5 years. This may not come as a surprise. The rate of
transition may be quicker in migrant populations than in an already settled
population which may account for quick changes in body weight. Many
participants in the qualitative study had not been exposed to obesogenic food
and edible oil in their rural area. Furthermore, due to the lack of income and
cooking supplies, obesogenic dietary behaviour was adopted shortly after
migration. Early life malnutrition may also predispose migrant women to adult
obesity as they get exposed to an obesogenic environment (Godfrey et al.,
2017; Murphy et al., 2017).
214
8.2.2 Economic circumstances of rural-to-urban migrant women
are salient in nutrition transition and obesity risk
Table 8.1 also illustrates characteristics of migrant women who were prone to
be associated with obesity, dietary outcomes and corresponding qualitative
interpretations. The mixed methods findings suggest rural-to-urban migrant
women’s economic circumstances to be the most salient influence on nutrition
transition (e.g. obesogenic dietary behaviour and traditional food intake) and
obesity risk.
On a national level, the KDHS analysis showed no clear effect of rural-to-
urban migration on the likelihood of having obesity and intake of the food
groups ASF, fat and sweets. Rather, the changes in economic circumstances
of those who migrated may be a more important influence. Participants in the
qualitative study said that ASF, processed food (e.g. mandazis and chapatti),
and edible vegetable oils were unaffordable or inaccessible in their rural food
environments. In addition, due to many women being involved in farming they
were more physically active in the rural area. A couple of studies have
indicated nutrition transition to be underway in Eastern Africa’s rural areas. A
cross-sectional study identified a dietary pattern which includes breads, cakes
and products fried in oil among rural women (Keding, 2016). This provides
some evidence for the early stages of nutrition transition as ultra- processed
foods and fat are becoming more accessible and affordable. In addition, a
recent qualitative study on the rural Kenyan coast highlighted unhealthy diets
(ultra-processed, fatty and sugary food and beverages) and unbalanced diets
to be accessible to adolescents (Ssewanyana et al., 2018). One study
compared macro-nutrient intakes between Kenyan and South African rural
women and surprisingly found fat intake to be higher among rural women in
South Africa was presumed to be in a further stage of nutrition transition as
the country had a higher level of urbanisation. Women would have increased
access to imported cooking fat. The explanation provided was that in the
period of conducting this study (2007) informal and local shops were selling
margarine in small quantities which women could then use without a
refrigerator. It could be argued that these results were observed as they
sampled rural women from regions within proximity of urban centres and
therefore had improved access to trading centres and kiosk which offer such
commodities more cheaply (Rischke et al., 2015). Migrant women who used
cooking fat in the rural area lived nearby the capital Nairobi, and secondary
cities such as Kisumu and Nakuru. The increased accessibility potentially is
paired with an increase in job opportunities outside of farming as rural areas
215
become more connected to the urban areas. An increased use of edible oil for
food preparation in rural areas could be a key dietary determinant of the rising
obesity rates among the wealthier in rural areas and may partly explain why
there is a limited effect of rural-to-urban migration on increased obesity odds
in the KDHS after controlling for household wealth.
The mixed methods findings suggest that migrant women’s economic
circumstances were also salient in the Nairobi slum context. Figure 8.1 shows
a conceptual view which presents potential mechanisms between urban slum
exposure and obesogenic food intake. Although this figure is undoubtedly a
simplification of the reality, it illustrates important mechanisms derived from
the mixed methods synthesis. The NUHDSS data showed clear associations
between economic characteristics and the odds of having obesity, more
frequent meat and sugary drink intake, fruit and vegetable intake. Rural-to-
urban migrant women belonging to the wealthier households were more likely
to have obesity and a more frequent intake of luxury products such as red
meat and sugary drinks. There was also a clear difference between the lowest
expenditure group and all other expenditure groups for sugary drink and
vegetable intake. In addition to the assets- and consumption-based economic
measures, type of IGA was also observed to be a potentially important
determinant. Self-employed women were more likely to have obesity and
reported a higher fruit intake in comparison to those who worked at home.
Recent studies suggest there to be a typical economic gradient for BMI within
slum neighbourhoods (Asiki et al., 2018a; Haregu et al., 2018).
The qualitative study identified multiple environmental, psychosocial and
behavioural pathways that may account for these associations. As Chapter 7,
and wider migration literature have shown, obesogenic dietary behaviour is
influenced by a multitude of individual and environmental factors (Bojorquez
et al., 2014; Murphy et al., 2017; Ngongalah et al., 2018; Puoane et al., 2006;
Stern et al., 2010). While I acknowledge this, I identified potential mechanisms
to be particularly important in relation to obesogenic food intake. The majority
of the participants in this study frequently consumed obesogenic street and
packaged foods, and incorporated edible vegetable oil in their diets. Among
wealthier women, obesogenic street foods were still a crucial component of
the daily diet. This is in accordance with previous urban SSA literature which
found street foods to be represented across all socio-economic groups
(Kimani-Murage et al., 2014; Maxwell, 2000; van 't Riet et al., 2001; Tschirley
et al., 2015). However, wealthier migrant women, or migrant women who sold
obesogenic foods as a part of their food selling business, said that they
216
consumed these in large portions. Due to economic environmental factors
such as unsteady income-generating activities, fluctuating prices of food and
cooking supplies, a lack of saving options and competing priorities, rural-to-
urban migrant women expressed concerns about spending scarce resources
and therefore frequently looked for the cheapest options. Generally,
perceptions of affordability drove food choice.
As is shown in Figure 8.1, time became an increasingly important resource
with engagement in IGA post-migration. Some of the KI’s and migrant
women’s narratives pointed out structural determinants such as gender roles
and a spatial mismatch in income-generating activities drove women into
sedentary and food selling businesses. Migrant women worked long and
irregular hours. The economic circumstances, often in combination with
household responsibilities, promoted stress and feelings of time scarcity and
hence drove obesogenic dietary behaviour. Studies in Nairobi have
consistently shown the importance of time scarcity in relation to pre-prepared
street food intake (Goudet et al., 2017; Kimani-Murage et al., 2014; van 't Riet
et al., 2001). In the qualitative study, self-employed participants elaborated
that they ate their own produce due to budget constraints and a lack of storage
facilities. This is particularly important to those who sold fried street foods.
Furthermore, they also had little time to cook and resorted to snacking during
their jobs. There was variation in the success of businesses, whereas some
reported to have extra food autonomy after starting up the business which
provided them with more food autonomy.
There was also a geographical aspect to their economic circumstances.
Richer migrant households (in terms of household assets) may reside at the
outskirts of urban slum neighbourhoods where there is improved housing.
Their geographical position encouraged more frequent visits to small
supermarkets which sell cheap obesogenic foods in bulk. Based on these
study’s findings, economic status is likely an important moderator of the
relationship between rural-to-urban migrant women’s obesogenic dietary
behaviour and impact of environmental level changes.
In the NUHDSS, there was no clear association between marital status and
odds of having obesity (Table 8.1). Married migrant women reported a lower
intake of vegetables in comparison to single migrant women. Apparent from
the qualitative findings, the influence of economic factors on nutrition transition
among rural-to-urban migrant women cannot be seen separately from their
marital status and household composition. The migrant women’s food choices
were both directly and indirectly influenced through family rules on income
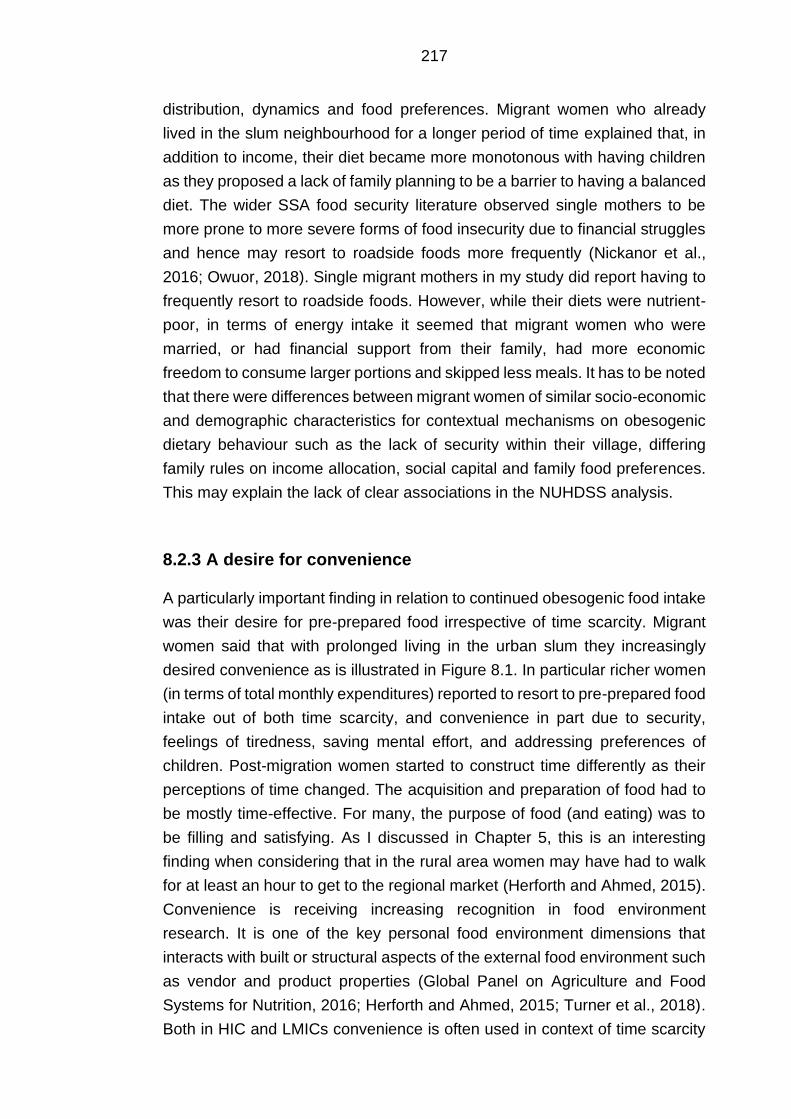
217
distribution, dynamics and food preferences. Migrant women who already
lived in the slum neighbourhood for a longer period of time explained that, in
addition to income, their diet became more monotonous with having children
as they proposed a lack of family planning to be a barrier to having a balanced
diet. The wider SSA food security literature observed single mothers to be
more prone to more severe forms of food insecurity due to financial struggles
and hence may resort to roadside foods more frequently (Nickanor et al.,
2016; Owuor, 2018). Single migrant mothers in my study did report having to
frequently resort to roadside foods. However, while their diets were nutrient-
poor, in terms of energy intake it seemed that migrant women who were
married, or had financial support from their family, had more economic
freedom to consume larger portions and skipped less meals. It has to be noted
that there were differences between migrant women of similar socio-economic
and demographic characteristics for contextual mechanisms on obesogenic
dietary behaviour such as the lack of security within their village, differing
family rules on income allocation, social capital and family food preferences.
This may explain the lack of clear associations in the NUHDSS analysis.
8.2.3 A desire for convenience
A particularly important finding in relation to continued obesogenic food intake
was their desire for pre-prepared food irrespective of time scarcity. Migrant
women said that with prolonged living in the urban slum they increasingly
desired convenience as is illustrated in Figure 8.1. In particular richer women
(in terms of total monthly expenditures) reported to resort to pre-prepared food
intake out of both time scarcity, and convenience in part due to security,
feelings of tiredness, saving mental effort, and addressing preferences of
children. Post-migration women started to construct time differently as their
perceptions of time changed. The acquisition and preparation of food had to
be mostly time-effective. For many, the purpose of food (and eating) was to
be filling and satisfying. As I discussed in Chapter 5, this is an interesting
finding when considering that in the rural area women may have had to walk
for at least an hour to get to the regional market (Herforth and Ahmed, 2015).
Convenience is receiving increasing recognition in food environment
research. It is one of the key personal food environment dimensions that
interacts with built or structural aspects of the external food environment such
as vendor and product properties (Global Panel on Agriculture and Food
Systems for Nutrition, 2016; Herforth and Ahmed, 2015; Turner et al., 2018).
Both in HIC and LMICs convenience is often used in context of time scarcity
218
due to competing demands such as employment or food sources which are
far away (Herforth and Ahmed, 2015; Jackson and Viehoff, 2016; Turner et
al., 2018; Venn and Strazdins, 2017). As discussed in Chapter 7, the findings
of my research suggest that a desire for convenience could be viewed more
holistically as economic, socio-cultural and socio-technological factors
seemed to contribute in addition to the built environmental aspects of the food
environment as illustrated in Figure 8.1.
The qualitative findings emphasised the importance of geographical position
of the slum village, and structural barriers in relation to the wholesale market.
Poor infrastructure (roads) and having to use public transport discouraged
migrant women of all socio-economic status to visit the market frequently.
Especially during the rainy season migrant women were discouraged from
travelling due to unpaved roads and travelling to food sources outside and
within their community (village) food environments. The high availability of
food sources within proximity of their homes was generally appreciated by the
rural-to-urban migrant women. It is therefore important to consider that as
incomes increase, migrant women may still acquire more expensive and less
diverse meals within their community for time management reasons. As
discussed earlier, feelings of time scarcity, and preference for acquiring food
nearby may also explain why there was an inverse association between
perception of walking time to the nearest market and vegetable intake. In
addition, this desire for pre-prepared obesogenic food within their village
community environment seems to be strengthened with the adoption of other
new behaviours and increased sedentary behaviour. Previous research which
looked at the association between urbanisation and obesity in SSA and other
LMICs found similar findings as women became less active and therefore
operated within a small environment (Fraser, 2005). This also seems to be the
case in the present study. Physical activity within the community environment
was exacerbated by a lack of space and poor infrastructure. In the qualitative
study, some rural-to-urban migrant women mentioned to have an interest in
television series which led them to preferring pre-prepared food over cooking
at home. Whereas television watching could be a sign of affluence, some
migrant women mentioned that television watching was a behaviour which
was noticed among many within the community who did not own a television.
With access to new technology which encouraged sedentary behaviour this
partly contributed to pre-prepared obesogenic food intake and reduced the
frequency of cooking at home. This may explain the NUHDSS findings which
showed that migrant women who watched television daily were also more
likely to have obesity and consume sugary drinks more frequently.
219
Frequency of television watching
Figure 8.1 Conceptual view of key multilevel influences of urban slum exposure on obesogenic dietary behaviour among rural-to-urban migrant women. Lines with arrows indicate the direction of association in which these occur. The lines without arrows highlight that there is a relationship between two concepts. The dashed lines represent a potential negative association. The dark shaded boxes are variables from NUHDSS.
Community Household Individual Built food environment
Lack of a steady income/long hours
of work
Pre-prepared and/or pre-cut
food (street vendors/restaurant/kiosk/vend
ing machine/food
hawkers)
Small supermarket
(purchasing of obesogenic
food (in bulk))
Exposure to urban slum environment
Time scarcity/stress
Type of income-
generating activity
Community gender norms
Household wealth
(assets)
Household responsibilities
Spatial mismatch job opportunities
Main market (wholesale/wet
market)
Accessibility
Household expenditures
220
8.2.4 Changes in diet with improved food and nutrition knowledge
and awareness
As presented in Table 8.1, the mixed methods also addressed individual
awareness of nutrition and dietary promotion. The NUHDSS results observed
only about a quarter of rural-to-urban migrant women to be aware of diet and
nutrition promotion through media. However, this may have changed with the
increased use of technology since 2008/2009 (African Population and Health
Research Centre, 2014). Previous studies have associated changes in
information environments with increased individual knowledge and awareness on
health and diet (Grant, 2010; Puoane et al., 2006; Stern et al., 2010). Indeed, the
qualitative study highlighted that generally migrant women became more aware
of a balanced diet as they had more access to information in the urban
environment through the healthcare system, technology, church and social
media. However, there should be caution as the migrant women in this study
were recruited by CHVs and CHWs and many had access to health promotion.
As mentioned in Chapter 7, many reported having received dietary information at
the clinic due to disease or pregnancy. However, there was also confusion on the
links between food, weight and health. Being aware of disease and healthy diets
appeared to be strong psychological drivers for willingness to change diets.
Interestingly, inferential statistics observed weak, but positive associations
between awareness of diet and nutrition promotion and reported fruit and
vegetable intake in Nairobi’s slums. As I discussed in Chapter 5, women who
reported greater intakes may also have been more likely to recall these
promotions as fruit and vegetables were already an important part of their diet.
Improved vegetable intake may however not be unreasonable. Most participants
perceived vegetables such as kale, cabbage and tomatoes to be accessible and
affordable. Furthermore, vegetables were generally consumed for reasons of
tradition. Vegetables were also perceived to be an essential component of their
evening meal. Vegetable and fruit promotion only found limited resistance
(Tschirley et al., 2015).
However, as the qualitative study made apparent, due to mentioned economic,
physical and socio-cultural barriers on both a household and community level,
migrant women in this sample found it challenging to adhere to healthier diets
and reduce their weight. Some women did suggest there to be nutrition resilience
as they were diagnosed with disease. Nutrition resilience in the HIC literature
refers to achievement of high quality diets among people of lower socio-economic
status who have positive food-related attitudes and are able to achieve higher
quality diets despite their economic constraints (Aggarwal et al., 2016). The same
study which coined this term in HIC settings observed that shoppers who reported
221
nutrition to be a key food value to also have better dietary quality irrespective of
socio-economic status (income, education) and ethnicity (Aggarwal et al., 2016).
In this case, the notion is that with rational food-decision making it is possible to
have healthier diets, even within poor socio-economic settings when migrant
women are aware of the consequences of diets on their health. Particularly
important in these cases was their accessibility to wholesale markets. This
emphasises the importance of a combination of individual awareness, which was
partly determined by the social environment settled in, and a food environment
which can realise the individual’s intention to a healthy diet and weight loss
(Owuor et al., 2017; Roberto et al., 2015). More evidence is however required to
confirm this concept. These divergent cases also showcase that more scrutiny is
needed on economic and social coping mechanisms of migrant women post-
migration and their potential positive and negative consequences on obesogenic
and traditional diets as they become more aware of nutrition and dietary
promotion.
8.2.5 Potential neighbourhood effects on nutrition transition
The qualitative study allowed further exploration of the environmental context in
which nutrition transition among rural-to-urban migrant women occurred. As is
mentioned in Table 8.1, no neighbourhood variables were included in the
quantitative phase. Chapter 7 highlighted that nutrition transition is driven by a
complex interplay of economic, physical and socio-cultural environmental
influences. Some of these environmental factors were perceived by the
participants to have a more prominent influence on aspects of nutrition transition
than others. As discussed above, changes in economic environment were
especially influential on nutrition transition. Their community had, in addition to
their households, a strong influence on their dietary behaviour. These findings
suggest that there are potential neighbourhood effects on nutrition transition. To
reiterate Chapter 2, the concept of neighbourhood effects in my research refers
to factors that affect health at the community level independent of individual
household characteristics, including individual household levels of poverty or
deprivation (Ezeh et al., 2017; Lilford et al., 2017).
The physical environmental attributes of the food environment within slum
villages and neighbourhoods were important on their perception of traditional
food and encouraged obesogenic food intake. First, urban food swamp conditions
within their community encouraged pre-prepared obesogenic food intake due to
repeated exposures and promoted food purchases regardless of individual of
household characteristics. Taste is a widely recognised key determinant of food

222
choice. The palatability and enjoyment of foods are often tied to their energy
density and therefore fat content (Drewnowski et al., 2012). Taste has been the
most important influence on food-decision making and has been highlighted in
relation to the automated influences of the built food environment on obesogenic
food intake (Cohen, 2008; Cohen and Babey, 2012; Story et al., 2008).
Second, poor hygienic standards of the growing and selling community and
consumer food environment discouraged migrant women to consume traditional
food (e.g. vegetables, fish and other rural food grown in the urban area) or to
cook at home. This highlights how garbage belts, open sewers, and keeping of
livestock impacts on migrant women’s food intake and eating occasions
irrespective of individual household socio-economic status (Ezeh et al., 2017). In
addition to food safety and quality perceptions driving women away from
traditional food, it is also important to address this matter in relation to health due
to the presence of pathogens indicative of faecal contamination (Ruel et al.,
2017). Food safety is named as a growing concern in urban areas, and was a
key returning theme among rural-to-urban migrant women. Overall, access to
safe food, control of environmental contaminants and effective quality assurance
are of critical concerns in slum neighbourhoods. They do not only prevent
disease, but according to this study also stimulate appetite for traditional food and
encourage cooking at home. The consumer’s perception and worries concerning
food safety are increasingly recognised in SSA and wider LMICs literature
(Ahmed et al., 2019; High Level Panel of Experts on Food Security and Nutrition,
2017).
In addition to physical environmental mechanisms, the existing socio-cultural
norms and values within each village community seemed to exert an important
direct and indirect influence on the migrant’s changes in dietary behaviour and
body image perception. Migrant women shifted to the social norms on food
preparation (frying and mixing of food), meal patterns (skipping lunch and
snacking) and eating occasions (e.g. eating outside of home) and body image.
Many of the food sources they visited most frequently were introduced by their
neighbours and/or close family who lived in the same slum village. As migrant
women predominantly navigated an informal community food environment it may
not be surprising that they adopted typical urban foods and preparation methods
as this type of food environment is extra sensitive to the demand, time constraints
and economic possibilities of its residents. Previous SSA studies have shown the
influence of local demand on the shaping of the food environment (Smit, 2016;
Steyn et al., 2016). The shaping of the informal community food environment is
however a bi-directional process. Rural-to-urban migrant women shared food and
recipes typical of the rural area and their ethnic group with others in the
223
community. This was especially so in more heterogenous villages. These study
findings reinforce more recent socio-ecological urban store choice literature in
HIC settings which highlight that structural and economic determinants of food
choice are tightly interwoven with social environmental influences (Diez et al.,
2017; Cannuscio et al., 2014).
As mentioned above, the participants’ narratives revealed structural socio-
cultural drivers, such as gendered IGA and household rules, that contributed to
migrant women seeing the low cost and time-effectiveness of cooking at home.
Other important findings were the implications of food norms and values within
their respective community food environments for the adoption of urban food
preparation methods. Common to all interviewed migrant women was the switch
from boiling to frying of foods. In addition to edible oils being affordable,
accessible and improving the taste of “urban foods”, migrant women increasingly
used edible vegetable oils as this was culturally desired. In this study eating pre-
prepared food outside of home was a key component of obesogenic dietary
behaviour. However, cooking at home was not necessarily less obesogenic as
migrant women sprinkled edible oil on top of pre-prepared food.
In context of body image and weight gain, an important finding in this study was
that rural-to-urban migrant women, and at times their husbands, felt pressured by
both rural and urban communities in their respective villages to conform to the
culturally desired body image. This acted as an important barrier to changing or
losing weight (Draper et al., 2016). The findings in this study do however imply
that body image perception in urban slums might be shifting towards slimmer
body sizes due to increased awareness of NCDs within the neighbourhood village
communities. Previous studies have also indicated mixed ideal body image
perception, particularly among younger urban residents as they get in touch with
HIC beauty ideals (Benkeser et al., 2012; Cohen et al., 2018; Gradidge et al.,
2015; Phillips et al., 2016; Toselli et al., 2016). Typical characteristics of urban
slums such as the high population density may amplify these neighbourhood
effects.
In the wider literature there is a lack of strong associations between
neighbourhood characteristics and health/obesity. This could partly be explained
by the complexity of system influences on dietary behaviour and obesity. Another
potential explanation is of a methodological nature as most studies which
investigate neighbourhood influences on diets and obesity have a cross-sectional
design (Cummins and Macintyre, 2005; Letarte et al., 2018).

224
8.3 Generalisability and transferability of my findings
In quantitative research, generalisability is considered a key criterion for
evaluating the quality of a study. However, generalisability is a debatable and
complex issue even in studies which are considered to bring forth high quality
evidence (Polit and Beck, 2010).
Whether the KDHS findings are generalisable to urban areas within Kenya, and
other SSA countries is to be questioned. In the KDHS analysis I merged the
different urban areas and rural areas. A recent study reported the results of a
panel study which followed rural non-migrants, rural-to-urban migrants and urban
non-migrants over 24 years in Indonesia. The authors argued that nutrition
transition theory is only applicable to Jakarta, the capital of Indonesia. There were
much smaller differences in diet noted between rural areas and smaller urban
centres. They came to similar conclusions that nutrition transition may not be
attributable to urban living alone but more so the socio-economic conditions in
which they reside. They observed that most changes occurred at a similar pace
in both rural and urban areas, and there being some evidence that moving to
Jakarta was associated with significant changes in food expenditures for some
energy-dense foods. In all urban environments consumption of a traditional diet
(fish and vegetables) and other traditional foods such as non-rice staples showed
little change (Colozza and Avendano, 2019). Large cities may have a lower urban
gradient for income and poverty levels, and markedly different food environments
than secondary cities which are often closer to the rural areas and may have a
cheaper supply of locally produced food products (Bloem and de Pee, 2017).
On the environmental context of nutrition transition, it is more difficult to claim that
my findings are generalisable due to the qualitative nature. Whether the mixed
methods findings are transferable is debatable. Common to the empirical
literature on migration and urbanisation in SSA my research observed that
nutrition transition among rural-to-urban migrant women was influenced by a
complex interplay of individual and environmental (or contextual) influences, with
economic factors playing a particularly important role (Cohen et al., 2017; Puoane
et al., 2006). Nutrition transition and rising obesity rates occur globally. Further,
primary urban economic centres in SSA and other LMICs seem to undergo similar
trends such as globalisation, liberalisation of food trade, income growth,
advances in technology and engagement of women in the economic sector, with
the consequence of shaping obesogenic environments. In accordance with the
dietary convergence-divergence model, integration of countries and their urban
areas into the world economy has led to commodities such as processed energy-
dense foods being available everywhere. However, there is also local divergence
225
as different foods are available due to the informal nature of the community food
environments they settle in (Hawkes, 2006).
As for the international immigration literature, studies which have explored
individual and environmental factors of acculturation and dietary changes among
African immigrant women have also identified economic, physical and socio-
cultural environmental influences such as budget constraints, high availability of
obesogenic foods, children’s influences, and time scarcity to be influential on
changes in diet or dietary acculturation (e.g. often related to the adoption of
“Western” obesogenic foods) (Murphy et al., 2017; Ngongalah et al., 2018; Patil
et al., 2009; Wilson et al., 2010). Migrant women in these studies mostly departed
from rural areas in their home countries and ended up in urban areas. Hence,
this transition may share some similarities in relation to internal rural-to-urban
migration as these immigrant women may follow the nutrition transition trajectory.
Interestingly, similar themes in relation to beliefs and attitudes of migrant women
towards their food environment and changes in their diet were noted (Alidu and
Grunfeld, 2018; Ngongalah et al., 2018; Wilson et al., 2010).
Literature from different contexts thus share key themes which support the idea
of nutrition transition. These patterns for dietary behaviour and weight gain seem
to be inherent to urbanisation and applicable to urban districts of different socio-
economic settings. However, due to the informal nature of the food environment,
and typical contextual urban slum characteristics such as a high population
density, lack of space, poor housing, overcrowding and poor water, sanitation
and hygiene, comparison of findings on diet and obesity risk between this study
and other (im)migration studies may be limited. Some of the identified
mechanisms between neighbourhood-level influences and the migrants’ dietary
behaviour appear to be unique to urban slums in comparison with other urban
neighbourhoods. Building on the Lancet slum health series, this distinguishes
migration to urban slums from other migration studies with the suggestion that
the identified neighbourhood-behaviour interactions are more pervasive (Lilford
et al., 2017). Interestingly, a recent longitudinal study which tested the effect of
internal migration on mortality showed there to be diversity in migration-mortality
relationships over a range of urban health and demographic surveillance systems
(HDSS) between West, East and South African regions (Ginsburg et al., 2016).
Caution on transferability between urban slum neighbourhoods is therefore
warranted as well.
By selecting a wide range of different rural-to-urban migrant women in terms of
migratory, demographic and socio-economic characteristics in three distinctly
different slum neighbourhoods my findings may be transferable to other slum
neighbourhoods in SSA and other LMICs should the cities in which they are
226
located be in similar stages of nutrition transition, urbanisation and economic
development. Previous research on food security, food environment and related
concepts showed there to be conflicting results between cities and countries due
these being in different stages of development (Farrell et al., 2017; Steyn et al.,
2012; Symmank et al., 2017). The temporal aspect is therefore especially
important when transferring the results of these findings to other settings outside
of this research context. In addition, the use of multiple methods, including PR
methods during my data collection assisted in yielding more informed and reliable
constructions of realities as these were co-constructed with the research
participants. The qualitative themes were generalisable over the different slum
neighbourhoods. However, one has to take into consideration the geographical
position of the slum within cities as this may bring different issues which may
affect dietary behaviour and obesity risk such as flooding risk. Previous literature
also found spatial heterogeneity in access to services between slum
neighbourhoods within a city irrespective of household characteristics and
poverty (Gulyani and Talukdar, 2010). While the findings and used methods of
my research could inspire other studies, for identifying effective solutions context-
specific evidence remains required.
Due to the mixed methods nature of my research, the findings on characteristics
of migrant women particularly prone to have obesity are to some extent
generalisable to rural-to-urban migrant women in Kenya, and other SSA countries
given that context, characteristics and stage of development are similar.
8.4 Reflection on my conceptual framework
8.4.1 Measurement of outcomes
8.4.1.1 Obesity risk
In both quantitative studies I used BMI to classify women as normal weight, being
overweight or having obesity. BMI as a measurement of obesity is useful as it is
quick and straightforward to both measure and calculate. However, it is also
subject to misclassification errors. With the use of BMI we do not differentiate
between adiposity or lean mass as it takes the whole-body mass in the nutritional
assessment (World Health Organisation, 2020). In addition, when we use BMI we
also do not take into consideration the different levels of adiposity based on
ethnicity (World Health Organisation, 2020). One study investigated the inter-
relationships among four different main anthropometric indices (BMI, waist-
circumference, waist to hip ratio, and waist to height ratio) for measuring

227
overweight and obesity in Nairobi’s slums. The authors found there to be a high
level of variation between the anthropometric markers in estimating prevalence
of above normal body composition and recommend additional markers to BMI to
detect individuals with a cardio-metabolic risk profile (Haregu et al., 2016a). This
is in line with the international recommendations that suggest that an additional
measure such as waist circumferences to be useful for identifying individuals with
excess fat (World Health Organisation, 2020). Future quantitative research
among rural-to-urban migrants could consider investigating multiple measures of
adiposity.
8.4.1.2 Dietary outcomes
Multiple food groups were included in the secondary data analyses, and in the
qualitative study I expanded on these with ultra-processed and traditional food
products which could not be derived from the generic food groups in the NUHDSS
analysis. In addition, I looked at additional dietary behaviours such as food
preparation and eating away from home which are commonly associated with
nutrition transition, and hence obesity risk.
During the quantitative studies, I decided to analyse the food groups
independently. However, people generally do not consume single food groups,
but in combination. The application of data reduction techniques such as latent
class analysis could have proven useful to identify dietary typologies. I could have
obtained detailed information on the characteristics of rural-to-urban women
following a dietary typology characteristic of nutrition transition. However,
nutrition transition is not straightforward. For this analysis I chose to analyse food
groups independently, as conflation into typologies may lead to information loss
on the specific influences of each food intake group. For example, with dietary
recommendations, fruit and vegetable intake is often conflated while its
determinants can differ remarkably (World health Organisation, 2018). This study
showcases, alongside previous literature, that determinants of fruit and vegetable
intake respectively intake can be remarkably different, especially in low-income
context (Kamphuis et al., 2006; Kimani-Murage et al., 2015b; Landais et al.,
2015). This is however an option to consider for future DHS and HDSS analyses
which contain questions on food intake.
Furthermore, a limitation already mentioned in Chapter 4 concerns the lack of
data on ultra-processed food intake. A recent review also highlighted this to be
an issue (Walls et al., 2018). Whereas in the past some questionnaires have
already been developed to assess nutrition transition, future migrant studies
should consider measuring intake of food products which are often not
228
incorporated as a part of the more generic food groups such as meat, cereals,
fruits and vegetables. Ultra-processed foods have consistently been associated
with obesity risk (Juul et al., 2018; Monteiro et al., 2018). In context of rural-to-
urban migration, and urbanisation in a wider sense in SSA, these foods are
among the key changes (Steyn et al., 2014).
Lastly, in the qualitative study I focussed on traditional foods in addition to
obesogenic dietary behaviour as an integral part of nutrition transition. I
considered a loss of traditional foods in the diet with migration to contribute to a
reduced intake of essential nutrients and dietary fibre which may also serve as a
replacement of obesogenic food (Kuhnlein et al., 2009; Romieu et al., 2017). The
maintenance of traditional foods has also received attention as important foods
as they promote biodiversity and favourable land use. Encouraging demand for
these products may not solely have a beneficial direct influence on the individual’s
health but may also contribute to more sustainable diets in the long-term
(Burlingame and Dernini, 2018).
At the outset of my research I used a definition which was derived from the
definition for a traditional diet by Kuhnlein et al. (2009). They defined a traditional
diet as a diet which consists of foods that people have access to locally, without
having to purchase them, and within traditional knowledge and the natural
environment from farming or wild harvesting. Based on the qualitative findings I
interpret that the used definition may not be entirely accurate in a Kenyan context.
While most participants with a farming/fishing background had access to freely
and locally available food from farming and wild harvesting, some were not able
to maintain these ties. They therefore had to purchase traditional foods at the
village kiosk, market or trading centre.
In this study it also became evident that perceptions of traditional foods among
consumers are highly sensitive to cultural, geographical and temporal factors
(Rascke & Cheema, 2007). In general, migrant women associated a traditional
diet with a diet with which they grew up. Interestingly, migrant women did assign
the term tradition to specific vegetables from the rural area irrespective of whether
they consumed these vegetables in the rural area themselves. This signifies the
importance and longevity of vegetables within the Kenyan diet (Raschke et al.,
2007; Aworh, 2018). Many participants in the qualitative study said they
consumed traditional vegetables, roots and tubers but also fish and meat as these
were important sources of food and livelihoods in the rural area. As expected, this
varied widely by region and ethnic group which makes it challenging to define
traditional food in Kenya, and make generalised statements about barriers and
promotors of traditional food intake in urban slum settings. As a result, I may have
also missed out on traditional food products which were not highlighted by the
229
participants. Traditional food systems in Africa are known to make use of several
hundreds of edible and nutritious plants (Burlingame and Dernini, 2018).
From a consumer’s perspective, a urban-rural food comparison may more
accurately represent the perception of tradition in the Kenyan context. However,
urban heavily processed food are increasingly accessible in rural areas (Keding,
2016). Hence, the foods which people may refer to as traditional may no longer
represent fibrous and micro-nutrient dense food which are from farming or wild
harvesting in the natural environment. When defining a traditional diet in Kenya,
it may therefore be useful to include a specific time period in which traditional
foods and practices were established (Trichopoulou et al., 2007). Maintaining the
term traditional is valuable in promoting and maintain cultural food as this makes
it inseparable of the foods cultural, health and sustainable elements (Burlingame
and Dernini, 2018).
8.4.2 Reflection on the socio-ecological model and body image
perception
8.4.2.1 Socio-ecological model
Approaching this study with a socio-ecological framework assisted me in
developing a better understanding of the impact of changing environments on
obesogenic dietary behavior and reduced traditional food intake. It therefore can
provide guidance for developing culturally appropriate and sensitive intervention
strategies. In addition, while the primary aim of my research was not to directly
test acculturation, the dietary acculturation model was useful to incorporate the
migratory context to my research. A possible challenge in dietary behaviour
research is that, depending on the questioning, participants may repeat key food
values which are consistently repeated over the last couple of decades. These
seem to be universal regardless of context (Furst et al., 1996; Symmank et al.,
2017). Taking a socio-ecological perspective is particularly useful as it may
expose areas otherwise not touched upon such as neighbourhood safety or
gender roles. People are aware of only a fraction of the food decisions they make,
and many are unaware of how their environment influences these decisions
(Wansink & Sobal, 2007).
One of the limitations of the selected framework is that the interplay between the
different levels of individual and environmental influence are not well represented.
While SEM do recognise this, they do not provide any clear pointers on how to
interpret this (Gubbels et al., 2014; Stok et al., 2017). In the latter stages of my
research I increasingly appreciated the value of the dual process view model by
230
Kremers et al. (2006) which elaborates more on the interplay between individual
and environmental determinants of obesogenic behaviour. Furthermore, this
model considers the direct impact of the environment on dietary behaviour. In the
qualitative study it became evident that many participants showed awareness of
the automatic effect of their environment on their food choices, or it became
evident through their answers which indicated a lack of rational decision-making.
A consistent body of evidence has shown the influence of built and social
environmental cues on people’s subconscious food decision-making (Kremers,
2010).
At the outset of my research I chose single-level regression models to identify
characteristics of rural-to-urban migrant women prone to obesity and associated
with higher levels of food intake for the DHS and NUHDSS analyses. I did not
consider advanced statistical techniques such as multi-level modelling since the
secondary data did not contain relevant variables on neighbourhood socio-
cultural and physical food environments. Multilevel analysis is however a valuable
technique as it recognises the hierarchical structures which addresses the
underestimation of standard errors and lowers the risk of type 1 errors (Scott et
al., 2013). The multi-stage sampling design in the DHS allows for creating
neighbourhoods/communities variables which are based on a common PSU
(Kravdal, 2006). Future Kenyan DHS analyses could consider a multilevel
modelling approach to test the effect of neighbourhood and regional level socio-
economic/demographic characteristics on individual obesity and food intake
outcomes.
While the encompassing of many determinants of nutrition transition and obesity
risk is indeed a strength of the selected framework it could also be viewed as a
potential weakness. While the model acknowledges the many determinants that
influence dietary change and weight gain in context of migration, the pitfall is that
it approaches complex individual behaviours with less depth than more
individually focussed behavioural models (Stok et al., 2017). Furthermore, I gave
special attention to the influence of food environment-dietary behaviour
(acquirement, preparation, cooking, storing and eating of food) interaction during
the primary qualitative data collection and analysis. A potential limitation of this
could be that attention was taken away from other related influences such as
socio-cultural norms (Teddlie and Tashakkori, 2009).
231
8.4.2.2 Body image perception
Ideal body image perception, weight gain and its linkages to food intake were
further explored in the qualitative study. For this, PhotoVoice sessions instigated
women’s body shape ideals and how this related to dietary behaviour post-
migration. However, body image is a complex construct which consists of multiple
dimensions of measurement (Okop, 2017). Based on my research findings, I
suggest that future studies incorporate a number of culturally sensitive
measurement tools (e.g. body size dissatisfaction, weight-related belief
constructs and body image perception) as is recommended in the academic
literature (Cohen et al., 2013; Okop, 2017).
8.5 Methodological considerations
The empirical chapters highlighted the study’s respective strengths and
limitations. In the following section, I therefore examine the strengths and
limitations of the selected mixed methods design.
8.5.1 Sequential explanatory design
A strength of my research is the use of a mixed methods design to understand
nutrition transition and obesity risk among rural-to-urban migrant women in
Nairobi’s slums. At the time of formulating the research aim and objectives, many
of the concepts were largely unexplored in context of rural-to-urban migration. A
combination of both qualitative and quantitative methods was therefore
particularly appealing (Creswell et al., 2011). Furthermore, this mixed methods
design allowed for secondary data analysis. One challenge of working with
secondary data is the lack of familiarity (Bryman, 2016). To address this, I took
time to understand the datasets and I maintained email correspondence with the
data analyst at APHRC. This design also allowed me to find explanations for the
quantitative findings and placing these into context. This would have been
impossible through quantitative methods alone (Ivankova et al., 2006). The field
of mixed research is still evolving and changing which gives mixed methods
researchers the opportunity to be creative and utilise multiple types of writing and
integration approaches (Leech, 2012).
Another strength was the inclusion of participatory methods in my research.
These methods assisted the participants in talking more openly about their
perceptions of important influences on dietary change, and interaction with their
new food environment. Especially with the PhotoVoice method, visualisation
revealed much that would otherwise be hidden by focus groups and interviews
232
alone (Chambers, 1994). While several themes emerged from the qualitative
data, it became clear that different food values were important across different
socio-economic and demographic groups and neighbourhoods. As indicated
above, the pitfall however with asking women what factors drove changes in their
diet post-migration, and daily food choices many present universal factors such
as food price, time and taste which have been repeatedly observed in other
contexts as the participants are expected to respond within a brief time frame.
However, as is well shown in another study, with further probing other food values
come to surface which were not considered previously (van 't Riet et al., 2001).
The PhotoVoice sessions addressed this by allowing participants to reflect on
important influences for a longer period of time.
As mentioned in Chapter 3, ideally, my research respondents would have been
involved in both the quantitative and qualitative studies. Selection of new
participants in the qualitative study may lead to divergent views and cause
inconsistencies in the inferences derived from the quantitative and qualitative
studies. In addition, qualitative interviews can provide more clarity on the
respondents’ answer (Ivankova, 2013). Though acknowledged, this turned out
not to be feasible due to high mobility within slums and the large time gap in
between the qualitative and quantitative studies (Zulu et al., 2011). Furthermore,
time and financial constraints prevented me from planning and implementing a
survey prior to the qualitative study.
Lastly, despite inherent linearity of a sequential explanatory design, experience
tells that the quantitative and qualitative studies may interact in a non-linear way
(Ivankova, 2013). Qualitative findings may reveal the need for additional
statistical testing of the quantitative data that facilitates to the understanding of
qualitative findings. This interaction between the different studies may help
achieve interpretative rigor of the study’s meta-inferences (Ivankova, 2013;
O’Cathain et al., 2010). The qualitative findings of my research study led to new
insights which could be tested in future quantitative analyses and contribute to
the inferences derived from my research.
233
Chapter 9 Conclusions
I start the final chapter with a summary of the key findings. Subsequently, I
present the implications of the findings for future policies and interventions. Whilst
my overall research aim was to examine nutrition transition and obesity risk
among rural-to-urban migrant women, both my research findings, and
subsequent community dissemination meetings, led to context-specific insights
on potential policy and practice to address and prevent the negative aspects of
nutrition transition among rural-to-urban migrant women (and non-migrant
women). Following this I summarise and present my research finding’s
contribution to the field. In conclusion, I present the directions for future research.
9.1 Summary of key findings
The overall aim of my research was to examine nutrition transition among rural-
to-urban migrant women in order to better understand obesity risk in Nairobi’s
slums. I employed a sequential explanatory mixed methods research study which
had an initial quantitative phase and a subsequent qualitative phase to help
deepen understanding and extend the quantitative findings.
I initiated the quantitative research phase with an analysis of the KDHS 2014.
With this analysis I addressed several objectives. The first objective of this
analysis was to examine nutrition transition and population weight gain in Kenya
in the context of urbanisation. This was done by comparing rural-to-urban migrant
women with rural and urban non-migrant women for weight status and household
food intake. The second objective of this analysis was to identify the socio-
economic and demographic characteristics of rural-to-urban migrant women
prone to having obesity. Subsequently, I identified characteristics associated with
obesity risk among rural-to-urban migrant women on both a national level and in
Nairobi’s slums. In Nairobi’s slums I identified characteristics associated with
obesity odds, and red meat, soft drink, fruits and vegetable intake in Nairobi’s
slums. The findings in the first quantitative phase (Chapter 5) were linked to the
qualitative phase in the form of sample selection and building processes
(interview guide development) for the second phase (Chapter 6 and Chapter 7).
I conducted the qualitative study to interpret the findings of the quantitative phase,
to explore the environmental context in which nutrition transition among rural-to-
urban migrants occurs, and to examine the rural-to-urban migrant women’s
experiences and perceptions of their current food environment and changes in
diet. Lastly, I combined the quantitative and qualitative findings by using a joint

234
display which is a widely used mixed methods integration technique. This
synthesis has led to the formulation of several key meta-inferences (Chapter 8).
First, the mixed methods findings showed that at both the national and urban
slum neighbourhood level, changes in diet among rural-to-urban migrant women
seemed to reflect dominant nutrition patterns found within the urban setting. The
KDHS analysis suggested there were no distinct differences between rural-to-
urban migrant households and urban non-migrant households for obesity risk and
most food groups on a national level. Analysis of secondary data from Nairobi
slums showed that there were no distinct differences between rural-to-urban
migrant women and urban born women for obesity risk and food intake (meat,
sugary drinks, fruits and vegetables) before and after controlling for socio-
economic, demographic, environmental and behavioural characteristics. Both the
KDHS and NUHDSS analyses also indicated positive associations between
duration of urban residence and obesity risk. In the qualitative study, migrant
women generally perceived that residents born and raised in Nairobi had different
attitudes towards dietary behavior, however many said that their diets and food
sources were similar to those of the residents within their respective villages. In
addition, the qualitative study identified important dietary shifts among rural-to-
urban migrant women concerning obesogenic dietary behavior including the
incorporation of pre-prepared obesogenic food in their daily diet, use of edible
vegetable oil in food preparation, and a more individualised dietary behaviour
which involved snacking.
The second key finding of the mixed methods analysis was that rural-to-urban
migrant women’s economic circumstances were a salient influence on nutrition
transition on both a national and slum neighbourhood level and obesity risk. After
controlling for household wealth, the KDHS analysis showed no clear effect of
rural-to-urban migration on the likelihood of having obesity and intake of most
ASF, fat and sweets. In these Nairobi slums, rural-to-urban migrant women
belonging to the wealthier households were more likely to have obesity and a
more frequent intake of the luxury products red meat and sugary drinks. There
was a clear positive association between household monthly expenditures and
both sugary drink and vegetable intake. In addition to the assets- and
consumption-based economic measures, type of IGAs was also observed to be
a potentially important determinant. Self-employed women were more likely to
have obesity and reported a higher fruit intake in comparison to those who worked
at home. There appeared to be a typical economic gradient within slum
neighbourhoods among migrant women as the more affluent were more prone to
have obesity. The qualitative study identified several potential pathways which
encouraged obesogenic dietary behaviour. In particular, concerns about
235
spending scarce resources due to economic and built environmental factors such
as unsteady income-generating activities, fluctuating prices of food and cooking
supplies, a lack of saving options and competing priorities were reasons for pre-
prepared obesogenic food intake and a reduced intake of traditional food. Time
became an increasingly important resource as engagement in IGAs post-
migration meant that women worked long and irregular hours. In the NUHDSS,
there was no clear difference between single, married and separated migrant
women in terms of odds of having obesity. Apparent from the qualitative findings,
the influence of economic factors on nutrition transition among rural-to-urban
migrant women cannot be seen separately from their marital status and
household composition.
Furthermore, the NUHDSS findings showed that migrant women who watched
television daily were also more likely to have obesity and consume sugary drinks
more frequently. In the qualitative study migrant women said that with prolonged
living in the urban slum they increasingly desired convenience. High accessibility
and the normalisation of pre-prepared obesogenic food triggered and continued
intake of obesogenic food post-migration. In addition, poor infrastructure and
socio-technological changes discouraged physical activity, and in turn stimulated
their desires for this type of food and were barriers to visiting cheaper food
sources such as the wholesale market.
Third, the NUHDSS results identified only about a quarter of rural-to-urban
migrant women to be aware of diet and nutrition promotion through the media.
Inferential statistics observed weak, but positive associations between
awareness of diet and nutrition promotion and reported fruit and vegetable intake
in Nairobi’s slums. Generally women became more aware of a balanced diet
when they had more access to information in the urban environment through the
healthcare system, technology, church and social media. The qualitative study
built on this and highlighted that there was much uncertainty among rural-to-
urban migrant women concerning the determinants of weight gain. Furthermore,
rural-to-urban migrant women, and at times their husbands, felt pressured by both
rural and urban communities in their respective villages to conform to the
culturally desired body image. In general, migrant women in this sample found it
hard to adhere to healthier diets and reduce their weight due to economic,
physical and socio-cultural barriers on both a household and community level. A
few women did appear to be nutrition resilient as they were diagnosed with
disease.
Lastly, the qualitative study emphasised the potential presence of neighbourhood
effects on obesogenic dietary behaviour and reduced intake of traditional food
through physical and socio-cultural pathways irrespective of individual and

236
household socio-economic and demographic characteristics. Urban food swamp
conditions within their community encouraged pre-prepared obesogenic food
intake due to repeated exposures and promoted food purchases regardless of
individual of household characteristics. Poor hygiene standards of the growing
and selling community and consumer food environment discouraged migrant
women from consuming traditional foods (e.g. vegetables, fish and other rural
food grown in the urban area) or from cooking at home. The neighbourhood
community played an important role in convergence of the migrant’s diet to those
of the community through processes of social contagion. Migrant women shifted
to the social norm for dietary behaviour and obesity risk which shows that
structural and economic determinants of food choice are tightly interwoven with
social environmental influences. This was particularly worrying for edible oil
intake as, in addition to being affordable, being accessible and improving the
taste of “urban foods”, this was also culturally desired.
9.2 Implications of the findings for policy and practice
Due to the participatory activities within my qualitative study many of the
suggested insights are participant-led. My suggestions for policy and practice are
mainly related to the individual, household and community level as these can be
directly derived from my research findings. The qualitative study also gave more
insight into practices of other groups within the slum communities. Dissemination
meetings were held in each slum after the field activities. Attendees of the
meetings in Korogocho and Viwandani were the Chief (government official
stationed in the slum), members of the Community Advisory Committee (CAC)
and the slum village elders. The CAC was constituted in 2012 to ensure that the
two slum communities are directly involved in the research activities by APHRC.
In addition, several participants from the PhotoVoice study were invited for the
dissemination meetings in Korogocho and Viwandani. County and community
nutritionists, and CHW were present at the dissemination meeting in Kibera. We
looked into opportunities to involve the community in a similar manner as in
Korogocho and Viwandani. However, due to budgetary constraints I limited this
mainly to nutrition and health workers. The purpose of these meetings was to
disseminate the research findings and briefly discuss potential interventions to
prevent obesogenic dietary behaviour and promote traditional diets. These
meetings shed light on a variety of potential interventions across individual,
household, community and political levels applicable to rural-to-urban migrant
women and the wider slum communities. The highlights of these meetings build
on my research findings.
237
My research findings imply that it is difficult for rural-to-urban migrant women to
avoid obesogenic dietary behaviour and to maintain their traditional diet should
they desire this. It may therefore be more effective to improve accessibility, safety
and desirability of traditional foods, and healthy body image norms within slum
neighbourhood communities and connecting urban neighbourhoods (Herforth
and Ahmed, 2015; Hunter-Adams, 2017). Figure 9.1 presents an overview of the
suggested policy interventions and settings. Due to the potential pervasive
neighbourhood effects and the identified need for community-based
interventions, I took inspiration from the Community Energy Balance framework
(CEBF) to categorise and present the intervention settings and targets to facilitate
healthy food environments and improve diets among rural-to-urban migrant
women and wider population groups with whom they live together (Kumanyika et
al., 2012). The CEBF framework is based on a SEM and utilises the concept of
energy-balance (food intake and physical activity) to describe various cultural and
community influences on migrant populations’ high obesity risk and the settings,
actions pathways and change agents at individual, family and community levels
to achieve community-level healthy weight status outcomes. It is increasingly
applied to understand energy-balance behaviour among African immigrants in a
HIC, though could well be applied to other population groups (Kumanyika et al.,
2012; Renzaho et al., 2018). In addition, I categorised the interventions into
agentic, agento-structural and structural interventions. This hierarchy of
interventions is increasingly used in obesity-related intervention and policy
research in context of equity, but similar hierarchies have also been applied to
other public health matters (Adams et al., 2016; Backholer et al., 2014; Hyseni et
al., 2017). It is believed that agentic interventions widen obesity inequity among
populations whereas structural interventions narrow these. Agento-structural
interventions focus on maintaining the choice of the individual though making it
easier to choose for a healthier lifestyle (Backholer et al., 2014).
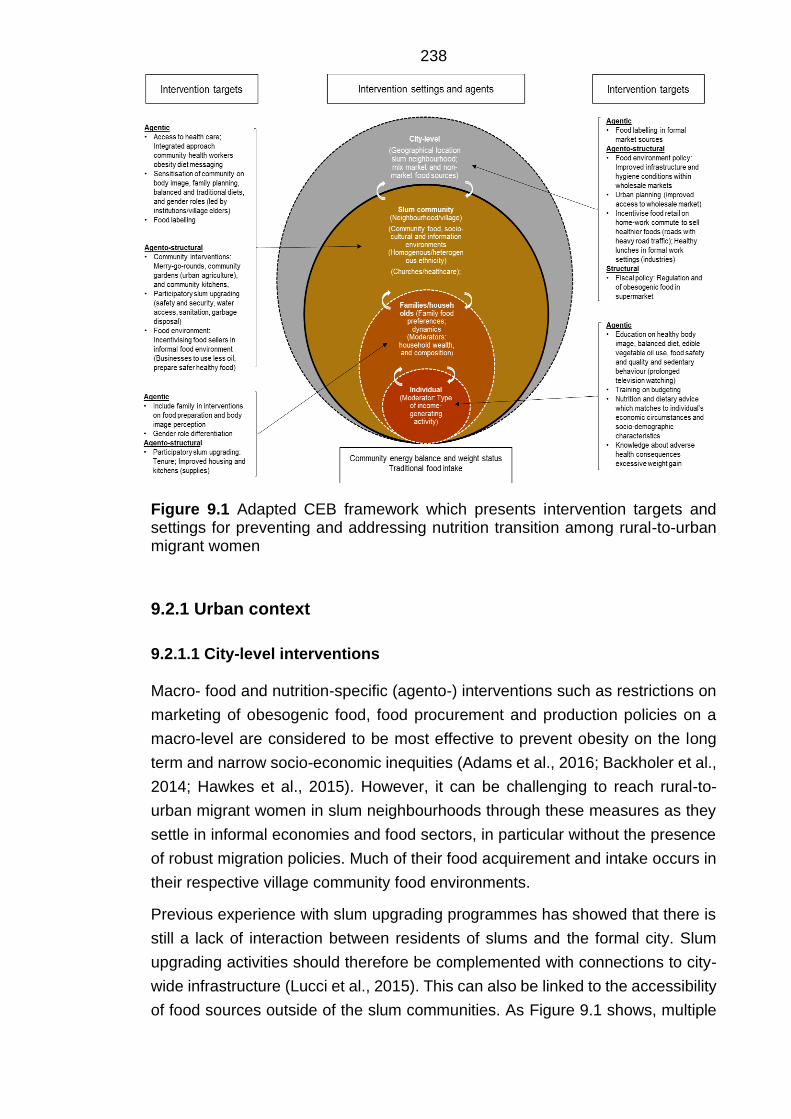
238
Figure 9.1 Adapted CEB framework which presents intervention targets and settings for preventing and addressing nutrition transition among rural-to-urban migrant women
9.2.1 Urban context
9.2.1.1 City-level interventions
Macro- food and nutrition-specific (agento-) interventions such as restrictions on
marketing of obesogenic food, food procurement and production policies on a
macro-level are considered to be most effective to prevent obesity on the long
term and narrow socio-economic inequities (Adams et al., 2016; Backholer et al.,
2014; Hawkes et al., 2015). However, it can be challenging to reach rural-to-
urban migrant women in slum neighbourhoods through these measures as they
settle in informal economies and food sectors, in particular without the presence
of robust migration policies. Much of their food acquirement and intake occurs in
their respective village community food environments.
Previous experience with slum upgrading programmes has showed that there is
still a lack of interaction between residents of slums and the formal city. Slum
upgrading activities should therefore be complemented with connections to city-
wide infrastructure (Lucci et al., 2015). This can also be linked to the accessibility
of food sources outside of the slum communities. As Figure 9.1 shows, multiple
239
actions could benefit rural-to-urban migrant women diets and nutrition status. City
improvements and affordable public transport are needed and could have a
positive effect on wholesale and wet market accessibility. This may encourage
migrant women to shop at these type of food sources more frequently, especially
during the rainy season when travelling is either more expensive and/or energy
consuming. The qualitative study highlighted that migrant women generally had
a positive attitude towards shopping at the market due to the ability to buy a
variety of food, including traditional food, in bulk. This does however have socio-
cultural implications. Social and financial support from the shopkeepers, often
their neighbourhoods or friends, was highly valued among the participants. They
mentioned they did not go frequently enough to the wholesale market to build up
social relationships, hence these types of interventions could be only feasible if
migrant women are encouraged to go frequently. Even then, more affluent
migrant women said they acquired their food within their community food
environment to save time. Evidence from Cape Town, South Africa showed that
obesogenic food located close to transport interchanges as a response to time
poverty of the urban poor (Battersby et al., 2016).
Very few participants in my research visited supermarkets (smaller retail
versions) on the outskirts of slum neighbourhoods. This would have allowed them
to acquire more food in bulk, including obesogenic foods such as crisps and
larger versions of energy-dense starchy foods such as mandazi and chapatti.
Supermarket policies which regulate the availability of obesogenic foods and
reduce the price of fibrous food such as pulses, legumes and roots with the
condition that migrant and non-migrant women have and/or reserve the time to
prepare these foods could be effective (Demmler et al., 2017). Though, these
would only reach few due to the spatial disconnect of many slum villages with
formal market sources. In addition, while there is evidence for a supermarket
expansion in Nairobi, some of the major chains are experiencing financial
difficulty (Owuor et al., 2017). The rate and degree to which the modern
supermarket regime will reduce the informal market share in SSA is unknown
though there is the expectancy that the informal markets are there to stay (Crush
and Frayne, 2011).
Of the formally employed migrant women in the qualitative study most were active
in the CBD, or industries surrounding the slum neighbourhoods. Policy initiatives
and programmes such as cheap healthy lunches could cover the gaps migrant
women face as they often skipped lunch or snacked on obesogenic foods in
between work shifts. Evidence from HIC settings has shown the workplace to be
an ideal venue to provide healthier diets and has brought positive dietary
behaviour change (fruit and vegetable intake, reduced fat intake and cholesterol
240
and weight loss) and health outcomes (Schliemann and Woodside, 2019; World
Health Organisation, 2009).
9.2.1.2 Community-level interventions
A community systems approach
Much can be done to prevent and address excessive weight gain and unhealthy
diets awaiting an improved policy environment (Lilford et al., 2017). In particular,
participatory slum upgrading could prove to be a promising multi-sectoral and
multi-component intervention to improve residents’ overall well-being (Lucci et
al., 2015). It often combines meso-policies such as tenure security, political
recognition, support for livelihoods and enhanced social services, community
engagement, together with micro-interventions such as shelter and built
environmental improvements (adequate housing, water, roads and other
infrastructures). This type of intervention could provide rural-to-urban migrant and
non-migrant women with more agency on selecting safe and nutritious diets
through improved livelihoods and improved environments (Corburn and Sverdlik,
2019). Previous literature showed that granting secure tenure, improved
governance and community engagement have all proven to be effective on
physical activity and health outcomes (Lilford et al., 2017). Some migrant women
highlighted the individualistic nature of the urban environment in which there was
little sharing of food for social, economic and time scarcity reasons.
An increasing body of global literature calls for a systems approach to address
obesity and energy-balance behaviours (Bagnall et al., 2019; Lee et al., 2017;
Swinburn et al., 2019). As obesity has been recognised as a result of complex,
adaptive systems, systems science methods are increasingly being applied to
community obesity prevention efforts (Swinburn et al., 2019). A local community
systems approach responds to the complexity of obesity through an ongoing,
dynamic and flexible way of working. It enables local stakeholders to come
together, share an understanding of the reality of the challenge, and consider
how the local systems are operating and where the greatest opportunities lie for
change. Stakeholders agree actions and decide as a network on how to
collaborate together to bring about sustainable, long term systems change (Lee
et al., 2017; Swinburn et al., 2019). Participatory slum upgrading programmes
could resemble a whole system approach, though in the past there has been
variety in terms of targets and outcomes (Lucci et al., 2015). These upgrading
programmes may be especially effective in homogenous slum villages in terms
of ethnicity, as they could more effectively address the socio-cultural and
environmental community barriers to traditional diets and promoters of
241
obesogenic dietary behaviour. The need for communal action aligns with the
opinions of multiple participants at the dissemination meetings in Korogocho and
Viwandani who urged for sensitisation on traditional diets and cooking behaviour
on a slum village level. They also acknowledged that it is challenging for
individuals to change their behavior and weight in an environment in which social
pressures are strong. Past participatory slum upgrading programmes in LMICs
have improved social cohesion within slum communities (Lucci et al., 2015).
However, evaluations of these and wider health outcomes are often absent from
these types of programmes. Furthermore, these type of structural interventions
alone are not perceived to be enough to prevent obesogenic and unsafe food
intake (Ahmed et al., 2019; Corburn and Sverdlik, 2017).
While these type of programmes were not highlighted by the participants in my
study, they did shed light on several community coping mechanisms in the
qualitative study. Some of the migrant women were involved in merry-go-rounds
(also referred to as saving schemes or micro-saving groups) that allowed them
to save money during financially insecure times, purchase food in bulk (this was
often starchy staple food such as rice, cornflour and sugar), and cope with family
tensions on the household food budget. A study in Nairobi’s slums previously
showed promising results of social safety nets on food insecurity. About 26% of
the participants were involved in some type of safety net including merry-go-
round groups and found that these participants less frequently resorted to
reducing their food intake as a coping mechanism (Amendah et al., 2014). In
addition, another study in Nairobi showed that as a result of a community-led
slum upgrading programme merry-go-rounds were formed and were effective in
building social and economic capital (Weru, 2004). Merry-go-rounds are a
promising community intervention which supports migrant women with irregular
incomes and family tensions on income distribution.
Communal agriculture projects could be accompanied with participatory slum
upgrading programmes. Few participants mentioned urban agriculture as
contributing to their diet which may be in part due to their mobility and/or recent
arrival (Maxwell, 1995; Tevera, 1996). Conversations about the inability to do
urban agriculture did arise in the PhotoVoice sessions among some participants
as a main barrier of the built food environment to traditional food intake. They
opted for a more systematic organisation of hygienic and communal urban
agriculture. There are currently no identified studies which examine the role of
urban agriculture in enhancing community access to sufficient and affordable
food (Poulsen et al., 2015; Warren et al., 2015). Future studies could look into
opportunities for scaling up urban agriculture from a household to a community
level. Policies that promote types of low-space agriculture, such as sack
242
gardening, which are more accessible to the urban poor do have the potential to
promote traditional food intake and improve household food security. However,
solutions must address the mentioned barriers such as a lack of space, insecurity
and faecal or urinal contamination which discouraged the PhotoVoice participants
from practicing individual urban agriculture. Furthermore, while it may have
potential for migrant women who are struggling with finding IGA and are able to
continue agriculture practices which aligns with their background, this may not
suit many as time scarcity has already been shown to be a promoter of pre-
prepared food intake.
In the meantime, to encourage traditional food intake, future interventions could
build on recent initiatives regarding urban agriculture practices in the slums
(Gallaher et al., 2013). However, against this are issues of poor water availability,
contamination risks and land availability. Slum populations who practiced urban
agriculture often used waste bi-products and contaminated water (Uganda
National Academy of Sciences, 2018). The Nairobi City County Assembly
implemented the Urban Agriculture Promotion and Regulation Act in Nairobi in
2015. The Act allows aspects of urban agriculture such as wall gardens, sack
gardens, and the keeping of small animals and multi-storey gardens. It was only
recently adopted as a bylaw and therefore its impact is yet to be observed (Owuor
et al., 2017).
The current literature on urban agriculture is divided on the utility of
individual/household urban agriculture on food security, dietary diversity and
nutrition outcomes (Warren et al., 2015). Whereas it may have positive
implications for migrant women in terms of social capital and increasing vegetable
diversity, focussing on these sorts of activities may draw attention away from
addressing a failing food distribution system and poor access to traditional
wholesale markets (Warren et al., 2015).
Communal activities such as community kitchens could also prove to be useful
to mitigate the lack of kitchen and storage supplies and busy lifestyles which were
for many migrant women main reasons not to engage in cooking food daily.
Community kitchens are also known as an event commonly organised by
community facilitators which provides an opportunity for a group of people to meet
regularly and prepare and/or a meal together to enhance resilience among those
experiencing food insecurity, promote empowerment and/or develop food skills.
The evaluation of this initiative in HIC settings shows mixed results. One
systematic review showed benefits of community kitchens among low-income
groups in terms of improved cooking skills, positive dietary changes (increased
diversity fruits and vegetables) and the opportunity to socialise (Iacovou et al.,
2013). However, a more recent prospective study among low-income families in
243
Canada suggested that this type of programme may not be as effective as a
means of improving access to healthy food. A lack of awareness and time for
travelling to these events were perceived to be important barriers (Kirkpatrick and
Tarasuk, 2008; Loopstra and Tarasuk, 2013).
Interventions on the built community food environment
The mixed methods analysis showed that women who sold obesogenic foods
were more prone to a higher intake of obesogenic foods and a sedentary lifestyle.
In the short-term, discouraging migrant women from engaging in street food
selling may also be challenging due to existing gender roles, relatively high
economic returns and limited other options. Migrant and non-migrant women
should therefore be encouraged to sell healthy products within their community
as this may prove to be both a stimulus to a healthier diet, and reduce intake of
fatty energy-dense foods. Previous literature has opted for education of street
food sellers; however, this may be challenging as changes of a food seller’s
inventory to include more nutritious food may affect their income and may make
street food (including the healthier) unaffordable for many. This is a delicate
matter as informal street food outlets and food vendors are pivotal in the local
informal food environment in Nairobi’s slums (Ahmed et al., 2019; Mwangi et al.,
2002; Owuor et al., 2017). Regulation of street food vending is also proposed as
a potential option. However, many fast food outlets operate in slums to avoid this,
hence this may also not be the most suitable solution (Githiri et al., 2016).
In 2013, a Food Vendors’ Association was launched in four settlements: Mathare,
Huruma, Mukuru and Kibera. The association has over 700 members which
include women selling vegetables and cooked foods, butchery owners, kiosk
owners and livestock keepers. The members are organised into local groups that
jointly buy products as well as participate in merry-go-rounds (Githiri et al., 2016).
Ensuring incorporation of migrant women in associations such as these may be
an effective solution in which affiliated CHW could play a vital role in changing
behaviour. This could also be organised in collaboration with the Food Vendor’s
Association and other local stakeholders (Ahmed et al. 2019). The use of edible
vegetable oil post-migration was driven not only due to increased availability and
affordability, but also socio-cultural and taste preferences indicating it to be
potentially difficult to reduce their intake. An example which could be transferable
to Nairobi’s slums is the Healthy Hawkers Programme in Singapore. This led to
an increase in the availability and affordability of healthier oils for use by street
vendors. A collaboration of governmental and food industry actors enabled the
production of an affordable blended oil which contained 25% less saturated fat
than the palm oil which was generally used by vendors (Hawkes et al., 2013).
244
Food safety turned out to be an important issue for rural-to-urban migrant women.
Due to the abundance of food vendors and street food sellers there were often
choices for migrant women which met their needs. However, the criteria for safe
food varied considerably amongst the participants. Participants seemed to
understand and accepted the food seller’s practices since they had to make a
profit. They did mention that the cleaner places also attracted more customers.
In addition to sensitivity by individuals about which aspects of the food seller’s
safety practices they should pay attention to, healthier foods might be sold easier
when food sellers follow the food safety practices desired by the participants.
There has already been a recent response to this. A participatory mapping study
in the Nairobi slums of Kibera, Mathare and Mukuru focused on the interactions
of food vendors within their surrounding environment and infrastructure services
to improve the food safety of informal food vendors. The data collected allowed
communities to prioritise areas for regular clean-up activities and assisted with
advocacy to improve these places in cooperation with local authorities (Ahmed et
al., 2019).
Participatory slum upgrading projects in this context may also improve the food
environment in terms of food safety and quality. A slum upgrading initiative in
Korogocho provided tarmacked roads and concrete drainage channels. There
are now common sites for food vendors’ livelihoods with the consequence of
having to sell less often near open sewers and heaps of garbage (Githiri et al.,
2016). This may particularly encourage healthy food intake among migrant
women who mainly operate within their slum community food environments.
These initiatives may also encourage cooking at home as poor hygienic
circumstances and smells discouraged this. While this may not directly influence
obesogenic dietary behaviour, it is an important factor to consider in future diet
promotion activities and maintenance of traditional diets.
9.2.1.3 Individual and household interventions
At the household or family level, key informants and participants at the
dissemination meeting suggested that interventions on maternal nutrition and
food intake could be more effective when men were involved so that they could
be educated on their responsibilities to provide for the family and to be actively
engaged in nutrition. Socio-cultural norms regarding the responsibilities of men
within the household within certain communities may jeopardise child and
women’s nutrition. My research showed mixed findings on this. Among many
households, men only had and/or felt the responsibility of providing money, and
some did not partake in the family meals. Both the research findings and
245
dissemination meetings identified that there are inter-household differences for
family dynamics and responsibilities which deserve more scrutiny.
A recent systematic review aimed to determine, among other things, the effect of
interventions on mechanisms contributing to maternal nutrition in LMICs between
2000 and 2012. Interventions that engaged men were associated with improved
maternal nutrition. Interventions in urban areas improved male partner support,
increased couple communication and joint decision-making, however with
ambiguous effects on women’s autonomy (Tokhi et al., 2018). There is however
a paucity of evidence on the effectiveness of incorporating men, and other family
members in the improvement of women’s nutrition and dietary outcomes.
Children’s preferences also played an important role in the rural-to-urban migrant
women’s dietary behaviour. For multiple reasons, such as pleasing their children
to avoid embarrassment in the community, safety and security, and financial
constraints, it was difficult for women to improve both their own and their
children’s diet. My research findings reinforce the need that future practice and
research should focus on intervention possibilities which also focus on educating
the child to inform the family which may relieve pressure from the mother
(Berhane et al., 2018).
The informal community food environments are partly shaped by the resident’s
demands, something which also became evident in this study (Smit, 2016).
Participants at the dissemination meetings suggested there was a need for
education and awareness among rural-to-urban migrant women in order to
prevent them from adopting unhealthy diets. Shifting demand may be one, albeit
challenging, part of the solution to shaping less obesogenic food environments
and promoting traditional diets within communities (Burlingame and Dernini,
2018; High Level Panel of Experts on Food Security and Nutrition, 2017). While
neighbourhood characteristics influence obesogenic food intake, including high
quantities of edible oil use and reduced intake of traditional food, the study
findings also show that economic differences within the slum neighbourhoods
may hamper the spread of education messages and even widen diet disparities.
Furthermore, findings build on previous literature which indicates that
interventions on an individual level that are agentic may not be as effective,
especially when they do not involve the household and community (Roberto et
al., 2015). The qualitative findings did however identify pointers for nutrition and
diet promotion and showed that there is still territory to win in terms of education
and knowledge. Key informants acknowledged that this may be particularly
important when their livelihoods increase.
Future health promotion activities should ideally be based upon existing lay
knowledge and food desires. Some of the migrant women said that they didn’t

246
appreciate and/or understand messages which focussed on discouraging intake
of certain foods. In general, migrant women had a positive attitude towards the
increased food options post-migration. Instead, they may be more willing to
adhere to advice which matches their own circumstances such as ethnicity
(cultural identity) and economic status. As acknowledged by key informants in
this research, when migrant women increase their income by engaging into
employment, education is needed to encourage them to spend their income on
healthier food products. However, migrant women may still not engage in
frequent cooking without cost- and time-effective cooking supplies. Stoves were
felt to be an ineffective tool to prepare traditional food and other fibrous food
which made many resort to pre- prepared street food. Other cooking methods
such as gas or electricity were perceived to be unaffordable or dangerous due to
material circumstances (e.g. close proximity to others, housing structure and lack
of space). Education on how to effectively prepare nutritious food with the
available cooking equipment is valuable in addition to investigating innovative
affordable cooking equipment (Thakur et al., 2017).
Discouraging messages may also only be effective when they can maintain
dietary diversity. Furthermore, as some migrant women in the qualitative study
pointed out, the prevention of obesogenic dietary behaviour may be effective
when people are aware and/or experience the adverse health consequences of
excessive weight gain. Participants who were with disease or were aware of
diseases within their communities showed signs of nutrition resilience despite
financial constraints. My qualitative research findings showed there to be inter-
individual differences for ideal body image perception. In support of Phillips et al.
(2016), it is important not to create a culture of obsession with thinness or body
shaming as it may further challenge mental and physical health.
As I mentioned earlier, reducing intake of edible vegetable oil use may be the
most desirable diet outcome to prevent unhealthy weight gain. Interventions and
promotion on the use of vegetable oils could consider portioning and may be
particularly effective if health promoters consider the socio-cultural value of using
oil to prepare food in these communities. The key informants in my research had
already mentioned using this in their health promotion activities. Additionally,
participants in the qualitative study appreciated the use of herbs and spices post-
migration. Simple recipes can be taught which improve the taste of food and thus
may assist in reducing the quantity and use of edible oil.
One of the key informants noted that it is challenging to reach everybody, in
particular women who only recently migrated from rural areas due insufficient
CHV. To improve the spread of nutrition and diet messages to individuals,
families and communities, both the key informants and participants at the
247
dissemination meetings opted for higher recruitment of CHV, and to educate them
on cooking and traditional food intake. Several participating migrant women
mentioned that they received health information from community workers, which
they tried to adhere to. CHV have a good understanding of the slum dynamics
and are trusted by the community (anecdotal evidence). In addition to the
utilisation of CHV, findings have shown the potential of sectors such as clinics
and churches in spreading awareness of fruit and vegetable intake. Previous
research in Nairobi recommends integrated health services (Oti, 2015). CHV who
currently address communicable diseases such as HI and child undernutrition
could also provide lifestyle modification advice on obesity and diet related NCD
(Oti, 2015). This is however challenging. A recent evaluation of nutritional
counselling and support program for breastfeeding in Nairobi’s slums highlighted
that the additional health care activities put a strain on the health care providers
and day-care centres where these activities were being held without additional
support (Goudet et al., 2018a). Hence, prior to making new suggestions for
nutrition and health promotion/counselling, there is a need for private-public
partnerships or policies which may realise a larger workforce. The Kenyan
government currently considers CHV to be part-time volunteers (Aseyo et al.,
2018). Previous studies have already proven malnutrition prevention
programmes to be highly cost-effective (Goudet et al., 2018b; Oti et al., 2016; van
de Vijver et al., 2016). Hence possibilities should be investigated in relation to
obesity.
In addition, further research is needed to explore how CHV can be efficiently and
effectively utilised to provide integrated community-based health services (Oti,
2015; Wahl et al., 2019). There is limited published material which focuses on
maternal diets and obesity. Most of the existing slum literature has paid attention
to child feeding and malnutrition (Goudet et al., 2017). Finally, a lack of presence
of the public or state actors may prove as an important barrier to addressing the
multifaceted drivers of obesity. Implementing interventions can be challenging
due to the high mobility of migrants (circular migration). There is a lack of security
due to high amounts of crime, poor physical infrastructure, and lack of willingness
to work in slums. In addition, the capacity of rural-to-urban migrant women and
other residents to participate in community-based interventions due to busy
lifestyles could be a key barrier which has to be taken into consideration for
interventions to be effective (van de Vijver et al., 2015).
Interventions and policies which target obesity and related dietary behaviour may
not be effective among migrant and non-migrant women unless they consider
time scarcity. Time scarcity has been acknowledged in the existing literature
which suggests affordable day-care services to balance childcare and
248
employment responsibilities to improve the nutrition status of mothers (Ruel et
al., 2017). There has also been a response in Nairobi. A recent report showed
the potential of subsidised childcare in Nairobi’s slums (Clark et al., 2019). The
results revealed that women were working less hours with similar earnings.
However, it should be considered that these do not necessarily lead to healthier
lifestyles. Migrant women in my research who had their children in school during
the day still resorted to pre-prepared food. Much of their time was invested in
managing their business or looking for casual jobs. According to the migrants’
accounts, skipping of home-prepared meals and pre-prepared food intake
seemed to occur at the work environment or during the daily commute. It would
be useful to evaluate the effect of this type of intervention on women’s nutrition
and dietary behaviour. Home-prepared food may not be different from pre-
prepared in terms of energy-density.
9.2.2 Rural revitalisation
While my research predominantly focussed on an urban context, when providing
recommendations for future policy and practice attention should also be paid to
rural areas and food systems. In line with previous literature, rural revitalisation
efforts, such as the lack of land rights and agricultural activities and address rural
poverty, are needed to address migration push factors (Mberu et al., 2017).
Ideally there should be equal focus on both rural and urban areas and the synergy
between these in the political sphere. In a recent Global Food Policy Report this
is referred to as rurbanomics which is an approach that emphasises linkages
between rural and urban economies (International Food Policy Research
Institute, 2019). My findings have given some indication of obesity to be
increasingly a problem of rural areas among the wealthier following urban
patterns such as a higher intake energy-dense food intake and increased use of
cheap edible vegetable oils (Keding, 2016; Madise and Letamo, 2017; Steyn and
McHiza, 2014; Toselli et al., 2016). Based on the migrants’ narratives and wider
literature, larger body image ideals are very much present in rural areas in Kenya
and wider SSA (Toselli et al., 2016). Consequent upon these findings, it may be
important for policy initiatives to approach this holistically by intervening at
availability of obesogenic food, oil use and rural community body image
perception to halt rising obesity levels in Kenya’s rural areas. It should however
be taken into account that younger rural residents perceive the city to be exciting
or migrate, continue their education or seek employment opportunities. Hence,
improved livelihoods may not necessarily reduce rural-to-urban migration (World
Bank). Furthermore, future investments in secondary cities may lead to a better
distribution of rural-to-urban migrants and increase their prospects of having
249
positive economic and health outcomes. The projections are that by 2030 Kenya
will have seven urban settlements with a total of more than 500,000 inhabitants
versus the two urban settlements in 2018 (NCPD, 2018). The recent literature
recognises that improving rural-urban linkages not only may alleviate rural
poverty, hence stabilising rural-to-urban migration rates, but also improve urban
food systems which tackles obesogenic food environments (Bloem and de Pee,
2017; International Food Policy Research Institute, 2019). In secondary or
medium-sized cities this holds potential as these may be better connected to local
food systems and are more effective platforms to trade agricultural produce,
industrial products and services with the surrounding rural areas (Bloem and de
Pee, 2017).
9.3 Contribution of my study’s findings
My research builds on the nutrition transition and urbanisation literature in SSA.
It responds to the need for context-specific evidence on the factors and
environmental context that drive nutrition transition and obesity in migrant women
living in slums. Rural-to-urban migration will not stop in the near future (Ezeh et
al., 2017). A large proportion of the migrants end up in slum settlements and
many may intend to stay for a long period. Focussing on the urban poorest is
therefore particularly valuable (Zulu et al., 2011).
My research offered a contrast to the existing evidence by focussing on a rural-
to-urban migrant group which represents a greater heterogeneity in socio-
economic and demographic status. The findings identified characteristics of rural-
to-urban migrant women who were at risk of having obesity. Furthermore, at the
initiation of my study, food environment research was gaining traction in LMICs
(Anggraini et al., 2016; Dake et al., 2016; Smit, 2016). My research represents a
novel contribution to the small evidence base on food environment-individual
behaviour interactions in SSA and wider LMICs by approaching this from a
migrants’ perspective. As such it also fed into the call for evidence on subjective
perceptions on food environments (Pitt et al., 2017; High Level Panel of Experts
on Food Security and Nutrition, 2017). A greater emphasis on how individual
migrants and environmental factors interact in the food environment has led to a
greater understanding of how environments may halt nutrition transition in the
context of rapid urbanisation.
Many studies have investigated dietary behaviour in the context of migration. My
results contribute to the migration literature by showing how changes in diet are
determined. They support previous studies that have described how these
changes are influenced by a complex interplay of factors on multiple levels of

250
influence beyond the built food environment. This research also adds to the
increasing literature on PhotoVoice in urban slums which has shown to be a
highly effective technique for gaining perceptions on contextual determinants of
behaviour and diet outcomes, and communicating the findings to a wider
audience.
Lastly, the rich description of the context and perceptions of rural-to-urban
migrant women on nutrition transition and changing food environments
highlighted key implications for improvement of diets and prevention of obesity in
slum environments.
9.4 Directions for future research
During the course of my research, a number of possible areas for further research
have emerged.
9.4.1 Longitudinal studies
My research has explored the context and factors associated with obesity and
food intake at a single time point. It would be of benefit to investigate nutrition
transition among internal migrants in longitudinal designs. In addition, future
migration research would benefit of controlling for age at migration, and gather
information on previous residency in peri-urban urban areas which would
enhance the independent effect of rural-to-urban migration on diet and nutrition
outcomes. Individual and household economic factors were identified to be
potential important moderators in the environment-individual interaction. This
deserves more scrutiny in future longitudinal migration studies which could
benefit from measuring the effect of changes in consumption and deprivation on
diets among migrants (Bag & Seth, 2018, Ensor 2020).
While there have been a few longitudinal rural-to-urban migration studies
conducted in LMICs (Cockx et al., 2018; Colozza and Avendano, 2019), these
have not been situated in slum settings, and do not control for environment
factors. As I mentioned earlier, this type of design is costly and time-consuming
(Beauchemin and Schoumaker, 2016).
Within the NUHDSS, APHRC collects data in the surveillance areas every four
months on vital events (deaths, births and migration), household characteristics
and health information (Beguy et al., 2015). Monitoring and surveillance systems
such as the NUHDSS hold the potential to incorporate information on obesity and
include a validated food questionnaire. However, slum dwellers may already be
251
overburdened with answering a multitude of questions. Due to the high mobility
of slum dwellers it may also be particularly difficult to track migrants and to
separate the effect of individual and household economic circumstances as this
might be a reason for families to move to other community villages where they
have more economic opportunities and access to basic services (Beguy et al.,
2010). Furthermore, the missing of rural non-migrants in HDSS datasets does not
allow for the testing of the direct effect of migration on changes in diet and
nutrition status.
9.4.2 Improvement and expansion of measurement tools
One of the current barriers to carrying out research on nutrition transition is the
lack of accurate measurement of energy-dense street food intake and related
portion sizes, use of general food groups (which do not specify traditional foods),
and the quantity of oil use (Walls et al., 2018). Validated food frequency
questionnaires which incorporate these dietary components would assist in
monitoring intake of traditional and energy-dense diets and better establish links
between dietary behaviour and obesity among migrant and non-migrant
populations. Ideally these would be linked to Kenyan food composition tables
(KFCT) which have recently been released by the Kenyan Government in
collaboration with the Food and Agriculture Organisation of the United Nations
(FAO) (FAO/Government of Kenya, 2018). The KFCT includes a total, 509 raw
and cooked food entries which are further grouped into 15 food groups. Slum and
National surveys such as the WHO STEPS only contain questions on a small set
of general food groups and nutrients (World Health Organisation, 2019). While
the KDHS does provide information on 15 different food groups, the food
composition tables expand on this with national mixed dishes and insects (Kenya
National Bureau of Statistics et al., 2015). Adaptation of national surveys such as
the DHS and WHO STEPS to include a more accurate reflection of national diets
could assist in more accurately examining the relationship between nutrition and
epidemiological transitions and support effective food and nutrition
policy/intervention (Elmadfa and Meyer, 2010).
The mixed perceptions of participants on availability and accessibility indicate
that prior to intervention development, mapping of the food environment is
required which could follow the example of previous studies to ensure
consistency and comparability (Ahmed et al., 2019; Lytle and Sokol, 2017).
Future studies could also confirm if the individuals’ perceptions match objective
measures of their food environment, in order to address the real and/or perceived
lack of healthy options in slum and adjacent neighbourhoods (Bridle-Fitzpatrick,
252
2015; Diez et al., 2017; Park et al., 2011). To best understand this association,
additional objective measures such as Geographic Information Systems (GIS)
and participatory community mapping could be particularly valuable. These could
be implemented in addition to subjective reports of the consumer and allow for
more insight on which aspects of the village and slum neighbourhood food
environments to address to prevent migrant and non-migrant’s obesogenic
dietary behaviour (Holdsworth and Landais, 2019; Roda et al., 2016; Turner et
al., 2018).
While food environment research is evolving, there are still many gaps in its
theory and empirical evidence, as well as in the metrics and assessment methods
which assist us in understanding how food environments and diets are changing
(High Level Panel of Experts on Food Security and Nutrition, 2017). A recent
panel meeting of 16 experts (non-government and government sectors) on food
and nutrition issues in Kenya was convened. With the Healthy Food Environment
Policy Index (Food-EPI) tool, developed by the International Network for Food
and Obesity/NCD (INFORMAS) they assessed the policies and infrastructure in
place to create healthier food environments. Several actions of importance and
feasibility were identified. These included leadership (incorporating a food
systems approach with a focus on sustainable and diverse diets), food promotion
(advertising and marketing with commercial food producers), food labelling and
food composition, all of which should be accompanied by serving guidelines and
tax policies which encourage healthy foods and discourage unhealthy foods
(Asiki et al., 2020). As mentioned earlier, as migrant women operate in pre-
dominantly informal food environments future research is required on how
interventions within the urban food system incorporate the informal food sources
and livelihoods of migrant and non-migrant women.
Food environment mapping could be embedded in wider neighbourhood level
data to get a more accurate picture of the impact of the neighbourhood on both
migrant and non-migrant groups. The call for neighbourhood and city level data
within SSA and wider LMICs is not new (Thomson et al., 2019). My research
strengthens the case that the food environment in which migrant women operate
is more than the economic (price) and built (availability and accessibility)
environments. Socio-cultural factors shape food environments and the migrants’
decision of where to acquire food partly relies on maintaining social relationships
and support. These should be taken into consideration in informal food
environments that are existent in slum neighbourhoods. Urban health decision-
makers expressed their need for neighbourhood-level data on health
determinants to generate better informed decisions on improving the environment
(Thomson et al., 2019). My research focussed on the food environment as an
253
important factor of nutrition transition among rural-to-urban migrant women.
Additional neighbourhood level data should not limit itself to the food environment
but also incorporate other important environmental aspects (Lytle and Sokol,
2017).
Furthermore, future research on theoretical and applicable research of time and
nutrition transition is needed. Recognising issues of time scarcity and
convenience could help researchers better understand obesogenic dietary
behaviour. One course of action could be the development and validation of
context metrics on time scarcity to assess tiredness, time scarcity and
convenience as barriers of planning and preparing meals, particularly among
women as they have the roles of acquiring and preparing food, raising the
children and engagement in IGA (Djupegot et al., 2017; Storfer-Isser and Musher-
Eizenman, 2013). Furthermore, it may support CHV/CHW in identifying coping
strategies for preventing obesogenic dietary behaviour in context of
environmental constraints.
9.4.3 Research and evaluation of proposed interventions
With the development of the interventions and policy changes suggested above,
operational and evaluation research is needed to identify whether these positively
affect dietary behaviour and obesity.
My research focused on women aged 18-49 years old. This allowed me to gain
a more in-depth understanding of this groups’ dietary behaviour and their
perceptions on their new environment. However, to effectively incorporate men
into interventions on changing diets and body image perceptions, an additional
step could be to obtain the perspectives of men on changing diets and food
environments which may further facilitate our understanding for gender
disparities on obesity and dietary behaviour. This may also inform future
interventions which incorporate men to improve theirs and other family members’
health (Battersby, 2011). There is need to further investigate the intersecting
influences of gender roles and the socio-cultural environment in context of
urbanisation on adults’ food choices and dietary intake among different ethnic
groups.
Furthermore, as I mentioned earlier, participatory community activities may be
important to implement in parallel with changes in food policy to prevent
obesogenic dietary behaviour and obesity. Prior to implementing community-
driven interventions one could first assess the community readiness, and expand
this with assessing whether these will reach all sub-groups. Community-
readiness assessments have been implemented in both HICs and LMICs,
254
including SSA settings (Pradeilles et al., 2019b). In addition to development of
metric scales to capture time scarcity and convenience, future policy and practice
should be evaluated for their relevance on these concepts. This aspect of
convenience deserves more scrutiny in relation to socio-technological
advancements, changing socio-cultural norms (e.g. normalisation of convenience
food) and obesity risk (Jackson and Viehoff, 2016).
There is also a need to investigate the reach of food system and environment
policy initiatives such as restrictions on marketing of obesogenic food, food
procurement and production policies which address the food environment gaps
previously identified (Asiki et al., 2020). Evaluation of the impact of future
interventions on the information environment in neighbourhoods adjacent to slum
areas on the awareness and changes in diet of migrant and non-migrant women
in slum neighbourhoods could inform future structural and agento-structural
interventions with improved economic circumstances. While the formal food
companies may not reach migrant women with their advertisement on a daily
basis, some women in my study did aspire dining in formal restaurants, or
consuming “western food” such as pizza.
A potentially important component of the urban food environment could be
community agriculture. Further investments in research and data collection are
needed to better understand the current and potential contribution of urban
agriculture to traditional food intake and reduction of obesogenic food intake. A
past Kibera study showed positive signs of urban sack gardening which at times
incorporated multiple households and improved household food security, social
capital and increased variety of green leafy vegetable intake (Gallaher et al.,
2013). There is however currently a paucity of documented urban agriculture
studies in SSA. With many rural-to-urban migrant women having a background
in farming, current constraints to urban agriculture development, including
insecure land tenure, polluted land and water must be lifted. With the new Nairobi
City Council policy on urban agriculture this may become more feasible (Owuor
et al., 2017; Zezza and Tasciotti, 2010).
Lastly, for reasons aforementioned I focussed on multiple outcomes, including
dietary intake and obesity in the quantitative, and a more specific focus on
obesogenic dietary behaviour and traditional food intake in the qualitative phase
of my research with the aim to better understand obesity risk among the urban
poor. This allowed me to gain a more detailed understanding of obesogenic
dietary behaviour among this population group. Future research could investigate
determinants of obesity in urban slums among a diverse range of population
groups, including adolescents and elderly.

255
Ideally, this occurs alongside an investigation of shared proximal and immediate
drivers of multiple forms of malnutrition, and identification of effective platforms
to enrol the implementation of cost-effective interventions which address both
undernutrition and obesity, also referred to as double duty actions. To keep the
focus on one form of malnutrition may exacerbate another form. These type of
interventions received increased attention over the last couple of years, in
particular with the release of the latest Lancet series on the double burden of
malnutrition (Popkin et al., 2020; Pradeilles et al., 2019a; World health
Organisation, 2017).
256
List of References
Abdullah, A. 2015. The Double Burden of Undernutrition and Overnutrition in Developing Countries: an Update. Current Obesity Reports. 4(3), pp.337-349.
Abrahams, Z., Mchiza, Z. and Steyn, N.P. 2011. Diet and mortality rates in Sub-Saharan Africa: Stages in the nutrition transition. BMC Public Health. 11(1), p801.
Abuya, B.A., Ciera, J. and Kimani-Murage, E. 2012. Effect of mother’s education on child’s nutritional status in the slums of Nairobi. BMC Pediatrics. 12(1), p80.
Adams, J., Mytton, O., White, M. and Monsivais, P. 2016. Why Are Some Population Interventions for Diet and Obesity More Equitable and Effective Than Others? The Role of Individual Agency. PLOS Medicine. 13(4), pe1001990.
Afolabi, W.A.O., Addo, A.A. and Sonibare, M.A. 2004. Activity pattern, energy intake and obesity among Nigerian urban market women. International Journal of Food Sciences and Nutrition. 55(2), pp.85-90.
African Population and Health Research Centre. 2001. APHRC Microdata portal. [Online]. [Accessed 21 February 2020]. Available from: http://microdataportal.aphrc.org/index.php/catalog
African Population and Health Research Centre. 2014. Population and Health Dynamics in Nairobi's Informal Settlements: Report of the Nairobi Cross-sectional Slums Survey (NCSS) 2012. [Online]. Nairobi, Kenya: African Population and Health Research Centre (APHRC) Available from: https://assets.publishing.service.gov.uk/media/57a089f240f0b64974000338/NCSS2-FINAL-Report.pdf
Aggarwal, A., Rehm, C.D., Monsivais, P. and Drewnowski, A. 2016. Importance of taste, nutrition, cost and convenience in relation to diet quality: Evidence of nutrition resilience among US adults using National Health and Nutrition Examination Survey (NHANES) 2007–2010. Preventive Medicine. 90, pp.184-192.
Agyemang, C., Boatemaa, S., Agyemang Frempong, G. and de-Graft Aikins, A. 2016. Obesity in sub-Saharan Africa. Metabolic Syndrome: A Comprehensive Textbook. pp.41-53.
Ahmed, S., Haklay, M., Tacoli, C., Githiri, G., Dávila, J.D., Allen, A. and Fèvre, E.M. 2019. Participatory mapping and food-centred justice in informal settlements in Nairobi, Kenya. Geo: Geography and Environment. 6(1), pe00077.
Ahmed, S., Simiyu, E., Githiri, G., Sverdlik, A. and Mbaka, S. 2015. Cooking up a storm: Community-led mapping and advocacy with food vendors in Nairobi's informal settlements. [Online]. International Institute for Environment and Development. [Accessed 28 July 2020]. Available from: https://pubs.iied.org/pdfs/10734IIED.pdf
Ajayi, I.O., Adebamowo, C., Adami, H.-O., Dalal, S., Diamond, M.B., Bajunirwe, F., Guwatudde, D., Njelekela, M., Nankya-Mutyoba, J. and Chiwanga, F.S. 2016. Urban–rural and geographic differences in overweight and obesity in four sub-Saharan African adult populations: a multi-country cross-sectional study. BMC Public Health. 16(1), p1126.
Ajzen, I. 2002. Perceived Behavioral Control, Self-Efficacy, Locus of Control, and the Theory of Planned Behavior. Journal of Applied Social Psychology. 32(4), pp.665-683.
Alidu, L. and Grunfeld, E.A. 2018. A systematic review of acculturation, obesity and health behaviours among migrants to high-income countries. Psychology & Health. 33(6), pp.724-745.
Alimi, B.A. 2016. Risk factors in street food practices in developing countries: A review. Food Science and Human Wellness. 5(3), pp.141-148.
257
Allen, P. and Sachs, C. 2012. Women and food chains: The gendered politics of food. International Journal of Sociology of Food and Agriculture. 15(1), pp.1-23.
Alves, J.G., Falcao, R.W., Pinto, R.A. and Correia, J.B. 2011. Obesity patterns among women in a slum area in Brazil. Journal of Health, Population and Nutrition. 29(3), pp.286-289.
Amendah, D.D., Buigut, S. and Mohamed, S. 2014. Coping Strategies among Urban Poor: Evidence from Nairobi, Kenya. PLOS One. 9(1), pe83428.
Anggraini, R., Februhartanty, J., Bardosono, S., Khusun, H. and Worsley, A. 2016. Food Store Choice Among Urban Slum Women Is Associated With Consumption of Energy-Dense Food. Asia Pacific Journal of Public Health. 28(5), pp.458-468.
Antiporta, D.A., Smeeth, L., Gilman, R.H. and Miranda, J.J. 2016. Length of urban residence and obesity among within-country rural-to-urban Andean migrants. Public Health Nutrition. 19(7), pp.1270-1278.
Anuradha, R., Ravivarman, G. and Jain, T. 2011. The prevalence of overweight and obesity among women in an urban slum of Chennai. Journal of Clinical and Diagnostic Research. 5(5), pp.957-960.
Aseyo, R.E., Mumma, J., Scott, K., Nelima, D., Davis, E., Baker, K.K., Cumming, O. and Dreibelbis, R. 2018. Realities and experiences of community health volunteers as agents for behaviour change: evidence from an informal urban settlement in Kisumu, Kenya. Human Resources for Health. 16(1), p53.
Asiki, G., Mohamed, S.F., Wambui, D., Wainana, C., Muthuri, S., Ramsay, M. and Kyobutungi, C. 2018a. Sociodemographic and behavioural factors associated with body mass index among men and women in Nairobi slums: AWI-Gen Project. Global Health Action. 11, p1470738.
Asiki, G., Shao, S., Wainana, C., Khayeka–Wandabwa, C., Haregu, T.N., Juma, P.A., Mohammed, S., Wambui, D., Gong, E., Yan, L.L. and Kyobutungi, C. 2018b. Policy environment for prevention, control and management of cardiovascular diseases in primary health care in Kenya. BMC Health Services Research. 18(1), p344.
Asiki, G., Wanjohi, M.N., Barnes, A., Bash, K., Muthuri, S., Amugsi, D., Doughman, D., Kimani, E., Vandevijvere, S. and Holdsworth, M. 2020. Benchmarking food environment policies for the prevention of diet-related non-communicable diseases in Kenya: National expert panel’s assessment and priority recommendations. PLOS One. 15(8), pe0236699.
Aworh, O.C. 2018. From lesser-known to super vegetables: the growing profile of African traditional leafy vegetables in promoting food security and wellness. Journal of the Science of Food and Agriculture. 98(10), pp.3609-3613.
Ayala, G.X., Baquero, B. and Klinger, S. 2008. A Systematic Review of the Relationship between Acculturation and Diet among Latinos in the United States: Implications for Future Research. Journal of the American Dietetic Association. 108(8), pp.1330-1344.
Backholer, K., Beauchamp, A., Ball, K., Turrell, G., Martin, J., Woods, J. and Peeters, A. 2014. A Framework for Evaluating the Impact of Obesity Prevention Strategies on Socioeconomic Inequalities in Weight. American Journal of Public Health. 104(10), pp.e43-e50.
Bag, S. and Seth, S. 2018. Does It Matter How We Assess Standard of Living? Evidence from Indian Slums Comparing Monetary and Multidimensional Approaches. Social Indicators Research. 140(2), pp.715-754.
Bagnall, A., Radley, D., Jones, R., Gately, P., Nobles, J., Van Dijk, M., Blackshaw, J., Montel, S. and Sahota, P. 2019. Whole systems approaches to obesity and other complex public health challenges: a systematic review. BMC Public Health. 19(1), p8.

258
Baker, P., Hawkes, C., Wingrove, K., Demaio, A.R., Parkhurst, J., Thow, A.M. and Walls, H. 2018. What drives political commitment for nutrition? A review and framework synthesis to inform the United Nations Decade of Action on Nutrition. BMJ Global Health. 3(1), pe000485.
Baker, S.E. and Edwards, R. 2012. How many qualitative interviews is enough? [Online]. : National Centre for Research Methods. [Accessed 28 July 2020]. Available from: http://eprints.ncrm.ac.uk/2273/4/how_many_interviews.pdf
Baranowski, T., Cerin, E. and Baranowski, J. 2009. Steps in the design, development and formative evaluation of obesity prevention-related behavior change trials. International Journal of Behavioral Nutrition and Physical Activity. 6(1), p6.
Baranowski, T., Cullen, K.W., Nicklas, T., Thompson, D. and Baranowski, J. 2003. Are current health behavioral change models helpful in guiding prevention of weight gain efforts? Obesity Research. 11, pp.23s-43s.
Battersby, J. 2011. Urban food insecurity in Cape town, South Africa: An alternative approach to food access. Development Southern Africa. 28(4), pp.545-561.
Battersby, J. and Crush, J. 2014. Africa’s Urban Food Deserts. Urban Forum. 25(2), pp.143-151.
Battersby, J., Marshak, M. and Mngqibisa, N. 2016. Mapping the Informal Food Economy of Cape Town, South Africa. [Online]. African Food Security Urban Network (AFSUN). Available from: http://www.afsun.org/wp-content/uploads/2017/06/AFSUN24.pdf
Baum, F., MacDougall, C. and Smith, D. 2006. Participatory action research. Journal of Epidemiology and Community Health. 60(10), pp.854-857.
Bazant, E.S. and Koenig, M.A. 2009. Women's satisfaction with delivery care in Nairobi's informal settlements. International Journal for Quality in Health Care. 21(2), pp.79-86.
Beauchemin, C. and Schoumaker, B. 2016. Micro Methods: Longitudinal Surveys and Analyses. In: White, M.J. ed. International Handbook of Migration and Population Distribution. Dordrecht: Springer Netherlands, pp.175-204.
Beguy, D., Bocquier, P. and Zulu, E.M. 2010. Circular migration patterns and determinants in Nairobi slum settlements. Demographic Research. 23(20), pp.549-586.
Beguy, D., Elung’ata, P., Mberu, B., Oduor, C., Wamukoya, M., Nganyi, B. and Ezeh, A. 2015. Health & demographic surveillance system profile: the Nairobi urban health and demographic surveillance system (NUHDSS). International Journal of Epidemiology. 44(2), pp.462-471.
BeLue, R., Okoror, T.A., Iwelunmor, J., Taylor, K.D., Degboe, A.N., Agyemang, C. and Ogedegbe, G. 2009. An overview of cardiovascular risk factor burden in sub-Saharan African countries: a socio-cultural perspective. Globalization and Health. 5(1), p10.
Benkeser, R.M., Biritwum, R. and Hill, A.G. 2012. Prevalence of overweight and obesity and perception of healthy and desirable body size in urban, Ghanaian women. Ghana Medical Journal. 46(2), pp.66-75.
Berhane, H.Y., Ekström, E.-C., Jirström, M., Berhane, Y., Turner, C., Alsanius, B.W. and Trenholm, J. 2018. What Influences Urban Mothers’ Decisions on What to Feed Their Children Aged Under Five—The Case of Addis Ababa, Ethiopia. Nutrients. 10(9), p1142.
Bernabe-Ortiz, A., Gilman, R.H., Smeeth, L. and Miranda, J.J. 2010. Migration surrogates and their association with obesity among within-country migrants. Obesity (Silver Spring). 18(11), pp.2199-2203.
Berry, J.W. 1997. Immigration, Acculturation, and Adaptation. Applied Psychology. 46(1), pp.5-34.

259
Beyer, L.I., Chaudhuri, J. and Kagima, B. 2016. Kenya's focus on urban vulnerability and resilience in the midst of urban transitions in Nairobi. Development Southern Africa. 33(1), pp.3-22.
Bhurosy, T. and Jeewon, R. 2014. Overweight and obesity epidemic in developing countries: a problem with diet, physical activity, or socioeconomic status? Scientific World Journal. 2014, p964236.
Bird, J., Montebruno, P. and Regan, T. 2017. Life in a slum: understanding living conditions in Nairobi’s slums across time and space. Oxford Review of Economic Policy. 33(3), pp.496-520.
Black, C., Moon, G. and Baird, J. 2014. Dietary inequalities: What is the evidence for the effect of the neighbourhood food environment? Health & Place. 27, pp.229-242.
Bloem, S. and de Pee, S. 2017. Developing approaches to achieve adequate nutrition among urban populations requires an understanding of urban development. Global Food Security. 12, pp.80-88.
Boatemaa, S., Badasu, D.M. and Aikins, A.d.-G. 2018. Food beliefs and practices in urban poor communities in Accra: implications for health interventions. BMC Public Health. 18(1), p434.
Bojorquez, I., Renteria, D. and Unikel, C. 2014. Trajectories of dietary change and the social context of migration: a qualitative study. Appetite. 81, pp.93-101.
Bojorquez, I., Rosales, C., Angulo, A., de Zapien, J., Denman, C. and Madanat, H. 2018. International migration and dietary change in Mexican women from a social practice framework. Appetite. 125, pp.72-80.
Booysen, F., van der Berg, S., Burger, R., Maltitz, M.v. and Rand, G.d. 2008. Using an Asset Index to Assess Trends in Poverty in Seven Sub-Saharan African Countries. World Development. 36(6), pp.1113-1130.
Bourne, L.T. 1996. Dietary intake in an urban african population in South Africa, with special reference to the nutrition transition. Ph.D. thesis, University of Cape Town.
Bourne, L.T., Lambert, E.V. and Steyn, K. 2002. Where does the black population of South Africa stand on the nutrition transition? Public Health Nutrition. 5(1a), pp.157-162.
Bowen, L., Ebrahim, S., De Stavola, B., Ness, A., Kinra, S., Bharathi, A.V., Prabhakaran, D. and Reddy, K.S. 2011. Dietary intake and rural-urban migration in India: a cross-sectional study. PLoS One. 6(6), pe14822.
Brant, R. 1990. Assessing Proportionality in the Proportional Odds Model for Ordinal Logistic Regression. Biometrics. 46(4), pp.1171-1178.
Bridle-Fitzpatrick, S. 2015. Food deserts or food swamps?: A mixed-methods study of local food environments in a Mexican city. Social Science & Medicine. 142, pp.202-213.
Bronfenbrenner, U. 1979. The ecology of human development: Experiments by design and nature. Cambridge, MA: Harvard University Press.
Brug, J., Kremers, S.P., Lenthe, F., Ball, K. and Crawford, D. 2008. Environmental determinants of healthy eating: in need of theory and evidence. Proceedings of the Nutrition Society. 67(3), pp.307-316.
Bryman, A. 2006. Integrating quantitative and qualitative research: how is it done? Qualitative Research. 6(1), pp.97-113.
Bryman, A. 2016. Social research methods. Oxford university press. Bryman, A., Becker, S. and Sempik, J. 2008. Quality Criteria for Quantitative, Qualitative
and Mixed Methods Research: A View from Social Policy. International Journal of Social Research Methodology. 11(4), pp.261-276.
260
Burlingame, B. and Dernini, S. 2018. Sustainable diets: Linking nutrition and food systems. CABI.
Cabassa, L.J. 2003. Measuring Acculturation: Where We Are and Where We Need to Go. Hispanic Journal of Behavioral Sciences. 25(2), pp.127-146.
Callens, K. and Seiffert, B. 2003. Methodological guide: Participatory appraisal of nutrition and household food security situations and planning of interventions from a livelihoods perspective. [Online]. Rome: The Food and Agriculture Organization of the United Nations. [Accessed 28 July 2020]. Available from: http://www.fao.org/3/ad694e/ad694e00.htm
Cannuscio, C.C., Hillier, A., Karpyn, A. and Glanz, K. 2014. The social dynamics of healthy food shopping and store choice in an urban environment. Social Science & Medicine. 122, pp.13-20.
Carolina for Kibera. 2019. Programs that Change Lives. [Online]. [Accessed 21 March]. Available from: https://carolinaforkibera.org/our-work/programs/
Carrillo-Larco, R.M., Bernabé-Ortiz, A., Pillay, T.D., Gilman, R.H., Sanchez, J.F., Poterico, J.A., Quispe, R., Smeeth, L. and Miranda, J.J. 2015. Obesity risk in rural, urban and rural-to-urban migrants: prospective results of the PERU MIGRANT study. International Journal Of Obesity. 40, p181.
Case, A. and Menendez, A. 2009. Sex differences in obesity rates in poor countries: Evidence from South Africa. Economics & Human Biology. 7(3), pp.271-282.
Caspi, C.E., Sorensen, G., Subramanian, S.V. and Kawachi, I. 2012. The local food environment and diet: a systematic review. Health & place. 18(5), pp.1172-1187.
Catalani, C. and Minkler, M. 2009. Photovoice: A Review of the Literature in Health and Public Health. Health Education & Behavior. 37(3), pp.424-451.
Chambers, R. 1994. The origins and practice of participatory rural appraisal. World Development. 22(7), pp.953-969.
Chan, R.S.M. and Woo, J. 2010. Prevention of overweight and obesity: how effective is the current public health approach. International Journal of Environmental Research and Public Health. 7(3), pp.765-783.
Chaput, J.P., Gilbert, J.A. and Tremblay, A. 2007. Relationship between food insecurity and body composition in Ugandans living in urban Kampala. Journal of the American Dietetic Association. 107(11), pp.1978-1982.
Charlton, K.E., Brewitt, P. and Bourne, L.T. 2004. Sources and credibility of nutrition information among black urban South African women, with a focus on messages related to obesity. Public Health Nutrition. 7(6), pp.801-811.
Christensen, D.L., Friis, H., Mwaniki, D.L., Kilonzo, B., Tetens, I., Boit, M.K., Omondi, B., Kaduka, L. and Borch-Johnsen, K. 2009. Prevalence of glucose intolerance and associated risk factors in rural and urban populations of different ethnic groups in Kenya. Diabetes Research and Clinical Practice. 84(3), pp.303-310.
Chweya, J.A. and Eyzaguirre, P.B. 1999. The biodiversity of traditional leafy vegetables. [Online]. University of Nairobi. Available from: https://www.bioversityinternational.org/fileadmin/user_upload/online_library/publications/pdfs/The_biodiversity_of_traditional_leafy_vegetables.pdf
Clark, S., Kabiru, C.W., Laszlo, S. and Muthuri, S. 2019. The Impact of Childcare on Poor Urban Women’s Economic Empowerment in Africa. Demography. 56(4), pp.1247-1272.
Cobb, L.K., Appel, L.J., Franco, M., Jones-Smith, J.C., Nur, A. and Anderson, C.A.M. 2015. The relationship of the local food environment with obesity: A systematic review of methods, study quality, and results. Obesity. 23(7), pp.1331-1344.
Cockx, L., Colen, L. and De Weerdt, J. 2018. From corn to popcorn? Urbanization and dietary change: Evidence from rural-urban migrants in Tanzania. World Development. 110, pp.140-159.
261
Cohen, D.A. 2008. Obesity and the built environment: changes in environmental cues cause energy imbalances. International Journal of Obesity. 32, pp.S137-S142.
Cohen, D.A. and Babey, S.H. 2012. Contextual influences on eating behaviours: heuristic processing and dietary choices. Obesity Reviews. 13(9), pp.766-779.
Cohen, E., Amougou, N., Ponty, A., Loinger-Beck, J., Nkuintchua, T., Monteillet, N., Bernard, J.Y., Said-Mohamed, R., Holdsworth, M. and Pasquet, P. 2017. Nutrition Transition and Biocultural Determinants of Obesity among Cameroonian Migrants in Urban Cameroon and France. International Journal of Environmental Research and Public Health. 14(7), p696.
Cohen, E., Boetsch, G., Palstra, F.P. and Pasquet, P. 2013. Social valorisation of stoutness as a determinant of obesity in the context of nutritional transition in Cameroon: The Bamiléké case. Social Science & Medicine. 96, pp.24-32.
Cohen, E., Ndao, A., Faye, B., Ndiaye, S., Ndiaye, E.H.M., Ezan, G., Gueye, L., Boëtsch, G., Pasquet, P. and Chapuis-Lucciani, N. 2018. Large body size as a socially valued factor determining excess weight and obesity in the context of the nutritional transition in Senegal. Bulletins et Mémoires de la Société d’Anthropologie de Paris. 30(1-2), pp.59-69.
Cohen, M.J. and Garrett, J.L. 2010. The food price crisis and urban food (in)security. Environment and Urbanization. 22(2), pp.467-482.
Colozza, D. and Avendano, M. 2019. Urbanisation, dietary change and traditional food practices in Indonesia: A longitudinal analysis. Social Science & Medicine. 233, pp.103-112.
Cooper, C.M. and Yarbrough, S.P. 2010. Tell Me—Show Me: Using Combined Focus Group and Photovoice Methods to Gain Understanding of Health Issues in Rural Guatemala. Qualitative Health Research. 20(5), pp.644-653.
Corburn, J. and Hildebrand, C. 2015. Slum Sanitation and the Social Determinants of Women’s Health in Nairobi, Kenya. Journal of Environmental and Public Health. 2015, pp.1-7.
Corburn, J. and Sverdlik, A. 2017. Slum Upgrading and Health Equity. International Journal of Environmental Research and Public Health. 14(4), p342.
Corburn, J. and Sverdlik, A. 2019. Informal Settlements and Human Health. In: Nieuwenhuijsen, M. and Khreis, H. eds. Integrating Human Health into Urban and Transport Planning: A Framework. Cham: Springer International Publishing, pp.155-171.
Corden, A. and Sainsbury, R. 2006. Using Verbatim Quotations in Reporting Qualitative Social Research: Researchers' views. [Online]. University of York, York: Social Policy Research Unit. [Accessed 28 July 2020]. Available from: http://www.york.ac.uk/inst/spru/pubs/pdf/verbquotresearch.pdf
Cornelsen, L., Alarcon, P., Häsler, B., Amendah, D.D., Ferguson, E., Fèvre, E.M., Grace, D., Dominguez-Salas, P. and Rushton, J. 2016. Cross-sectional study of drivers of animal-source food consumption in low-income urban areas of Nairobi, Kenya. BMC Nutrition. 2(1), p70.
Cornwall, A. and Jewkes, R. 1995. What is participatory research? Social Science & Medicine. 41(12), pp.1667-1676.
Covic, N. and Hendriks, S.L. 2015. Achieving a nutrition revolution for Africa: The road to healthier diets and optimal nutrition. [Online]. Washington, D.C.: International Food Policy Research Institute (IFPRI). [Accessed 28 July 2020]. Available from: http://dx.doi.org/10.2499/9780896295933
Crawford, D., Jeffery, R.W., Ball, K. and Brug, J. 2010. Obesity Epidemiology: From Aetiology to Public Health. 2 ed.
Creswell, J.W. 2013. Research design: Qualitative, quantitative, and mixed methods approaches. Sage publications.
262
Creswell, J.W. and Clark, V.L.P. 2017. Designing and conducting mixed methods research. Sage publications.
Creswell, J.W., Klassen, A.C., Plano Clark, V.L. and Smith, K.C. 2011. Best practices for mixed methods research in the health sciences. Bethesda, MD: National Institutes of Health. 10, p61.
Crush, J., Frayne, B. and Pendleton, W. 2012. The Crisis of Food Insecurity in African Cities. Journal of Hunger & Environmental Nutrition. 7(2-3), pp.271-292.
Crush, J., Hovorka, A. and Tevera, D. 2011. Food security in Southern African cities:The place of urban agriculture. Progress in Development Studies. 11(4), pp.285-305.
Crush, J.S. and Frayne, G.B. 2011. Urban food insecurity and the new international food security agenda. Development Southern Africa. 28(4), pp.527-544.
Cummins, S. and Macintyre, S. 2005. Food environments and obesity—neighbourhood or nation? International Journal of Epidemiology. 35(1), pp.100-104.
Dake, F.A., Thompson, A.L., Ng, S.W., Agyei-Mensah, S. and Codjoe, S.N. 2016. The Local Food Environment and Body Mass Index among the Urban Poor in Accra, Ghana. Journal of Urban Health. 93(3), pp.438-455.
Dake, F.A.A., Tawiah, E.O. and Badasu, D.M. 2011. Sociodemographic correlates of obesity among Ghanaian women. Public Health Nutrition. 14(7), pp.1285-1291.
de Brauw, A., Mueller, V. and Lee, H.L. 2014. The Role of Rural–Urban Migration in the Structural Transformation of Sub-Saharan Africa. World Development. 63, pp.33-42.
de Brauw, A., Mueller, V. and Woldehanna, T. 2017. Does Internal Migration Improve Overall Well-Being in Ethiopia?†. Journal of African Economies. 27(3), pp.347-365.
Dekker, L.H., Snijder, M.B., Beukers, M.H., de Vries, J.H., Brants, H.A., de Boer, E.J., van Dam, R.M., Stronks, K. and Nicolaou, M. 2011. A prospective cohort study of dietary patterns of non-western migrants in the Netherlands in relation to risk factors for cardiovascular diseases: HELIUS-Dietary Patterns. BMC Public Health. 11, p441.
Delavari, M., Sønderlund, A.L., Swinburn, B., Mellor, D. and Renzaho, A. 2013. Acculturation and obesity among migrant populations in high income countries – a systematic review. BMC Public Health. 13(1), p458.
Demmler, K.M., Klasen, S., Nzuma, J.M. and Qaim, M. 2017. Supermarket purchase contributes to nutrition-related non-communicable diseases in urban Kenya. PLOS One. 12(9), pe0185148.
Development Initiatives. 2018. 2018 Global Nutrition Report: Shining a light to spur action on nutrition. [Online]. Bristol, UK: Development Initiatives. [Accessed 28 July 2020]. Available from: https://globalnutritionreport.org/d7447a
Devine, C.M. 2005. A Life Course Perspective: Understanding Food Choices in Time, Social Location, and History. Journal of Nutrition Education and Behavior. 37(3), pp.121-128.
Di Cesare, M., Khang, Y.-H., Asaria, P., Blakely, T., Cowan, M.J., Farzadfar, F., Guerrero, R., Ikeda, N., Kyobutungi, C., Msyamboza, K.P., Oum, S., Lynch, J.W., Marmot, M.G. and Ezzati, M. 2013. Inequalities in non-communicable diseases and effective responses. The Lancet. 381(9866), pp.585-597.
Diez, J., Conde, P., Sandin, M., Urtasun, M., Lopez, R., Carrero, J.L., Gittelsohn, J. and Franco, M. 2017. Understanding the local food environment: A participatory photovoice project in a low-income area in Madrid, Spain. Health Place. 43, pp.95-103.
Dinsa, G.D., Goryakin, Y., Fumagalli, E. and Suhrcke, M. 2012. Obesity and socioeconomic status in developing countries: a systematic review. Obesity Reviews. 13(11), pp.1067-1079.
263
Djupegot, I.L., Nenseth, C.B., Bere, E., Bjørnarå, H.B.T., Helland, S.H., Øverby, N.C., Torstveit, M.K. and Stea, T.H. 2017. The association between time scarcity, sociodemographic correlates and consumption of ultra-processed foods among parents in Norway: a cross-sectional study. BMC Public Health. 17(1), p447.
Djurfeldt, A.A. 2015. Multi-Local Livelihoods and Food Security in Rural Africa. Journal of International Development. 27(4), pp.528-545.
Dominguez-Salas, P., Alarcón, P., Häsler, B., Dohoo, I.R., Colverson, K., Kimani-Murage, E.W., Alonso, S., Ferguson, E., Fèvre, E.M., Rushton, J. and Grace, D. 2016. Nutritional characterisation of low-income households of Nairobi: socioeconomic, livestock and gender considerations and predictors of malnutrition from a cross-sectional survey. BMC Nutrition. 2(1), p47.
Dorélien, A., Balk, D. and Todd, M. 2013. What Is Urban? Comparing a Satellite View with the Demographic and Health Surveys. Population and Development Review. 39(3), pp.413-439.
Draper, C.E., Davidowitz, K.J. and Goedecke, J.H. 2016. Perceptions relating to body size, weight loss and weight-loss interventions in black South African women: a qualitative study. Public Health Nutrition. 19(3), pp.548-556.
Drewnowski, A. and Kawachi, I. 2015. Diets and Health: How Food Decisions Are Shaped by Biology, Economics, Geography, and Social Interactions. Big Data. 3(3), pp.193-197.
Drewnowski, A., Mennella, J.A., Johnson, S.L. and Bellisle, F. 2012. Sweetness and Food Preference. The Journal of Nutrition. 142(6), pp.1142S-1148S.
Drewnowski, A. and Popkin, B.M. 1997. The Nutrition Transition: New Trends in the Global Diet. Nutrition Reviews. 55(2), pp.31-43.
Drewnowski, A. and Specter, S. 2004. Poverty and obesity: the role of energy density and energy costs. The American Journal of Clinical Nutrition. 79(1), pp.6-16.
Ebrahim, S., Kinra, S., Bowen, L., Andersen, E., Ben-Shlomo, Y., Lyngdoh, T., Ramakrishnan, L., Ahuja, R.C., Joshi, P., Das, S.M., Mohan, M., Davey Smith, G., Prabhakaran, D., Reddy, K.S. and Indian Migration Study, g. 2010. The effect of rural-to-urban migration on obesity and diabetes in India: a cross-sectional study. PLOS Medicine. 7(4), pe1000268.
Elmadfa, I. and Meyer, A.L. 2010. Importance of food composition data to nutrition and public health. European Journal of Clinical Nutrition. 64(3), pp.S4-S7.
Elsey, H., Manandah, S., Sah, D., Khanal, S., MacGuire, F., King, R., Wallace, H. and Baral, S.C. 2016a. Public Health Risks in Urban Slums: Findings of the Qualitative ‘Healthy Kitchens Healthy Cities’ Study in Kathmandu, Nepal. PLOS One. 11(9), pe0163798.
Elsey, H., Poudel, A.N., Ensor, T., Mirzoev, T., Newell, J.N., Hicks, J.P., Cartwright, C., Wong, D., Tait, C., Baral, S., Bhattarai, R., Khanal, S., Dhungel, R., Gajurel, S., Manandhar, S., Mashreky, S., Ferdoush, J., Huque, R., Ferdous, T., Nasreen, S., Van Minh, H., Duc, D.M., Ngoc, B., Thomson, D. and Wallace, H. 2018. Improving household surveys and use of data to address health inequities in three Asian cities: protocol for the Surveys for Urban Equity (SUE) mixed methods and feasibility study. BMJ Open. 8(11), pe024182.
Elsey, H., Thomson, D.R., Lin, R., Maharjan, U., Agarwal, S. and Newell, J. 2016b. Addressing Inequities in Urban Health: Do Decision-Makers Have the Data They Need? Report from the Urban Health Data Special Session at International Conference on Urban Health Dhaka 2015. Journal of Urban Health. 93(3), pp.526-537.
Emmel, N. 2013. Sampling and Choosing Cases in Qualitative Research: A Realist Approach. [Online]. London. [Accessed 2020/03/15]. Available from:
264
https://methods.sagepub.com/book/sampling-and-choosing-cases-in-qualitative-research
Eriksen, S.H., Brown, K. and Kelly, P.M. 2005. The Dynamics of Vulnerability: Locating Coping Strategies in Kenya and Tanzania. The Geographical Journal. 171(4), pp.287-305.
Ettarh, R., Van de Vijver, S., Oti, S. and Kyobutungi, C. 2013. Overweight, obesity, and perception of body image among slum residents in Nairobi, Kenya, 2008-2009. Preventing Chronic Disease. 10, pE212.
Ezeh, A., Oyebode, O., Satterthwaite, D., Chen, Y.-F., Ndugwa, R., Sartori, J., Mberu, B., Melendez-Torres, G.J., Haregu, T., Watson, S.I., Caiaffa, W., Capon, A. and Lilford, R.J. 2017. The history, geography, and sociology of slums and the health problems of people who live in slums. The Lancet. 389(10068), pp.547-558.
FAO/Government of Kenya. 2018. Kenya Food Composition Tables. [Online]. Nairobi: The Food and Agriculture Organization of the United Nations, The Ministry of Health, Republic of Kenya and The Ministry of Agriculture and Irrigation, Republic of Kenya. Available from: http://www.fao.org/3/I9120EN/i9120en.pdf
Farrell, P., Thow, A.M., Abimbola, S., Faruqui, N. and Negin, J. 2017. How food insecurity could lead to obesity in LMICs When not enough is too much: a realist review of how food insecurity could lead to obesity in low-and middle-income countries. Health Promotion International. 33(5), pp.812-826.
Faye, O., Baschieri, A., Falkingham, J. and Muindi, K. 2011. Hunger and Food Insecurity in Nairobi’s Slums: An Assessment Using IRT Models. Journal of Urban Health. 88(2), pp.235-255.
Fetters, M.D., Curry, L.A. and Creswell, J.W. 2013. Achieving Integration in Mixed Methods Designs—Principles and Practices. Health Services Research. 48(6pt2), pp.2134-2156.
Floro, M.S. and Bali Swain, R. 2013. Food Security, Gender, and Occupational Choice among Urban Low-Income Households. World Development. 42, pp.89-99.
Foeken, D.W.J. and Owuor, S.O. 2008. Farming as a livelihood source for the urban poor of Nakuru, Kenya. Geoforum. 39(6), pp.1978-1990.
Food and Agriculture Organization. 2003. Trade Reforms and Food Security: Conceptualizing the Linkages. [Online]. Rome: Food and Agriculture Organization of the United Nations (FAO). [Accessed 28 July 2020]. Available from: http://www.fao.org/3/a-y4671e.pdf
Food and Agriculture Organization of the United Nations. 2016. Influencing food environments for healthy diets. [Online]. Rome: Food and Agriculture Organization of the United Nations (FAO). Available from: http://www.fao.org/3/a-i6484e.pdf
Ford, N.D., Patel, S.A. and Narayan, K.M.V. 2017. Obesity in Low- and Middle-Income Countries: Burden, Drivers, and Emerging Challenges. Annual Review of Public Health. 38(1), pp.145-164.
Fox, S. 2014. The Political Economy of Slums: Theory and Evidence from Sub-Saharan Africa. World Development. 54, pp.191-203.
Franklin, B., Jones, A., Love, D., Puckett, S., Macklin, J. and White-Means, S. 2012. Exploring Mediators of Food Insecurity and Obesity: A Review of Recent Literature. Journal of Community Health. 37(1), pp.253-264.
Fraser, B. 2005. Latin America's urbanisation is boosting obesity. The Lancet. 365(9476), pp.1995-1996.
Frayne, B. 2004. Migration and urban survival strategies in Windhoek, Namibia. Geoforum. 35(4), pp.489-505.
Frayne, B., Pendleton, W., Crush, J., Acquah, B., Battersby-Lennard, J., Bras, E., Chiweza, A., Dlamini, T., Fincham, R. and Kroll, F. 2010. The state of urban food
265
insecurity in southern Africa. [Online]. [Accessed 28 July 2020]. Available from: http://www.afsun.org/wp-content/uploads/2013/09/AFSUN_2.pdf
Furst, T., Connors, M., Bisogni, C.A., Sobal, J. and Falk, L.W. 1996. Food Choice: A Conceptual Model of the Process. Appetite. 26(3), pp.247-266.
Gale, N.K., Heath, G., Cameron, E., Rashid, S. and Redwood, S. 2013. Using the framework method for the analysis of qualitative data in multi-disciplinary health research. BMC Medical Research Methodology. 13(1), p117.
Gallacher, L.-A. and Gallagher, M. 2008. Methodological Immaturity in Childhood Research?: Thinking through `participatory methods'. Childhood. 15(4), pp.499-516.
Gallaher, C.M., Kerr, J.M., Njenga, M., Karanja, N.K. and WinklerPrins, A.M.G.A. 2013. Urban agriculture, social capital, and food security in the Kibera slums of Nairobi, Kenya. Agriculture and Human Values. 30(3), pp.389-404.
Garnweidner, L.M., Terragni, L., Pettersen, K.S. and Mosdol, A. 2012. Perceptions of the Host Country's Food Culture among Female Immigrants from Africa and Asia: Aspects Relevant for Cultural Sensitivity in Nutrition Communication. Journal of Nutrition Education and Behavior. 44(4), pp.335-342.
Gaur, K., Keshri, K. and Joe, W. 2013. Does living in slums or non-slums influence women's nutritional status? Evidence from Indian mega-cities. Social Science & Medicine. 77, pp.137-146.
Ginsburg, C., Bocquier, P., Béguy, D., Afolabi, S., Augusto, O., Derra, K., Herbst, K., Lankoande, B., Odhiambo, F., Otiende, M., Soura, A., Wamukoya, M., Zabré, P., White, M.J. and Collinson, M.A. 2016. Healthy or unhealthy migrants? Identifying internal migration effects on mortality in Africa using health and demographic surveillance systems of the INDEPTH network. Social Science & Medicine. 164, pp.59-73.
Giskes, K., Avendaňo, M., Brug, J. and Kunst, A.E. 2010. A systematic review of studies on socioeconomic inequalities in dietary intakes associated with weight gain and overweight/obesity conducted among European adults. Obesity Reviews. 11(6), pp.413-429.
Gitau, T.M., Micklesfield, L.K., Pettifor, J.M. and Norris, S.A. 2014. Changes in Eating Attitudes, Body Esteem and Weight Control Behaviours during Adolescence in a South African Cohort. PLOS One. 9(10), pe109709.
Githiri, G., Ngugi, R., Njoroge, P. and Sverdlik, A. 2016. Nourishing Livelihoods: Recognising and Supporting Food Vendors in Nairobi’s Informal Settlements. [Online]. International Institute for Environment and Development. [Accessed 28 July 2020]. Available from: https://pubs.iied.org/pdfs/10762IIED.pdf
Glanz, K., Sallis, J.F., Saelens, B.E. and Frank, L.D. 2005. Healthy Nutrition Environments: Concepts and Measures. American Journal of Health Promotion. 19(5), pp.330-333.
Global Panel on Agriculture and Food Systems for Nutrition. 2016. Food systems and diets: Facing the challenges of the 21st century. [Online]. London, UK. [Accessed 28 July 2020]. Available from: http://glopan.org/sites/default/files/ForesightReport.pdf
Godfrey, K.M., Reynolds, R.M., Prescott, S.L., Nyirenda, M., Jaddoe, V.W., Eriksson, J.G. and Broekman, B.F. 2017. Influence of maternal obesity on the long-term health of offspring. The Lancet Diabetes & Endocrinology. 5(1), pp.53-64.
Goodfellow, T. 2013. Planning and development regulation amid rapid urban growth: Explaining divergent trajectories in Africa. Geoforum. 48, pp.83-93.
Goudet, S., Griffiths, P., Wainaina, C., N Macharia, T., Wekesah, F., Wanjohi, M., Muriuki, P. and Kimani-Murage, E. 2018a. Social value of a nutritional counselling

266
and support program for breastfeeding in urban poor settings, Nairobi. BMC Public Health. 18(1), p424.
Goudet, S., Jayaraman, A., Chanani, S., Osrin, D., Devleesschauwer, B., Bogin, B., Madise, N. and Griffiths, P. 2018b. Cost effectiveness of a community based prevention and treatment of acute malnutrition programme in Mumbai slums, India. PLOS One. 13(11), pe0205688.
Goudet, S.M., Kimani-Murage, E.W., Wekesah, F., Wanjohi, M., Griffiths, P.L., Bogin, B. and Madise, N.J. 2017. How does poverty affect children's nutritional status in Nairobi slums? A qualitative study of the root causes of undernutrition. Public Health Nutrition. 20(4), pp.608-619.
Government of Kenya. 2020. About Vision 2030. [Online]. [Accessed 13 March 2020]. Available from: https://vision2030.go.ke/about-vision-2030/
Gradidge, P.J.-L., Norris, S.A., Micklesfield, L.K. and Crowther, N.J. 2015. The role of lifestyle and psycho-social factors in predicting changes in body composition in black south African women. PLOS One. 10(7), pe0132914.
Grant, J. 2010. Spatial inequality and urban poverty traps. [Online]. London, UK: Overseas Development Institute. [Accessed 28 July 2020]. Available from: https://www.odi.org/sites/odi.org.uk/files/odi-assets/publications-opinion-files/5502.pdf
Gross, R., Schoeneberger, H., Pfeifer, H. and Preuss, H.-J. 2000. The four dimensions of food and nutrition security: definitions and concepts. SCN News. 20, pp.20-25.
Gubbels, J.S., Van Kann, D.H.H., de Vries, N.K., Thijs, C. and Kremers, S.P.J. 2014. The next step in health behavior research: the need for ecological moderation analyses - an application to diet and physical activity at childcare. International Journal of Behavioral Nutrition and Physical Activity. 11(1), p52.
Guest, G., Bunce, A. and Johnson, L. 2006. How many interviews are enough? An experiment with data saturation and variability. Field Methods. 18(1), pp.59-82.
Guetterman, T.C., Fetters, M.D. and Creswell, J.W. 2015. Integrating Quantitative and Qualitative Results in Health Science Mixed Methods Research Through Joint Displays. The Annals of Family Medicine. 13(6), pp.554-561.
Gulyani, S. and Talukdar, D. 2010. Inside Informality: The Links Between Poverty, Microenterprises, and Living Conditions in Nairobi’s Slums. World Development. 38(12), pp.1710-1726.
Gupta, V., Downs, S.M., Ghosh-Jerath, S., Lock, K. and Singh, A. 2016. Unhealthy Fat in Street and Snack Foods in Low-Socioeconomic Settings in India: A Case Study of the Food Environments of Rural Villages and an Urban Slum. The Journal of Nutrition Education and Behavior. 48(4), pp.269-279 e261.
Haggblade, S., Duodu, K.G., Kabasa, J.D., Minnaar, A., Ojijo, N.K. and Taylor, J.R. 2016. Emerging Early Actions to Bend the Curve in Sub-Saharan Africa’s Nutrition Transition. Food and Nutrition Bulletin. 37(2), pp.219-241.
Hansen, A.W., Christensen, D.L., Larsson, M.W., Eis, J., Christensen, T., Friis, H., Mwaniki, D.L., Kilonzo, B., Boit, M.K., Borch-Johnsen, K. and Tetens, I. 2011. Dietary patterns, food and macronutrient intakes among adults in three ethnic groups in rural Kenya. Public Health Nutrition. 14(9), pp.1671-1679.
Haregu, T.N., Mohamed, S.F., Muthuri, S., Khayeka-Wandabwa, C. and Kyobutungi, C. 2018. Body mass index and wealth index: positively correlated indicators of health and wealth inequalities in Nairobi slums. Global Health, Epidemiology and Genomics. 3, pe11.
Haregu, T.N., Oti, S., Egondi, T. and Kyobutungi, C. 2016a. Measurement of overweight and obesity an urban slum setting in sub-Saharan Africa: a comparison of four anthropometric indices. BMC Obesity. 3, p46.
267
Haregu, T.N., Oti, S., Ngomi, N., Khayeka–wandabwa, C., Egondi, T. and Kyobutungi, C. 2016b. Interlinkage among cardio-metabolic disease markers in an urban poor setting in Nairobi, Kenya. Global Health Action. 9(1), p30626.
Hawkes, C. 2006. Uneven dietary development: linking the policies and processes of globalization with the nutrition transition, obesity and diet-related chronic diseases. Global Health. 2, p4.
Hawkes, C., Jewell, J. and Allen, K. 2013. A food policy package for healthy diets and the prevention of obesity and diet-related non-communicable diseases: the NOURISHING framework. Obesity Reviews. 14(S2), pp.159-168.
Hawkes, C., Smith, T.G., Jewell, J., Wardle, J., Hammond, R.A., Friel, S., Thow, A.M. and Kain, J. 2015. Smart food policies for obesity prevention. The Lancet. 385(9985), pp.2410-2421.
Herforth, A. and Ahmed, S. 2015. The food environment, its effects on dietary consumption, and potential for measurement within agriculture-nutrition interventions. Food Security. 7(3), pp.505-520.
Hernández, A.V., Pasupuleti, V., Deshpande, A., Bernabé-Ortiz, A. and Miranda, J.J. 2012. Effect of rural-to-urban within-country migration on cardiovascular risk factors in low-and middle-income countries: a systematic review. Heart. 98(3), pp.185-194.
Higgs, S. and Thomas, J. 2016. Social influences on eating. Current Opinion in Behavioral Sciences. 9, pp.1-6.
High Level Panel of Experts on Food Security and Nutrition. 2017. Nutrition and Food Systems. Rome, Italy: Committee on World Food Security.
Hilbe, J.M. 2011. Negative Binomial Regression. 2 ed. Cambridge: Cambridge University Press.
Hilmers, A., Bernabe-Ortiz, A., Gilman, R.H., McDermott, A.Y., Smeeth, L. and Miranda, J.J. 2016. Rural-to-Urban Migration: Socioeconomic Status But Not Acculturation was Associated with Overweight/Obesity Risk. The Journal of Immigrant and Minority Health. 18(3), pp.644-651.
Himmelgreen, D.A., Cantor, A., Arias, S. and Romero Daza, N. 2014. Using a biocultural approach to examine migration/globalization, diet quality, and energy balance. Physiology & Behavior. 134, pp.76-85.
Holdsworth, M., Delpeuch, F., Landais, E., Gartner, A., Eymard-Duvernay, S. and Maire, B. 2006. Knowledge of dietary and behaviour-related determinants of non-communicable disease in urban Senegalese women. Public Health Nutrition. 9(8), pp.975-981.
Holdsworth, M. and Landais, E. 2019. Urban food environments in Africa: implications for policy and research. Proceedings of the Nutrition Society. 78(4), pp.513-525.
Holm, S. 1979. A Simple Sequentially Rejective Multiple Test Procedure. Scandinavian Journal of Statistics. 6(2), pp.65-70.
Holmboe-Ottesen, G. and Wandel, M. 2012. Changes in dietary habits after migration and consequences for health: a focus on South Asians in Europe. Food & Nutrition Research. 56.
Hosmer Jr, D.W., Lemeshow, S. and Sturdivant, R. 2013. Applied logistic regression. John Wiley & Sons.
Howe, L.D., Galobardes, B., Matijasevich, A., Gordon, D., Johnston, D., Onwujekwe, O., Patel, R., Webb, E.A., Lawlor, D.A. and Hargreaves, J.R. 2012. Measuring socio-economic position for epidemiological studies in low- and middle-income countries: a methods of measurement in epidemiology paper. International Journal of Epidemiology. 41(3), pp.871-886.
268
Hulme, D. and McKay, A. 2013. Identifying and Measuring Chronic Poverty: Beyond Monetary Measures? In: Kakwani, N. and Silber, J. eds. The Many Dimensions of Poverty. London: Palgrave Macmillan UK, pp.187-214.
Hunter-Adams, J. 2017. Exploring Perceptions of the Food Environment Amongst Congolese, Somalis and Zimbabweans Living in Cape Town. International Migration. 55(4), pp.78-87.
Hyseni, L., Elliot-Green, A., Lloyd-Williams, F., Kypridemos, C., O’Flaherty, M., McGill, R., Orton, L., Bromley, H., Cappuccio, F.P. and Capewell, S. 2017. Systematic review of dietary salt reduction policies: Evidence for an effectiveness hierarchy? PLOS One. 12(5), pe0177535.
Iacovou, M., Pattieson, D.C., Truby, H. and Palermo, C. 2013. Social health and nutrition impacts of community kitchens: a systematic review. Public Health Nutrition. 16(3), pp.535-543.
ICF. 2012. The DHS Program STATcompiler. [Online]. [Accessed 28 June 2019]. Available from: http://www.statcompiler.com.
International Food Policy Research Institute. 2015. Global Nutrition Report 2015: Actions and Accountability to Advance Nutrition and Sustainable Development. [Online]. Washington, DC.: International Food Policy Research Institute (IFPRI). [Accessed 28 July 2020]. Available from: https://globalnutritionreport.org/documents/13/english_15.pdf
International Food Policy Research Institute. 2019. 2019 Global food policy report. [Online]. Washington, DC: : International Food Policy Research Institute (IFPRI). [Accessed 28 July 2020]. Available from: https://doi.org/10.2499/9780896293502
International Organization for Migration. 2011. Glossary on Migration. [Online]. 2 ed. Geneva, Switzerland: International Organization for Migration (IOM). [Accessed 28 July 2020]. Available from: https://publications.iom.int/system/files/pdf/iml25_1.pdf
International Organization for Migration. 2015. Migration in Kenya: a Country Profile 2015. [Online]. Nairobi: International Organization for Migration (IOM). [Accessed 28 July 2020]. Available from: https://publications.iom.int/system/files/pdf/migration_profile_kenya.pdf
International Organization for Migration. 2018. Kenya’s Draft National Migration Policy Integrates Global Compact Commitments. [Online]. [Accessed 13 March 2020]. Available from: https://www.iom.int/news/kenyas-draft-national-migration-policy-integrates-global-compact-commitments
Ivankova, N.V. 2013. Implementing Quality Criteria in Designing and Conducting a Sequential QUAN → QUAL Mixed Methods Study of Student Engagement With Learning Applied Research Methods Online. Journal of Mixed Methods Research. 8(1), pp.25-51.
Ivankova, N.V., Creswell, J.W. and Stick, S.L. 2006. Using mixed-methods sequential explanatory design: From theory to practice. Field methods. 18(1), pp.3-20.
Jackson, P. and Viehoff, V. 2016. Reframing convenience food. Appetite. 98, pp.1-11. Jilcott, S.B., Laraia, B.A., Evenson, K.R. and Ammerman, A.S. 2009. Perceptions of the
Community Food Environment and Related Influences on Food Choice Among Midlife Women Residing in Rural and Urban Areas: A Qualitative Analysis. Women & Health. 49(2-3), pp.164-180.
Joshi, M.D., Ayah, R., Njau, E.K., Wanjiru, R., Kayima, J.K., Njeru, E.K. and Mutai, K.K. 2014. Prevalence of hypertension and associated cardiovascular risk factors in an urban slum in Nairobi, Kenya: A population-based survey. BMC Public Health. 14(1), pp.1-10.
269
Juul, F., Martinez-Steele, E., Parekh, N., Monteiro, C.A. and Chang, V.W. 2018. Ultra-processed food consumption and excess weight among US adults. British Journal of Nutrition. 120(1), pp.90-100.
Kamphuis, C.B.M., Giskes, K., de Bruijn, G.-J., Wendel-Vos, W., Brug, J. and van Lenthe, F.J. 2006. Environmental determinants of fruit and vegetable consumption among adults: a systematic review. British Journal of Nutrition. 96(4), pp.620-635.
Keding, G. 2016. Nutrition Transition in Rural Tanzania and Kenya. World Review of Nutrition and Dietetics. 115, pp.68-81.
Keino, S., Plasqui, G. and van den Borne, B. 2014. Household food insecurity access: a predictor of overweight and underweight among Kenyan women. Agriculture & Food Security. 3(1), p2.
Keller, C., Fleury, J., Perez, A., Ainsworth, B. and Vaughan, L. 2008. Using visual methods to uncover context. Qualitative Health Research. 18(3), pp.428-436.
Kennedy, E. and Reardon, T. 1994. Shift to non-traditional grains in the diets of East and West Africa: role of women's opportunity cost of time. Food Policy. 19(1), pp.45-56.
Kenya National Bureau of Statistics. 2010. The 2009 Kenya population and housing census. [Online]. Kenya National Bureau of Statistics (KNBS). [Accessed 28 July 2020]. Available from: https://s3-eu-west-1.amazonaws.com/s3.sourceafrica.net/documents/21195/Census-2009.pdf
Kenya National Bureau of Statistics, Ministry of Health/Kenya, National AIDS Control Council/Kenya, Kenya Medical Research Institute, Population, N.C.f. and Development/Kenya. 2015. Kenya Demographic and Health Survey 2014. Rockville, MD, USA.
Kiawi, E., Edwards, R., Shu, J., Unwin, N., Kamadjeu, R. and Mbanya, J.C. 2006. Knowledge, attitudes, and behavior relating to diabetes and its main risk factors among urban residents in Cameroon: a qualitative survey. Ethnicity & Disease. 16(2), pp.503-509.
Kibera UK. 2020. Kibera Facts & Information. [Online]. [Accessed 11 March]. Available from: https://www.kibera.org.uk/facts-info/
Kimani-Murage, E., Wekesah, F., Wanjohi, M., Kyobutungi, C., Ezeh, A., Musoke, R., Norris, S., Madise, N. and Griffiths, P. 2015a. Factors affecting actualisation of the WHO breastfeeding recommendations in urban poor settings in Kenya. Maternal & Child Nutrition. 11(3), pp.314-332.
Kimani-Murage, E.W., Muthuri, S.K., Oti, S.O., Mutua, M.K., van de Vijver, S. and Kyobutungi, C. 2015b. Evidence of a Double Burden of Malnutrition in Urban Poor Settings in Nairobi, Kenya. PLOS One. 10(6), pe0129943.
Kimani-Murage, E.W., Schofield, L., Wekesah, F., Mohamed, S., Mberu, B., Ettarh, R., Egondi, T., Kyobutungi, C. and Ezeh, A. 2014. Vulnerability to Food Insecurity in Urban Slums: Experiences from Nairobi, Kenya. Journal of Urban Health. 91(6), pp.1098-1113.
Kimenju, S.C. and Qaim, M. 2016. The nutrition transition and indicators of child malnutrition. Food Security. 8(3), pp.571-583.
Kimenju, S.C., Rischke, R., Klasen, S. and Qaim, M. 2015. Do supermarkets contribute to the obesity pandemic in developing countries? Public Health Nutrition. 18(17), pp.3224-3233.
Kinra, S., Andersen, E., Ben-Shlomo, Y., Bowen, L., Lyngdoh, T., Prabhakaran, D., Reddy, K.S., Ramakrishnan, L., Bharathi, A., Vaz, M., Kurpad, A., Smith, G.D. and Ebrahim, S. 2011. Association Between Urban Life-Years and Cardiometabolic Risk: The Indian Migration Study. American Journal of Epidemiology. 174(2), pp.154-164.
270
Kirkpatrick, S.I. and Tarasuk, V. 2008. Food Insecurity Is Associated with Nutrient Inadequacies among Canadian Adults and Adolescents. The Journal of Nutrition. 138(3), pp.604-612.
Kirunda, B.E., Fadnes, L.T., Wamani, H., Van den Broeck, J. and Tylleskär, T. 2015. Population-based survey of overweight and obesity and the associated factors in peri-urban and rural Eastern Uganda. BMC Public Health. 15(1), p1168.
Kitzinger, J. 1994. The methodology of Focus Groups: the importance of interaction between research participants. Sociology of Health & Illness. 16(1), pp.103-121.
Kitzinger, J. 1995. Qualitative research. Introducing focus groups. BMJ: British Medical Journal. 311(7000), p299.
Kockturk-Runefors, T. 1991. A model for adaptation to a new food pattern: the case of immigrants. Appetite. 16(2), p163.
Kravdal, Ø. 2006. A simulation-based assessment of the bias produced when using averages from small DHS clusters as contextual variables in multilevel models. Demographic Research. 15(1), pp.1-20.
Kremers, S.P.J. 2010. Theory and practice in the study of influences on energy balance-related behaviors. Patient Education and Counseling. 79(3), pp.291-298.
Kremers, S.P.J., de Bruijn, G.-J., Visscher, T.L.S., van Mechelen, W., de Vries, N.K. and Brug, J. 2006. Environmental influences on energy balance-related behaviors: A dual-process view. International Journal of Behavioral Nutrition and Physical Activity. 3(1), p9.
Kruger, H.S., Margetts, B.M. and Vorster, H.H. 2004. Evidence for relatively greater subcutaneous fat deposition in stunted girls in the North West Province, South Africa, as compared with non-stunted girls. Nutrition. 20(6), pp.564-569.
Kuhnlein, H.V., Erasmus, B. and Spigelski, D. 2009. Indigenous peoples' food systems: the many dimensions of culture, diversity and environment for nutrition and health. [Online]. Rome: Food and Agriculture Organization of the United Nations Available from: http://www.fao.org/3/i0370e/i0370e.pdf
Kuhnlein, H.V. and Receveur, O. 1996. Dietary Change and Traditional Food Systems of Indigenous Peoples. Annual Review of Nutrition. 16(1), pp.417-442.
Kumanyika, S., Taylor, W.C., Grier, S.A., Lassiter, V., Lancaster, K.J., Morssink, C.B. and Renzaho, A.M.N. 2012. Community energy balance: A framework for contextualizing cultural influences on high risk of obesity in ethnic minority populations. Preventive Medicine. 55(5), pp.371-381.
Lagerkvist, C.J., Hess, S., Okello, J., Hansson, H. and Karanja, N. 2013a. Food health risk perceptions among consumers, farmers, and traders of leafy vegetables in Nairobi. Food Policy. 38, pp.92-104.
Lagerkvist, C.J., Hess, S., Okello, J. and Karanja, N. 2013b. Consumer Willingness to Pay for Safer Vegetables in Urban Markets of a Developing Country: The Case of Kale in Nairobi, Kenya. The Journal of Development Studies. 49(3), pp.365-382.
Landais, E., Bour, A., Gartner, A., McCullough, F., Delpeuch, F. and Holdsworth, M. 2015. Socio-economic and behavioural determinants of fruit and vegetable intake in Moroccan women. Public Health Nutrition. 18(5), pp.809-816.
Lee, B.Y., Bartsch, S.M., Mui, Y., Haidari, L.A., Spiker, M.L. and Gittelsohn, J. 2017. A systems approach to obesity. Nutrition Reviews. 75(1), pp.94-106.
Lee, M.-J., Popkin, B.M. and Kim, S. 2002. The unique aspects of the nutrition transition in South Korea: the retention of healthful elements in their traditional diet. Public Health Nutrition. 5(1a), pp.197-203.
Leech, N.L. 2012. Writing Mixed Research Reports. American Behavioral Scientist. 56(6), pp.866-881.
271
Letarte, L., Lebel, A., Waygood, E.O.D., Tchernof, A. and Biertho, L. 2018. Longitudinal designs to study neighbourhood effects on the development of obesity: a scoping review protocol. BMJ Open. 8(1), pe017704.
Levin, C.E., Ruel, M.T., Morris, S.S., Maxwell, D.G., Armar-Klemesu, M. and Ahiadeke, C. 1999. Working Women in an Urban Setting: Traders, Vendors and Food Security in Accra. World Development. 27(11), pp.1977-1991.
Lilford, R.J., Oyebode, O., Satterthwaite, D., Melendez-Torres, G.J., Chen, Y.-F., Mberu, B., Watson, S.I., Sartori, J., Ndugwa, R., Caiaffa, W., Haregu, T., Capon, A., Saith, R. and Ezeh, A. 2017. Improving the health and welfare of people who live in slums. The Lancet. 389(10068), pp.559-570.
Long, J.S. and Freese, J. 2014. Regression models for categorical dependent variables using stata. College Station , TX: US: Stata Press.
Loopstra, R. and Tarasuk, V. 2013. Severity of Household Food Insecurity Is Sensitive to Change in Household Income and Employment Status among Low-Income Families. The Journal of Nutrition. 143(8), pp.1316-1323.
Loret de Mola, C., Pillay, T.D., Diez-Canseco, F., Gilman, R.H., Smeeth, L. and Miranda, J.J. 2012a. Body mass index and self-perception of overweight and obesity in rural, urban and rural-to-urban migrants: PERU MIGRANT study. PLOS One. 7(11), pe50252.
Loret de Mola, C., Stanojevic, S., Ruiz, P., Gilman, R.H., Smeeth, L. and Miranda, J.J. 2012b. The effect of rural-to-urban migration on social capital and common mental disorders: PERU MIGRANT study. Social Psychiatry and Psychiatric Epidemiology. 47(6), pp.967-973.
Lucci, P., Bhatkal, T., Khan, A. and Berliner, T. 2015. What works in improving the living conditions of slum dwellers – a review of the evidence across four programmes [Online]. London, UK: Overseas Development Institute (ODI). [Accessed 28 July 2020]. Available from: https://www.odi.org/sites/odi.org.uk/files/odi-assets/publications-opinion-files/10188.pdf
Lynch, M. and Batal, M. 2011. Factors Influencing Childcare Providers' Food and Mealtime Decisions: An Ecological Approach. Child Care in Practice. 17(2), pp.185-203.
Lytle, L.A. and Sokol, R.L. 2017. Measures of the food environment: A systematic review of the field, 2007–2015. Health & Place. 44, pp.18-34.
Macharia, K. 1988. Social networks: ethnicity and the informal sector in Nairobi. . [Online]. University of Nairobi, Nairobi: Institute for Development Studies (IDS). [Accessed 28 July 2020]. Available from: https://opendocs.ids.ac.uk/opendocs/bitstream/handle/20.500.12413/1321/wp463-318965.pdf?sequence=1&isAllowed=y
MacQueen, K.M., McLellan, E., Metzger, D.S., Kegeles, S., Strauss, R.P., Scotti, R., Blanchard, L. and Robert T. Trotter, I. 2001. What Is Community? An Evidence-Based Definition for Participatory Public Health. American Journal of Public Health. 91(12), pp.1929-1938.
Madise, N.J. and Letamo, G. 2017. Complex association between rural/urban residence, household wealth and women’s overweight: evidence from 30 cross-sectional national household surveys in Africa. BMC Obesity. 4(1), p5.
Martin, M.A. and Lippert, A.M. 2012. Feeding her children, but risking her health: The intersection of gender, household food insecurity and obesity. Social Science & Medicine. 74(11), pp.1754-1764.
Marx, B., Stoker, T. and Suri, T. 2013. The Economics of Slums in the Developing World. Journal of Economic Perspectives. 27(4), pp.187-210.
272
Matoti-Mvalo, T. 2006. An exploration of the perceptions about being thin, HIV/Aids and body image in black South African women. Ph.D. thesis, University of the Western Cape.
Maxwell, D.G. 1995. Alternative food security strategy: A household analysis of urban agriculture in Kampala. World Development. 23(10), pp.1669-1681.
Mayega, R.W., Makumbi, F., Rutebemberwa, E., Peterson, S., Ostenson, C.G., Tomson, G. and Guwatudde, D. 2012. Modifiable socio-behavioural factors associated with overweight and hypertension among persons aged 35 to 60 years in eastern Uganda. PLOS One. 7(10), pe47632.
Mayén, A.-L., Marques-Vidal, P., Paccaud, F., Bovet, P. and Stringhini, S. 2014. Socioeconomic determinants of dietary patterns in low- and middle-income countries: a systematic review. The American Journal of Clinical Nutrition. 100(6), pp.1520-1531.
Mays, N. and Pope, C. 2000. Assessing quality in qualitative research. BMJ. 320(7226), pp.50-52.
Mberu, B., Béguy, D. and Ezeh, A.C. 2017. Internal Migration, Urbanization and Slums in Sub-Saharan Africa. In: Groth, H. and May, J.F. eds. Africa's Population: In Search of a Demographic Dividend. Cham: Springer International Publishing, pp.315-332.
Mberu, B.U. 2016. African Migration and Population Distribution: Recent Trends, Methodological Challenges and Policy Issues. In: White, M.J. ed. International Handbook of Migration and Population Distribution. Dordrecht: Springer Netherlands, pp.245-267.
Mberu, B.U., Ciera, J.M., Elungata, P. and Ezeh, A.C. 2014. Patterns and Determinants of Poverty Transitions among Poor Urban Households in Nairobi, Kenya. African Development Review. 26(1), pp.172-185.
Mberu, B.U., Ezeh, A.C., Chepngeno-Langat, G., Kimani, J., Oti, S. and Beguy, D. 2013. Family Ties and Urban–Rural Linkages among Older Migrants in Nairobi Informal Settlements. Population, Space and Place. 19(3), pp.275-293.
Mberu, B.U. and Mutua, M. 2015. Internal migration and early life mortality in Kenya and Nigeria. Population, Space and Place. 21(8), pp.788-808.
Mbochi, R.W., Kuria, E., Kimiywe, J., Ochola, S. and Steyn, N.P. 2012. Predictors of overweight and obesity in adult women in Nairobi Province, Kenya. BMC Public Health. 12, p823.
McHiza, Z.J., Goedecke, J.H. and Lambert, E.V. 2011. Intra-familial and ethnic effects on attitudinal and perceptual body image: a cohort of South African mother-daughter dyads. BMC Public Health. 11, pp.433-433.
McHiza, Z.J., Temple, N.J., Steyn, N.P., Abrahams, Z. and Clayford, M. 2013. Content analysis of television food advertisements aimed at adults and children in South Africa. Public Health Nutrition. 16(12), pp.2213-2220.
McLeroy, K.R., Bibeau, D., Steckler, A. and Glanz, K. 1988. An Ecological Perspective on Health Promotion Programs. Health Education & Behavior. 15(4), pp.351-377.
Measure DHS. 2012. DHS Recode Manual. Calverton: ICF International. Mellin-Olsen, T. and Wandel, M. 2005. Changes in Food Habits among Pakistani
Immigrant Women in Oslo, Norway. Ethnicity & Health. 10(4), pp.311-339. Micklesfield, L.K., Lambert, E.V., Hume, D.J., Chantler, S., Pienaar, P.R., Dickie, K.,
Puoane, T. and Goedecke, J.H. 2013. Socio-cultural, environmental and behavioural determinants of obesity in black South African women. Cardiovascular Journal of Africa. 24(9-10), pp.369-375.
Ministry of Health Kenya. 2014. Kenya Health Policy 2014-2030. [Online]. Nairobi, Kenya: Ministry of Health Kenya. [Accessed 28 July 2020]. Available from: http://www.health.go.ke

273
Ministry of Health Kenya. 2015. Kenya National Strategy for the Prevention and Control of Non-communicable Diseases 2015-2020. [Online]. Nairobi, Kenya: Republic Of Kenya, Ministry of Health. Available from: https://extranet.who.int/nutrition/gina/sites/default/files/KEN-2015-NCDs.pdf
Misra, A., Sharma, R., Pandey, R.M. and Khanna, N. 2001. Adverse profile of dietary nutrients, anthropometry and lipids in urban slum dwellers of northern India. European Journal of Clinical Nutrition. 55(9), pp.727-734.
Monteiro, C.A., Moubarac, J.-C., Levy, R.B., Canella, D.S., Louzada, M.L.d.C. and Cannon, G. 2018. Household availability of ultra-processed foods and obesity in nineteen European countries. Public Health Nutrition. 21(1), pp.18-26.
Moore, S. and Kawachi, I. 2017. Twenty years of social capital and health research: a glossary. Journal of Epidemiology and Community Health. 71(5), p513.
Morgan, D. and Kreuger, R. 1993. When to use focus groups and why. Successful Focus Groups: Advancing the State of the Art. Thousand Oaks, California: SAGE Publications, Inc., pp.3-19.
Morgan, D.L. 1995. Why Things (Sometimes) Go Wrong in Focus Groups. Qualitative Health Research. 5(4), pp.516-523.
Murphy, M., Robertson, W. and Oyebode, O.J.C.O.R. 2017. Obesity in International Migrant Populations. Current Obesity Reports. 6(3), pp.314-323.
Mutisya, M., Ngware, M.W., Kabiru, C.W. and Kandala, N.-b. 2016. The effect of education on household food security in two informal urban settlements in Kenya: a longitudinal analysis. Food Security. 8(4), pp.743-756.
Mvo, Z. 1999. Perceptions of overweight African women about acceptable body size of women and children. Curationis. 22, pp.27-31.
Mwangi, A.M., den Hartog, A.P., Mwadime, R.K., van Staveren, W.A. and Foeken, D.W. 2002. Do street food vendors sell a sufficient variety of foods for a healthful diet? The case of Nairobi. Food and Nutrition Bulletin. 23(1), pp.48-56.
Nairobi City County. 2015. The Nairobi City County Urban Agriculture Promotion and ReguIation Act. Nairobi, Kenya.
National Institute of Population Research and Training, International Centre for Diarrhoeal Disease Research and Measure Evaluation. 2015. Bangladesh Urban Health Survey 2013 Final Report. [Online]. Dhaka, Bangladesh, and Chapel Hill, North Carolina (USA): NIPORT, International Centre for Diarrhoeal Disease Research (icddr,b) and Measure Evaluation. [Accessed 28 July 2020]. Available from: https://www.measureevaluation.org/resources/publications/tr-15-117/at_download/document
NCPD. 2018. The State of Kenya Population 2017. [Online]. Nairobi: National Council for Population and Development (NCPD). Available from: https://ncpd.go.ke/wp-content/uploads/2020/05/STATE-OF-KENYA-POPULATION-JUNE-2018-2.pdf
Neuman, M., Kawachi, I., Gortmaker, S. and Subramanian, S.V. 2013. Urban-rural differences in BMI in low- and middle-income countries: the role of socioeconomic status. The American Journal of Clinical Nutrition. 97(2), pp.428-436.
Neven, D. and Reardon, T. 2004. The Rise of Kenyan Supermarkets and the Evolution of Their Horticulture Product Procurement Systems. Development Policy Review. 22(6), pp.669-699.
Ngongalah, L., Rankin, J., Rapley, T., Odeniyi, A., Akhter, Z. and Heslehurst, N. 2018. Dietary and Physical Activity Behaviours in African Migrant Women Living in High Income Countries: A Systematic Review and Framework Synthesis. Nutrients. 10(8).
Nickanor, N., Crush, J. and Pendleton, W. 2016. Migration, Rural-Urban Linkages and Food Insecurity. In: Crush, J. and Battersby, J. eds. Rapid Urbanisation, Urban Food Deserts and Food Security in Africa. [Online]. Cham: Springer International
274
Publishing, pp.127-142. Available from: https://doi.org/10.1007/978-3-319-43567-1_10
O’Cathain, A., Murphy, E. and Nicholl, J. 2010. Three techniques for integrating data in mixed methods studies. BMJ. 341, pc4587.
Oduol, P.A. 1986. The Shamba system: an indigenous system of food production from forest areas in Kenya. Agroforestry Systems. 4(4), pp.365-373.
Okop, K.J. 2017. Exploring the association between body image, body fat, and total cardiovascular disease risk among adults in a rural and an urban community of South Africa. Ph.D. thesis, University of the Western Cape.
Okop, K.J., Lambert, E.V., Alaba, O., Levitt, N.S., Luke, A., Dugas, L., Rvh, D., Kroff, J., Micklesfield, L.K., Kolbe-Alexander, T.L., Warren, S., Dugmore, H., Bobrow, K., Odunitan-Wayas, F.A. and Puoane, T. 2019. Sugar-sweetened beverage intake and relative weight gain among South African adults living in resource-poor communities: longitudinal data from the STOP-SA study. International Journal of Obesity. 43(3), pp.603-614.
Okop, K.J., Mukumbang, F.C., Mathole, T., Levitt, N. and Puoane, T. 2016. Perceptions of body size, obesity threat and the willingness to lose weight among black South African adults: a qualitative study. BMC Public Health. 16(1), p365.
Osei-Kwasi, H.A., Nicolaou, M., Powell, K., Terragni, L., Maes, L., Stronks, K., Lien, N., Holdsworth, M. and on behalf of the, D.c. 2016. Systematic mapping review of the factors influencing dietary behaviour in ethnic minority groups living in Europe: a DEDIPAC study. International Journal of Behavioral Nutrition and Physical Activity. 13(1), p85.
Osei-Kwasi, H.A., Powell, K., Nicolaou, M. and Holdsworth, M. 2017. The influence of migration on dietary practices of Ghanaians living in the United Kingdom: a qualitative study. Annals of Human Biology. 44(5), pp.454-463.
Oti, S.O. 2015. Double burden of disease in the slums of Kenya. Ph.D. thesis, University of Amsterdam.
Oti, S.O., van de Vijver, S., Gomez, G.B., Agyemang, C., Egondi, T., Kyobutungi, C. and Stronks, K. 2016. Outcomes and costs of implementing a community-based intervention for hypertension in an urban slum in Kenya. Bulletin of the World Health Organization. 94(7), pp.501-509.
Oti, S.O., van de Vijver, S.J.M., Kyobutungi, C., Gomez, G.B., Agyemang, C., Moll van Charante, E.P., Brewster, L.M., Hendriks, M.E., Schultsz, C., Ettarh, R., Ezeh, A. and Lange, J. 2013. A community-based intervention for primary prevention of cardiovascular diseases in the slums of Nairobi: the SCALE UP study protocol for a prospective quasi-experimental community-based trial. Journal of Urban Health. 14, pp.409-409.
Ouedraogo, H.Z., Fournet, F., Martin-Prevel, Y., Gary, J., Henry, M.C. and Salem, G. 2008. Socio-spatial disparities of obesity among adults in the urban setting of Ouagadougou, Burkina Faso. Public Health Nutrition. 11(12), pp.1280-1287.
Owuor, S. 2018. The State of Household Food Security in Nairobi, Kenya. [Online]. Waterloo, Canada: Hungry Cities Partnership. [Accessed 28 July 2020]. Available from: https://hungrycities.net/wp-content/uploads/2018/07/HCP11.pdf
Owuor, S., Brown, A., Crush, J.S., Frayne, B. and Wagner, J. 2017. The Urban Food System of Nairobi, Kenya. [Online]. Waterloo, Canada: Hungry Cities Partnership. [Accessed 28 July 2020]. Available from: https://hungrycities.net/wp-content/uploads/2017/11/HC6.pdf
Owuor, S.O. 2007. Migrants, urban poverty and the changing nature of urban–rural linkages in Kenya. Development Southern Africa. 24(1), pp.109-122.
Oyebode, O., Pape, U.J., Laverty, A.A., Lee, J.T., Bhan, N. and Millett, C. 2015. Rural, Urban and Migrant Differences in Non-Communicable Disease Risk-Factors in
275
Middle Income Countries: A Cross-Sectional Study of WHO-SAGE Data. PLOS One. 10(4).
Oyewole, O.E. and Atinmo, T. 2015. Nutrition transition and chronic diseases in Nigeria. Proceedings of the Nutrition Society. 74(4), pp.460-465.
Oyvat, C. and wa Gĩthĩnji, M. 2019. Migration in Kenya: beyond Harris-Todaro. International Review of Applied Economics. 34(1), pp.4-35.
Paeratakul, S., White, M.A., Williamson, D.A., Ryan, D.H. and Bray, G.A. 2002. Sex, Race/Ethnicity, Socioeconomic Status, and BMI in Relation to Self-Perception of Overweight. Obesity Research. 10(5), pp.345-350.
Park, Y., Quinn, J., Florez, K., Jacobson, J., Neckerman, K. and Rundle, A. 2011. Hispanic immigrant women’s perspective on healthy foods and the New York City retail food environment: A mixed-method study. Social Science & Medicine. 73(1), pp.13-21.
Patil, C.L., Hadley, C. and Nahayo, P.D. 2009. Unpacking Dietary Acculturation Among New Americans: Results from Formative Research with African Refugees. Journal of Immigrant and Minority Health. 11(5), pp.342-358.
Patton, M.Q. 1999. Enhancing the quality and credibility of qualitative analysis. BMC Health Services Research. 34(5 Pt 2), pp.1189-1208.
Patton, M.Q. 2002. Two Decades of Developments in Qualitative Inquiry: A Personal, Experiential Perspective. Qualitative Social Work. 1(3), pp.261-283.
Patton, M.Q. 2014. Qualitative research & evaluation methods: Integrating theory and practice. 4 ed. SAGE Publications, Inc.
Pawloski, L.R., Curtin, K.M., Gewa, C. and Attaway, D. 2012. Maternal–child overweight/obesity and undernutrition in Kenya: a geographic analysis. Public Health Nutrition. 15(11), pp.2140-2147.
Penney, T.L., Almiron-Roig, E., Shearer, C., McIsaac, J.-L. and Kirk, S.F.L. 2014. Modifying the food environment for childhood obesity prevention: challenges and opportunities. Proceedings of the Nutrition Society. 73(2), pp.226-236.
Peterson, B. and Harrell, F.E. 1990. Partial Proportional Odds Models for Ordinal Response Variables. Journal of the Royal Statistical Society. Series C (Applied Statistics). 39(2), pp.205-217.
Phillips, E.A., Comeau, D.L., Pisa, P.T., Stein, A.D. and Norris, S.A. 2016. Perceptions of diet, physical activity, and obesity-related health among black daughter-mother pairs in Soweto, South Africa: a qualitative study. BMC Public Health. 16, p750.
Pitt, E., Gallegos, D., Comans, T., Cameron, C. and Thornton, L. 2017. Exploring the influence of local food environments on food behaviours: a systematic review of qualitative literature. Public Health Nutrition. 20(13), pp.2393-2405.
Polit, D.F. and Beck, C.T. 2010. Generalization in quantitative and qualitative research: Myths and strategies. International Journal of Nursing Studies. 47(11), pp.1451-1458.
Popkin, B.M. 1993. Nutritional Patterns and Transitions. Population and Development Review. 19(1), pp.138-157.
Popkin, B.M. 2004. The Nutrition Transition: An Overview of World Patterns of Change. Nutrition Reviews. 62(s2), pp.S140-S143.
Popkin, B.M. 2015. Nutrition Transition and the Global Diabetes Epidemic. Current Diabetes Reports. 15(9), p64.
Popkin, B.M., Adair, L.S. and Ng, S.W. 2012. Global nutrition transition and the pandemic of obesity in developing countries. Nutrition Reviews. 70(1), pp.3-21.
Popkin, B.M., Corvalan, C. and Grummer-Strawn, L.M. 2020. Dynamics of the double burden of malnutrition and the changing nutrition reality. The Lancet. 395(10217), pp.65-74.
276
Popkin, B.M., Lu, B. and Zhai, F. 2002. Understanding the nutrition transition: measuring rapid dietary changes in transitional countries. Public Health Nutrition. 5(6a), pp.947-953.
Porta, M. 2016. Residual Confounding. Oxford University Press. 2016. Available from: https://www.oxfordreference.com/view/10.1093/acref/9780199976720.001.0001/acref-9780199976720-e-1649
Poulsen, M.N., McNab, P.R., Clayton, M.L. and Neff, R.A. 2015. A systematic review of urban agriculture and food security impacts in low-income countries. Food Policy. 55, pp.131-146.
Poulter, N.R., Khaw, K.T., Hopwood, B.E., Mugambi, M., Peart, W.S., Rose, G. and Sever, P.S. 1990. The Kenyan Luo migration study: observations on the initiation of a rise in blood pressure. BMJ. 300(6730), pp.967-972.
Powell, K., Wilcox, J., Clonan, A., Bissell, P., Preston, L., Peacock, M. and Holdsworth, M. 2015. The role of social networks in the development of overweight and obesity among adults: a scoping review. BMC Public Health. 15(1), p996.
Pradeilles, R., Baye, K. and Holdsworth, M. 2019a. Addressing malnutrition in low- and middle-income countries with double-duty actions. Proceedings of the Nutrition Society. 78(3), pp.388-397.
Pradeilles, R., Marr, C., Laar, A., Holdsworth, M., Zotor, F., Tandoh, A., Klomegah, S., Coleman, N., Bash, K., Green, M. and Griffiths, P.L. 2019b. How ready are communities to implement actions to improve diets of adolescent girls and women in urban Ghana? BMC Public Health. 19(1), p646.
Puoane, T., Fourie, J.M., Shapiro, M., Rosling, L., Tshaka, N.C. and Oelefse, A.J. 2005. 'Big is beautiful'-an exploration with urban black community health workers in a South African township. South African Journal of Clinical Nutrition. 18(1), pp.6-15.
Puoane, T., Matwa, P., Hughes, G. and Bradley, H. 2006. Socio-cultural factors influencing food consumption patterns in the black African population in an urban township in South Africa. [Online]. University of the Western Cape. [Accessed 28 July 2020]. Available from: http://repository.uwc.ac.za/xmlui/bitstream/handle/10566/253/JHE-SI-14-12-089-093-Puoane-T-Text.pdf?sequence=1&isAllowed=y
Puoane, T., Tsolekile, L. and Steyn, N. 2010. Perceptions about body image and sizes among Black African girls living in Cape Town. Ethnicity & Disease. 20(1), pp.29-34.
Raschke, V. and Cheema, B. 2008. Colonisation, the New World Order, and the eradication of traditional food habits in East Africa: Historical perspective on the nutrition transition. Public Health Nutrition. 11(7), pp.662-674.
Raschke, V., Oltersdorf, U., Elmadfa, I., Wahlqvist, M.L., Kouris-Blazos, A. and Cheema, B.S.B. 2007. The need for an online collection of traditional African food habits. African Journal of Food, Agriculture, Nutrition and Development. 7(1).
Regev-Tobias, H., Reifen, R., Endevelt, R., Havkin, O., Cohen, E., Stern, G. and Stark, A. 2012. Dietary acculturation and increasing rates of obesity in Ethiopian women living in Israel. Nutrition. 28(1), pp.30-34.
Renzaho, A.M. and Burns, C. 2006. Post‐migration food habits of sub‐Saharan African migrants in Victoria: A cross‐sectional study. Nutrition & Dietetics. 63(2), pp.91-102.
Renzaho, A.M.N. 2004. Fat, rich and beautiful: changing socio-cultural paradigms associated with obesity risk, nutritional status and refugee children from sub-Saharan Africa. Health & Place. 10(1), pp.105-113.
Renzaho, A.M.N., Green, J., Smith, B.J. and Polonsky, M. 2018. Exploring Factors Influencing Childhood Obesity Prevention Among Migrant Communities in
https://www.oxfordreference.com/view/10.1093/acref/9780199976720.001.0001/acref-9780199976720-e-1649
277
Victoria, Australia: A Qualitative Study. Journal of Immigrant and Minority Health. 20(4), pp.865-883.
Richard, L., Gauvin, L. and Raine, K. 2011. Ecological Models Revisited: Their Uses and Evolution in Health Promotion Over Two Decades. Annual Review of Public Health. 32(1), pp.307-326.
Rischke, R., Kimenju, S.C., Klasen, S. and Qaim, M. 2015. Supermarkets and food consumption patterns: the case of small towns in Kenya. Food Policy. 52, pp.9-21.
Ritchie, J., Lewis, J., Nicholls, C.M. and Ormston, R. 2013. Qualitative research practice: A guide for social science students and researchers. Sage.
Roberto, C.A., Swinburn, B., Hawkes, C., Huang, T.T.K., Costa, S.A., Ashe, M., Zwicker, L., Cawley, J.H. and Brownell, K.D. 2015. Patchy progress on obesity prevention: emerging examples, entrenched barriers, and new thinking. The Lancet. 385(9985), pp.2400-2409.
Robinson, R.S. 2014. Purposive Sampling. In: Michalos, A.C. ed. Encyclopedia of Quality of Life and Well-Being Research. Dordrecht: Springer Netherlands, pp.5243-5245.
Roda, C., Charreire, H., Feuillet, T., Mackenbach, J.D., Compernolle, S., Glonti, K., Ben Rebah, M., Bárdos, H., Rutter, H., McKee, M., De Bourdeaudhuij, I., Brug, J., Lakerveld, J. and Oppert, J.-M. 2016. Mismatch between perceived and objectively measured environmental obesogenic features in European neighbourhoods. Obesity Reviews. 17(S1), pp.31-41.
Romieu, I., Dossus, L., Barquera, S., Blottière, H.M., Franks, P.W., Gunter, M., Hwalla, N., Hursting, S.D., Leitzmann, M., Margetts, B., Nishida, C., Potischman, N., Seidell, J., Stepien, M., Wang, Y., Westerterp, K., Winichagoon, P., Wiseman, M. and Willett, W.C. 2017. Energy balance and obesity: what are the main drivers? Cancer Causes & Control. 28(3), pp.247-258.
Ruel, M.T., Garrett, J., Yosef, S. and Olivier, M. 2017. Urbanization, Food Security and Nutrition. In: de Pee, S., et al. eds. Nutrition and Health in a Developing World. Cham: Springer International Publishing, pp.705-735.
Ruel, M.T., Garrett, J.L. and Haddad, L. 2008. Rapid Urbanization and the Challenges of Obtaining Food and Nutrition Security. In: Semba, R.D., et al. eds. Nutrition and Health in Developing Countries. Totowa, NJ: Humana Press, pp.639-656.
Ruel, M.T., Haddad, L. and Garrett, J.L. 1999. Some Urban Facts of Life: Implications for Research and Policy. World Development. 27(11), pp.1917-1938.
Ruel, M.T., Minot, N. and Smith, L. 2005. Patterns and determinants of fruit and vegetable consumption in sub-Saharan Africa: a multicountry comparison. [Online]. Rome: World Health Organisation (WHO). Available from: https://www.who.int/dietphysicalactivity/publications/f&v_africa_economics.pdf
Rutstein, S.O. and Rojas, G. 2006. Guide to DHS statistics. [Online]. Calverton, Maryland: ORC Macro. [Accessed 28 July 2020]. Available from: https://dhsprogram.com/pubs/pdf/DHSG1/Guide_to_DHS_Statistics_29Oct2012_DHSG1.pdf
Sandelowski, M. 1995. Sample size in qualitative research. Research in Nursing & Health. 18(2), pp.179-183.
Satia-Abouta, J. 2003. Dietary acculturation: definition, process, assessment, and implications. International Journal of Human Ecology. 4(1), pp.71-86.
Satia-Abouta, J., Patterson, R.E., Neuhouser, M.L. and Elder, J. 2002. Dietary acculturation: Applications to nutrition research and dietetics. Journal of the American Dietetic Association. 102(8), pp.1105-1118.
Satia, J.A. 2010. Dietary acculturation and the nutrition transition: an overview. Applied Physiology, Nutrition, and Metabolism. 35(2), pp.219-223.
278
Schenker, M.B., Castañeda, X. and Rodriguez-Lainz, A. 2014. Migration and health. A research methods handbook. University of California Press.
Schliemann, D. and Woodside, J.V. 2019. The effectiveness of dietary workplace interventions: a systematic review of systematic reviews. Public Health Nutrition. 22(5), pp.942-955.
Scott, A., Ejikeme, C.S., Clottey, E.N. and Thomas, J.G.J. 2012. Obesity in sub-Saharan Africa: development of an ecological theoretical framework. Health Promotion International. 28(1), pp.4-16.
Scott, M.A., Simonoff, J.S. and Marx, B.D. 2013. The SAGE handbook of multilevel modeling. Sage.
Silverman, D. 2006. Credible qualitative research. Interpreting qualitative data: methods for analyzing talk, text and interaction. 3rd edn. London: Sage Publishing Ltd. pp.289-295.
Sim, J. 1998. Collecting and analysing qualitative data: issues raised by the focus group. Journal of Advanced Nursing. 28(2), pp.345-352.
Skovdal, M. and Cornish, F. 2015. Qualitative Research for Development. Practical Action Publishing.
Sleddens, E.F.C., Kroeze, W., Kohl, L.F.M., Bolten, L.M., Velema, E., Kaspers, P., Kremers, S.P.J. and Brug, J. 2015. Correlates of dietary behavior in adults: an umbrella review. Nutrition Reviews. 73(8), pp.477-499.
Smit, W. 2016. Urban governance and urban food systems in Africa: Examining the linkages. Cities. 58, pp.80-86.
Smith, J. and Firth, J. 2011. Qualitative data analysis: the framework approach. Nurse researcher. 18(2), pp.52-62.
Snowdon, W., Schultz, J. and Swinburn, B. 2008. Problem and solution trees: a practical approach for identifying potential interventions to improve population nutrition. Health Promotion International. 23(4), pp.345-353.
Snyder, R.E., Jaimes, G., Riley, L.W., Faerstein, E. and Corburn, J. 2014. A Comparison of Social and Spatial Determinants of Health Between Formal and Informal Settlements in a Large Metropolitan Setting in Brazil. Journal of Urban Health. 91(3), pp.432-445.
Sobal, J. and Bisogni, C.A. 2009. Constructing Food Choice Decisions. Annals of Behavioral Medicine. 38(1), pp.s37-s46.
Sobngwi, E., Mbanya, J.-C., Unwin, N.C., Porcher, R., Kengne, A.-P., Fezeu, L., Minkoulou, E.M., Tournoux, C., Gautier, J.-F., Aspray, T.J. and Alberti, K. 2004. Exposure over the life course to an urban environment and its relation with obesity, diabetes, and hypertension in rural and urban Cameroon. International Journal of Epidemiology. 33(4), pp.769-776.
Spallek, J., Zeeb, H. and Razum, O. 2011. What do we have to know from migrants' past exposures to understand their health status? A life course approach. Emerging Themes in Epidemiology. 8(6).
Ssewanyana, D., Abubakar, A., van Baar, A., Mwangala, P.N. and Newton, C.R. 2018. Perspectives on Underlying Factors for Unhealthy Diet and Sedentary Lifestyle of Adolescents at a Kenyan Coastal Setting. Frontiers in Public Health. 6, pp.11-11.
Stern, R., Puoane, T. and Tsolekile, L. 2010. An Exploration into the Determinants of Noncommunicable Diseases Among Rural-to-Urban Migrants in Periurban South Africa. Preventing Chronic Disease 7(6).
Steyn, N.P., Jaffer, N., Nel, J., Levitt, N., Steyn, K., Lombard, C. and Peer, N. 2016. Dietary Intake of the Urban Black Population of Cape Town: The Cardiovascular Risk in Black South Africans (CRIBSA) Study. Nutrients. 8(5), p285.
279
Steyn, N.P., Labadarios, D. and Nel, J.H. 2011a. Factors which influence the consumption of street foods and fast foods in South Africa--a national survey. Nutrition Journal. 10, p104.
Steyn, N.P., McHiza, Z., Hill, J., Davids, Y.D., Venter, I., Hinrichsen, E., Opperman, M., Rumbelow, J. and Jacobs, P. 2014. Nutritional contribution of street foods to the diet of people in developing countries: A systematic review. Public Health Nutrition. 17(6), pp.1363-1374.
Steyn, N.P. and McHiza, Z.J. 2014. Obesity and the nutrition transition in Sub-Saharan Africa. Annals of the New York Academy of Sciences. 1311, pp.88-101.
Steyn, N.P., Nel, J.H., Parker, W., Ayah, R. and Mbithe, D. 2012. Urbanisation and the nutrition transition: a comparison of diet and weight status of South African and Kenyan women. Scandinavian Journal of Public Health. 40(3), pp.229-238.
Steyn, N.P., Nel, J.H., Parker, W.A., Ayah, R. and Mbithe, D. 2011b. Dietary, social, and environmental determinants of obesity in Kenyan women. Scandinavian Journal of Public Health. 39(1), pp.88-97.
Stok, F.M., Hoffmann, S., Volkert, D., Boeing, H., Ensenauer, R., Stelmach-Mardas, M., Kiesswetter, E., Weber, A., Rohm, H., Lien, N., Brug, J., Holdsworth, M. and Renner, B. 2017. The DONE framework: Creation, evaluation, and updating of an interdisciplinary, dynamic framework 2.0 of determinants of nutrition and eating. PLOS One. 12(2), pe0171077.
Stok, F.M., Renner, B., Allan, J., Boeing, H., Ensenauer, R., Issanchou, S., Kiesswetter, E., Lien, N., Mazzocchi, M., Monsivais, P., Stelmach-Mardas, M., Volkert, D. and Hoffmann, S. 2018. Dietary Behavior: An Interdisciplinary Conceptual Analysis and Taxonomy. Frontiers in Psychology. 9(1689).
Storfer-Isser, A. and Musher-Eizenman, D. 2013. Measuring Parent Time Scarcity and Fatigue as Barriers to Meal Planning and Preparation: Quantitative Scale Development. Journal of Nutrition Education and Behavior. 45(2), pp.176-182.
Story, M., Kaphingst, K.M., Robinson-O'Brien, R. and Glanz, K. 2008. Creating healthy food and eating environments: policy and environmental approaches. Annual Review of Public Health. 29, pp.253-272.
Swinburn, B., Egger, G. and Raza, F. 1999. Dissecting Obesogenic Environments: The Development and Application of a Framework for Identifying and Prioritizing Environmental Interventions for Obesity. Preventive Medicine. 29(6), pp.563-570.
Swinburn, B., Kraak, V., Rutter, H., Vandevijvere, S., Lobstein, T., Sacks, G., Gomes, F., Marsh, T. and Magnusson, R. 2015. Strengthening of accountability systems to create healthy food environments and reduce global obesity. The Lancet. 385(9986), pp.2534-2545.
Swinburn, B., Sacks, G., Vandevijvere, S., Kumanyika, S., Lobstein, T., Neal, B., Barquera, S., Friel, S., Hawkes, C., Kelly, B., L'Abbé, M., Lee, A., Ma, J., Macmullan, J., Mohan, S., Monteiro, C., Rayner, M., Sanders, D., Snowdon, W., Walker, C. and INFORMAS. 2013. INFORMAS (International Network for Food and Obesity/non-communicable diseases Research, Monitoring and Action Support): overview and key principles. Obesity Reviews. 14(S1), pp.1-12.
Swinburn, B.A., Kraak, V.I., Allender, S., Atkins, V.J., Baker, P.I., Bogard, J.R., Brinsden, H., Calvillo, A., De Schutter, O., Devarajan, R., Ezzati, M., Friel, S., Goenka, S., Hammond, R.A., Hastings, G., Hawkes, C., Herrero, M., Hovmand, P.S., Howden, M., Jaacks, L.M., Kapetanaki, A.B., Kasman, M., Kuhnlein, H.V., Kumanyika, S.K., Larijani, B., Lobstein, T., Long, M.W., Matsudo, V.K.R., Mills, S.D.H., Morgan, G., Morshed, A., Nece, P.M., Pan, A., Patterson, D.W., Sacks, G., Shekar, M., Simmons, G.L., Smit, W., Tootee, A., Vandevijvere, S., Waterlander, W.E., Wolfenden, L. and Dietz, W.H. 2019. The Global Syndemic
280
of Obesity, Undernutrition, and Climate Change: The Lancet Commission report. The Lancet. 393(10173), pp.791-846.
Swinburn, B.A., Sacks, G., Hall, K.D., McPherson, K., Finegood, D.T., Moodie, M.L. and Gortmaker, S.L. 2011. The global obesity pandemic: shaped by global drivers and local environments. The Lancet. 378(9793), pp.804-814.
Symmank, C., Mai, R., Hoffmann, S., Stok, F.M., Renner, B., Lien, N. and Rohm, H. 2017. Predictors of food decision making: A systematic interdisciplinary mapping (SIM) review. Appetite. 110, pp.25-35.
Tacoli, C. 2003. The links between urban and rural development. Environment and Urbanization. 15(1), pp.3-12.
Tacoli, C. 2013. Urban poverty, food security and climate change. [Online]. London: International Institute for Environment and Development (IIED). [Accessed 28 July 2020]. Available from: https://pubs.iied.org/pdfs/10623IIED.pdf
Tacoli, C. 2017. Food (In)Security in Rapidly Urbanising, Low-Income Contexts. International Journal of Environmental Research and Public Health. 14(12), p1554.
Tacoli, C., McGranahan, G. and Satterthwaite, D. 2015. Urbanisation, rural-urban migration and urban poverty. [Online]. Human Settlements Group, International Institute for Environment and Development (IIED). [Accessed 28 July 2020]. Available from: https://www.jstor.org/stable/pdf/resrep01308.pdf?refreqid=excelsior%3A817ed0fef22200738565125ae64b252d
Teddlie, C. and Tashakkori, A. 2009. Foundations of mixed methods research: Integrating quantitative and qualitative approaches in the social and behavioral sciences. Sage.
Temple, B. and Young, A. 2004. Qualitative Research and Translation Dilemmas. Qualitative Research. 4(2), pp.161-178.
Temple, N.J. and Steyn, N.P. 2011. The cost of a healthy diet: a South African perspective. Nutrition. 27(5), pp.505-508.
Tevera, D.S. 1996. Urban Agriculture in Africa: A Comparative Analysis of Findings from Zimbabwe, Kenya and Zambia. African Urban Quarterly. 11(2-3), pp.181-187.
Thakur, M., Boudewijns, E.A., Babu, G.R., Winkens, B., de Witte, L.P., Gruiskens, J., Sushama, P., Ghergu, C.T. and van Schayck, O.C.P. 2017. Low-smoke chulha in Indian slums: study protocol for a randomised controlled trial. BMC Public Health. 17(1), p454.
Thomson, D.R., Linard, C., Vanhuysse, S., Steele, J.E., Shimoni, M., Siri, J., Caiaffa, W.T., Rosenberg, M., Wolff, E., Grippa, T., Georganos, S. and Elsey, H. 2019. Extending Data for Urban Health Decision-Making: a Menu of New and Potential Neighborhood-Level Health Determinants Datasets in LMICs. Journal of Urban Health. 96(4), pp.514-536.
Tokhi, M., Comrie-Thomson, L., Davis, J., Portela, A., Chersich, M. and Luchters, S. 2018. Involving men to improve maternal and newborn health: A systematic review of the effectiveness of interventions. PLOS One. 13(1), pe0191620.
Tong, A., Sainsbury, P. and Craig, J. 2007. Consolidated criteria for reporting qualitative research (COREQ): a 32-item checklist for interviews and focus groups. International Journal for Quality in Health Care. 19(6), pp.349-357.
Torun, B., Stein, A.D., Schroeder, D., Grajeda, R., Conlisk, A., Rodriguez, M., Mendez, H. and Martorell, R. 2002. Rural-to-urban migration and cardiovascular disease risk factors in young Guatemalan adults. International Journal of Epidemiology. 31(1), pp.218-226.
Toselli, S., Rinaldo, N. and Gualdi-Russo, E. 2016. Body image perception of African immigrants in Europe. Globalization and Health. 12(1), p48.

281
Townshend, T. and Lake, A. 2017. Obesogenic environments: current evidence of the built and food environments. Perspectives in Public Health. 137(1), pp.38-44.
Trichopoulou, A. 2012. Diversity v. globalization: traditional foods at the epicentre. Public Health Nutrition. 15(6), pp.951-954.
Trichopoulou, A., Soukara, S. and Vasilopoulou, E. 2007. Traditional foods: a science and society perspective. Trends in Food Science & Technology. 18(8), pp.420-427.
Tschirley, D., Reardon, T., Dolislager, M. and Snyder, J. 2015. The Rise of a Middle Class in East and Southern Africa: Implications for Food System Transformation. Journal of International Development. 27(5), pp.628-646.
Turk, M.T., Fapohunda, A. and Zoucha, R. 2015. Using photovoice to explore nigerian immigrants' eating and physical activity in the United States. Journal of Nursing Scholarship. 47(1), pp.16-24.
Turner, C., Aggarwal, A., Walls, H., Herforth, A., Drewnowski, A., Coates, J., Kalamatianou, S. and Kadiyala, S. 2018. Concepts and critical perspectives for food environment research: A global framework with implications for action in low- and middle-income countries. Global Food Security. 18, pp.93-101.
Turner, C., Kadiyala, S., Aggarwal, A., Coates, J., Drewnowski, A., Hawkes, C., Herforth, A., Kalamatianou, S. and Walls, H. 2017. Concepts and methods for food environment research in low and middle income countries. [Online]. London, UK: Agriculture, Nutrition and Health Academy Food Environments Working Group (ANH-FEWG). [Accessed 28 July 2020]. Available from: https://anh-academy.org/sites/default/files/FEWG_TechnicalBrief_low.pdf
Uganda National Academy of Sciences. 2018. Owning Our Urban Future: Enabling Healthy Cities in Eastern Africa. Kampala, Uganda.
Ulijaszek, S.J., Mann, N. and Elton, S. 2012. Evolving Human Nutrition: Implications for Public Health. Cambridge: Cambridge University Press.
United Nations. 2011. Map of Kenya. [Online]. [Accessed 21 March 2020]. Available from: https://www.un.org/Depts/Cartographic/map/profile/kenya.pdf
United Nations Human Settlements Programme. 2016a. Slum Almanac 2015–2016: Tracking Improvement in the Lives of Slum Dwellers. [Online]. Nairobi, Kenya: UN-Habitat. [Accessed 28 July 2020]. Available from: https://unhabitat.org/sites/default/files/download-manager-files/Slum%20Almanac%202015-2016_PSUP.pdf
United Nations Human Settlements Programme. 2016b. Urbanization and development emerging futures. [Online]. Nairobi, Kenya United Nations Human Settlements Programme (UN-Habitat) Available from: https://unhabitat.org/sites/default/files/download-manager-files/WCR-2016-WEB.pdf
United Nations Human Settlements Programme. [no date]. ‘People United for a New Korogocho’ – Korogocho (KENYA). [Online]. [Accessed 21 March 2020]. Available from: https://mirror.unhabitat.org/content.asp?cid=5263&catid=510&typeid=24&subMenuId=0
United States Agency for International Development. 2019. Kenya: Devolution. [Online]. United States Agency for International Development (USAID). [Accessed 29 July 2020]. Available from: https://www.usaid.gov/sites/default/files/documents/1860/Devolution_fact_sheet_2019.pdf
Unwin, N., James, P., McLarty, D., Machybia, H., Nkulila, P., Tamin, B., Nguluma, M. and McNally, R. 2010. Rural to urban migration and changes in cardiovascular risk factors in Tanzania: a prospective cohort study. BMC Public Health. 10, p272.
https://unhabitat.org/sites/default/files/download-manager-files/Slum%20Almanac%202015-2016_PSUP.pdf
282
Urquia, M.L. and Gagnon, A.J. 2011. Glossary: migration and health. Journal of Epidemiology and Community Health. 65(5), p467.
van 't Riet, H., den Hartog, A.P., Hooftman, D.A., Foeken, D.W. and van Staveren, W.A. 2003. Determinants of non-home-prepared food consumption in two low-income areas in Nairobi. Nutrition. 19(11-12), pp.1006-1012.
van 't Riet, H., den Hartog, A.P., Mwangi, A.M., Mwadime, R.K., Foeken, D.W. and van Staveren, W.A. 2001. The role of street foods in the dietary pattern of two low-income groups in Nairobi. European Journal of Clinical Nutrition. 55(7), pp.562-570.
van de Vijver, S., Oti, S., Oduor, C., Ezeh, A., Lange, J., Agyemang, C. and Kyobutungi, C. 2015. Challenges of health programmes in slums. The Lancet. 386(10008), pp.2114-2116.
van de Vijver, S., Oti, S.O., Gomez, G.B., Agyemang, C., Egondi, T., van Charante, E.M., Brewster, L.M., Hankins, C., Tanovic, Z. and Ezeh, A. 2016. Impact evaluation of a community-based intervention for prevention of cardiovascular diseases in the slums of Nairobi: the SCALE-UP study. Global Health Action. 9(1), p30922.
Varadharajan, K.S., Thomas, T., Rajaraman, D., Kurpad, A.V. and Vaz, M. 2013. Overweight and obesity among internal migrants in India. Asia Pacific Journal of Clinical Nutrition. 22(3), pp.416-425.
Venn, D. and Strazdins, L. 2017. Your money or your time? How both types of scarcity matter to physical activity and healthy eating. Social Science & Medicine. 172, pp.98-106.
Verstraeten, R., Van Royen, K., Ochoa-Aviles, A., Penafiel, D., Holdsworth, M., Donoso, S., Maes, L. and Kolsteren, P. 2014. A conceptual framework for healthy eating behavior in ecuadorian adolescents: A qualitative study. PLOS One. 9(1), pe87183.
Vorster, H.H., Kruger, A. and Margetts, B.M. 2011. The nutrition transition in Africa: can it be steered into a more positive direction? Nutrients. 3(4), pp.429-441.
Vyas, S. and Kumaranayake, L. 2006. Constructing socio-economic status indices: how to use principal components analysis. Health Policy and Planning. 21(6), pp.459-468.
Wade, R.H. 2003. What strategies are viable for developing countries today? The World Trade Organization and the shrinking of ‘development space’. Review of International Political Economy. 10(4), pp.621-644.
Wahl, B., Lehtimaki, S., Germann, S. and Schwalbe, N. 2019. Expanding the use of community health workers in urban settings: a potential strategy for progress towards universal health coverage. Health Policy and Planning. 35(1), pp.91-101.
Walls, H.L., Johnston, D., Mazalale, J. and Chirwa, E.W. 2018. Why we are still failing to measure the nutrition transition. BMJ Global Health. 3(1), pe000657.
Wang, C. and Burris, M.A. 1997. Photovoice: Concept, methodology, and use for participatory needs assessment. Health Education & Behavior. 24(3), pp.369-387.
Wang, Y.C., McPherson, K., Marsh, T., Gortmaker, S.L. and Brown, M. 2011. Health and economic burden of the projected obesity trends in the USA and the UK. The Lancet. 378(9793), pp.815-825.
Warren, E., Hawkesworth, S. and Knai, C. 2015. Investigating the association between urban agriculture and food security, dietary diversity, and nutritional status: A systematic literature review. Food Policy. 53, pp.54-66.
Webb, P., Coates, J., Frongillo, E.A., Rogers, B.L., Swindale, A. and Bilinsky, P. 2006. Measuring Household Food Insecurity: Why It's So Important and Yet So Difficult to Do. The Journal of Nutrition. 136(5), pp.1404S-1408S.
283
Wells, J.C., Marphatia, A.A., Cole, T.J. and McCoy, D. 2012. Associations of economic and gender inequality with global obesity prevalence: understanding the female excess. Social Science & Medicine. 75(3), pp.482-490.
Weru, J. 2004. Community federations and city upgrading: the work of Pamoja Trust and Muungano in Kenya. Environment and Urbanization. 16(1), pp.47-62.
Weru, J., Okoyo, O., Wambui, M., Njoroge, P., Mwelu, J., Otibine, E., Chepchumba, A., Wanjiku, R., Wakesho, T. and Njenga Maina, J.P. 2018. The Akiba Mashinani Trust, Kenya: a local fund’s role in urban development. Environment and Urbanization. 30(1), pp.53-66.
Willett, W. 2012. Nutritional epidemiology. Oxford university press. Williams, R.J.T.J.o.M.S. 2016. Understanding and interpreting generalized ordered logit
models. 40(1), pp.7-20. Wilson, A., Renzaho, A.M.N., McCabe, M. and Swinburn, B. 2010. Towards
understanding the new food environment for refugees from the Horn of Africa in Australia. Health & Place. 16(5), pp.969-976.
World Bank. 2020a. Population living in slums (% of urban population) - Sub-Saharan Africa. [Online]. [Accessed 07 July 2020]. Available from: https://data.worldbank.org/indicator/EN.POP.SLUM.UR.ZS?locations=ZG
World Bank. 2020b. Urban population (% of total population) - Sub-Saharan Africa. [Online]. [Accessed 07 July 2020]. Available from: https://data.worldbank.org/indicator/SP.URB.TOTL.IN.ZS?locations=ZG
World Food Programme. 2008. Food consumption analysis: calculation and use of the food consumption score in food security analysis. [Online]. Rome, Italy: World Food Programme Rome (WFP). [Accessed 28 July 2020]. Available from: https://documents.wfp.org/stellent/groups/public/documents/manual_guide_proced/wfp197216.pdf
World Health Organisation. 2009. Interventions on diet and physical activity: what works: summary report. Geneva, Switzerland.
World health Organisation. 2017. Double-duty actions. [Online]. Geneva, Switzerland: World Health Organization (WHO). Available from: https://www.who.int/nutrition/publications/doubleburdenmalnutrition-policybrief/en/
World health Organisation. 2018. Healthy diet. [Online]. [Accessed 23 March 2020]. Available from: https://www.who.int/news-room/fact-sheets/detail/healthy-diet
World Health Organisation. 2019. The WHO STEPwise approach to noncommunicable disease risk factor surveillance (STEPS). [Online]. [Accessed 28 July 2020]. Available from: https://www.who.int/chp/steps/instrument/STEPS_Instrument_V3.2.pdf?ua=1
World Health Organisation. 2020. Obesity and overweight. [Online]. [Accessed 17 March 2020]. Available from: https://www.who.int/en/news-room/fact-sheets/detail/obesity-and-overweight
Yadav, K. and Krishnan, A. 2008. Changing patterns of diet, physical activity and obesity among urban, rural and slum populations in north India. Obesity Reviews. 9(5), pp.400-408.
Zezza, A. and Tasciotti, L. 2010. Urban agriculture, poverty, and food security: Empirical evidence from a sample of developing countries. Food Policy. 35(4), pp.265-273.
Ziraba, A.K., Fotso, J.C. and Ochako, R. 2009. Overweight and obesity in urban Africa: A problem of the rich or the poor? BMC Public Health. 9, p465.
Zulu, E.M., Beguy, D., Ezeh, A.C., Bocquier, P., Madise, N.J., Cleland, J. and Falkingham, J. 2011. Overview of migration, poverty and health dynamics in Nairobi City's slum settlements. Journal of Urban Health. 88(2), pp.185-199.
284
Appendix A Questionnaires and interview guides
A.1 Pre-questionnaires
Record the following information about the participant:
Demographic characteristics
What is your age?
Je, wewe ni wa umri gani?
What is your current marital status?
Je, hali yako ya sasa ya ndoa ni ipi?
Who do you live with?
Je, unaishi na nani?
Which religious denomination do you belong to?
Je, wewe ni wa dini gani?
Which ethnic group do you belong to?
Je, wewe ni wa kabila gani?
Which part of Kenya are you from?
Je, umetoka sehemu gani ya Kenya?
Which part of Kenya did you migrate from?
Ulikuwa unaishi wapi kabla ya kuhamia Nairobi?
How many years have you lived in Nairobi?
Je, umeishi Nairobi kwa miaka mingapi?
How many years have you lived where you are living
now?
Je, umeishi kwa miaka ngapi mahali unaishi sasa?
Socio-economic characteristics
What was your occupation before arriving in Nairobi?
Je, ulikuwa unafanya kazi gani kabla kuhamia
Nairobi?
What is your current occupation?
Je, unafanya kazi gani kwa sasa?
285
What is the highest level of education that you have
completed?
Je, umekamilisha kiwango kipi cha juu zaidi cha
elimu?
How much is your food and non-food expenditure in a
normal month?
Je, kwa kawaida, huwa unatumia pesa ngapi kwa
matumizi yako ya chakula na matumizi mengineyo
kwa mwezi mmoja?
Dietary change scale
How would you compare the similarity between the food you now normally eat in
the slum with the food you normally ate in your home area?
Je, unaweza kulinganisha aje kufanana kwa chakula unachokula kwa mitaa ya
mabanda na chakula ulichokuwa unakula katika nyumbani kwako kabla ya
kuhamia Nairobi?
Scale (1-10):
The same as what I used to eat -------------------------------------------------------------
Extremely different
Kiwango (1-10)
Hakuna tofauti kabisa ---------------------------------------------------------------------kuna
tofauti kubwa kabisa
286
A.2 Interview guides
A.2.1 Key informant interview guide
Participant’s ID:
Understanding nutrition transition among internal rural-urban migrants in Nairobi’s slums
Key-informant interview guide ------------------------------------------------------------------------------------------------------
Date: _______________ Moderator: __________________________ Assistant Moderator: ______________________________
Starting section Thank you for taking part in this study. As you know, we would like to better understand dietary behaviour among people who migrated to Nairobi from the countryside. Further we would like to hear more about current policies and programmes which address unhealthy dietary behaviour, obesity and diet-related NCDs, and how rural-urban migrants are represented in these. We would like you to do the talking. There are no right or wrong answers. At any time, you can call a stop to the interview, or say that you do not wish to answer a question.
Explain how the recorder is used Confirm that the participant has received and understood the information sheet Confirm that participant has signed the consent form.
Do you have any questions before we start?
*Switch on the recorder*
Section 1. Migrants’ dietary behaviour in slums
1. Are you often in in contact with rural-urban migrants? Could you tell me more about their diet?
2. Have you noticed any changes in their diet?
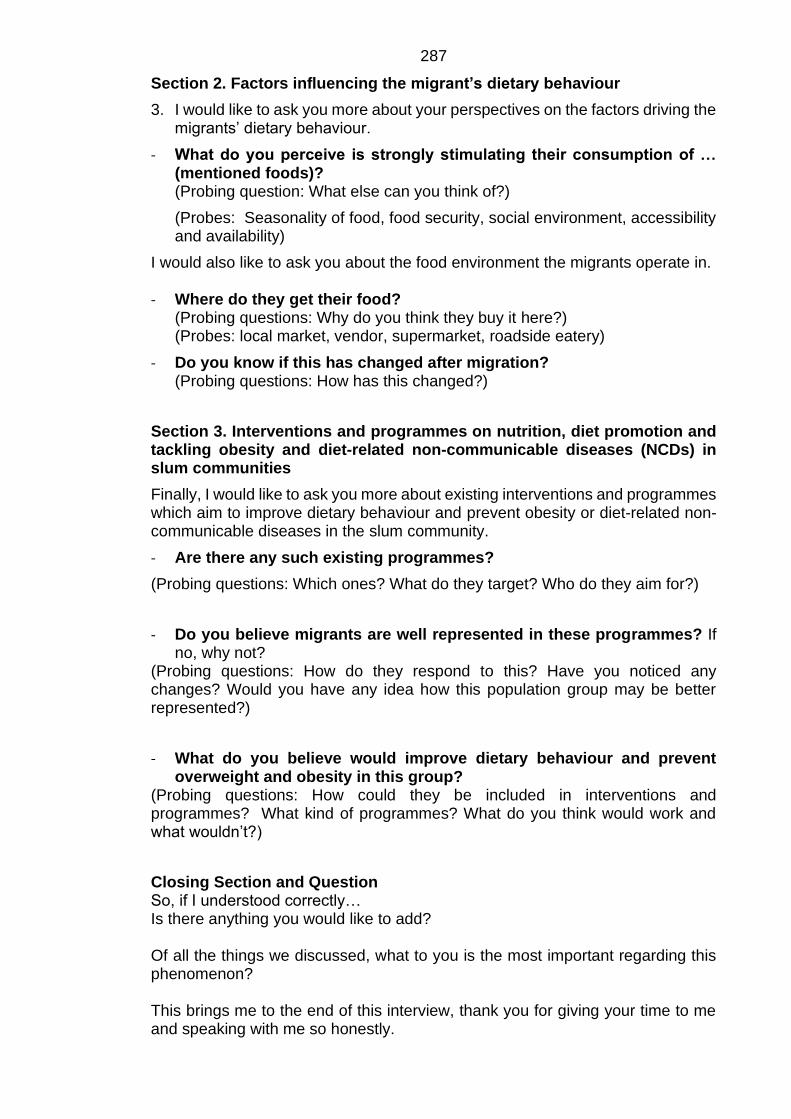
287
Section 2. Factors influencing the migrant’s dietary behaviour
3. I would like to ask you more about your perspectives on the factors driving the migrants’ dietary behaviour.
- What do you perceive is strongly stimulating their consumption of … (mentioned foods)? (Probing question: What else can you think of?)
(Probes: Seasonality of food, food security, social environment, accessibility and availability)
I would also like to ask you about the food environment the migrants operate in. - Where do they get their food?
(Probing questions: Why do you think they buy it here?) (Probes: local market, vendor, supermarket, roadside eatery)
- Do you know if this has changed after migration? (Probing questions: How has this changed?)
Section 3. Interventions and programmes on nutrition, diet promotion and tackling obesity and diet-related non-communicable diseases (NCDs) in slum communities
Finally, I would like to ask you more about existing interventions and programmes which aim to improve dietary behaviour and prevent obesity or diet-related non-communicable diseases in the slum community.
- Are there any such existing programmes?
(Probing questions: Which ones? What do they target? Who do they aim for?)
- Do you believe migrants are well represented in these programmes? If no, why not?
(Probing questions: How do they respond to this? Have you noticed any changes? Would you have any idea how this population group may be better represented?)
- What do you believe would improve dietary behaviour and prevent overweight and obesity in this group?
(Probing questions: How could they be included in interventions and programmes? What kind of programmes? What do you think would work and what wouldn’t?)
Closing Section and Question So, if I understood correctly… Is there anything you would like to add? Of all the things we discussed, what to you is the most important regarding this phenomenon? This brings me to the end of this interview, thank you for giving your time to me and speaking with me so honestly.
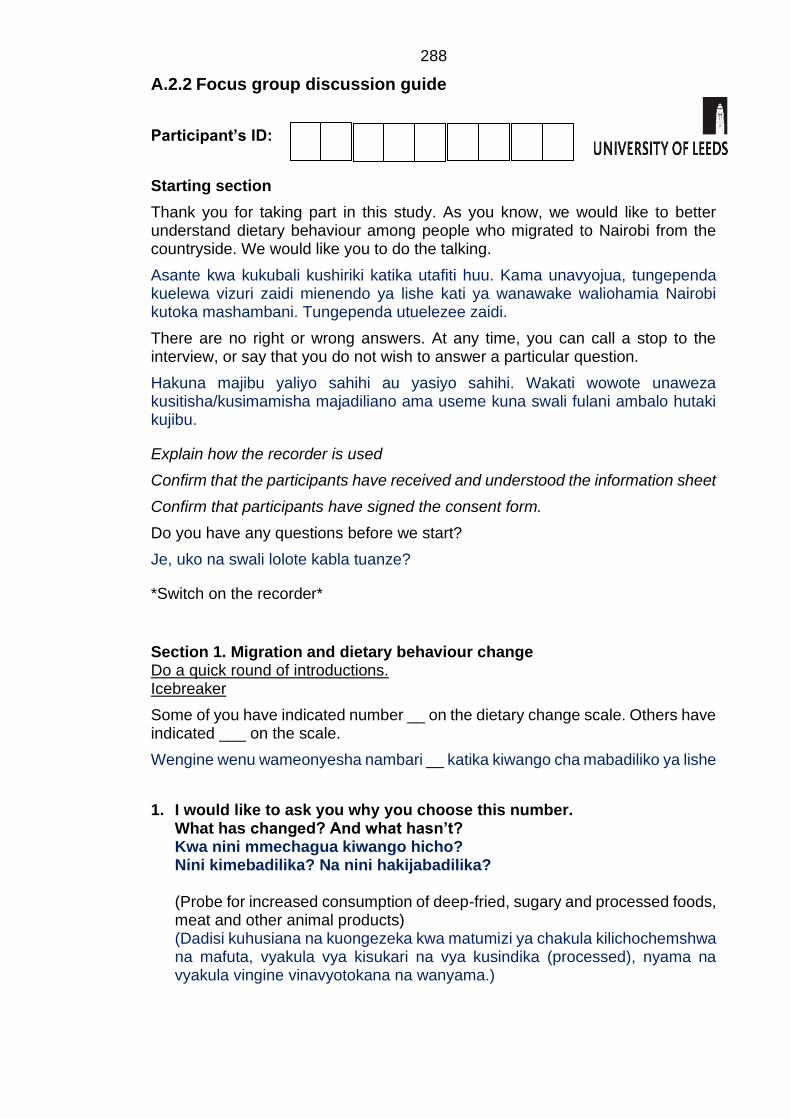
288
A.2.2 Focus group discussion guide
Participant’s ID:
Starting section
Thank you for taking part in this study. As you know, we would like to better understand dietary behaviour among people who migrated to Nairobi from the countryside. We would like you to do the talking.
Asante kwa kukubali kushiriki katika utafiti huu. Kama unavyojua, tungependa kuelewa vizuri zaidi mienendo ya lishe kati ya wanawake waliohamia Nairobi kutoka mashambani. Tungependa utuelezee zaidi.
There are no right or wrong answers. At any time, you can call a stop to the interview, or say that you do not wish to answer a particular question.
Hakuna majibu yaliyo sahihi au yasiyo sahihi. Wakati wowote unaweza kusitisha/kusimamisha majadiliano ama useme kuna swali fulani ambalo hutaki kujibu.
Explain how the recorder is used
Confirm that the participants have received and understood the information sheet
Confirm that participants have signed the consent form.
Do you have any questions before we start?
Je, uko na swali lolote kabla tuanze?
*Switch on the recorder*
Section 1. Migration and dietary behaviour change Do a quick round of introductions. Icebreaker
Some of you have indicated number __ on the dietary change scale. Others have indicated ___ on the scale.
Wengine wenu wameonyesha nambari __ katika kiwango cha mabadiliko ya lishe
1. I would like to ask you why you choose this number. What has changed? And what hasn’t? Kwa nini mmechagua kiwango hicho? Nini kimebadilika? Na nini hakijabadilika? (Probe for increased consumption of deep-fried, sugary and processed foods, meat and other animal products) (Dadisi kuhusiana na kuongezeka kwa matumizi ya chakula kilichochemshwa na mafuta, vyakula vya kisukari na vya kusindika (processed), nyama na vyakula vingine vinavyotokana na wanyama.)

289
(Pick out food groups typically associated with an energy-dense diet: deep-fried foods, highly processed foods, sodas, cheap cooking oils, animal products (red meat), sugar and sweet food products like cake and white bread). (Angazia vikundi vya vyakula vinavyohusishwa na vyakula vya nishati (energy-dense): vyakula vya kusindika, sodas, mafuta ya kupikia yenye bei rahisi, bidhaa za wanyama (red meat), sukari na bidhaa za chakula zilizo tamu kama keki na mkate mweupe)
2. How come you started eating these (foods) after migration? (Probing questions: 1. Are they affordable? 2. Are they accessible? 3. Are they available? 4. Do you prefer these foods?) Kulikuwa aje ukaanza kukula hizi chakula baada ya kuhamia mjini? (Je, ni nafuu? Je, zinaweza kupatikana? Je, zinapatikana? Unapendelea vyakula hivi?)
Section 2.
Social and cultural context of changing dietary behaviour I would now like to discuss with you about how your neighbourhood influences what you eat. Ningetaka tujadiliane na wewe kuhusu vile maeneo jirani yako huadhiri chakula unachokula.
3. How is your daily eating routine? Utaratibu wako wa kula kila siku ni upi? (Probing questions: Can anybody identify themselves with this? Is it different for somebody else?) Je, kuna mtu anaweza sema utaratibu wake ni upi? Au ni tofauti kwa kila mmoja?
4. Who influences what you eat? Nani huadhiri chakula unachokula?
(Probing questions: How do they influence what you eat? Which foods do you eat because of them?) Yeye/wao huadhiri kivipi? Ni chakula gani unachokula sababu yao?
(Probing questions: Other rural migrants influence this? Are you cooking together? Can you think of anything else in the neighbourhood where you are living that influences what you are eating?) (Wahamiaji wengine huadhiri? Huwa mnapika pamoja? Je, unaweza kufikiria kitu kingine chochote katika maeneo jirani unayoishi ambayo huadhiri kile unachokula?)
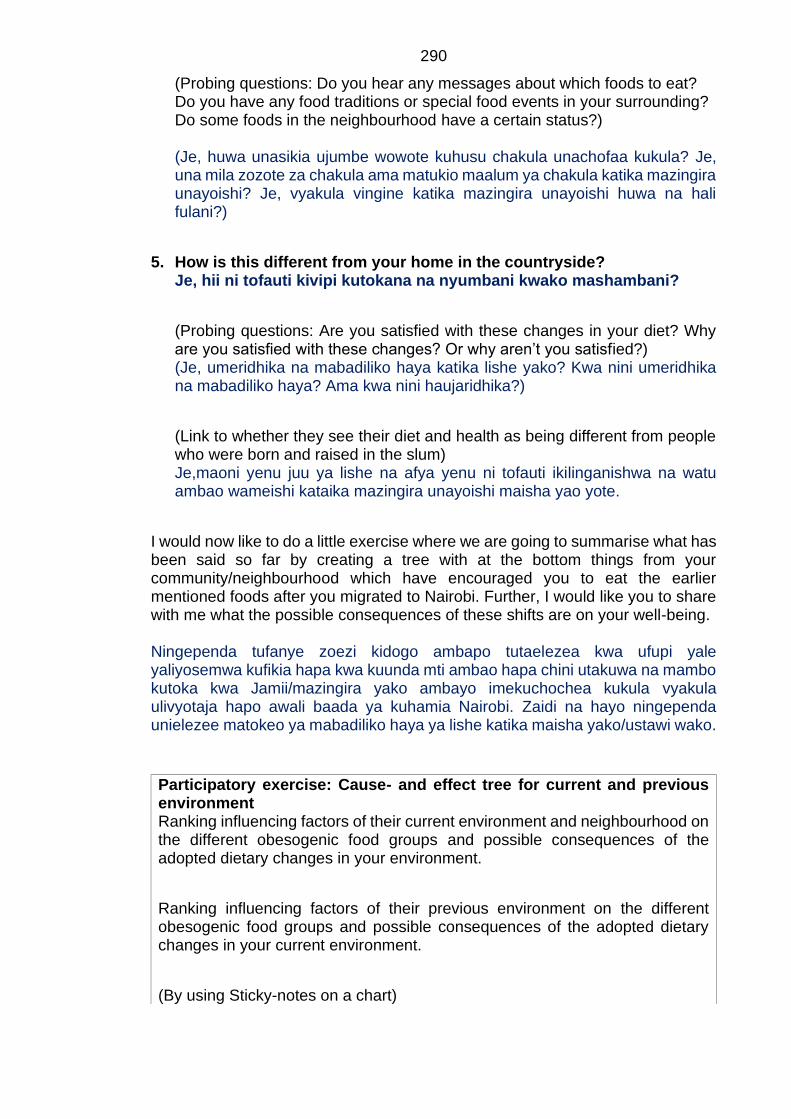
290
(Probing questions: Do you hear any messages about which foods to eat? Do you have any food traditions or special food events in your surrounding? Do some foods in the neighbourhood have a certain status?) (Je, huwa unasikia ujumbe wowote kuhusu chakula unachofaa kukula? Je, una mila zozote za chakula ama matukio maalum ya chakula katika mazingira unayoishi? Je, vyakula vingine katika mazingira unayoishi huwa na hali fulani?)
5. How is this different from your home in the countryside? Je, hii ni tofauti kivipi kutokana na nyumbani kwako mashambani?
(Probing questions: Are you satisfied with these changes in your diet? Why are you satisfied with these changes? Or why aren’t you satisfied?) (Je, umeridhika na mabadiliko haya katika lishe yako? Kwa nini umeridhika na mabadiliko haya? Ama kwa nini haujaridhika?)
(Link to whether they see their diet and health as being different from people who were born and raised in the slum) Je,maoni yenu juu ya lishe na afya yenu ni tofauti ikilinganishwa na watu ambao wameishi kataika mazingira unayoishi maisha yao yote.
I would now like to do a little exercise where we are going to summarise what has been said so far by creating a tree with at the bottom things from your community/neighbourhood which have encouraged you to eat the earlier mentioned foods after you migrated to Nairobi. Further, I would like you to share with me what the possible consequences of these shifts are on your well-being. Ningependa tufanye zoezi kidogo ambapo tutaelezea kwa ufupi yale yaliyosemwa kufikia hapa kwa kuunda mti ambao hapa chini utakuwa na mambo kutoka kwa Jamii/mazingira yako ambayo imekuchochea kukula vyakula ulivyotaja hapo awali baada ya kuhamia Nairobi. Zaidi na hayo ningependa unielezee matokeo ya mabadiliko haya ya lishe katika maisha yako/ustawi wako.
Participatory exercise: Cause- and effect tree for current and previous environment Ranking influencing factors of their current environment and neighbourhood on the different obesogenic food groups and possible consequences of the adopted dietary changes in your environment.
Ranking influencing factors of their previous environment on the different obesogenic food groups and possible consequences of the adopted dietary changes in your current environment.
(By using Sticky-notes on a chart)

291
----------------------------------------------------------------------------------------------------------
• Tea/snack break
Discuss the results afterwards.
Closing Section
Closing question: 6. Of all the things we discussed, what do you feel is the most important? Je, kwa mambo yote tuliyojadiliana ni jambo gani unahisi ni la muhimu zaidi?
Do you feel anything has changed regarding the dietary scale after the discussion? Je, unahisi kuna kitu chochote kilichobadilika kuhusu kiwango cha mabadiliko ya lishe baada ya mazungumzo?
This brings me to the end of our discussion. Thank you for sharing your knowledge and speaking with me so honestly. Huu ndio mwisho wa majadiliano yetu. Shukrani kwa kukubali kushirikiana nami na kupeana ujuzi wako na kuongea na mimi kwa uaminifu wa hali ya juu.
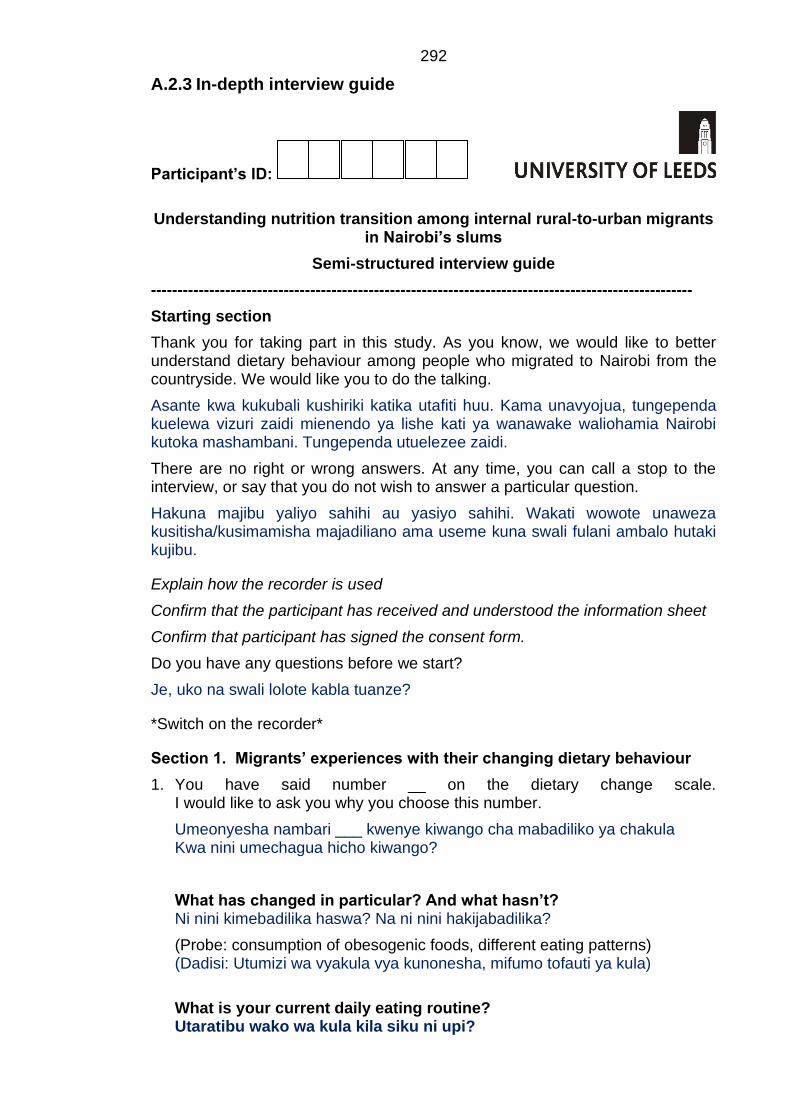
292
A.2.3 In-depth interview guide
Participant’s ID:
Understanding nutrition transition among internal rural-to-urban migrants in Nairobi’s slums
Semi-structured interview guide
------------------------------------------------------------------------------------------------------
Starting section
Thank you for taking part in this study. As you know, we would like to better understand dietary behaviour among people who migrated to Nairobi from the countryside. We would like you to do the talking.
Asante kwa kukubali kushiriki katika utafiti huu. Kama unavyojua, tungependa kuelewa vizuri zaidi mienendo ya lishe kati ya wanawake waliohamia Nairobi kutoka mashambani. Tungependa utuelezee zaidi.
There are no right or wrong answers. At any time, you can call a stop to the interview, or say that you do not wish to answer a particular question.
Hakuna majibu yaliyo sahihi au yasiyo sahihi. Wakati wowote unaweza kusitisha/kusimamisha majadiliano ama useme kuna swali fulani ambalo hutaki kujibu.
Explain how the recorder is used
Confirm that the participant has received and understood the information sheet
Confirm that participant has signed the consent form.
Do you have any questions before we start?
Je, uko na swali lolote kabla tuanze?
*Switch on the recorder*
Section 1. Migrants’ experiences with their changing dietary behaviour
1. You have said number __ on the dietary change scale. I would like to ask you why you choose this number.
Umeonyesha nambari ___ kwenye kiwango cha mabadiliko ya chakula Kwa nini umechagua hicho kiwango?
What has changed in particular? And what hasn’t? Ni nini kimebadilika haswa? Na ni nini hakijabadilika?
(Probe: consumption of obesogenic foods, different eating patterns) (Dadisi: Utumizi wa vyakula vya kunonesha, mifumo tofauti ya kula)
What is your current daily eating routine? Utaratibu wako wa kula kila siku ni upi?
293
(Probing question: Could you elaborate on …?) (Dadisi: elezea Zaidi tafadhali…)
How do you feel about your current diet? Je, unahisi aje kuhusu lishe yako ya sasa? (Probing question: Why do you think it is?) (Kwa nini unafikiria iko…? Ama kwa nini haiko…?)
2. Did your food preparation change since migrating to Nairobi? Je, maandalizi yako ya chakula ilibadilika tangu kuhamia Nairobi? (Probing question: In what way has it changed?) (Dadisi: Je, yamebadilika aje?)
So, to summarise what we just have been talking about … Kwa mukhtasari, tumeongea kuhusu…..
Section 2. Migrants’ perceptions on influences of dietary behaviour and their current food environment
3. I would like to ask you more about what has caused you to change your diet after migration. Ningependa kukuuliza Zaidi juu ya kile kilichosababisha wewe kubadilisha lishe yako baada ya kuhamia Nairobi.
- What do you feel is strongly encouraging your consumption of … (mentioned foods)? Ni nini unahisi kimechochea sana matumizi yako ya vyakula vilivyotajwa?
(Probing question: What else can you think of?)
(Dadisi: Nini kingine unaweza fikiria?)
4. I would also like to ask you about your current food environment. Ningependa pia kukuuliza kuhusu mazingira yako ya sasa ya chakula Where do you get your food from? Je, huwa unapata chakula wapi?
(Probing questions: Why do you buy it here? How has this changed after migration?) (Dadisi: kwa nini huwa unanunua hapo? Hii imebadilika aje baada ya kuhamia Nairobi?) (Probes: local market, vendor, supermarket, roadside eatery) (Dadisi: Soko la mtaani, maduka makubwa, kando ya barabara)
What do you think about your neighbourhood and its access to food in general? Unafikiria nini kuhusu maeneo jirani na upatikanaji wa chakula kwa ujumla?
294
(Probing questions: Could you tell me more about this? What would you like to see changed?) (Dadisi: Tafadhali elezea Zaidi? Ni nini ungependa kuona kimebadilika?) (Probes: availability & accessibility, marketing) (Dadisi: kuweza kupata, upatikanaji, utangazaji wa chakula)
How is this different from upcountry? Je, hii ni tofauti aje na maeneo ya mashambani? (Probing questions: What do you like more about it? What do you like less?) (Dadisi: Ni nini unapenda kuhusu hii? Ni nini hupendi?
Closing Section
So, if I understood correctly…
Kama nimeelewa viziru…..
Is there anything you would like to add?
Kuna kitu ungependa kuongezea?
Closing question:
5. Among all the things we talked about, what to you is the most important? Je, kwa mambo yote tuliyojadiliana ni jambo gani unahisi ni la muhimu zaidi?
This brings me to the end of this interview, thank you for giving your time to me and speaking with me so honestly.
Huu ndio mwisho wa majadiliano yetu. Shukrani kwa kukubali kushirikiana nami na kupeana ujuzi wako na kuongea na mimi kwa uaminifu wa hali ya juu.

295
A.2.4 PhotoVoice guide
Steps to follow:
Meeting 1:
1. Introductions of research study and establishing a safe social space
2. Objectives to communicate to participants
I would like to ask you to make photographs of the following:
Prompts:
- Take a picture of something or somebody which does not encourage you to cook or eat at home Piga picha ya kitu au mtu ambaye haukushawishi wewe kupika au kula nyumbani
- Take a picture of something or somebody in your neighbourhood which prevents you from eating traditional vegetables or traditional rural foods Piga picha ya kitu au mtu katika jirani yako ambayo inakuzuia kula mboga za jadi au vyakula vya jadi vijijini
- Take a picture of something or somebody in your neighbourhood that encourages you to buy and eat foods at the roadside Piga picha ya kitu au mtu katika jirani yako ambayo inakushawishi kununua na kula vyakula kando ya barabara
- Take a picture of something or somebody in your neighbourhood that prevents you from going to the local market Piga picha ya kitu au mtu katika jirani yako ambayo inakuzuia kwenda kwenye soko la ndani
- Take a picture of what you see as the ideal body image Piga picha kile unaona ni mwili sawa kuwa nayo.
------------------------------------------------------------------------------------------------------
➢ You are free to make your own interpretations; your pictures are the truth. ➢ Instruct participants to adhere to visual ethics (Anybody who has not given
consent can’t be captured on the photo) ➢ Encourage them to take photographs at home and within their neighborhood,
and not to take pictures of only their food.

296
(Participants won’t be informed on what an obesogenic diet entails as it may bias their answers on food intake eating habits)
3. Introducing photography and the use of cameras (1/2 day)
➢ Address the mechanical aspects of the cameras ➢ Usage of the camera to take best pictures (finger not in front of lens etc.) ➢ Inform participants to make sure that there is enough light when making the
pictures
Taking Photographs
➢ Remind participants to think of the following prior to taking photographs
➢ Be respectful (i.e. be polite when approaching others, do not invade the private space of others)
➢ Don’t do anything you wouldn’t usually do (taking a photograph in a location that puts you in danger)
➢ Don’t go anywhere you wouldn’t usually go
Meeting 2:
Story and caption development
1. The participants will be asked to select five (or more, depending on final quantity) which represents the given prompts and have most meaning to them. These will be collected and placed on a wall for group discussion.
2. The discussion will be participant-driven: The participants will be discussing their perceptions and experiences towards what is influencing their current diet and what role the food environment plays in this relationship, by telling the stories associated with each of their “most meaningful” photographs.
3. The discussion will be prompt based. The participants and the moderator will be discussing the pictures together per prompt instead of separate presentations by the participant.
The discussion will be regulated by asking the following probing questions:
Discussion by using the SHOWeD method The interview guide will include the following questions to explore their perceptions more in-depth (will be adapted as to be more appropriate):
(a) What do you See here?

297
(b) What is really Happening here?
(c) How does this relate to Our lives?
(d) Why did you choose this picture?
(e) What can we do about it? (List provided recommendations from participants on a chart)
(Adapt to study context after the first time)
Ending Section
Closing question:
4. Of all the things we discussed, what do you feel is the most important?
This brings me to the end of our Photovoice project. Thank you so much for your participation and sharing your opinions and knowledge.

298
Appendix B Ethical certificates of approval
B.1 University of Leeds ethical certificate of approval
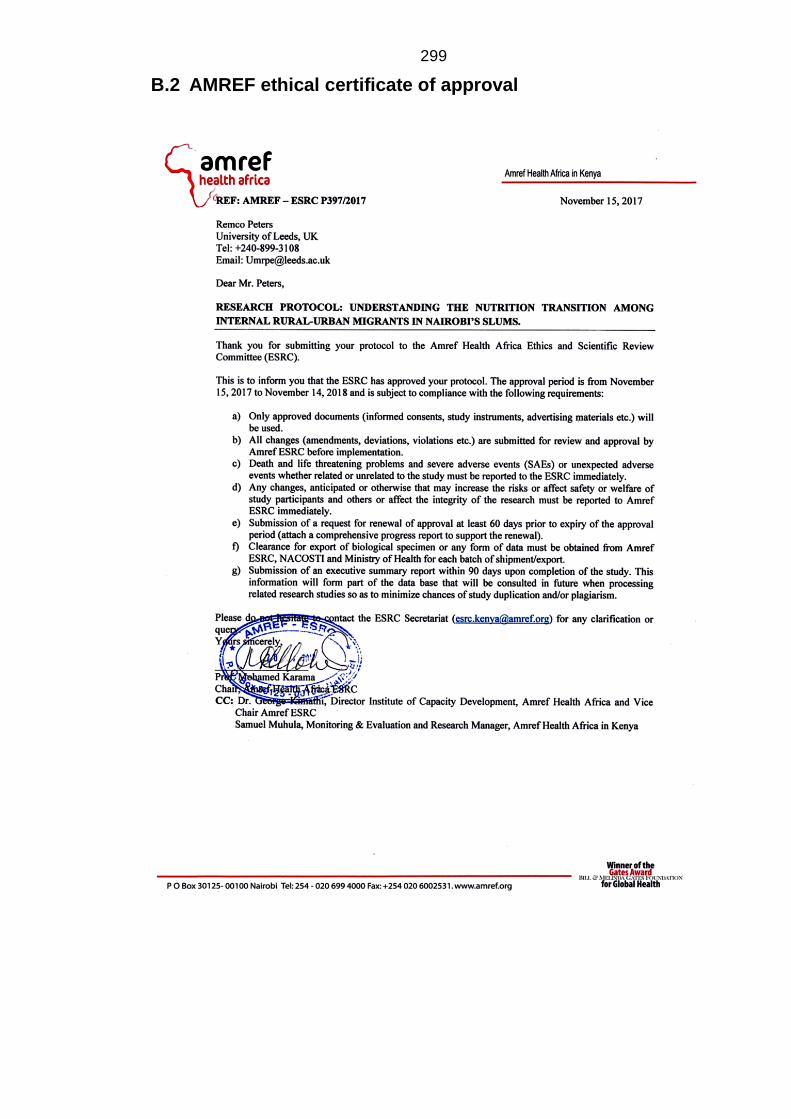
299
B.2 AMREF ethical certificate of approval
300
Appendix C Template study information and ethical form
C.1 Information sheet and consent for FGD
Title of Study: Understanding nutrition transition among rural-to-urban migrant women in Nairobi’s slums
Kichwa cha Utafiti: Kuelewa mabadiliko ya lishe miongoni mwa wanawake waliohamia mitaa ya mabanda Nairobi kutoka vijijini
Name of Investigators: Change as necessary for research staff African Population Health Research Centre (APHRC)/Carolina for Kibera (CfK)
Principal Investigator: Remco Peters University of Leeds
United Kingdom (UK) E-mail: [email protected]
Institutions: The Nuffield Centre for International Health & Development, Leeds Institute of Health Sciences, University of Leeds, Level 10, Worsley Building, Clarendon Way, Leeds, LS2 9NL, United Kingdom Write APHRC/CfK address
INTRODUCTION You are being invited to take part in a research study which aims to improve our understanding of dietary behavior change and rural-to-urban migration in Kenya. The findings of this study will be used to inform decision making about how to stimulate healthy dietary behaviour among rural-to-urban migrants and others who live within the urban slums. We would therefore like to hear more from people who migrated to Nairobi on their perspectives and experiences towards their dietary behaviour and the food environment. The study is called: “Understanding the nutrition transition among rural-to-urban migrant women in Nairobi” and is a PhD research study run by the University of Leeds in collaboration with the African Population Health Research Centre (APHRC) and Carolina for Kibera (CfK).
UTANGULIZI Unaalikwa kushiriki katika utafiti unaolenga kuboresha ufahamu wetu wa mabadiliko ya tabia ya chakula na uhamiaji wa kutoka vijijini hadi mitaa ya mabanda hapa Kenya. Matokeo ya utafiti huu yatatumika kusaidia wanaohamia mijini na wanaoishi mijini kufanya maamuzi ya hekima kuhusu mienendo inyaofaa ya lishe bora. Kwa hivyo, tungependa kusikia zaidi kutoka kwa watu ambao wamehamia Nairobi kuhusu mtazamo wao na uzoefu kuelekea mienendo
301
na pia kuhusu mazingira ya chakula. Huu utafiti unatambulika kama: “Kuelewa mabadiliko ya lishe kati ya wanawake waliohama kutoka vijijini mpaka mitaa ya mabanda Nairobi”. Huu mradi unaendeshwa na Chuo Kikuu cha Leeds, Uingereza na unalenga kupokezwa kwa shahada ya PhD kwa mwanafunzi anayeuongoza. Mradi huu unaendeshwa kwa ushirikiano na shirika la utafiti la African Population and Health Research Center (APHRC) na shirika la Carolina for Kibera (CfK).
WHAT IS THE PURPOSE OF THIS STUDY? This study aims to investigate the relationship between internal rural-to-urban migration and dietary behavior change among post-migrant women in urban slums. This is to develop a better understanding of the interplay of risk factors which stimulate adult obesity among migrants in the urban slum communities.
LENGO LA UTAFITI HUU Lengo la utafiti huu ni kuchunguza uhusiano kati ya uhamiaji wa kutoka vijijini hadi mijini na mienendo ya kubadilisha lishe miongoni mwa wanawake wanaoishi katika mitaa ya mabanda baada ya kuhamia huko kutoka vijijini. Hii inalenga kuelewa zaidi vile mambo kadhaa huchangia fetma ya watu wazima miongoni mwa waliohamia mitaa ya mabanda kutoka vijijini.
WHO CAN PARTICIPATE IN THIS STUDY? Any woman, between 18-49 years old, who migrated from the rural area to the urban slum.
NANI ANAWEZA KUSHIRIKI KATIKA UTAFITI HUU? Mwanamke yeyote, kati ya umri wa miaka 18-49 aliyehamia mitaa ya mabanda kutoka vijijini.
WHAT DOES THIS STUDY INVOLVE? If you agree to participate in our study, we would like to ask you to join a group of other participants, who live in the same slum as you, to discuss about your dietary habits, traditions and patterns and how it may have changed since you started living in [insert slum]. The discussion will last approximately 2 hours, and will be audio-recorded. We are particularly interested in the social and cultural context of your dietary behaviour. Also, we would like you to participate in the drawing of problem trees, this to explore and understand the different causes and effects of migrating to urban slums and adoption of different dietary behaviours.
HUU UTAFITI UNAHUSU NINI? Ikiwa utakubali kushiriki katika utafiti huu, tungependa kukuomba ujiunge na kikundi cha washiriki wengine wanaoishi katika mtaa mmoja na wewe ili kujadiliana mambo yanayohusu mienendo ya lishe, mila na mifumo na vile haya mambo yanawezakuwa yalibadilika kutoka uanze kuishi Nairobi hasa [insert slum]. Mazungumuzo haya yanakadhiriwa kuchukua muda wa masaa mawili na itanukuliwa na kinasa sauti.
302
Tunaangazia hasa mambo ya kijamii na kitamaduni yanayochangia mienendo yako ya lishe. Pia tungetaka kukuhusisha katika kuchora mti wa changamoto ambao utatusaidia kuchunguza na kuelewa mambo tofauti na athari za kuhamia mitaa ya mabanda na vile watu huchagua njia tofauti za mienendo ya lishe.
WHAT ARE THE BENEFITS OF THIS STUDY? While there are no immediate benefits for participating in the project, the results of the study should improve our understanding of the factors and context which stimulate dietary behaviour change in urban slums. This in order to better inform future policies and interventions which can stimulate healthy dietary behavior and therefore prevent obesity among migrants and other urban dwellers living in Nairobi’s slums. The findings of this study will be published in academic/scientific journals, so those in other slums in Kenya may benefit as well from these findings.
MANUFAA YA UTAFITI HUU NI YAPI?
Ingawa hakuna faida ya moja kwa moja kwa kushiriki katika mradi huu, matokeo ya utafiti huu yataboresha ufahamu wetu wa sababu na muktadha (context) zinazochangia mabadiliko ya tabia ya lishe katika mitaa ya mabanda. Hii ni kwa sababu ya kuboresha sera za hapo mbeleni na hatua ambazo zinaweza kuchochea mienendo bora ya lishe ili kuzuia fetma (obesity) miongoni mwa waliohamia mitaa ya mabanda kutoka vijijini na wakaaji wengine katika mitaa ya mabanda ya Nairobi. Matokeo ya utafiti huu yatachapishwa katika majarida ya kitaaluma/kisayansi ili wale wanaoishi katika mitaa mingine ya mabanda hapa Kenya wafaidike.
WHAT WILL THE STUDY COST ME? The study procedures will bear no cost to you. You will not receive any financial incentive for participating in this study. You will though receive a refreshment and compensation for travelling costs to the research site.
UTAFITI HUU UTANIGHARIMU NINI? Taratibu za utafiti huu hazitakugharimu chochote. Hutapokea malipo yoyote kwa kushiriki katika utafiti huu. Hata hivyo utapata vitafunio na fidia ya gharama ya usafiri wako kutoka kwako hadi pahali utafiti unafanyika.
CAN I REFUSE TO PARTICIPATE OR WITHDRAW FROM THE STUDY? Yes, the decision is completely up to you. Taking part in this research study is entirely your choice. If you decide not to participate in the focus group discussion, there will be no negative consequences. If you decide to take part, you will be asked to give consent by signing a form. You may withdraw any time before or during the interview without providing reasons for your withdrawal. After the interview we won’t be able to separate your provided data from the other participants’ data in the discussion. The information you give us will not be linked to your name or household in any way.
JE, NAWEZA KATAA KUSHIRIKI AU NIJITOE KWA UTAFITI HUU? Ndio, uamuzi huo ni wako kabisa. Kushiriki katika utafiti huu ni uamuzi wako pekee. Ikiwa utaamua kutoshiriki katika majadiliano ya kikundi hakutakuwa na
303
matokeo yoyote mabaya. Ukiamua kushiriki, utaulizwa kupatiana ruhusa kwa kutia sahihi kwa fomu ya kibali. Unaweza kujiondoa wakati wowote kwa utafiti huu kabla au wakati majadiliano yanaendelea bila kupeana sababu zozote za kujiondoa. Baada ya majadiliano, hatuwezi kutenganisha habari yako kutoka kwa habari ya wenzako. Habari utakayotupatia haitaunganishwa na jina lako au kwa nyumba/familia uliyotoka kwa njia yoyote.
HOW WILL WE PROTECT YOUR INFORMATION AND CONFIDENTIALITY? The information you provide will only be available to researchers working on the study. You will be identified by a number, not your names. By signing the consent form, you are allowing the researchers to use the information we collect from you for research analysis. You will not be identified or identifiable in any reports/publications resulting from this study.
TUTALINDA AJE HABARI YAKO NA USIRI WAKO? Habari utakayotoa itaonekana tu na watafiti wanaohusika na utafiti huu peke yao. Utatambuliwa na nambari sio kwa majina yako. Kwa kutia sahihi kwa fomu ya kibali, unatoa ruhusa kwa watafiti kutumia habari utakayotoa kuchambua utafiti. Hautatambuliwa kwa ripoti zozote au kwa machapisho yoyote yanayotokana na utafiti huu.
ARE THERE ANY RISKS INVOLVED IF I TAKE PART? There are no major risks associated with this study. However, it is possible that you may feel distress and/or privacy concerns due to the nature of the questions being asked. You do not have to answer any questions you feel you are not comfortable with, and you can take a break or stop the interview without any negative consequences. If you experience distress and/or privacy concerns during this study then please discuss this further with the Principal Investigator: 0712 094 459, the Lead Research Assistant: [insert number] or you may contact AMREF Kenya at: +254 20 6993000.
JE, KUNA MADHARA YOYOTE NIKIAMUA KUSHIRIKI? Hakuna madhara makubwa yanayohusiana na utafiti huu. Hata hivyo, inawezekana kwamba unaweza hisi kutofurahishwa au usumbufu kutokana na maswali yatakayoulizwa. Sio lazima ujibu swali lolote linalokufanya uhisi usumbufu na unaweza kupumzika au kusimamisha mahojiano bila kupata matoke yoyote mabaya. Ukihisi usumbufu wowote au wasiwasi kuhusu faragha ya mahojiano tafadhali wasiliana na msaidizi wa utafiti katika nambari ya simu 0712 094 459, msaidizi mkuu wa utafiti: 0711 159 970 au pia waweza kuwasiliana na AMREF Kenya katika nambari +254 20 6993000.
WHO CAN I CONTACT? If you want to know more about the study, you may ask us now and you will also be able to communicate later with the principal investigator (0712 094 459) or the h research assistant (0711 159 970) of this study. If you want to know more about your rights of as a participant of a research study, you would be able to contact Amref Health Africa (+254 20 699 3000).
304
NITAWASILIANA NA NANI? Ikiwa ungetaka kujua zaidi kuhusu utafiti huu unaweza kutuuliza sasa na pia utaweza kuwasiliana baadaye na mchunguzi mkuu: 0712 094 459, au msaidizi wa utafiti kwa binafsi: 0711 159 970. Ikiwa ungetaka kujua zaidi kuhusu haki zako kama mshiriki wa utafiti, unaweza kuwasiliana na mmoja wa Scientific Steering Committee wa AMREF Health Africa katika nambari ya simu +254 20 6993000. Utafiti huu umeidhinishwa na bodi ya Taasisi ya utafiti ya Amref Health Africa.
ETHICS APPROVAL: This study has been reviewed and given favorable opinion by University of Leeds, School of Medicine Research Ethics Committee, in August 2017. Reference: MREC16-159 In Kenya, this study is approved by the board of the Amref Health Africa Ethics & Scientific Review Committee. Reference: AMREF – ESRC P397/2017
KUIDHINISHWA KWA UTAFITI Utafiti huu umeidhinishwa na chuo kikuu cha Leeds, Uingereza kupitia kamati ya School of Medicine Research Ethics Committee. Kumbukumbu: MREC16-159 Hapa Kenya, utafiti huu umeidhinishwa na bodi ya taasisi ya utafiti ya Amref Health Africa Ethics & Scientific Review Committee. Kumbukumbu: AMREF – ESRC P397/2017

305
PARTICIPANT CONSENT FORM:
Understanding nutrition transition among rural-to-urban migrant women
in Nairobi’s slums
Consent for Focus Group Discussion
1. I confirm that I understood the information sheet dated August 2017, version 3 explaining the above research project and I have had the opportunity to ask questions about the project.
2. I understand that my participation is voluntary and that I am free to withdraw at any time before or during the focus group discussion without giving any reason and without there being any negative consequences. In addition, should I not wish to answer any particular question or questions, I am free to decline.
3. I understand and agree that any provided answers during the focus group discussion cannot be removed after the focus group discussion is finished. Contact number Remco Peters: (0712-094-459), or [insert number research assistant]
4. I give permission for members of the research team to have access to my anonymised responses. I understand that my name will not be linked with the research materials, and I will not be identified or identifiable in the report or reports that result from the research. I understand that my responses will be kept strictly confidential.
5. I agree to our discussions being audio-recorded, and for the recordings and transcripts to be used in future research in an anonymised form.
6. I understand that relevant sections of the data collected during the study, may be looked at by auditors from the University of Leeds where it is relevant to my taking part in this research. I give permission for these individuals to have access to my records.
7. I agree to take part in the above research project and will inform the lead researcher should my contact details change during the project and, if necessary, afterwards.
__________________ _______________ ________________ Signature of participant Signature of investigator Signature of witness __________________ _______________ ________________ Participant’s name/ finger print/foot print Investigator’s name Witness’ name __________________ _______________ ________________ Date Date Date

306
FOMU YA KIBALI YA MSHIRIKI:
Kuelewa mabadiliko ya lishe miongoni mwa wanawake wanaohamia mitaa
ya mabanda hapa Nairobi kutoka vijijini
Fomu ya kibali ya majadiliano ya kikundi
1. Nadhibitisha kwamba nimeelewa karatasi ya habari ya Agosti
2017, toleo la tatu inayoelezea juu ya utafiti huu na nimepewa fursa ya kuuliza maswali kuhusu utafiti huu
2. Naelewa kuwa kushiriki kwangu ni kwa hiari na niko huru kujiondoa wakati wowote kabla au wakati majadiliano yanaendelea bila kupatiana sababu yoyote na bila matokeo yoyote mabaya. Pia, nikijihisi kutojibu swali lolote au maswali yoyote, niko huru kutojibu.
3. Naelewa kuwa habari yoyote nitakayotoa wakati wa majadiliano haiwezi kuondolewa baada ya majadiliano kumalizika. Namba ya mawasiliano Remco Peters: (0712-094-459), au [insert number research assistant]
4. Natoa ruhusa kwa watafiti kupata majibu yangu yasiyoweza kuunganishwa na jina langu. Naelewa jina langu halitaunganishwa na vifaa vya utafiti na sitatambuliwa au kutambulika katika ripoti zozote zitakazotokana na utafiti huu. Naelewa kwamba majibu yangu yatahifadhiwa kwa siri.
5. Nakubali majadiliano yetu yanaswe kupitia kinasa sauti na rekodi na habari inayotokana na rekodi hizi itumike kwa utafiti ujao bila habari kuunganishwa na walioipatiana.
6. Naelewa kwamba sehemu za habari itakayokusanywa wakati wa utafiti huu zaweza kuangaliwa na wakaguzi kutoka chuo kikuu cha Leeds pahali inahusu kushiriki kwangu katika utafiti huu. Natoa ruhusa kwa wakaguzi hawa wapate rekodi zangu.
7. Nakubali kushiriki katika utafiti huu na nitamweleza mtafiti mkuu iwapo nambari yangu ya simu itabadilika wakati wa utafiti na kama ni muhimu, hata baada ya utafiti.
___________________ ________________ ______________ Signature of participant Signature of investigator Signature of witness Sahihi ya mshiriki Sahihi ya mtafiti Sahihi ya shahidi ___________________ ________________ ______________ Participant’s name/ finger print/foot print Investigator’s name Witness’ name Jina la mshiriki/ alama ya kidole Jina la mtafiti Jina la shahidi ___________________ ________________ ______________ Date Date Date Tarehe Tarehe Tarehe
Related Documents