36 Vo Hong Duc et al. Ho Chi Minh City Open University Journal of Science, 9(1), 36-53 Understanding key drivers of attitudes toward income inequality in the Asia Pacific region Vo Hong Duc 1* , Nguyen Cong Thang 1 , Pham Ngoc Thach 1 , Vo The Anh 1 , Vu Ngoc Tan 1 1 Ho Chi Minh City Open University, Vietnam * Corresponding author: [email protected] ARTICLE INFO ABSTRACT DOI:10.46223/HCMCOUJS. econ.en.9.1.175.2019 Received: August 6 th , 2018 Revised: September 24 th , 2018 Accepted: March 4 th , 2019 Keywords: Asia-Pacific region, attitude toward income inequality, determinants Attitude toward income inequality and its drivers have attracted great attention from policymakers around the globe. Nevertheless, it appears that there is a shortage of empirical studies on the issue, at least in the context of the Asia-Pacific region - the World’s most dynamic economic region. This study is conducted to determine key drivers of attitude toward income inequality from various demographic factors, including Gender, Age, Political party, Education, Supervision, Family income, and Class. Available data for 19 countries at a different level of economic growth and development in the region are collected from the World Values Survey in 2016. The findings from this empirical study suggest that the role of each demographic factor as a significant explanation of variation in the attitude toward income inequality is different across nations in the study. In addition, a set of demographic factors, significantly contributing to the variation in attitude toward income inequality, varies across selected countries in the study. Among the demographic factors, Supervision and Class tend to be dominant factors in explaining variation in the attitude toward income inequality. 1. Introduction In recent years, income inequality and its consequences have attracted attention from economists, academics and policymakers. In its comprehensive study, the Organisation for Economic Co-operation and Development (OECD) demonstrated that in the long-run, income inequality could matter for economic growth (Cingano, 2014). Particularly, income inequality polarizes between social classes, leading to a reduction in the level of trust and cooperation between members within a society. This consequence, in turn, could reduce productivity and investment which are critical inputs of a national economy. Income inequality is also a starting point for various social issues (Dorling, 2011; Stiglitz, 2012). Income inequality is a signal of a concentration of political decision-making which effectively hinders maintaining human resources at the optimal level (Dabla-Norris, Tsounta, Kochhar, Ricka, & Suphaphiphat, 2015). Moreover, income inequality seems to be associated with poverty in reality, a high rate of crime

Welcome message from author
This document is posted to help you gain knowledge. Please leave a comment to let me know what you think about it! Share it to your friends and learn new things together.
Transcript
36 Vo Hong Duc et al. Ho Chi Minh City Open University Journal of Science, 9(1), 36-53
Understanding key drivers of attitudes toward income inequality
in the Asia Pacific region
Vo Hong Duc1*, Nguyen Cong Thang1, Pham Ngoc Thach1, Vo The Anh1, Vu Ngoc Tan1
1Ho Chi Minh City Open University, Vietnam *Corresponding author: [email protected]
ARTICLE INFO ABSTRACT
DOI:10.46223/HCMCOUJS.
econ.en.9.1.175.2019
Received: August 6th, 2018
Revised: September 24th, 2018
Accepted: March 4th, 2019
Keywords:
Asia-Pacific region, attitude toward income inequality,
determinants
Attitude toward income inequality and its drivers have
attracted great attention from policymakers around the globe.
Nevertheless, it appears that there is a shortage of empirical
studies on the issue, at least in the context of the Asia-Pacific
region - the World’s most dynamic economic region. This study
is conducted to determine key drivers of attitude toward income
inequality from various demographic factors, including Gender,
Age, Political party, Education, Supervision, Family income, and
Class. Available data for 19 countries at a different level of
economic growth and development in the region are collected
from the World Values Survey in 2016. The findings from this
empirical study suggest that the role of each demographic factor
as a significant explanation of variation in the attitude toward
income inequality is different across nations in the study. In
addition, a set of demographic factors, significantly contributing
to the variation in attitude toward income inequality, varies
across selected countries in the study. Among the demographic
factors, Supervision and Class tend to be dominant factors in
explaining variation in the attitude toward income inequality.
1. Introduction
In recent years, income inequality and its consequences have attracted attention from
economists, academics and policymakers. In its comprehensive study, the Organisation for
Economic Co-operation and Development (OECD) demonstrated that in the long-run, income
inequality could matter for economic growth (Cingano, 2014). Particularly, income inequality
polarizes between social classes, leading to a reduction in the level of trust and cooperation
between members within a society. This consequence, in turn, could reduce productivity and
investment which are critical inputs of a national economy. Income inequality is also a starting
point for various social issues (Dorling, 2011; Stiglitz, 2012). Income inequality is a signal of
a concentration of political decision-making which effectively hinders maintaining human
resources at the optimal level (Dabla-Norris, Tsounta, Kochhar, Ricka, & Suphaphiphat, 2015).
Moreover, income inequality seems to be associated with poverty in reality, a high rate of crime
Vo Hong Duc et al. Ho Chi Minh City Open University Journal of Science, 9(1), 36-53 37
and violence. In the extreme case, income inequality could lead to political instability (Dabla-
Norris et al., 2015; Medgyesi, 2013).
Without exception, income inequality does exist in every nation. For example, in the
United States of America, the wealth of the top 1 percent richest individuals accounts for nearly
one-third asset of that country as a whole. From 1980 to 2010, the share held by the 1 percent
wealthiest population has witnessed a rise in France, United Kingdom, Sweden and Europe.
Seriously, to advanced economies and emerging markets alike, inequality in wealth is more
observable than that in income which is measured by the Gini index (Dabla-Norris et al., 2015).
Due to the presence of the detrimental effects of income inequality on the society, its
wide range of coverage, a true understanding of the extent of income inequality, and its drivers,
and how to handle the issue must necessarily become the central focus, from both practical and
academic aspects. As such, comprehensive analysis in relation to the attitude toward income
inequality, and its drivers, seem to be an inevitable task. From the best of our knowledge, the
work of Dabla-Norris et al. (2015) is considered as a pioneering study which focuses on the
emerging markets. No study has been found to be conducted with attention to the Asia Pacific
region, a new engine of the world economy in the near future. As such, this study is conducted
to fill this gap.
The structure of the paper is organized as follows. Following this introduction, literature
review is discussed in Section 2. Data and research methodology are both discussed in Section
3. Section 4 presents empirical results. Section 5 concludes and discusses policy implications.
2. Literature Review
Social view on inequality is diverse. In contrast to the view of mitigation of inequality
due to its detrimental consequences, there is also a view for an acceptable level of inequality,
for example, income inequality. Intuitively, as somebody spends more time on work, it is
reasonable to pay more for them.
Even, one is ready to tolerate more income inequality in the case when their positions
are likely to be improved (Hirschman & Rothschild, 1973). For that reason, many policies have
been initiated in an effort to narrow down the income gap between the rich and the poor.
Medgyesi (2013) stated that structural position was about the influence of one’s social
position on the views. Particularly, the higher a person’s socioeconomic position is, the more
income inequality a person believes to be legitimate. Curtis and Andersen (2015) argued that it
was the case as economic resources are extremely unequally distributed, emphasizing that the
middle class was as likely as the working class to support a reduction in inequality. This
conclusion is also consistent with the work of Mau (1997), which demonstrated that for the
people in Sweden and Great Britain, who considered themselves as in the bottom of their
community, they tended to be in favor of income equality. In early searches on social opinion
(Gijsberts, 2002; Noll, 1998), most of them ended up with a finding that people did all share
38 Vo Hong Duc et al. Ho Chi Minh City Open University Journal of Science, 9(1), 36-53
egalitarian views rather than income disparity, especially who lived in a nation whose economy
was heavily regulated by the government.
Moreover, prior studies revealed that age also constituted an attitude toward income
inequality. Austen (2002) found a positive relationship between age and the legitimate ratio of
high- to low-status pay. Kelley and Evans (1993), in their interesting note, showed that the older
tended to advocate pay differences as compared to the younger by 30 percent. Their conclusion
is also consistent with the work of Gijsberts (2002), in fact, the author stated that the older were
likely to favor 20 percent more inequality on income than the younger.
Among demographic factors, gender plays a significant impact on attitude toward
inequality. The rationale behind is that views on economic inequality between men and women
are quite different, due to discriminations and socialization processes (Cyba, 2000; Frerichs,
1997). Austen (2002) argued that in both 1987 and 1992 in Australia, West Germany, and the
USA males were in favor of higher legitimate ratio of high- to low-status pay than females.
Also, the author emphasized that the magnitude was more observable in the second period (in
1992). At the same time, Gijsberts (2002) confirmed these findings under the context of West
Germany, Hungary and Poland.
Another source of variation in attitude toward income inequality is level of education.
Intuitively, if one spends more schooling year, they tend to require a higher wage to compensate
for educational investment. As a consequence, that legitimate offer could potentially lead to a
widening income gap. And that, in its turn, influences the opinion on income inequality. The
importance of the educational factor has been investigated (Austen, 2002; Gijsberts, 2002).
They all posited that income inequality was in favor of more educated interviewees than fewer
ones. In the work of Gijsberts (2002), it was found that the legitimate income inequality was
increased by 3 percent as each additional year of schooling, as being the case of Great Britain
and the USA. Similarly, 0.6 percent increase in the legitimate ratio of high-to low-status pay
was related to each additional year of schooling in Australia (Austen, 2002).
In addition, among all previous studies on the topic, it is widely accepted that political
party played an important role in determining social attitude (Austen, 2002; Kim, Huh, Choi,
& Lee, 2018). Especially, from the work of Austen (2002), a significant difference in attitude
toward income was observable among people who attended or did not attend political parties.
Similar to age and education, the author stated that being a political member also refers to
income disparity.
3. Data and Methodology 3.1. Data
In order to explain variation in attitude toward income inequality through its drivers,
this study employs data offered by the World Values Survey
(http://www.worldvaluessurvey.org). Using a set of questions to investigate how human beliefs
influence social and political life, the operation of the World Values Survey has been covering
by almost 100 countries which contain almost 90 percent of the world’s population. Its output
has been utilized by various studies, government officials, journalists, and students. The most
Vo Hong Duc et al. Ho Chi Minh City Open University Journal of Science, 9(1), 36-53 39
current survey - WV6 - was released in 2016. This wave comprises 60 countries in the world.
Among them, 19 countries in the Asia Pacific region are selected due to the availability of data.
The included countries are Australia, Chile, Taiwan, China, India, Japan, South Korea,
Malaysia, New Zealand, Peru, Russia, Thailand, the US, Colombia, Hong Kong, Mexico,
Singapore, the Philippines, and Pakistan.
The assessment of dependent variable - attitude toward income inequality - was
accomplished by asking respondents to indicate the extent to which they agree on income
inequality. Question is in a form of 10-point Likert-type scale in which 1 means incomes should
be made more equal and 10 depicts larger income differences as incentives for different
individual effort. For a comprehensive view on level of acceptance in countries in the database,
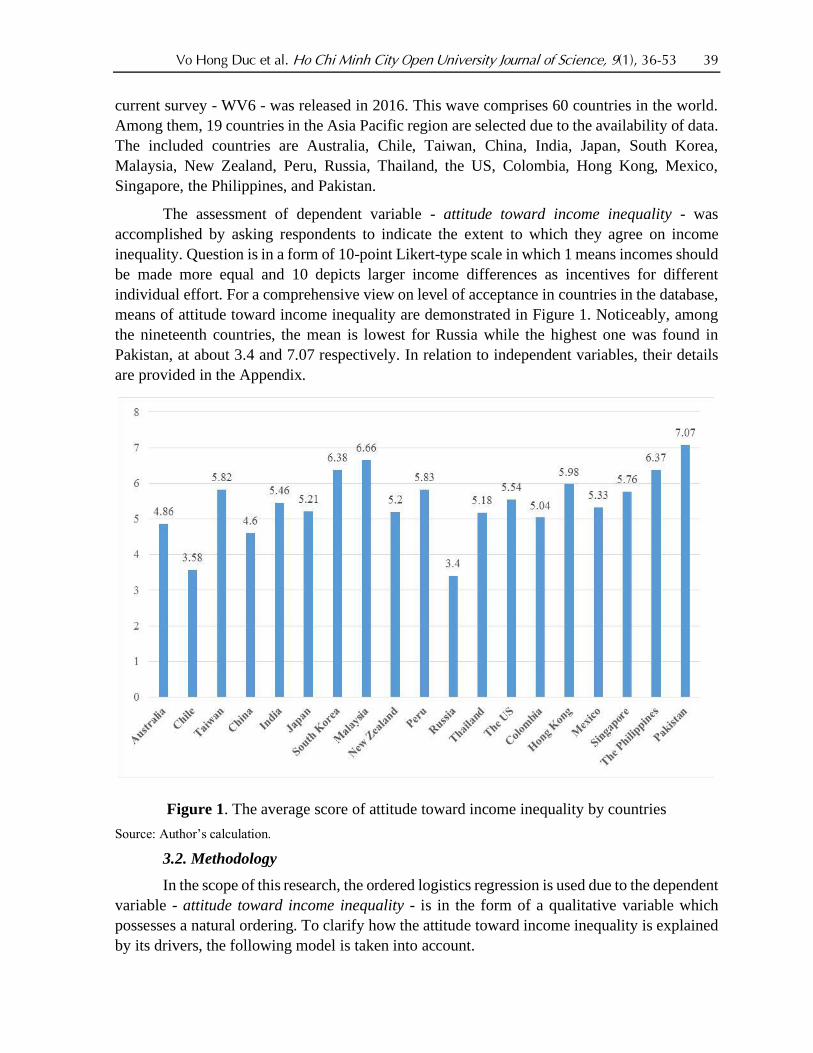
means of attitude toward income inequality are demonstrated in Figure 1. Noticeably, among
the nineteenth countries, the mean is lowest for Russia while the highest one was found in
Pakistan, at about 3.4 and 7.07 respectively. In relation to independent variables, their details
are provided in the Appendix.
Figure 1. The average score of attitude toward income inequality by countries
Source: Author’s calculation.
3.2. Methodology
In the scope of this research, the ordered logistics regression is used due to the dependent
variable - attitude toward income inequality - is in the form of a qualitative variable which
possesses a natural ordering. To clarify how the attitude toward income inequality is explained
by its drivers, the following model is taken into account.
40 Vo Hong Duc et al. Ho Chi Minh City Open University Journal of Science, 9(1), 36-53
Attitude represents for attitude toward income
inequality. is the probability of respondents agree on attitude toward income inequality at level
i. is the intercept. Xj is the set of variables including Gender, Age, Political party, Education,
Supervision, Family income, and Class. is the error term. Moreover, squared value of Age is
also included in the model in order to cater for possible curvilinear effects in the relationship
between these variables and Attitude toward income inequality (Austen, 2002).
One potential issue in cross-sectional data is that error terms’ variances are not equal
which may lead to a statistically insignificant coefficient or misleading inferences. As such,
White's robust standard error procedure is utilized. In addition, the investigation demonstrated
that the foregoing model could encounter the issue of multicollinearity when both variables -
Class and Family income - are included at the same time. The association between Class and
Family income could be the case as a matter of questions utilized in the survey. Therefore, the
dependent variable - Attitude toward income inequality - is regressed on Family income and
Class separately. The results are reported in Table 2 and Table 3, respectively.
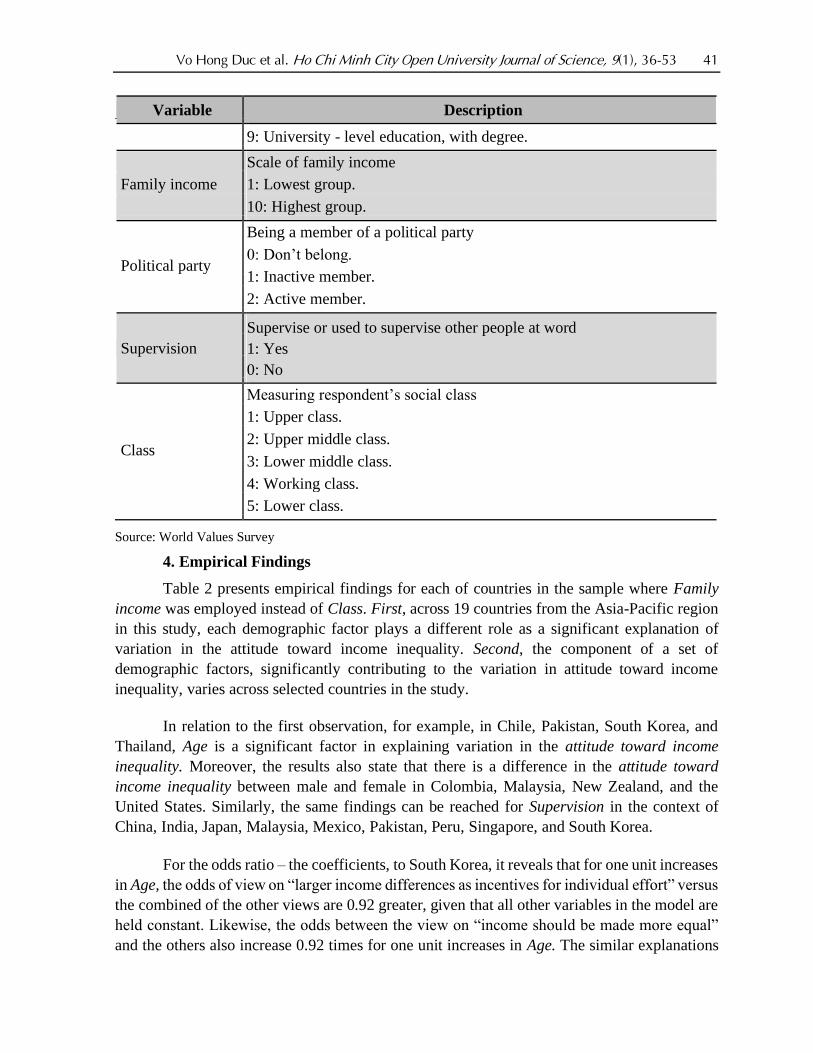
Table 1
A description of variables
Variable Description
Dependent variable
Attitude toward
Measuring income inequality. It is in a form of 10-point Likert-type scale
1: Income should be made more equal income inequality
10: We need larger income differences as incentive for individual effort
Independent variable
Respondent’s gender by observation
Gender 1: Male
0: Female
Age Respondent’s age
Measuring the highest education level attended by respondent
1: No formal education.
2: Incomplete primary school.
3: Complete primary school.
Education
4: Incomplete secondary school: technical/ vocational type.
5: Complete secondary school: technical/ vocational type.
6: Incomplete secondary school: university-preparatory type.
7: Complete secondary school: university-preparatory type.
8: Some university-level education, without degree.
(1)
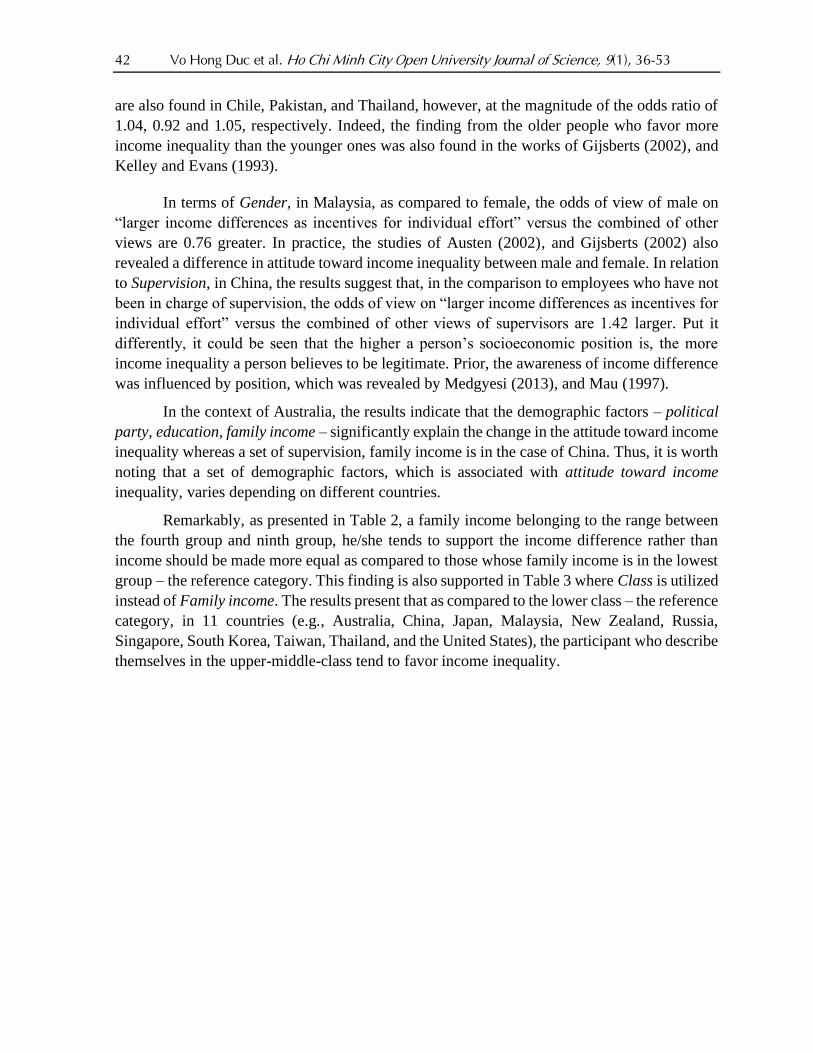
Vo Hong Duc et al. Ho Chi Minh City Open University Journal of Science, 9(1), 36-53 41
Variable Description
9: University - level education, with degree.
Scale of family income
Family income 1: Lowest group.
10: Highest group.
Being a member of a political party
Political party
0: Don’t belong.
1: Inactive member.
2: Active member.
Supervision
Supervise or used to supervise other people at word
1: Yes
0: No
Measuring respondent’s social class
1: Upper class.
Class
2: Upper middle class.
3: Lower middle class.
4: Working class.
5: Lower class.
Source: World Values Survey
4. Empirical Findings
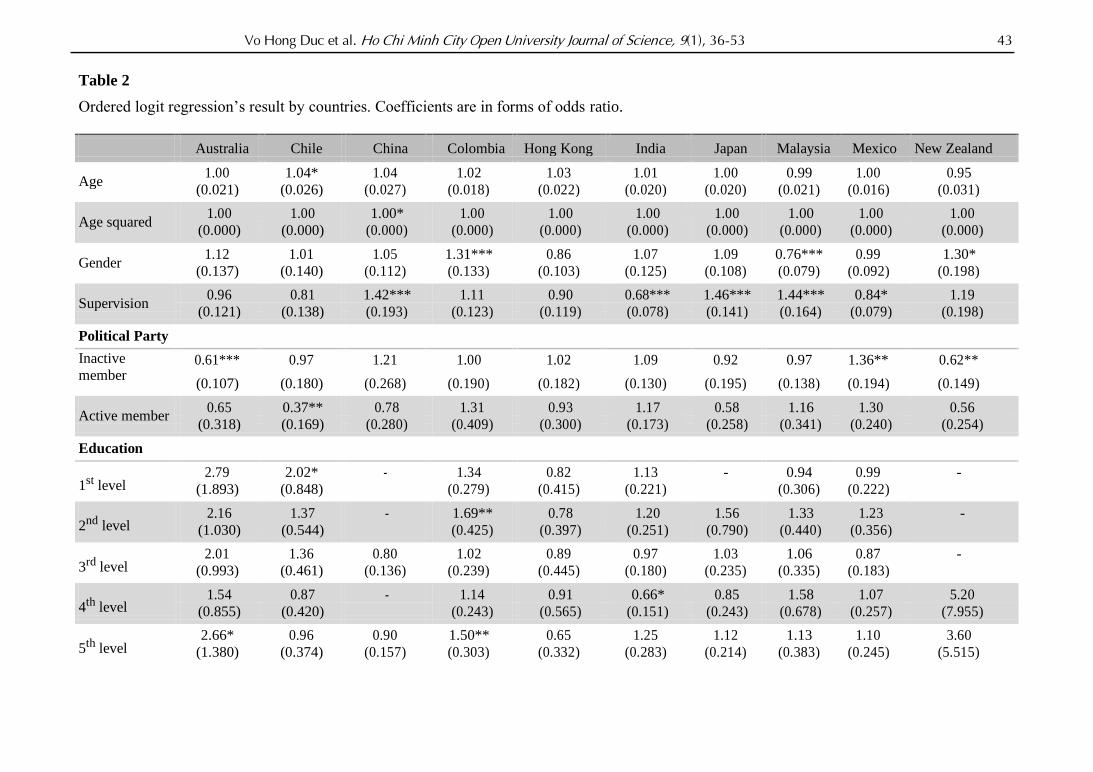
Table 2 presents empirical findings for each of countries in the sample where Family
income was employed instead of Class. First, across 19 countries from the Asia-Pacific region
in this study, each demographic factor plays a different role as a significant explanation of
variation in the attitude toward income inequality. Second, the component of a set of
demographic factors, significantly contributing to the variation in attitude toward income
inequality, varies across selected countries in the study.
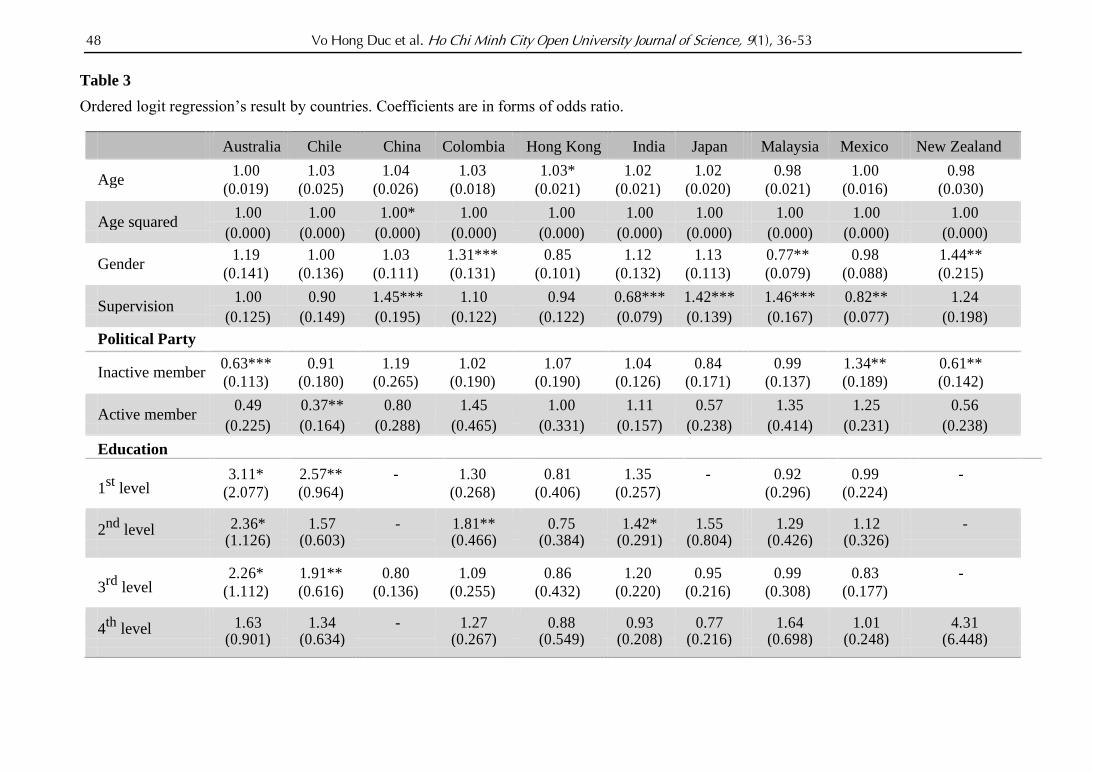
In relation to the first observation, for example, in Chile, Pakistan, South Korea, and
Thailand, Age is a significant factor in explaining variation in the attitude toward income
inequality. Moreover, the results also state that there is a difference in the attitude toward
income inequality between male and female in Colombia, Malaysia, New Zealand, and the
United States. Similarly, the same findings can be reached for Supervision in the context of
China, India, Japan, Malaysia, Mexico, Pakistan, Peru, Singapore, and South Korea.
For the odds ratio – the coefficients, to South Korea, it reveals that for one unit increases
in Age, the odds of view on “larger income differences as incentives for individual effort” versus
the combined of the other views are 0.92 greater, given that all other variables in the model are
held constant. Likewise, the odds between the view on “income should be made more equal”
and the others also increase 0.92 times for one unit increases in Age. The similar explanations
42 Vo Hong Duc et al. Ho Chi Minh City Open University Journal of Science, 9(1), 36-53
are also found in Chile, Pakistan, and Thailand, however, at the magnitude of the odds ratio of
1.04, 0.92 and 1.05, respectively. Indeed, the finding from the older people who favor more
income inequality than the younger ones was also found in the works of Gijsberts (2002), and
Kelley and Evans (1993).
In terms of Gender, in Malaysia, as compared to female, the odds of view of male on
“larger income differences as incentives for individual effort” versus the combined of other
views are 0.76 greater. In practice, the studies of Austen (2002), and Gijsberts (2002) also
revealed a difference in attitude toward income inequality between male and female. In relation
to Supervision, in China, the results suggest that, in the comparison to employees who have not
been in charge of supervision, the odds of view on “larger income differences as incentives for
individual effort” versus the combined of other views of supervisors are 1.42 larger. Put it
differently, it could be seen that the higher a person’s socioeconomic position is, the more
income inequality a person believes to be legitimate. Prior, the awareness of income difference
was influenced by position, which was revealed by Medgyesi (2013), and Mau (1997).
In the context of Australia, the results indicate that the demographic factors – political
party, education, family income – significantly explain the change in the attitude toward income
inequality whereas a set of supervision, family income is in the case of China. Thus, it is worth
noting that a set of demographic factors, which is associated with attitude toward income
inequality, varies depending on different countries.
Remarkably, as presented in Table 2, a family income belonging to the range between
the fourth group and ninth group, he/she tends to support the income difference rather than
income should be made more equal as compared to those whose family income is in the lowest
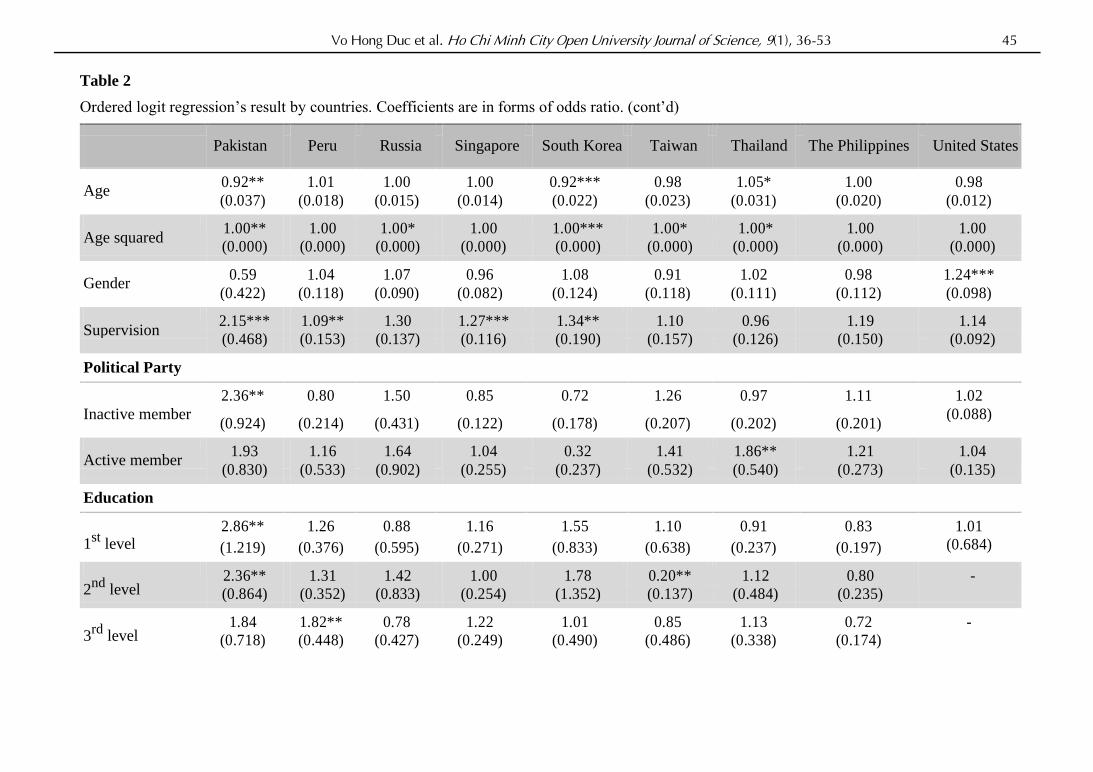
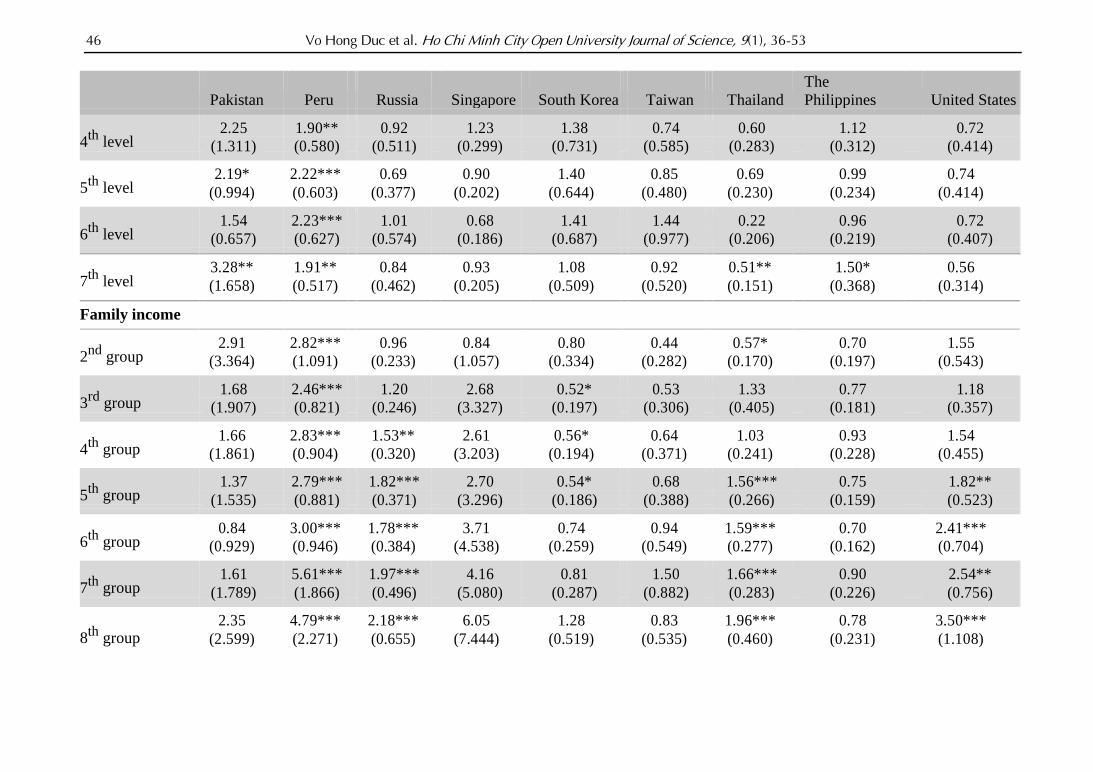
group – the reference category. This finding is also supported in Table 3 where Class is utilized
instead of Family income. The results present that as compared to the lower class – the reference
category, in 11 countries (e.g., Australia, China, Japan, Malaysia, New Zealand, Russia,
Singapore, South Korea, Taiwan, Thailand, and the United States), the participant who describe
themselves in the upper-middle-class tend to favor income inequality.
Vo Hong Duc et al. Ho Chi Minh City Open University Journal of Science, 9(1), 36-53 43
Table 2
Ordered logit regression’s result by countries. Coefficients are in forms of odds ratio.
Australia
Chile
China
Colombia
Hong Kong
India
Japan
Malaysia
Mexico
New Zealand
Age
1.00 1.04* 1.04 1.02 1.03 1.01 1.00 0.99 1.00 0.95
(0.021)
(0.026)
(0.027) (0.018)
(0.022)
(0.020)
(0.020)
(0.021) (0.016) (0.031)
Age squared
1.00 1.00 1.00* 1.00 1.00 1.00 1.00 1.00 1.00 1.00
(0.000)
(0.000)
(0.000)
(0.000)
(0.000)
(0.000)
(0.000)
(0.000)
(0.000)
(0.000)
Gender
1.12 1.01 1.05 1.31*** 0.86 1.07 1.09 0.76*** 0.99 1.30*
(0.137)
(0.140)
(0.112) (0.133)
(0.103)
(0.125)
(0.108)
(0.079) (0.092) (0.198)
Supervision
0.96 0.81 1.42*** 1.11 0.90 0.68*** 1.46*** 1.44*** 0.84* 1.19
(0.121)
(0.138)
(0.193)
(0.123)
(0.119)
(0.078)
(0.141)
(0.164)
(0.079)
(0.198)
Political Party
Inactive
member 0.61*** 0.97 1.21 1.00 1.02 1.09 0.92 0.97 1.36** 0.62**
(0.107)
(0.180)
(0.268) (0.190)
(0.182)
(0.130)
(0.195)
(0.138) (0.194) (0.149)
Active member
0.65 0.37** 0.78 1.31 0.93 1.17 0.58 1.16 1.30 0.56
(0.318)
(0.169)
(0.280)
(0.409)
(0.300)
(0.173)
(0.258)
(0.341)
(0.240)
(0.254)
Education
1st level
2.79 2.02* - 1.34 0.82 1.13 - 0.94 0.99 - (1.893) (0.848) (0.279) (0.415) (0.221) (0.306) (0.222)
2nd level
2.16 1.37 - 1.69** 0.78 1.20 1.56 1.33 1.23 - (1.030) (0.544) (0.425) (0.397) (0.251) (0.790) (0.440) (0.356)
3rd level
2.01 1.36 0.80 1.02 0.89 0.97 1.03 1.06 0.87 - (0.993) (0.461) (0.136) (0.239) (0.445) (0.180) (0.235) (0.335) (0.183)
4th level
1.54 0.87 - 1.14 0.91 0.66* 0.85 1.58 1.07 5.20 (0.855) (0.420) (0.243) (0.565) (0.151) (0.243) (0.678) (0.257) (7.955)
5th level
2.66* 0.96 0.90 1.50** 0.65 1.25 1.12 1.13 1.10 3.60 (1.380) (0.374) (0.157) (0.303) (0.332) (0.283) (0.214) (0.383) (0.245) (5.515)
44 Vo Hong Duc et al. Ho Chi Minh City Open University Journal of Science, 9(1), 36-53
6th level
2.97** 0.67 - 1.60 0.74 0.81 1.70 2.14** 0.69 4.11
(1.521) (0.284) (0.357) (0.399) (0.192) (0.754) (0.754) (0.191) (6.357)
7th level
Family income
2nd group
3rd group
4th group
5th group
6th group
7th group
8th group
9th group
2.23* 0.95 1.06 1.39 0.82 3.88*** 1.37 1.49 0.88 3.94
(1.069) (0.375) (0.211) (0.298) (0.417) (1.190) (0.288) (0.549) (0.196) (6.091)
2.09* 2.47 1.57 0.93 1.02 1.12 1.13 1.47 0.94 1.19
(0.794) (1.469) (0.559) (0.298) (0.522) (0.256) (0.175) (0.956) (0.127) (0.566)
1.54 2.79* 1.23 1.21 1.05 1.65* 1.68*** 0.43 1.02 0.96
(0.526) (1.623) (0.378) (0.353) (0.461) (0.455) (0.269) (0.234) (0.153) (0.406)
2.01** 4.03** 1.61 1.05 1.14 1.36* 1.92*** 0.37** 1.04 1.03
(0.652) (2.308) (0.484) (0.296) (0.501) (0.329) (0.337) (0.200) (0.168) (0.414)
2.50*** 6.85*** 1.33 1.50 1.36 1.59*** 1.40* 0.28*** 0.91 1.53
(0.797) (3.929) (0.396) (0.402) (0.595) (0.395) (0.246) (0.138) (0.163) (0.647)
2.64*** 8.00 1.43 1.15 1.24 3.14*** 1.64*** 0.34** 0.94 1.18
(0.862) (4.639) (0.438) (0.322) (0.548) (0.802) (0.282) (0.163) (0.203) (0.496)
3.57*** 8.10*** 1.48 1.41 1.71 3.58*** 1.93** 0.42* 0.94 1.64
(1.149) (4.861) (0.464) (0.405) (0.747) (0.959) (0.508) (0.201) (0.168) (0.695)
4.13*** 10.64*** 1.48 1.51 1.40 3.63*** 2.38*** 0.43* 1.06 1.66
(1.445) (6.705) (0.503) (0.477) (0.695) (0.973) (0.514) (0.210) (0.227) (0.694)
4.45*** 7.49*** 2.73* 0.60 1.96 4.59*** 2.51*** 0.40 0.65 2.12*
(2.096) (5.181) (1.448) (0.376) (1.827) (1.342) (0.507) (0.238) (0.206) (0.906)
Highest group
13.37*** 36.85*** 27.24*** 3.80** 9.34 12.06*** 3.27*** 0.74 2.56** 2.95**
(10.217)
(23.996)
(26.145) (2.555)
(15.894)
(4.815)
(0.671)
(0.612) (1.092) (1.288)
Num of obs 963 782 1135 1291 933 1190 1718 1182 1579 596
Pseudo R2 0.0176 0.0244 0.0094 0.0086 0.116 0.0361 0.0163 0.0136 0.004 0.0182
Prob > chi2 0.000 0.000 0.000 0.004 0.006 0.000 0.000 0.000 0.317 0.000
Vo Hong Duc et al. Ho Chi Minh City Open University Journal of Science, 9(1), 36-53 45
Table 2
Ordered logit regression’s result by countries. Coefficients are in forms of odds ratio. (cont’d)
Pakistan
Peru
Russia
Singapore
South Korea
Taiwan
Thailand
The Philippines
United States
Age
0.92** 1.01 1.00 1.00 0.92*** 0.98 1.05* 1.00 0.98
(0.037)
(0.018)
(0.015) (0.014) (0.022)
(0.023)
(0.031)
(0.020) (0.012)
Age squared
1.00** 1.00 1.00* 1.00 1.00*** 1.00* 1.00* 1.00 1.00 (0.000) (0.000) (0.000) (0.000) (0.000) (0.000) (0.000) (0.000) (0.000)
Gender
0.59 1.04 1.07 0.96 1.08 0.91 1.02 0.98 1.24***
(0.422)
(0.118)
(0.090) (0.082) (0.124)
(0.118)
(0.111)
(0.112) (0.098)
Supervision
2.15*** 1.09** 1.30 1.27*** 1.34** 1.10 0.96 1.19 1.14 (0.468) (0.153) (0.137) (0.116) (0.190) (0.157) (0.126) (0.150) (0.092)
Political Party
Inactive member
2.36** 0.80 1.50 0.85 0.72 1.26 0.97 1.11 1.02
(0.924)
(0.214)
(0.431) (0.122) (0.178)
(0.207)
(0.202)
(0.201)
(0.088)
Active member
1.93 1.16 1.64 1.04 0.32 1.41 1.86** 1.21 1.04
(0.830)
(0.533)
(0.902)
(0.255)
(0.237)
(0.532)
(0.540)
(0.273)
(0.135)
Education
1
st level
2.86** 1.26 0.88 1.16 1.55 1.10 0.91 0.83 1.01
(1.219) (0.376) (0.595) (0.271) (0.833) (0.638) (0.237) (0.197) (0.684)
2
nd level
2.36** 1.31 1.42 1.00 1.78 0.20** 1.12 0.80 - (0.864) (0.352) (0.833) (0.254) (1.352) (0.137) (0.484) (0.235)
3
rd level
1.84 1.82** 0.78 1.22 1.01 0.85 1.13 0.72 - (0.718) (0.448) (0.427) (0.249) (0.490) (0.486) (0.338) (0.174)
46 Vo Hong Duc et al. Ho Chi Minh City Open University Journal of Science, 9(1), 36-53
Pakistan Peru Russia Singapore South Korea Taiwan Thailand
The
Philippines United States
4th
level 2.25 1.90** 0.92 1.23 1.38 0.74 0.60 1.12 0.72 (1.311) (0.580) (0.511) (0.299) (0.731) (0.585) (0.283) (0.312) (0.414)
5th
level 2.19* 2.22*** 0.69 0.90 1.40 0.85 0.69 0.99 0.74
(0.994) (0.603) (0.377) (0.202) (0.644) (0.480) (0.230) (0.234) (0.414)
6th
level 1.54 2.23*** 1.01 0.68 1.41 1.44 0.22 0.96 0.72 (0.657) (0.627) (0.574) (0.186) (0.687) (0.977) (0.206) (0.219) (0.407)
7th
level 3.28** 1.91** 0.84 0.93 1.08 0.92 0.51** 1.50* 0.56
(1.658) (0.517) (0.462) (0.205) (0.509) (0.520) (0.151) (0.368) (0.314)
Family income
2nd
group 2.91 2.82*** 0.96 0.84 0.80 0.44 0.57* 0.70 1.55
(3.364) (1.091) (0.233) (1.057) (0.334) (0.282) (0.170) (0.197) (0.543)
3rd
group 1.68 2.46*** 1.20 2.68 0.52* 0.53 1.33 0.77 1.18 (1.907) (0.821) (0.246) (3.327) (0.197) (0.306) (0.405) (0.181) (0.357)
4th
group 1.66 2.83*** 1.53** 2.61 0.56* 0.64 1.03 0.93 1.54
(1.861) (0.904) (0.320) (3.203) (0.194) (0.371) (0.241) (0.228) (0.455)
5th
group 1.37 2.79*** 1.82*** 2.70 0.54* 0.68 1.56*** 0.75 1.82** (1.535) (0.881) (0.371) (3.296) (0.186) (0.388) (0.266) (0.159) (0.523)
6th
group 0.84 3.00*** 1.78*** 3.71 0.74 0.94 1.59*** 0.70 2.41***
(0.929) (0.946) (0.384) (4.538) (0.259) (0.549) (0.277) (0.162) (0.704)
7th
group 1.61 5.61*** 1.97*** 4.16 0.81 1.50 1.66*** 0.90 2.54** (1.789) (1.866) (0.496) (5.080) (0.287) (0.882) (0.283) (0.226) (0.756)
8th
group 2.35 4.79*** 2.18*** 6.05 1.28 0.83 1.96*** 0.78 3.50***
(2.599) (2.271) (0.655) (7.444) (0.519) (0.535) (0.460) (0.231) (1.108)
Vo Hong Duc et al. Ho Chi Minh City Open University Journal of Science, 9(1), 36-53 47
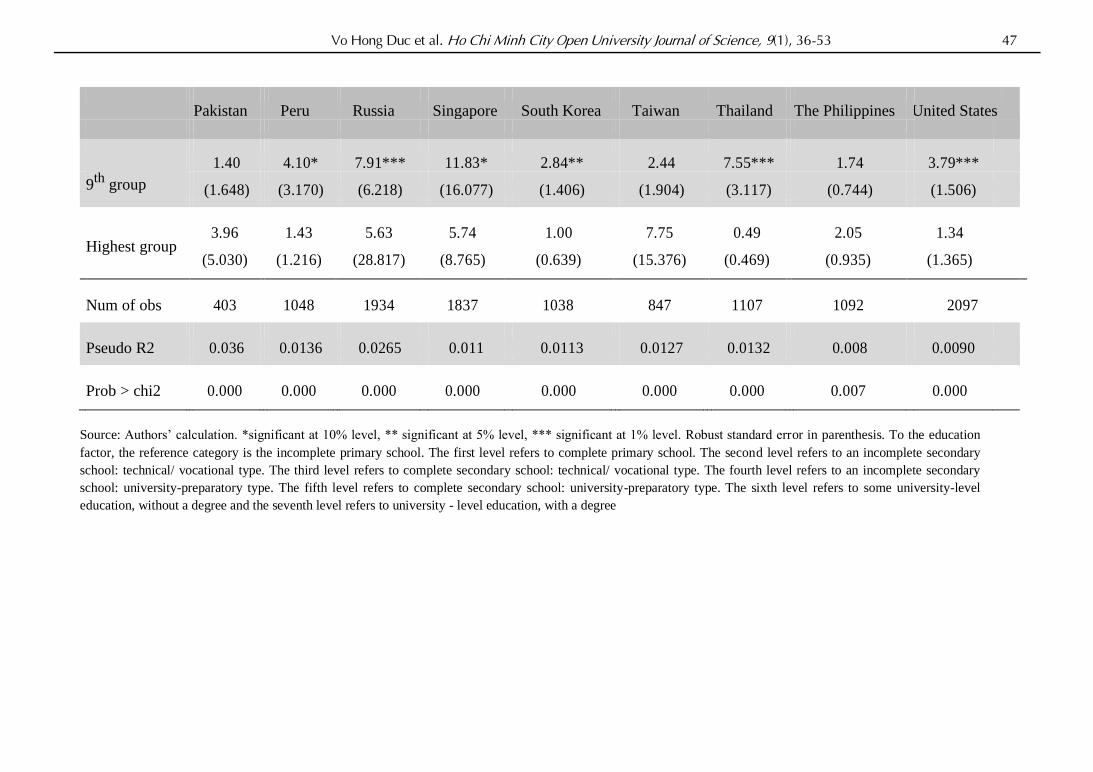
Pakistan Peru Russia Singapore South Korea Taiwan Thailand The Philippines United States
9th
group
1.40 4.10* 7.91*** 11.83* 2.84** 2.44 7.55*** 1.74 3.79***
(1.648) (3.170) (6.218) (16.077) (1.406) (1.904) (3.117) (0.744) (1.506)
Highest group
3.96 1.43 5.63 5.74 1.00 7.75 0.49 2.05 1.34
(5.030)
(1.216)
(28.817) (8.765) (0.639)
(15.376)
(0.469)
(0.935) (1.365)
Num of obs 403 1048 1934 1837 1038 847 1107 1092 2097
Pseudo R2 0.036 0.0136 0.0265 0.011 0.0113 0.0127 0.0132 0.008 0.0090
Prob > chi2 0.000 0.000 0.000 0.000 0.000 0.000 0.000 0.007 0.000
Source: Authors’ calculation. *significant at 10% level, ** significant at 5% level, *** significant at 1% level. Robust standard error in parenthesis. To the education
factor, the reference category is the incomplete primary school. The first level refers to complete primary school. The second level refers to an incomplete secondary
school: technical/ vocational type. The third level refers to complete secondary school: technical/ vocational type. The fourth level refers to an incomplete secondary
school: university-preparatory type. The fifth level refers to complete secondary school: university-preparatory type. The sixth level refers to some university-level
education, without a degree and the seventh level refers to university - level education, with a degree
48 Vo Hong Duc et al. Ho Chi Minh City Open University Journal of Science, 9(1), 36-53
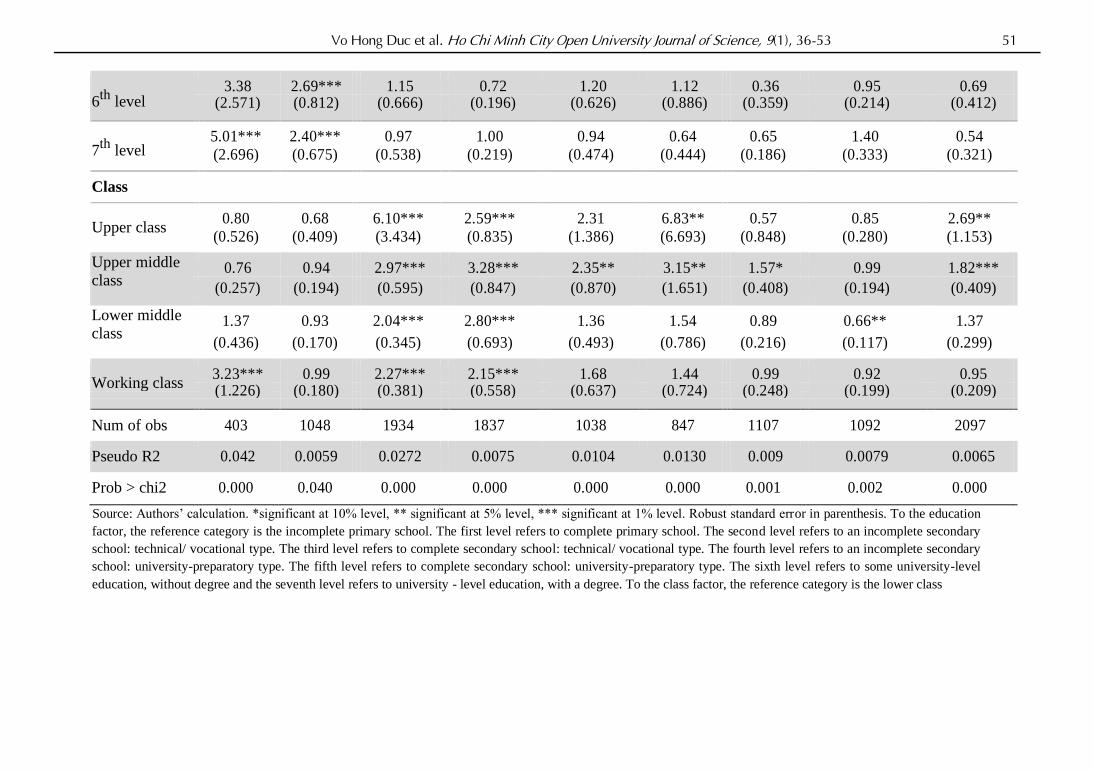
Table 3
Ordered logit regression’s result by countries. Coefficients are in forms of odds ratio.
Australia
Chile
China
Colombia
Hong Kong
India
Japan
Malaysia
Mexico
New Zealand
Age
1.00 1.03 1.04 1.03 1.03* 1.02 1.02 0.98 1.00 0.98 (0.019) (0.025) (0.026) (0.018) (0.021) (0.021) (0.020) (0.021) (0.016) (0.030)
Age squared
1.00 1.00 1.00* 1.00 1.00 1.00 1.00 1.00 1.00 1.00
(0.000)
(0.000)
(0.000)
(0.000)
(0.000)
(0.000)
(0.000)
(0.000)
(0.000)
(0.000)
Gender
1.19 1.00 1.03 1.31*** 0.85 1.12 1.13 0.77** 0.98 1.44**
(0.141)
(0.136)
(0.111) (0.131) (0.101)
(0.132)
(0.113)
(0.079) (0.088) (0.215)
Supervision
1.00 0.90 1.45*** 1.10 0.94 0.68*** 1.42*** 1.46*** 0.82** 1.24
(0.125)
(0.149)
(0.195)
(0.122)
(0.122)
(0.079)
(0.139)
(0.167)
(0.077)
(0.198)
Political Party
Inactive member
0.63*** 0.91 1.19 1.02 1.07 1.04 0.84 0.99 1.34** 0.61** (0.113) (0.180) (0.265) (0.190) (0.190) (0.126) (0.171) (0.137) (0.189) (0.142)
Active member
0.49 0.37** 0.80 1.45 1.00 1.11 0.57 1.35 1.25 0.56
(0.225)
(0.164)
(0.288)
(0.465)
(0.331)
(0.157)
(0.238)
(0.414)
(0.231)
(0.238)
Education
1
st level
3.11* 2.57** - 1.30 0.81 1.35 - 0.92 0.99 - (2.077) (0.964) (0.268) (0.406) (0.257) (0.296) (0.224)
2nd
level 2.36* 1.57 - 1.81** 0.75 1.42* 1.55 1.29 1.12 -
(1.126)
(0.603)
(0.466)
(0.384)
(0.291)
(0.804)
(0.426)
(0.326)
3
rd level
2.26* 1.91** 0.80 1.09 0.86 1.20 0.95 0.99 0.83 - (1.112) (0.616) (0.136) (0.255) (0.432) (0.220) (0.216) (0.308) (0.177)
4th
level 1.63 1.34 - 1.27 0.88 0.93 0.77 1.64 1.01 4.31
(0.901)
(0.634)
(0.267)
(0.549)
(0.208)
(0.216)
(0.698)
(0.248)
(6.448)
Vo Hong Duc et al. Ho Chi Minh City Open University Journal of Science, 9(1), 36-53 49
Australia
Chile
China
Colombia
Hong Kong
India
Japan
Malaysia
Mexico
New Zealand
5
th level
2.79** 1.45 0.90 1.68*** 0.64 1.35 1.03 1.14 1.08 2.84 (1.459) (0.542) (0.157) (0.336) (0.327) (0.299) (0.197) (0.382) (0.243) (4.246)
6th
level 3.17** 1.12 - 1.82*** 0.76 0.80 1.56 2.07** 0.67 3.25
(1.621)
(0.456)
(0.407)
(0.412)
(0.197)
(0.695)
(0.711)
(0.183)
(4.880)
7
th level
2.33* 1.73 1.03 1.61** 0.82 5.52*** 1.25 1.60 0.86 3.21 (1.128) (0.634) (0.207) (0.348) (0.423) (1.564) (0.263) (0.591) (0.193) (4.845)
Class
Upper class
4.54 1.29 0.52 2.69** 1.11 1.07 32.55*** 1.10 3.34*** (6.979) (0.881) (0.842) (1.153) (0.654) (0.306) (17.121) (0.608) (1.403) -
Upper middle
class
3.50** 1.48 1.90** 1.82*** 1.15 1.55 4.26*** 0.45*** 1.28 3.15*
(1.822) (0.483) (0.556) (0.409) (0.260) (0.412) (0.869) (0.120) (0.217) (2.130)
Lower middle 2.27 1.25 1.32* 1.37 1.25 1.30 2.82*** 0.60*** 1.21 2.55
class (1.185) (0.348) (0.221) (0.299) (0.253) (0.341) (0.515) (0.113) (0.190) (1.717)
Working class
1.58 1.09 1.60*** 0.95 1.10 2.11*** 2.07*** 1.11 1.59*** 1.58 (0.830) (0.316) (0.277) (0.209) (0.246) (0.584) (0.392) (0.208) (0.263) (1.070)
Num of obs 963 782 1135 2097 933 1190 1718 1182 1579 596
Pseudo R2 0.015 0.0072 0.0078 0.0065 0.0042 0.0178 0.020 0.0150 0.0049 0.0174
Prob > chi2 0.000 0.071 0.000 0.000 0.475 0.000 0.000 0.000 0.008 0.000
50 Vo Hong Duc et al. Ho Chi Minh City Open University Journal of Science, 9(1), 36-53
Table 3
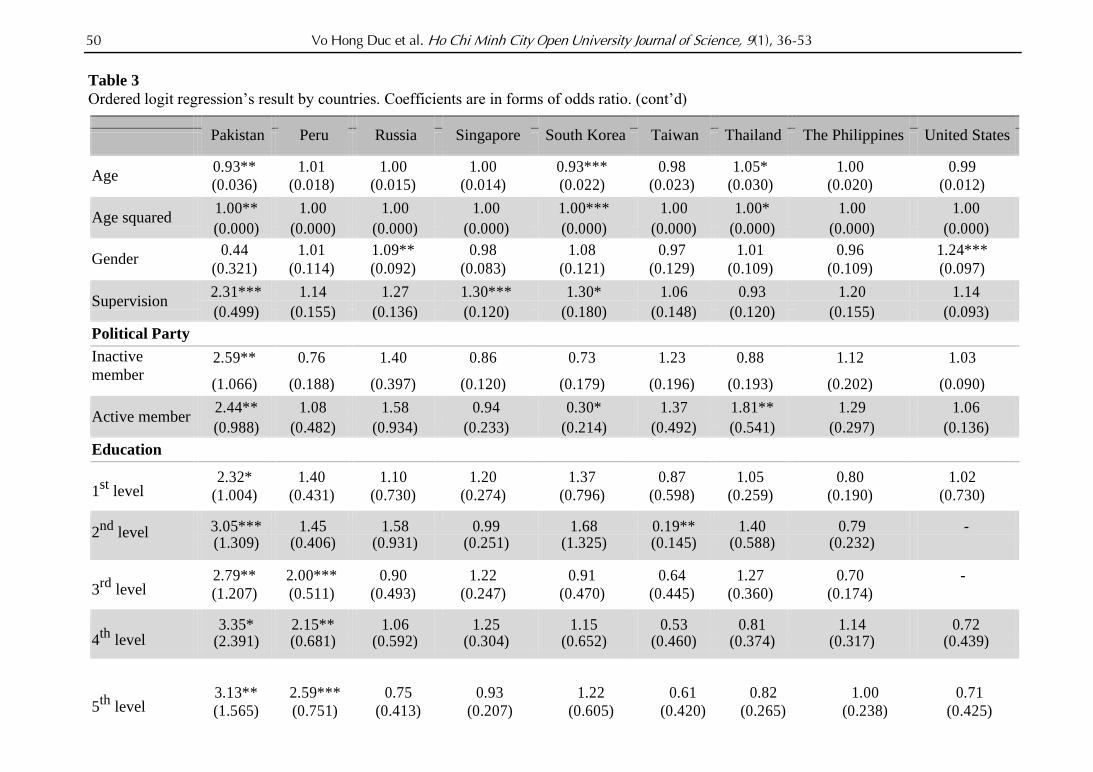
Ordered logit regression’s result by countries. Coefficients are in forms of odds ratio. (cont’d)
Pakistan
Peru
Russia
Singapore
South Korea
Taiwan
Thailand
The Philippines
United States
Age
0.93** 1.01 1.00 1.00 0.93*** 0.98 1.05* 1.00 0.99 (0.036) (0.018) (0.015) (0.014) (0.022) (0.023) (0.030) (0.020) (0.012)
Age squared
1.00** 1.00 1.00 1.00 1.00*** 1.00 1.00* 1.00 1.00
(0.000)
(0.000)
(0.000)
(0.000)
(0.000)
(0.000)
(0.000)
(0.000)
(0.000)
Gender
0.44 1.01 1.09** 0.98 1.08 0.97 1.01 0.96 1.24***
(0.321)
(0.114)
(0.092) (0.083)
(0.121)
(0.129)
(0.109)
(0.109) (0.097)
Supervision
2.31*** 1.14 1.27 1.30*** 1.30* 1.06 0.93 1.20 1.14
(0.499)
(0.155)
(0.136)
(0.120)
(0.180)
(0.148)
(0.120)
(0.155)
(0.093)
Political Party
Inactive
member 2.59** 0.76 1.40 0.86 0.73 1.23 0.88 1.12 1.03
(1.066)
(0.188)
(0.397) (0.120)
(0.179)
(0.196)
(0.193)
(0.202) (0.090)
Active member
2.44** 1.08 1.58 0.94 0.30* 1.37 1.81** 1.29 1.06
(0.988)
(0.482)
(0.934)
(0.233)
(0.214)
(0.492)
(0.541)
(0.297)
(0.136)
Education
1
st level
2.32* 1.40 1.10 1.20 1.37 0.87 1.05 0.80 1.02 (1.004) (0.431) (0.730) (0.274) (0.796) (0.598) (0.259) (0.190) (0.730)
2nd
level 3.05*** 1.45 1.58 0.99 1.68 0.19** 1.40 0.79 -
(1.309)
(0.406)
(0.931)
(0.251)
(1.325)
(0.145)
(0.588)
(0.232)
3
rd level
2.79** 2.00*** 0.90 1.22 0.91 0.64 1.27 0.70 - (1.207) (0.511) (0.493) (0.247) (0.470) (0.445) (0.360) (0.174)
4
th level
3.35* 2.15** 1.06 1.25 1.15 0.53 0.81 1.14 0.72 (2.391) (0.681) (0.592) (0.304) (0.652) (0.460) (0.374) (0.317) (0.439)
5
th level
3.13** 2.59*** 0.75 0.93 1.22 0.61 0.82 1.00 0.71 (1.565) (0.751) (0.413) (0.207) (0.605) (0.420) (0.265) (0.238) (0.425)
Vo Hong Duc et al. Ho Chi Minh City Open University Journal of Science, 9(1), 36-53 51
6
th level
3.38 2.69*** 1.15 0.72 1.20 1.12 0.36 0.95 0.69 (2.571) (0.812) (0.666) (0.196) (0.626) (0.886) (0.359) (0.214) (0.412)
7
th level
5.01*** 2.40*** 0.97 1.00 0.94 0.64 0.65 1.40 0.54 (2.696) (0.675) (0.538) (0.219) (0.474) (0.444) (0.186) (0.333) (0.321)
Class
Upper class
0.80 0.68 6.10*** 2.59*** 2.31 6.83** 0.57 0.85 2.69**
(0.526)
(0.409)
(3.434) (0.835)
(1.386)
(6.693)
(0.848)
(0.280) (1.153)
Upper middle
class 0.76 0.94 2.97*** 3.28*** 2.35** 3.15** 1.57* 0.99 1.82***
(0.257) (0.194) (0.595) (0.847) (0.870) (1.651) (0.408) (0.194) (0.409)
Lower middle
class 1.37 0.93 2.04*** 2.80*** 1.36 1.54 0.89 0.66** 1.37
(0.436) (0.170) (0.345) (0.693) (0.493) (0.786) (0.216) (0.117) (0.299)
Working class
3.23*** 0.99 2.27*** 2.15*** 1.68 1.44 0.99 0.92 0.95 (1.226) (0.180) (0.381) (0.558) (0.637) (0.724) (0.248) (0.199) (0.209)
Num of obs 403 1048 1934 1837 1038 847 1107 1092 2097
Pseudo R2 0.042 0.0059 0.0272 0.0075 0.0104 0.0130 0.009 0.0079 0.0065
Prob > chi2 0.000 0.040 0.000 0.000 0.000 0.000 0.001 0.002 0.000
Source: Authors’ calculation. *significant at 10% level, ** significant at 5% level, *** significant at 1% level. Robust standard error in parenthesis. To the education
factor, the reference category is the incomplete primary school. The first level refers to complete primary school. The second level refers to an incomplete secondary
school: technical/ vocational type. The third level refers to complete secondary school: technical/ vocational type. The fourth level refers to an incomplete secondary
school: university-preparatory type. The fifth level refers to complete secondary school: university-preparatory type. The sixth level refers to some university-level
education, without degree and the seventh level refers to university - level education, with a degree. To the class factor, the reference category is the lower class
52 Vo Hong Duc et al. Ho Chi Minh City Open University Journal of Science, 9(1), 36-53
5. Concluding remarks and policy implications
This empirical study aims to determine drivers of attitude toward income inequality
from a pool of demographic factors across the selected countries in the Asia-Pacific region,
using the most recent data from World Values Survey in 2016. Various demographic factors,
including Gender, Age, Political party, Education, Supervision, Family income, and Class are
included in this study. The findings from this empirical study suggest that the role of each
demographic factor as a significant explanation of variation in the attitude toward income
inequality depends on the selected countries. In other words, the impact of demographic factors
on attitude toward income inequality varies by countries. In addition, the components of a set
of demographic factors, significantly contributing to the variation in selected countries in the
study. Remarkably, among the demographic factors, as family income is employed, Supervision
is a significant contribution to attitude toward income inequality in 9 countries, and as Class
is taken into account, the role of Supervision is found statistically significant in 8 countries.
On the ground of key findings from this study, social and economic policies targeted to
the attitude toward income inequality in Vietnam in the future will need to focus on the so-
called Class such as Upper Class; Working Class; or Lower Class in the society. Doing so will
reduce the gaps between classes or even to eliminate them in order to achieve a more
harmonic society in the process of economic growth and development in Vietnam in the
near future.
References
Austen, S. (2002). An international comparison of attitudes to inequality. International Journal
of Social Economics, 29(3), 218-237. doi:10.1108/03068290210417106
Cingano, F. (2014). Trends in income inequality and its impact on economic growth (OECD
Social, Employment and Migration Working Papers, No. 163).
doi:10.1787/5jxrjncwxv6j-en
Curtis, J., & Andersen, R. (2015). How social class shapes attitudes on economic inequality:
The competing forces of self-interest and legitimation. International Review of Social
Research, 5(1), 4-19. doi:10.1515/irsr-2015-0002
Cyba, E. (2000). Geschlecht und soziale Ungleichheit. Konstellationen der
Frauenbenachteiligung. Opladen, Germany: Leske und Budrich.
Dabla-Norris, E., Tsounta, E., Kochhar, K., Ricka, F., & Suphaphiphat, N. (2015). Causes and
consequences of income inequality: A global perspective. Washington, DC: International
Monetary Fund.
Dorling, D. (2011). Injustice: Why social inequality persists. Bristol, UK: Policy Press.
Frerichs, P. (1997). Klasse und Geschlecht 1. Arbeit. Macht. Anerkennung. Interessen.
Opladen, Germany: Leske und Budrich.
Gijsberts, M. (2002). The legitimation of income inequality in state-socialist and market
societies. Acta Sociologica, 45(4), 269-285. doi:10.1177/000169930204500402
Vo Hong Duc et al. Ho Chi Minh City Open University Journal of Science, 9(1), 36-53 53
Hirschman, A. O., & Rothschild, M. (1973). The changing tolerance for income inequality in
the course of economic development. The Quarterly Journal of Economics, 87(4), 544-
566. doi:10.2307/1882024
Kelley, J., & Evans, M. D. (1993). The legitimation of inequality: Occupational earnings in nine
nations. American Journal of Sociology, 99(1), 75-125.
Kim, H., Huh, S., Choi, S., & Lee, Y. (2018). Perceptions of inequality and attitudes towards
redistribution in four East Asian welfare states. International Journal of Social Welfare,
27(1), 28-39. doi:10.1111/ijsw.12266
Mau, S. (1997). Ideologischer konsens und dissens im wohlfahrtsstaat: Zur binnenvariation
von einstellungen zu sozialer ungleichheit in Schweden, Großbritannien und der
Bundesrepublik Deutschland. Soziale Welt, 48(1), 17-37.
Medgyesi, M. (2013). Increasing income inequality and attitudes to inequality: A cohort
perspective (AIAS, GINI Discision Paper, No. 94). Retrieved March 10, 2018, from
https://www.researchgate.net/publication/312266723_Increasing_income_inequality_a
nd_attitudes_to_inequality_a_cohort_perspective
Noll, H. H. (1998). Wahrnehmung und Rechtfertigung sozialer Ungleichheit 1991-1996.
Opladen, Germany: Leske und Budrich.
Stiglitz, J. (2012). The Price of Inequality: How today's divided society endangers our future.
New York, NY: W. W. Norton & Company.
Related Documents