Understanding Immigrant Population Growth Within Urban Areas: A Spatial Econometric Approach Joan Carles Martori & Philippe Apparicio & André Ngamini Ngui # Springer Science+Business Media Dordrecht 2014 Abstract During the last two decades, many studies have described the evolution of the spatial distribution of immigrant groups within an urban area (for example, by using segregation indexes). Nevertheless, the factors that could explain the growth of the immigrant population within an urban area have not yet been fully explored. Moreover, the studies referred to have mainly been conducted in countries that have traditionally received large populations of immigrants, such as the USA, Canada, the UK and Northern Europe. In regard to European cities, the case of the Barcelona metropolitan area (BMA) is particularly relevant: the percentage of immigrants in the total popula- tion has increased significantly within a very short period of time (from 5.05 % in 2001 to 15.16 % in 2008, 12.03 % in 2013). Consequently, the main objective of this study is to examine the factors influencing the relative variation in the percentage of non-EU immigrants during the period of stronger growth (2001–2008). From a methodological point of view, we constructed two spatial models at the census tract level: the spatial lag and spatial error models. The predictors that we selected encompass several dimen- sions: socioeconomic status (unemployment, low education, household income and blue-collar workers), immigrant diversity (entropy), housing (small dwellings and condition of dwelling), and population density and distance to the central business district (CBD). According to the results of the spatial models, the most important factors explaining the growth of immigrant populations are, in descending order: household income, small dwellings and immigrant diversity. Int. Migration & Integration DOI 10.1007/s12134-014-0402-0 J. C. Martori (*) Department of Economics and Business, University of Vic, Sagrada Família, 7, 08500 Vic, Barcelona, Spain e-mail: [email protected] P. Apparicio INRS Centre Urbanisation Culture Société, 385, rue Sherbrooke Est, Montréal H2X 1E3, Canada e-mail: [email protected] A. N. Ngui Centre de Réadaptation en Dépendance de Montréal, Institut Universitaire, 950, rue de Louvain Est, Montréal H2M 2E8, Canada e-mail: [email protected]

Welcome message from author
This document is posted to help you gain knowledge. Please leave a comment to let me know what you think about it! Share it to your friends and learn new things together.
Transcript
Understanding Immigrant Population GrowthWithin Urban Areas: A Spatial Econometric Approach
Joan Carles Martori & Philippe Apparicio &
André Ngamini Ngui
# Springer Science+Business Media Dordrecht 2014
Abstract During the last two decades, many studies have described the evolution ofthe spatial distribution of immigrant groups within an urban area (for example, by usingsegregation indexes). Nevertheless, the factors that could explain the growth of theimmigrant population within an urban area have not yet been fully explored. Moreover,the studies referred to have mainly been conducted in countries that have traditionallyreceived large populations of immigrants, such as the USA, Canada, the UK andNorthern Europe. In regard to European cities, the case of the Barcelona metropolitanarea (BMA) is particularly relevant: the percentage of immigrants in the total popula-tion has increased significantly within a very short period of time (from 5.05 % in 2001to 15.16 % in 2008, 12.03 % in 2013). Consequently, the main objective of this study isto examine the factors influencing the relative variation in the percentage of non-EUimmigrants during the period of stronger growth (2001–2008). From a methodologicalpoint of view, we constructed two spatial models at the census tract level: the spatial lagand spatial error models. The predictors that we selected encompass several dimen-sions: socioeconomic status (unemployment, low education, household income andblue-collar workers), immigrant diversity (entropy), housing (small dwellings andcondition of dwelling), and population density and distance to the central businessdistrict (CBD). According to the results of the spatial models, the most importantfactors explaining the growth of immigrant populations are, in descending order:household income, small dwellings and immigrant diversity.
Int. Migration & IntegrationDOI 10.1007/s12134-014-0402-0
J. C. Martori (*)Department of Economics and Business, University of Vic, Sagrada Família, 7, 08500 Vic, Barcelona,Spaine-mail: [email protected]
P. ApparicioINRS Centre Urbanisation Culture Société, 385, rue Sherbrooke Est, Montréal H2X 1E3, Canadae-mail: [email protected]
A. N. NguiCentre de Réadaptation en Dépendance de Montréal, Institut Universitaire, 950, rue de Louvain Est,Montréal H2M 2E8, Canadae-mail: [email protected]
Keywords Immigration . Barcelonametropolitan area . Spatial models
Introduction
In recent years, growing attention has been focused on the integration of immigrantsinto host societies around the world. Some areas are characterized by processes leadingto segregation (Poulsen et al. 2002), whereas other areas are typified by processesleading to assimilation (Peach 2009), segmented assimilation (Portes and Zhou 1993)or pluralism (Boal 1999). For all these scenarios, researchers have sought to identifysuch processes and to explain how they lead to variations in settlement patterns. Manyof these researchers have thus contributed to the vast body of work on the residentiallocation of immigrants. A large portion of this work focuses on the explanatory factorsthat determine where immigrant populations are located. These explanatory factors,which are also referred to as determinants, are divided into four categories: labourmarket conditions (Borjas 1999, 2001), the specificities of the local welfare system(Borjas 1999; Dodson 2001), the presence of an existing immigrant community(Zavodny 1999; Zorlu and Mulder 2008; Åslund 2005) and the size and diversity ofthe existing immigrant population (Belanger and Rogers 1992; Rogers and Henning1999). To illustrate the relative importance of these factors, most authors examine dataon either an inter-metropolitan or regional scale. Among the research that has examinedsuch inter-metropolitan and regional differences are the studies by several authors in theUSA (Alba et al. 1999; Bartel 1989; Edin et al. 2003; Funkhouser 2000; Newbold1999; Zavodny 1997), and in Northern and Western Europe (Arapoglou 2012; Musterdand Deurloo 2002; Zorlu and Mulder 2008). In addition, within this body of work,much effort has been devoted to improving our understanding of the processes at playin countries with long histories of immigration, whereas few authors have looked atimmigration growth in countries where immigration is a more recent phenomenon.Moreover, few authors have examined intra-metropolitan factors that determine thelocation of new immigrants within the city, and when these explanatory factors areexamined, the variables are somewhat limited in their scope (Fahey and Fanning 2010).In consequence, little is known about the factors that determine the location ofimmigrants within urban areas in the southern EU countries where strong immigrationgrowth is a fairly recent phenomenon.
Over the last decade, Southern Europe has been a host destination for manyimmigrants arriving mainly from Africa, Latin America and Eastern Europe(Kandylis et al. 2012; Rebelo 2012). One of the most receptive of these host countrieshas been Spain. In 1998, 1.60 % of the Spanish population was foreign-born, in 2001this proportion was 3.33 % but in 2008 this proportion had increased to 11.41 % (INE2008). After 2008, the proportion of immigrants has increased more slowly: 12.08 % in2009 and 12.22 % in 2010 which is the last year of growth (12.18 % in 2011).Furthermore, 2008 is an interesting cutoff to study the immigration in Spain becauseit is the last year of growth of the Spain GDP before the actual economic crisis: 1.44trillion US dollars in 2007, 1.59 trillion US dollars in 2008, 1.45 trillion US dollars in2009 (Source: The World Bank). Moreover, in the housing market, 2008 represents apeak in housing prices after a decade of continuous growth of building activity. Recentstudies have found that immigration population growth in the 2001–2008 period may
J.C. Martori et al.
explain Spain’s larger housing market boom (Gonzalez and Ortega 2013). Given this,growing immigrant population has been accompanied by a situation of strong econom-ic context which is especially interesting to explain why this growth is unevenlydistributed within an urban area. In consequence, in the section “Data and Methods”,we present an econometric model to explain immigrant population growth over the2001–2008 period based on the initial conditions in 2001.
From 2008 to 2013, the economic situation has changed dramatically: the recessionhas driven down 7 % of GDP over the last 5 years; unemployment is stuck at 26 %; theemigration of Spanish people is picking up; and the proportion of foreign-borns hasdecreased to 11.76 %. The change of economic situation had important consequencesfor non-EU immigrants and it has been analyzed by several authors. The effects of theeconomic crisis on labour market conditions for immigration population have beenstudied by Castles (2011). Domingo et al. (2010) have compared the situation of twocountries of Southern Europe (i.e. Spain and Italy). Galeano et al. (2014) havedescribed the formation and evolution of ethnic enclaves in Catalonia before andduring the economic crisis. Taken together, these results indicate that there is asignificant decline in the living conditions of immigrants. Several research projectsare currently working with these new conditions generated by the economic crisis.1
Of the total immigrant population in 2008, 40 % came from non-EU countries.Some EU member states require Bulgarians and Romanians to acquire a permit in orderto work, whereas Spain maintains work restrictions only for Romanian citizens;Romanian citizens are therefore included in the group of non-EU immigrants eventhough they have been part of the EU since 2007.
From a geographic point of view, the distribution of immigrants across Spain hasbeen rather uneven. In 1998, 75.85 % of all non-EU immigrants lived in Barcelona andMadrid, the two largest cities in the country. Ten years later, despite a considerable levelof migration to other parts of Spain, the concentration of non-EU immigrants in thesetwo cities remained high (48.68 %). In 2001, Spain had 41,116,842 inhabitants,1,371,657 of whom were immigrants, compared with 46,157,822 and 5,268,762respectively in 2008. There were 2,934,591 inhabitants in the Barcelona metropolitanarea in 2001, of whom 148,170 were immigrants. In 2008, the Barcelona metropolitanarea contained 3,182,739 inhabitants, 482,604 of whom were immigrants. The propor-tion of immigrants thus increased from 5.05 to 15.16 %. Over the same period, Madridshowed a similar increase in its immigrant population, which rose from 5.68 to16.03 %.
Furthermore, in a previous article specifically examining the case of Barcelona, wefound evidence of intra-metropolitan segregation among non-EU immigrants (Martoriand Apparicio 2011). For all of these reasons, the example of the Barcelona metropol-itan area (hereafter referred to as the BMA) represents a unique case that can be used toillustrate the factors that explain, both globally and locally, the changes occurring in thepercentage of immigrants over time. We analyze these factors in a context of strongimmigration growth over a short period of time (2001–2008), and we attempt to
1 (a) Plan Nacional de I+D+I 2011 ¿De la complementariedad a la exclusión? Análisis sociodemográfico delimpacto de la crisis económica en la población inmigrada (Ref. CSO2011/24501). (b) Plan Nacional de I+D+I 2011 Proyecto Movilidad y Reconfiguración Urbana y Metropolitana (Ref.CSO2011/29943).
Understanding Immigrant Population Growth Within Urban Areas
understand what has led to larger increases in the percentage of immigrants in someparts of the BMA as opposed to others.
From a methodological point of view, empirical analyses regarding immigrantlocation are often based on individual-level data. Among the authors using spatiallyreferenced data, only one researcher uses intra-metropolitan spatial data to analyze thedynamics of immigrant settlement patterns (Bråmå 2008). To our knowledge, no studyhas as yet introduced spatial effects to explain the growth of the immigrant populationwithin urban areas. Modeling with a spatial dataset requires that researchers control forspatial dependence (Anselin 2002). Spatial econometrics has recently been appraised ina thematic issue of the Journal of Regional Science. In the introduction to this specialissue, Partridge et al. (2012) raise doubts about spatial lag models. Although some ofthe criticisms raised are valid, these issues can be overcome by improving appliedspatial econometrics work. Moreover, spatial econometrics methods (spatial lag andspatial error models) are used today in many applied studies in various research fields(Castro et al. 2013; Lazrak et al. 2013; Weidmann and Salehyan 2013), as they are usedhere.
The remainder of this paper is structured as follows. In the second section, wediscuss the theoretical framework of the key explanatory factors determining immigrantlocation. The third section gives a brief overview of the BMA and the immigrationprocesses under study, and describes the empirical model and the statistical methodol-ogy that is applied to validate it. In the fourth section, we present the significance of thedifferent explanatory factors.
Theoretical Framework
In order to appropriately allocate resources and services to the communities or munic-ipalities where they are most needed, decision makers and policy makers managing theintegration of immigrants must have a detailed knowledge not only of the currentnumbers of immigrants but also of the factors that will determine changes in theirresidential location over time. In researchers’ attempts to understand the spatial distri-bution of different population groups in urban areas, the residential segregation ofethnic groups has been a key topic (e.g. Gilliland and Olson 2010; Johnston et al. 2001;Massey and Denton 1988; van Kempen and Ozuekren 1998). Segregation is the resultof processes that can be external to the ethnic group (i.e. policies or the host society’sattitudes towards immigrants, which may encourage or discourage settlement in certainneighbourhoods), or internal to the ethnic group (i.e. the close social bonds of certainethnic groups, which favour a clustered settlement pattern) (Aalbers and Deurloo 2003;Arbaci 2007). Additionally, Schelling (1969) presents another explanation for thesegregation which results from the native population moving away from the immigrantpopulation. The recent empirical literature on the spatial distribution of immigrantpopulations in urban areas is rich in studies that have assessed the explanatory factorsthat determine these populations’ residential location (Fougère et al. 2013; Gabriel andPainter 2012; Lichter et al. 2010; Wadsworth 2010).
This literature is comprised of studies on four main components. The first compo-nent consists of factors relating to labour market conditions. The second componentincludes factors relating to the presence of established immigrants in the census tract,
J.C. Martori et al.

which may be less important in the case of the BMA, where the majority of immigrantshave arrived in the last decade. The third component is comprised of factors pertainingto the housing market, and the last component groups together a number of geographicfactors. In the sections below, we explain each component in detail.
Labour Market Conditions
Labour market conditions such as average wages and unemployment affect whereimmigrants settle (Borjas 1999). Another theory, posited by Borjas (1999) and Dodson(2001), is the welfare system’s role at the local level: these authors believe that the localwelfare system may be an attractive factor for immigrants, along with unemploymentinsurance and health insurance (i.e. the notion of “welfare magnets”). But other authorsdisagree. Zavodny (1997), for example, shows that a more advanced welfare system isnot correlated with higher levels of immigration. At the opposite end of the labourspectrum are the immigrants employed in the knowledge economy. Bartel (1989) founda positive correlation between educational level and immigrants’ tendency to move toareas with lower ethnic concentrations. In short, there is an ongoing debate on theimportance of labour market conditions in determining the location of immigrantpopulations.
In Spain, there is a high level of unemployment, more than 10 % in 2001 and13.79 % in 2008 before the economic crisis according to Economically ActivePopulation Survey (Spanish Statistical Office), and it is generally accepted that thisfactor is associated with low-skilled jobs and low educational levels (Canal-Dominguez and Rodriguez-Gutierrez 2008; Simon et al. 2008). In this sense,Arbaci (2007; 2008) and Kandylis et al. (2012) point out that a combination ofthese three factors in southern EU cities may give rise to a scattered spatial patternof immigrant population distribution. Consequently, immigrants from outsideEurope may be likely to settle in areas with high levels of unemployment. Inaddition, the relatively strong presence of blue-collar workers and the relativelyhigh proportion of residents without a diploma also characterize the labour marketconditions of certain areas that have been associated with the strong presence ofimmigrants (Wadsworth 2010).
Presence and Diversity of the Immigrant Population
The second determinant of immigrants’ residential location is the presence ofestablished immigrants (Zavodny 1999; Åslund 2005; Zorlu and Mulder 2008). Inother words, the number of immigrants in a given area has an attractive effect in itself(Belanger and Rogers 1992; Rogers and Henning 1999), so that the higher the numberof existing immigrants, the greater is the area’s power of attraction. These factors arealso present if we look at the latest waves of immigration in the USA, where it has beenfound that immigrants tend to move to regions where there are already large immigrantpopulations (Belanger and Rogers 1992; Rogers and Henning 1999). This type ofapproach suggests that metropolitan areas in the USA may tend to receive immigrantsin the future, and, for all intents and purposes, this theory also suggests which areasmay have large immigrant populations in the near future. Since these processes involvesignificant changes in public services, some European countries have developed
Understanding Immigrant Population Growth Within Urban Areas

policies to direct immigrants to certain regions (see for example, Dutch RefugeeCouncil 1999 or Edin et al. 2003).
The tendency for immigrants to settle in neighbourhoods where other immigrantsare present appears to be more important after their initial choice of urban area, asdemonstrated by Åslund (2005) in the case of Sweden. At the other end of thespectrum, Funkhouser (2000) also agrees with the secondary migration explanation,and, more importantly, he posits that after many years in the host country, immigrantstend to relocate to areas with low ethnic concentrations. Mendoza (2013) and Yue et al.(2013) have shown the importance of social networks in determining immigrants’destinations. The explanatory value of this theory is however somewhat limited inour case. As we noted in the introduction, the nature of the migration to the BMAdiffers from that found in other urban areas. In 1998, with only 1.7 % of the populationbeing foreign-born, the BMA did not have a large existing immigrant population. Thispopulation was also highly diverse (i.e. high entropy) (Martori and Apparicio 2011).
Housing Market
The third factor that determines the location of the immigrant population involvesdimensions relating to the housing market. By comparing different regions in theNetherlands, Zorlu and Mulder (2008) show how recent immigrants are located inareas where deprivation indicators, such as substandard housing, are high. In the case ofSweden, Bråmå (2008) and Åslund (2005) also introduce a number of housing marketconditions. In short, for both of these countries, it is shown that, in general, newimmigrants live in very different housing conditions from those of the native popula-tion. But these cases differ considerably from the situation in Spain. In the Netherlandsand Sweden, rental and cooperative housing represents more than half of the market. InSpain, on the other hand, 77.6 % of the immigrant population lives in rental dwellings,compared with only 15 % of the native population (Colectivo IOE 2005). In the centralmunicipalities of the BMA, 25 % of the dwellings are rented against 11.3 % for thewhole Spain.
This system is “characterized by an imbalance in housing tenure favouring owneroccupation and residual social housing” (Fullaondo and Garcia 2007, page 4.). Painterand Yu (2010) introduce other variables, such as housing prices and rent, in order toexamine immigrants’ success in the housing markets of a sample of 60 mid-size USurban areas. The results indicate, along the same lines, that immigrants are lesssuccessful than their American counterparts in becoming residential property owners.In short, the immigrant population in Spain is concentrated in areas where the majorityof the dwellings are small and in poor condition (Ajenjo et al. 2008).
Geographic Factors
Population density is a geographic variable used to identify areas with a high concen-tration of immigrants (Martori and Hoberg 2008; Qadeer 2010). In Spain, the intensemigration growth of the past decade has generated significant territorial dynamics inimmigrants’ settlement patterns. With the wave of immigration that began in 2000, theold town cores of cities acted as “gateways” for immigration flows. These areas arecharacterized by an informal housing market, which is for the most part comprised of
J.C. Martori et al.
substandard dwellings. Thus, in contrast to the findings of Malheiros and Vala (2004)for the late 1990s, the territorial pattern of immigration in Spanish cities has beendefined until recently by a high concentration of immigrants in the cores ofmetropolises, and not in the suburbs (Arbaci and Tapada-Berteli 2012). We have seena shift in immigrant populations towards the peripheries of urban areas, which hasresulted in a new ethnic geography. The primary force behind this shift was thesaturation of the traditional “gateway” areas, which could no longer accept morepopulations. This has led to a process of geographic expansion whereby new immi-grants have settled in working class areas in the urban periphery (Martori and Apparicio2011).
Data and Methods
An Overview of the BMA
The BMA is located on the central coast of Catalonia, Spain. In administrative terms, itis part of the Metropolitan Region (MR), and it represents 65 % of residents and 89 %of the MR immigrant population. The BMA is comprised of 36 municipalities occu-pying 627 km2 and containing 3.18 million inhabitants in 2008. The BMA is dividedinto 2493 census tracts (CTs), each of which includes some 500 to 2000 residents. Thedata on residents’ nationalities was obtained at the CT level from the Spanish NationalStatistics Office. In terms of its urban form, the BMA contains three different zones: (1)the central municipality of Barcelona (1,615,908 inhabitants); (2) the inner ring forminga continuous urban space with the main municipalities of L’Hospitalet de Llobregat(253,782 inhabitants), Badalona (215,329) and Santa Coloma de Gramenet (117,336);and (3) the last zone, which is a discontinuous area far from the central business district(CBD)2 that contains both residential areas and industrial parks. Here, we find themunicipalities of Sant Cugat del Vallés (76,274 inhabitants) and Castelldefels (60,572)(Fig. 1).
An Overview of Immigrant Population Growth in the BMA
The percentage of the immigrant population rose sharply from 4.17 to 11.91 % between2001 and 2008. In 2008, the BMA had 3,182,739 inhabitants, of whom 482,604 wereimmigrants, with 379,198 of them coming from non-EU countries. In 2008, the sevenlargest immigrant groups were Ecuadorians (10.54 %), Moroccans (9.49 %), Bolivians(7.37 %), Italians (5.62 %), Peruvians (5.15 %), Pakistanis (5.04 %) and Chinese(5.02 %). The percentages of non-EU immigrants in 2001 and 2008 and the relativevariation of non-EU immigrants from 2001 to 2008 are mapped at the CT level inFig. 2a–c. As can be seen, the CTs with the highest proportions of non-EU immigrantpopulations in 2008 are mainly located in the districts of Barcelona and in the
2 We consider the CBD as the oldest district (District I) in the City of Barcelona (Ciutat Vella): it is the locationof the City Hall, the headquarters of the autonomous government and the offices of many large companies, andis the site of major commercial activities.
Understanding Immigrant Population Growth Within Urban Areas
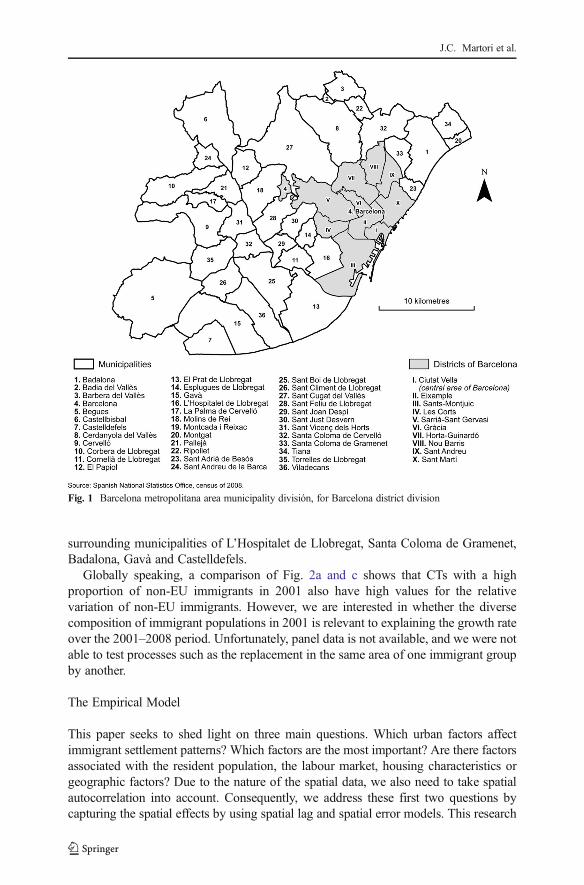
surrounding municipalities of L’Hospitalet de Llobregat, Santa Coloma de Gramenet,Badalona, Gavà and Castelldefels.
Globally speaking, a comparison of Fig. 2a and c shows that CTs with a highproportion of non-EU immigrants in 2001 also have high values for the relativevariation of non-EU immigrants. However, we are interested in whether the diversecomposition of immigrant populations in 2001 is relevant to explaining the growth rateover the 2001–2008 period. Unfortunately, panel data is not available, and we were notable to test processes such as the replacement in the same area of one immigrant groupby another.
The Empirical Model
This paper seeks to shed light on three main questions. Which urban factors affectimmigrant settlement patterns? Which factors are the most important? Are there factorsassociated with the resident population, the labour market, housing characteristics orgeographic factors? Due to the nature of the spatial data, we also need to take spatialautocorrelation into account. Consequently, we address these first two questions bycapturing the spatial effects by using spatial lag and spatial error models. This research
Fig. 1 Barcelona metropolitana area municipality división, for Barcelona district division
J.C. Martori et al.

therefore uses an econometric modeling strategy to explain the growth of the non-EUimmigrant population in the BMA from 2001 to 2008. The unit of analysis in this studyis the census tract. Two sources of data, both at the census tract level, were obtainedfrom the Spanish National Statistics Office: Censo de Población (2001), and theimmigration data taken from the continuous registry of population (2001–2008) knownas the Padron Municipal. The Padron Municipal is a municipal (non-state) registry thatincludes both the regular and irregular migrant populations. It contains data on thepopulation by sex, age, place of birth, place of residence and nationality. It is availablefrom 1996 onwards, and is easily accessible for research purposes. González (2005)compared counts of immigrants in Censo de Población and Padron Municipal; heconcluded that there is an overestimation of the immigration population in the PadronMunicipal in comparison with the Censo de Población. The variable that we wish tostudy is the growth rate of the population of non-EU immigrants from 2001 to 2008, aperiod with the highest levels of immigrant population growth.
In line with the theoretical framework, the predictors that we selected encompassfour dimensions: labour market conditions (unemployment, low education, householdincome (Madariaga et al. 2012) and blue-collar workers), immigrant diversity
Fig. 2 Presence and growth of non-EU immigrant population
Understanding Immigrant Population Growth Within Urban Areas
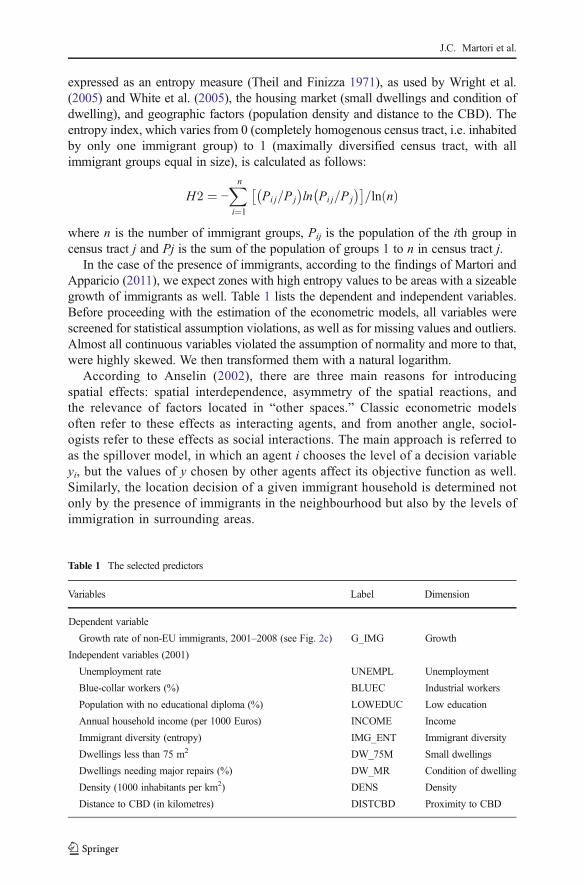
expressed as an entropy measure (Theil and Finizza 1971), as used by Wright et al.(2005) and White et al. (2005), the housing market (small dwellings and condition ofdwelling), and geographic factors (population density and distance to the CBD). Theentropy index, which varies from 0 (completely homogenous census tract, i.e. inhabitedby only one immigrant group) to 1 (maximally diversified census tract, with allimmigrant groups equal in size), is calculated as follows:
H2 ¼ −Xi¼1
n
Pi j=P j
� �ln Pi j=P j
� �� �=ln nð Þ
where n is the number of immigrant groups, Pij is the population of the ith group incensus tract j and Pj is the sum of the population of groups 1 to n in census tract j.
In the case of the presence of immigrants, according to the findings of Martori andApparicio (2011), we expect zones with high entropy values to be areas with a sizeablegrowth of immigrants as well. Table 1 lists the dependent and independent variables.Before proceeding with the estimation of the econometric models, all variables werescreened for statistical assumption violations, as well as for missing values and outliers.Almost all continuous variables violated the assumption of normality and more to that,were highly skewed. We then transformed them with a natural logarithm.
According to Anselin (2002), there are three main reasons for introducingspatial effects: spatial interdependence, asymmetry of the spatial reactions, andthe relevance of factors located in “other spaces.” Classic econometric modelsoften refer to these effects as interacting agents, and from another angle, sociol-ogists refer to these effects as social interactions. The main approach is referred toas the spillover model, in which an agent i chooses the level of a decision variableyi, but the values of y chosen by other agents affect its objective function as well.Similarly, the location decision of a given immigrant household is determined notonly by the presence of immigrants in the neighbourhood but also by the levels ofimmigration in surrounding areas.
Table 1 The selected predictors
Variables Label Dimension
Dependent variable
Growth rate of non-EU immigrants, 2001–2008 (see Fig. 2c) G_IMG Growth
Independent variables (2001)
Unemployment rate UNEMPL Unemployment
Blue-collar workers (%) BLUEC Industrial workers
Population with no educational diploma (%) LOWEDUC Low education
Annual household income (per 1000 Euros) INCOME Income
Immigrant diversity (entropy) IMG_ENT Immigrant diversity
Dwellings less than 75 m2 DW_75M Small dwellings
Dwellings needing major repairs (%) DW_MR Condition of dwelling
Density (1000 inhabitants per km2) DENS Density
Distance to CBD (in kilometres) DISTCBD Proximity to CBD
J.C. Martori et al.
With respect to this approach, various neighbourhood characteristics are related tothe percentage of immigrants. These spatial effects on immigrant location choicesprovide a theoretical basis for us to use the spatial lag and spatial error models.
From a practical standpoint, there is another reason for introducing spatial effects. If,for example, the scale and location of the process under study do not correspond to theavailable data, the mismatch will tend to result in the modeling of a structure that showsa systematic spatial pattern. In consequence, the off-diagonal elements of the errorcovariance matrix will not equal zero. In this situation, two broad classes of spatialeffects may be distinguished, which are referred to as spatial dependence and spatialheterogeneity.
In summary, we use a strategy for modeling the growth of the immigrant populationin the BMA that is based on the predictors discussed in the theoretical framework.Since this general model has spatial effects, we proceed with the computation of twospatial econometric models. Consequently, we use spatial lag and spatial error modelsto control for spatial dependence.
According to the theoretical framework and the available data at the census tractlevel, we estimate the model as follows:
log G IMGð Þi;2001−2008 ¼ β1 þ β2log UNEMPLð Þi;2001 þ β3log BLUECð Þi2001þβ4log LOWEDUCð Þi;2001 þ β5log INCOMEð Þi;2001þβ6log IMG ENTð Þi;2001 þ β7log DW75Mð Þi;2001þ β8 DW MRð Þi;2001 þ β9log DENSð Þi;2001þ β10log DISTCBDð Þi;2001 þ εi;2001
where the dependent variable is the growth rate of non-EU immigrants in the 2001–2008 period:
logyi;2008− yi;2001
yi;2001
!
with yi,2008 and yi,2001 being respectively the numbers of non-EU immigrants in censustract i in 2008 and 2001. The interpretation of the parameters in spatial models must bedone by using the technique proposed by LeSage and Pace (2009). Note that the“dwellings needing major repairs” variable (DW_MR) is not in logarithmic formbecause there are several census tracts with zero values for this variable. In short, themodel explains immigrant population growth over the period from 2001 to 2008 basedon the initial conditions in 2001. On the one hand, we have used cross-sectional databecause this kind of data presents heteroscedasticity, but we found it difficult todetermine the appropriate transformation model. In this case, a logarithmic transfor-mation is useful. This method is usual in econometrics and empirical model is specifiedwhere the variables are expressed in logarithm. On the other hand, in the models thatwere estimated, the interpretation of the parameters becomes richer and more complexthan with linear regression parameters. We used LeSage and Pace’s (2009) approachbased on Sr(W) matrix.
To introduce spatial effects, we estimated two models. The spatial lag model is themost frequently encountered specification in spatial econometrics:
y ¼ ρWyþ Xβ þ ε;
Understanding Immigrant Population Growth Within Urban Areas
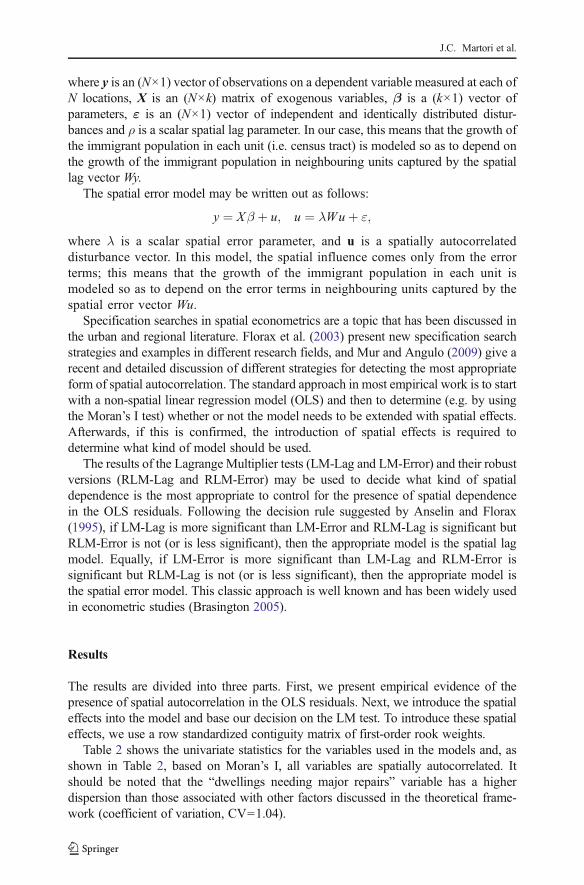
where y is an (N×1) vector of observations on a dependent variable measured at each ofN locations, X is an (N×k) matrix of exogenous variables, β is a (k×1) vector ofparameters, ε is an (N×1) vector of independent and identically distributed distur-bances and ρ is a scalar spatial lag parameter. In our case, this means that the growth ofthe immigrant population in each unit (i.e. census tract) is modeled so as to depend onthe growth of the immigrant population in neighbouring units captured by the spatiallag vector Wy.
The spatial error model may be written out as follows:
y ¼ Xβ þ u; u ¼ λWuþ ε;
where λ is a scalar spatial error parameter, and u is a spatially autocorrelateddisturbance vector. In this model, the spatial influence comes only from the errorterms; this means that the growth of the immigrant population in each unit ismodeled so as to depend on the error terms in neighbouring units captured by thespatial error vector Wu.
Specification searches in spatial econometrics are a topic that has been discussed inthe urban and regional literature. Florax et al. (2003) present new specification searchstrategies and examples in different research fields, and Mur and Angulo (2009) give arecent and detailed discussion of different strategies for detecting the most appropriateform of spatial autocorrelation. The standard approach in most empirical work is to startwith a non-spatial linear regression model (OLS) and then to determine (e.g. by usingthe Moran’s I test) whether or not the model needs to be extended with spatial effects.Afterwards, if this is confirmed, the introduction of spatial effects is required todetermine what kind of model should be used.
The results of the Lagrange Multiplier tests (LM-Lag and LM-Error) and their robustversions (RLM-Lag and RLM-Error) may be used to decide what kind of spatialdependence is the most appropriate to control for the presence of spatial dependencein the OLS residuals. Following the decision rule suggested by Anselin and Florax(1995), if LM-Lag is more significant than LM-Error and RLM-Lag is significant butRLM-Error is not (or is less significant), then the appropriate model is the spatial lagmodel. Equally, if LM-Error is more significant than LM-Lag and RLM-Error issignificant but RLM-Lag is not (or is less significant), then the appropriate model isthe spatial error model. This classic approach is well known and has been widely usedin econometric studies (Brasington 2005).
Results
The results are divided into three parts. First, we present empirical evidence of thepresence of spatial autocorrelation in the OLS residuals. Next, we introduce the spatialeffects into the model and base our decision on the LM test. To introduce these spatialeffects, we use a row standardized contiguity matrix of first-order rook weights.
Table 2 shows the univariate statistics for the variables used in the models and, asshown in Table 2, based on Moran’s I, all variables are spatially autocorrelated. Itshould be noted that the “dwellings needing major repairs” variable has a higherdispersion than those associated with other factors discussed in the theoretical frame-work (coefficient of variation, CV=1.04).
J.C. Martori et al.
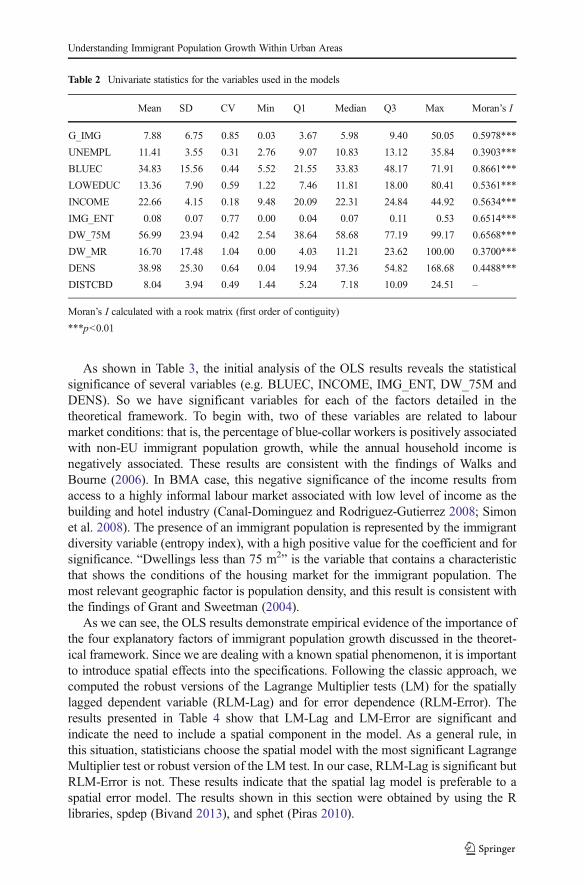
As shown in Table 3, the initial analysis of the OLS results reveals the statisticalsignificance of several variables (e.g. BLUEC, INCOME, IMG_ENT, DW_75M andDENS). So we have significant variables for each of the factors detailed in thetheoretical framework. To begin with, two of these variables are related to labourmarket conditions: that is, the percentage of blue-collar workers is positively associatedwith non-EU immigrant population growth, while the annual household income isnegatively associated. These results are consistent with the findings of Walks andBourne (2006). In BMA case, this negative significance of the income results fromaccess to a highly informal labour market associated with low level of income as thebuilding and hotel industry (Canal-Dominguez and Rodriguez-Gutierrez 2008; Simonet al. 2008). The presence of an immigrant population is represented by the immigrantdiversity variable (entropy index), with a high positive value for the coefficient and forsignificance. “Dwellings less than 75 m2” is the variable that contains a characteristicthat shows the conditions of the housing market for the immigrant population. Themost relevant geographic factor is population density, and this result is consistent withthe findings of Grant and Sweetman (2004).
As we can see, the OLS results demonstrate empirical evidence of the importance ofthe four explanatory factors of immigrant population growth discussed in the theoret-ical framework. Since we are dealing with a known spatial phenomenon, it is importantto introduce spatial effects into the specifications. Following the classic approach, wecomputed the robust versions of the Lagrange Multiplier tests (LM) for the spatiallylagged dependent variable (RLM-Lag) and for error dependence (RLM-Error). Theresults presented in Table 4 show that LM-Lag and LM-Error are significant andindicate the need to include a spatial component in the model. As a general rule, inthis situation, statisticians choose the spatial model with the most significant LagrangeMultiplier test or robust version of the LM test. In our case, RLM-Lag is significant butRLM-Error is not. These results indicate that the spatial lag model is preferable to aspatial error model. The results shown in this section were obtained by using the Rlibraries, spdep (Bivand 2013), and sphet (Piras 2010).
Table 2 Univariate statistics for the variables used in the models
Mean SD CV Min Q1 Median Q3 Max Moran’s I
G_IMG 7.88 6.75 0.85 0.03 3.67 5.98 9.40 50.05 0.5978***
UNEMPL 11.41 3.55 0.31 2.76 9.07 10.83 13.12 35.84 0.3903***
BLUEC 34.83 15.56 0.44 5.52 21.55 33.83 48.17 71.91 0.8661***
LOWEDUC 13.36 7.90 0.59 1.22 7.46 11.81 18.00 80.41 0.5361***
INCOME 22.66 4.15 0.18 9.48 20.09 22.31 24.84 44.92 0.5634***
IMG_ENT 0.08 0.07 0.77 0.00 0.04 0.07 0.11 0.53 0.6514***
DW_75M 56.99 23.94 0.42 2.54 38.64 58.68 77.19 99.17 0.6568***
DW_MR 16.70 17.48 1.04 0.00 4.03 11.21 23.62 100.00 0.3700***
DENS 38.98 25.30 0.64 0.04 19.94 37.36 54.82 168.68 0.4488***
DISTCBD 8.04 3.94 0.49 1.44 5.24 7.18 10.09 24.51 –
Moran’s I calculated with a rook matrix (first order of contiguity)
***p<0.01
Understanding Immigrant Population Growth Within Urban Areas
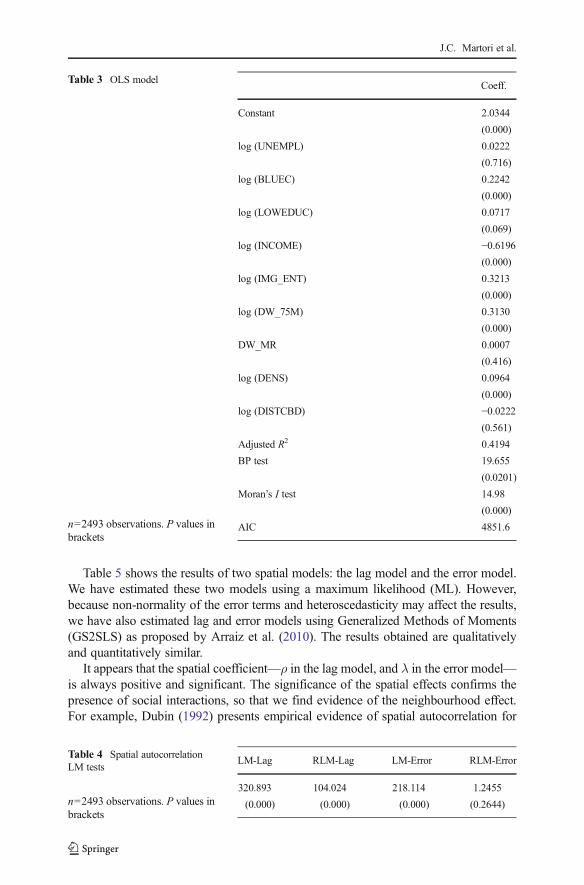
Table 5 shows the results of two spatial models: the lag model and the error model.We have estimated these two models using a maximum likelihood (ML). However,because non-normality of the error terms and heteroscedasticity may affect the results,we have also estimated lag and error models using Generalized Methods of Moments(GS2SLS) as proposed by Arraiz et al. (2010). The results obtained are qualitativelyand quantitatively similar.
It appears that the spatial coefficient—ρ in the lag model, and λ in the error model—is always positive and significant. The significance of the spatial effects confirms thepresence of social interactions, so that we find evidence of the neighbourhood effect.For example, Dubin (1992) presents empirical evidence of spatial autocorrelation for
Table 3 OLS model
n=2493 observations. P values inbrackets
Coeff.
Constant 2.0344
(0.000)
log (UNEMPL) 0.0222
(0.716)
log (BLUEC) 0.2242
(0.000)
log (LOWEDUC) 0.0717
(0.069)
log (INCOME) −0.6196(0.000)
log (IMG_ENT) 0.3213
(0.000)
log (DW_75M) 0.3130
(0.000)
DW_MR 0.0007
(0.416)
log (DENS) 0.0964
(0.000)
log (DISTCBD) −0.0222(0.561)
Adjusted R2 0.4194
BP test 19.655
(0.0201)
Moran’s I test 14.98
(0.000)
AIC 4851.6
Table 4 Spatial autocorrelationLM tests
n=2493 observations. P values inbrackets
LM-Lag RLM-Lag LM-Error RLM-Error
320.893 104.024 218.114 1.2455
(0.000) (0.000) (0.000) (0.2644)
J.C. Martori et al.
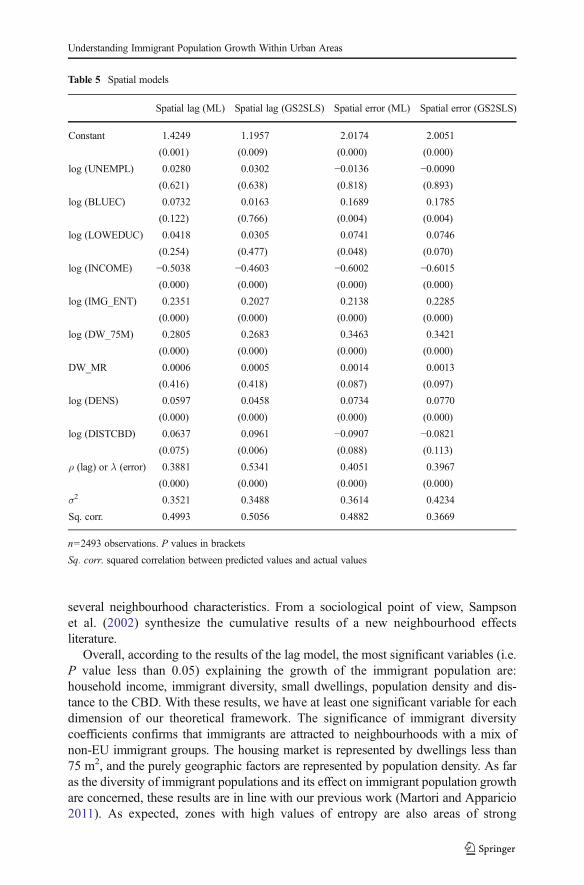
several neighbourhood characteristics. From a sociological point of view, Sampsonet al. (2002) synthesize the cumulative results of a new neighbourhood effectsliterature.
Overall, according to the results of the lag model, the most significant variables (i.e.P value less than 0.05) explaining the growth of the immigrant population are:household income, immigrant diversity, small dwellings, population density and dis-tance to the CBD. With these results, we have at least one significant variable for eachdimension of our theoretical framework. The significance of immigrant diversitycoefficients confirms that immigrants are attracted to neighbourhoods with a mix ofnon-EU immigrant groups. The housing market is represented by dwellings less than75 m2, and the purely geographic factors are represented by population density. As faras the diversity of immigrant populations and its effect on immigrant population growthare concerned, these results are in line with our previous work (Martori and Apparicio2011). As expected, zones with high values of entropy are also areas of strong
Table 5 Spatial models
Spatial lag (ML) Spatial lag (GS2SLS) Spatial error (ML) Spatial error (GS2SLS)
Constant 1.4249 1.1957 2.0174 2.0051
(0.001) (0.009) (0.000) (0.000)
log (UNEMPL) 0.0280 0.0302 −0.0136 −0.0090(0.621) (0.638) (0.818) (0.893)
log (BLUEC) 0.0732 0.0163 0.1689 0.1785
(0.122) (0.766) (0.004) (0.004)
log (LOWEDUC) 0.0418 0.0305 0.0741 0.0746
(0.254) (0.477) (0.048) (0.070)
log (INCOME) −0.5038 −0.4603 −0.6002 −0.6015(0.000) (0.000) (0.000) (0.000)
log (IMG_ENT) 0.2351 0.2027 0.2138 0.2285
(0.000) (0.000) (0.000) (0.000)
log (DW_75M) 0.2805 0.2683 0.3463 0.3421
(0.000) (0.000) (0.000) (0.000)
DW_MR 0.0006 0.0005 0.0014 0.0013
(0.416) (0.418) (0.087) (0.097)
log (DENS) 0.0597 0.0458 0.0734 0.0770
(0.000) (0.000) (0.000) (0.000)
log (DISTCBD) 0.0637 0.0961 −0.0907 −0.0821(0.075) (0.006) (0.088) (0.113)
ρ (lag) or λ (error) 0.3881 0.5341 0.4051 0.3967
(0.000) (0.000) (0.000) (0.000)
σ2 0.3521 0.3488 0.3614 0.4234
Sq. corr. 0.4993 0.5056 0.4882 0.3669
n=2493 observations. P values in brackets
Sq. corr. squared correlation between predicted values and actual values
Understanding Immigrant Population Growth Within Urban Areas
immigrant population growth. The negative sign for income suggests the presence ofgreater immigrant population growth in areas with lower income levels (Arbaci andMalheiros 2010; Walks and Bourne 2006). The positive significance of the distance tothe CBD reveals the process of decentralization (Arbaci and Malheiros 2010); in otherwords, as the distance from the CBD increases, immigrant population growth alsoincreases. It is worth noting that this decentralization is not synonymous with lowpopulation density, because some areas outside the central city also have high densitylevels. Housing characteristics are especially important, and the variable “dwellingsless than 75 m2” is significant. These results regarding the importance of housingcharacteristics confirm previous studies showing the immigrant population living insmaller dwellings (Miret and Serra del Pozo 2013).
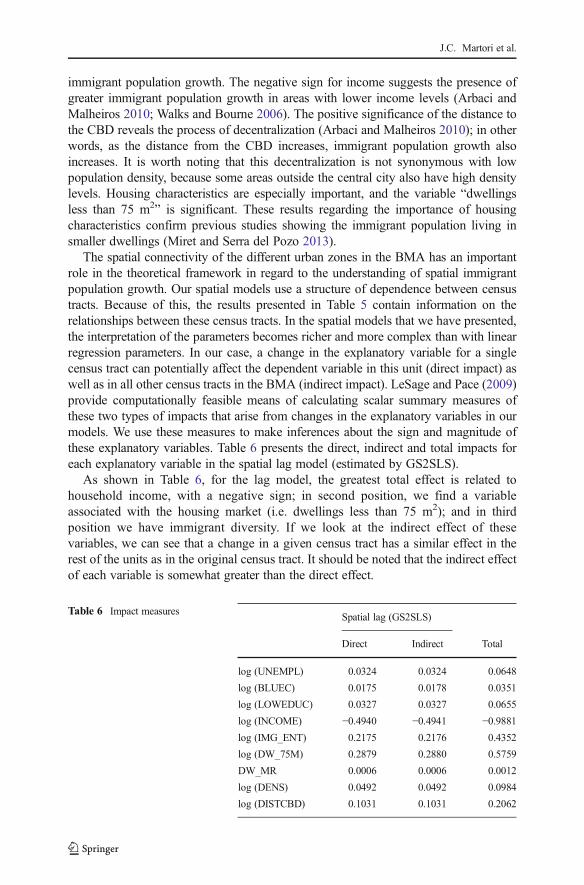
The spatial connectivity of the different urban zones in the BMA has an importantrole in the theoretical framework in regard to the understanding of spatial immigrantpopulation growth. Our spatial models use a structure of dependence between censustracts. Because of this, the results presented in Table 5 contain information on therelationships between these census tracts. In the spatial models that we have presented,the interpretation of the parameters becomes richer and more complex than with linearregression parameters. In our case, a change in the explanatory variable for a singlecensus tract can potentially affect the dependent variable in this unit (direct impact) aswell as in all other census tracts in the BMA (indirect impact). LeSage and Pace (2009)provide computationally feasible means of calculating scalar summary measures ofthese two types of impacts that arise from changes in the explanatory variables in ourmodels. We use these measures to make inferences about the sign and magnitude ofthese explanatory variables. Table 6 presents the direct, indirect and total impacts foreach explanatory variable in the spatial lag model (estimated by GS2SLS).
As shown in Table 6, for the lag model, the greatest total effect is related tohousehold income, with a negative sign; in second position, we find a variableassociated with the housing market (i.e. dwellings less than 75 m2); and in thirdposition we have immigrant diversity. If we look at the indirect effect of thesevariables, we can see that a change in a given census tract has a similar effect in therest of the units as in the original census tract. It should be noted that the indirect effectof each variable is somewhat greater than the direct effect.
Table 6 Impact measuresSpatial lag (GS2SLS)
Direct Indirect Total
log (UNEMPL) 0.0324 0.0324 0.0648
log (BLUEC) 0.0175 0.0178 0.0351
log (LOWEDUC) 0.0327 0.0327 0.0655
log (INCOME) −0.4940 −0.4941 −0.9881log (IMG_ENT) 0.2175 0.2176 0.4352
log (DW_75M) 0.2879 0.2880 0.5759
DW_MR 0.0006 0.0006 0.0012
log (DENS) 0.0492 0.0492 0.0984
log (DISTCBD) 0.1031 0.1031 0.2062
J.C. Martori et al.

Conclusion
In this paper, we have analyzed a number of explanatory factors that are relevant tounderstanding the variability in the growth of the immigrant population in a SouthernEuropean metropolitan area. More specifically, we studied the Barcelona metropolitanarea as a special case characterized by a rapidly growing immigrant population over ashort period of time. The results of the OLS demonstrated the importance of the classicfactors mentioned in the literature: that is, the labour market, the immigrant popula-tion’s diversity, the housing market, and geographic factors.
However, the aim of this paper goes beyond the gathering of new empirical evidencefor the theoretical causes of immigrant population growth in a Southern Europeanmetropolitan area; in sections three and four, we show the relevance of spatial factors inthis kind of analysis.
Firstly, spatial effects have to be introduced into the econometric specifications.The spatial effects are due to both theoretical reasons and the available data. Themain theoretical argument is that the location decision of a given immigranthousehold may be determined not only by the presence of immigrants in a givenneighbourhood but also by the levels of immigration in nearby areas. In our case, ifthe scale and location of the process under study do not correspond to the availabledata, the mismatch will tend to result in model structures that include a spatialpattern.
Secondly, the spatial effects were explored here by using two models: the spatiallag and spatial error models. Following a standard specification search processbased on LM and RLM tests, the spatial lag model was found to best describe thedata. The final results indicated the importance of spatial effects that affect thegrowth of the immigrant population. Thirdly, we used LeSage and Pace’s (2009)approach to estimate the impact measures for each of the explanatory variables. Forthe Barcelona metropolitan area, our models revealed that immigrant population’sdiversity in a given area is less important in explaining the growth of the immigrantpopulation than household income is, and that this is especially the case with thespatial lag model. This result is important because the literature suggests that thepresence of other immigrants is the primary determinant of immigrants’ locationchoices. This would suggest that in southern EU metropolitan areas, there may beother factors that are more important than the presence of other immigrants inexplaining immigrant population growth in these urban areas.
These results suggest a number of avenues for future research. In order to be ableto generalize this empirical model, further validation and new data from othersouthern EU metropolitan areas are needed. Other previous studies of urban areasin Southern EU (Arbaci 2007, 2008; Kandylis et al. 2012; Rebelo 2012) in Portugal(Lisbon and Oporto), Italy (Roma, Milan and Turin) and Greece (Athens) pointedout the importance of housing market. In this work, we have introduced othervariables: labour market, diversity and geographical. These variables proved to beimportant for explaining the variability in the growth of the immigrant populationwithin urban areas.
Finally, we must extend spatial econometric models to include not only spatialautocorrelation but also spatial heterogeneity, or at least to include municipality fixedeffects to account for this spatial heterogeneity.
Understanding Immigrant Population Growth Within Urban Areas
Acknowledgments The authors would like to thank the anonymous reviewers for their helpful commentson the original version of this paper. This paper was first presented at the 5th World Conference of the SpatialEconometrics Association (SEA) in Toulouse, France, in July 2011. We are grateful to the participants for theircomments and to Jesus Mur for his valuable suggestions on various drafts of the paper. The study has beenfunded by the ARAFI2008 program of the Catalan Government.
References
Aalbers, M. B., & Deurloo, R. (2003). Concentrated and condemned? Residential patterns of immigrants fromindustrial and non-industrial countries in Amsterdam. Housing, Theory and Society, 20(4), 197–208.
Ajenjo, M., Blanes, A., Bosch, J., Parella, S., Recio, A., SanMartin, J., et al. (2008). Les condicions de vida dela Població immigrada a Catalunya. Barcelona: Editorial Mediterrània.
Alba, R. D., Logan, J. R., Stults, B. J., Marzan, G., & Zhang, W. (1999). Immigrant groups in the suburbs: areexamination of suburbanization and spatial assimilation. American Sociological Review, 64(3), 446–460.
Anselin, L. (2002). Under the hood issues in the specification and interpretation of spatial regression models.Agricultural Economics, 27(3), 247–267.
Anselin, L. and Florax, R.J. (1995). Small sample properties of tests for spatial dependence in regressionmodels: Some further results. In: New Directions in Spatial Econometrics. : Springer, 21–74.
Arapoglou, V. P. (2012). Diversity, inequality and urban change. European Urban and Regional Studies,19(3), 223–237.
Arbaci, S. (2007). The residential insertion of immigrants in Europe: patterns and mechanisms in southernEuropean cities. The Barlett School of planning. London: University College.
Arbaci, S. (2008). (Re)viewing ethnic residential segregation in southern european cities: housing and urbanregimes as mechanisms of marginalisation. Housing Studies, 23(4), 589–613.
Arbaci, S., & Malheiros, J. (2010). De-segregation, peripheralisation and the social exclusion of immigrants:southern European cities in the 1990s. Journal of Ethnic and Migration Studies, 36(2), 227–255.
Arbaci, S., & Tapada-Berteli, T. (2012). Social inequality and urban regeneration in Barcelona city centre:reconsidering success. European Urban and Regional Studies, 19(3), 287–311.
Arraiz, I., Drukker, D., Kelejian, H., & Prucha, I. (2010). A spatial Cliff-Ord type model with heteroskedasticinnovations: small and large sample results. Journal of Regional Science, 50(2), 592–614.
Åslund, O. (2005). Now and forever? Initial and subsequent location choices of immigrants. Regional Scienceand Urban Economics, 35(2), 141–165.
Bartel, A. P. (1989). Where do the new US immigrants live? Journal of Labor Economics, 7(4), 371.Belanger, A., & Rogers, A. (1992). The internal migration and spatial redistribution of the foreign-born
population in the United States: 1965–70 and 1975–80. International Migration Review, 26(4), 1342–1369.
Bivand, R. (2013). Spdep: spatial dependence: weighting schemes, statistics and models. R Package Ver.0.5–56.
Boal, F. W. (1999). From undivided cities to undivided cities: assimilation to ethnic cleansing. HousingStudies, 14(5), 585–600.
Borjas, G.J. (1999). The economic analysis of immigration. Handbook of Labor Economics: 1697–1760.Borjas, G.J. (2001). Does immigration grease the wheels of the labor market? Brookings Papers on Economic
Activity: 69–119.Bråmå, Å. (2008). Dynamics of ethnic residential segregation in Göteborg, Sweden, 1995–2000. Population
Space and Place, 14(2), 101–117.Brasington, D. M. (2005). Demand for environmental quality: a spatial hedonic analysis. Regional Science
and Urban Economics, 35(1), 57.Canal-Dominguez, J. F., & Rodriguez-Gutierrez, C. (2008). Analysis of wage differences between native and
immigrant workers in Spain. Spanish Economic Review, 10(2), 109–134.Castles, S. (2011). Migration, crisis and the global labour market. Globalizations, 8(3), 311–324.Castro, M., Paleti, R., & Bhat, C. R. (2013). A spatial generalized ordered response model to examine
highway crash injury severity. Accident Analysis and Prevention, 52, 188–203.Colectivo, I. O. E. (2005). Inmigración y vivienda en España. Madrid: Ministerio De Trabajo y Asuntos
Sociales.
J.C. Martori et al.
Dodson, M. E. (2001). Welfare generosity and location choices among new United States immigrants.International Review of Law and Economics, 21(1), 47–67.
Domingo, A., Gil-Alonso, F., & Galizia, F. (2010). Autoctoni ed immigrati nel mercato del lavoro spagnolo editaliano: dall’espansione economica alla crisi. Rivista Italiana di Economia, Demografia e Statistica,64(4), 151–158.
Dubin, R. A. (1992). Spatial autocorrelation and neighborhood quality. Regional Science and UrbanEconomics, 22(3), 433–452.
Dutch Refugee Council. (1999). Housing for refugees in the European Union. Amsterdam: Dutch RefugeeCouncil.
Edin, P. A., Fredriksson, P., & Åslund, O. (2003). Ethnic enclaves and the economic success of immigrants—evidence from a natural experiment. Quarterly Journal of Economics, 118(1), 329–357.
Fahey, T., & Fanning, B. (2010). Immigration and socio-spatial segregation in Dublin, 1996–2006. UrbanStudies, 47(8), 1625–1642.
Florax, R. J., Der Vlist, V., & Arno, J. (2003). Spatial econometric data analysis: moving beyond traditionalmodels. International Regional Science Review, 26(3), 223–243.
Fougère, D., Kramarz, F., Rathelot, R., & Safi, M. (2013). Social housing and location choices of immigrantsin France. International Journal of Manpower, 34(1), 56–69.
Fullaondo, A. and Garcia, P. (2007). Foreign immigration in Spain: towards multi-ethnic metropolises.European Network of Housing Research Conference, Rotterdam.
Funkhouser, E. (2000). Changes in the geographic concentration and location of residence of immigrants.International Migration Review, 34(2), 489–510.
Gabriel, S. A., & Painter, G. D. (2012). Household location and race: a 20‐year retrospective. Journal ofRegional Science, 52(5), 809–818.
Galeano, J., Sabater, A., & Domingo, A. (2014). Formació i evolució dels enclavaments ètnics a Catalunyaabans i durant la crisi econòmica. Document d’Anàlisi Geogràfica, 60(2), 261–288.
Gilliland, J., & Olson, S. (2010). Residential segregation in the industrializing city: a closer look. UrbanGeography, 31(1), 29.
González, V. (2005). Novedades en el censo de la población de España 2001. Cuadernos geográficos, 36, 15–33.
Gonzalez, L., & Ortega, F. (2013). Immigation and housing booms: evidence from Spain. Journal of RegionalScience, 53(1), 37–59.
Grant, H., & Sweetman, A. (2004). Introduction to economic and urban issues in Canadian immigrationpolicy. Canadian Journal of Urban Research, 13(1), 1–24.
INE (2008) Municipal Register, 2001–2008.Johnston, R., Forrest, J., & Poulsen, M. (2001). The geography of an EthniCity: residential segregation of
birthplace and language groups in Sydney, 1996. Housing Studies, 16(5), 569–594.Kandylis, G., Maloutas, T., & Sayas, J. (2012). Immigration, inequality and diversity: socio-ethnic
hierarchy and spatial organization in Athens, Greece. European Urban and Regional Studies, 19(3),267–286.
Lazrak, F., Nijkamp, P., Rietveld, P., & Rouwendal, J. (2013). The market value of cultural heritage in urbanareas: an application of spatial hedonic pricing. Journal of Geographical Systems, 1–26.
LeSage, J. P., & Pace, R. K. (2009). Introduction to spatial econometrics. Boca Raton: CRC Press.Lichter, D. T., Parisi, D., Taquino, M. C., & Grice, S. M. (2010). Residential segregation in new Hispanic
destinations: cities, suburbs, and rural communities compared. Social Science Research, 39(2), 215–230.
Madariaga, R. Martori, J.C. and Oller, R. (2012). Distribución espacial y desigualdad de la renta salarial en elárea Metropolitana de Barcelona. Scripta Nova: Revista Electrónica De Geografía y Ciencias Sociales16.
Malheiros, J., & Vala, F. (2004). Immigration and city change: the Lisbon metropolis at the turn of thetwentieth century. Journal of Ethnic and Migration Studies, 30(6), 1065–1086.
Martori, J. C., & Apparicio, P. (2011). Changes in spatial patterns of the immigrant population of a southernEuropean metropolis: the case of the Barcelona metropolitan area (2001–2008). Tijdschrift VoorEconomische En Sociale Geografie, 102(5), 562–581.
Martori, J. C., & Hoberg, K. (2008).New techniques of spatial statistics for the detection of residential clustersof immigrant populations. Barcelona: Universitat de Barcelona.
Massey, D. S., & Denton, N. A. (1988). The dimensions of residential segregation. Social Forces, 67(2), 281–315.
Mendoza, C. (2013). Explaining urban migration fromMexico City to the USA: social networks and territorialattachments. International Migration.
Understanding Immigrant Population Growth Within Urban Areas
Miret, N., & Serra del Pozo, P. (2013). El papel de la inmigración extranjera en el cambio social y urbano delBesòs i el Maresme, un barrio periférico de Barcelona. Interrogaciones a partir de un estudio exploratorio.Estudios Geográficos, 74(274), 193–229.
Mur, J., & Angulo, A. (2009). Model selection strategies in a spatial setting: some additional results. RegionalScience and Urban Economics, 39(2), 200–213.
Musterd, S., & Deurloo, R. (2002). Unstable immigrant concentrations in Amsterdam: spatial segregation andintegration of newcomers. Housing Studies, 17(3), 487–503.
Newbold, K. B. (1999). Spatial distribution and redistribution of immigrants in the metropolitan United States,1980 and 1990. Economic Geography, 75(3), 254–271.
Painter, G., & Yu, Z. (2010). Immigrants and housing markets in mid-size metropolitan Areas. TheInternational Migration Review IMR, 44(2), 442–476.
Partridge, M. D., Boarnet, M., Brakman, S., & Ottaviano, G. (2012). Introduction: whither spatial economet-rics? Journal of Regional Science, 52(2), 167–171.
Peach, C. (2009). Slippery segregation: discovering or manufacturing ghettos? Journal of Ethnic andMigration Studies, 35(9), 1381–1395.
Piras, G. (2010). Sphet: spatial models with heteroskedastic innovations. Journal of Statistical Software, 35(1),1–21.
Portes, A., & Zhou, M. (1993). The new second generation: segmented assimilation and its variants. TheAnnals of the American Academy of Political and Social Science, 530(1), 74–96.
Poulsen, M., Forrest, J., & Johnston, R. (2002). From modern to post-modern? Contemporary ethnicresidential segregation in four US metropolitan areas. Cities, 19(3), 161–172.
Qadeer, M. (2010). Evolution of ethnic enclaves in the Toronto metropolitan area, 2001–2006. Journal ofInternational Migration and Integration, 11(3), 315–339.
Rebelo, E. M. (2012). Work and settlement locations of immigrants: how are they connected? The case of theOporto Metropolitan Area. European Urban and Regional Studies, 19(3), 312–328.
Rogers, A., & Henning, S. (1999). The internal migration patterns of the foreign-born and native-bornpopulations in the United States: 1975–80 and 1985–90. International Migration Review, 33(2), 403–429.
Sampson, R. J., Morenoff, J. D., & Gannon-Rowley, T. (2002). Assessing “neighborhood effects”: socialprocesses and new directions in research. Annual Review of Sociology, 28, 443–478.
Schelling, T. C. (1969). Models of segregation. The American Economic Review, 59(2), 488–493.Simon, H., Sanroma, E., & Ramos, R. (2008). Labour segregation and immigrant and native-born wage
distributions in Spain: an analysis using matched employer-employee data. Spanish Economic Review,10(2), 135–168.
Theil, H., & Finizza, A. J. (1971). A note on the measurement of racial integration of schools by means ofinformational concepts. The Journal of Mathematical Sociology, 1(2), 187–193.
van Kempen, R., & Ozuekren, A. S. (1998). Ethnic segregation in cities: new forms and explanations in adynamic world. Urban Studies, 35(10), 1631–1656.
Wadsworth, J. (2010). The UK labour market and immigration. National Institute Economic Review, 213(1),R35–R42.
Walks, R., & Bourne, L. S. (2006). Ghettos in Canada’s cities? Racial segregation, ethnic enclaves and povertyconcentration in Canadian urban areas. The Canadian Geographer/Le Géographe Canadien, 50(3), 273–297.
Weidmann, N.B. and Salehyan, I. (2013). Violence and ethnic segregation: a computational model applied toBaghdad. International Studies Quarterly.
White, M. J., Kim, A. H., & Glick, J. E. (2005). Mapping social distance ethnic residential segregation in amultiethnic metro. Sociological Methods & Research, 34(2), 173–203.
Wright, R., Ellis, M., & Parks, V. (2005). Re‐placing whiteness in spatial assimilation research. City andCommunity, 4(2), 111–135.
Yue, Z., Li, S., Jin, X., & Feldman, M. W. (2013). The role of social networks in the integration of Chineserural–urban migrants: a migrant–resident tie perspective. Urban Studies, 50(9), 1704–1723.
Zavodny, M. (1997). Welfare and the locational choices of new immigrants. Economic Review-FederalReserve Bank of Dallas:, 2–10.
Zavodny, M. (1999). Determinants of recent immigrants’ locational choices. International Migration Review,33(4), 1014–1030.
Zorlu, A., & Mulder, C. (2008). Initial and subsequent location choices of immigrants to the Netherlands.Regional Studies, 42(2), 245.
J.C. Martori et al.
Related Documents