Understanding FDI and its impact in the United Kingdom Understanding FDI and its impact in the United Kingdom for DIT's investment promotion activities and services Phase 2 Analytical report Publication date: 5 th March 2021

Welcome message from author
This document is posted to help you gain knowledge. Please leave a comment to let me know what you think about it! Share it to your friends and learn new things together.
Transcript
Understanding FDI and its impact in the United Kingdom
Understanding FDI and its impact in the United Kingdom for DIT's investment promotion activities and services Phase 2 Analytical report
Publication date:
5th March 2021

Understanding FDI and its impact in the United Kingdom
2
Summary
This report builds on the first phase of DIT’s analysis to further explore how inward FDI affects the British economy.
Details
This analytical report further develops DIT’s understanding of how inward FDI affects the British economy, which is a vital step in realising DIT’s vision of a value-driven investment promotion strategy. The report develops a good understanding of distribution of FDI activities in the UK regions. Building on the first phase of DIT’s analysis, the updated methodology estimates the economic impact using employment created by Foreign Direct Investment in the UK, which will be referred to hereafter as ‘foreign employment’ as a measure of FDI to reflect changing industrial composition. It also enhances the model’s ability to capture the economy wide impacts of FDI on Gross Value Added (GVA).
Research Authors:
Anuj Joshua Mathew, Kenneth Koo, Emma Hatwell, Miles Johnson, Sami Hamroush, Matthew Needham and Tord Johnsen (Department for International Trade).
Acknowledgements:
The analysis covered in the report was undertaken in partnership with London Economics, and the authors would like to acknowledge the analytical contributions of Laura Koch and Patrice Muller.
The Department expresses gratitude to Professor Davide Castellani for peer reviewing the analysis and for his insightful comments and guidance on the analysis.
ONS Disclaimer
This work contains statistical data from ONS which is Crown Copyright. The use of the ONS statistical data in this work does not imply the endorsement of the ONS in relation to the interpretation or analysis of the statistical data. This work uses research datasets which may not exactly reproduce National Statistics aggregates.

Understanding FDI and its impact in the United Kingdom
3
Contents
Table of Contents
Main Points 6
Executive summary 7
Section 1: Introduction 9
1.1 Foreign direct investment 9
1.2 Measuring FDI in the UK 10
1.3 Distribution of FDI in the UK 11
1.4 DIT and FDI in the UK 15
Section 2: A New Measure of FDI 16
2.1 Analysing the economic impact of FDI 16
Section 3: Economic impact factors 18
3.1 Gross value added (GVA) 18
3.2 Employment 18
3.3 Average wages 19
3.4 Apparent labour productivity (ALP) 19
Section 4: Analytical approach 21
4.1 Methodology 21
4.1.3 Inter-sectoral GVA impacts methodology 24
Section 5: Data sources 28
5.1 Data for measures of FDI 28
5.2 Data for impact and Control Measures 29
5.3 Data Transformation 29
5.4 Evaluation Series 29
Section 6: Results 30
6.1 Overview of model estimates 30
6.2 Evaluation 33
6.2.1 Sectoral approach 33
Section 7: Application of methodology to projects supported by DIT 38
7.1 Identifying eligible FDI transactions 38
7. 2 Estimating GVA from DIT supported FDI transactions 38
Section 8: Conclusion 39
8.1 Summary 39
8.2 Limitations and further research 39

Understanding FDI and its impact in the United Kingdom
4
Annexes 46
Annex A – FDI Breakdown into NUTS2 Regions 46
Annex B – Baseline Econometric estimates 48
Annex C – Criteria for FDI project 54
Figures
Figure 1 – Spatial Distribution of UK FDI 11
Figure 2 – Foreign-owned MNE activity as a percentage of total activity by Region (NUTS1), 2018 12
Figure 3 – Methodology for Intersectoral impacts 26
Figure 4 – Capital Labour ratios 34
Figure 5 – Evaluated impact of an increase in FDI on GVA 36
Figure 6 – Evaluated impact of an increase in FDI on Employment 37
Figure A1 – Foreign-owned MNE activity as a percentage of total activity by Region (NUTS2), 2018 47
Tables
Table 1 – Estimated coefficients 30
Table 2 – Sector-specific evaluated results 35
Table A2 – GVA: baseline econometric estimates - Employment 49
Table A3 – GVA: baseline econometric estimates - Capital 50
Table A4 – Employment: baseline econometric estimates - Capital 51
Table A5 – Average annual wages: baseline econometric estimates - Employment 52
Table A6 – Average annual wages: baseline econometric estimates - Capital 53
Table A7 – ALP: baseline econometric estimates - Employment 54
Table A8 – FDI project eligibility tests 55
Table A9 – FDI project verification test 55

Understanding FDI and its impact in the United Kingdom
5
Equations Equation 1 – Econometric specification 22
Equation 2 – Evaluation equation for Great Britain 23
Equation 3 – Sector-specific evaluation equation 23
Equation 4 – Inter-sectoral: Input sector proportions 25
Equation 5 – Inter-sectoral: Incremental Ouptut 25
Equation 6 – Inter-sectoral: Incremental Demand 25
Equation 7 – Inter-sectoral: Incremental GVA Change 25
Equation 8 – Inter-sectoral: Total Inter-sectoral GVA Impact in Sectoro 26
Equation 9 – Inter-sectoral: Total GVA Impacts 26

Understanding FDI and its impact in the United Kingdom
6
Main Points
1. The first phase of DIT’s FDI impact analysis, published in 2018, sought to identify how, when and where the positive impacts from inward FDI occurs in order to effectively streamline and target DIT’s FDI related activities in those sectors where the economic impact is highest.
2. Whilst the above report focused solely on the impact of FDI as measured by capital-expenditure of the foreign investment, in the current report, we also estimate the economic impact using employment by foreign firms as a measure. This additional measure is developed in recognition of changing nature of foreign investments with certain industries evolving to be more physical asset-light in nature and increasing prominence of intangible forms of business investments. These changes, along with the emergence of digital economy have enhanced the newfound ability of firms to access the international market with a much smaller “asset footprint locally.
3. Furthermore, whilst the first phase focused mainly on the impacts within the sector FDI occurred, in the current report we have enhanced the model to also capture the economy wide impacts for Gross Value Added (GVA). This wider impact estimation enables a holistic understanding of the impact of foreign investment in the economy through supply chain effects.
4. Our analysis shows that, overall a 1% increase in FDI stock in Great Britain has on average resulted an increase in GVA of 0.094% via the capital measure and 0.24% via the employment measure; an increase in employment of 0.084%; an increase in average annual wages of 0.045% via capital and 0.11% via employment and an increase in labour productivity of 0.031%. Where earlier analysis was undertaken in a similar scope, we see that our results are broadly consistent and comparable.
5. Translating the coefficients for GVA and employment for operational purpose so as to support public policy, on average a £1 million FDI project into Great Britain leads to a net increase in national levels of GVA of around £98,000 and a net increase in employment of around 2.9 jobs. Similarly, translating the employment-based coefficient, we see that a unit increase in employment at a foreign firm produces an increase in GVA of £212,000.
6. Applying this analysis, for the financial year 2019 to 2020, where DIT supported 1,449 FDI projects, it is estimated that these FDI projects generated approximately £2.8 bn of GVA over the next three years.
7. The report’s analytical findings will be applied to be an enabling guide for DIT to target projects with the highest predicted economic impact value and to estimate and report the long-term potential impact of FDI A further application of the analytical finding is to inform the development of departmental performance metrics in FDI with a focus on economic impact and value addition to support internal and external reporting of DIT’s performance in FDI.
8. The report also explored the spatial distribution of foreign-owned multinationals across the UK to better understand their contributions to local economies in the UK. Our analysis shows that, while just 4% of local business units in the UK were foreign owned in 2018, they accounted for nearly 40% of UK business turnover and employed 4.9 million people. Furthermore, while the activities of foreign multinationals are concentrated in certain regions, they accounted for between 12% and 21% of local business employment in all twelve regions of the UK.

Understanding FDI and its impact in the United Kingdom
7
Executive summary
1. The analytical report builds on our first phase analysis to further explore how inward FDI affects the British economy. This is a vital step in realising DIT’s vision of a value-driven investment promotion strategy. By identifying the nature of the economic value in FDI, the report provides a basis to develop a coherent and value-based investment promotion strategy.
2. The first phase of our FDI impact analysis focused solely on the impact of FDI as measured by capital-based foreign investment. In this update we include an employment-based measure of FDI, so as to estimate the impact of an increase in employment by foreign firms. This is due to the changing nature of investments as certain industries are evolving to become more asset-light in nature. These changes have enhanced the newfound ability of firms to access the international market with a much smaller “asset footprint locally.
3. Further, in conjunction with other additions to the Economic Impact Framework, we undertake analysis capturing inter-industry impacts on Gross value addition (GVA). This is to develop further understanding of the broader impacts, as opposed to the previous values which concentrate on intra-industry (within the FDI sector) impacts.
4. The overall impact of FDI is two-fold, including both direct and an indirect impacts. This analysis focuses on the effects on existing firms in Great Britain, rather than the effect that the new entrant has on the economy directly. While the analysis focuses on Great Britain, it’s results are also applicable to the UK due to the small difference in total investment.
5. We find that inward FDI has a net positive effect on Great Britain’s economy. At a national level, we find that FDI improve all four of our key economic impact factors. A 1% increase in FDI in Great Britain, on average results in an increase in GVA of 0.094% via the capital and 0.24% via the employment measures. An increase of 1% in FDI capital increases employment and annual wages by 0.084% and 0.045% respectively, and a 1% increase in FDI employment increases annual wages by 0.11%. Finally we also found that a 1% increase in FDI employment increases labour productivity by 0.031%.
6. We then translate the coefficients for GVA and employment for operational purposes so as to support public policy. On average a £1 million FDI project into Great Britain leads to a net increase in national GVA of around £98,000 (including inter-sectoral impacts). It also leads to a net increase in employment of around 2.9 jobs. Similarly, translating the employment-based coefficient, a unit increase in employment at a foreign firm produces an increase in GVA of £212,000 (including inter-sectoral impacts). Where earlier analysis was undertaken in a similar scope, we see that our results are broadly consistent and comparable.
7. The analysis provides justification for the department’s commitment to the value-driven investment promotion strategy, by establishing in specific terms the value-adding properties of FDI. The estimates of impact across sectors allows for directed policymaking, designed to maximise the impact of investment promotion through identification of high-value areas or industries.
8. Our analysis now offers a more comprehensive overview of how changes in inward FDI affect the economy due to enhancements since Phase 1. However, there are still some limitations and possible future extensions worth noting:
• Our current analysis is unable to identify varying impacts of FDI based on the type of investment, for example, greenfield, brownfield, M&As and expansions. We are also unable

Understanding FDI and its impact in the United Kingdom
8
to distinguish the regional British impact of FDI and variations within. Work is currently underway to develop our understanding in both these areas.
• Current analysis only looks at the effect of FDI on Great Britain due to data availability. Additionally, the ARDx data used has not been updated beyond 2014 by ONS.
• Our evaluation method currently assumes that the relationship between FDI and the economic impact variables discussed is same for each sector.
• When translating for operational purposes so as to support public policy, the method of deciding the appropriate FDI measure for each sector is rudimentary. Further development of our sectoral understanding will allow us to adapt these allocations as needed.
• The inter-sectoral impacts assume that firms that receive FDI would operate in the same way as domestic firms. This approach of assuming the same level of technology for both domestic and foreign firms is expected to be conservative estimation of the impact. This is due to businesses receiving foreign investment tend to be more productive than domestic businesses1.
• The current analysis assumes the interactions between the sectors have a constant rate of returns to FDI. The level of input from other sectors may not scale directly with increased output in the FDI sector.
• As highlighted within the methodology, the inter-sectoral analysis is based on data from 2016, which is the latest data available.
• The inter-sectoral impacts are most applicable to averages. This means this might be not appropriate for specific businesses.
• Further detail on limitations are included in the report and we intend to address some of these issues in further phases of the analysis.
9. Given the limitations of the model and the continued work to improve on it, the analysis and the results should be treated as experimental in nature.
10. The analysis also explored the spatial distribution of foreign-owned multinationals and their activities across the UK to better understand their contributions to local economies. Our analysis shows that, while just 4% of local business units in the UK were foreign owned in 2018, they accounted for nearly 40% of UK business turnover and employed 4.9 million people. Furthermore, while the activities of foreign multinationals are concentrated in certain regions, they accounted for between 12% and 21% of local business employment in all twelve regions of the UK.
1. Office for National Statistics, 2020, UK foreign direct investment, trends and analysis: August 2020

Understanding FDI and its impact in the United Kingdom
9
Section 1: Introduction
While the main analysis of this report focuses on the impact of FDI in Great Britain, in Section 1 we provide context as to the role of FDI in the UK as a whole.
1.1 Foreign direct investment Foreign direct investment (FDI) refers to cross-border investments from one country into another, with the aim of establishing a lasting interest in an enterprise where the investor’s purpose is to have an effective voice in the management of the enterprise. For the purposes of FDI statistics, an effective voice means a 10% or more ownership of the equity share capital. From a UK perspective, inward FDI is an investment from foreign investors who add to or acquire equity share capital in a UK resident affiliate enterprise (subsidiary or associate) or branch by a non-UK parent company or head office.
FDI transactions take three main forms:
• New (‘Greenfield’)
• Expansions
• Merger and Acquisitions (M&As)
New investment projects are a type of FDI where a foreign investor starts a new business by establishing a new entity, setting up new offices, building, production or operational facilities in the UK. This type of investment directly contributes to capital formation through new capital expenditures, increases the output and generates employment and other benefits. New investments can be made by either an existing investor or a new investor.
Expansion investment projects are a type of FDI where an existing investor expands the production or operational facilities of an existing UK foreign direct enterprise with additional investments. Merger and Acquisition (M&A) projects are a type of FDI made by foreign investors to either merge with or acquire at least 10% of existing equity or assets of an existing UK company. A merger occurs when two or more companies agree to merge into a new single company rather than remain separated for creating business synergies. An acquisition is a transaction between two companies by which the acquiring company purchases the existing assets and liabilities of the target company. M&As are a common mechanism for entering a new market and are usually followed by new additional investments. As the government department responsible for the promotion and facilitation of inward investment, DIT aims to record and report information on all FDI projects successfully landing in the UK that have been assisted by the DIT network teams.
New jobs created and safeguarded are estimates over a three-year period. Job numbers are sourced from interactions with businesses and public announcements, and in the case of non-involved projects, calculated through algorithms used in external databases.
Data and information related to involved projects are self-reported by the DIT network and are recorded on an internal database. All parties involved in a project are responsible to enter the necessary data on to the system following agreed operating principles and eligibility criteria. The eligibility criteria for FDI projects can be found in Annex D.

Understanding FDI and its impact in the United Kingdom
10
1.2 Measuring FDI in the UK The UK inward FDI stock (International Investment position) measures the total financial value of FDI in the UK at a point in time (normally end of calendar year). The stock has the following main components:
• Foreign companies’ share capital and reserves
• Net amount due to foreign parents on the inter-company account
• Net amount due to foreign parents on the branch head-office account
Inward FDI flows (or transactions) show the net inward direct investments made during any reference period (quarterly and annually). FDI flows comprise of:
• Acquisitions or disposals of equity capital;
• Reinvested earnings and
• Inter-company debt and other capital.
The ONS also measures and reports the estimated value of FDI earnings foreign investors generate from their investments. The official statistics on FDI flow and FDI earnings form part of the Balance of Payments, while the FDI stock figures are reflected in the international investment positions.
The UK currently ranks second in the world for inward FDI stock globally (second only to the US), and also holds the largest FDI stock in Europe (UNCTAD 2020). Europe continues to be the dominant source of inward FDI stock in the UK (accounting for 56%). At an individual country level the USA has the largest share, accounting for just under a quarter of the stock of inward FDI in the UK (24.5%) in 2019 (Office for National Statistics 2019).
The insights in this chapter is drawn from ONS data for GVA2 and population3 and DIT analysis of the ONS Business Structural Database (BSD), accessed via the Secure Research Environment. The BSD is a comprehensive database capturing almost all businesses in the UK and is derived primarily from the ONS Inter-Departmental Business Register (IDBR), which in turn is based on data from Companies House, HMRC VAT and Pay As You Earn (PAYE) records, ONS surveys, and supplemented with commercial data from Dun & Bradstreet. Only very small businesses, such as the self-employed, are not found on the BSD.
To produce the statistics and insights covered in this chapter, we have analysed BSD data at a regional level. Within the BSD, data is readily available on employment, foreign ownership, and local units. Turnover data is only available at an enterprise level; therefore, we have apportioned turnover across local units according to the share of overall employees. One limitation of this is where the number of employees does not accurately reflect the share of turnover generated in the
2 https://www.ons.gov.uk/economy/grossvalueaddedgva/bulletins/regionalgrossvalueaddedbalanceduk/1998to2017
3 https://www.ons.gov.uk/file?uri=/peoplepopulationandcommunity/populationandmigration/populationestimates/datasets/populationestimatesforukenglandandwalesscotlandandnorthernireland/mid20182019laboundaries/ukmidyearestimates20182019ladcodes.xls
Understanding FDI and its impact in the United Kingdom
11
overall enterprise. Nevertheless, this approach does overcome the common challenge faced when conducting spatial analysis using only enterprise units, where economic activity is often over-inflated for regions that are home to headquarters and holding companies, even when only a small proportion of activity takes place there.
1.3 Distribution of FDI in the UK
1.3.1 The contributions of foreign multinationals to UK regions The role foreign investment plays in economic growth, productivity, and employment in the UK is substantial. However, its effect does vary across the country and studying the subnational distribution of FDI is important for understanding the true impact of FDI.
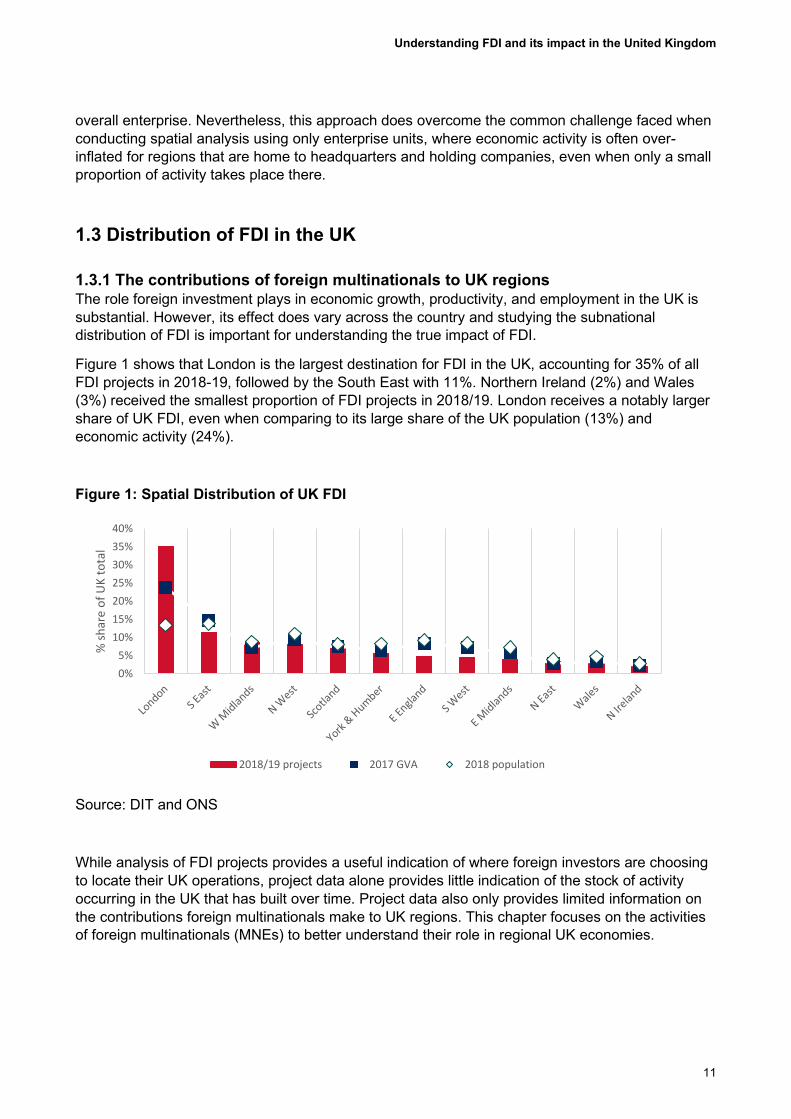
Figure 1 shows that London is the largest destination for FDI in the UK, accounting for 35% of all FDI projects in 2018-19, followed by the South East with 11%. Northern Ireland (2%) and Wales (3%) received the smallest proportion of FDI projects in 2018/19. London receives a notably larger share of UK FDI, even when comparing to its large share of the UK population (13%) and economic activity (24%).
Figure 1: Spatial Distribution of UK FDI
Source: DIT and ONS
While analysis of FDI projects provides a useful indication of where foreign investors are choosing to locate their UK operations, project data alone provides little indication of the stock of activity occurring in the UK that has built over time. Project data also only provides limited information on the contributions foreign multinationals make to UK regions. This chapter focuses on the activities of foreign multinationals (MNEs) to better understand their role in regional UK economies.
0%5%
10%15%20%25%30%35%40%
% sh
are
of U
K to
tal
2018/19 projects 2017 GVA 2018 population
Understanding FDI and its impact in the United Kingdom
12
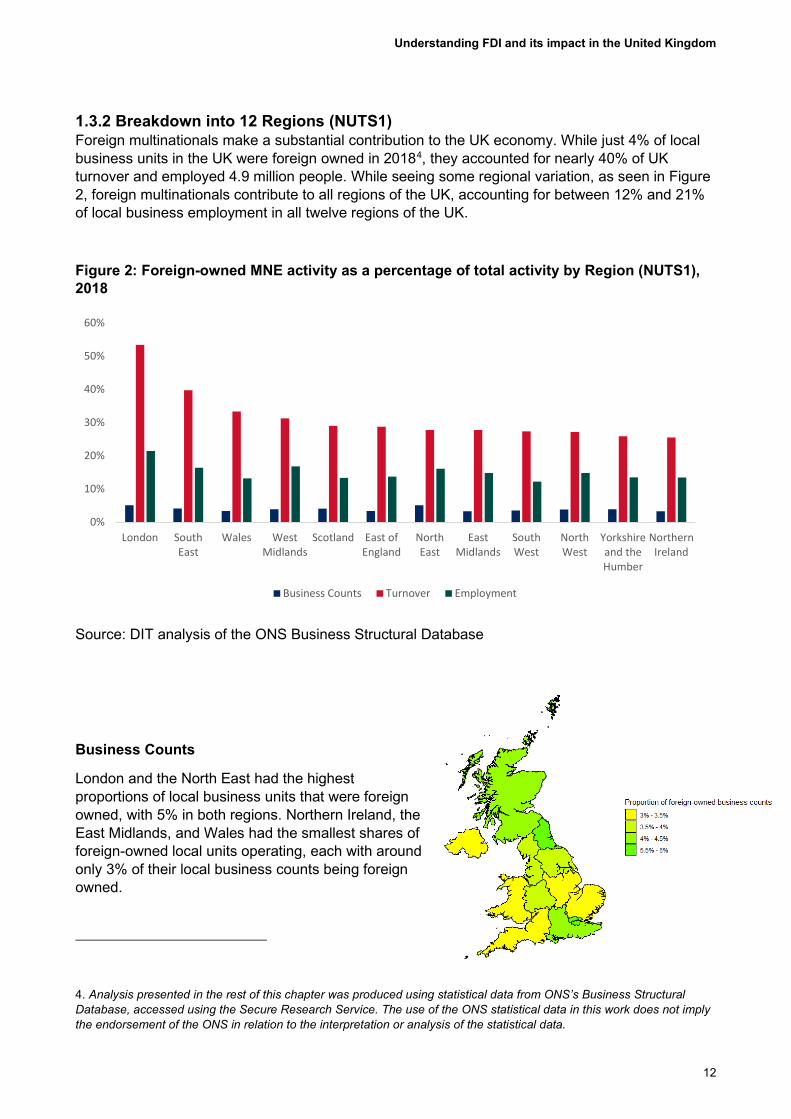
1.3.2 Breakdown into 12 Regions (NUTS1) Foreign multinationals make a substantial contribution to the UK economy. While just 4% of local business units in the UK were foreign owned in 20184, they accounted for nearly 40% of UK turnover and employed 4.9 million people. While seeing some regional variation, as seen in Figure 2, foreign multinationals contribute to all regions of the UK, accounting for between 12% and 21% of local business employment in all twelve regions of the UK.
Figure 2: Foreign-owned MNE activity as a percentage of total activity by Region (NUTS1), 2018
Source: DIT analysis of the ONS Business Structural Database
Business Counts
London and the North East had the highest proportions of local business units that were foreign owned, with 5% in both regions. Northern Ireland, the East Midlands, and Wales had the smallest shares of foreign-owned local units operating, each with around only 3% of their local business counts being foreign owned.
4. Analysis presented in the rest of this chapter was produced using statistical data from ONS’s Business Structural Database, accessed using the Secure Research Service. The use of the ONS statistical data in this work does not imply the endorsement of the ONS in relation to the interpretation or analysis of the statistical data.
0%
10%
20%
30%
40%
50%
60%
London SouthEast
Wales WestMidlands
Scotland East ofEngland
NorthEast
EastMidlands
SouthWest
NorthWest
Yorkshireand theHumber
NorthernIreland
Business Counts Turnover Employment

Understanding FDI and its impact in the United Kingdom
13
Turnover
The proportional of local business turnover accounted for by foreign MNEs is notably larger than business counts, indicating that, while few UK businesses are foreign owned, they tend to be much larger. Over half of business turnover generated by in London is accounted for by foreign-owned MNEs (53%), followed by the South East (40%) and Wales (33%). Northern Ireland (26%), Yorkshire and the Humber (26%) and the North West (27%) had the smallest shares of local business turnover generated by foreign MNEs.
Employment
The proportion of local business employment accounted for by foreign-owned MNEs varies from between 12% and 21% across the UK. The largest shares are in London (21%), followed by the West Midlands (17%) and the South East (16%). Foreign MNEs accounted for the smallest shares of local business employment in the South West (12%) and Wales (13%).
1.3.3 Breakdown into 42 Regions (NUTS2) While the previous section identified some variations in foreign MNEs’ activities across UK regions, splitting the UK into twelve broad regions can mask differences in activity at a more granular level. For example, while 13% of overall business employment in Scotland was accounted for by foreign MNEs in 2018, this rises to 20% for North Eastern Scotland.
Presenting the contributions of foreign-owned MNEs by 42 regions across the UK (see Annex A) highlights further variations in the contributions of multinationals to regional economies. Foreign multinationals account for at least a fifth of employment in five UK regions, and under 10% in four.

Understanding FDI and its impact in the United Kingdom
14
Business Counts
Inner London West has the highest proportion of local business units accounted for by foreign owned MNEs (over 9%). All other regions had a foreign-owned share of less than 6%, with only West Central Scotland, Tees Valley and Durham, and Northumberland and Tyne and Wear accounting for more than 5%.
Foreign MNEs in Outer London East & North East, Cumbria, Cornwall & Isles of Scilly, and Lincolnshire accounted for less than 3% of local business units in each region.
Turnover
MNEs accounted for the largest share of turnover in Inner London West, at almost 67% of local business turnover. MNEs accounted for just under half of local business turnover in Berkshire, Buckinghamshire, and Oxfordshire (49%). MNEs in North Eastern Scotland also made a large contribution to local business turnover at almost 44%.
Foreign MNEs in all other regions accounted for less than 40% of local business turnover. Regions with less than 20% of turnover accounted for by foreign MNEs were South Yorkshire, Cumbria, Highlands & Islands, Devon, and Cornwall & Isles of Scilly5.
5. Turnover data has been suppressed to mitigate disclosure East Yorkshire & Northern Lincolnshire, Outer London South, North Yorkshire, and Outer London East & North East.

Understanding FDI and its impact in the United Kingdom
15
Employment
Foreign multinationals accounted for 27% of business employment in Inner London West. Foreign multinationals also accounted for at over a fifth of business employment in Inner London East, Berkshire, Buckinghamshire & Oxfordshire, Outer London (West & North West), and North Eastern Scotland.
Business employment in Cornwall & Isles of Scilly, Highlands & Islands, Cumbria, Devon had the lowest proportions attributable to foreign MNEs, with less than 10% in each.
1.3.4 Summary of FDI in the UK Foreign-owned multinationals make a substantial contribution to the UK economy; while only 4% of local business units are foreign owned, they accounted for nearly 40% of UK business turnover and employed 4.9 million workers in 2018. However, the spread of activity by foreign-owned multinationals across UK regions is uneven, with some regions feeling the impacts of FDI more than others. According to literature, this is in part due to multinationals’ location decisions. Investors may choose to locate operations in certain regions over others based on factors such as the economic characteristics of a region (market size, education, infrastructure), costs, and historical connections. Forthcoming DIT research publications aim to further develop the evidence base around the drivers and barriers of subnational FDI.
Analysis in this section highlights that, while unevenly distributed, foreign MNEs contribute to economic activity across all parts of the UK, accounting for between 12% and 21% of local business employment in all twelve broad UK regions and devolved administrations. Analysis at a more granular level highlights that variations also exist within subnational regions and devolved administrations.
1.4 DIT and FDI in the UK DIT seeks to attract new FDI and help existing foreign-owned businesses to expand in the UK, offering services to new inward investors and foreign-owned businesses planning to expand their UK operations. DIT does so to help overcome a number of market failures, some of which prevent investment from landing in the UK given information asymmetries which could lead to potential investors to underestimate the benefit of an investment. Others relate to considering the broader benefits of investment to the economy from positive externalities which are not considered within an investor’s decision process.
DIT aims to increase foreign investment into the UK, and to prioritise support for those with the greatest quality using a framework made up of quantitative and qualitative indicators. Therefore, when considering the impact of FDI, it is important to consider not only the financial size of investment or pure FDI project numbers but also their economic impacts. This involves looking into the business nature, quality and other characteristics and suitability of the FDI project in generating positive impact. This is something we explored in the first phase of our analysis and have enhanced further in this report.

Understanding FDI and its impact in the United Kingdom
16
Section 2: A New Measure of FDI
The first phase of our FDI impact6 analysis focused solely on the impact of FDI as measured by capital-based foreign investment. In this update we include an employment-based measure of FDI. In this way, we estimate the impact of an increase in employment by foreign firms. This addition is primarily driven by the changing nature of investments as certain industries are evolving to become more asset-light in nature. For example, the rise of the sharing economy justifies the move away from capital expenditure as the sole indicator of FDI in a sector.7
Additionally, the UNCTAD World Investment Report (2017) identifies the ability of the digital economy in transforming the international operations of multi-national enterprises (MNEs). The digital economy now means that a physical presence in host countries is less necessary for foreign firms, and so affects the type of operations MNEs set up internationally. This is corroborated by Gestrin and Staudt (2018), who point out the newfound ability of firms to access the international market with a much smaller “asset footprint”. They go on to associate this capability with the appearance of micro-multinationals and born-global firms which can achieve a global reach with very little cross-border investments.
New technologies have allowed some businesses to execute novel international business models which allow them to build a global presence without large amounts of traditional FDI. However, it is unlikely that, at least for now, all sectors will feel the impact of the new technologies in the same way. The internationalisation strategies of more traditional sectors will still be heavily supported by conventional FDI. However, as time goes on and MNEs in such sectors like agri-business, real estate, construction, healthcare, professional services and retail build up their own digital capabilities, hybrid business models are likely to emerge which require less FDI (UNCTAD, 2017).
2.1 Analysing the economic impact of FDI As shown, FDI is considered to be an important contributor to economic growth due to its potential to enhance productivity and innovation, create employment and lead to several other benefits. FDI firms or firms receiving FDI generally tend to be more productive with access to better technology and management practices, which existing firms can benefit from through knowledge spillovers.
Although most macroeconomic studies support the positive impact FDI has on economic growth, linkage is identified on basis of specific factors such as the ‘absorptive’ capacity or supportive business environment in the host country. Identifying how, when and where the positive impacts from FDI occur is important as it enables effective streamlining and targeting of DIT’s services to promote FDI in those areas, regions, or sectors where the best value for money is attained.
This report discusses the econometric analysis undertaken to assess the impact FDI has on the identified economic impact factors on the basis of historical data on FDI in Great Britain between
6. Estimating the economic impact of FDI to support DIT’s promotion strategy: analytical report: https://www.gov.uk/government/publications/estimating-the-economic-impact-of-fdi-to-support-dits-promotion-strategy-analytical-report#:~:text=Based%20on%20an%20econometric%20model,the%20economic%20impact%20is%20maximised.
7. The sharing economy is a ‘socio-economic ecosystem’, constructed around the sharing of resources. This encompasses anything from on-demand technologies, such as Uber, to hospitality platforms, such as Airbnb (Kaushal, 2017). These platforms generally capitalize on the demand-supply gap with digital platforms, allowing them to decrease capital expenditure (Lim and Mack, 2018).

Understanding FDI and its impact in the United Kingdom
17
1998 and 2014. The findings from the analysis will be used to form baseline impact rates for each of these economic impact factors to assess the impact or value addition of future FDI projects. As in phase 1, the report retains a higher focus on the indirect as compared to direct effects of foreign direct investment due to a number of reasons. These include:
• More stable average impacts • Irreversibility of the indirect effects • Relation to externalities and therefore the justification for government intervention • The ability to use a much larger dataset and therefore produce more robust results
A more detailed explanation of these reasons may be found within the first publication.
The rest of the report is structured as follows: Section 3 introduces the economic impact factors that are scoped to be relevant in the context of FDI in Great Britain followed by Section 4 which details the analytical approach and methodology. Section 5 details the data sources that are used for the analysis, and Section 6 details the main results and their respective intuitions. Section 7 introduces the overall application of the Phase 2 methodology while Section 8 summarises the report and analytical findings with the limitations and recommendations for future research.
Understanding FDI and its impact in the United Kingdom
18
Section 3: Economic impact factors
As in the initial report, we focus on the relationships between FDI and specific economic variables, namely: GVA, employment, average annual wages, apparent and labour productivity (ALP)8.
3.1 Gross value added (GVA) What is GVA?
GVA, or Gross value added, is a measure of economic output, much like GDP. Indeed, GVA and GDP only differ in their treatment of taxation and subsidies when measuring output. For a given institutional unit, such as a business, household, or charity, GVA is a measure of the economic value generated by that unit.
It is estimated as the £ output of a unit (that is, the goods/services produced: for example, chairs, books, financial advice etc.) minus the purchases required to produce that output. By ‘purchases’, we refer to intermediate consumption; this constitutes of all the purchases a unit makes in the supply chain in order to produce their output.9 Examples of purchases could be: raw material inputs, like wood or metal; machinery used in production such as sewing machines or printing presses; or accountancy services purchased to maintain company accounts.
What are the channels through which FDI affects GVA?
Various studies such as Graham and Krugman (1993) and Girma, et al. (2001) show that firms undertaking FDI tend to be more productive than domestic firms. It is argued that they must be more productive to be able to overcome the sunk costs of moving to the new market and compete with domestic firms. This is empirically justified by studies from Girma, et al. (2001) and Lipsey and Sjoholm (2004). Upon entering the host economy, these highly productive foreign competitors exert two distinct influences on existing firms: a competitive pressure, and a demonstrative effect whereby domestic firms have an opportunity to appropriate advanced or more productive technologies (Girma, et al. 2001).
Our analysis estimating the indirect effect of FDI and explained in detail in the subsequent sections suggests that a 1% increase in FDI leads to a sectoral increase in GVA of 0.094% (capital expenditure-based measure) and 0.24% (employment-based measure). This suggests that the market in Great Britain possesses sufficient absorptive capacity for the effects of FDI on GVA to be expansionary as opposed to contractionary.
3.2 Employment Globally, the increase in FDI is also reflected by an increase in the number of jobs in the foreign affiliates of MNEs. Almost 80 million workers were employed by foreign affiliates of multinational companies in 2018, nearly triple the number in 1990 (UNCTAD, 2010, 2019). FDI into the UK in
8. Within the updated econometric framework, the results for R&D expenditure were found to be statistically insignificant and therefore we have not commented on the impacts with this report. This may partly be due to the fact that the variable was produced through matching with the BERD and therefore the impact variable was not as comprehensively populated. We will explore this further in future extensions to the project.
9. This does not include labour costs.

Understanding FDI and its impact in the United Kingdom
19
2019/20 created around 56,000 new jobs through 1852 projects, with over 78% of these projects landing in the UK as a result of DIT involvement (Department for International Trade 2020).10
What are the channels through which FDI affects employment?
Most of the literature suggests a positive direct effect of FDI on employment, although the extent of the effect varies, and in some instances can also result in negative impacts. The competition and demonstration effects of FDI on employment could be positive or negative depending on the characteristics of the entrant and the competing existing firms within the sector, mainly their ‘absorptive capacity’ and ultimate response in terms of output-generation.
Our analysis, explained in detail in the subsequent sections, suggests a positive impact of FDI in Great Britain. Specifically, we found that a 1% increase in FDI leads on average to an increase in employment of 0.084%, suggesting that the market in Great Britain possesses sufficient absorptive capacity for the effects of FDI on employment to be expansionary as opposed to contractionary.
3.3 Average wages What are the channels through which FDI affects the average wage rate?
Girma, et al. (2001) suggest that employees working for foreign firms tend to be more productive and have a higher marginal product, and as a result, are paid higher wages. An increase in wages as a result of FDI could also be due to the presence of market failures such as worker turnover and search frictions, and MNEs paying higher than average wages to attract the best workers from domestic firms (Girma, et al. 2001). However, as stated by Hale and Long (2012), analysis on the indirect effect of FDI on wages has failed to produce conclusive findings. Whilst most studies show that FDI has a positive impact on wages, a few indicate small negative effects.
Our analysis of the indirect effect of FDI on average annual wages, explained in detail in the subsequent sections, shows that a 1% increase in FDI leads on average to a 0.045% (capital expenditure based measure) and 0.11% (employment based measure) increase in average annual wages.
3.4 Apparent labour productivity (ALP) What is ALP?
Apparent Labour Productivity (ALP) is the efficiency of the workforce calculated as output per worker. Higher ALP brings about higher GDP for a given labour force. ALP can be driven by total factor productivity growth and capital enhancements.
What are the channels through which FDI affects ALP?
There are many academic studies investigating the relationship between FDI and productivity with spillovers often cited as the link between these concepts. Various studies such as Graham and Krugman (1993) show that firms undertaking FDI tend to be more productive than domestic firms. Barrell and Pain (1997) estimate that roughly 30% of the productivity growth in UK manufacturing between 1985 and 1995 has occurred because of FDI. It is argued that firms carrying out FDI must
10. The job figures are estimates over three years as reported by investors.

Understanding FDI and its impact in the United Kingdom
20
be more productive to be able to overcome the sunk costs of moving to the new market and compete with domestic firms.
FDI increases competition and hence productivity by forcing domestic firms to increase their efficiency to remain competitive with their foreign competitors, and/or by forcing unproductive firms to exit the market (Blomström (1986) and Griffith, et al. (2002)). Local firms can improve their operations by ‘imitating’ the FDI firms, who as argued by Girma, et al. (2001), are more productive, assuming that domestic firms are unable to fully appropriate all benefits of higher technology or capability.
Our analysis explained in detail in the subsequent sections shows that a 1% increase in FDI leads on average to a 0.031% increase in labour productivity.

Understanding FDI and its impact in the United Kingdom
21
Section 4: Analytical approach
4.1 Methodology The following sections describe the estimation methods for the indirect impacts of FDI. As discussed previously the methodology and subsequent results should be treated as experimental.
4.1.1 Indirect impact estimation Considering the indirect impact of FDI requires us to look at how the variable of interest changes in all firms (domestic and foreign) following FDI, that is, the spillovers generated by the investing foreign firm. As there is strong evidence in the literature that spillovers mainly occur through interactions in the supply chain, Javorcik (2004) for example finds positive productivity spillovers through the relations between foreign firms and domestic suppliers, our analysis focuses on intra-industry spillovers.
Regression analysis provides a powerful tool when estimating indirect effects. The following aspects need to be considered when defining the research methodology:
1. Omitted variables bias: Unobserved variables potentially hinder the identification of impacts in a regression, as there are likely to be a number of unobserved firm-, sector- and region-specific variables that drive any observed correlation between the impact variable and FDI. In order to address the omitted variables problem, firstly, fixed effects are applied to control for fixed firm-level unobserved variation. Secondly, sector- and region-specific dummy variables are included in the estimating equation such that sectoral and regional fixed effects are controlled for. In addition, in order to control for sectoral shocks, sector-level FDI variables are normalised by sector-level GVA. Regional employment, or region-time dummies for employment-related impact variables (such as employment), is also included to control for regional shocks.
2. Endogeneity may also be a concern. In the case of ALP for example estimates may be biased because FDI may be attracted to sectors that are already productive to benefit from knowledge spillovers. In our case the independent variable of interest, FDI, is a macro variable at sector-level, and therefore less likely to be affected by productivity at the firm-level (dependent variable).11 Furthermore, we incorporate lags of FDI as contemporary productivity shocks are less likely to have an influence on FDI decisions made in the past.
As discussed earlier, our initial analysis took only into consideration the economic impact of FDI based on the value of capital investment or the fixed cost of capital. This was a recognised limitation to our research due to the evolving nature of FDI in some industries. As discussed earlier, ‘Asset-light’ investments, as reported in UNCTAD (2017), have become a more prominent method of inward investment by foreign firms due to new modes of promotion and the emergence of the digital economy. As a result, focusing solely on the impact of capital expenditure by foreign firms could lead to the misrepresentation of FDI. Thus, our enhanced approach introduces a new employment-based measure of FDI to address this issue.
Other enhancements to the 2018 model includes taking the log of our main independent variable of interest, introducing a new employment-based measure of FDI, the removal and addition of relevant controls and the uniformization of lag structure across the estimations. Separately from
11 See chapter on data sources.

Understanding FDI and its impact in the United Kingdom
22
the specification estimating the indirect impact at sector level, we have also added further analysis to capture inter-sectoral impacts, which the report discusses in more detail further on.
Upon review, it was decided that our econometric model from 2018 was prone to overspecification for certain variables. For this reason, certain controls are removed from our current model. In addition, a new shock variable is introduced: regional GVA. This allows us to control for economic cycles and trends more uniformly across both our capital expenditure FDI and employment based FDI regression estimations. Moreover, lag structures were aligned for all economic impact variable estimations to a maximum lag length of 2 for the same reason.
The following econometric specification addresses the considerations above and is broadly in line with Haskel, et al. (2007) who have estimated the impact of FDI on UK productivity:
Equation 1 – Econometric specification
Here, 𝑦𝑦𝑖𝑖𝑖𝑖𝑖𝑖 is the outcome variable of firm 𝑖𝑖 in sector 𝑠𝑠 at time 𝑡𝑡, 𝑓𝑓𝑓𝑓𝑓𝑓𝑓𝑓𝑖𝑖𝑓𝑓𝑓𝑓 is a dummy variable indicating whether a firm is foreign-owned or not. The foreign ownership dummy controls for different levels of the outcome measure of foreign owned firms compared to domestically owned firms. 𝑭𝑭𝑭𝑭𝑭𝑭𝒔𝒔𝒔𝒔−𝒍𝒍 indicates the overall stock of FDI in sector 𝑠𝑠 at time 𝑡𝑡 lagged 𝑙𝑙 years for capex-assigned sectors. For sectors assigned the employment-based measure of FDI, 𝑭𝑭𝑭𝑭𝑭𝑭𝒔𝒔𝒔𝒔−𝒍𝒍 is instead the total employment of foreign-owned firms in sector 𝑠𝑠 at time 𝑡𝑡 lagged 𝑙𝑙 years. The natural log is taken for both measures to allow for the interpretation of the coefficient 𝑡𝑡 as an elasticity. This is the main variable of interest to derive the impact of the presence of FDI on the economic impact factor. It captures spillover effects of higher levels of FDI in a sector on firms in the same sector where the investment takes place as well as effects operating through the prices in same-sector factor and product markets. Impacts are derived as the sum of the coefficients on the logged FDI variables ∑ 𝜷𝜷𝒍𝒍 2
𝒍𝒍=0 .
The natural log of the domestic equivalent of the FDI measure (that is, capital stock or total domestic employment) in sector 𝑠𝑠 at time 𝑡𝑡 lagged 𝑙𝑙 years is also taken and included as a control variable. To control for cyclical shocks and trend conditions we incorporate a regional GVA control variable which captures the total GVA in the region firm 𝑖𝑖 is situated in at time 𝑡𝑡. Furthermore, sector and region dummies are included to account for sector- and region-specific effects. Finally, 𝑋𝑋 is a vector containing economic impact factor specific control variables for firm specific characteristics. As discussed earlier, the model was estimated using fixed effects to control for fixed firm-level unobserved variation, using cluster robust standard errors at the firm level.
Indirect effects are estimated at the sector level, therefore capturing intra-industry spillovers. If there are significant, positive (for example) inter-sectoral indirect effects, the true magnitude of indirect effects may be larger than the estimates yielded by the econometric analysis. As the sector groupings used are very broad, we ensure that spillovers between sectors of the same category including supply chains are captured. This approach, however, may not be the most suitable to comprehensively capture spillovers from the ‘financial services’ sector, which interacts with most
log(𝑦𝑦𝑖𝑖𝑖𝑖𝑖𝑖) = 𝑐𝑐𝑓𝑓𝑓𝑓𝑠𝑠𝑡𝑡 + 𝛼𝛼 ∙ 𝑓𝑓𝑓𝑓𝑓𝑓𝑓𝑓𝑖𝑖𝑓𝑓𝑓𝑓𝑖𝑖𝑖𝑖 + �𝜷𝜷𝒍𝒍 ∙ 𝒍𝒍𝒍𝒍𝒍𝒍(𝑭𝑭𝑭𝑭𝑭𝑭𝒔𝒔𝒔𝒔−𝒍𝒍) 𝟐𝟐
𝒍𝒍=𝟎𝟎
+ �𝛾𝛾𝑙𝑙 ∙ 𝑙𝑙𝑓𝑓𝑓𝑓(𝑑𝑑𝑓𝑓𝑑𝑑𝑓𝑓𝑠𝑠𝑡𝑡𝑖𝑖𝑐𝑐 𝑓𝑓𝑒𝑒𝑒𝑒𝑖𝑖𝑒𝑒𝑒𝑒𝑙𝑙𝑓𝑓𝑓𝑓𝑡𝑡𝑖𝑖𝑖𝑖−𝑙𝑙)2
𝑙𝑙=0
+ 𝜌𝜌 .𝑋𝑋𝑖𝑖𝑖𝑖 + 𝜃𝜃 ∙ 𝑓𝑓𝑓𝑓𝑓𝑓𝑖𝑖𝑓𝑓𝑓𝑓 𝐺𝐺𝐺𝐺𝐺𝐺𝑖𝑖𝑖𝑖 + 𝜅𝜅 ∙ 𝑠𝑠𝑓𝑓𝑐𝑐𝑡𝑡𝑓𝑓𝑓𝑓𝑖𝑖
+ 𝜆𝜆 ∙ 𝑓𝑓𝑓𝑓𝑓𝑓𝑖𝑖𝑓𝑓𝑓𝑓𝑟𝑟 + 𝜈𝜈 ∙ 𝑓𝑓𝑖𝑖𝑓𝑓𝑑𝑑𝑖𝑖 + 𝜉𝜉𝑖𝑖𝑖𝑖

Understanding FDI and its impact in the United Kingdom
23
other parts of the economy. Results referring to this sector should therefore be treated with caution.
4.1.2 Evaluation Estimation results represent the elasticity of the outcome variables to the exposure of sectoral FDI, that is, the percentage change in the variable following a 1% increase in the normalised (meaning in relation to the total amount) FDI stock. As the sectoral FDI stock and most economic impact factors, for example national and sectoral employment figures, are publicly available through the ONS, we can transform the obtained elasticities into pound values and estimate the change in the economic impact factor associated with £1 million FDI. This, we undertake for operational purposes so as to support public policy for GVA and Employment measures alone.
National
We transform our elasticity coefficients into absolute values using the following formula, denoting by 𝛽𝛽 the relevant coefficient for the variable being evaluated (for example 0.094 for GVA) and by 𝜇𝜇 the final, absolute value:
Equation 2 – Evaluation equation for Great Britain
𝛽𝛽𝐺𝐺𝑒𝑒𝑓𝑓𝑖𝑖𝑒𝑒𝑉𝑉𝑙𝑙𝑓𝑓1 × 𝐼𝐼𝑓𝑓𝑒𝑒𝑓𝑓𝑠𝑠𝑡𝑡𝑑𝑑𝑓𝑓𝑓𝑓𝑡𝑡 𝐺𝐺𝑒𝑒𝑙𝑙𝑒𝑒𝑓𝑓
𝐹𝐹𝐹𝐹𝐼𝐼1≡ 𝐺𝐺𝑒𝑒𝑓𝑓𝑖𝑖𝑒𝑒𝑉𝑉𝑙𝑙𝑓𝑓2 − 𝐺𝐺𝑒𝑒𝑓𝑓𝑖𝑖𝑒𝑒𝑉𝑉𝑙𝑙𝑓𝑓1 ≡ 𝜇𝜇
where: 𝐺𝐺𝑒𝑒𝑓𝑓𝑖𝑖𝑒𝑒𝑉𝑉𝑙𝑙𝑓𝑓1 = quantity of variable before investment𝐺𝐺𝑒𝑒𝑓𝑓𝑖𝑖𝑒𝑒𝑉𝑉𝑙𝑙𝑓𝑓2 = quantity of variable after investment𝐹𝐹𝐹𝐹𝐼𝐼1 = quantity of FDI before investment
When we say the quantity of the variable (for example GVA), or FDI, we mean the quantity across Great Britain as a whole. We can observe this value from ONS statistics for 𝐺𝐺𝑒𝑒𝑓𝑓𝑖𝑖𝑒𝑒𝑉𝑉𝑙𝑙𝑓𝑓1 and 𝐹𝐹𝐹𝐹𝐼𝐼1.This formula has been derived algebraically from the definition of elasticities, and can be thought of, not as an approximation or assumption, but as a mathematical identity.
Sectoral
For our sectoral results, we use our national coefficient estimates in combination with our evaluation procedure; this is equivalent to assuming that the estimated coefficient is identical across all sectors. As a result, we produce sectoral effects for a given sector (in this example imaginary sector ‘A’) using the following formula:
Equation 3 – Sector-specific evaluation equation
𝛽𝛽𝐺𝐺𝑒𝑒𝑓𝑓𝑖𝑖𝑒𝑒𝑉𝑉𝑙𝑙𝑓𝑓𝐴𝐴 × 𝐼𝐼𝑓𝑓𝑒𝑒𝑓𝑓𝑠𝑠𝑡𝑡𝑑𝑑𝑓𝑓𝑓𝑓𝑡𝑡 𝐺𝐺𝑒𝑒𝑙𝑙𝑒𝑒𝑓𝑓
𝐹𝐹𝐹𝐹𝐼𝐼𝐴𝐴= 𝜇𝜇𝐴𝐴
where: 𝐺𝐺𝑒𝑒𝑓𝑓𝑖𝑖𝑒𝑒𝑉𝑉𝑙𝑙𝑓𝑓𝐴𝐴 = quantity of variable in sector ‘A’ before investment𝐹𝐹𝐹𝐹𝐼𝐼𝐴𝐴 = quantity of FDI in sector ‘A’ before investment
Understanding FDI and its impact in the United Kingdom
24
The figures we require to compute this value are again available from official data sources of the ONS. We can see from inspection of this equation that our sectoral evaluation methodology captures two basic intuitions:
• The effect of an FDI occuring in the sector is decreasing in the stock of FDI present in that sector of Great Britain.
• The effect of an FDI occurring is increasing in the amount of the variable of interest (for example GVA) present in that sector of Great Britain.
Thus, the evaluation approach leads to a decreasing impact with increasing levels of FDI in the respective sector. This reflects the assumption of diminishing marginal returns to FDI. If a sector is already characterised by high levels of FDI, the additional impact of any further FDI project is expected to be limited. This is because existing firms are already exposed to MNEs, spillovers may have already been realised and the industry is saturated. On the other hand, lower the current stock of FDI in a sector, the higher the potential impact of a new FDI firm entering the market on existing firms.
Similarly, our approach leads to an increasing impact with increasing levels of the variable of interest in the sector. This reflects the assumption that sectors with high levels of our variable of interest will produce greater indirect effects, owing to the strength of the sector to produce that variable. For instance, consider a sector that employs a large number of workers; an FDI project landing in that sector is more likely to raise employment in existing firms than an investment into a sector with relatively low levels of employment.
Further discussion of the sectoral evaluation and the treatment of capital or labour intensive sectors for operational purposes are is discussed in section 6.2.
While the analysis focuses on Great Britain, it’s results are also applicable to the UK due to Northern Ireland making up a relatively small proportion of the total investment captured in the analysis.
4.1.3 Inter-sectoral GVA impacts methodology In conjunction with other additions to the Economic Impact Framework introduced in 4.1.1 we have also explored to capture the inter-industry impacts of increases in Gross Value Added (GVA). This is to attempt to capture the breadth of the impacts, as opposed to using the previous values which concentrates solely on intra-industry impacts. It is worth noting that this process is driven by the need to operationalise academic literature so that this can be adapted to support public policy.
To do so, analysis was undertaken on the latest release of the ONS’s Input-Output Analytical tables. These report the amount of input needed from all of the other sectors within the economy to produce the output within a single sector. Looking at all sectors in this way therefore helps provide a view of how all the sectors within the economy interact. The latest available information published in March 2020 refers to the year 2016.
To structure the analysis in a way which was compatible with our existing Economic Impact Framework which aggregated ONS sectors into 18 overall sector groupings, the same was done to the 64 sectors within the original Input-Output table. This was performed using the ‘Input-Output Table (Domestic Use at basic prices)’ so as to focus on the domestic interaction of sectors and to abstract from the use of imported products and materials in the generation of value added. This is done to provide a more accurate view on the interaction between sectors solely within the UK economy.

Understanding FDI and its impact in the United Kingdom
25
Using these, a value was generated for the proportion of input from each input sector as a percentage of total output in the Output Sector:
Equation 4 – Inter-sectoral: Input sector proportions
£ 𝑚𝑚𝑖𝑖𝑙𝑙𝑙𝑙𝑖𝑖𝑚𝑚𝑚𝑚 𝑓𝑓𝑟𝑟𝑚𝑚𝑚𝑚 𝐼𝐼𝑚𝑚𝐼𝐼𝐼𝐼𝑖𝑖 𝑆𝑆𝑆𝑆𝑆𝑆𝑖𝑖𝑚𝑚𝑟𝑟𝑖𝑖£ 𝑚𝑚𝑖𝑖𝑙𝑙𝑙𝑙𝑖𝑖𝑚𝑚𝑚𝑚 𝑇𝑇𝑚𝑚𝑖𝑖𝑇𝑇𝑙𝑙 𝑂𝑂𝐼𝐼𝑖𝑖𝐼𝐼𝐼𝐼𝑖𝑖 𝑖𝑖𝑚𝑚 𝑆𝑆𝑆𝑆𝑆𝑆𝑖𝑖𝑚𝑚𝑟𝑟𝑜𝑜
= % 𝑭𝑭𝑰𝑰𝑰𝑰𝑰𝑰𝒔𝒔 𝒇𝒇𝒇𝒇𝒍𝒍𝒇𝒇 𝑺𝑺𝑺𝑺𝑺𝑺𝒔𝒔𝒍𝒍𝒇𝒇𝒊𝒊 𝒍𝒍𝒇𝒇 𝑺𝑺𝑺𝑺𝑺𝑺𝒔𝒔𝒍𝒍𝒇𝒇𝒍𝒍
where the total of all the Input Sectors is the total intermediate consumption minus the use of imported products and taxes less subsidies within the output sector. Again, we disregard the use of imported products and taxes less subsidies to focus specifically on how sectors interact in terms of domestic production and value added.
The next step in the process is then to look at the proportion of overall GVA within the Output Sector in relation to the Total Output within that sector. This GVA proportion is used to then create a Total Output to GVA ratio, effectively converting the GVA impact of FDI from the previous analysis to an Incremental Output value:
Equation 5 – Inter-sectoral: Incremental Ouptut
1% 𝐺𝐺𝐺𝐺𝐺𝐺 𝑓𝑓𝑓𝑓 𝑇𝑇𝑓𝑓𝑡𝑡𝑒𝑒𝑙𝑙 𝑂𝑂𝑒𝑒𝑡𝑡𝑂𝑂𝑒𝑒𝑡𝑡 𝑖𝑖𝑓𝑓 𝑆𝑆𝑓𝑓𝑐𝑐𝑡𝑡𝑓𝑓𝑓𝑓𝑚𝑚
= 𝑭𝑭𝑰𝑰𝑺𝑺𝒇𝒇𝑺𝑺𝒇𝒇𝑺𝑺𝑰𝑰𝒔𝒔𝑰𝑰𝒍𝒍 𝑶𝑶𝑰𝑰𝒔𝒔𝑰𝑰𝑰𝑰𝒔𝒔
with Incremental Output representing the increase in output from an increase in a unit of GVA.
Converting to the Incremental Output then allows the use of the proportions of the Input Sectors to estimate the Incremental Demand to the Input Sectors by the Output Sector. This is done by simply multiplying the Input Sector proportion by the Incremental Output:
Equation 6 – Inter-sectoral: Incremental Demand
% 𝐼𝐼𝑓𝑓𝑂𝑂𝑒𝑒𝑡𝑡 𝑓𝑓𝑓𝑓𝑓𝑓𝑑𝑑 𝑆𝑆𝑓𝑓𝑐𝑐𝑡𝑡𝑓𝑓𝑓𝑓𝑖𝑖 𝑓𝑓𝑓𝑓 𝑆𝑆𝑓𝑓𝑐𝑐𝑡𝑡𝑓𝑓𝑓𝑓𝑚𝑚 × 𝐼𝐼𝑓𝑓𝑐𝑐𝑓𝑓𝑓𝑓𝑑𝑑𝑓𝑓𝑓𝑓𝑡𝑡𝑒𝑒𝑙𝑙 𝑂𝑂𝑒𝑒𝑡𝑡𝑂𝑂𝑒𝑒𝑡𝑡 = 𝑭𝑭𝑰𝑰𝑺𝑺𝒇𝒇𝑺𝑺𝒇𝒇𝑺𝑺𝑰𝑰𝒔𝒔𝑰𝑰𝒍𝒍 𝑭𝑭𝑺𝑺𝒇𝒇𝑰𝑰𝑰𝑰𝑫𝑫 𝒔𝒔𝒍𝒍 𝑺𝑺𝑺𝑺𝑺𝑺𝒔𝒔𝒍𝒍𝒇𝒇𝒊𝒊 𝒃𝒃𝒃𝒃 𝑺𝑺𝑺𝑺𝑺𝑺𝒔𝒔𝒍𝒍𝒇𝒇𝒍𝒍
The Incremental Demand to each Input Sector is then converted back into GVA terms by multiplying through by the GVA proportions once again sector by sector. This produces the Incremental GVA Change for each sector contributing toward overall total output, where an increase in a unit of output results in a change in GVA
Equation 7 - Inter-sectoral: Incremental GVA Change
𝐼𝐼𝑓𝑓𝑐𝑐𝑓𝑓𝑓𝑓𝑑𝑑𝑓𝑓𝑓𝑓𝑡𝑡𝑒𝑒𝑙𝑙 𝐹𝐹𝑓𝑓𝑑𝑑𝑒𝑒𝑓𝑓𝑑𝑑 𝑡𝑡𝑓𝑓 𝑆𝑆𝑓𝑓𝑐𝑐𝑡𝑡𝑓𝑓𝑓𝑓𝑖𝑖 𝑉𝑉𝑦𝑦 𝑆𝑆𝑓𝑓𝑐𝑐𝑡𝑡𝑓𝑓𝑓𝑓𝑚𝑚 × % 𝐺𝐺𝐺𝐺𝐺𝐺 𝑓𝑓𝑓𝑓 𝑇𝑇𝑓𝑓𝑡𝑡𝑒𝑒𝑙𝑙 𝑂𝑂𝑒𝑒𝑡𝑡𝑂𝑂𝑒𝑒𝑡𝑡 𝑖𝑖𝑓𝑓 𝑆𝑆𝑓𝑓𝑐𝑐𝑡𝑡𝑓𝑓𝑓𝑓𝑚𝑚= 𝑭𝑭𝑰𝑰𝑺𝑺𝒇𝒇𝑺𝑺𝒇𝒇𝑺𝑺𝑰𝑰𝒔𝒔𝑰𝑰𝒍𝒍 𝑮𝑮𝑮𝑮𝑮𝑮 𝑪𝑪𝑪𝑪𝑰𝑰𝑰𝑰𝒍𝒍𝑺𝑺 𝒇𝒇𝒇𝒇𝒍𝒍𝒇𝒇 𝑺𝑺𝑺𝑺𝑺𝑺𝒔𝒔𝒍𝒍𝒇𝒇𝒊𝒊 𝒊𝒊𝑰𝑰 𝑺𝑺𝑺𝑺𝑺𝑺𝒔𝒔𝒍𝒍𝒇𝒇𝒍𝒍

Understanding FDI and its impact in the United Kingdom
26
The Incremental GVA Change across all Input Sectors are then aggregated to produce the total additional GVA impact within an Output Sector, resulting in a multiplier value which captures the total inter-sectoral impacts on GVA in Sectoro:
Equation 8 - Inter-sectoral: Total Inter-sectoral GVA Impact in Sectoro
�𝐼𝐼𝑓𝑓𝑐𝑐𝑓𝑓𝑓𝑓𝑑𝑑𝑓𝑓𝑓𝑓𝑡𝑡𝑒𝑒𝑙𝑙 𝐺𝐺𝐺𝐺𝐺𝐺 𝑐𝑐ℎ𝑒𝑒𝑓𝑓𝑓𝑓𝑓𝑓 𝑓𝑓𝑓𝑓𝑓𝑓𝑑𝑑 𝑠𝑠𝑓𝑓𝑐𝑐𝑡𝑡𝑓𝑓𝑓𝑓𝑖𝑖 𝑖𝑖𝑓𝑓 𝑠𝑠𝑓𝑓𝑐𝑐𝑡𝑡𝑓𝑓𝑓𝑓𝑚𝑚
= 𝑻𝑻𝒍𝒍𝒔𝒔𝑰𝑰𝒍𝒍 𝒊𝒊𝑰𝑰𝒔𝒔𝑺𝑺𝒇𝒇 − 𝒔𝒔𝑺𝑺𝑺𝑺𝒔𝒔𝒍𝒍𝒇𝒇𝑰𝑰𝒍𝒍 𝑮𝑮𝑮𝑮𝑮𝑮 𝒊𝒊𝒇𝒇𝑰𝑰𝑰𝑰𝑺𝑺𝒔𝒔 𝒊𝒊𝑰𝑰 𝒔𝒔𝑺𝑺𝑺𝑺𝒔𝒔𝒍𝒍𝒇𝒇𝒍𝒍
The final step to incorporate these into the current FDI impact framework was to then apply the additional impacts to the econometrics coefficients focusing on the intra-sectoral impacts:
Equation 9 - Inter-sectoral: Total GVA Impacts
𝐼𝐼𝑓𝑓𝑡𝑡𝑓𝑓𝑒𝑒 − 𝑠𝑠𝑓𝑓𝑐𝑐𝑡𝑡𝑓𝑓𝑓𝑓𝑒𝑒𝑙𝑙 𝐺𝐺𝐺𝐺𝐺𝐺 𝑖𝑖𝑑𝑑𝑂𝑂𝑒𝑒𝑐𝑐𝑡𝑡𝑠𝑠 × (1 + 𝑇𝑇𝑓𝑓𝑡𝑡𝑒𝑒𝑙𝑙 𝑖𝑖𝑓𝑓𝑡𝑡𝑓𝑓𝑓𝑓 − 𝑠𝑠𝑓𝑓𝑐𝑐𝑡𝑡𝑓𝑓𝑓𝑓𝑒𝑒𝑙𝑙 𝐺𝐺𝐺𝐺𝐺𝐺 𝑖𝑖𝑑𝑑𝑂𝑂𝑒𝑒𝑐𝑐𝑡𝑡𝑠𝑠) = 𝑻𝑻𝒍𝒍𝒔𝒔𝑰𝑰𝒍𝒍 𝑮𝑮𝑮𝑮𝑮𝑮 𝑭𝑭𝒇𝒇𝑰𝑰𝑰𝑰𝑺𝑺𝒔𝒔𝒔𝒔
This overall process as above is summarised in figure 3 below into 4 overall areas12:
1. Interaction between sectors
2. The inputs needed from all other sectors to produce an extra unit
3. Increase in total GVA due to extra inputs
4. And finally the resultant inter-sectoral impacts
12 This approach of estimating eonomy wide impacts was undertaken both by the US Export-Import Bank as well as by UK Export Finance to estimate the impacts on jobs supported by their export support services

Understanding FDI and its impact in the United Kingdom
27
Figure 3 – Methodology for Inter-sectoral impacts

Understanding FDI and its impact in the United Kingdom
Section 5: Data sources
The sample for this analysis is constructed using firm level panel data from the Annual Respondents Database X. The principle dataset used within this analysis is therefore populated with 852,420 observations spanning 17 years’ worth of business survey and administrative data in Great Britain. The dataset covers the periods of 1998-2014 which represents the entirety of the range of years currently available for the ARDx.
The Annual Respondents Database X (ARDx) is a dataset created using two ONS surveys, the Annual Business Inquiry (ABI; 1998-2008) and the Annual Business Survey (ABS; 2009 onwards). The ABI consists of an employment survey and a second survey for financial information. The ABS only collects financial data, and so is supplemented with employment data from the Business Register and Employment Survey (BRES; 2009 onwards). The business unit to which these questionnaires are sent is at the reporting unit level. Other than for a minority of larger business or businesses which have a more complex structure, the reporting unit is the same as the enterprise. Around 95% of the reporting units in the data have only one local unit - that is, they are single-site businesses.
The ARDx sample frame covers businesses in all parts of the economy except those that do not meet the VAT turnover thresholds. This includes very small businesses, businesses without employees, and those with low turnover in addition to some non-profit organisations and the self-employed. The ARDx contains data on approximately 50,000 businesses in Great Britain each year. The ARDx is not populated with business data from the Northern Ireland region.
The ARDx contains response data on a range of measures including approximate gross value added, total employment costs, capital expenditure. It is also supplemented with administrative data on employment, type of business, turnover, Standard Industrial Classification (SIC), geographical location, and ownership from the Inter-Departmental Business Register (IDBR).
The inter-sectoral analysis was performed using the United Kingdom Input-Output Analytical Tables, 2016, published in early 2020 by the ONS13 and itself derived from annual Supply and Use tables.
5.1 Data for measures of FDI14 The analytical approach using the capex-based measure of FDI seeks to understand the impact of £1m of Foreign Direct Investment. This measure of FDI is constructed using data from national statistics produced by the Office for National Statistics (ONS) which detail inward FDI positions by industrial activity. OECD’s ‘FDI positions by industry’ data is used to back cast the ONS series for sectors where data is not available for the whole period.
The second estimation approach in this analysis seeks to understand the impact of 1 job by foreign owned businesses. This measure is constructed by calculating the share of employment by foreign owned businesses in a variant of the ARDx, the ARDx register panel, and applying these shares to total industry jobs figures taken from the ONS’s Workforce Jobs national statistics. The register panel
13 ONS - UK input-output analytical tables - industry by industry: https://www.ons.gov.uk/economy/nationalaccounts/supplyandusetables/datasets/ukinputoutputanalyticaltablesindustrybyindustry
14 All macro series of data sources were collected and accessed in 2016/17 and may have been subject to revision. Please also note that the OECD STAN database frequently revises figures and so current figures may not correspond to those used in this analysis.
Understanding FDI and its impact in the United Kingdom
29
dataset captures the whole business ‘universe’; featuring those businesses that have responded to the ABI/ABS surveys, those that have not responded, and those that are out of scope.
Accordingly, the register panel contains a much smaller pool of variables and is mostly sourced from administrative data from the IDBR.
5.2 Data for impact and Control Measures The impact measures explored in this analysis include firm-level gross value added (GVA), employment, average wages and ALP. The first three are sourced directly from the ARDx. The labour productivity measure is constructed by calculating gross value added per employee.
Control measures used in this analysis include region, sector, age and ownership at firm-level, sectoral domestic capital stock, sector GVA, and region GVA. Data on firm level control measures are available in the ARDx. Within our macro series of control measures, sector domestic capital stock is produced using the ONS’s Volume Index of UK Capital Service’s (VICS) data, and a firm-level capital stock allocation exercise to produce domestic and foreign shares. GVA controls are sourced from the ONS’s Regional Gross Value Added (balanced) Experimental Statistics.
5.3 Data Transformation All financial figures have been deflated to 2013 prices15. This has been done using a variety of deflators including the ONS’s Producer Price Indices (PPI) and Services Producer Price Indices (SPPI), which track the quarterly changes in the prices received for products and services provided in the UK. As well as the Consumer Price Index, ONS capital stock deflators, ONS gross value-added chain volume measures, OECD STAN deflators, and Eurostat’s GDP deflators.
Moreover, in order to mitigate the effect of outliers in the analysis and following a series of robustness checks, a trimming exercise was undertaken to remove the top and bottom 5% of observations for the impact measures explored.
5.4 Evaluation Series As part of this analysis’s evaluation approach, sector and year macro variants of the impact measures explored are used to estimate the impact of £1m inward FDI or 1 foreign owned job. These figures, some of which already detailed in this note, have been collected from the below sources:
GVA: OECD Gross Value Added at factor costs from the STAN database.
Employment: ONS Workforce Jobs.
15 In order to incorporate and evaluate vertical spillovers, each estimation approach has also involved deploying the ONS’s 2013 Input-Output tables to calculate backwards and forwards FDI figures. We apply shares from the year 2013, which is the base year used when deflating all relevant variables.

Understanding FDI and its impact in the United Kingdom
30
Section 6: Results
In this section, we present the results of our analysis. We begin with an overview of our indirect impact model estimates, followed by a brief description of how these estimates are to be interpreted. Specifically, we highlight that our analysis produces estimates of the elasticities between FDI and our dependent variables, with this report focusing on the operational aspects of GVA and employment. Again, all results should be treated as experimental in nature.
6.1 Overview of model estimates
6.1.1 Indirect effects Having applied the methodology for the indirect impact estimation outlined in previous sections, and referring to Equation 1, we arrive at the following estimates for the elasticity of FDI with respect to the specified dependent variable of interest:
Table 1 – Estimated coefficients
FDI measure GVA Employment Average annual wages
ALP
Capex FDI 0.09441*** 0.08414*** 0.04477*** -
Employment FDI
0.24290*** - 0.10610*** 0.031288***
***, ** and * denote statistical significance of 1%, 5% and 10%.
These values indicate the percentage change in the respective variable following a 1% increase in FDI and are discussed below.
6.1.2 Gross Value Added (GVA) As indicated previously, the indirect impact of FDI on GVA is defined as the change in the GVA of firms already existing in Great Britain and operating in the same sector where the new FDI occured. As an example, if a £100 million FDI project results in the creation of an automotive manufacturing plant (a project landing in ‘transport equipment’), the indirect GVA impact of that project would be the additional GVA produced by existing operators in the ’transport equipment’ sector grouping. The addition of the inter-sectoral impacts also now captures the increased GVA in other sectors arising from the initial investment in Transport equipment.
Tables A2 and A3 in Annex B shows econometric results for our final model specification (Equation 1). The following firm-level controls were added to the specification described in equation 1 above: average employment costs and a dummy indicating whether the firm is foreign or not. We control for varying regional economic conditions by including regional employment as a variable.
The variable of interest (FDI) has a positive and statistically significant impact on output suggesting that indirect effects on GVA are present in Great Britain. We calculate the total value of the effect by combining the results for all lag lengths, which produces our final estimate for the total effect of FDI on GVA, an effect spread across 2 years’ worth of lags.
We find that a 1% increase in a capital expenditure-based measure of FDI results in an indirect increase in GVA of 0.09441% and a 1% increase in an employment-based measure of FDI results in an indirect increase in GVA of 0.24290%.
6.1.3 Employment
Understanding FDI and its impact in the United Kingdom
31
The indirect impact of FDI on employment is defined as the change in the number of employees working in firms already existing in Great Britain and operating in the same sector where the new FDI occured. As an example, if a £100 million FDI project results in the creation of an automotive manufacturing plant (that is, an FDI project landing in ‘transport equipment’). Here, the indirect employment impact of that project would be the additional workers employed by existing firms in the ‘transport equipment’ sector in response to the new FDI project.
Table A4 in Annex B shows econometric results for our final model specification using the capex-based measure of FDI. The only additional control variable that was added was a foreign ownership dummy. We control for regional shocks by using region GVA as a control.
Our final estimated coefficient is 0.08414; this can be interpreted as a 1% increase in FDI stock resulting in a 0.08414% increase in employment.
6.1.4 Annual Average Wages The indirect impact of FDI on average wages is defined as the change in the average annual wage of employees working in firms already existing in Great Britain following and operating in the same sector where the new FDI occured. As an example, if a £100 million FDI project results in the creation of an automotive manufacturing plant (that is, a project landing in ‘transport equipment’). Here, the indirect average annual wages impact of that FDI project would be the change in the wages of workers employed by existing firms in the ‘transport equipment’ sector.
Tables A5 and A6 in Annex B show the econometric results for our final model specifications for both the capex-based and employment-based measures of FDI. The only additional control variable that was added was a foreign ownership dummy. We control for varying regional economic conditions by including regional GVA as a variable.
The variable of interest (FDI stock normalised by GVA) has a positive and statistically significant impact on average annual wages suggesting that indirect positive effects on annual wages are present in Great Britain.
These results support the claim that FDI has a positive indirect effect within the receiving firm’s sector; in other words, introducing FDI into an industry in Great Britain’s economy appears to raise the average annual wage of firms within that industry. This confirms the view from the literature that the entrance of foreign firms prompts a rise in wages in existing domestic firms (N. L. Driffield 1996). At the root of this increase could either be the amplification of competitive pressures within the economy, a position supported by Borensztein, et al. (1998) and Lipsey and Sjoholm (2004), or alternatively some demonstrative influence as suggested by Hijzen and Swaim (2008).
Our final estimated coefficients are 0.10610 for the employment-based measure of FDI and 0.04477 for our capex-based measure. Thus, for a 1% increase in employment created by Foreign Direct Investment in the UK, which will be referred to hereafter as ‘foreign employment’, there is a 0.10610% increase in average annual wages and a 1% increase in FDI stock there is a resultant 0.04477% increase in average annual wages.
6.1.5 Apparent Labour Productivity The indirect impact of FDI on ALP is defined as the change in the ALP of firms already existing in Great Britain and operating in the same sector where the new FDI occured. As an example, if a £100 million FDI project results in the creation of an automotive manufacturing plant (that is, a project landing in ‘transport equipment’). Here, the indirect ALP impact of that project would be the change in the ALP of existing firms in the ‘transport equipment’ sector.
Table A7 in Annex B shows full econometric analysis for our final model specification. The following firm-level controls were added: age, average employment costs, an R&D dummy, and a dummy indicating whether the firm is foreign or not.. We control for varying regional economic conditions by including regional GVA as a variable. We calculate the total value of the effect by combining the results for all three lag lengths, which produces our final estimate for the total effect of FDI on ALP.Our final estimated coefficient for the impact through the employment based measure of FDI is

Understanding FDI and its impact in the United Kingdom
32
0.031288; this can be interpreted as a 1% increase in foreign employment results in a 0.031288% indirect increase through spillovers in ALP.
We fail to find a significant result that explains ALP through the FDI capital given a lack of statistical significance and this will be further examined in subsequent research.
Thus the variable of interest (FDI employment normalised by GVA) has a positive and statistically significant impact on ALP suggesting that indirect positive effects on ALP are present in Great Britain.
We calculate the total value of the effect by combining the results for all three lag lengths, which produces our final estimate for the total effect of FDI on ALP. These results support the claim that FDI has a positive indirect effect within the receiving firm’s sector; in other words, introducing FDI into an industry in the Great Britain’s economy appears to raise the ALP of firms within that industry. This confirms the view from the literature that states that the introduction of foreign entrants to a domestic market encourages productivity gains in existing firms (Girma, Greenaway and Wakelin 2001). These productivity gains may reflect adaptations to enhanced competitive pressures in the economy that encourage firms to invest in improving their productive capacity (Horstmann and Markusen (1996), Blomström (1986) and Griffith, et al. (2002)). Alternatively, there may be some demonstration effects that existing firms are able to appropriate to their own productive advantage (Markusen (1995) and Caves (1996)).
It is worth mentioning that the overall effect is positive; as such we can infer that any negative effects of competitive and demonstrative influences stemming from FDI are overwhelmed by the positive externalities. Whilst we may be concerned that excessive productivity differentials between foreign and domestic firms might produce negative overall effects, as described by Girma, et al. (2001) and Borensztein, et al. (1998), their shared conclusion that developed economies ought to possess the human capital advantages to profit from these competitive and demonstrative pressures are confirmed by our analysis.

Understanding FDI and its impact in the United Kingdom
33
6.2 Evaluation The evaluation is performed at a national and sectoral level and enables us to transflate these elasticities into pound values for DIT’s operational purposes. We estimate the change in the economic impact factor for every £1 million of FDI or for a unit increase in employment at a foreign firm depending on the measure of FDI assigned to a sector/ economic impact variable.
We have chosen to focus the evaluated results on GVA and employment due to these being used for the operational purposes within DIT.
6.2.1 Sectoral approach We examine and evaluate the indirect impact of FDI on existing firms in Great Britain separately for all economic impact factors as discussed earlier. Alongside overall national impacts, effects are broken down by sector as FDI activity varies greatly by sector in terms of investment value.
18 sector groupings as defined by the ONS
Whilst it would be appropriate and robust to use both (capital and employment based) GVA coefficients of impact for carrying out the evaluation for operational purposes, we identify the sectors for which a capital-based measure of FDI would be most relevant and those for which the employment based measure would be most relevant.16 In order to do this, we examine the capital labour ratio of all 18 sectors. In using the capital labour ratio to determine whether a sector should use a capital or employment-based measure of FDI, we are making several assumptions. One of these assumptions being that domestic and foreign firms have similar shares of capital and employment. Additionally, our data is taken from 2014 to draw consistency with the firm level data we use for the econometric analysis and we assume that the make-up of sectors has not changed significantly between 2014 and now. Equally, it should be noted that this separation of capital and employment-based measures of FDI is an interpretation which reflects the application of theory to operational considerations.
16 It should be noted that for evaluating the impact of FDI on This is because using an employment-based measure of FDI to estimate a relationship between FDI and employment is statistically inappropriate. Thus, for estimating the impact of FDI on employment, only the capital-based measure of FDI is utilised.
• Agriculture, forestry and farming • Mining and quarrying (including
oil and gas production) • Food products, beverages and
tobacco products • Textiles and wood activities • Petroleum, chemicals,
pharmaceuticals, rubber, plastic products
• Metal and machinery products • Computer, electronic and optimal
products • Transport equipment
• Other manufacturing • Electricity, gas, water and waste • Construction • Retail and wholesale trade, repair of
motor vehicles and motorcycles • Transportation and storage • Information and communication • Financial services • Professional, scientific and technical
services • Administration and support service
activities • Other services

Understanding FDI and its impact in the United Kingdom
34
Figure 3 below shows the capital/labour ratio of the 18 sectors, with the Mining & Quarrying sector showing the highest ratio (£153,000) and therefore could be considered as the most capital intensive. Those sectors whose capital labour ratio ranks in the top half are assigned the capital -based measure of FDI, whilst those in the bottom half are assigned the employment-based measure. However, an issue arises with the potential crudeness of this decision-making process and so for certain sectors, further research was undertaken to substantiate the categorisation of these sectors. For example, previous research identifies ‘Construction’ as a labour-intensive sector (Innovate UK, 2018) , whilst ‘Petroleum, chemicals, pharmaceuticals, rubber, plastic products’ is made up of capital-intensive industries better represented by the use of a capital-based measure of FDI (Clews, 2016).
Figure 4 – Capital Labour ratios
This selection process resulted in the below allocations of FDI measures to each sector. For those sectors using the capital-based measure of FDI, the evaluated impact will represent the resultant change in GVA from a £1 million increase in FDI. Analogously, for sectors using the employment-based measure of FDI, the evaluated impact will represent the consequent change in GVA in the sector from a unit increase in employment by the investing foreign firm in the sector.
£0£20,000£40,000£60,000£80,000
£100,000£120,000£140,000£160,000£180,000
Capex FDI Employment FDI
• Computer, electronic and optical products • Agriculture, forestry and fishing
• Electricity, gas, water and waste • Construction
• Information and communication • Administration and support service activities
• Metal and machinery products • Financial services
• Mining and quarrying (including oil and gas production)
• Food products, beverages and tobacco products
• Other manufacturing • Other services
• Petroleum, chemicals, pharmaceutical rubber and plastic products
• Professional, scientific and technical activities
• Textiles and wood activities • Retail and wholesale trade, repair of motor vehicles and motorcycles
• Transport equipment

Understanding FDI and its impact in the United Kingdom
35
It should be noted that for evaluating the impact of FDI on we only use the capital-based measure. This is because using an employment-based measure of FDI to estimate a relationship between FDI and employment is statistically inappropriate. Thus, for estimating the impact of FDI on employment, only the capital-based measure of FDI is utilised.
Applying the results discussed in 6.1.1 with equation 2- equation 9, to undertake the evaluation procedure as well as including inter-sectoral impacts for GVA, we arrive at the following results:
Table 2 – Sector-specific evaluated results (employment sectors in italics)
Sector
GVA Employ.
Total Great Britain (Employment FDI) £211,780.8 -
Total Great Britain (Capex FDI) £98,460 2.89
Administration and support service activities £47,765 8.16
Agriculture, Forestry and fishing £265,386 18.48
Computer, electronic and optical products £51,663 0.54
Construction £141,475 15.58
Electricity, gas, water and waste £93,757 0.58
Financial services £82,314 0.40
Food products, beverages and tobacco products
£69,210 0.66
Information and communication £126,041 1.30
Metal and machinery products £177,556 1.98
Mining and quarrying (including oil and gas production)
£44,712 0.06
Other manufacturing £87,708 1.01
Other services £311,898 42.73
Petroleum, chemicals, pharmaceutical rubber and plastic products £118,281 0.85
Professional, scientific and technical activities £92,157 4.76
Retail and wholesale trade, repair of motor vehicles and motorcycles £51,984 3.66
Textiles and wood activities £268,661 3.64
Transport equipment £209,651 2.03
Transportation and storage £206,471 3.38

Understanding FDI and its impact in the United Kingdom
36
6.2.1 GVA Evaluation Now, specifically looking into the GVA results, we see that across Great Britain a £1 million increase in FDI in a given sector including inter-sectoral impacts is estimated to produce, on average, approximately £98,000 net increase in GVA in the economy.. Similarly, a unit increase in employment by the investing foreign firm is estimated to produce, on average, around a £212,000 net increase in GVA.
Sectoral
Figure 5 below demonstrates the variation in the impact across all sectors, with the greatest evaluated impact including inter-sectoral impacts is seen in the Other Services sector, the increase in GVA is estimated to be around £311,898. In contrast, the lowest impact is seen in Mining and Quarrying where an increase in the capital-based measure of FDI of £1mn is associated with an increase in GVA of £44,712.
Figure 5 – Evaluated impact of an increase in FDI on GVA
The above results and variation can be explained by the GVA intensity (increasing) within each sector and also the current amount of FDI stock in the sector, where evaluated results are increasing in the former and decreasing in the latter.For example, the large reported value for ‘other services’ is a function of high values of GVA in that sector, whereas the high value for ‘agriculture, forestry and fishing’ is a result of low levels of FDI in that sector. Similarly, low evaluated figures in ‘food products, beverages and tobacco products’ are formed due to low levels of GVA, and in ‘financial services’ and ‘mining and quarrying’ reflect the high levels of FDI stock found in that industry.
Another key driver for the results are the large variation for the intersectoral effects between sectors, where the sectors with least interaction with other sectors will yield the lowest intersectoral effects and the sectors with the highest interaction with other sectors will see large increase in impacts.
Overall, applying the inter-sectoral GVA multiplier generates increases in the total economic impact across all sectors. Using a weighted average to demonstrate the impact on all sectors and therefore the whole economy we see an increase of 26% in GVA when including inter-sectoral impacts.
£0
£50,000
£100,000
£150,000
£200,000
£250,000
£300,000
£350,000

Understanding FDI and its impact in the United Kingdom
37
The sector which had seen the highest percentage increase in impact was the ‘Food products, beverages & tobacco products’ sector. The sector saw a 45% increase in GVA, with Martinez and Briz (2000) highlighting the reasons for this being the fact that the Food and Drinks sector is situated in a ‘well developed network of interindustry purchases and sales’17. Intuitively this can be seen in the interactions between inputs from agriculture sectors as a base for food production, the need for packaging and containers for the food and drink sales and also the actual need for machinery within the production process.
The lowest increase within a sector was seen within the ‘Electricity, gas, water and waste’ sector, seeing only a 20% increase, meaning a 25-percentage point difference between the highest and lowest increases. This wide range illustrates the differences in interactions between sectors. The majority of the output being produced by the ‘Electricity, gas, water and waste’ sector came from the sector itself. By contrast, the rest of the inputs from other sectors were distributed relatively evenly across the other sectors in much smaller amounts as compared to other sectors.
6.2.3 Employment Evaluation Now if we specifically look into employment results, we notice that a £1 million increase in FDI in a given sector is estimated to produce, on average, around 2.89 jobs among firms in the same sector.
Sectoral
Figure 6 below shows the greatest evaluated impact is once again seen in Other Services (42.73). The lowest net additional employment is created in in Mining and Quarrying (0.06).
Figure 6 – Evaluated impact of an increase in FDI on Employment
Similar to the GVA results, the employment results can also be explained by the employment intensity (increasing) within each respective sector and also the current amount of FDI stock in the sector, where evaluated results are increasing in the former and decreasing in the latter. For example, the large estimated value for ‘Other Services’ is a driven by the high amount of existing employment in that sector, and again the high value for ‘Agriculture, Forestry and Fishing’ is a result of low levels of FDI in that sector. Similarly, low evaluated figures in a number of the other sectors are due to either lower levels of employment in the sector or high amount of existing stock to creatin ‘Financial Services’ and ‘Mining and Quarrying’ result in lower impacts.
17. Innovation in the Spanish Food & Drink Industry - Martinez and Briz, (2000)
05
1015202530354045

Understanding FDI and its impact in the United Kingdom
38
Section 7: Application of methodology to projects supported by DIT
7.1 Identifying eligible FDI transactions Investment promotion agencies, including DIT, are focused on and measure their operational performance based on the number of specific individual investment decisions – these are FDI projects. FDI projects can come in different forms depending on the characteristics of the investment project and the nature of actual engagement of the investor in the UK. For the purposes of DIT definitions and this publication, and as stated in Section 1 of the report, FDI transactions take three main forms: new investments, expansions on an existing investment, and M&As.
As the government department responsible for the promotion and facilitation of inward investment, DIT aims to record and report information on all FDI projects successfully landing in the UK that have been assisted by the DIT network teams.
New jobs created and safeguarded are estimates over a three-year period. Job numbers are sourced from interactions with businesses and public announcements, and in the case of non-involved projects, calculated through algorithms used in external databases.
Data and information related to involved projects are self-reported by the DIT network and are recorded on an internal database. All parties involved in a project are responsible to enter the necessary data on to the system following agreed operating principles and eligibility criteria. The eligibility criteria for FDI projects can be found in Annex D.
Each investment within the forms is treated as an investment project. These projects undergo an independent verification prior to confirmation as a success for official reporting in the DIT inward investment publication.
Along with confirming the eligibility of projects, additional objectives of the verification process are to ensure that investment projects are genuine, and to assess the robustness, accuracy and consistency of the project data reported by the DIT network. The tests applied on each project in the main verification stage are mapped out in Annex D.
7. 2 Estimating GVA from DIT supported FDI transactions In the financial year 2019 to 2020, DIT supported 1,449 FDI projects18. Based on the methodology set out earlier in the report, these FDI projects are estimated to generate £2.83 billion in gross value add (GVA) over the next three years.
This estimate has been made by applying the sector specific multipliers to either the number of new jobs generated from successful FDI projects or the capital expenditure reported to be invested by the FDI projects.
18. https://www.gov.uk/government/statistics/department-for-international-trade-inward-investment-results-2019-to-2020

Understanding FDI and its impact in the United Kingdom
39
Section 8: Conclusion
8.1 Summary The first phase of our FDI impact analysis, published in 2018, sought to identify how, when and where the positive impacts from inward FDI occur. This is in order to enable effective streamlining and targeting of DIT’s activities to promote FDI in those areas or sectors where the economic impact of our services is maximised.
In the current report, we additionally include an employment-based measure of FDI by estimating the impact of an increase in employment by foreign firms. This additional measure is being introduced in recognition of the changing nature of foreign investments - with certain industries evolving to become more asset-light in nature and with increasing share of intangible nature forms of business investment. The report also seeks to capture the inter-industry impacts of increases in Gross Value Added at a high-level, attempting to capture broader impacts, as opposed to the first phase of analysis which concentrated solely on intra-industry (within the same sector where FDI occurred) impacts. At a national level, we find that, on average, FDI projects improve all four of our key economic impact factors.
After estimating the elasticity of FDI with respect to the economic impact factors, these elasticities are transformed into pound values (at both a national and sectoral level) for operational purposes. This enables the estimation of the change in the economic impact factor for every £1 million of FDI or for a unit increase in employment (one new employee) at a foreign firm. The distinction depends on the measure of FDI assigned to a sector/ economic impact variable.
Specifically, a £1 million FDI project into Great Britain leads to a net increase in national levels of GVA of around £98,000 when including inter-sectoral impacts and a net increase in employment of approximately 2.9 jobs. Similarly, a unit increase in employment at a foreign firm produces an increase in GVA of £212,000 when including inter-sectoral impacts. FDI projects increase average annual wages by 0.045% via capital and 0.11% via employment-based measures and also produce an increase in labour productivity of 0.031%.
Also included in this report is an examination of foreign MNE contribution across the UK, dividing the UK into 12 regions and further into 42 sub-regions. In both cases, regional variations still exist. For example, foreign MNEs accounted for 5% of local business units in London, 21% of business employment, and over half of turnover. Analysis at a more granular level highlights that variations can also exist within subnational regions and devolved administrations. For example, while foreign MNEs accounted for 13% of business employment in Scotland, this rose to 20% for North Eastern Scotland.
8.2 Limitations and further research Whilst the econometric analysis provides a good indication of the impact of FDI on Great Britain, it is pertinent to highlight the limitations of the analysis. Though this report attempts to offer a comprehensive approach to FDI analysis, certain abstractions were necessary in order to produce workable results. Closer inspection of these abstractions offers up a wide spectrum of additional research topics, many of which have the potential to further enrich our understanding of FDI. These extensions, aside from their academic value, offer the opportunity to improve the government’s approach to investment promotion and policy formulation in FDI. Here, we point out some possible extensions and limitations of the analysis currently covered.
A limitation of our analysis is the inability to distinguish between different forms of investment. Our definition of FDI captures greenfield, expansions, mergers and acquisitions (M&A) and joint venture investment projects. As a result, our analysis in its current form is unable to identify varying impacts of FDI based on the type of investment. A more granular understanding of the variation in the impact by

Understanding FDI and its impact in the United Kingdom
40
investment type is a crucial necessity in prioritising promotion of FDI projects.19 Additionally, we are unable to distinguish the regional impact of FDI and whether FDI has a larger or smaller effect on economic indicators in certain regions. Work is currently underway to develop our understanding in both these areas.
Although we had initially planned to consider the effect of FDI on the UK, we were not able to obtain the necessary data to analyse the impact on Northern Ireland. Hence, the current analysis only looks at the effect of FDI on Great Britain. We aim to source firm-level data for Northern Ireland and intend to analyse the impact of FDI on Northern Ireland, and consequently the UK. Additionally, due to its unavailability, the micro-data used for the analysis pertains to 1998-2014. We hope to update our analysis in both these areas at earliest opportunity the microdata is updated by ONS.
Our evaluation method is used to predict sector-specific impacts of FDI. Our current assumption is that the relationship between FDI (either capex-based or employment-based) and the economic impact variables discussed in this document is the same for each sector. A future extension of this analysis could attempt to estimate sector specific impacts of FDI.
As previously discussed, our current method of deciding which measure of FDI should be used for each sector is rudimentary. For this reason, the assignment for each sector is not necessarily permanent and when applying these findings for DIT’s operational purposes, it may need updating accordingly. Further development of our sectoral understanding and discussions with sector teams will allow us to adapt these allocations as needed.
While we have also now added inter-sectoral impacts to the overall methodology it must be noted that this analysis is at a much higher level. In comparison to the intra-sectoral results, it does not have the same granularity of data and analysis underpinning its results.
Furthermore, there are a number of other considerations to take into account when considering the inter-sectoral methodology and results. For example, the analysis is based purely on domestic interaction – and there is a question on whether firms invested in through FDI would operate in the same way as domestic firms in the same sector. This is especially the case if they were to bring in new technological processes or ways of production and therefore more profoundly affect interactions with other sectors.
Another important consideration that is not captured through the current analysis is whether the interactions between the sectors have a constant rate of returns to FDI. Potentially the level of input from other sectors may not scale directly with increased output in the FDI sector. This would likely affect the sectors which see the largest investments given potential economies of scale.
The current inter-sectoral analysis also only looks to capture intra-sectoral GVA impacts, with further work necessary to explore if it is possible to extend such analysis to the other economic indicators of interest.
As highlighted within the methodology, the input-output relationship is based on data from 2016, which is the latest data available. If the relationships have since changed between sectors than the estimates produced will not be necessarily reflective of the true amount.
In a peer review of a similar methodology used by the UK Export Finance for their jobs supported model and peer reviewed by external experts20 it was highlighted that the construction of the input-output table itself relies on a series of assumptions that render I-O figures only applicable to averages
19. For example, the extent to which employment in foreign-owned firms reflects the impact on employment as a result of FDI depends on whether FDI occurs through greenfield investment or M&A. Whilst greenfield FDI is generally considered to have large positive impacts, OECD (2008) suggests that cross-border M&A may also have a significant positive impact on employment.
15. UK Trade Policy Observatory, University of Sussex

Understanding FDI and its impact in the United Kingdom
41
at best. They are helpful to grasp the average behaviour of sectors but might be quite wrong for specific businesses. Therefore, while the methodology offers a good estimate of effects on the overall sector, it is not likely to be very accurate for exact set of businesses. Indeed, as discussed previously, FDI firms are likely to be different to the average. To achieve a better understanding of the characteristics of these businesses, a study further analysing firm level data is necessary.
As discussed throughout the report, given the considerations on the limitations of the model and the DIT’s continued work to improve on it, the overall analysis and the results should be treated only as experimental in nature. We intend to address some of these issues in the next phase of our analysis.

Understanding FDI and its impact in the United Kingdom
42
Bibliography
Aitken, Brian J, and Ann E Harrison. 1999. “Do Domestic Firms Benefit from Direct Foreign Investment? Evidence from Venezuela.” American Economic Review 89 (3): 605-618.
Alfaro, Laura. 2003. “Foreign Direct Investment and Growth: Does the Sector Matter?” Working Paper.
Barrell, Ray, and Nigel Pain. 1997. “Foreign direct investment, technological change, and economic growth within Europe.” Economic Journal 107 (445): 1770-1786.
Bellak, Christian. 2004. “How Domestic and Foreign Firms Differ and Why Does it Matter?” Journal of Economic Surveys 18 (4): 483-514.
Bengoa, Marta, and Blanca Sanchez-Robles. 2003. “Foreign direct investment, economic freedom and growth: New evidence from Latin America.” European Journal of Political Economy 19 (3): 529-545.
Blalock, Garrick, and Paul J Gertler. 2008. “Welfare gains from Foreign Direct Investment through technology transfer to local suppliers.” Journal of International Economics 74 (2).
Blomström, Magnus. 1986. “Foreign Investment and Productive Efficiency: The Case of Mexico.” The Journal of Industrial Economics 35 (1): 97-110.
Borensztein, E, J De Gregorio, and J-W Lee. 1998. “How does foreign direct investment affect economic growth?” Journal of International Economics 45 (1): 115-135.
Braunstein, Elissa, and Gerald Epstein. 2002. “Bargaining Power and Foreign Direct Investment in China: Can 1.3 Billion Consumers Tame the Multinationals?” IDEAS Working Paper Series from RePEc.
Brown, Charles, and James L Medoff. 2003. “Firm Age and Wages.” Journal of Labor Economics 21 (3): 677-697.
Cabinet Office. 2017. Implementing the Sustainable Development Goals. London: GOV.UK.
Carkovic, Maria, and Ross Levine. 2002. Does Foreign Direct Invesment Accelerate Growth? University of Minnesota, Working Paper.
Caves, Richard E. 1996. Multinational enterprise and economic analysis. 2nd. Cambridge: Cambridge University Press.
Chuang, Yih‐Chy, and Chi‐Mei Lin. 1999. “Foreign direct investment, R&D and spillover efficiency: Evidence from Taiwan's manufacturing firms.” Journal of Development Studies 35 (4): 117-137.
Cook, Gary, Naresh Pandit, Hans Lööf, and Börje Johansson. 2013. “Clustering, MNEs, and Innovation: Who Benefits and How?” International Journal of the Economics of Business 20 (2): 203-227.
De Mello, Luiz. 1999. “Foreign direct investment-led growth: evidence from time series and panel data.” Oxford Economic Papers 51 (1): 133-151.
Department for International Trade. 2018. Department for International Trade inward investment results 2017 to 2018. London: GOV.UK.
Djankov, Simeon, and Bernard Hoekman. 2000. “Foreign investment and productivity growth in Czech enterprises.” The World Bank economic review 14 (1): 49-64.
Driffield, Nigel L. 1996. Global competition and the Labour Market. Amsterdam: Harwood Academic Publishers.
Driffield, Nigel. 2001. “The Impact on Domestic Productivity of Inward Investment in the UK.” Manchester School 69 (1): 103-119.

Understanding FDI and its impact in the United Kingdom
43
Driffield, Nigel, Jun Du, Mark Hart, Jim Love, and Efstathios Tapinos. 2010. A comparative evaluation of the impact of UK Trade & Investment's R&D programme and other UKTI support that impacts R&D. Aston University: UKTI Research Report.
Dunning, John. 1994. “Multinational enterprises and the globalization of innovatory capacity.” Research Policy 23 (1): 67.
European Commission. 2018. South East of England. https://ec.europa.eu/growth/tools-databases/regional-innovation-monitor/base-profile/south-east-england.
—. 2018. West Midlands. https://ec.europa.eu/growth/tools-databases/regional-innovation-monitor/base-profile/west-midlands.
Garcia-Vega, Maria, Patricia Hofmann, and Richard Kneller. 2015. “Multinationals and the Globalization of R&D.”
Girma, Sourafel, and Holger Gorg. 2007. “Evaluating the foreign ownership wage premium using a difference-in-differences matching approach.” Journal of International Economics 72 (1): 97-112.
Girma, Sourafel, and Katharine Wakelin. 2002. “Are there Regional Spillovers from FDI in the UK?” In Trade, Investment, Migration and Labour Market Adjustment, 172-186. London: Palgrave Macmillan.
Girma, Sourafel, David Greenaway, and Katharine Wakelin. 2001. “Who Benefits from Foreign Direct Investment in the UK?” Scottish Journal of Political Economy 48 (2): 119-133.
Girma, Sourafel, Yundan Gong, and Holger Görg. 2008. “Foreign Direct Investment, Access to Finance, and Innovation Activity in Chinese Enterprises.” The World Bank Economic Review 22 (2): 367-382.
Graham, Edward M, and Paul R Krugman. 1993. “The Surge in Foreign Direct Investment in the 1980s.” In Foreign Direct Investment, 13-36. Chicago: University of Chicago Press.
Griffith, Rachel, Stephen Redding, and Hel Simpson. 2002. “Productivity Convergence and Foreign Ownership at the Establishment Level.” The Institute for Fiscal Studies.
Griffith, Rachel, Stephen Redding, and John Van Ree. 2000. “Mapping the Two Faces of R&D: Productivity Growth in a Panel of OECD Industries.” IDEAS Working Paper Series from RePEc.
Hale, Galina, and Cheryl Long. 2012. Foreign Direct Investment in China: Winners and losers (World Scientific Publishing).
Hale, Galina, and Mingzhi Xu. 2016. “FDI Effects on the Labor Market of Host Countries.” Federal Reserve Bank of San Francisco Working Paper Series.
Halpern, László, and Balázs Muraközy. 2007. “Does Distance Matter in Spillover?” Economics of Transition 15 (4): 781-805.
Haskel, Jonathan E, Sonia C Pereira, and Matthew J Slaughter. 2007. “Does Inward Foreign Direct Investment Boost the Productivity of Domestic Firms?” The Review of Economics and Statistics 83 (9): 482-496.
Heyman, Fredrik. 2007. “Firm Size or Firm Age? The Effect on Wages using Matched Employer-Employee Data.” LABOUR 21 (2): 237-263.
Hijzen, Alexander, and Paul Swaim. 2008. “Do multinationals promote better pay and working conditions?” Organisation for Economic Cooperation and Development. The OECD Observer (269): 15-17.
Horstmann, Ignatius J, and James R Markusen. 1996. “Exploring New Markets: Direct Investment, Contractual Relations and the Multinational Enterprise.” International Economic Review 37 (1): 1-19.

Understanding FDI and its impact in the United Kingdom
44
Idson, Todd L, and Walter Y Oi. 1999. “Workers Are More Productive in Large Firms.” American Economic Review 89 (2): 104-108.
Javorcik, Beata Smarzynska. 2004. “Does Foreign Direct Investment Increase the Productivity of Domestic Firms? In Search of Spillovers Through Backward Linkages.” American Economic Review 94 (3): 605-627.
Javorcik, Beata Smarzynska, and Mariana Spatareanu. 2008. “To share or not to share: does local participation matter for spillovers from foreign direct investment?” The Journal of Development Economics 85 (1).
Javorcik, Beata, and Yue Li. 2013. “Do the biggest aisles serve a brighter future? Global retail chains and their implications for Romania.” Journal of International Economics 90 (2): 348.
Javorcik, Beata, Wolfgang Keller, and James Tybout. 2008. “Openness and Industrial Response in a Wal‐Mart World: A Case Study of Mexican Soaps, Detergents and Surfactant Producers.” World Economy 31 (12): 1558-1580.
Jude, Cristina, and Monica Ioana Pop Silaghi. 2016. “Employment effects of foreign direct investment: New evidence from Central and Eastern European countries.” International Economics 145: 32-49.
Kerekes, Monika, and Jürgen Bitzer. 2008. “Does foreign direct investment transfer technology across borders? New evidence.” Economics Letters 100 (3): 355-358.
Konings, Jozef. 2001. “The Effects of Foreign Direct Investment on Domestic Firms.” Economics of Transition 9 (3): 619-633.
Kugler, Maurice. 2006. “Migrant Remittances, Human Capital Formation and Job Creation Externalities in Colombia.”
Lipsey, Robert E, and Fredrik Sjoholm. 2004. “Host Country Impacts Of Inward Fdi: Why Such Different Answers?” IDEAS Working Paper Series from RePEc.
Litan, Robert E, and Ian Hathaway. 2014. The Other Aging of America: The Increasing Dominance of Older Firms. Brookings.
Markusen, James R. 1995. “The Boundaries of Multinational Enterprises and the Theory of International Trade.” Journal of Economic Perspectives 9 (2): 169-189.
OECD. 2008. “Do Multinationals Promote Better Pay and Working Conditions?” OECD Employment Outlook (OECD).
OECD. 2015. Frascati Manual. OECD.
OECD. 2017. R&D intensity by industry, 2015: As a percentage of gross value added, log scale. Paris: OECD Publishing.
Office for National Statistics. 2016. Economic Review, January 2016. Office for National Statistics.
Office for National Statistics. 2017. Foreign direct investment involving UK companies: 2016. Office for National Statistics.
Office for National Statistics. 2017. Region by Industry (2 digit SIC) - ASHE: Table 5. Office for National Statistics.
Office for National Statistics. 2017. Regional gross value added (income approach). Office for National Statistics.
Office for National Statistics. 2017. S01: Regional labour market summary. Office for National Statistics.
O'Mahony, Mary, and Nicholas Oulton. 1990. Industry-level estimates of the capital stock in UK manufacturing, 1948-85. London: The Institute.

Understanding FDI and its impact in the United Kingdom
45
Ouimet, Paige, and Rebecca Zarutskie. 2014. “Who Works for Startups? The Relation between Firm Age, Employee Age and Growth.” Journal of Financial Economics 112 (3): 386-407.
Rodrik, Dani. 1999. The New Global Economy and The Developing Countries : Making Openness Work. Baltimore: Johns Hopkins University Press.
Spiezia, Vincenzo. 2004. “Trade, FDI and Employment: Some Empirical Evidence.” In Understanding Globalization, Employment and Poverty Reduction. New York: Palgrave Macmillan.
UK Trade & Investment. 2014. UKTI inward investment report 2013-2014. London: GOV.UK.
UK Trade & Investment. 2015. UKTI Inward Investment Report 2014 to 2015. London: GOV.UK.
UNCTAD. 2017. “Global Investment Trends Monitor.”
UNCTAD. 2001. “World Investment Report 2001.”
UNCTAD. 2017. “World Investment Report 2017.”
UNCTAD. 2010. “World Investment Report: Investing in a Low Carbon Economy.”
Vacaflores, Diego E. 2011. “Was Latin America Correct In Relying In Foreign Direct Investment To Improve Employment Rates?” Applied Econometrics and International Development 11 (2): 101-122.
Veugelers, Reinhilde, and Peter Vanden Houte. 1990. “Domestic R&D in the Presence of Multinational Enterprises.” International Journal of Industrial Organization 8 (1): 1.
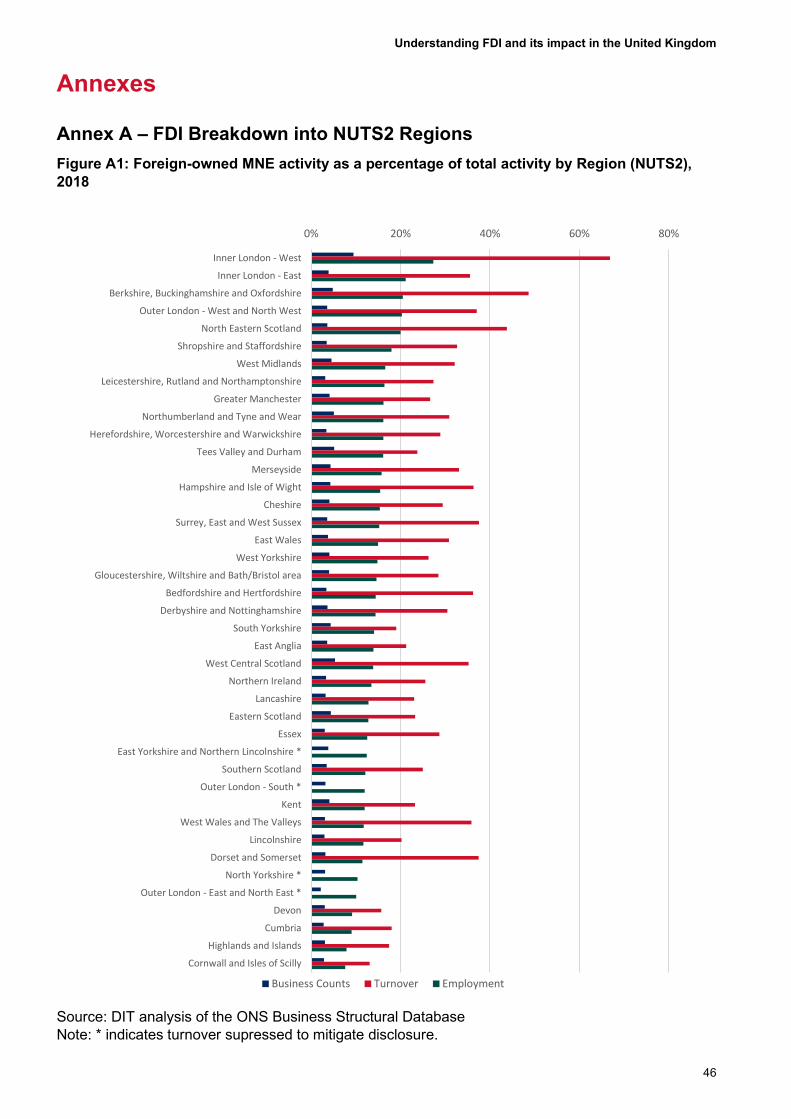
Understanding FDI and its impact in the United Kingdom
46
Annexes
Annex A – FDI Breakdown into NUTS2 Regions Figure A1: Foreign-owned MNE activity as a percentage of total activity by Region (NUTS2), 2018
Source: DIT analysis of the ONS Business Structural Database Note: * indicates turnover supressed to mitigate disclosure.
0% 20% 40% 60% 80%
Inner London - West
Inner London - East
Berkshire, Buckinghamshire and Oxfordshire
Outer London - West and North West
North Eastern Scotland
Shropshire and Staffordshire
West Midlands
Leicestershire, Rutland and Northamptonshire
Greater Manchester
Northumberland and Tyne and Wear
Herefordshire, Worcestershire and Warwickshire
Tees Valley and Durham
Merseyside
Hampshire and Isle of Wight
Cheshire
Surrey, East and West Sussex
East Wales
West Yorkshire
Gloucestershire, Wiltshire and Bath/Bristol area
Bedfordshire and Hertfordshire
Derbyshire and Nottinghamshire
South Yorkshire
East Anglia
West Central Scotland
Northern Ireland
Lancashire
Eastern Scotland
Essex
East Yorkshire and Northern Lincolnshire *
Southern Scotland
Outer London - South *
Kent
West Wales and The Valleys
Lincolnshire
Dorset and Somerset
North Yorkshire *
Outer London - East and North East *
Devon
Cumbria
Highlands and Islands
Cornwall and Isles of Scilly
Business Counts Turnover Employment

Understanding FDI and its impact in the United Kingdom
47
Figure A1 above demonstrates the breakdown of foreign owned MNE activity according to NUTS 2 regions as a proportion of total activity in the region. It examines business count, turnover as well as employment and shows that across the board, foreign MNE’s produce a disproportionate amount of turnover and employment. This is especially true for London and Berkshire, Buckinghamshire and Oxfordshire.

Understanding FDI and its impact in the United Kingdom
48
Annex B – Baseline Econometric estimates Table A2 – GVA: baseline econometric estimates - Employment
Analysis: GVA (employment-based measure)
Parameter Coefficient
L0 ln(FDI) 0.347***
(35.97)
L1 ln(FDI) -0.190***
(-24.78)
L2 ln(FDI) 0.0858***
(11.75)
L0 ln(domestic equivalent) 0.317***
(8.69)
L1 ln(domestic equivalent) -0.158***
(-3.59)
L2 ln(domestic equivalent) -0.0989**
(-2.52)
Dummy variable indicating whether foreign owned=0 0
(.)
Dummy variable indicating whether foreign owned=1 0.0213**
(2.11)
empcost_r_log 0.184***
(38.35)
gva_region_log 0.225***
(4.48)
Constant 1.634
(1.21)
r2 0.101
r2_a 0.101
aic 367010.5
bic 367415.4
N 565848
Fixed effects model using cluster robust standard errors. ***, ** and * denote statistical significance of 1%, 5% and 10%.
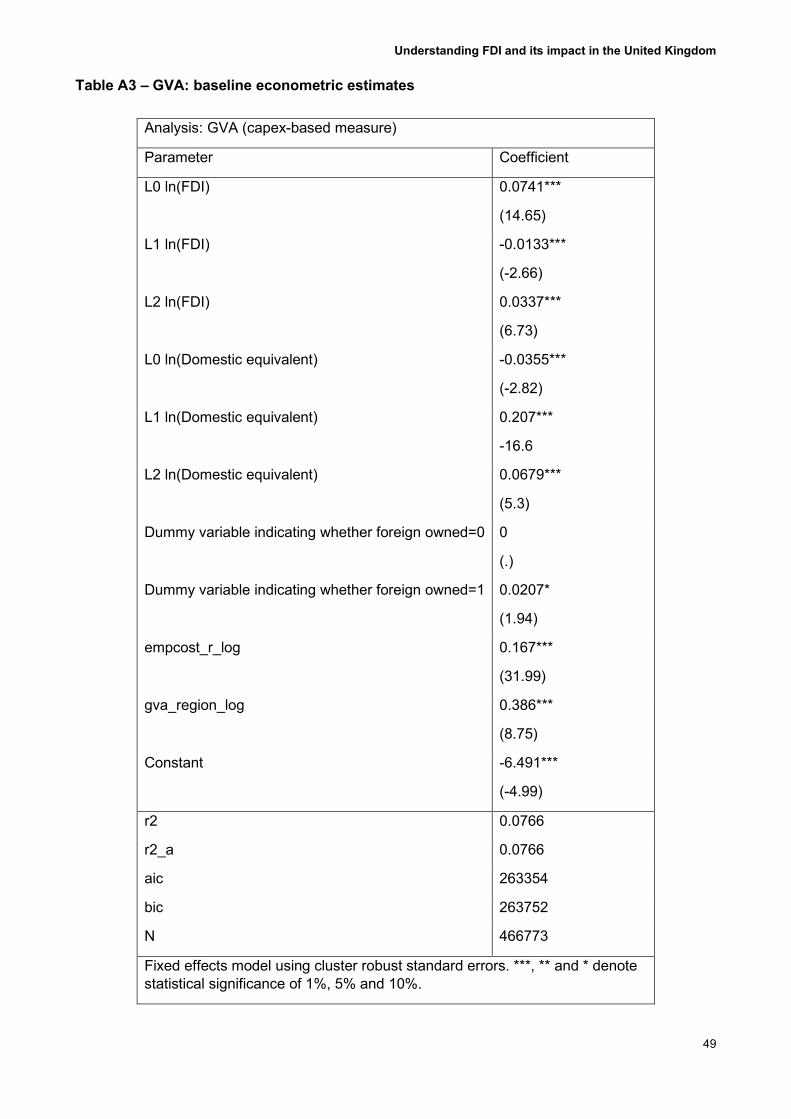
Understanding FDI and its impact in the United Kingdom
49
Table A3 – GVA: baseline econometric estimates
Analysis: GVA (capex-based measure)
Parameter Coefficient
L0 ln(FDI) 0.0741***
(14.65)
L1 ln(FDI) -0.0133***
(-2.66)
L2 ln(FDI) 0.0337***
(6.73)
L0 ln(Domestic equivalent) -0.0355***
(-2.82)
L1 ln(Domestic equivalent) 0.207***
-16.6
L2 ln(Domestic equivalent) 0.0679***
(5.3)
Dummy variable indicating whether foreign owned=0 0
(.)
Dummy variable indicating whether foreign owned=1 0.0207*
(1.94)
empcost_r_log 0.167***
(31.99)
gva_region_log 0.386***
(8.75)
Constant
-6.491***
(-4.99)
r2 0.0766
r2_a 0.0766
aic 263354
bic 263752
N 466773
Fixed effects model using cluster robust standard errors. ***, ** and * denote statistical significance of 1%, 5% and 10%.

Understanding FDI and its impact in the United Kingdom
50
Table A4 – Employment: baseline econometric estimates - Capital
Analysis: Employment (capex-based measure)
Parameter Coefficient
L0 ln(FDI) 0.0446***
(14.28)
L1 ln(FDI) 0.00889***
(3.14)
L2 ln(FDI) 0.0306***
(10.18)
L0 ln(Domestic equivalent) 0.0569***
(7.59)
L1 ln(Domestic equivalent) 0.0561***
(8.23)
L2 ln(Domestic equivalent) 0.0830***
(10.64)
Dummy variable indicating whether foreign owned=0 0
(.)
Dummy variable indicating whether foreign owned=1 0.0351***
(4.88)
gva_region_log 0.557***
(18.06)
Constant -18.60***
(-20.63)
r2 0.0330
r2_a 0.0329
aic -246342.4
bic -245948.7
N 567337
Fixed effects model using cluster robust standard errors.
***, ** and * denote statistical significance of 1%, 5% and 10%.

Understanding FDI and its impact in the United Kingdom
51
Table A5 – Average annual wages: baseline econometric estimates - Employment
Analysis: Average annual wages (employment based measure)
Parameter Coefficient
L0 ln(FDI) 0.304***
(44.22)
L1 ln(FDI) -0.247***
(-45.22)
L2 ln(FDI) 0.0493***
(9.48)
L0 ln(Domestic equivalent) -0.174***
(-6.31)
L1 ln(Domestic equivalent) -0.172***
(-5.35)
L2 ln(Domestic equivalent) 0.0696**
(2.51)
Dummy variable indicating whether foreign owned=0 0
(.)
Dummy variable indicating whether foreign owned=1 0.00541
(0.80)
gva_region_log -0.418***
(-11.02)
Constant 22.62***
(22.02)
r2 0.0290
r2_a 0.0290
aic 134199.6
bic 134594.2
N 583424
Fixed effects model using cluster robust standard errors.
***, ** and * denote statistical significance of 1%, 5% and 10%.

Understanding FDI and its impact in the United Kingdom
52
Table A6 – Average annual wages: baseline econometric estimates - Capital
Analysis: Average annual wages (capex-based measure)
Parameter Coefficient
L0 ln(FDI) 0.0375***
(10.43)
L1 ln(FDI) -0.0281***
(-7.27)
L2 ln(FDI) 0.0354***
(9.12)
L0 ln(Domestic equivalent) -0.128***
(-13.79)
L1 ln(Domestic equivalent) 0.258***
(27.96)
L2 ln(Domestic equivalent) -0.0598***
(-6.49)
Dummy variable indicating whether foreign owned=0 0
(.)
Dummy variable indicating whether foreign owned=1 0.0128*
(1.84)
gva_region_log -0.233***
(-7.41)
Constant 12.70***
(13.77)
r2 0.0145
r2_a 0.0144
aic 50931.0
bic 51318.0
N 468905
Fixed effects model using cluster robust standard errors.
***, ** and * denote statistical significance of 1%, 5% and 10%.

Understanding FDI and its impact in the United Kingdom
53
Table A7 – ALP: baseline econometric estimates - Employment
Analysis: ALP (employment based measure)
Parameter Coefficient
L0 ln(FDI) 0.245*** (30.94)
L1 ln(FDI) -0.247*** (-37.95)
L2 ln(FDI) 0.0337*** (5.62)
L0 ln(Domestic equivalent) 0.156*** (5.38)
L1 ln(Domestic equivalent) -0.229*** (-6.35)
L2 ln(Domestic equivalent) 0.0568* (1.78)
Dummy variable indicating whether foreign owned=0 0 (.)
Dummy variable indicating whether foreign owned=1 0.00151 (0.20)
Log Firm age 0.116*** (10.44)
empcost_r_log 0.242*** (35.40)
dRND 0.00832* (1.95)
gva_region_log -0.139*** (-3.50)
Constant 10.95*** (10.49)
r2 0.140 r2_a 0.140 aic 199672.6 bic 200091.9 N 457225
Fixed effects model using cluster robust standard errors. ***, ** and * denote statistical significance of 1%, 5% and 10%.

Understanding FDI and its impact in the United Kingdom
54
Annex C – Criteria for FDI project Table A8 – FDI project eligibility tests
FDI project eligibility tests
1. There must be a new, additional financial investment in the UK foreign direct enterprise as part of the FDI project. Each FDI project must demonstrate it is bringing in some financial investment into the UK.
2. To qualify as an FDI project, the foreign ownership or voting power in the UK company as a result of the new equity investment must be at least 10%.
3. The business activities supported by the investment project are expected to last at least three years. DIT supports those investments that create or expand long term businesses in the UK.
4. New investments or expansions must create one or more new permanent (meaning expected to last for at least 2 years) jobs in the UK. Total jobs expected to be created or safeguarded in the UK cover the first three years of each project.
5. (Applicable only for Retention and M&A projects claiming safeguarded jobs)
There must be sufficient evidence that without new additional investment the UK based company would potentially reduce its production capacity, and/or employment level and could ultimately result in the closure of the UK business.
Table A9 – FDI project verification tests
FDI project eligibility tests
1. The UK foreign direct enterprise must be registered in the UK. This is sourced through Companies House.
2. The UK foreign direct enterprise must be occupying or legally committed themselves to taking premises in a specific physical business address. This is sourced through confirmation of the UK business address on the company’s website or through official documentation.
3. There must be evidence that the investment funds have been secured, that at least one person is working or is in the process of being recruited to work, and that activities planned as a result of the investment have commenced. Evidence is sourced from public announcements, investor confirmation, or through a note from the DIT officials' visit to the UK company site.

Understanding FDI and its impact in the United Kingdom
55
[inside of the back cover – for printed publications, leave this page blank]

Understanding FDI and its impact in the United Kingdom
56
The UK’s Department for International Trade (DIT) helps businesses export, drives inward and outward investment, negotiates market access and trade deals, and champions free trade.
Legal disclaimer Whereas every effort has been made to ensure that the information in this document is accurate the Department for International Trade does not accept liability for any errors, omissions or misleading statements, and no warranty is given or responsibility accepted as to the standing of any individual, firm, company or other organisation mentioned.
Copyright © Crown Copyright 2021
You may re-use this publication (not including logos) free of charge in any format or medium, under the terms of the Open Government Licence.
To view this licence visit:
www.nationalarchives.gov.uk/doc/open-government-licence or email: [email protected].
Where we have identified any third party copyright information in the material that you wish to use, you will need to obtain permission from the copyright holder(s) concerned.
This document is also available on our website at gov.uk/dit
Any enquiries regarding this publication should be sent to us at
Published February 2021 by Department for International Trade
Related Documents