Understanding construction competitiveness : the contribution of system dynamics Dangerfield, BC, Green, SD and Austin, S http://dx.doi.org/10.1108/14714171011083579 Title Understanding construction competitiveness : the contribution of system dynamics Authors Dangerfield, BC, Green, SD and Austin, S Type Article URL This version is available at: http://usir.salford.ac.uk/17833/ Published Date 2010 USIR is a digital collection of the research output of the University of Salford. Where copyright permits, full text material held in the repository is made freely available online and can be read, downloaded and copied for non-commercial private study or research purposes. Please check the manuscript for any further copyright restrictions. For more information, including our policy and submission procedure, please contact the Repository Team at: [email protected] .

Welcome message from author
This document is posted to help you gain knowledge. Please leave a comment to let me know what you think about it! Share it to your friends and learn new things together.
Transcript

Understanding construction competitiveness : the contribution of
system dynamicsDangerfield, BC, Green, SD and Austin, S
http://dx.doi.org/10.1108/14714171011083579
Title Understanding construction competitiveness : the contribution of system dynamics
Authors Dangerfield, BC, Green, SD and Austin, S
Type Article
URL This version is available at: http://usir.salford.ac.uk/17833/
Published Date 2010
USIR is a digital collection of the research output of the University of Salford. Where copyright permits, full text material held in the repository is made freely available online and can be read, downloaded and copied for noncommercial private study or research purposes. Please check the manuscript for any further copyright restrictions.
For more information, including our policy and submission procedure, pleasecontact the Repository Team at: [email protected].

1
UNDERSTANDING CONSTRUCTION COMPETITIVENESS: THE
CONTRIBUTION OF SYSTEM DYNAMICS
DANGERFIELD, BRIAN. C., GREEN, STUART. D. AND AUSTIN, SIMON.A.
Purpose
Construction sector competitiveness has been a subject of interest for many years.
Research too often focuses on the means of overcoming the ‘barriers to change’ as if such
barriers were static entities. There has been little attempt to understand the dynamic inter-
relationship between the differing factors which impinge upon construction sector
competitiveness. The paper outlines the benefits of taking a systems approach to
construction competitiveness research.
Design/methodology/approach
The System Dynamics (SD) modelling methodology is described. This can provide
practitioners with ‘microworlds’ within which they can explore the dynamic effects of
different policy decisions. The data underpinning the use of SD was provided by
interviews and case study research which allowed an understanding of the context
within which practitioners operate.
Findings
The over-riding conclusion is that the system dynamics methodology has been shown to
be capable of providing a means to assess the forces which shape the sustained
competitiveness of construction firms. As such, it takes the assessment of strategic policy
analysis in the construction sector onto a higher plane. The need to collect data and make
retrospective assessments of competitiveness and strategic performance at the statistical
level is not now the only modus operandi available
Originality/value

2
Novel research methodology which points towards an alternative research agenda for
construction competitiveness research.
Keywords: Competitiveness; System Dynamics, Research, Industry Improvement,
Policy Modelling
Type= Research paper
Introduction
The paper has arisen from a three-year research project funded by the UK Engineering
and Physical Sciences Research Council (EPSRC) aimed at improving the
competitiveness of the UK construction industry. The research was funded on the basis of
competitive peer review and was predicated on the observation that the post-Egan (date?)
industry improvement agenda was becoming increasingly disconnected from the day-to-
day challenges faced by firms in the construction sector. The aim was to bring a fresh
perspective to the construction competitiveness research agenda by better understanding
how competiveness is enacted within the sector, and how construction firms might better
respond to opportunities in the future.. The research comprised a unique collaboration
between the universities of Reading, Loughborough and Salford. The project has
generated an significant amount of interest and it is expected to be an exemplar for a new
model of collaborative research involving a wide range of engagement between industry
and academia. Over the course of the three-year project the research team engaged with
hundreds of practitioners from a multiplicity of organisations.
Within the scope of a single paper it is not possible to describe in detail the project,
colloquially known as the ‘Big Ideas’, in its entirety. The purpose of the current paper is
to focus on the contribution offered by the work package which focused on system
dynamics. Initially, the broad background to the project is described followed by an
overview of the adopted research methodology. The origins and nature of system

3
dynamics are then described prior to a detailed description of how competitiveness was
modelled for a typical contracting firm. Particular emphasis is given to the development
of a ‘competitiveness index’. For details on other strands of research within the Big Ideas
project see: Green et al (2008a), Green et al (2008b), Harty et al (2007), Goodier et al
(2007, 2009).
Background
To understand the background to the ‘Big Ideas’ we must go back to the Egan report
(1998), which proposed a radical transformation of the UK construction sector. Egan
identified five key drivers of change: committed leadership, a focus on the customer,
integrated processes and teams, a quality driven agenda, and a commitment to people.
The Strategic Forum was subsequently formed in 2001 to oversee the industry reform
movement. This resulted in a revised set of targets for achieving industry reform by the
end of 2007 (Strategic Forum, 2002). More recently the time horizon has been extended
through to the 2012. Current emphasis is given to the 2012 Construction Commitments
which seek to promote enlightened practices on the back of the construction works
relating to the 2012 Olympic Games.
Egan’s (1998) initial agenda and the subsequent emphasis on instrumental targets were in
no small way directed at overcoming industry failings caused by sector fragmentation.
However, the overwhelming tendency was to focus on the ‘barriers to change’ as if such
barriers were static entities. There has been little attempt to understand the way in which
the advocated best practice approaches relate to the pre-existing dynamics of industry
change.
It must also be recognised that the construction sector has never really existed as a
coherent entity and the causes of fragmentation are deeply-rooted (Rabeneck, 2007).
Furthermore, since the late-1970s, industry fragmentation has been exacerbated by the
vicissitudes of successive policy and procurement initiatives which have acted
accumulatively to encourage the growth of self-employment (Harvey, 2003). The demise
of the public sector Direct Labour Organisations (DLOs) also did much to erode the

4
industry’s traditional training base. These factors combined to reinforce the adopted
model of ‘structural flexibility’ as the key means of achieving competitive advantage
(Winch, 1998). The end result is a contracting sector dominated by ‘hollowed-out’ firms
with few direct employees, thereby raising concerns about the industry’s absorptive
capacity and its ability to innovate (Gann, 2001). The Egan initiative was therefore
directed at a sector that was already locked into a ‘low road’ development path (Best,
1990; Bosch and Philips, 2003) and the isomorphic forces at work were not so easily
overcome. Hence it is not surprising that progress in implementing the improvement
agenda has subsequently been described as ‘slow and patchy’. Certainly there has been
little willingness to reinforce the rhetorical exhortations of the Egan Report (Date?)
through regulation or institutional reform.
Progress has undoubtedly been made in overcoming the industry’s more overt adversarial
practices, and the construction sector has made significant progress in embracing new
(digital) technologies. But the quest for rationalisation has arguably encouraged a reliance
on routine and structured approaches at the expense of imagination, innovation and
professionalism (Hughes, 2003). In this respect, the continuous advocacy of key
performance indicators (KPIs) is part of the problem rather than part of the solution.
Moreover, a review of the annual data shows that performance against most indices has
reached a plateau, often with little overall improvement (DBERR, 2008).
Others have alluded to the possibility that the Egan agenda may have served to legitimise
trends that were already happening, rather than challenge the basis of existing embedded
practices (Green et al, 2008). But most telling of all is the way in which the improvement
agenda remains of marginal relevance to the day-to-day challenges faced by the majority
of firms in the construction sector. The Big Ideas project therefore set out to engage with
the day-to-day realities of those who have felt marginalised by the currently accepted
discourse of industry improvement.
But an even more striking observation is that the post-Egan improvement debate has been
too focused on improving industry performance as measured by the needs of today; there

5
has to date been little attempt to focus on what needs to be done if the sector is to serve
the needs of society tomorrow. And here lies a further important message from the Big
Ideas project: the challenges of the future will not be the same as the challenges of the
present. Climate change, global economic re-structuring, demographic change and an
increasing emphasis on social inclusion provide just a few pointers towards future
challenges to be faced. Such challenges are entirely beyond the reach of those current
best practice ideas which focus almost exclusively on productivity, efficiency and
improving collaborative working.
Research methodology
Overview
The research sought to address construction sector competitiveness from a systems
perspective. Too many previous research projects were seen to focus on narrowly defined
issues of productivity to the detriment of broader considerations. The Big Ideas project
set out to build on the tradition of socio-technical systems analysis pioneered by the
Tavistock Institute (1966). Central to this approach was the recognition that organizations
comprise both a technological production system and a social system of the people
managing and operating the technology. The Tavistock (1966) report advocated
‘collaborative leadership for change’ as the model of future action. The themes of
collaboration, learning and a process view were subsequently emphasised by Latham
(1994) and Egan (1998), but without the rigour of the underlying socio-technical systems
analysis. Adopting a systems perspective on construction sector performance focuses
attention onto the inter-connectivity and relationships between different parts of the
sector. It further emphasizes the ‘emergent’ (often undesirable) properties that arise from
the way the parts are organized. It is particularly important to understand how the
behaviour of individual decision makers is structured by their function within the wider
system (Winch, 2002).

6
Whilst rooted in the 1960s, systems approaches have developed significantly in recent
years. A diversity of techniques are now available that enable both structural and cultural
issues to be addressed and modelled (Jackson, 2000; Mingers and Gill, 1997; Mideley,
2000; Rosenhead and Mingers, 2001). The current research sought to follow the
principles of a ‘multimethodology’ research design (Mingers, 2001). In addition to
system dynamics (SD), the broader research project was informed by the soft systems
methodology (SSM, Checkland (1981). SD is frequently used as part of multi-
methodology approaches and can be usefully combined with cognitive mapping and SSM
(Coyle and Alexander, 1997; Mingers and Rosenhead, 2001).
Appropriate use was also made of a wide range of interpretative research approaches.
The methodology in its totality was specifically designed to deal with related aspects of
the construction sector: (i) underlying social structures, (ii) differing personal constructs
and rationalities, and (iii) underlying causal structures. These interacting influences are
seen to be central to the dominant industry recipe of competitiveness, and yet they are
rarely taken in account by those who advocate industry improvement. Their explicit
recognition guards against the reductionist tendencies of many previous construction
sector research projects.
System dynamics
SD was initially developed by Forrester (1961) to reflect the view that the dynamics of
industrial systems result from underlying the structure of flows, delays, information and
feedback. Mathematical models of the relations between system components are
constructed and the model is run as a computer simulation. Interest in SD has been
stimulated by the availability of graphical software and Senge’s (1990) popularisation
within the context of the learning organisation. In contrast to Forrester’s original
conceptualisation, the modelling process is now primarily seen as a vehicle for the
development of learning and social coordination (de Geus, 1994; Sterman, 2000; Vennix,
1996). SD modelling focuses attention onto complex relationships and creates an
environment that enables wide participation by diverse stakeholders. The elements of a
system are modelled to interact through mutually causative feedback loops thereby

7
providing an enhanced understanding of selected dynamic features of current trends and
policies which determine the construction sector’s development. Rather than attempt to
model the construction sector as a whole, aspects were selected for modelling on the
basis of perceived importance and likely impact as identified in the concurrent empirical
research. For example, the decline of traditional construction skills in local communities
was highlighted by many participants as an issue of concern.
SD modelling has been widely implemented as a means of strategy support. Particular
examples include Dangerfield and Roberts’ (2000) strategic evaluation of capacity
retirements in the UK steel industry where they demonstrated how policies adopted in
response to a depressed financial performance only laid the basis for yet further financial
tensions at a later point in time. The steel industry study was seen as especially relevant
given current concerns regarding the future capacity of the UK construction sector.
Bajracharya et al’s (2000) case study of the infrastructure for training activities in the
Nepalese construction sector is another example of the use of SD for an issue of strategic
importance.
SD modelling can be especially powerful in challenging the mental models of those
involved. The active participation of industry representatives has been an essential
component of the adopted approach in this research. It should be emphasised that
multiple policy insights can be derived from the modelling process itself. The approach
focused on simulation runs across a range of policy choices and future scenarios. The SD
models were further used in their own right as a scenario generation tool to supplement
the futures studies described in Goodier et al (2007, 2009). An additional benefit of the
SD modelling process related to the insights into the ways in which dynamic structural
relationships may impede or facilitate desired industry change..
Furthermore, ‘microworlds’ were developed in the form of management flight-simulators
(Morecroft, 1984) thereby helping foster learning by senior industrialists and policy
makers. A microworld is essentially an interface to the model that enables participants
with limited quantitative skills to rehearse policy interventions and ultimately to grasp the

8
learning coming from the model. One of the key strengths of participative approaches to
SD modelling is the way that it combines research outcomes with an ongoing
commitment to dissemination. The preferred software in the Big Ideas project was
VENSIM. This has previously been found to be sufficiently robust to enable the
modelling of complex dynamic systems, whilst providing excellent transparency for non-
specialist users.
System dynamics modelling at the firm level
Multiple models
Data was sourced from concurrent empirical research into the way in which
competitiveness is enacted within regional contracting firms. This provided the necessary
information to enable a series of multiple cause-and-effect analyses to be performed
using SD. The first stage of the SD modelling process involved the development of
influence diagrams from the cognitive maps produced by researchers from the University
of Loughborough. A fragment of one of the influence diagrams is included as figure 4. In
accordance with the overall philosophy of the proposal, particular attention was given to
the broader systemic implications of current trends and policies. In recognition of the
complex and multi-perspective nature of construction competitiveness, different SD
models were prepared at different levels of aggregation: firm, sector and national. This
paper concentrates only on the former: contracting firms acting in competition. .
Competiveness model
The most significant stream of SD modelling work involved the formulation of a model
which reflects a competitive situation and allows performance of an individual
constituent entity (a contracting firm in this case) to be evaluated in the light of different
policies. To this end a generic contractors’ model was formulated. The model
incorporated three stylised general contracting firms, A-C, in competition (although any
number of competitors could have been used). The methodology allows various resources
to be modelled – materials, money, people – but, moreover, also considers the policies

9
which govern the management of these resources which, in turn, determine the firm’s
competitive strength. The model, when run, dynamically traces out the performance of
individual variables over a period of time. If a firm is under-performing then its
‘competitors’ can react and secure a further advantage.
The purpose of this study was to assess policy issues and highlight those which might
result in a sustained performance, as opposed to policies which might predicate
intermittent crises. The model did not purport to produce a ‘forecast’ of what might
happen to a real-life construction firm, but rather it is an instrument of learning – to
suggest how some policies can lead to competitive benefits whilst others are deficient or
capable of producing unexpected behaviour. The notional contracting firms are generic
although their structure mimics typical firms in the industry and both that and the model’s
parameters have been determined through interviews with industry executives. Although
the firms in this model are generic, it would be perfectly possible to parameterise one of
them to equate with a particular real-world contracting firm.
High-level map
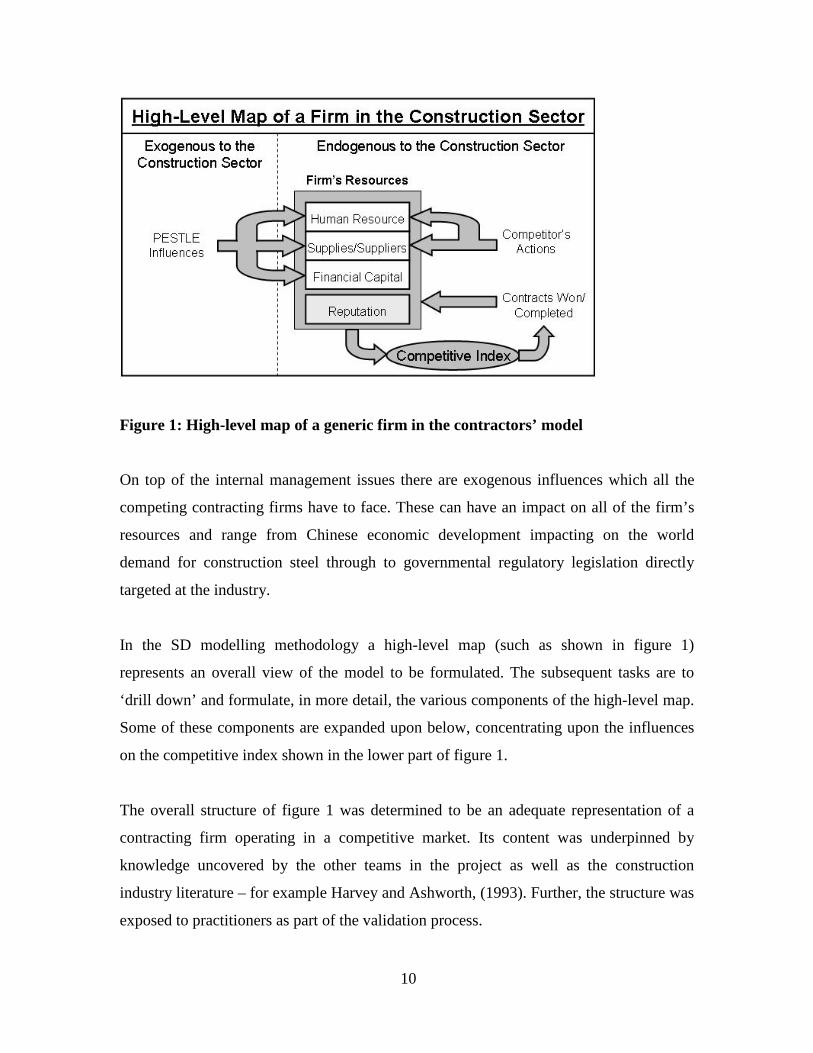
A representation of the overall view of the contractors’ model in the form of a high-level
map is depicted in Figure 1. It shows that the typical contracting firm must manage
human resources, money and materials. Its performance is affected by its competitor’s
actions but, aside from them, there are other issues which affect a firm’s reputation and
which in turn have largely been determined by its own actions. These include control of
project over-runs, late starts and financial shortfalls. These sort of issues affect a
contracting firm’s competitive position and thus its ability to win further contracts in the
market place.
10
Figure 1: High-level map of a generic firm in the contractors’ model
On top of the internal management issues there are exogenous influences which all the
competing contracting firms have to face. These can have an impact on all of the firm’s
resources and range from Chinese economic development impacting on the world
demand for construction steel through to governmental regulatory legislation directly
targeted at the industry.
In the SD modelling methodology a high-level map (such as shown in figure 1)
represents an overall view of the model to be formulated. The subsequent tasks are to
‘drill down’ and formulate, in more detail, the various components of the high-level map.
Some of these components are expanded upon below, concentrating upon the influences
on the competitive index shown in the lower part of figure 1.
The overall structure of figure 1 was determined to be an adequate representation of a
contracting firm operating in a competitive market. Its content was underpinned by
knowledge uncovered by the other teams in the project as well as the construction
industry literature – for example Harvey and Ashworth, (1993). Further, the structure was
exposed to practitioners as part of the validation process.

11
The Competitive Index
The factors affecting a contracting firm’s reputation are handled in the model by the
establishment of a competitive index. This is a means to embrace the range of factors
which impact on competitiveness and implicitly recognises that the concept it is a multi-
dimensional one. The references to Lu (2006) and Sha et al (2008) in respect of the
Chinese construction industry reveal that this is not a new idea. But whereas their index
formulations are used on ex post construction industry data, ours is embedded in a
dynamic model and so is continually being re-computed ‘on the fly’ as the simulation
proceeds.
The design of the competitive index is as depicted in figure 2 for a single contracting
firm. The spokes leading to the central ellipse are competitive factors (CF) each of which
contribute to the calculation of the overall competitive index (CI) for that firm. The
factors are each assigned weights (W). The spoke lengths are variable reflecting the
strength of that factor at varying points in time. Lengthening of the spoke length may
reflect an improved performance if the competitive factor was, say, revenue and a
deteriorating performance if it reflected a late completion time on the contract. These
spoke lengths can and do vary as the model simulation proceeds through time. The
weights on the other hand will not: they reflect the relative importance of each
competitive factor in the given market. This is emphasised by the diameter of the nodes
representing the weights at the end of each spoke.

12
Figure 2 – Diagrammatic representation of the competitive index as used in the
model
The mathematics involved is highlighted in figure 2. The weights are constrained to sum
to 1.0 and the value of each competitive factor is normalised to a scale of 0-1. This is
achieved by determining the best (largest or smallest as appropriate) of the three
competing firm’s values for a given CF and awarding this the value of 1.0. The other
(two) values are then calculated as pro-rata values against the best value. This is the
mechanism used by the World Bank to determine the competitiveness of different
nations. It should be noted that this is not the same normalisation process as that adopted
by Sha et al (2008). The approach they have adopted ensures that the full range of the
scale is used. Thus, under their method, one firm will always score 0 and another 1.0 on
any given competitive factor.
On the other hand the method we have adopted allows one to determine how far off the
‘best’ any given firm is for any given competitive factor. For instance, it can be seen that

13
the hypothetical firm depicted scores the best for competitive factor 1 but is only at 75%
of the normalised benchmark for CF’s 2 and 4. It performs worst on CF 5 where it is at
only 50% of the normalised benchmark and this performance might prove costly since
CF 5 has the largest weight. All of this assumes that, for all CF’s, largest is best.
The competitive index (CI) is the weighted sum of the individual weights times the
normalised values of each competitive factor. It must result in a value in the range of 0 to
1.0 and is re-computed at every time step in the simulation. A firm will be awarded
contracts in proportion to its own CI value over the sum of all firms’ CI values. In this
way its ‘reputation’ (figure 1) is fed back into its ability to secure future contracts. It
should be understood that this means that if each of the three firms have the same CI
(whether that be, say, 0.33, 0.5, 0.6 or indeed 1.0) they will each receive the same share
of the contracts on offer in the market: one-third in this case.
Sectors of the model
The model has three main sectors: contracts and work-in-progress; finance; and human
resources. The first of these is shown in figure 3. Although there are assumed to be three
competing firms in this market the diagrammatic representation is common: the differing
firms are handled by an array facility in the software employed. The rectangles represent
stocks (accumulations) whilst the valve symbols depict management control and thus the
policy leverage points. Raising or lowering a flow affects the stock immediately before
and/or after it. Two policy domains which are suggested by a consideration of figure 3
are, firstly, the allocation of contracts and whether to bid aggressively or take a measured
view on future undertakings. Another obvious policy consideration surrounds the
management of work-in-progress. Under-performance here will result in late contract
completion – a major factor determining a contractor’s reputation.

14
Figure 3 – Flow diagram of the contracts and work-in-progress sector
The fraction of contracts allocated to each firm is, in a raw bidding process, determined
by the competitive index as described above. Within the model the influences on this are
as illustrated in figure 4. These number four: completion delay; start delay; financial
factors; and workforce factors.
Competitive Index
CF start delay<average actual
start delay>
normalised startdelay
CF completiondelaynormalised
completion delay
<average actualcompletion time>
weight for startdelay
weight forcompletion delay
weight for financenormalised financial
resource<FirmWorkforce>
normalised humanresource
weight for humanresource
<Annualprofit/loss>
Figure 4 – Influences on the competitive index in the model (Note: variables in angled
brackets represent those computed in another model sector)

15
The remaining sectors consist of (i) finance and (ii) human resources including those
employed directly by the firm and those sub-contracted. The financial sector is simply a
revenue-in: costs-out arrangement, although fresh accumulations are made each year to
mimic the normal annual financial reporting period. The simulations cover a period of 15
years and the fixed time step is one-eighth of a year. The parameter values currently
adopted in the model are listed in Table 1. Obviously these can be changed very easily;
indeed a parameter change may form a component of a strategic policy experiment.
Parameter Values
The following are the main parameter values in the model:
Delay in starting contract (normal) 1.5 yearsDelay in completing contract (normal) 1 yearNew contracts put on offer 50/yrHiring lag 1 yearSub-contracting lag 3 monthsAverage number of employees on site (per contract) 50 peopleAverage revenue per contract p.a. £4 millionDelay in receiving money 3 monthsDelay in paying money 3 monthsAverage supply cost per contract p.a. £0.5 millionAverage cost per employee £20,000 pa
Table 1: Main parameter values in the model
Validation of model sectors
The model described above is formulated on the basis of information gleaned by the other
teams involved in the project, together with general knowledge from the construction

16
literature. It is, therefore, a generic model. The best way to validate a generic model of
this nature is to expose it to the scrutiny of industry experts. Accordingly, a session was
held where invited participants were taken through the detail of the model and their
comments recorded. The participants were asked three questions:
• Can you identify any fundamental flaws in the model as shown?
• Do you consider there is anything which needs adding to the
model?
• Please identify up to 3 issues or causes of concern for which the
model might be employed to provide a better understanding
In response, for instance, mention was made of the importance of differentiating between
own employees and sub-contracted employees in the human resource sector. Also, the
practice of over-trading, when contractors bid even though they don’t have the necessary
workforce or resources available, was stressed as being something the model needed to
deal with.
Had the model been of a specific contracting firm, arguably the model validation process
might have been more straightforward. Firm executives would be extremely familiar with
the structure and policies of their own firm. Further, there would most likely be some
data against which to compare model output and so allow a calibration of the firm’s
behaviour over time.
Concluding remarks
It should be stressed that although system dynamics modelling was an important
component of the ‘Big Ideas’ project, it was but one element of an overall methodology
which emerged from the synthesis of the different work activities at the three
universities. Space prevents detailed discussion of the experiments which have been

17
conducted with the SD model described. For more detail on some of the experiments
conducted, including the graphical output, see Dangerfield, Quigley and Kearney (2008a
and 2008b). For instance, the strength of competitive behaviour (how avidly the firm
pursues new contracts) has been shown to be a determinant of profitability. The more
aggressive competitive behaviour produces the most severe oscillations in profits. A
more measured approach produces oscillations which are much more attenuated
(Dangerfield, Quigley and Kearney, 2008b). It is planned to assess the merits of
frameworks as an approach to future contracting behaviour.
The over-riding conclusion is that the system dynamics methodology has been shown to
be capable of providing a means to assess the forces which shape the sustained
competitiveness of construction firms. As such, it takes the assessment of strategic policy
analysis in the construction sector onto a higher plane. The need to collect data and make
retrospective assessments of competitiveness and strategic performance at the statistical
level is not now the only modus operandi available. Models which capture the causative
factors operating in the real-world and allow easy experimentation offer a new paradigm
for research on construction sector performance.
Whilst the research described has demonstrated the utility of SD modelling in strategic
policy evaluation in construction at the proof of concept level, more widespread adoption
of it at the level of the individual firm is called for. The team engaged with a small
number of individual firms towards the end of the project in an effort to disseminate the
overall methodology which emerged from the study. Generic models, such as the one
described above, can prove useful in engaging academia but more needs to be done by
individual firms to show a willingness to go forward with a model-based methodology
for their strategic planning.
However, within the broader context of the Big Ideas project as a whole, the research has
demonstrated the possibility of combining quantitative modelling techniques such as
system dynamics with qualitative case study research. Data from the case studies can
usefully be used to inform the modelling process, and the outcomes from the modelling

18
process can initiate discussions which lead to fresh approaches. It has been found to be
crucial to possess an in-depth understanding of the challenges faced by contractors prior
to engaging in participative modelling workshops.
Contextual understanding is vital. But apart from issues of substance, it is also important
to be able to adopt the language that practitioners use to make sense of the challenges that
they face. It has been demonstrated that system dynamics modelling can lead to important
new insights with direct implications for practice. However, it has also been
demonstrated that construction practitioners will only engage with the modelling process
if the researchers are able to demonstrate a broad contextual understanding of the
challenges faced by contracting firms. The prevailing tendency is to focus on the ‘barriers
to change’ as if such barriers were static entities. There has been little attempt to
understand the dynamic inter-relationship between the differing factors which impinge
upon construction sector competitiveness. Significant work also remains to be done at the
level of construction sector policy in terms of the advocated key performance indicators
(KPIs). System dynamics offers the means of evaluating the dynamic interaction between
different factors. For example, to date there has been no work to explore the possible
feedback effects that may be implicit within 2012 Construction Commitments.
References
Bajracharya, A., Ogunlana, S. O. and Bach, N. L. (2000) Effective organizational
infrastructure for training activities: a case study of the Nepalese construction sector,
System Dynamics Review, 16, 91-112.
Best, M. H. (1990) The New Competition: Institutions of Industrial Restructuring,
Harvard University Press, Cambridge, MA.
Bosch, G. and Philips, P. (Eds) (2003) Building Chaos: an International comparison of
Deregulation in the Construction Industry, Routledge, London.

19
Checkland P (1981) Systems Thinking, Systems Practice, Wiley, Chichester.
Coyle, R. and Alexander, M. (1997) Two approaches to qualitative modelling of a
nation’s drug trade, System Dynamics Review, 13, 205-22.
Dangerfield, BC and Roberts, CA (2000) A strategic evaluation of capacity retirements
in the steel industry, Journal of the Operational Research Society, 51(1), 53-60.
Dangerfield BC, Quigley M and Kearney JR (2008a) A Dynamic Policy Model to Manage Temporal Performance amongst Contracting Firms in a Competitive Situation. Procs of the Transformation through Construction conference, CIB W65/55, Dubai, 2008. Dangerfield BC, Quigley M and Kearney JR (2008b) A Dynamic Policy Model to Manage Temporal Performance amongst Contracting Firms in a Competitive Situation. Procs of the International System Dynamics Conference, Athens. http://www.systemdynamics.org/conferences/2008/proceed/index.html (Accessed 28 January 2010) DBERR (2008) Construction Statistics Annual, 2008, Department of Business, Enterprise
and Regulatory Reform, London.
Egan, J. (1998) Rethinking Construction: Department of the Environment, Transport and
the Regions (DETR), London.
Forrester, J. (1961) Industrial Dynamics, MIT Press, Cambridge, MA. (Now available
from Pegasus Communications, Waltham, MA.)
Gann, D. (2001) Putting academic ideas into practice: technological progress and the
absorptive capacity of construction organisations, Construction Management and
Economics, 19, 321-330.
de Geus, A. P. (1994) Modeling to predict or to learn? In, J.D.W. Morecroft and J.D.

20
Sterman (eds) Modeling for Learning Organizations, Productivity Press, Portland, OR.
Goodier, C. I., Soetanto, R., Dainty, A. R. J., Austin, S. A., Price, A. D. and Harty, C.
(2007) A competitive future for UK construction?, Construction Information Quarterly,
9(4), 169-174.
Goodier, C. I., Austin, S. A., Soetanto, R. And Dainty, A. R. J.,Causal mapping and
scenario building with multiple organisations, accepted for publication in Futures,
doi:10.1016/jfutures.2009.11.007.
Green, S. D., Harty, C. F., Elmualim, A. A., Larsen, G. and Kao, C. C. (2008a) On the
discourse of construction competitiveness, Building Research & Information, 36(5), 426-
435.
Green, S. D., Larsen, G. D. and Kao, C. C. (2008b) Competitive strategy revisited:
contested concepts and dynamic capabilities, Construction Management and Economics,
26(1) 63-78.
Harty, C., Goodier, C.I., Soetanto, R., Austin, S.A., Dainty, A.R.J. and Price, A.D.F.
(2007) The futures of construction; a critical review of construction futures studies.
Construction Management and Economics, 25 (5): 477-493.
Harvey, M. (2003) Privatization, fragmentation and inflexible flexibilization in the UK
construction industry, in Building Chaos: A International Comparison of Deregulation in
the Construction Industry (Eds. G. Bosch and P. Philips), Routledge, London, pp. 188-
209.
Harvey RC and Ashworth A (1993) The Construction Industry of Gt Britain,
Butterworth-Heinemann, Oxford.
Hughes, W.P. (2003) De-professionalised, automated construction procurement. In

21
Foxell, S. (Ed.) The Professionals’ Choice: The future of the built environment
professions. Building Futures, London.
Jackson, M.C. (2000) Systems Approaches to Management, Klumer Academic, New
York.
Latham, M. (1994) Constructing the Team, HMSO, London.
Lu, W.S. (2006) A system for assessing and communicating contractors’
competitiveness. Unpublished PhD thesis, Department of Building and Real Estate, Hong
Kong Polytechnic.
Midgley, G. A. (2000) Systemic Intervention: Philosophy, Methodology and Practice,
Klumer Academic, New York.
Mingers, J. and Gill, A. (1997) Multimethodology: The Theory and Practice of
Combining Management Science Methodologies, Wiley, Chichester.
Mingers, J. (2001) Multimethodology – mixing and matching methods, in J. Rosenhead
and J. Mingers (eds) Rational Analysis for a Problematic World Revisited, 2nd edn.,
Wiley, Chichester, pp 289-309.
Morecroft, J.D.W. (1984) System dynamics and microworlds for policymakers, Eur J
Opl Res, 35: 301-320.
Senge, P. (1990) The Fifth Discipline: The Art and Practice of the Learning
Organisation, Century Books.

22
Sha, K., Yang, J., and Song, R. (2008) Competitiveness assessment system for China’s
construction industry. Building Research and Information, 36(1), 97-109.
Sterman, J. (2000) Business Dynamics: Systems Thinking and Modelling for a Complex
World, McGraw-Hill, New York.
Rabeneck, A. (2008) A sketch-plan for construction of built environment theory. Building
Research and Information, 36(3), 269-279.
Rosenhead, J. and Mingers, J. (eds.) (2001) Rational Analysis for a Problematic World
Revisited, 2nd edn., Wiley, Chichester.
Strategic Forum (2002). Accelerating Change. Rethinking Construction. London.
Tavistock Institute (1966) Interdependence and Uncertainty: A Study of the Building
Industry, Tavistock Publications, London.
Vennix, J. A. M. (1996) Group Model Building: Facilitating Team Learning using
System Dynamics, Wiley, Chichester.
Winch, G. (1998) The growth of self-employment in British construction, Construction
Management and Economics, 16, 531-42.
Winch, G. (2002) Managing Construction Projects, Blackwell, Oxford.
Related Documents


