Understanding Climate Change NSTA March 10, 2011 Mort Sternheim [email protected] Rob Snyder [email protected] STEM Education Institute University of Massachusetts Amherst # 0732945

Understanding Climate Change NSTA March 10, 2011 Mort Sternheim [email protected]@umassk12.net Rob Snyder [email protected]@umassk12.net STEM.
Dec 24, 2015
Welcome message from author
This document is posted to help you gain knowledge. Please leave a comment to let me know what you think about it! Share it to your friends and learn new things together.
Transcript
Understanding Climate ChangeNSTA
March 10, 2011Mort Sternheim [email protected]
Rob Snyder [email protected] Education Institute
University of Massachusetts Amherst
# 0732945
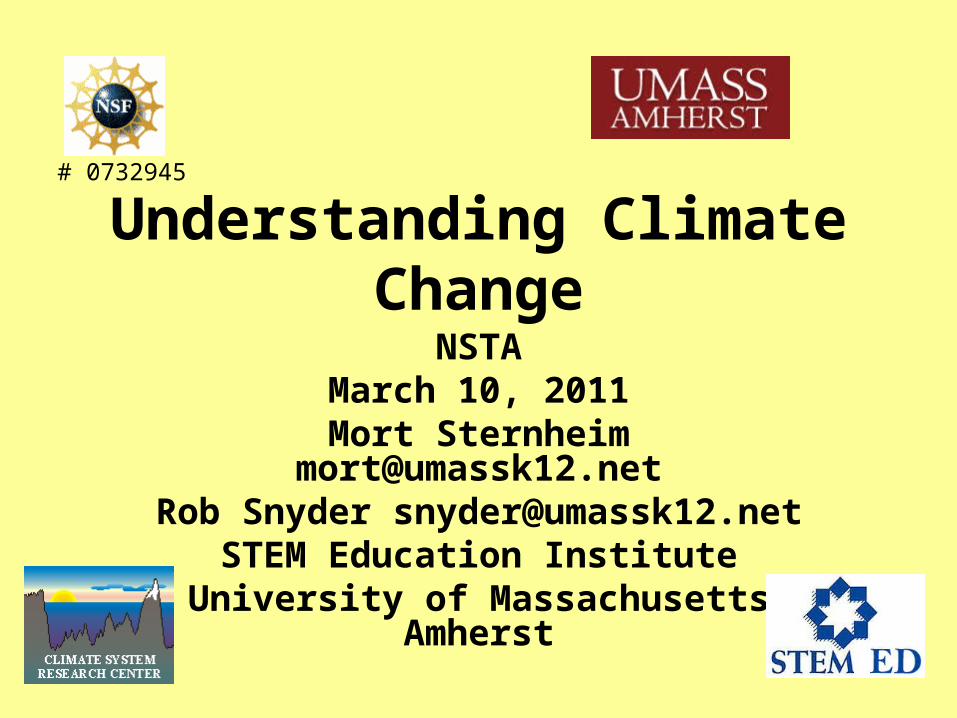
Climate Change Education Provides Opportunities for Students To:
1. Develop Spatial Thinking Interpret maps, diagrams, graphs, charts, animations and
models.2. Develop Temporal Thinking
Understand how the history of climate change is discovered and future changes predicted.
3. Understand Earth as a Complex System Explore feedbacks that occur between and among
components of Earth’s Climate System.4. Learn in the Field
Collect and analyze real time data and observations.
How Geoscientists Think and Learn, Kastens et al., EOS,Transactions, American Geophysical Union; August 4, 2009, p. 265
1. Examples of Spatial Thinking Questions• Why does Earth’s rotation, axial tilt and
orbital motion result in seasonal changes in lengths of daytime and the angle of incidence of sunlight?
• How might changes in the Earth’s orbit and axial tilt influence climate cycles?
• How would sea level rise impact coastlines?

Diagrams are often used in an attempt to have students develop spatial thinking and to understand
seasonal changes in the position of the sun in the sky and the lengths of daytimes.
http://okfirst.mesonet.org/train/meteorology/Seasons.html
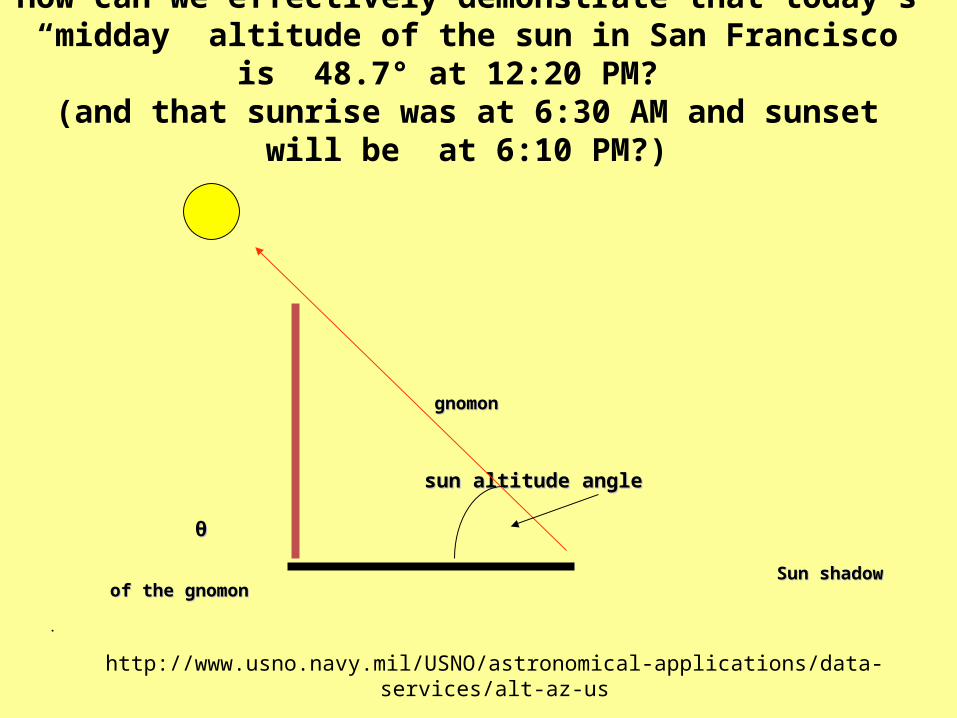
How can we effectively demonstrate that today’s “midday” altitude of the sun in San Francisco is 48.7° at 12:20 PM?
(and that sunrise was at 6:30 AM and sunset will be at 6:10 PM?)
gnomongnomon
sun altitude anglesun altitude angle
θθ Sun shadow of the gnomonSun shadow of the gnomon
. .
http://www.usno.navy.mil/USNO/astronomical-applications/data-services/alt-az-us

The “Globe Walk” demonstration/activity provides a better opportunity for students to develop spatial thinking that
relates to an understanding of seasonal and climatic change.
• Put a model of the sun in the center of the room.• Move a model Earth to its position in orbit for today’s date.• Locate a point on Earth for San Francisco.• Rotate the globe so it is midday in San Francisco.• Use a straw to point from San Francisco to the model sun.• Use another straw to point south from San Francisco.• Measure the angle formed by the two straws.
The Globe Walk can also demonstrate seasonal changes in the length of daytime.
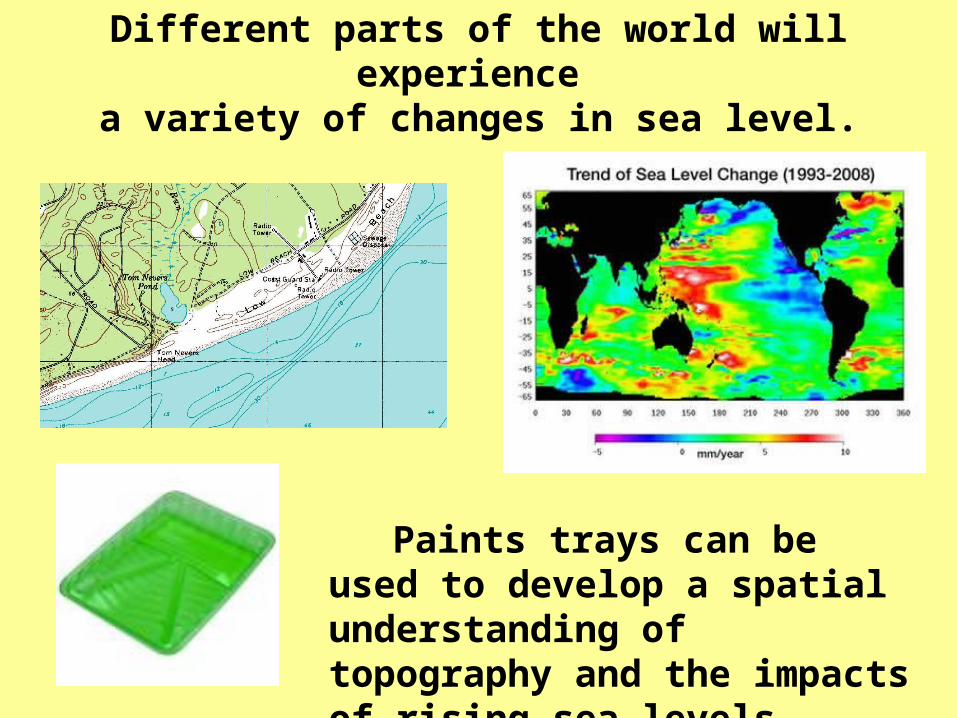
Different parts of the world will experience a variety of changes in sea level.
Paints trays can be used to develop a spatial understanding of topography and the impacts of rising sea levels.
2. Examples of Temporal Thinking Questions
• How do we “go back in time” to construct a long term history of climate change?
• How do ancient levels of CO2 compare with present day concentrations?
• How can we infer the long term history of Earth’s temperature using stable isotopes of oxygen?
Some of the many factors that have influenced Earth’s climate history include:
• Solar Activity• Volcanic eruptions• Concentrations of “greenhouse gases• Particulates from combustion and wind
blown dust• Changes in Earth’s albedo• Changes in Earth’s axial tilt• Changes in Earth’s orbital eccentricity

A study of the Milankovitch Cycledevelops both spatial and temporal thinking.
Milutin Milankovitch is credited with formulating the theory that gradual changes in Earth’s axial tilt and orbital eccentricity contributed to the pattern of climate change. His theory can also be explored using the “Globe Walk.”
http://en.wikipedia.org/wiki/Milankovitch_cycles

The Holocene Epoch began about 12,000 years ago. The result was the end of the most recent ice age and the present
warming trend.
The early Holocene warming was due principally to orbital changes as suggested by the Milankovitch Theory. However, the differences between aphelion and perihelion distances are greatly exaggerated in these diagrams.

9 of the 10 warmest years have occurred since 1990Inter-annual range: ~1.2°C (±0.6 °C)30-year mean range: ~0.5°C (±0.25 °C)
Interpreting graphs of climate history develops temporal thinking and establishes a context for a study of climate change
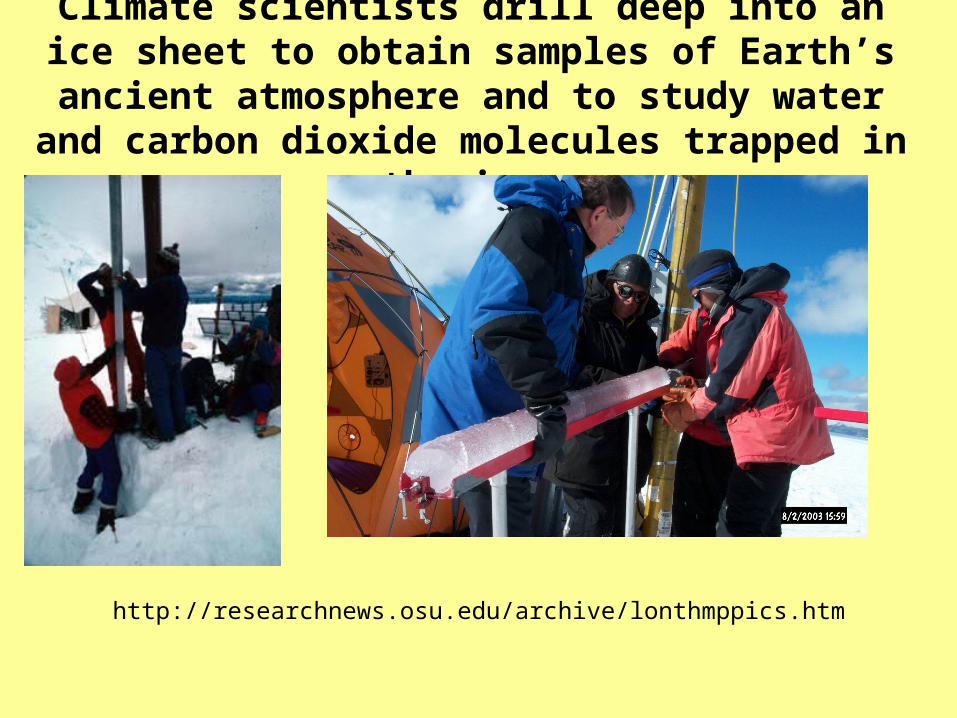
Climate scientists drill deep into an ice sheet to obtain samples of Earth’s ancient atmosphere and to study
water and carbon dioxide molecules trapped in the ice.
http://researchnews.osu.edu/archive/lonthmppics.htm
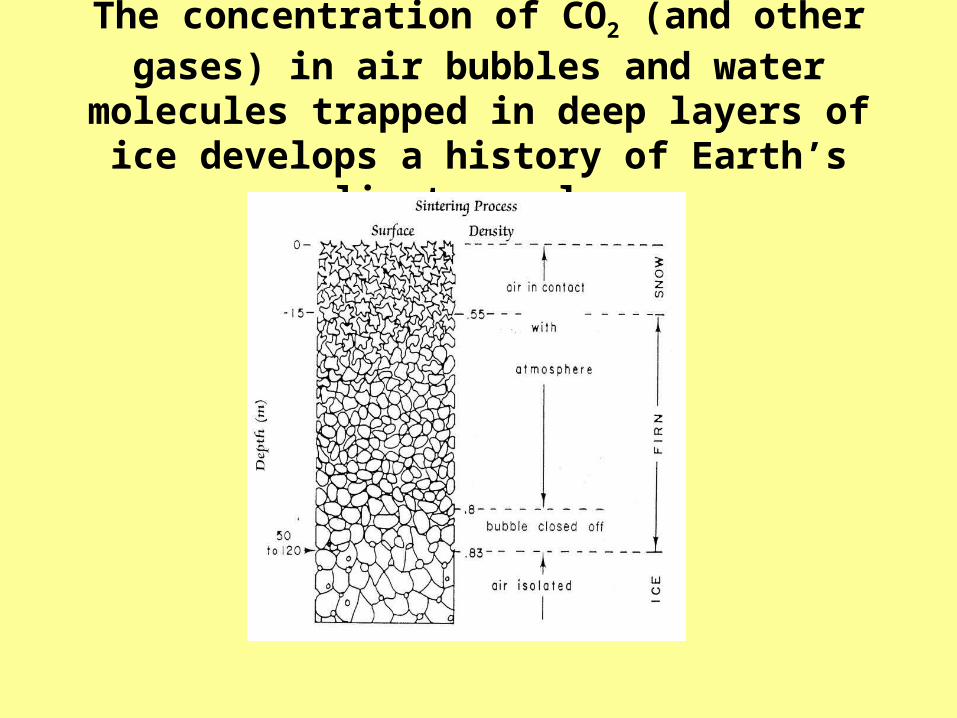
The concentration of CO2 (and other gases) in air bubbles and water molecules trapped in deep layers
of ice develops a history of Earth’s climate cycles.

Can understanding the masses of isotopes lead to understanding how we construct a temperature history?
16O1H 1H
Evaporates from oceans more readily Evaporates from oceans more readily and is transported more easily to and is transported more easily to northern latitudes before condensing.northern latitudes before condensing.
1H 1H
18O Evaporates less readily from oceans Evaporates less readily from oceans and is less effectively transported to and is less effectively transported to northern latitudes before condensingnorthern latitudes before condensing
• Mass spectrometers determine ratios of oxygen isotopes found in the layers of ice cores.• During warm periods, a greater number of more massive water molecules reached higher latitudes. This increased the ratio of 18O found in ice sheets formed in warmer periods.• During colder periods, more massive water molecules precipitated at lower latitudes and thus less 18O is found in ice sheet layers formed during colder periods.

Students can compare their CO2 own measurements with an even longer climate history obtained from ice core data.
3. Earth’s Complex Climate SystemExamples of complexities include:• Positive and negative feedbacks that either
amplify or diminish climate change.– Melting snow and ice exposes darker land and
water surfaces that absorb more of the Sun’s energy (decreasing albedo). This causes more melting in a self reinforcing cycle.
• Deep ocean currents transport matter and energy great distances over very long time periods.
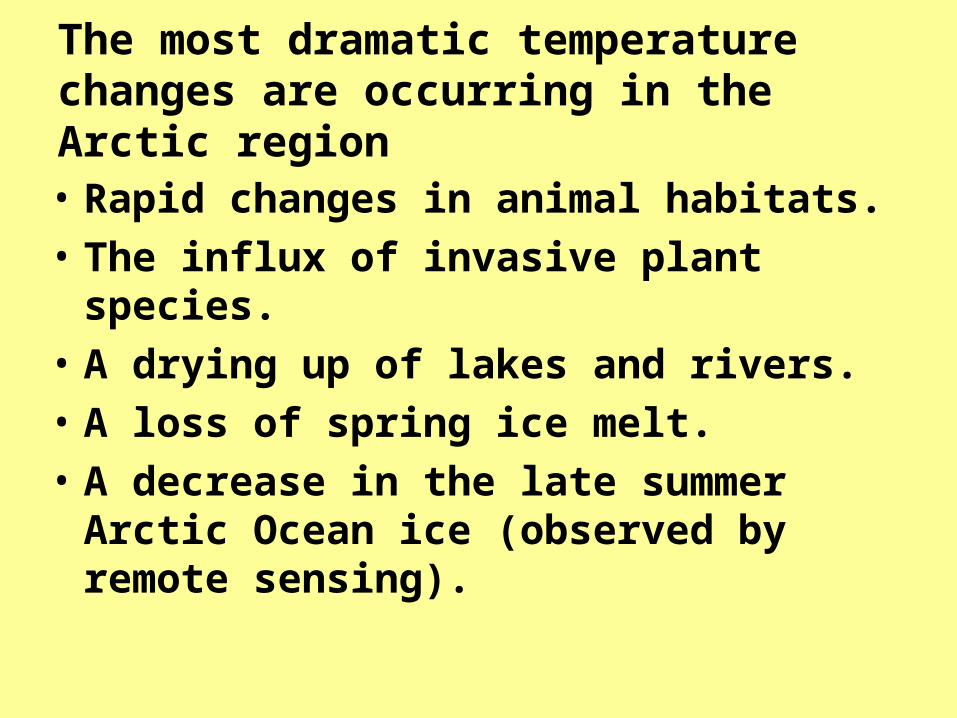
The most dramatic temperature changes are occurring in the Arctic region
• Rapid changes in animal habitats.• The influx of invasive plant species.• A drying up of lakes and rivers.• A loss of spring ice melt.• A decrease in the late summer Arctic Ocean
ice (observed by remote sensing).
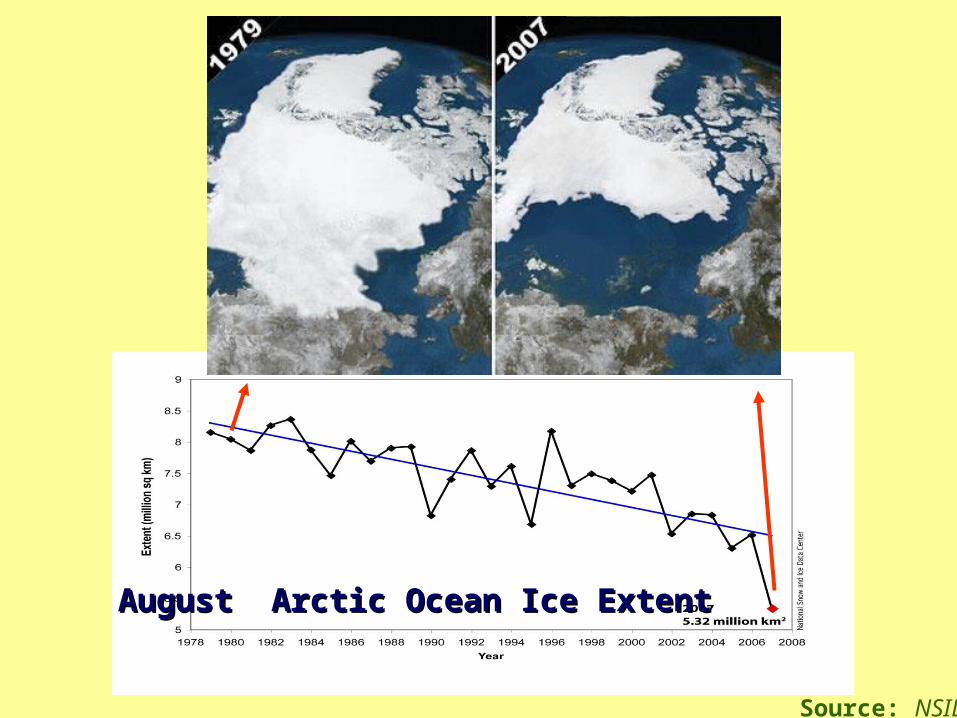
August Arctic Ocean Ice ExtentAugust Arctic Ocean Ice Extent
Source: NSIDC
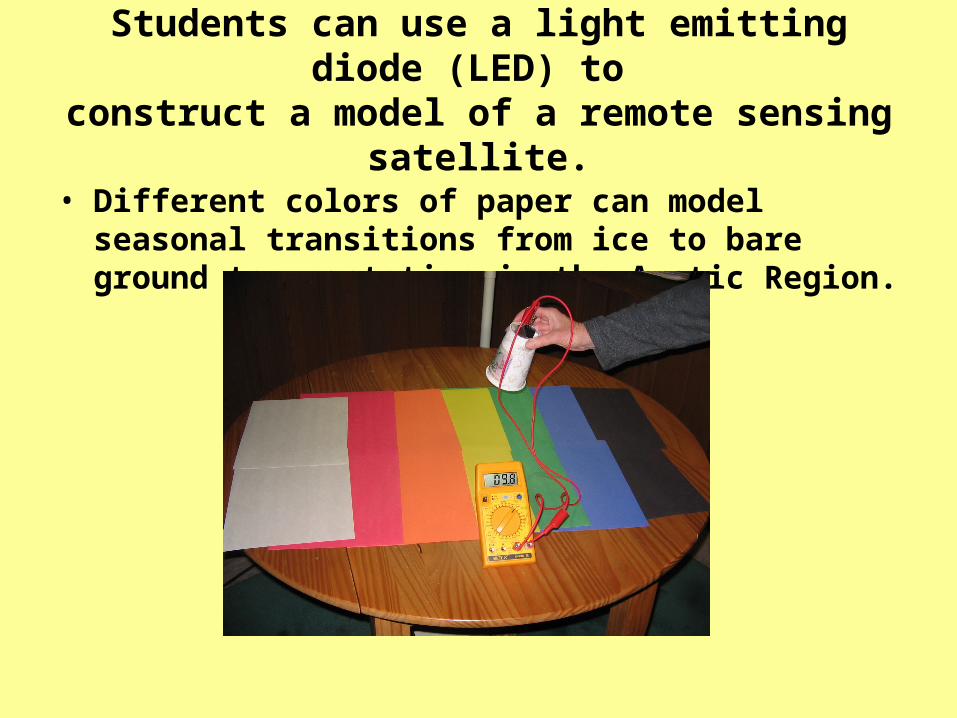
Students can use a light emitting diode (LED) to construct a model of a remote sensing satellite.
• Different colors of paper can model seasonal transitions from ice to bare ground to vegetation in the Arctic Region.
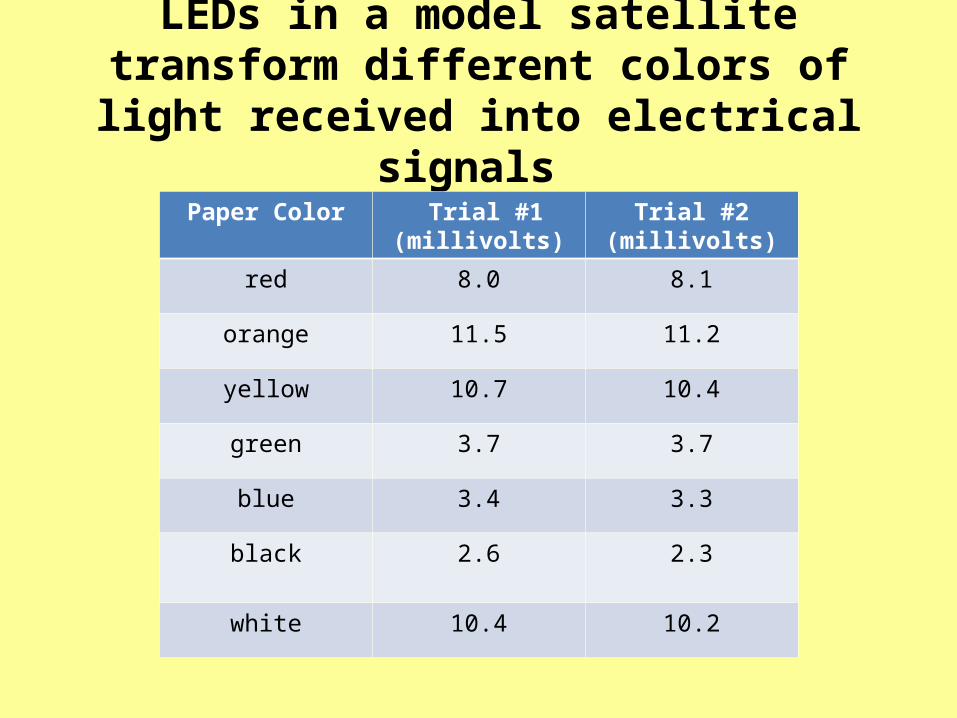
LEDs in a model satellite transform different colors of light received into electrical signals
Paper Color Trial #1 (millivolts)
Trial #2(millivolts)
red 8.0 8.1
orange 11.5 11.2
yellow 10.7 10.4
green 3.7 3.7
blue 3.4 3.3
black 2.6 2.3
white 10.4 10.2
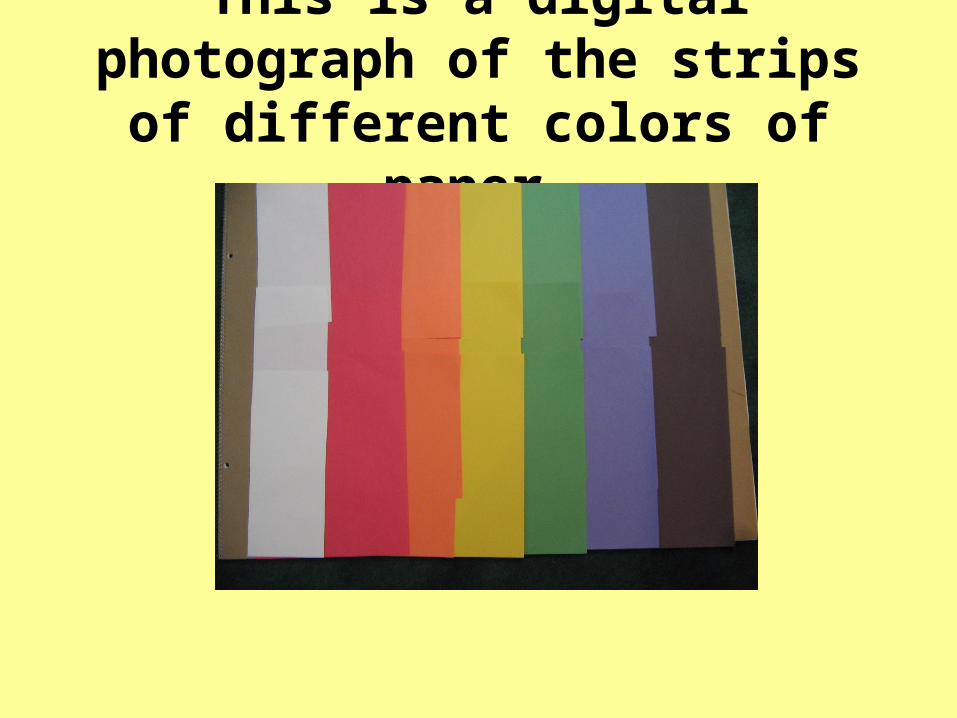
This is a digital photograph of the strips of different colors of paper.
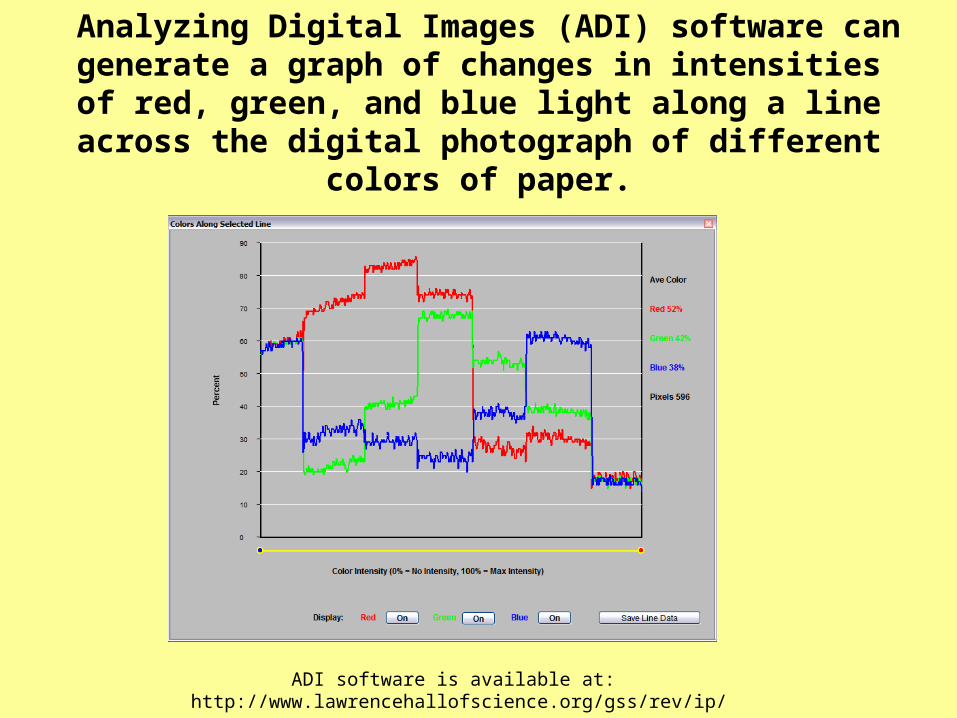
Analyzing Digital Images (ADI) software can generate a graph of changes in intensities of red, green, and blue light along a
line across the digital photograph of different colors of paper.
ADI software is available at: http://www.lawrencehallofscience.org/gss/rev/ip/
4. Field Experiences
Students can• Measure albedo and the associated warming
effects.• Measure CO2 levels and study effects of changes.• Monitor the severity of “heating seasons” and
“cooling seasons”.• Plot graphs of changing CO2 levels from modern and
ice core data (umassk12.net/ipy).• Use software and NOAA images to measure
changes in Arctic ice area (umassk12.net/digital).

Measuring albedo
• Three ways to measure albedo– Light meters. Point down, up,
find the ratio. – LED’s and multimeters. (An LED
can absorb light as well as emitting it) Same idea as light meter.
– Digital camera and free ImageJ software. Compare brightness of Xerox paper vs snow, turf, pavement ….
• Mastech Digital 4-Range 200,000 Lux Luxmeter , $55 (Amazon.com)
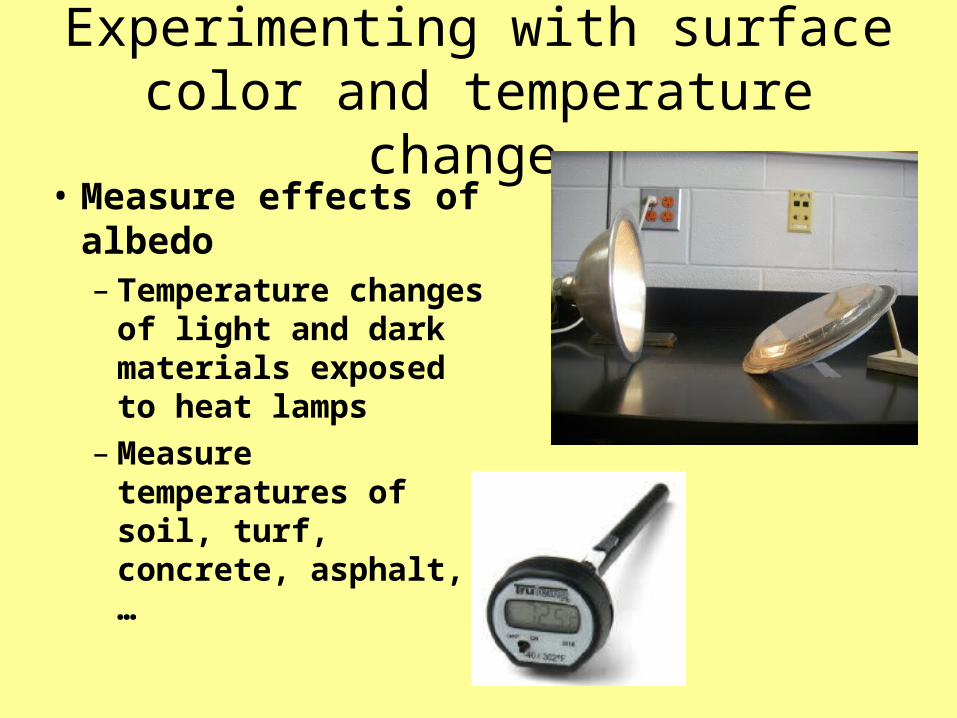
Experimenting with surface color and temperature change.
• Measure effects of albedo – Temperature changes
of light and dark materials exposed to heat lamps
– Measure temperatures of soil, turf, concrete, asphalt, …

Measure variations in CO2 levels
Gastec tubes (Ward Scientific)
Meters
bromothymol blue

CO2 measurements and effects
• Exhaled breath at rest or exercising• Classroom level changes over time• Uptake by plants• Car exhausts• Effects on Aiptasia pallida, a surrogate for coral
organisms

Analyze Heating and Cooling Seasons
• Most newspapers provide daily updates of degree day data.
• During colder months, heating degree days are published and compared with a 30 year average.
• During warmer months, cooling degree days are published and compared with a 30 year average.
• This type of analysis is described on the STEM Ed IPY web site.

Climate Change Education at UMass Amherst
The Science, Technology, Engineering and Mathematics Education Institute (STEM Ed) and the Climate System Research Center (CSRC) have developed a wide range of climate change education curriculum materials and presentations.
They are available at:www.umassk12.net/ipy
04/19/23
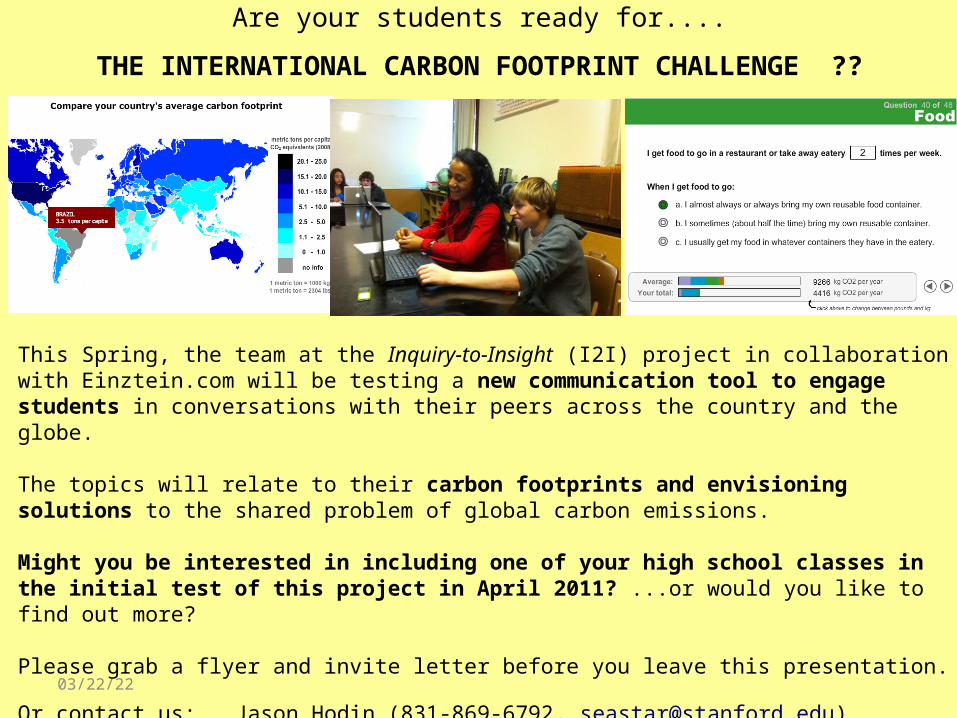
Are your students ready for....
THE INTERNATIONAL CARBON FOOTPRINT CHALLENGE ??
This Spring, the team at the Inquiry-to-Insight (I2I) project in collaboration with Einztein.com will be testing a new communication tool to engage students in conversations with their peers across the country and the globe.
The topics will relate to their carbon footprints and envisioning solutions to the shared problem of global carbon emissions.
Might you be interested in including one of your high school classes in the initial test of this project in April 2011? ...or would you like to find out more?
Please grab a flyer and invite letter before you leave this presentation.
Or contact us: Jason Hodin (831-869-6792, [email protected])Pamela Miller (831-238-7550, [email protected])
Related Documents