Understanding Boswellia papyrifera tree secondary metabolites through bark spectral analysis Atkilt Girma a,b,⇑ , Andrew K. Skidmore a , C.A.J.M. de Bie a , Frans Bongers c a University of Twente, ITC faculty, P.O. Box 217, 7500 AE Enschede, The Netherlands b Department of Land Resources Management and Environmental Protection, Mekelle University, P.O. Box 287, Ethiopia c Forest Ecology and Forest Management Group, Centre for Ecosystem Studies, Wageningen University, PO Box 47, 6700 AA Wageningen, The Netherlands article info Article history: Received 25 December 2014 Received in revised form 28 February 2015 Accepted 17 March 2015 Keywords: Boswellic acid Boswellia papyrifera Incensole acetate Plant biochemicals PLSR Spectroscopy abstract Decision makers are concerned whether to tap or rest Boswellia Papyrifera trees. Tapping for the produc- tion of frankincense is known to deplete carbon reserves from the tree leading to production of less viable seeds, tree carbon starvation and ultimately tree mortality. Decision makers use traditional experience without considering the amount of metabolites stored or depleted from the stem-bark of the tree. This research was designed to come up with a non-destructive B. papyrifera tree metabolite estimation tech- nique relevant for management using spectroscopy. The concentration of biochemicals (metabolites) found in the tree bark was estimated through spectral analysis. Initially, a random sample of 33 trees was selected, the spectra of bark measured with an Analytical Spectral Device (ASD) spectrometer. Bark samples were air dried and ground. Then, 10 g of sample was soaked in Petroleum ether to extract crude metabolites. Further chemical analysis was conducted to quantify and isolate pure metabolite compounds such as incensole acetate and boswellic acid. The crude metabolites, which relate to frankincense produce, were compared to plant properties (such as diameter and crown area) and reflectance spectra of the bark. Moreover, the extract was compared to the ASD spectra using partial least square regression technique (PLSR) and continuum removed spectral analysis. The continuum removed spectral analysis were performed, on two wavelength regions (1275–1663 and 1836–2217) identified through PLSR, using absorption features such as band depth, area, position, asym- metry and the width to characterize and find relationship with the bark extracts. The results show that tree properties such as diameter at breast height (DBH) and the crown area of untapped and healthy trees were strongly correlated to the amount of stored crude metabolites. In addi- tion, the PLSR technique applied to the first derivative transformation of the reflectance spectrum was found to estimate the concentration of the metabolites reliably at higher coefficient of determination. The most influential maximum slope positions of the spectrum obtained through PLSR analysis of the petroleum ether extract (crude metabolites) and the pure compounds (incensole acetate and boswellic acid) were found to coincide and concentrate in the region between 1383–1406 nm and 1861– 1896 nm. However, analysis on these two individual specific region absorption features relationship with the bark extract, using the continuum removed approach, was not as robust as the PLSR analysis. This reveals that the ability to estimate metabolites in the stem-bark of B. papyrifera using spectral analysis opens a new approach on how to manage B. papyrifera tree. Development of such technique pro- vides quick and reliable information for decision makers to decide on when to tap or for how long to rest the trees. However, to implement the technique, further research need to be conducted to determine how B. papyrifera tree metabolites vary due to tapping. In addition, research to determine the lowest metabo- lites quantity threshold, useful for management of the tree, needs to be conducted. Ó 2015 International Society for Photogrammetry and Remote Sensing, Inc. (ISPRS). Published by Elsevier B.V. All rights reserved. http://dx.doi.org/10.1016/j.isprsjprs.2015.03.010 0924-2716/Ó 2015 International Society for Photogrammetry and Remote Sensing, Inc. (ISPRS). Published by Elsevier B.V. All rights reserved. ⇑ Corresponding author at: University of Twente, ITC faculty, P.O. Box 217, 7500 AE Enschede, The Netherlands. ISPRS Journal of Photogrammetry and Remote Sensing 105 (2015) 30–37 Contents lists available at ScienceDirect ISPRS Journal of Photogrammetry and Remote Sensing journal homepage: www.elsevier.com/locate/isprsjprs

Welcome message from author
This document is posted to help you gain knowledge. Please leave a comment to let me know what you think about it! Share it to your friends and learn new things together.
Transcript
ISPRS Journal of Photogrammetry and Remote Sensing 105 (2015) 30–37
Contents lists available at ScienceDirect
ISPRS Journal of Photogrammetry and Remote Sensing
journal homepage: www.elsevier .com/ locate/ isprs jprs
Understanding Boswellia papyrifera tree secondary metabolites throughbark spectral analysis
http://dx.doi.org/10.1016/j.isprsjprs.2015.03.0100924-2716/� 2015 International Society for Photogrammetry and Remote Sensing, Inc. (ISPRS). Published by Elsevier B.V. All rights reserved.
⇑ Corresponding author at: University of Twente, ITC faculty, P.O. Box 217, 7500 AE Enschede, The Netherlands.
Atkilt Girma a,b,⇑, Andrew K. Skidmore a, C.A.J.M. de Bie a, Frans Bongers c
a University of Twente, ITC faculty, P.O. Box 217, 7500 AE Enschede, The Netherlandsb Department of Land Resources Management and Environmental Protection, Mekelle University, P.O. Box 287, Ethiopiac Forest Ecology and Forest Management Group, Centre for Ecosystem Studies, Wageningen University, PO Box 47, 6700 AA Wageningen, The Netherlands
a r t i c l e i n f o a b s t r a c t
Article history:Received 25 December 2014Received in revised form 28 February 2015Accepted 17 March 2015
Keywords:Boswellic acidBoswellia papyriferaIncensole acetatePlant biochemicalsPLSRSpectroscopy
Decision makers are concerned whether to tap or rest Boswellia Papyrifera trees. Tapping for the produc-tion of frankincense is known to deplete carbon reserves from the tree leading to production of less viableseeds, tree carbon starvation and ultimately tree mortality. Decision makers use traditional experiencewithout considering the amount of metabolites stored or depleted from the stem-bark of the tree. Thisresearch was designed to come up with a non-destructive B. papyrifera tree metabolite estimation tech-nique relevant for management using spectroscopy. The concentration of biochemicals (metabolites)found in the tree bark was estimated through spectral analysis.
Initially, a random sample of 33 trees was selected, the spectra of bark measured with an AnalyticalSpectral Device (ASD) spectrometer. Bark samples were air dried and ground. Then, 10 g of sample wassoaked in Petroleum ether to extract crude metabolites. Further chemical analysis was conducted toquantify and isolate pure metabolite compounds such as incensole acetate and boswellic acid. The crudemetabolites, which relate to frankincense produce, were compared to plant properties (such as diameterand crown area) and reflectance spectra of the bark. Moreover, the extract was compared to the ASDspectra using partial least square regression technique (PLSR) and continuum removed spectral analysis.The continuum removed spectral analysis were performed, on two wavelength regions (1275–1663 and1836–2217) identified through PLSR, using absorption features such as band depth, area, position, asym-metry and the width to characterize and find relationship with the bark extracts.
The results show that tree properties such as diameter at breast height (DBH) and the crown area ofuntapped and healthy trees were strongly correlated to the amount of stored crude metabolites. In addi-tion, the PLSR technique applied to the first derivative transformation of the reflectance spectrum wasfound to estimate the concentration of the metabolites reliably at higher coefficient of determination.The most influential maximum slope positions of the spectrum obtained through PLSR analysis of thepetroleum ether extract (crude metabolites) and the pure compounds (incensole acetate and boswellicacid) were found to coincide and concentrate in the region between 1383–1406 nm and 1861–1896 nm. However, analysis on these two individual specific region absorption features relationship withthe bark extract, using the continuum removed approach, was not as robust as the PLSR analysis.
This reveals that the ability to estimate metabolites in the stem-bark of B. papyrifera using spectralanalysis opens a new approach on how to manage B. papyrifera tree. Development of such technique pro-vides quick and reliable information for decision makers to decide on when to tap or for how long to restthe trees. However, to implement the technique, further research need to be conducted to determine howB. papyrifera tree metabolites vary due to tapping. In addition, research to determine the lowest metabo-lites quantity threshold, useful for management of the tree, needs to be conducted.� 2015 International Society for Photogrammetry and Remote Sensing, Inc. (ISPRS). Published by Elsevier
B.V. All rights reserved.
A. Girma et al. / ISPRS Journal of Photogrammetry and Remote Sensing 105 (2015) 30–37 31
1. Introduction
Foliar biochemical concentrations may indicate plant produc-tivity, rate of litter decomposition and status of nutrient availabil-ity (Curran, 1989). Estimation of specific types of biochemicals inplants is possible through the use of hyperspectral instruments.For example, Normalized Difference Vegetation Index (NDVI) andNear Infrared (NIR) spectroscopy were demonstrated to havepotential for tea quality assessment (Dutta et al., 2011). They foundthat NDVI had a direct relationship with green leaf parameterssuch as caffeine, theogallin, Epicatechin (EC) and Epicatechin gal-late (ECG). On the other hand, NIR showed a negative correlationwith caffeine, theogallin and catechins. Improved accuracies werereported to assess tea polyphenols and free amino acids whenusing leaf powder and fresh tea leaves spectra (Bian et al., 2010).Dury et al. (2001) suggested that secondary metabolites such assideroxylonal compounds in dried and fresh Eucalyptus melliodoraleaves can be estimated through spectral analysis, thus, definingleaf palatability for Folivorous marsupials.
Nutrients concentration such as of foliar nitrogen, has also beensuccessfully quantified and/or mapped using hyperspectral instru-ments and imagery, example for savanna grass (Mutanga andSkidmore, 2007; Ramoelo et al., 2011), sugarcane (Abdel-Rahmanet al., 2010), orange leaves (Min et al., 2008), dried white pine nee-dles (Kokaly, 2001), rice (Tian et al., 2011), wheat (Vigneau et al.,2011; Wei et al., 2008; Yao et al., 2010) and apple (Perry andDavenport, 2007). Likewise, reasonable relationships werereported for phosphorus using water-removed spectra (Ramoeloet al., 2011), and for plant pigments, nitrogen, phosphorous andwater content (Asner and Martin, 2008; Hallik et al., 2009). Fromdifferent sources, Curran (1989), compiled 42 different absorptionwavelength regions that relate to foliar chemical concentrationssuch as oils, protein, lignin, cellulose, starch, sugar and nitrogen.
Frankincense or olibanum is one of the oldest internationallytraded commercial tree product obtained from tapping or wound-ing the Boswellia papyrifera tree. The product is used for severalpurposes (Fichtl and Admasu, 1994; Gebrehiwot, 2003; Mutangaand Skidmore, 2007). B. papyrifera (Del.) Hochst, is a deciduous treeoccurring in dry woodlands. It has flaky and papery outer bark lay-ers (Fichtl and Admasu, 1994) and a greenish photosynthetic innerbark layer (Girma et al., 2013).
Frankincense samples obtained from Ethiopia were found tocontain alcohol and ester derivatives such as n-octyl acetate(63.5%), n-octanol (17.8%) and n-octyl formate (1.8%); oxygenditerpene derivatives such as incensole acetate (1.7%) andincensole (0.7); diterpene hydrocarbon such as verticilla-4(20),7,11-triene (2.3%); and monoterpene such as limonene (4.7%) anda-pinene (2.1%) (Camarda et al., 2007). In addition, Hamm et al.(2005b) reported the major constituents of the frankincense tobe n-octyl acetate (64.6%), n-octanol (13.9) and incensole acetate(10.8%). The presence of n-octyl acetate and n-octanol seems tobe consistent with that of Camarda et al. (2007). Detailed analysisof the triterpenoids of the Ethio-eritrean type frankincense wasgiven by Mathe et al. (2004). Characterization of different incensetypes from different geographic origin, relevant for archaeologicalstudies, was possible to some extent through use of the HighPerformance Liquid Chromatography (HPLC) laboratory instru-ment (Archier and Vieillescazes, 2000).
The bioactive constituents of B. papyrifera stem-bark was par-tially analyzed by Atta-ur-Rahman et al. (2005). They reportedchemical compounds such as boswellic acid to be found in boththe bark and the frankincense (exudates). Analysis of plant chemi-cals either from the bark or the frankincense demands expertknowledge, time and sophisticated laboratory instruments (suchas HPLC, gas chromatography (GC), Gas Chromatography Mass
Spectrometry (GC–MS) or Nuclear Magnetic Resonance (NMR)),and destruction of plant parts to acquire samples.
On the other hand, understanding of the health of the tree or tomake decisions on when to tap it to harvest the frankincensedemands quick field decisions. Therefore, our objective of thisresearch was to study a potential non-destructive B. papyrifera treemetabolites estimation technique based on spectroscopy. Throughbark reflectance analysis we aimed to estimate crude metabolites(CM) concentrations as the quality of CM in terms of incensoleacetate and boswellic acid concentration. This method can poten-tially support farmers to make decisions on when to tap or rest atree. This research is limited to healthy and untapped trees havingvariable plant properties.
2. Methods
2.1. Study area
The study was conducted in the Metema Woreda (County)located (Fig. 1) in the north-west of Ethiopia (12�170 to 13�60N,36�000 to 36�470E). The elevation of the study area ranges between600 and 850 m. The major farming system within the area is basedon sesame, cotton, sorghum and livestock production. The Woredahas a high coverage of Acacia dominated woodland (Acacia seyaland Acacia polyacantha) containing several gum and resin producingtree species such as B. papyrifera. The soil types where the sampledtrees are located are mainly Leptosols, Cambisols and Regosols.
Thirteen years of meteorological data obtained from theNational Meteorological Agency of Ethiopia indicates thatMetema has a unimodal annual average rainfall of about1000 mm, and an annual minimum, average, and maximum tem-peratures of 15, 28, and 40 �C respectively. The long term rainfalldata indicate that the dry season covers more than eight monthsannually. The agro-ecological zone classification of the study areais moist Kolla (Hurni, 1998).
2.2. The B. papyrifera tree
In Ethiopia, B. papyrifera trees are mainly found in dry-wood-lands and wooded-grasslands specifically in Acacia-Commiphoraand Combretum–Terminalia woodlands, located at low and midaltitudes ranging from 950 to 1800 m (Fichtl and Admasu, 1994).
The height and diameter at breast height (DBH) of the tree canreach 15 m and 46 cm respectively with an average populationheight and DBH to be 9 m and 20 cm respectively (Eshete, 2011).Leaves of B. papyrifera usually remain on the tree for about3 months annually i.e. from early June to early September, coincid-ing more or less with the onset and end of rains. In the Metemaworeda, B. papyrifera sheds its leaves earlier than any other treespecies present in the landscape, usually from the end of Augustto mid-September. Almost all other tree species will be devoid ofleaves by mid-November. Frankincense is obtained through tap-ping/wounding of the stem-bark (Fig. 2).
2.3. Sampling and field data measurement
The field data were collected during dry season when the B.papyrifera trees were leafless. Bark samples were collected from33 randomly selected trees that were not tapped for at least thepast 4 years, from Lemlem Terara village, Metema. The exact treelocations were measured using a Global Positioning System (GPS)instrument. The individual tree properties including DBH, plantheight, canopy area and diameter (average) were measured. Thecanopy area was measured with a HP iPAQ pocket PC mobileGISinstrument, running ESRI’s ArcPad software.
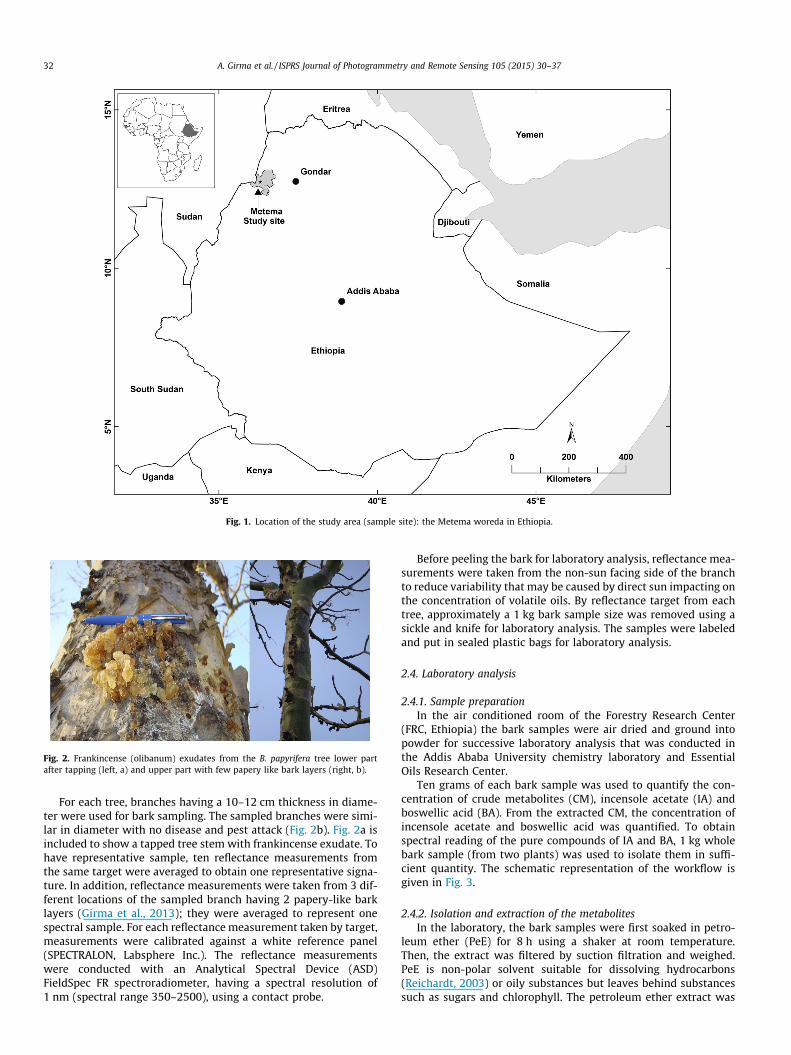
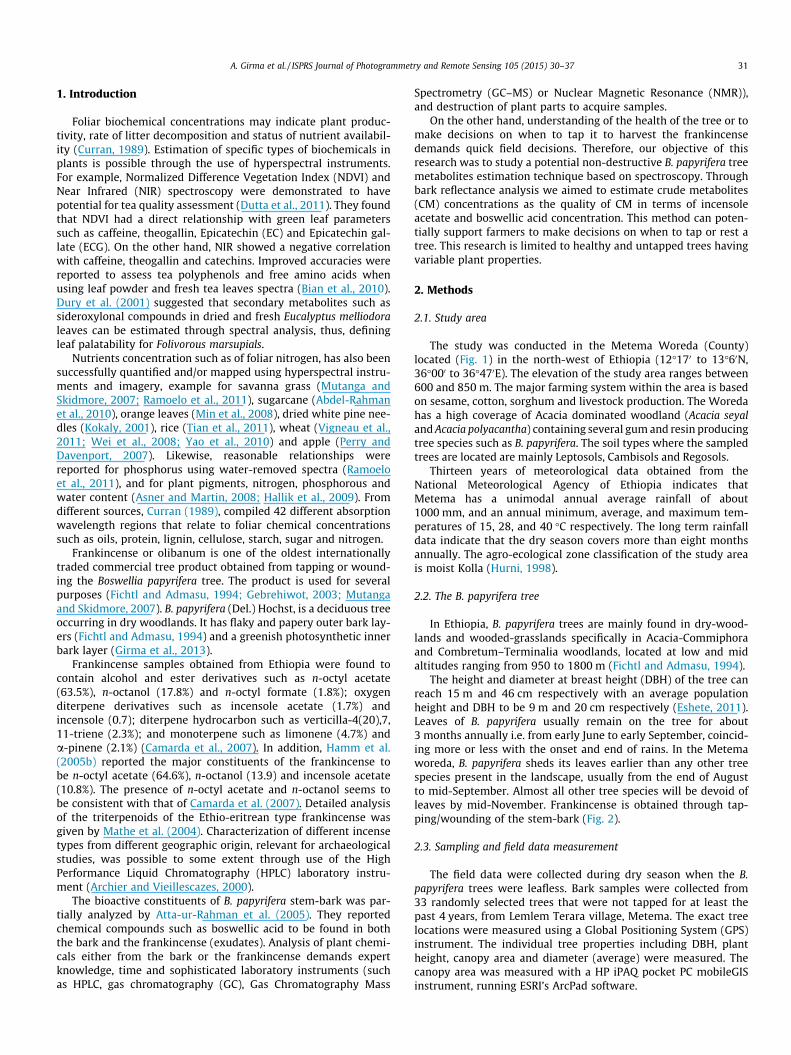
Fig. 1. Location of the study area (sample site): the Metema woreda in Ethiopia.
Fig. 2. Frankincense (olibanum) exudates from the B. papyrifera tree lower partafter tapping (left, a) and upper part with few papery like bark layers (right, b).
32 A. Girma et al. / ISPRS Journal of Photogrammetry and Remote Sensing 105 (2015) 30–37
For each tree, branches having a 10–12 cm thickness in diame-ter were used for bark sampling. The sampled branches were simi-lar in diameter with no disease and pest attack (Fig. 2b). Fig. 2a isincluded to show a tapped tree stem with frankincense exudate. Tohave representative sample, ten reflectance measurements fromthe same target were averaged to obtain one representative signa-ture. In addition, reflectance measurements were taken from 3 dif-ferent locations of the sampled branch having 2 papery-like barklayers (Girma et al., 2013); they were averaged to represent onespectral sample. For each reflectance measurement taken by target,measurements were calibrated against a white reference panel(SPECTRALON, Labsphere Inc.). The reflectance measurementswere conducted with an Analytical Spectral Device (ASD)FieldSpec FR spectroradiometer, having a spectral resolution of1 nm (spectral range 350–2500), using a contact probe.
Before peeling the bark for laboratory analysis, reflectance mea-surements were taken from the non-sun facing side of the branchto reduce variability that may be caused by direct sun impacting onthe concentration of volatile oils. By reflectance target from eachtree, approximately a 1 kg bark sample size was removed using asickle and knife for laboratory analysis. The samples were labeledand put in sealed plastic bags for laboratory analysis.
2.4. Laboratory analysis
2.4.1. Sample preparationIn the air conditioned room of the Forestry Research Center
(FRC, Ethiopia) the bark samples were air dried and ground intopowder for successive laboratory analysis that was conducted inthe Addis Ababa University chemistry laboratory and EssentialOils Research Center.
Ten grams of each bark sample was used to quantify the con-centration of crude metabolites (CM), incensole acetate (IA) andboswellic acid (BA). From the extracted CM, the concentration ofincensole acetate and boswellic acid was quantified. To obtainspectral reading of the pure compounds of IA and BA, 1 kg wholebark sample (from two plants) was used to isolate them in suffi-cient quantity. The schematic representation of the workflow isgiven in Fig. 3.
2.4.2. Isolation and extraction of the metabolitesIn the laboratory, the bark samples were first soaked in petro-
leum ether (PeE) for 8 h using a shaker at room temperature.Then, the extract was filtered by suction filtration and weighed.PeE is non-polar solvent suitable for dissolving hydrocarbons(Reichardt, 2003) or oily substances but leaves behind substancessuch as sugars and chlorophyll. The petroleum ether extract was
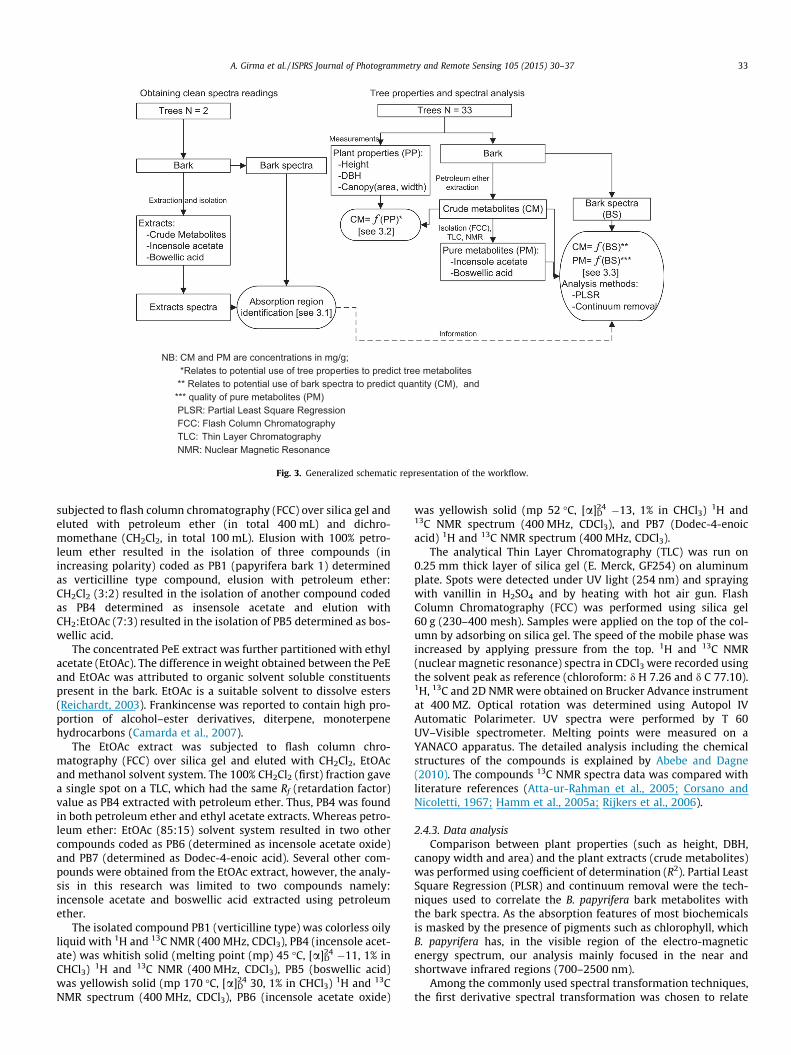
NB: CM and PM are concentrations in mg/g; *Relates to potential use of tree properties to predict tree metabolites** Relates to potential use of bark spectra to predict quantity (CM), and *** quality of pure metabolites (PM)PLSR: Partial Least Square RegressionFCC: Flash Column ChromatographyTLC: Thin Layer ChromatographyNMR: Nuclear Magnetic Resonance
Fig. 3. Generalized schematic representation of the workflow.
A. Girma et al. / ISPRS Journal of Photogrammetry and Remote Sensing 105 (2015) 30–37 33
subjected to flash column chromatography (FCC) over silica gel andeluted with petroleum ether (in total 400 mL) and dichro-momethane (CH2Cl2, in total 100 mL). Elusion with 100% petro-leum ether resulted in the isolation of three compounds (inincreasing polarity) coded as PB1 (papyrifera bark 1) determinedas verticilline type compound, elusion with petroleum ether:CH2Cl2 (3:2) resulted in the isolation of another compound codedas PB4 determined as insensole acetate and elution withCH2:EtOAc (7:3) resulted in the isolation of PB5 determined as bos-wellic acid.
The concentrated PeE extract was further partitioned with ethylacetate (EtOAc). The difference in weight obtained between the PeEand EtOAc was attributed to organic solvent soluble constituentspresent in the bark. EtOAc is a suitable solvent to dissolve esters(Reichardt, 2003). Frankincense was reported to contain high pro-portion of alcohol–ester derivatives, diterpene, monoterpenehydrocarbons (Camarda et al., 2007).
The EtOAc extract was subjected to flash column chro-matography (FCC) over silica gel and eluted with CH2Cl2, EtOAcand methanol solvent system. The 100% CH2Cl2 (first) fraction gavea single spot on a TLC, which had the same Rf (retardation factor)value as PB4 extracted with petroleum ether. Thus, PB4 was foundin both petroleum ether and ethyl acetate extracts. Whereas petro-leum ether: EtOAc (85:15) solvent system resulted in two othercompounds coded as PB6 (determined as incensole acetate oxide)and PB7 (determined as Dodec-4-enoic acid). Several other com-pounds were obtained from the EtOAc extract, however, the analy-sis in this research was limited to two compounds namely:incensole acetate and boswellic acid extracted using petroleumether.
The isolated compound PB1 (verticilline type) was colorless oilyliquid with 1H and 13C NMR (400 MHz, CDCl3), PB4 (incensole acet-ate) was whitish solid (melting point (mp) 45 �C, [a]D
24 �11, 1% inCHCl3) 1H and 13C NMR (400 MHz, CDCl3), PB5 (boswellic acid)was yellowish solid (mp 170 �C, [a]D
24 30, 1% in CHCl3) 1H and 13CNMR spectrum (400 MHz, CDCl3), PB6 (incensole acetate oxide)
was yellowish solid (mp 52 �C, [a]D24 �13, 1% in CHCl3) 1H and
13C NMR spectrum (400 MHz, CDCl3), and PB7 (Dodec-4-enoicacid) 1H and 13C NMR spectrum (400 MHz, CDCl3).
The analytical Thin Layer Chromatography (TLC) was run on0.25 mm thick layer of silica gel (E. Merck, GF254) on aluminumplate. Spots were detected under UV light (254 nm) and sprayingwith vanillin in H2SO4 and by heating with hot air gun. FlashColumn Chromatography (FCC) was performed using silica gel60 g (230–400 mesh). Samples were applied on the top of the col-umn by adsorbing on silica gel. The speed of the mobile phase wasincreased by applying pressure from the top. 1H and 13C NMR(nuclear magnetic resonance) spectra in CDCl3 were recorded usingthe solvent peak as reference (chloroform: d H 7.26 and d C 77.10).1H, 13C and 2D NMR were obtained on Brucker Advance instrumentat 400 MZ. Optical rotation was determined using Autopol IVAutomatic Polarimeter. UV spectra were performed by T 60UV–Visible spectrometer. Melting points were measured on aYANACO apparatus. The detailed analysis including the chemicalstructures of the compounds is explained by Abebe and Dagne(2010). The compounds 13C NMR spectra data was compared withliterature references (Atta-ur-Rahman et al., 2005; Corsano andNicoletti, 1967; Hamm et al., 2005a; Rijkers et al., 2006).
2.4.3. Data analysisComparison between plant properties (such as height, DBH,
canopy width and area) and the plant extracts (crude metabolites)was performed using coefficient of determination (R2). Partial LeastSquare Regression (PLSR) and continuum removal were the tech-niques used to correlate the B. papyrifera bark metabolites withthe bark spectra. As the absorption features of most biochemicalsis masked by the presence of pigments such as chlorophyll, whichB. papyrifera has, in the visible region of the electro-magneticenergy spectrum, our analysis mainly focused in the near andshortwave infrared regions (700–2500 nm).
Among the commonly used spectral transformation techniques,the first derivative spectral transformation was chosen to relate
34 A. Girma et al. / ISPRS Journal of Photogrammetry and Remote Sensing 105 (2015) 30–37
the bark metabolites with the reflectance spectra. The first deriva-tive of the spectral reflectance was derived using a first-differenceapproach. A first-difference transformation of the reflectance spec-trum calculates differences in reflectance between adjacent wave-bands (Dawson and Curran, 1998; Guyot and Baret, 1988; le Maireet al., 2004). A first derivative spectrum is known to enhanceabsorption features (Curran et al., 1990). Before the spectral trans-formation, spectral smoothing was applied using a Savitzky–Golayfilter (Svitzky and Golay, 1964) with second-order polynomialleast-square function and symmetrical three-band window toremove possible noise.
PLSR analysis was applied on the first derivative smoothedspectra to determine which wavelength bands or regions estimatethe bark extracts best. The analysis was done using theUnscrambler v10.0.1 CAMO software (http://www.camo.com).PLSR tries to predict a set of dependent (y) variable (s) from a setof independent (x) variables. PLSR is also closely related toPrincipal Component Regression (PCR) analysis (Darvishzadehet al., 2008). More information on PCR and PLSR can be found inDarvishzadeh et al. (2008), Geladi and Kowalski (1986) andSchlerf et al. (2003). The mean centered with the leave-one-out(LOO) technique was employed for cross validation.
Continuum removed spectral analysis of the absorption banddepth, area, position, asymmetry and the width were calculatedusing IDL–ENVI (http://www.ittvis.com) software with theDISPEC 3.2 IDL spectral analysis program developed by (van derWerff, 2010). This technique is most commonly used by geologiststo identify subtle differences between mineral spectrum absorp-tion features. A hull was applied in two absorption regions(1275–1663 and 1836–2217) that contain the most influential orcontributing wavelength regions identified through PLSR analysis.Details on continuum removal are explained by Clark et al. (2003).
3. Result
3.1. Spectral response curves of B. papyrifera bark metabolites
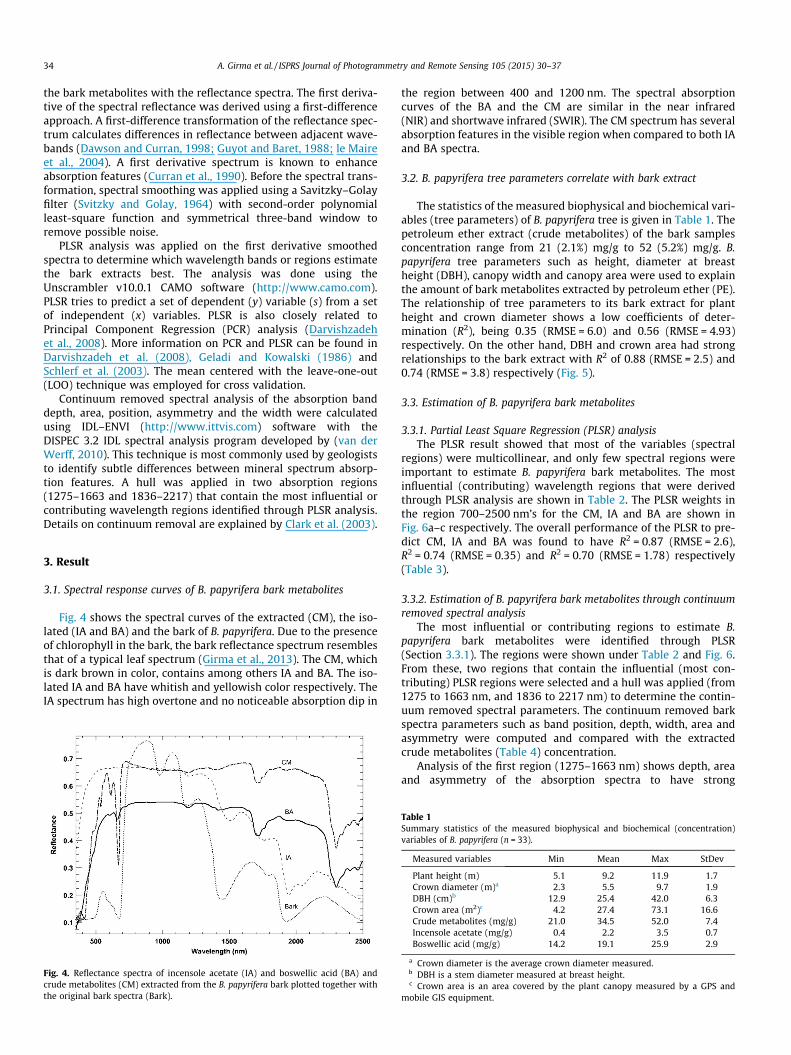
Fig. 4 shows the spectral curves of the extracted (CM), the iso-lated (IA and BA) and the bark of B. papyrifera. Due to the presenceof chlorophyll in the bark, the bark reflectance spectrum resemblesthat of a typical leaf spectrum (Girma et al., 2013). The CM, whichis dark brown in color, contains among others IA and BA. The iso-lated IA and BA have whitish and yellowish color respectively. TheIA spectrum has high overtone and no noticeable absorption dip in
Fig. 4. Reflectance spectra of incensole acetate (IA) and boswellic acid (BA) andcrude metabolites (CM) extracted from the B. papyrifera bark plotted together withthe original bark spectra (Bark).
the region between 400 and 1200 nm. The spectral absorptioncurves of the BA and the CM are similar in the near infrared(NIR) and shortwave infrared (SWIR). The CM spectrum has severalabsorption features in the visible region when compared to both IAand BA spectra.
3.2. B. papyrifera tree parameters correlate with bark extract
The statistics of the measured biophysical and biochemical vari-ables (tree parameters) of B. papyrifera tree is given in Table 1. Thepetroleum ether extract (crude metabolites) of the bark samplesconcentration range from 21 (2.1%) mg/g to 52 (5.2%) mg/g. B.papyrifera tree parameters such as height, diameter at breastheight (DBH), canopy width and canopy area were used to explainthe amount of bark metabolites extracted by petroleum ether (PE).The relationship of tree parameters to its bark extract for plantheight and crown diameter shows a low coefficients of deter-mination (R2), being 0.35 (RMSE = 6.0) and 0.56 (RMSE = 4.93)respectively. On the other hand, DBH and crown area had strongrelationships to the bark extract with R2 of 0.88 (RMSE = 2.5) and0.74 (RMSE = 3.8) respectively (Fig. 5).
3.3. Estimation of B. papyrifera bark metabolites
3.3.1. Partial Least Square Regression (PLSR) analysisThe PLSR result showed that most of the variables (spectral
regions) were multicollinear, and only few spectral regions wereimportant to estimate B. papyrifera bark metabolites. The mostinfluential (contributing) wavelength regions that were derivedthrough PLSR analysis are shown in Table 2. The PLSR weights inthe region 700–2500 nm’s for the CM, IA and BA are shown inFig. 6a–c respectively. The overall performance of the PLSR to pre-dict CM, IA and BA was found to have R2 = 0.87 (RMSE = 2.6),R2 = 0.74 (RMSE = 0.35) and R2 = 0.70 (RMSE = 1.78) respectively(Table 3).
3.3.2. Estimation of B. papyrifera bark metabolites through continuumremoved spectral analysis
The most influential or contributing regions to estimate B.papyrifera bark metabolites were identified through PLSR(Section 3.3.1). The regions were shown under Table 2 and Fig. 6.From these, two regions that contain the influential (most con-tributing) PLSR regions were selected and a hull was applied (from1275 to 1663 nm, and 1836 to 2217 nm) to determine the contin-uum removed spectral parameters. The continuum removed barkspectra parameters such as band position, depth, width, area andasymmetry were computed and compared with the extractedcrude metabolites (Table 4) concentration.
Analysis of the first region (1275–1663 nm) shows depth, areaand asymmetry of the absorption spectra to have strong
Table 1Summary statistics of the measured biophysical and biochemical (concentration)variables of B. papyrifera (n = 33).
Measured variables Min Mean Max StDev
Plant height (m) 5.1 9.2 11.9 1.7Crown diameter (m)a 2.3 5.5 9.7 1.9DBH (cm)b 12.9 25.4 42.0 6.3Crown area (m2)c 4.2 27.4 73.1 16.6Crude metabolites (mg/g) 21.0 34.5 52.0 7.4Incensole acetate (mg/g) 0.4 2.2 3.5 0.7Boswellic acid (mg/g) 14.2 19.1 25.9 2.9
a Crown diameter is the average crown diameter measured.b DBH is a stem diameter measured at breast height.c Crown area is an area covered by the plant canopy measured by a GPS and
mobile GIS equipment.
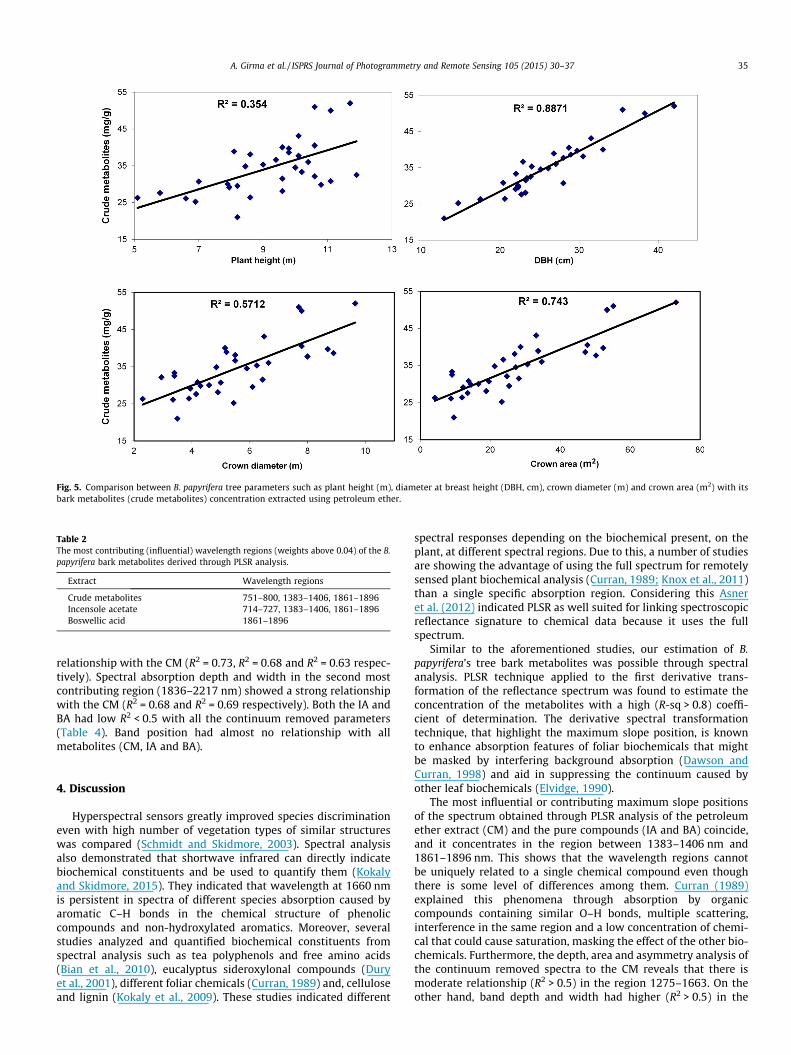
Fig. 5. Comparison between B. papyrifera tree parameters such as plant height (m), diameter at breast height (DBH, cm), crown diameter (m) and crown area (m2) with itsbark metabolites (crude metabolites) concentration extracted using petroleum ether.
Table 2The most contributing (influential) wavelength regions (weights above 0.04) of the B.papyrifera bark metabolites derived through PLSR analysis.
Extract Wavelength regions
Crude metabolites 751–800, 1383–1406, 1861–1896Incensole acetate 714–727, 1383–1406, 1861–1896Boswellic acid 1861–1896
A. Girma et al. / ISPRS Journal of Photogrammetry and Remote Sensing 105 (2015) 30–37 35
relationship with the CM (R2 = 0.73, R2 = 0.68 and R2 = 0.63 respec-tively). Spectral absorption depth and width in the second mostcontributing region (1836–2217 nm) showed a strong relationshipwith the CM (R2 = 0.68 and R2 = 0.69 respectively). Both the IA andBA had low R2 < 0.5 with all the continuum removed parameters(Table 4). Band position had almost no relationship with allmetabolites (CM, IA and BA).
4. Discussion
Hyperspectral sensors greatly improved species discriminationeven with high number of vegetation types of similar structureswas compared (Schmidt and Skidmore, 2003). Spectral analysisalso demonstrated that shortwave infrared can directly indicatebiochemical constituents and be used to quantify them (Kokalyand Skidmore, 2015). They indicated that wavelength at 1660 nmis persistent in spectra of different species absorption caused byaromatic C–H bonds in the chemical structure of phenoliccompounds and non-hydroxylated aromatics. Moreover, severalstudies analyzed and quantified biochemical constituents fromspectral analysis such as tea polyphenols and free amino acids(Bian et al., 2010), eucalyptus sideroxylonal compounds (Duryet al., 2001), different foliar chemicals (Curran, 1989) and, celluloseand lignin (Kokaly et al., 2009). These studies indicated different
spectral responses depending on the biochemical present, on theplant, at different spectral regions. Due to this, a number of studiesare showing the advantage of using the full spectrum for remotelysensed plant biochemical analysis (Curran, 1989; Knox et al., 2011)than a single specific absorption region. Considering this Asneret al. (2012) indicated PLSR as well suited for linking spectroscopicreflectance signature to chemical data because it uses the fullspectrum.
Similar to the aforementioned studies, our estimation of B.papyrifera’s tree bark metabolites was possible through spectralanalysis. PLSR technique applied to the first derivative trans-formation of the reflectance spectrum was found to estimate theconcentration of the metabolites with a high (R-sq > 0.8) coeffi-cient of determination. The derivative spectral transformationtechnique, that highlight the maximum slope position, is knownto enhance absorption features of foliar biochemicals that mightbe masked by interfering background absorption (Dawson andCurran, 1998) and aid in suppressing the continuum caused byother leaf biochemicals (Elvidge, 1990).
The most influential or contributing maximum slope positionsof the spectrum obtained through PLSR analysis of the petroleumether extract (CM) and the pure compounds (IA and BA) coincide,and it concentrates in the region between 1383–1406 nm and1861–1896 nm. This shows that the wavelength regions cannotbe uniquely related to a single chemical compound even thoughthere is some level of differences among them. Curran (1989)explained this phenomena through absorption by organiccompounds containing similar O–H bonds, multiple scattering,interference in the same region and a low concentration of chemi-cal that could cause saturation, masking the effect of the other bio-chemicals. Furthermore, the depth, area and asymmetry analysis ofthe continuum removed spectra to the CM reveals that there ismoderate relationship (R2 > 0.5) in the region 1275–1663. On theother hand, band depth and width had higher (R2 > 0.5) in the
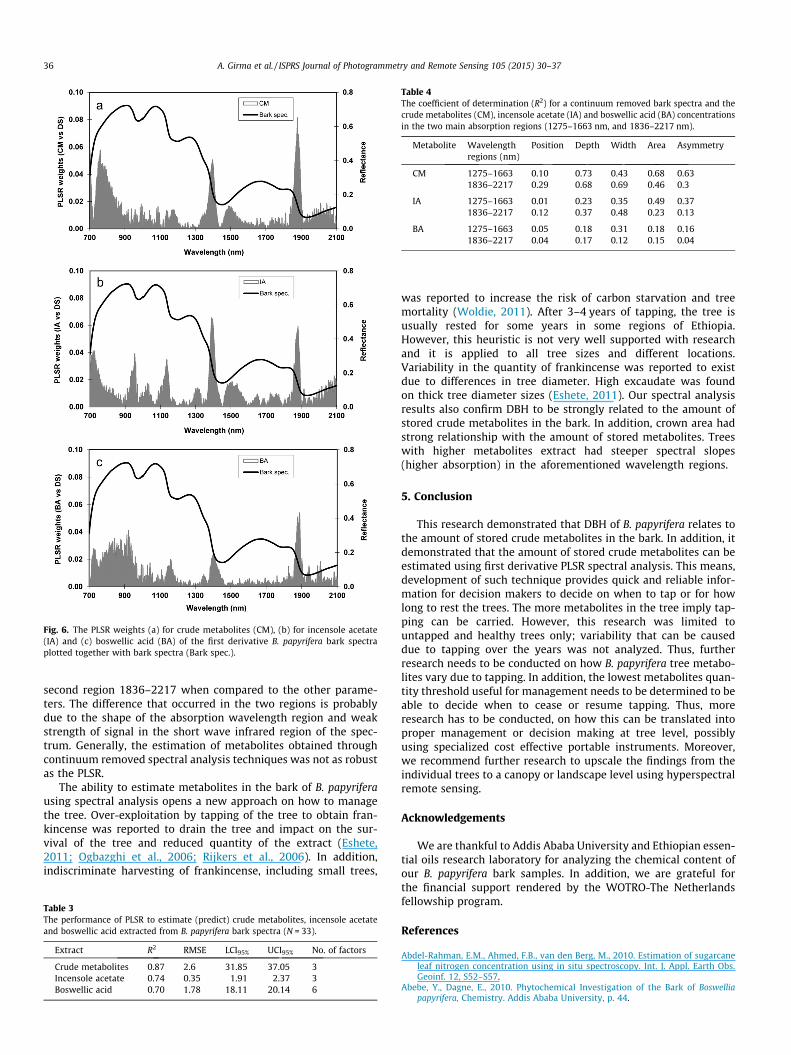
Fig. 6. The PLSR weights (a) for crude metabolites (CM), (b) for incensole acetate(IA) and (c) boswellic acid (BA) of the first derivative B. papyrifera bark spectraplotted together with bark spectra (Bark spec.).
Table 4The coefficient of determination (R2) for a continuum removed bark spectra and thecrude metabolites (CM), incensole acetate (IA) and boswellic acid (BA) concentrationsin the two main absorption regions (1275–1663 nm, and 1836–2217 nm).
Metabolite Wavelengthregions (nm)
Position Depth Width Area Asymmetry
CM 1275–1663 0.10 0.73 0.43 0.68 0.631836–2217 0.29 0.68 0.69 0.46 0.3
IA 1275–1663 0.01 0.23 0.35 0.49 0.371836–2217 0.12 0.37 0.48 0.23 0.13
BA 1275–1663 0.05 0.18 0.31 0.18 0.161836–2217 0.04 0.17 0.12 0.15 0.04
36 A. Girma et al. / ISPRS Journal of Photogrammetry and Remote Sensing 105 (2015) 30–37
second region 1836–2217 when compared to the other parame-ters. The difference that occurred in the two regions is probablydue to the shape of the absorption wavelength region and weakstrength of signal in the short wave infrared region of the spec-trum. Generally, the estimation of metabolites obtained throughcontinuum removed spectral analysis techniques was not as robustas the PLSR.
The ability to estimate metabolites in the bark of B. papyriferausing spectral analysis opens a new approach on how to managethe tree. Over-exploitation by tapping of the tree to obtain fran-kincense was reported to drain the tree and impact on the sur-vival of the tree and reduced quantity of the extract (Eshete,2011; Ogbazghi et al., 2006; Rijkers et al., 2006). In addition,indiscriminate harvesting of frankincense, including small trees,
Table 3The performance of PLSR to estimate (predict) crude metabolites, incensole acetateand boswellic acid extracted from B. papyrifera bark spectra (N = 33).
Extract R2 RMSE LCI95% UCI95% No. of factors
Crude metabolites 0.87 2.6 31.85 37.05 3Incensole acetate 0.74 0.35 1.91 2.37 3Boswellic acid 0.70 1.78 18.11 20.14 6
was reported to increase the risk of carbon starvation and treemortality (Woldie, 2011). After 3–4 years of tapping, the tree isusually rested for some years in some regions of Ethiopia.However, this heuristic is not very well supported with researchand it is applied to all tree sizes and different locations.Variability in the quantity of frankincense was reported to existdue to differences in tree diameter. High excaudate was foundon thick tree diameter sizes (Eshete, 2011). Our spectral analysisresults also confirm DBH to be strongly related to the amount ofstored crude metabolites in the bark. In addition, crown area hadstrong relationship with the amount of stored metabolites. Treeswith higher metabolites extract had steeper spectral slopes(higher absorption) in the aforementioned wavelength regions.
5. Conclusion
This research demonstrated that DBH of B. papyrifera relates tothe amount of stored crude metabolites in the bark. In addition, itdemonstrated that the amount of stored crude metabolites can beestimated using first derivative PLSR spectral analysis. This means,development of such technique provides quick and reliable infor-mation for decision makers to decide on when to tap or for howlong to rest the trees. The more metabolites in the tree imply tap-ping can be carried. However, this research was limited tountapped and healthy trees only; variability that can be causeddue to tapping over the years was not analyzed. Thus, furtherresearch needs to be conducted on how B. papyrifera tree metabo-lites vary due to tapping. In addition, the lowest metabolites quan-tity threshold useful for management needs to be determined to beable to decide when to cease or resume tapping. Thus, moreresearch has to be conducted, on how this can be translated intoproper management or decision making at tree level, possiblyusing specialized cost effective portable instruments. Moreover,we recommend further research to upscale the findings from theindividual trees to a canopy or landscape level using hyperspectralremote sensing.
Acknowledgements
We are thankful to Addis Ababa University and Ethiopian essen-tial oils research laboratory for analyzing the chemical content ofour B. papyrifera bark samples. In addition, we are grateful forthe financial support rendered by the WOTRO-The Netherlandsfellowship program.
References
Abdel-Rahman, E.M., Ahmed, F.B., van den Berg, M., 2010. Estimation of sugarcaneleaf nitrogen concentration using in situ spectroscopy. Int. J. Appl. Earth Obs.Geoinf. 12, S52–S57.
Abebe, Y., Dagne, E., 2010. Phytochemical Investigation of the Bark of Boswelliapapyrifera, Chemistry. Addis Ababa University, p. 44.
A. Girma et al. / ISPRS Journal of Photogrammetry and Remote Sensing 105 (2015) 30–37 37
Archier, P., Vieillescazes, C., 2000. Characterisation of various geographical originincense based on chemical criteria. Analusis 28, 233–237.
Asner, G.P., Martin, R.E., 2008. Spectral and chemical analysis of tropical forests:Scaling from leaf to canopy levels. Remote Sens. Environ. 112, 3958–3970.
Asner, G., Martin, R., Suhaili, A., 2012. Sources of canopy chemical and spectraldiversity in Lowland Bornean forest. Ecosystems 15, 504–517.
Atta-ur-Rahman, Naz, H., Fadimatou, Makhmoor, T., Yasin, A., Fatima, N., Ngounou,F.N., Kimbu, S.F., Sondengam, B.L., Choudhary, M.I., 2005. Bioactive constituentsfrom Boswellia papyrifera. J. Nat. Prod. 68, 5.
Bian, M., Skidmore, A.K., Schlerf, M., Fei, T., Liu, Y.F., Wang, T.J., 2010. ReflectanceSpectroscopy of biochemical components as indicators of tea (Camellia Sinensis)quality. Photogramm. Eng. Rem. S 76, 1385–1392.
Camarda, L., Dayton, T., Di Stefano, V., Pitonzo, R., Schillaci, D., 2007. Chemicalcomposition and antimicrobial activity of some oleogum resin essential oilsfrom Boswellia SPP. (Burseraceae). Anal. Chim. 97, 837–844.
Clark, R.N., Swayze, G.A., Livo, K.E., Kokaly, R.F., Sutley, S.J., Dalton, J.B., McDougal,R.R., Gent, C.A., 2003. Imaging spectroscopy: Earth and planetary remotesensing with the USGS Tetracorder and expert systems. J. Geophys. Res.-Planet108.
Corsano, S., Nicoletti, R., 1967. The structure of incensole. Tetrahedron 23, 1977–1984.
Curran, P.J., 1989. Remote-sensing of foliar chemistry. Remote Sens. Environ. 30,271–278.
Curran, P.J., Dungan, J.L., Gholz, H.L., 1990. Exploring the relationship betweenreflectance red edge and chlorophyll content in slash pine. Tree Physiol. 7, 33–48.
Darvishzadeh, R., Skidmore, A., Schlerf, M., Atzberger, C., Corsi, F., Cho, M., 2008. LAIand chlorophyll estimation for a heterogeneous grassland using hyperspectralmeasurements. Isprs. J. Photogramm. 63, 409–426.
Dawson, T.P., Curran, P.J., 1998. A new technique for interpolating the reflectancered edge position. Int. J. Remote Sens. 19, 2133–2139.
Dury, S., Turner, B., Foley, B., Wallis, I., 2001. Use of high spectral resolution remotesensing to determine leaf palatability of eucalypt trees for Folivorous Marsupials.Int. J. Appl. Earth Obs. Geoinf. 3, 328–336.
Dutta, R., Stein, A., Bhagat, R.M., 2011. Integrating satellite images and spectroscopyto measure green and black tea quality. Food Chem. 127, 866–874.
Elvidge, C.D., 1990. Visible and near-infrared reflectance characteristics of dry plantmaterials. Int. J. Remote Sens. 11, 1775–1795.
Eshete, W.A., 2011. The Frankincense Tree of Ethiopia: Ecology, Productivity andPopulation Dynamics, Forest Ecology and Forest Management Group.Wageningen University, Wageningen, p. 161.
Fichtl, R., Admasu, A., 1994. Honey Bee Flora of Ethiopia. DED/Margraf Verlag,Germany.
Gebrehiwot, K., 2003. Ecology and Management of Boswellia papyrifera (Del.)Hochst. Dry Forests in Tigray, Northern Ethiopia Faculty of Forest Sciences andForest Ecology. Georg-August-University of Göttingen, Göttingen, p. 191.
Geladi, P., Kowalski, B.R., 1986. Partial least-squares regression: a tutorial. Anal.Chim. Acta 185, 1–17.
Girma, A., Skidmore, A.K., de Bie, C.A.J.M., Bongers, F., Schlerf, M., 2013.Photosynthetic bark: Use of chlorophyll absorption continuum index toestimate Boswellia papyrifera bark chlorophyll content. Int. J. Appl. Earth Obs.Geoinf. 23, 71–80.
Guyot, G., Baret, F., 1988. Utilisation de la haute resolution spectrale pour suivrel’etat des couverts vegetaux, in: Guyenne, T.D., Hunt, J.J. (Eds.), 4th InternationalColloquium on Spectral Signatures of Objects in Remote Sensing. ESA SP-287,Aussois, France, 18–22 January 1988, pp. 279–286.
Hallik, L., Kull, O., Niinemets, Ü., Aan, A., 2009. Contrasting correlation networksbetween leaf structure, nitrogen and chlorophyll in herbaceous and woodycanopies. Basic Appl. Ecol. 10, 309–318.
Hamm, S., Bleton, J., Connan, J., Tchapla, A., 2005a. A chemical investigation byheadspace SPME and GC–MS of volatile and semi-volatile terpenes in variousolibanum samples. Phytochemistry 66, 1499–1514.
Hamm, S., Bleton, J., Connan, J., Tchapla, A., 2005b. A chemical investigation byheadspace SPME and GC–MS of volatile and semi-volatile terpenes in variousolibanum samples. Phytochemistry 66, 1499–1514.
Hurni, H., 1998. Soil conservation research programme Ethiopia: Agroecologicalbelts of Ethiopia, explanatory notes on three maps at a scale of 1:1,000,000
Centre for Development and Environment University of Bern. Switzerland inassociation with The Ministry of Agriculture, Ethiopia, p. 43.
Knox, N.M., Skidmore, A.K., Prins, H.H.T., Asner, G.P., van der Werff, H.M.A., de Boer,W.F., van der Waal, C., de Knegt, H.J., Kohi, E.M., Slotow, R., Grant, R.C., 2011. Dryseason mapping of savanna forage quality, using the hyperspectral CarnegieAirborne Observatory sensor. Remote Sens. Environ. 115, 1478–1488.
Kokaly, R.F., 2001. Investigating a Physical Basis for Spectroscopic Estimates of LeafNitrogen Concentration. Remote Sens. Environ. 75, 153–161.
Kokaly, R.F., Skidmore, A.K., 2015. Plant phenolics and absorption features invegetation reflectance spectra near 1.66 lm. Int. J. Appl. Earth Obs. Geoinf.
Kokaly, R.F., Asner, G.P., Ollinger, S.V., Martin, M.E., Wessman, C.A., 2009.Characterizing canopy biochemistry from imaging spectroscopy and itsapplication to ecosystem studies. Remote Sens. Environ. 113 (Supplement 1),S78–S91.
le Maire, G., François, C., Dufrêne, E., 2004. Towards universal broad leaf chlorophyllindices using PROSPECT simulated database and hyperspectral reflectancemeasurements. Remote Sens. Environ., 1–28
Mathe, C., Culioli, G., Archier, P., Vieillescazes, C., 2004. High-performance liquidchromatographic analysis of triterpenoids in commercial Frankincense.Chromatographia 60, 493–499.
Min, M., Lee, W.S., Burks, T.F., Jordan, J.D., Schumann, A.W., Schueller, J.K., Xie, H.,2008. Design of a hyperspectral nitrogen sensing system for orange leaves.Comput. Electron. Agr. 63, 215–226.
Mutanga, O., Skidmore, A., 2007. Red edge shift and biochemical content in grasscanopies. Isprs. J. Photogramm. 62, 34–42.
Ogbazghi, W., Bongers, F., Rijkers, T., Wessel, M., 2006. Population structure andmorphology of the frankincense tree Boswellia papyrifera along an altitudegradient in Eritrea. J. Drylands 1, 9.
Perry, E.M., Davenport, J.R., 2007. Spectral and spatial differences in response ofvegetation indices to nitrogen treatments on apple. Comput. Electron. Agr. 59,56–65.
Ramoelo, A., Skidmore, A.K., Schlerf, M., Mathieu, R., Heitkonig, I.M.A., 2011. Water-removed spectra increase the retrieval accuracy when estimating savanna grassnitrogen and phosphorus concentrations. Isprs. J. Photogramm. 66, 408–417.
Reichardt, C., 2003. Solvents and Solvent Effects in Organic Chemistry, Third ed.Woley-VCH verlag GmbH & Co. KGaA, Weinheim.
Rijkers, T., Ogbazghi, W., Wessel, M., Bongers, F., 2006. The effect of tapping forfrankincense on sexual reproduction in Boswellia papyrifera. J. Appl. Ecol. 43,1188–1195.
Schlerf, M., Atzberger, C., Udelhoven, T., Jarmer, T., Mader, S., Werner, W., Hill, J.,2003. Spectrometric estimation of leaf pigments in Norway spruce needlesusing band-depth analysis, partial least-wquare regression and inversion of aconifer leaf model, in: Habermeyer, M., Muller, A., Holzwarth, S. (Eds.), Proc. 3rdEARSeL Workshop on Imaging Spectroscopy, Herrsching, Germany, pp. 559–568.
Schmidt, K.S., Skidmore, A.K., 2003. Spectral discrimination of vegetation types in acoastal wetland. Remote Sens. Environ. 85, 92–108.
Svitzky, A., Golay, M.J.E., 1964. Smoothing and differentiation of data by simplifiedleast-squares procedures. Anal. Chem. 36, 1627–1639.
Tian, Y.C., Yao, X., Yang, J., Cao, W.X., Hannaway, D.B., Zhu, Y., 2011. Assessing newlydeveloped and published vegetation indices for estimating rice leaf nitrogenconcentration with ground- and space-based hyperspectral reflectance. FieldCrops Res. 120, 299–310.
van der Werff, H., 2010. DISPEC 3.2 IDL Spectral Analysis Software Program.Vigneau, N., Ecarnot, M., Rabatel, G., Roumet, P., 2011. Potential of field
hyperspectral imaging as a non destructive method to assess leaf nitrogencontent in Wheat. Field Crops Res. 122, 25–31.
Wei, F., Yan, Z., Yongchao, T., Weixing, C., Xia, Y., Yingxue, L., 2008. Monitoring leafnitrogen accumulation in wheat with hyper-spectral remote sensing. Acta Ecol.Sinica 28, 23–32.
Woldie, T.M., 2011. Physiological Ecology of the Frankincense Tree, ProductionEcology and Resource Conservation (PE&RC). Wageningen University,Wageningen, p. 127.
Yao, X., Zhu, Y., Tian, Y., Feng, W., Cao, W., 2010. Exploring hyperspectral bands andestimation indices for leaf nitrogen accumulation in wheat. Int. J. Appl. EarthObs. Geoinf. 12, 89–100.
Related Documents