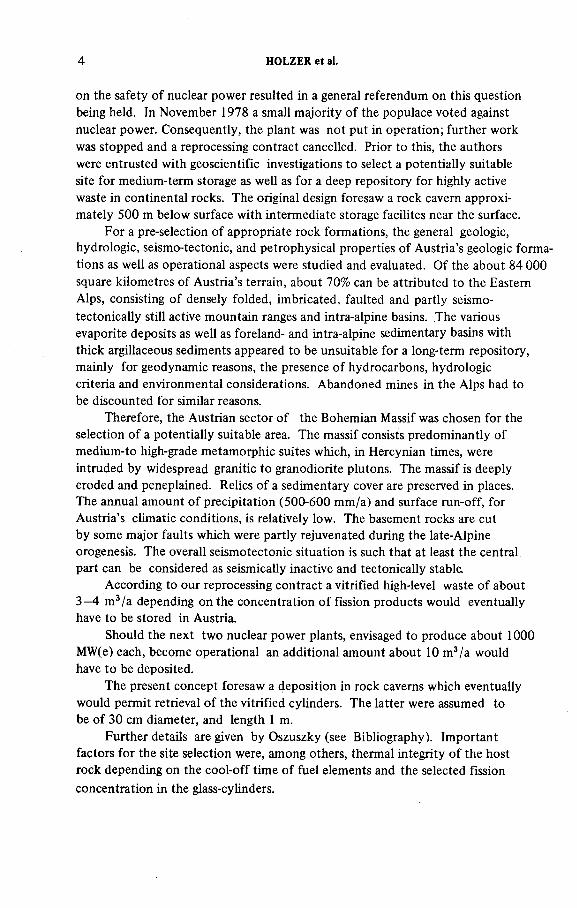
Underground Disposal of Radioactive Wastes Vbl.ll |J A J PROCEEDINGS OF ASYMPOSIUM, OTANIEMI, 2-6 JULY 1979 JOINTLY ORGANIZED BY IAEA AND NEA (OECD) Atmosphere Surface waters Aquifers Щ Sedimentary :: layers : (highly variable) Host rock (with fluids) Dry well Earthen material Low-level-waste containers Sand Backfilled tunnel Conditioned alpha-bearing wastes Conditioned high-level wastes У J INTERNATIONAL ATOMIC ENERGY AGENCY, VIENNA, 1980

Welcome message from author
This document is posted to help you gain knowledge. Please leave a comment to let me know what you think about it! Share it to your friends and learn new things together.
Transcript
Underground Disposal of Radioactive Wastes
Vbl.ll|J A J PROCEEDINGS OF ASYMPOSIUM, OTANIEMI, 2 -6 JULY 1979
JOINTLY ORGANIZED BY IAEA AND NEA (OECD)
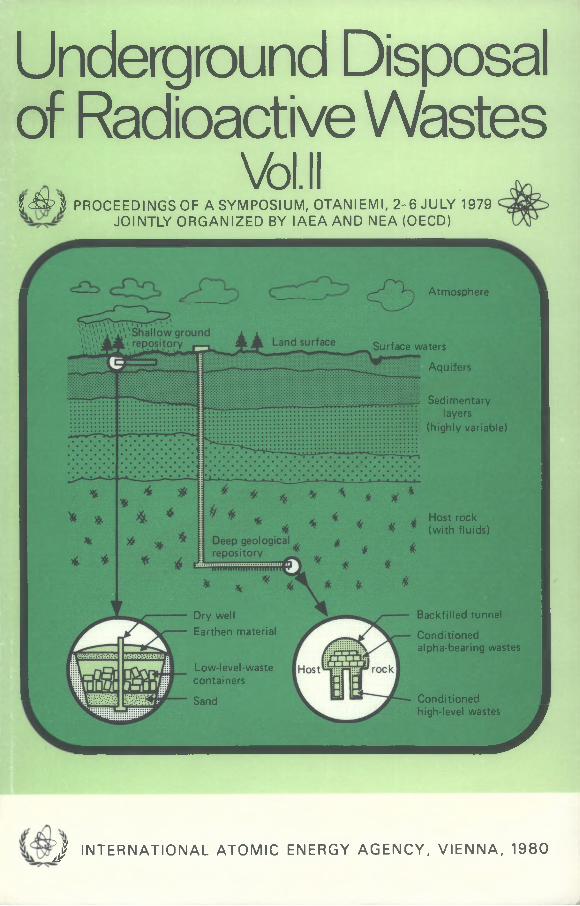
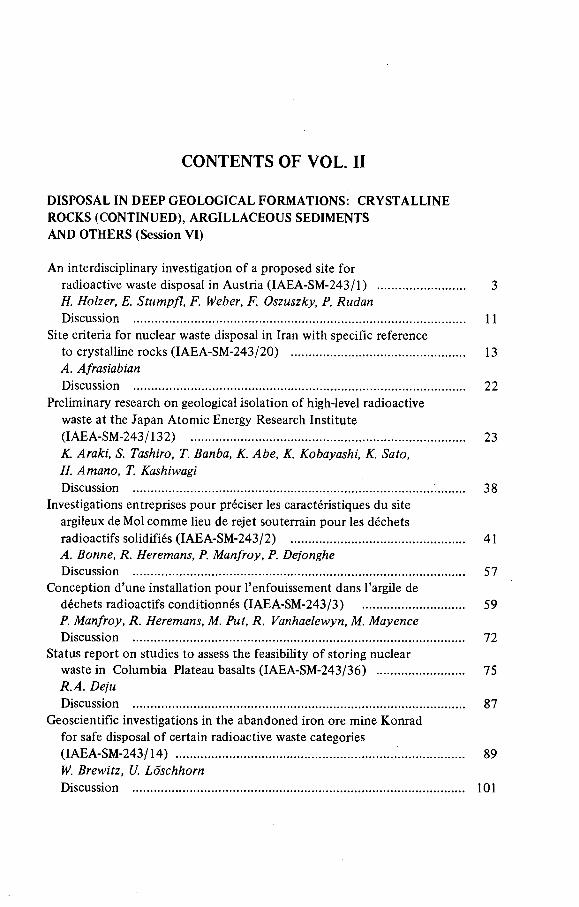
Atmosphere
Surface watersAquifers
Щ Sedimentary :: layers: (highly variable)
Host rock (with fluids)
Dry wellEarthen material
Low-level-wastecontainers
Sand
Backfilled tunnelConditioned alpha-bearing wastes
Conditioned high-level wastes
У
J IN T E R N A T IO N A L A T O M IC ENERGY A G E N C Y , V IE N N A , 1 9 8 0

UNDERGROUND DISPOSAL OF
RADIOACTIVE WASTES
VOL. II

PROCEEDINGS SERIES
UNDERGROUND DISPOSAL OF
RADIOACTIVE WASTESPROCEEDINGS OF A SYMPOSIUM ON
THE UNDERGROUND DISPOSAL OF
RADIOACTIVE WASTES
JOINTLY ORGANIZED BY THE
INTERNATIONAL ATOMIC ENERGY AGENCY
AND THE OECD NUCLEAR ENERGY AGENCY
AND HELD AT
OTANIEMI, FINLAND, 2 - 6 JULY 1979
In two volumes
VOLII
INTERNATIONAL ATOMIC ENERGY AGENCY
VIENNA, 1980

UNDERGROUND DISPOSAL OF RADIOACTIVE WASTES, VOL. II
IAEA, VIENNA, 1980
STI/PUB/528
ISBN 92-0-020280-9
© IAEA, 1980
Permission to reproduce or translate the information contained in this publication may be obtained by writing to the International Atomic Energy Agency, Wagramerstrasse 5, P.O. Box 100, A-1400 Vienna, Austria.
Printed by the IAEA in Austria Septem ber 1980
FOREWORD
Disposal of radioactive waste is an issue of central interest for the accept
ance and further industrial development of nuclear power. With today’s
technology, the most feasible option for the safe disposal of these wastes is to
deposit them underground in an appropriately conditioned form at suitable
sites.
Disposal of low- and intermediate-level radioactive wastes by shallow land
burial, emplacement in suitable abandoned mines, or by deep well injection and
hydraulic fracturing, has been practised in various countries for many years. In
recent years considerable efforts have been devoted in most countries that have
nuclear power programmes to developing and evaluating appropriate disposal
systems for radioactive wastes, in particular for high-level and transuranium-
bearing wastes, and to studying the potential for establishing repositories in
geological formations underlying their national territories.
In view of this the IAEA felt it was timely to hold a symposium to collect
new information and review current developments in this field. The symposium
was organized jointly by the IAEA and the OECD Nuclear Energy Agency in
co-operation with the Geological Survey of Finland, at the Technical University
of Helsinki, in Otaniemi, Finland. It was attended by about 400 participants
from 32 countries and four international organizations. A total of 68 papers
was presented in.ten sessions covering the following topics: national pro
grammes and general studies; disposal of solid waste at shallow depth and in
rock caverns; disposal of liquid waste by deep well injection and hydraulic
fracturing; disposal in salt formations, crystalline rocks and argillaceous sedi
ments; thermal aspects of disposal in deep geological formations; radionuclide
migration studies; and safety assessment and regulatory aspects. While the
disposal of high-level and alpha-bearing wastes arising from the management of
spent nuclear fuel was the central subject of the symposium, many papers also
dealt with matters concerning the disposal of low- and intermediate-level
wastes.
The papers and discussions published in the present Proceedings provide
an authoritative account of the status of underground disposal programmes
throughout the world in 1979. They evidence the experience that has been
gained and the comprehensive investigations that have been performed to study
various alternative possibilities for the underground disposal of radioactive
waste since the last IAEA/NEA symposium on this topic (Disposal of Radio
active Waste into the Ground) was held in Vienna in 1967. The symposium

showed an impressive variety of viable disposal options. It indicated also the
trend to develop a broad scientific base behind the concept of geological waste
disposal. Different approaches are being investigated for the emplacement of
the various waste forms in various rock types. Many geological environments
exist with the capability of providing safe isolation for all types of radioactive
waste.
It is hoped that these Proceedings, together with other documents published
within the Agency’s Underground Disposal Programme, will assist and guide
further national and international efforts in this important field.
EDITORIAL NOTE
The papers and discussions have been edited by the editorial staff o f the International Atomic Energy Agency to the extent considered necessary for the reader’s assistance. The views expressed and the general style adopted remain, however, the responsibility o f the named authors or participants. In addition, the views are not necessarily those o f the governments o f the nominating Member States or o f the nominating organizations.
Where papers have been incorporated into these Proceedings without resetting by the Agency, this has been done with the knowledge of the authors and their government authorities, and their cooperation is gratefully acknowledged. The Proceedings have been printed by composition typing and photo-offset lithography. Within the limitations imposed by this method, every effort has been made to maintain a high editorial standard, in particular to achieve, wherever practicable, consistency o f units and symbols and conformity to the standards recommended by competent international bodies.
The use in these Proceedings o f particular designations o f countries or territories does not imply any judgement by the publisher, the IAEA, as to the legal status of such countries or territories, o f their authorities and institutions or o f the delimitation of their boundaries.
The mention of specific companies or o f their products or brand names does not imply any endorsement or recommendation on the part o f the IAEA.
Authors are themselves responsible for obtaining the necessary permission to reproduce copyright material from other sources.
CONTENTS OF VOL. II
DISPOSAL IN DEEP GEOLOGICAL FORMATIONS: CRYSTALLINE
ROCKS (CONTINUED), ARGILLACEOUS SEDIMENTS
AND OTHERS (Session VI)
An interdisciplinary investigation of a proposed site for
radioactive waste disposal in Austria (IAEA-SM-243/1) ............................ 3
H. Holzer, E. Stumpfl, F. Weber, F. Oszuszky, P. RudanDiscussion ..................................................................................................... 11
Site criteria for nuclear waste disposal in Iran with specific reference
to crystalline rocks (IAEA-SM-243/20) ..................................................... 13
A. AfrasiabianDiscussion ..................................................................................................... 22
Preliminary research on geological isolation of high-level radioactive
waste at the Japan Atomic Energy Research Institute
(IAEA-SM-243/132) ........................................................ ........................... 23
K. Araki, S. Tashiro, T. Banba, K. Abe, K. Kobayashi, K. Sato,H. Amano, T. KashiwagiDiscussion ........................................................................................... ......... 38
Investigations entreprises pour préciser les caractéristiques du site
argileux de Mol comme lieu de rejet souterrain pour les déchets
radioactifs solidifiés (IAEA-SM-243/2) ..................................................... 41
A. Bonne, R. Heremans, P. Manfroy, P. DejongheDiscussion ..................................................................................................... 57
Conception d’une installation pour l’enfouissement dans l ’argile de
déchets radioactifs conditionnés (IAEA-SM-243/3) ............................... 59
P. Manfroy, R. Heremans, M. Put, R. Vanhaelewyn, M. MayenceDiscussion ..................................................................................................... 72
Status report on studies to assess the feasibility of storing nuclear
waste in Columbia Plateau basalts (IAEA-SM-243/36) .......................... 75
R.A. DejuDiscussion ..................................................................................................... 87
Geoscientific investigations in the abandoned iron ore mine Konrad
for safe disposal of certain radioactive waste categories
(IAEA-SM-243/14) ................................................................... .................... 89
W. Brewitz, U. LoschhornDiscussion ..................................................................................................... 101
DISPOSAL IN DEEP GEOLOGICAL FORMATIONS:
THERMAL ASPECTS (Session VII)
The application of field data from heater experiments conducted at
Stripa, Sweden, to parameters for repository design
(IAEA-SM-243/79) ........................................................................................ 105
M. Hood, H. Carlsson, P.H. NelsonDiscussion ..................................................................................................... 119
Modelling of temperature fields and deformations for radioactive waste
repositories in hard rock (IAEA-SM-243/164) ....................................... 121
O. Stephansson, R. Blomquist, T. Groth, P. Jonasson, T. TarandiDiscussion ..................................................................................................... 133
Thermal aspects of radioactive waste disposal in hard rock
(IAEA-SM-243/26) ........................................................................................ 137
H. Beale, P.J. Bourke, D.P. Hodgkinson Temperature distribution and thermally induced stresses in a high-level
waste repository (IAEA-SM-243/120)......................................................... 149
H. Harkônen, K. Ikonen, H. Noro Diffusion de la chaleur dégagée par des déchets vitrifiés de haute activité
dans un sol homogène (IAEA-SM-243/86) ................................................ 159
N. Juignet, S. Goldstein, J. Geffroy, R. Bonniaud, F.L.H. Laude Investigations on temperature rise and relative disposal area requirements
for LWR-waste disposal strategies in salt domes (IAEA-SM-243/15) .... 175
E. Korthaus, P. Donath, P. Ploumen, G. Strickman, P. WinskeDiscussion ..................................................................................................... 188
A procedure for detailed 3-D analysis applied to temperature rises in
multi-layer high-level waste repositories in a salt dome
(IAEA-SM-243/104) .................................................................................... 189
/ . Hamstra, J. W.A.M. Kevenaar, J. PrijDiscussion ..................................................................................................... 200
Свойства высокоактивных отходов, определяющие их поведение
при захоронении в геологические формации
(IAEA-SM-243/111) ................................................................................... 201
В .В .К ул и ч ен к о , Н. В. К р ы л о ва , И. И. К р ю к о в
(Properties o f high-level wastes which govern their behaviour when disposed o f in geological formations)Discussion .................................................................... ................................ 208
Minéralogical and geochemical constraints on maximum admissible
repository temperatures (IAEA-SM-243/28) ............................................ 209
N.A. ChapmanDiscussion ..................................................................................................... 219

RADIONUCLIDE MIGRATION (Session VIII)
Rapport établi sur demande
Enseignements tirés de l’étude des réacteurs naturels fossiles d’Oklo
pour le stockage des déchets radioactifs (IAEA-SM-243/8) ........................ 223
R. Hagemann, R. Naudet, F. WeberDiscussion ..................................................................................................... 237
238U/234U disequilibria as a measure óf uranium migration in clay over
the past 250 000 years (IAEA-SM-243/129) ............................................ 239
P.J: ShirvingtonDiscussion ..................................................................................................... 251
Shallow land burial of low-level radioactive wastes in the USA
(IAEA-SM-243/152) ........................................... ........................................ 253
J.B. RobertsonDiscussion ......................................................... ...................................... 268
Recherche en laboratoire sur la rétention et le transfert de
produits de fission et de transuraniens dans les milieux poreux
(IAEA-SM-243/155) ................................................................................... 271
J. Rochon, D. Rançon, J.P. GourmelDiscussion ..................................................................................................... 314
Transport mechanisms and rates of transport of radionuclides in the
geosphere as related to the Swedish KBS concept
(IAEA-SM-243/108) .................................................................................... 315
I. NeretnieksDiscussion ................................................................................................... . 339
Geochemical and isotopic investigations at the Stripa test site (Sweden)
(IAEA-SM-243/6) ........................................................................................ 341
P. Fritz, J.F. Barker, J.E. Gale, P.A. Witherspoon, J.N. Andrews,R.L.F. Kay, D.J. ¿ее, J.B. Cowart, J.K. Osmond, B.R. PayneDiscussion ..................................................................................................... 366
Laboratory studies of radionuclide transport in geologic media
(IAEA-SM-243/37) ............................... .................... .................................... 367
B.R. Erdal, B.P. Bayhurst, B.M. Crowe, W.R. Daniels,D.C. Hoffmann, F.O: Lawrence, J.R. Smyth, J.L. Thompson,K. WolfsbergDiscussion ..................................................................................................... 381
SAFETY ASSESSMENT AND REGULATORY ASPECTS
(Sessions IX and X)
Invited paper
Prediction of long-term geologic and climatic changes that might
affect the isolation of radioactive waste (IAEA-SM-243/43) .................. 385
Rhodes W. Fairbridge A risk analysis methodology for deep underground radioactive waste
repositories and related experimental research (IAEA-SM-243 / 161) .... 407
F. Girardi, A. Avogadro, G. Bertozzi, M. d ’Alessandro,F. Lanza, C.N. MurrayDiscussion ..................................................................................................... 420
The waste isolation safety assessment programme (IAEA-SM-243/35) ..... 423
A. Brandstetter, M.A. HarwellDiscussion ............................................. ....................................................... 434
The “Project-Safety-Studies Entsorgung” in the Federal Republic of
Germany (IAEA-SM-243/17) ...................................................................... 437
H. W. LeviDiscussion ..................................................................................................... 450
Safety assessment for deep underground disposal vault-pathways
analysis (IAEA-SM-243/169) ...................................................................... 453
R.B. Lyon, E.L.J. RosingerDiscussion ..................................................................................................... 463
Disposal of high-level waste or spent fuel in crystalline rock: factors
influencing calculated radiation doses (IAEA-SM-243/55) ................... 465
L. Devell, R. Bergman, Ulla Bergstrom, N. Kjellbert, C. Stenquist,B. GrundfeltDiscussion .................................................................................................... 492
Site data availability and safety assessment method development
for underground waste respositories (IAEA-SM-243/100) ...................... 495
V. Herrnberger, J.F. Schneider, J. GassmannDiscussion ..................................................................................................... 508
Application of the results of radiological assessments of high-level
waste disposal (IAEA-SM-243/25) .............................................. ............... 509
M.D. Hill, G.A.M. WebbDiscussion ..................................................................................................... 519
General discussion on Session IX ................................................................521

Технико-экономическое сравнение методов переработки и
захоронения жидких радиоактивных отходов на
атомных электростанциях СССР
(IAEA-SM-243/114) ................................................................................... 525
А .Н .К он драт ьев , М .В . Страхов, Н .А .Р а к о в , М .И . За ва дск и й (A technical and economic comparison o f methods fo r the treatment and disposal o f liquid radioactive wastes at nuclear power stations in the USSR)
.Discussion ..................................................................................................... 537
Design and safety evaluation of a Danish high-level waste disposal
facility in selected salt domes (IAEA-SM-243/154) .................................... 539
F. Hasted, S. MehlsenDiscussion ..................................................................................................... 551
General discussion on Session X .......... ............................................................ 553
Round Table discussion:
The reliability of radioactive waste isolation in geologic formations............ 557
Chairmen of sessions ........................................................................................ 571
Secretariat of the Symposium ........................................................................... 571
List of participants ............................................................................................ 573
Author index ..................................................................................................... 609
Transliteration index ........................................................................................ 613

DISPOSAL IN DEEP GEOLOGICAL FORMATIONS CRYSTALLINE ROCKS (CONTINUED),
ARGILLACEOUS SEDIMENTS AND OTHERS
(Session VI)

H. STIGZEUUS
Finland
Chairman

IAEA-SM-243/1
AN INTERDISCIPLINARY GEOSCIENTIFIC INVESTIGATION OF A PROPOSED SITE FOR RADIOACTIVE WASTE DISPOSAL IN AUSTRIA
H. HOLZER, E. STUMPFL, F. WEBER
Montanistische Universitàt Leoben
F. OSZUSZKY, P. RUDAN
Ôsterreichische Verbundgesellschaft Wien,
Vienna,
Austria
Abstract
AN INTERDISCIPLINARY GEOSCIENTIFIC INVESTIGATION OF A PROPOSED SITE
FOR RADIOACTIVE WASTE DISPOSAL IN AUSTRIA.
A geological reconnaissance of potentially suitable formations for long-term storage
of highly active radioactive waste in Austria showed that such formations could be expected
within the Bohemian Massif. Careful interpretation of LANDSAT imagery and available air
photo coverage led to the selection of an unfaulted area, approximately in the centre of a
large body of granodiorite. Field geology confirmed the homogeneity of granodiorite;
hydrologie investigations revealed the absence of a groundwater table except for small amounts
of surface water in the soil cover and weathering zone. A morphological analysis showed that
erosional processes are minimal at present and will remain so in the foreseeable geological
future. Geophysical investigations included, amongst others, magnetic measurements
(vertical intensity). The area chosen for further investigation is situated in a region of positive
measurements of vertical intensity. Some minor flat anomalies are due to higher magnetite
content of the granodiorite, which has magnetic susceptibilities of (4.0 - 5.8) X 10 (SI) or
(32-46) X 10"6 (CGS). Well-logging demonstrated high electric resistivities (some 1000 ohm-m).
in fresh rock; these values are reduced to about 100 ohm-m in weathered and fractured
rock. Temperature logs reveal undisturbed increase with depth; the average temperature
gradient (to 90 m depth) is 0.018°C/m. There is no microscopic evidence of tectonism or
fracturing. In conclusion, the large-scale regional features which indicate stability and lack of
tectonism , and geophysical i data, are supported by a detailed petrological investigation of
the granodiorite. The chosen area and site seem to be well suited to meet the containment
and isolation requirements for disposal of all sorts of radioactive waste to be expected.
1. INTRODUCTION
In the original medium-term energy plan for the Republic of Austria, three
nuclear power plants were envisaged. The first plant was constructed some 35
kilometres northwest of Vienna on the Danube. The 736 MW(e) power plant
was approaching its operational stage in 1978, when widespread public discussion
3
4 HOLZER et al.
on the safety of nuclear power resulted in a general referendum on this question
being held. In November 1978 a small majority of the populace voted against
nuclear power. Consequently, the plant was not put in operation; further work
was stopped and a reprocessing contract cancelled. Prior to this, the authors
were entrusted with geoscientific investigations to select a potentially suitable
site for medium-term storage as well as for a deep repository for highly active
waste in continental rocks. The original design foresaw a rock cavern approxi
mately 500 m below surface with intermediate storage facilites near the surface.
For a pre-selection of appropriate rock formations, the general geologic,
hydrologie, seismo-tectonic, and petrophysical properties of Austria’s geologic forma
tions as well as operational aspects were studied and evaluated. Of the about 84 000
square kilometres of Austria’s terrain, about 70% can be attributed to the Eastern
Alps, consisting of densely folded, imbricated, faulted and partly seismo-
tectonically still active mountain ranges and intra-alpine basins. The various
evaporite deposits as well as foreland- and intra-alpine sedimentary basins with
thick argillaceous sediments appeared to be unsuitable for a long-term repository,
mainly for geodynamic reasons, the presence of hydrocarbons, hydrologie
criteria and environmental considerations. Abandoned mines in the Alps had to
be discounted for similar reasons.
Therefore, the Austrian sector of the Bohemian Massif was chosen for the
selection of a potentially suitable area. The massif consists predominantly of
medium-to high-grade metamorphic suites which, in Hercynian times, were
intruded by widespread granitic to granodiorite plutons. The massif is deeply
eroded and peneplained. Relics of a sedimentary cover are preserved in places.
The annual amount of precipitation (500-600 mm/a) and surface run-off, for
Austria’s climatic conditions, is relatively low. The basement rocks are cut
by some major faults which were partly rejuvenated during the late-Alpine
orogenesis. The overall seismotectonic situation is such that at least the central
part can be considered as seismically inactive and tectonically stable.
According to our reprocessing contract a vitrified high-level waste of about
3—4 m3/a depending on the concentration of fission products would eventually
have to be stored in Austria.
Should the next two nuclear power plants, envisaged to produce about 1000
MW(e) each, become operational an additional amount about 10 m3/a would
have to be deposited.
The present concept foresaw a deposition in rock caverns which eventually
would permit retrieval of the vitrified cylinders. The latter were assumed to
be of 30 cm diameter, and length 1 m.
Further details are given by Oszuszky (see Bibliography). Important
factors for the site selection were, among others, thermal integrity of the host
rock depending on the cool-off time of fuel elements and the selected fission
concentration in the glass-cylinders.

IAEA-SM-243/1 5
2. SITE SELECTION
Within the Bohemian Massif four potential sites were proposed for more
detailed studies. One of them appeared to be the most suitable for geological,
hydrological, météorologie and logistic reasons. Additionally a low population
density and socio-economic factors were favourable.
3. DETAILED INVESTIGATIONS
3.1. Tectonics and seismicity
An interpretation of the heavy earthquakes of 1976 in the Friaul region
of northern Italy showed that the central part of the Bohemian Massif was almost
unaffected (few quakes were registered, with intensities of less than 3 degrees
on the Mercalli-Sieberg (°MS) scale). Furthermore, an evaluation of all available
data on earthquakes in Austria in historical times supported the above conclusion.
A seismo-tectonic investigation and risk analysis was performed by
R. Gutdeutsch (University of Vienna, Institute of Geophysics, unpublished report,
1978). It revealed very low seismic activity in the target area. The maximum earthquake
intensity in northeastern Austria recorded in historical times was a heavy quake
in 1590 with its epicentre at Neulengbach, some 65 km southeast of the target
area, at the northern front of the Flysch range. Its intensity at the proposed site
of the repository was estimated at: I = 6°MS. Such intensities are internationally
not considered as hazardous for underground rock caverns. Moreover, no
epicentres of quakes, even weak, have ever been recorded in the general area of
the proposed site.
A careful study of available LANDSAT satellite imagery of the area in
question showed that the potential repository site lies outside any lineaments
which, by some authors, were interpreted as active fault lines of seismo-tectonic
significance. Comparison of the seismic data with the location and trend of the
linears did not bear out these authors’ views. Photogeologic interpretation
proved the area to be free of surficially recognizable fracture or faults.
With regard to ’’man-made earthquakes”, local quakes of low intensities
could be caused by the thermal load produced by the high-level waste. However,
an analysis of such events revealed that the relatively low energy produced by the
above-mentioned phenomena would not open large fractures or fissures in
granitic rocks.
3.2. Geologic and morphologic environment
The site is located approximately in the centre of a large body of granodio-
rite. It is roughly lenticular in shape, with a north-south extension of about 15
km and a maximum width of approximately 6 km. It is bordered in the west by
6 HOLZER et al.
paragneiss, including cordierite gneiss with a north-southern strike and in the east
by orthogneiss and amphibolites, dipping steeply east. The granodiorite body proper
has a border zone of medium-grained granite, mainly developed at its eastern and
northern fringe.
The granodiorite is a coarse-grained rock with large potassium-feldspar crys
tals which give the rock its porphyric texture. Gabbroid and dioritic lenses are
common, reaching at places demensions of over a kilometre. A certain parallel
structure is observable, indicating an overall synclinal structure. In the adjacent
Czechoslovakian area, К/Ar dating of biotites showed an age of 376 million years.
A middle-Carboniferous cooling age can be assumed. Natural outcrops in the
target area are scarce but reveal a fairly homogeneous rock type. The overburden
varies in thickness from nil to one metre and consists of weathering products and
sandy soils. The area has low relief, gentle slope and a weak shallow drainage of
surface water.
A morphological analysis was performed by D. van Husen (Technical
University Vienna, unpublished report, 1977). Under present-day climatic condi
tions, no significant erosional processes are taking place in the selected area. Even
recurring periglacial climatic conditions and associated disappearance of the vege
tation would not alter this condition. Moreover, the proposed repository lies in a
zone which, during the peak of Alpine and north European glaciation, was with
in the ice-freé periglacial belt: a situation which would not alter even in case of
severe climatic changes, i.e. a renewed Ice Age in Europe or intense arid episodes.
3.3. Hydrogeologic conditions
According to investigations by H. Küpper (unpublished report, Vienna, 1977),
the target area forms a very slight cupola at about 600 m above sea level. The
compact granodiorite bedrock is at places overlain by sandy-argillaceous sediments
formed by weathering. The weak surficial drainage net has a run-off towards north
east and southwest. Water analyses showed identical values. The waters derive
from precipitation and penetrate into the bedrock down to about 25 m depth
along surficial cracks. Weak infiltration along sub-vertical fissures to about 90 m
is probable. With the exception of small amounts of surface water in the soil
cover and underlying weathering zone, a coherent circulating groundwater table
is absent.
3.4. Geophysical surveys
Detailed magnetic measurements (vertical intensity) were carried out with
distances of 50 m between the stations. The resulting iso-anomaly map shows
positive values throughout, with a general N-S trend of the isolines. It is characte
rized by an absence, of anomalies of considerable extent. Some smaller anomalies
IAEA-SM-243/17
have amplitudes up to 20 nT and are probably caused by basic inclusions in the
granodiorite. These results are in good coincidence with experiences in other
granite areas of the Bohemian Massif.
The susceptibility measured on cores from different depths give values in the
range of (4.0-5.8) X 10'4 (SI).
Well-logging was performed in all the six boreholes, measuring eigen-poten-
tial, electric log and temperature log. The electric logs were measured with a
normal electrode device having a depth of investigation up to 1.2 m. One impor
tant result of the electric logs is that the dense, unweathered granodiorite shows
high resistivity values (> 3000 ohm.m). Locally in some intervals of few m
thickness the resistivity values decrease to 100 ohm • m. Comparisons with the
geologic profile of the boreholes demonstrate that there are zones with a large
number of cracks.
Some temperature logs show small negative anomalies (~0.1°C) in accor
dance with anomalies of electric resistivity. This is a basis for the assumption that
no water circulation takes place in the faults. The mean temperature gradient,
computed from the lower, undisturbed parts of the logs is 0.018° C/m (equalling
a geothermal depth step of 55.5 m/°C).
Measurements of thermal conductivity were performed on 33 samples from
various depths, using a steady-state method. Each sample was divided into 3
cylindrical plates with a diameter of 5 cm and thicknesses of 1, 2 and 3 cm
respectively. The mean value of the thermal conductivity is 2.5 ± 0.15 W/m.K
(= 5.97 ± 0.35 X10’3 cal/cm-s-°C) at 40°C.
The mean density of the granodiorite is 2.716 ± 0.006 g/cm3. Compressional
wave velocities measured by ultrasonics are5110± 250 m/s.
These values of thermal conductivity are in a satisfactory coincidence with
the results found in the literature (Birch, 1966, Moissenko, 1968), but are generally
lower than are usually expected in granitic rocks. The variations of the thermal
conductivities of the Rastenberger granodiorite are probably caused by factors
such as variations in the quartz content, relatively large feldspar crystals, and
mafic lenses. There are also indications for a small anisotropy of thermal conducti
vity, where the values from measurements parallel to the earth surface are higher
(~ 5%) than in the vertical direction.
3.5. Test drilling and rock mechanics
Six shallow boreholes were drilled with a core diameter of 100 mm. Bore
holes 1 and 3-6 reached a depth of 50 m, borehole 2 was 90 m deep. Core re
covery was 100%. During the drilling, water pressure tests were performed in the
bedrock at intervals of 5 m.

8 HOLZER et al.
Results:
A loamy overburden averages 2 - 5 m in depth; below follows a zone of 4 m
of thoroughly weathered granodiorite-debris. It is underlain by homogeneous,
fresh granodiorite. Its topmost 5 to 10 m show fissures parallel to the surface.
In some boreholes, steep fissures were observed at greater depths, located at inter
vals of about 20 m.
All fissures appeared to be closed; two holes were free of fissures. The
water pressure tests showed positive results, indicating fracture-free bedrock.
This was confirmed by using a borehole TV-probe.
Chemical and isotopic-physical analyses of water in boreholes proved that
the underground water is distinctly different from surface water of the area, being
at least 25 years older.
Rock mechanics tests on drillcores gave the following results:
compressive strength 122N/mm2
shear strength 10.3 N/mm2
friction angle 59°
E - module 44.4 kN/cm2
3.6. Petrological investigations
The U- and Th-values of granodiorite were determined on drillcores at the
laboratories of the Studiengesellschaft fur Atomenergie (SGAE) in Vienna.
Various tests revealed the following values:
U - content 9.25 мg ± 0.45 Mg/g rock
Ra - content 1.47 Mg ± 0.073 pg/g rock
Th-content 48.58 //g ± 3.86 Mg/g rock
Noticeable is the relatively high Th-content of this rock type.
To investigate additional rock mechanics properties sound-emission analyses
were conducted by H. Hick (SGAE/Vienna). The rock was heated to 3 50°.
Significant strong acoustic emissions were recorded between 120 - 170° С and
above 270°C. Rock samples heated to more than 300°C probably lose their
mechanical strength.
Acoustic emission of fine-grained rocks was identified as “boiling-acoustics”,
that of coarse-grained rocks is due to boiling and fracturing. The latter was obser
ved above 120° and is probably caused by the differing thermal expansion of the
various crystals. Although these investigations have not been concluded it appears
that the maximum temperature load of the host rock should not exceed 100°C.
This might be of considerable importance for the reprocesser regarding the per
centage of fission products in the glass matrix.

IAEA-SM-243/1 9
Surface samples and core material were studied under the microscope. The
host rock of the proposed site is a medium to coarse-grained granodiorite. The
mafic components dominate; they are fine-grained except for a few larger amphi-
bole-crystals. The feldspar-grains average 1 cm; porphyroblasts of up to 4 cm are
abundant. Along fissures the feldspar is altered; biotite appears greenish.
The following components were identified:
quartz
orthoclase
plagioclase
biotite
hornblende
chlorite
accessories are opaque ore grains.
The quartz content is between 10 - 30%, biotite between 10- 20%. The
hornblende content varies between 9 and 15%, indicating a partly autometa-
morphic origin. The feldspar content lies between 50 - 60%.
The rock texture is generally sound and does not differ from other granitic
plutons. Experience gained in mining areas indicated that fissures and cracks in
cm to dm dimension occur at depths of several hundred metres. However those
cannot be considered as influencing the thermal conductivity or the mechanical
strength of the rock.
4. CONCLUSIONS
The results of the above investigations prove, in the opinion of the authors,
that the target area lies in a homogeneous, solid body of granodiorite. No major
tectonic faults were detected in the site area not in the adjacent sectors. The
seismo-tectonic situation as well as the hydrologie parameters appear favourable.
The rock-mechanical properties of the granodiorite promise good engineering
conditions.
The geological history of the area and its extrapolation into the future
supply no arguments against the construction of a repository at this location.
The acoustic emission analysis indicates that the host rock should
probably not be exposed to temperatures above 100°C.
The authors are aware that only parts of the planned investigation were
actually completed. Deep core drillings, gravimetric and refraction seismic surveys
as well as in situ thermal studies, etc. could not be executed because of the refe
rendum. Therefore the positive results presented here have to be considered as
incomplete.
3.7. Mineralogical investigations

10 HOLZER et al.
BIBLIOGRAPHY
ADAM, A., Geoelectric and Geothermal Studies, Akadémia Kiadó, Budapest (1976).
BIRCH, F., in Handbook of Physical Constants (S.P. Clark, Jr., Ed.) (1966).
BRANCA, G., GERA, F., MIRONE, М., VELONA, F., Radioactive waste management in Italy,
Energia Nucleare, Gennato 18 1 (1972) 17-25.
CLARK, S.P. Jr., Heat flow in the Austrian Alps, Geophys. J. 6 1 (1961) 54-63.
CREUTZBURG, H., Untersuchungen über den Warmestrom der Erde in Westdeutschland,
Kali und Steinsalz 4 (1964) 73-108.
EDER, O., HICK, H., Proposed Applications of Acoustic Emission Monitoring to Radioactive
Waste Disposal in Geologic Formations, Studiengesellschaft für Atomenergie (1979).
EISENBLÁTTER, J., FANINGER, G., Zur Anwendung der Schallemissionsanalyse in Forschung
und Technik, Metallwissenschaft und Technik 31 1 + 2 (1977).
EXNER, Ch., Zur Rastenberger Granittektonik im Bereich der Kampkraftwerke (Südliche
Bôhmische Masse), Mitt. Geol. Ges. Wien 61 (1968) 6—39.
FUCHS, G., MATURA, A., Zur Geologie des Kristallins der südlichen Bôhmischen Masse
(ErL z. geoL K. d. Krist. d. siidl. Bôhm. Masse), Geol. BA., Vienna (1976) (geol. map. 1:20 000
plus expl. text).
GEOLOGISCHE BUNDESANSTALT, Expanatory Notes for the Synoptic Map of Geology and
Geotechnics 1:10 000, Gopfritz, Vienna (1967) (text + geol. map).
HEIGL, F., SCHETELIG, K., Die Standortwahl für Kemkraftwerke aus der Sicht der Geologie,
der Hydrologie und des Objektschutzes, Geol. Rundsch. 66 (1977) 796—803.
INSTITUTE OF GEOLOGICAL SCIENCES, Disposal of Highly-Active, Solid Radioactive Wastes
into Geological Formations — Relevant Geological Criteria for the United Kingdom, Rep. 76/12,
Her Majesty’s Stationery Office, London (1976).
INTERNATIONAL ATOMIC ENERGY AGENCY, Site Selection Factors for Repositories
of Solid High-Level and Alpha-Bearing Wastes in Geological Formations, Tech. Rep. Ser. 177,
IAEA, Vienna (1977).
KAPPELMEYER, O., HAENEL, R ., Geothermics with Special Reference to Application, Gebr.
Bomtrager, Berlin (1974).
KARL, R., MANTEY, W., SCHUSTER, K., Gesteinphysikalische Parameter: Schallgeschwindig-
keit, Warmeleitfáhigkeit, Freiberger Forschungshefte С 197 (1965).
KUPKA, E., Berichte über Aufnahmen auf den Blattem Zwettl (19) und G fôhl (20) in den
Jahren 1969 und 1973, Verh. Geol. BA, A, Vienna (1970, 1974).
MOISSENKO, U., Warmeleitfáhigkeit der Gesteine bei hohen Temperaturen, Freibeiger
Forschungshefte, С 238, Leipzig (1968) 89—94.
OSZUSZKY, F., AUgemeine Überlegungen zur Entsorgung radioaktiver Restmaterialien in
geoL Fbrmationen, Atom u. Strom, 24. Jg., May/June (1978) 61-71.
OSZUSZKY, F., Die Endlagerung radioaktiver Abfálle, A.I.M. Liège, Centrales electriques
modernes (1978) 16—17.
IAEA-SM-243/1 11
ROBINSON, E., “Viscoelasticity of rocks” , State of Stress in the Earth’s Crust (Proc. Int.
Conf. Santa Monica, 1963), Elsevier, New York ( 1964) 181.
RYBACH, L., Warmeproduktionsbestimmungen an Gesteinen der Schweizer Alpen, Beitr. zur
Geol. d. Schweiz, Geotechn. Sèr., L. 51, Zurich (1973).
SCHERMANN, O., Über Horizontalverschiebungen ara Ostrand der Bôhmischen Masse, Mitt.
GeoL Bergbaustud. Vienna 16 (1966) 89-102.
SVOBODA, J., et al., Regional Geology of Czechoslovakia, Pt. I, Geol. Surv. Czechoslo
vakia, Prague (1966).
TOLLMANN, A., Die Bruchtektonik Ôsterreichs im Satellitenbild. N. Jb. Geol. Palâont.
Abh., 153 1 Stuttgart (1977) 1-27.
WEBER, F., Beitrâge zur Anwendung geophysikalischer Methoden bei Problemen der
Angewandten Geophysik. Mitt. Abt. Geol. Pal., Berg. Landesmuseum Joanneum, H. 36
Graz (1976) 179-224.
Various unpublished reports, Vienna 1977/1978 by GUTDEUTSCH, R., HICK, H.,
HOLZER, H., HUBBER, H., v.HUSEN, D„ JANSCHEK, H., KÜPPER, H., OSZUSZKY, F„
RUDAN, P. STUMPFL, E., WEBER, F.
DISCUSSION
H. M. HARSVELDT: In the section of the paper entitled “Geophysical
surveys” you state that locally in some intervals a few metres thick the resistivi
ty values decrease to 100 ohm/m. May I ask what lithology caused this?
F. OSZUSZKY: The lower resistivity values are due to the strongly
weathered granodiorite.
M. W. GOLDSMITH: How long a period did you set as a time frame for
your repository area to remain stable? I am referring to your summary statement
concerning the time frames for successful waste disposal which were discussed
in connection with the Austrian referendum.
F. OSZUSZKY: In discussing stability criteria for repositories it was our
intention to point out the widely different time frames, ranging from hundreds
to millions of years. In view of this spread it is suggested that the matter should be
opened for discussion in order that we may arrive at a “common time frame” on
an international basis.
J. A. ANGELO: Could you please comment on the extent of your use of
LANDSAT satellite imagery in repository site evaluation?
F. OSZUSZKY: The main reason for using this method was to prove that
no major fault existed in the vicinity of the target region. In our studies we also
compared LANDSAT images from known regions, such as Japan and California.

12 HOLZER et al.
K. SCHIFFER STEIN: You say your acoustic-emission analysis indicates
that the host rock should probably not be exposed to temperatures above 100°C.
Could you please explain how you can estimate the possible temperature load
of the host rock from acoustic emission?
F. OSZUSZKY: Preliminary laboratory investigations on host rock samples
have shown that in the temperature range of 100— 120°C the acoustic emission
rate increased significantly. Boiling phenomena of pore water could be excluded
and additional experiments revealed that the acoustic noise was due to the
occurrence of microfissures.
At the very preliminary stage of experimental investigations we preferred
to be conservative, i.e. to avoid any boiling and microfissuring phenomena in the
host rock and not to exceed 100°C in granite.
V. E. POLISCUK: If you decide to construct a repository, will you be able
to select a site which is located in a seismically stable area?
F. OSZUSZKY: Our target area for the proposed repository site lies in a
region which for all practical purposes is seismically stable. If a decision were
taken to construct such a final storage site in Austria, preference would be given
on geotechnical and hydrogeological grounds to the so area so selected.

IAE A-SM-24 3/20
SITE CRITERIA FOR NUCLEAR WASTE DISPOSAL IN IRAN WITH SPECIFIC REFERENCE TO CRYSTALLINE ROCKS
A. AFRASIABIAN
Atomic Energy Organization of Iran,
Teheran,
Iran
Abstract
SITE CRITERIA FOR NUCLEAR WASTE DISPOSAL IN IRAN WITH SPECIFIC REFERENCE
TO CRYSTALLINE ROCKS.
Iran has now started development of nuclear technology. Although this is in its initial
stages, the disposal of wastes will pose a serious problem unless a solution is found. Therefore
the Atomic Energy Organization of Iran (AEOI) has from the outset, although no waste
has yet actually been produced, given consideration to the problem of wastes and possible
methods for their desposal. This paper presents material contributing to a better understanding
of waste disposal in Iran. Based on the geological and seismotectonic characteristics of the
country, five regions have been proposed for future investigation. It appears that in Iran
granitic rocks are the most suitable for waste disposal because of their known uniformity,
stability, strength and thickness. Since this paper is the first on geological considerations for
waste disposal in Iran, it is hoped that it will provide a basis for discussion between interested
geologists.
1. INTRODUCTION
The two words “radioactive” and “waste” are in themselves highly emotive
and when linked open a dark area of apprehension among the public such as has
rarely been encountered before by any sector of national industry. Concern has
crystallized over the issue of high-level waste (HLW), the disposal of which by deep
burial in rock formations has been mooted as the most feasible option.
The present paper is a contribution to the current international debate on
the factors and criteria which bear upon the selection of a region where the use
of a specific geological formation for disposal could be possible. Later, based on
detailed field study and extensive exploration, it should be possible to select a
suitable site within the region for the repository. Among various methods,
disposal in stable crystalline rocks has been discussed. Suggested sites are shown
in Figs 1 and 2.
The purpose of this paper is to identify the site criteria which might be used
in the selection of an area containing geological formations suitable for the dis
posal of radioactive wastes in Iran. The geology and suitability of these crystalline
rocks is discussed. These rocks have been recommended as providing the greatest
13

14 AFRASIABIAN
FIG. I. Proposed regions for future waste disposal in Iran. Squares indicate possible areas.
possible degree of isolation under the geological conditions in Iran. It should be
noted that the selection of sites within any of the recommended regions would
necessitate extensive exploration which should aim at meeting the general criteria
defined in this paper. In addition to information about geological, geophysical,
hydrological, petrological and geotechnical characteristics of the formation and
its general assessment, long-term monitoring of hydrological, environmental, and
seismological conditions will be required at any site.
IAEA-SM-243/20 15
The term “area” must be considered as indefinite, since scale will vary in
different situations, reflecting particular geological conditions. However, in
outlining the investigation required, the intention will be to locate a site with the
following major characteristics:
(1) The site should be located in a region of very low seismic activity. Especially
important is the lack of active tectonic structures and general seismic and
tectonic stability of the region.
(2) The hydrologie cycle in the site area should not involve surfacing of possibly
contaminated groundwater.
(3) The site should be preferably remote from densely populated regions as
well as from natural resources.
(4) Reconstruction of the detailed past geological history and extrapolation of
the future geological picture of the site area should be possible.
2. DEFINITION OF SITE CRITERIA
3. DETERMINATION AND STUDY OF VARIOUS TECHNICAL PARAMETERS
AFFECTING THE SITE
3.1. General
Essentially the philosophy behind the disposal of radioactive wastes is to
create an effective barrier for radiological waste hazard for a relatively long
period of time. Thus the following geological criteria must be considered in
evaluating the site and the barrier:
(1) Tectonic displacement such as uplift, subsidence or lateral displacement has
great influence on the long-term stability of the disposal area as well as for
long-term changes in the hydrogeological cycles. It must be ensured that the
. storage areas should not undergo such displacement during their lifetime.
(2) The long-term behaviour of host rock under different geological conditions
must guarantee the long-term validity of the storage formations as a barrier.
(3) The formation must withstand possible thermal changes without losing its
barrier formations.
(4) Changes in sea level should not influence the disposal area.
(5) Glaciation must not take place on the disposal area.
16 AFRASIABIAN
(6) Erosion during the period of utilization must not negatively influence the
validity of the host formation as a geological barrier.
(7) No substantial changes in permeability and transmissivity of the storage
formation should occur during the storage formation periods.
(8) No long-term geochemical alteration of the storage formation which can
negatively influence its character as a geological barrier may occur.
(9) .The storage formation should not be affected by any earthquake of a
magnitude negatively to influence the validity of the geological barrier.
( 10) The storage formation should be resistant to weathering (physical and
chemical decomposition by water, wind, daily temperature variations,
bacteria, etc.).
3.2. Topography
A precise topographic map of the region and its vicinity showing mountains,
hills, gullies, drainage systems, vegetation, surface run-off and other topographic
feature should be considered.
3.3. Meteorological condition
A general description and presentation of meteorological information from
all meteorological stations near or in the region is required, showing the net annual
precipitation surplus and presenting data on temperature, historical monthly rain
and snowfall, relative humidity, wind velocity and direction, occurrence of
extreme weather phenomena such as hurricanes, tornadoes etc.
3.4. Hydrology
The important consideration from the standpoint of hydrology is that once
the solid waste material is buried beneath the ground, access of circulation fluids
(principally groundwater) presents the greatest risk of transporting waste away
from the burial site and back to the biosphere. Besides, the conditions need to be
such that relevant parameters can be monitored over a long period of time once
disposal has commenced.
The hydrological study should include the following:
(1) Information on nearby reservoirs, including drawing reservoirs, location of
existing or proposed dams, if any.
(2) Information on flood potential and probably maximum flood, water level
due to dam failure; average surface run-off.
IAEA-SM-243/20 17
(3) A study of regional and local groundwater aquifer sources. One of the main
objectives in the groundwater investigation is the determination of the floor
path for water beneath the proposed region and in particular of the point at
which it is likely to appear at the surface. This “area of emergence” may be
at a spring or where there is a seepage into a stream.
(4) Study of groundwater velocity and its chemical and physical properties.
3.5. Regional geology
The selection of an area where disposal facilities for waste may be located,
necessitates the availability within the area of a stable geological formation
suitable for the construction of engineering structures and able to retain the
waste, both under present conditions and under geological conditions. The
geological study should include at least the following:
(1) Geological map of the region, showing folds, faults, salt domes, volcanoes
and other tectonically important features.
(2) Study of geological units based on stratigraphical and petrological investiga
tions and age determination.
(3) Study of geological hazards in the region, including karst, landslide, weathering,
salt intrusion, and volcanism.
(4) Study of geological history and geomorphological evolution of the region by
means of paleontological, sedimentation, and paleogeographical methods.
(5) Study of unconsolidated young cover deposits.
3.6. Seismicity and neotectonics
The fact that most of Iran is an active seismic region should underline the
importance of the seismic characteristics of the area. In general, the site must be
outside the region of abnormally high seismicity. The study should include the
following:
( 1 ) Regional seismicity and collection of all available data on located epicentres
in the region.
(2) Seismotectonic conditions, with emphasis on the presentation of data on
intensities, magnitude, and epicentres of the region.
(3) Study of neotectonic features, with emphasis on active faults, seismic move
ments, their length, direction of motion, dip, rate of slip, strike and history
of previous movements, as well as relations between faults and subsurface
effects of neotectonic movements.

18 AFRASIABIAN
(4) Historical seismicity, migration of active zones.
3.7. Geophysical investigation
Investigations should include geophysical determination of the underground
extent of the host rocks and borehole testing, including well-logging (as needed)
Lugeon tests, and aerial and ground radiometric surveys of the region.
3.8. Geotechnical engineering
The study should includes collection of geotechnical data on host rock
formation, and data of subsurface characteristics of the region, including informa
tion on uniformity of rocks in depth and tunnelling condition.
4. THE IMPACT OF NUCLEAR WASTE DISPOSAL ON VARIOUS
PARAMETERS
The impact of radioactive waste disposal on natural and environmental
conditions that are characteristic of a given region should be studied. Aspects to
be considered are:
(1) Geography: including survey maps, road map, and location map of the
region.
(2) Demography and population distribution: including population fluctuation
and population for transients including tourists, labour force, nomads and
seasonal inhabitants.
(3) Land use: including the public usage of land and the nearest important
areas, projected land use within the region and its vicinity in future years, and
development projects within the region.
(4) Water utilization: including the sources of water used by inhabitants, annual
average consumption, projected water use, local aquifers of fresh water
supply, fluctuations of water flow in local rivers, wells, qanats, springs, with
chemical characteristics of each source of water.
(5) Ecological impact: including geological problems of the region, natural and
background radiation from various sources in the region.
(6) Interaction with other industrial facilities: including the study of hazards to
industrial plants within the vicinity.

IAE A-SM-24 3/20 19
(7) Economic factors: including overall economic feasibility of the region, taking
into account cost associated with (i) development of the site; (ii) avail
ability of construction materials, etc.
5. EVALUATION
A synthesis of all information obtained in previous studies is required. The
site should be evaluated and ranked according to the criteria of safety, suitability,
and economic advantages.
6. SUITABILITY OF CRYSTALLINE ROCK FORMATIONS IN IRAN
6.1. Seísmo tectonic provinces of Iran
Geologically and structurally, the Iranian mountain ranges have long been
known as a part of the Alpine-Himalayan system in western Asia, between the
Arabian shield in the south-west and the Turan Plate in the north-east. Stocklin
(1968) has reviewed the geological and tectonic work carried out to date and
distinguished major zones different in structural history and tectonic style. This
and other studies are noted in the bibliography following this paper.
To simplify the geology of Iran, the country can be divided into four major
structural—geological units separable on the basis of regional differences in
structural—geological characteristics. The major structural units from south
west to north-east are as follows:
(1) Zagros active folded belt, including the high Zagros (imbricate or Thrust
Zone) and foothills (simply folded belt).
(2) Central Iran including:
(A) Central Iran and Azarbaijan
(B) Lut Zone
(C) East Iranian Ranges (flysch zone)
(D) Makran Ranges
(E) Central Kavir.
(3) Alborz mountains from Bandar Pahlavi to Gorgan (south of the Caspian Sea).
(4) Koppeh Dagh Ranges north of Khorasan (NE Iran).
20 AFRASIABIAN
These units correspond to the seismic zones of Iran, as the earthquakes are
phenomena accompanying tectonic processes. Therefore, knowledge of the
tectonic environment and particularly the trend of recent tectonic movements is
of great importance and this has been taken into consideration in selecting the
five proposed regions to be investigated for future waste disposal in Iran.
6.2. Discussion on suitability of crystalline rocks
Following the review of the seismicity of the country, the regions between
the Jaz Murian and the Oman Line, as well as between the Zagros Thrust and the
Persian Gulf, are considered unsuitable because of their high seismotectonic
activity. The north-east of Iran is also characterized by high seismic activity and
is therefore excluded. In comparison with salt and clay formations it appears
that in Iran granitic rocks are the most suitable for waste disposal because of their
known uniform stability, strength and thickness.
As a result, and based on seismic, tectonic, hydrologie, and demographic
characteristics of the various regions, the following five areas (Fig.2) are recom
mended for future investigations for Nuclear Waste Disposal. These areas are as
follows:
(1) Shir-Kuh, SW of Yazd (31035'N, 54°E).
(2) Kuh-e-Rigi, SW of Dehe-Salm (30° 10'N, 59°20'E) (Central Lut).
(3) Shah-Kuh (31°40'N, 59°25'E) (North-Central Lut).
(4) Zarrim, NNE of Saghand (36°40'N, 54° 30'E).
(5) Tekab (36°25'N, 46° 40'E).
It should be possible to find a suitable site for waste disposal meeting the
above-mentioned site criteria. Regarding transportation, all the selected regions
could be made accessible.
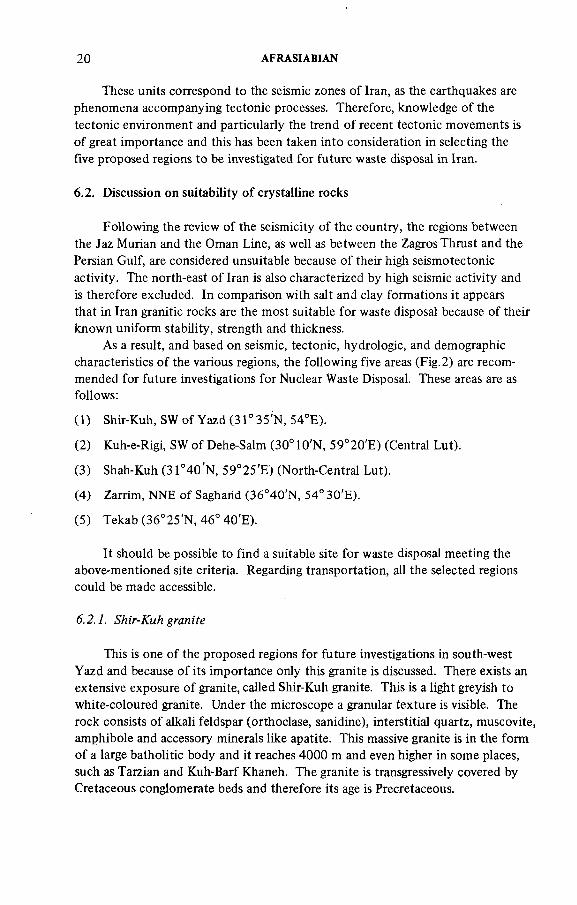
6.2.1. Shir-Kuh granite
This is one of the proposed regions for future investigations in south-west
Yazd and because of its importance only this granite is discussed. There exists an
extensive exposure of granite, called Shir-Kuh granite. This is a light greyish to
white-coloured granite. Under the microscope a granular texture is visible. The
rock consists of alkali feldspar (orthoclase, sanidine), interstitial quartz, muscovite,
amphibole and accessory minerals like apatite. This massive granite is in the form
of a large batholitic body and it reaches 4000 m and even higher in some places,
such as Tarzian and Kuh-Barf Khaneh. The granite is transgressively covered by
Cretaceous conglomerate beds and therefore its age is Precretaceous.
IAEA-SM-243/20 21
Considering the geology of the above-mentioned regions, a suitable site for
nuclear waste disposal in these granites can be found, after detailed field investiga
tions have been carried out.
Also, we must not totally rule out the possibility of salt dome structures,
although a final decision would require detailed study.
ACKNOWLEDGEMENTS
The author wishes to thank Dr. S. A. Yamani of the Waste Management
Division of the Atomic Energy Organization of Iran for his assistance, and
Dr. J. Stocklin for reading the manuscript.
BIBLIOGRAPHY
AFRASIABIAN, A., Specification for Site Selection, Waste Management Division, Atomic
Energy Organization of Iran, NMD/ST/5 (1977).
BERBERIAN, М., Seismotectonic Review of Iran, Geol. Survey of Iran, Rep. 39 (1976).
CHAMPMAN, N., et al., Nuclear waste disposal, New Scientist (1978) 225—228.
ESPAHBOD, M.R., Report on Yazd-Ardekan Area, Geol. Survey of Iran, Rep. 42 (1966).
GERA, F., “ Radioactive waste disposal in geological formations” , (Proc. Int. Conf. Nuclear
Power and its Fuel Cycle, Salzburg, 1977) IV, IAEA, Vienna (1977) 337.
GRAY, D.A., “Disposal of Radioactive Waste to Geological Formations, UK Inst. Geol. Sci.
Rep. 76/2 (1976).
HAGHIPOUR, A., et al., Report on Explanation Text of the Ardekan Quadrangle Map. Geol.
Survey of Iran (1977).
KASHFI, M.S., Plate tectonic and structural evolution of the Zagros geosyncline, SW-Iran,
Geol. Soc. Am., Bull., Vol.87(1976) 1486.
KRAUSKOPH, B.K., Geological Aspects of Criteria Development for Radioactive Waste
Management” . Geology Department, Stanford University, California ( 1976).
MOHAJER, A., Recent and Contemporary Crustal Deformation in Eastern Iran, Ph.D. thesis —
Imperial College, London (1975).
NOWROOZI, A.A., “Seismotectonic Provinces of Iran” , Bull. Seismological Soc. Am. 66 4
(1976) 1249.
STOCKLIN, J., “ Salt Deposits of the Middle East” , Geol. Soc. Am., Special Paper (1968)
152-181.
TAKIN, М., Iranian geology and continental drift in the Middle East” , Nature 235 5334 (1972).
7. CONCLUSIONS

22 AFRASIABIAN
DISCUSSION
J.A. ANGELO: Could you please comment on your future waste management
study plans? Will you soon start site surveys or geophysical investigations?
A. AFRASIABIAN: Our study plans regarding waste management were
originally based on having 20 nuclear reactors in Iran but now, in view of the
changed policy, our waste management planning will be on a much smaller scale.
Therefore, I do not think we shall start site surveying very soon.
IAEA-SM-243/132
PRELIMINARY RESEARCH ON GEOLOGICALISOLATION OF HIGH-LEVELRADIOACTIVE WASTE AT THEJAPAN ATOMIC ENERGY RESEARCH INSTITUTE
K. ARAKI, S. TASHIRO, T. BANBA, K. ABE,
K. KOBAYASHI, K. SATO, H. AMANO
Japan Atomic Energy Research Institute,
Tokaimura, Ibaraki
T. KASHIWAGI
Mitsubishi-kinzoku Co.,
Tokyo,
Japan
Abstract
PRELIM INARY RESEARCH ON GEOLOGICAL ISOLATION OF HIGH-LEVEL
RADIOACTIVE WASTE AT THE JAPAN ATOMIC ENERGY RESEARCH INSTITUTE.
A preliminary safety evaluation of the geological isolation of high-level waste (HLW) was
carried out taking into account heat accumulation and penetration of water into the geological
formation. Using a box-model calculation method, it was estimated that no thermal impact
would be detectable beyond 300 m upwards from the emplaced high-level waste in a granite rock
repository at 500 m down. It was estimated that the average temperature would increase more
than 170° С over 30 years after the emplacement of HLW in 148 canisters. The leachability of the
vitrified HLW was measured between 100 and 300°C for 2 h up to 80 kg/cm2 with a Soxhlet-type
leachability testing device (High-Pressure Soxhlet-Type Leachability Testing Device, HIPSOL),
assuming an increase of the temperature, and the penetration of water into the repository under
tectonic pressure. The leaching rate was increased from 0.2 wt% at 100°C to 6.0 wt% at 295° С
with regular exchange of distilled water as a leachant. The migration of the leached nuclides
was preliminarily estimated by means of the box-model calculation method, assuming several
parameters. It is concluded that further experiments are necessary to obtain input data for the
total safety evaluation.
1. INTRODUCTION
Ultimate isolation of high-level waste (HLW) is important to complete a
nuclear fuel cycle back-end and geological isolation is now considered to be one of
the most feasible methods [1].
Since 1977, the Japan Atomic Energy Research Institute has started to
measure the physical properties of rocks which are abundant in Japan and to make
factor analyses for the safety evaluation of HLW geological isolation as shown in
23
24 ARAKI et al.
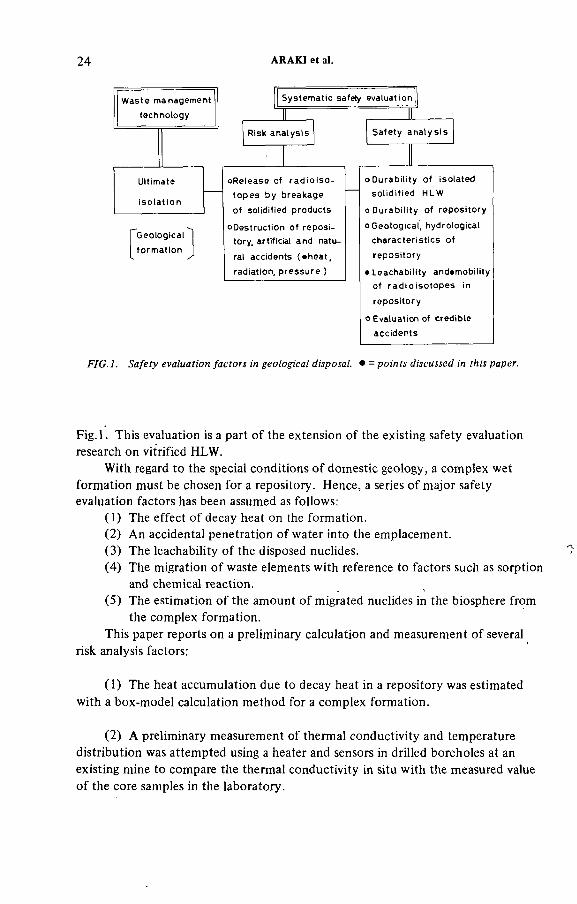
FIG.l. Safety evaluation factors in geological disposal. • = points discussed in this paper.
F ig .l. This evaluation is a part of the extension of the existing safety evaluation
research on vitrified HLW.
With regard to the special conditions of domestic geology, a complex wet
formation must be chosen for a repository. Hence, a series of major safety
evaluation factors has been assumed as follows:
(1) The effect of decay heat on the formation.
(2) An accidental penetration of water into the emplacement.
(3) The leachability of the disposed nuclides.
(4) The migration of waste elements with reference to factors such as sorption
and chemical reaction.
(5) The estimation of the amount of migrated nuclides in the biosphere from
the complex formation.
This paper reports on a preliminary calculation and measurement of several
risk analysis factors:
(1) The heat accumulation due to decay heat in a repository was estimated
with a box-model calculation method for a complex formation.
(2) A preliminary measurement of thermal conductivity and temperature
distribution was attempted using a heater and sensors in drilled boreholes at an
existing mine to compare the thermal conductivity in situ with the measured value
of the core samples in the laboratory.
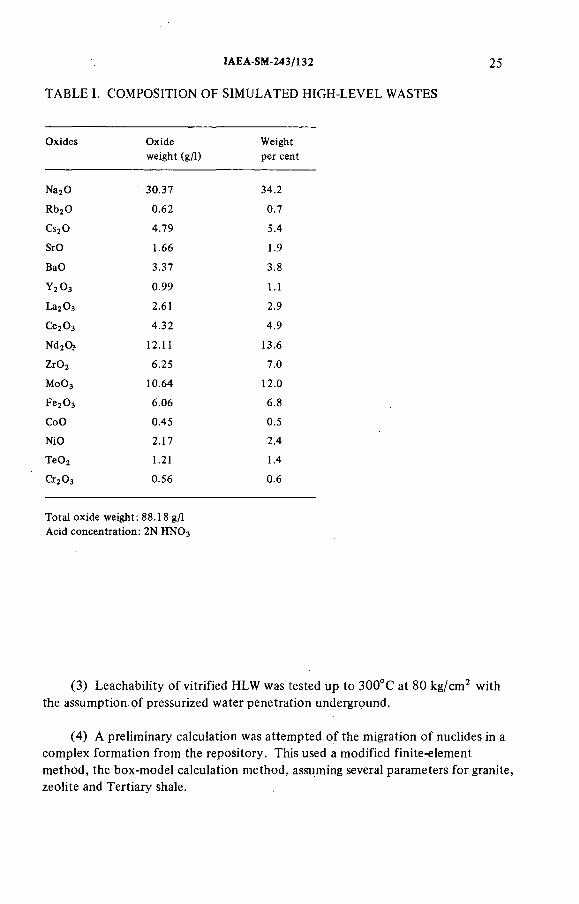
TABLE I. COMPOSITION OF SIMULATED HIGH-LEVEL WASTES
IAEA-SM-243/132 25
Oxides Oxide
weight (g/1)
Weight
per cent
Na20 30.37 34.2
Rb20 0.62 0.7
CS2O 4.79 5.4
SrO 1 . 6 6 1.9
BaO 3.37 3.8
y 2 o 3 0.99 1.1
La 2 O3 2.61 2.9
Се2Оз 4.32 4.9
Nd20? 1 2 . 1 1 13.6
Z r0 2 6.25 7.0
M0 O 3 10.64 1 2 . 0
Fe2 0 3 6.06 6 . 8
CoO 0.45 0.5
NiO 2.17 2.4
Te02 1 .2 1 1.4
Cr20 3 0.56 0 . 6
Total oxide weight: 88.18 g/1
Acid concentration: 2N H N 0 3
(3) Leachability of vitrified HLW was tested up to 300°C at 80 kg/cm2 with
the assumption.of pressurized water penetration underground.
(4) A preliminary calculation was attempted of the migration of nuclides in a
complex formation from the repository. This used a modified finite-element
method, the box-model calculation method, assuming several parameters for granite,
zeolite and Tertiary shale.

26 ARAK1 et al.
TABLE II. COMPOSITION OF BOROSILICATE GLASS
Component
Weight per cent
FP oxides
20.0
В20з
12.0
Na20
16.0
CaO
5.0
Zeolite
47.0
2. EXPERIMENTAL
2.1. Leaching test of simulated HLW glass at high temperature
Glass samples were prepared by the following procedure: Simulated high-level
liquid waste, calculated by the DCHAIN code [2] as shown in Table I, was prepared
with corresponding metal nitrates. The liquid waste was then calcined by a rotary-
kiln. After the calcine was mixed with glass-forming materials shown in Table II,
the mixture was poured into a melter, and heated by an induction coil at 1200 С
for 2 h to get a homogeneous glass block. The block was then broken down into
granules, which were sieved to obtain between 35 and 60 mesh fractions.
Leaching tests were performed at various temperatures from 100°C to 300°C,
using a device named “High-Pressure Soxhlet-Type Leachability Testing Device”
(HIPSOL). Six grams of the granular were set into the Soxhlet type extractor in
the vessel, and 300 ml of distilled water were poured into the vessel. After the
vessel was shut tightly and evacuated, it was heated up to setting temperature to
hold for 2 h. During this period, the pressure in the vessel was raised to the vapour
pressure corresponding to the temperature of the water. A part of the vapour was
condensed in a condenser set at the top of the vessel. The condensed water was led
to the Soxhlet-type extractor, mentioned above, to contact the sample glass.
The effluent flowed down to the vessel through the automatic siphon attached to
the extractor to be vaporized again. Thus the leaching tests were performed at an
elevated temperature.
The quantity of cesium and sodium contained in the leachant were determined
by atomic absorption analysis.
2.2. Thermal conductivity measurement in situ
To measure the thermal conductivity of the propylite rock formation in situ,
a cylindrical electric heater and 13 thermocouples were buried 90 m down in an
active mine in the north-east part of Japan.
A nichrom heater covered with a copper cylinder of 1000 mm length and
outer diameter of 47 mm was inserted in a 50 mm borehole and the centre of the
heater was set at 2..5 m from the surface of the face.

IAEA-SM 243/132 27
After setting the heater, the borehole was filled with asbestos and cement.
The eleven Chromel-Alumel thermocouples were also inserted into four
30 mm boreholes to measure the temperature at distances of 0.5 m to 2.0 m from
the centre of the heater. Two more С-A thermocouples were attached to the
heater to measure the heater surface temperature and to check that the heater
temperature did not exceed the maximum permitted temperature of 500°C.
The initial temperature of the wall surface and inside the rock was 14.0°C
and the air temperature in the mine was 20.0°C. The relative humidity was almost
95.5% in the corridor.
The power input of the heater was kept constant at 960 W and the heater
surface temperature was kept at 445°C during the experimental period of 2 months.
The temperature of the rock surface rose to 22.5 ± 0.5°C within a 2 m radius.
2.3. Physical property measurements of core samples
The water content of the rock samples measuring 10 cm X 2 cm X 1.5 cm
was measured by the weight lost after drying at 105°C for 24 h in an oven and
cooling in a desiccator for 24 h.
The specific heat was measured with a differential scanning calorimeter
making comparison with the standard sample of a — AI2O3 after normal drying
for 96 h and cooling of the sample which is used for the water content measurement.
The density measurement was performed as follows: The test sample of
3 cm X 3 cm X 4 cm brick was cut out from the rock sample and dried in an oven.
The sample was alternately weighed in air under air-dried and wet conditions,
and in water. The density was calculated from these results.
Thermal conductivity measurement was performed as follows: Two
10 cm X 20 cm X 5 cm bricks were dried at 105°C in a drier and cooled in a
desiccator. The heater, which also served as a thermocouple, was held between two
bricks. The rate of temperature climb of the heater was measured by the transient-
state heat-flux method and the thermal conductivity of the sample can be
calculated theoretically. The apparatus was calibrated with a standard glass every
day before testing.
3. RESULTS AND DISCUSSION
3.1. Estimation of heat accumulation in the geological formation surrounding
the repository
It is reported that the temperature distribution could be estimated by analysis
for a homogeneous massive rock. However, the actual geological formation is
composed of several rock formations between the ground surface and the repository.

2 8 ARAKI et al.
START
'READ OF FUNDAMENTAL DATA
'CALCULATION OF FIRST ADDRESS OF ARRANGEMENT
XREAD OF PHYSICAL CONSTANTS AND LOCATION
T
STEADY
>/LATTICE POINT,
1 = 1 ,J= 1 ,K = 1
CALCULATION OF HEAT BLANCE AT EACH POINT
CALCULATION OF TIME DEPENDENT BOUNDARY VALUES
CALCULATION OF HEAT GENERATION
PRINTING OUTT ( I J ,K )
LATTICE POINT, 1 = 1 ,J= 1 ,K = 1---------*
CALCULATION OF HEAT BALANCEAT EACH POINT
YES
FIG.2. Flowsheet o f code for computing temperature distributions in geologic formation around high-level waste repository.

IAEA-SM-243/132 29
In order to determine the thermal impact to the environment near the ground
surface and the thermal circumstances of a repository, a preliminary estimation was
attempted for the complex formation by the box-model calculation method. For
the calculation, the formation was divided into 12 m sided or 150 m sided cubic
sections and the heat generation from the box containing HLW was estimated.
The calculation was made only for vertical and horizontal heat transfer between
adjoining cubic sections. A heat balance can be expressed by the finite-step Eq .(l)
M. 2 inKi (Ti(t) - T„(t)} + Qn(t) = CpVn {Tn(t +At) - T„(t)}/At (1)
' where Cp is the specific heat at a constant pressure; At is the time step; Vn the
volume of point n; nKj the heat conductivity between point Ti and point i; Qn the
heat generation at position n. The flowchart for the calculation is given in Fig.2,
taking the heat conductivities for granite, shale and surface soil as 2.22, 1.65 and
1.75 W/m °C, respectively. Specific heat capacities used are 0.224, 0.232 and
0.232 W-h/kg-°C respectively. The decay heat was calculated to be 3000 W for one
canister of 0.3 mф X 3 m size with 20% of HLW by the DCHAIN code, assuming
that the burnup of the fuel was 33 GW-d/Mt fuel and the emplaced time was
30.5 years from the removal from the BWR into the repository. .
To estimate the thermal impact of the decay heat from the emplaced HLW,
the average temperature after 150 years was calculated for a repository in a granite
rock at 500 m depth covered with 150 m of shale and 150 m of surface soil.
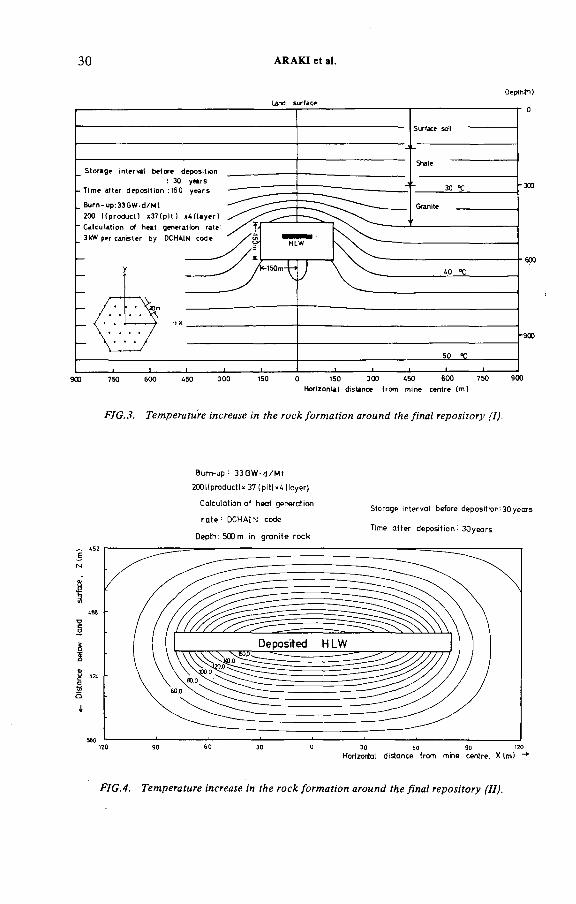
The result is shown in Fig.3 by using 150 m cubic boxes, taking a temperature
increase of 3° for every 100 m depth underground. It is estimated that there will be
little temperature increase after 150 years following disposal 200 m down and the
thermal impact to the surface is estimated to amount to less than 1°C. The temper
ature increase in the neighbourhood of the disposed HLW was calculated using 12 m
cubic boxes and the result is shown in Fig.4. The average temperature is estimated
to be more than 170°C at 30 years after emplacement.
3.2. Thermal conductivity measurement in situ
In order to evaluate the difference between the thermal conductivity between
core samples in a laboratory and that of the rock in situ, the physical properties
were measured and the increase of temperature was also measured in situ at the
position as shown in Fig.5. The increase of temperature was calculated by Eq. (2)
and the calculation was actually performed by a convenient method using a heater
model divided into 20 heat spots for a 1 m heater.
30 ARAKI et al.
Oepthfn)
Land surface
Horizontal distance from mine centre (m)
FJG.3. Temperature increase in the rock formation around the final repository (I).
i1
2ОTJ
Burn-up : 33 G W -d /M t
200l(product)* 37 (p it)*M lcye r)
Calculation of heat generation
ra te : DCH A IN codeStorage interval before deposition: 30 years
90 60 30 60 90 120Horizortal distance from mine centre, X lm)
FIG.4. Temperature increase in the rock formation around the final repository (II).
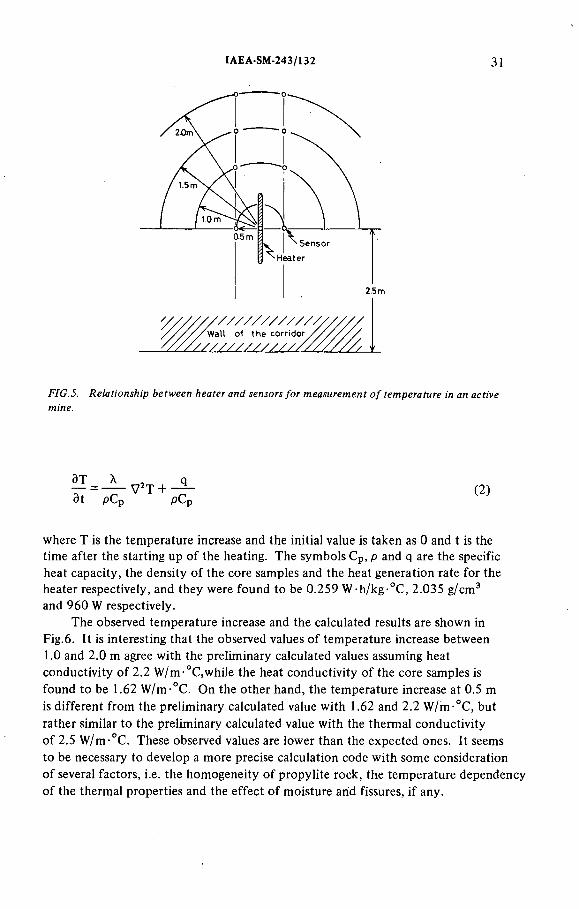
IAEA-SM-243/132 31
' / / / / / / / / / / / / y Wall o< th e co rrid o r
' / / / / / / / / / / / / ,
2.5 m
FIG.5. Relationship between heater and sensors for measurement of temperature in an active mine.
ЭТ X , q— = ------- V 2T + — —dt pCp pCp
(2)
where T is the temperature increase and the initial value is taken as 0 and t is the
time after the starting up of the heating. The symbols Cp, p and q are the specific
heat capacity, the density of the core samples and the heat generation rate for the
heater respectively, and they were found to be 0.259 W-h/kg-°C, 2.035 g/cm3
and 960 W respectively.
The observed temperature increase and the calculated results are shown in
Fig.6 . It is interesting that the observed values of temperature increase between
1.0 and 2.0 m agree with the preliminary calculated values assuming heat
conductivity of 2.2 W/m-°C,while the heat conductivity of the core samples is
found to be 1.62 W/m °C. On the other hand, the temperature increase at 0.5 m
is different from the preliminary calculated value with 1.62 and 2.2 W/nv°C, but
rather similar to the preliminary calculated value with the thermal conductivity
of 2.5 W/m-°C. These observed values are lower than the expected ones. It seems
to be necessary to develop a more precise calculation code with some consideration
of several factors, i.e. the homogeneity of propylite rock, the temperature dependency
of the thermal properties and the effect of moisture arid fissures, if any.
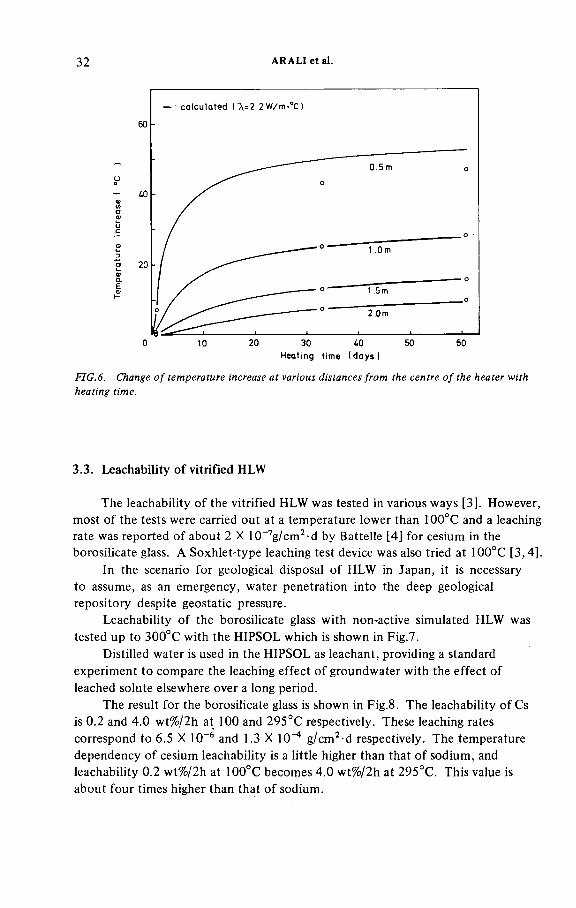
32 ARALI et al.
О 10 20 30 ¿O 50 60Heating time ( days )
FIG.6. Change of temperature increase at various distances from the centre of the heater with heating time.
3.3. Leachability of vitrified HLW
The leachability of the vitrified HLW was tested in various ways [3]. However,
most of the tests were carried out at a temperature lower than 100°C and a leaching
rate was reported of about 2 X 10⁻⁷g/cm2-d by Battelle [4] for cesium in the
borosilicate glass. A Soxhlet-type leaching test device was also tried at 100°C [3,4].
In the scenario for geological disposal of HLW in Japan, it is necessary
to assume, as an emergency, water penetration into the deep geological
repository despite geostatic pressure.
Leachability of the borosilicate glass with non-active simulated HLW was
tested up to 300°C with the HIPSOL which is shown in Fig.7.
Distilled water is used in the HIPSOL as leachant, providing a standard
experiment to compare the leaching effect of groundwater with the effect of
leached solute elsewhere over a long period.
The result for the borosilicate glass is shown in Fig.8 . The leachability of Cs
is 0.2 and 4.0 wt%/2h at 100 and 295°C respectively. These leaching rates
correspond to 6.5 X 10⁻⁶ and 1.3 X 10~* g/cm2-d respectively. The temperature
dependency of cesium leachability is a little higher than that of sodium, and
leachability 0.2 wt%/2h at 100°C becomes 4.0 wt%/2h at 295°C. This value is
about four times higher than that of sodium.

IAEA-SM-243/132 33
FIG. 7. High-pressure Soxhlet-type leachability testing device (HIPSOL).
The reason for this is as yet unclear, however, it is possible that the diffusion-
controlled leaching rate of the cesium-hydrated ion is bigger than that of the
sodium-hydrated ion because the diameter of the sodium-hydrated ion [5-8] is
bigger than that of the cesium-hydrated ion. A further experiment must be done
for other elements in the vitrified waste.
3.4. Preliminary estimation of nuclide migration in a geological formation
In a wet formation, the migration of nuclide must be considered by water
flow through the repository. Zimmerman reported downward movement of soil
moisture traced by means of hydrogen isotopes [9], and Jakubick reported
migration of plutonium in natural soils by a box-model in one direction, downward
[10]. Burkholder [11] tried to estimate nuclide migration by an upward analytical
method in a continental western desert soil. The actual formation in Japan is not
always flat and monotonous but is thought to be composed of several rock types,
for example a granite rock covered with a metamorphic rock and/or sedimentary
rocks.
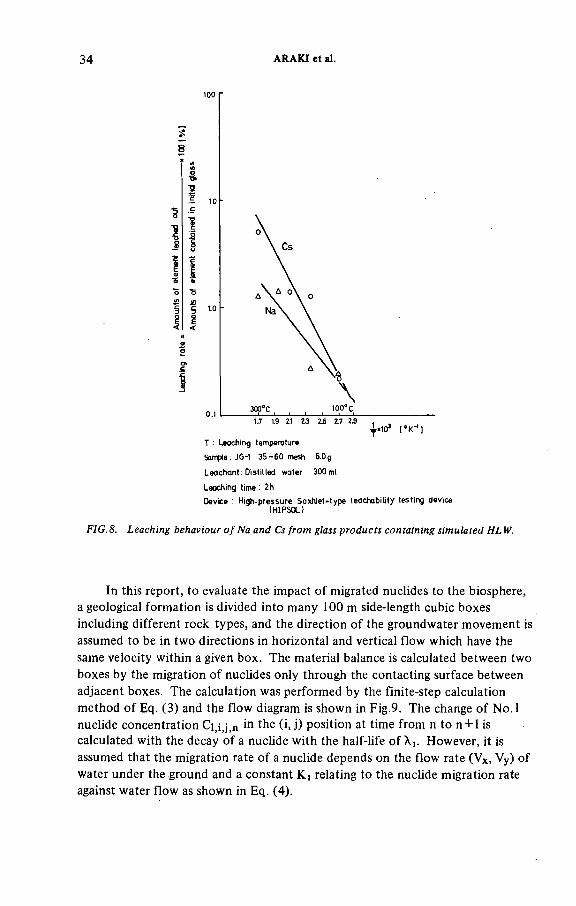
34 ARAKI et al.
Sample: JG-1 35 -60 mesh 6.0g
Leachant: Distilled water 300ml
Leoching time : 2h
Device : High.pressure SoxhleMype teachability testing device IHIPSOL)
FIG. 8. Leaching behaviour of Na and Cs from glass products containing simulated HL W.
In this report, to evaluate the impact of migrated nuclides to the biosphere,
a geological formation is divided into many 100 m side-length cubic boxes
including different rock types, and the direction of the groundwater movement is
assumed to be in two directions in horizontal and vertical flow which have the
same velocity within a given box. The material balance is calculated between two
boxes by the migration of nuclides only through the contacting surface between
adjacent boxes. The calculation was performed by the finite-step calculation
method of Eq. (3) and the flow diagram is shown in Fig.9. The change of No. 1
nuclide concentration Q .y .n in the (i, j) position at time from n to n + 1 is
calculated with the decay of a nuclide with the half-life of X). However, it is
assumed that the migration rate of a nuclide depends on the flow rate (Vx, Vy) of
water under the ground and a constant Ki relating to the nuclide migration rate
against water flow as shown in Eq. (4).
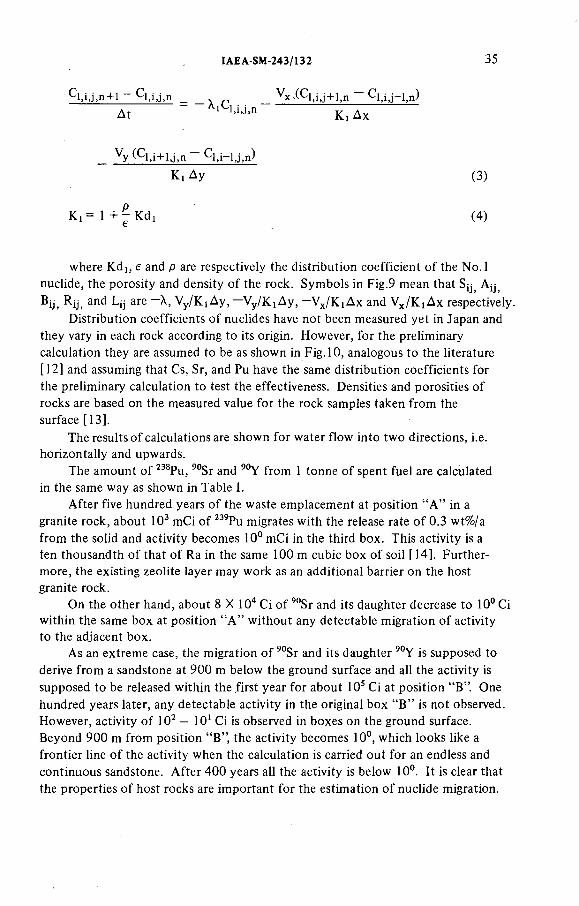
IAEA-SM-243/132 35
C l,i , j ,n + 1 C l ,i , j ,n
At
V x ( C l , i , j + l,n ^ l , i , j - l , n )
Kj Ax
Vy (C l , i+ l , j , n C l,i— l ,j ,n)
Ki Ay (3)
K i= 1 + j Kd (4)
where Kdb e and p are respectively the distribution coefficient of the No.l
nuclide, the porosity and density of the rock. Symbols in Fig.9 mean that Sy Ay
By, R ij; and Ljj are —X, Vy/KiAy, —Vy/K jДу, —Vx/KiAx and Vx/K iAx respectively
Distribution coefficients of nuclides have not been measured yet in Japan and
they vary in each rock according to its origin. However, for the preliminary
calculation they are assumed to be as shown in Fig. 10, analogous to the literature
[12] and assuming that Cs, Sr, and Pu have the same distribution coefficients for
the preliminary calculation to test the effectiveness. Densities and porosities of
rocks are based on the measured value for the rock samples taken from the
surface [13].
The results of calculations are shown for water flow into two directions, i.e.
horizontally and upwards.
The amount of 238Pu, 90Sr and 90Y from 1 tonne of spent fuel are calculated
in the same way as shown in Table I.
After five hundred years of the waste emplacement at position “A” in a
granite rock, about 103 mCi of 239Pu migrates with the release rate of 0.3 wt%/a
from the solid and activity becomes 10° mCi in the third box. This activity is a
ten thousandth of that of Ra in the same 100 m cubic box of soil [ 14]. Further
more, the existing zeolite layer may work as an additional barrier on the host
granite rock.
On the other hand, about 8 X 10⁴ Ci of 90Sr and its daughter decrease to 10° Ci
within the same box at position “A ” without any detectable migration of activity
to the adjacent box.
As an extreme case, the migration of 90Sr and its daughter 90Y is supposed to
derive from a sandstone at 900 m below the ground surface and all the activity is
supposed to be released within the first year for about 10s Ci at position “B”. One
hundred years later, any detectable activity in the original box “B” is not observed.
However, activity of 102 — 101 Ci is observed in boxes on the ground surface.
Beyond 900 m from position “B”, the activity becomes 10°, which looks like a
frontier line of the activity when the calculation is carried out for an endless and
continuous sandstone. After 400 years all the activity is below 10°. It is clear that
the properties of host rocks are important for the estimation of nuclide migration.

36 ARAKI et al.
NO
I YES
PRINTING OF C ( I , J )
-----------_____ NO
I YES
С Ёш Г')
( I - l ,J - 1 )
( I - l ,J )
JAI . J
( I - l ,J +1 )
( I ,J - 1 )
LI , J -
¿ . J► U , J b
( I , J + 1 )
- R I , J
(1+1,J - 1 )
BI , J( I + 1 , J
( i + l ,Л+1)
FIG. 9. Computation algorithm for migration of RI in geological formation.

IAEA-SM-243/132 37
FormationDistribution coefficient ( m l /q )
Flow rate ( m /a I
Density ( g/cm>)
Porosity
Tertiary tu f f (zeolite) 150 20 2 .0 0.2
1 '■1 Tertiary mudstone 3 50 1 .8 0.4
|< *+| Cretaceous gran ite 3 1 2.6 0.01
Sandstone 1 30 2.0 0.5
Land surface
Bedding
Nuclide: Pu-239 (1.6*10! mCi ) Releasing ra te : 0 .3 w t% per year
1 1 ’’Г л 0100 years later1 2 2 2
2 2 2 22 3 3
3/2
\ 23 3 3 À 3 \3 и
// 4 3 3
3 4 4 3 3 2 2 1Ч ч .
У4 с, 4 3 3 2 2 1 0
АЪ) 3 3 3 3 2 2 1 1 0
'n"m eans index of 10" Ci
.ЮООт
2000 m 1500
Nuclide : Sr-90 * Y- 90 ( 0.8»1(ГО )rate: 100wt% pep yearReleosipq
.500
1000 500
FIG. 10. Evaluated results o f geosphere transporting of nuclides from disposed radioactive waste.
4. CONCLUSION
The preliminary safety evaluation of HLW geological isolation was carried out
according to the sequence of events mainly caused by heat accumulation and
penetration of water into the geological formation of a repository. Further
investigation is necessary to develop estimation codes for the total safety evaluation
system of HLW management.
ACKNOWLEDGEMENTS
The authors would like to express their hearty thanks to Dr. N. Amano and
Dr. S. Suguri for their helpful discussions. They also would like to thank
Dr. M. Seno, Mr. K. Shimooka and other co-workers for their help in experiments.

REFERENCES
[1] POLVANI, C., et al., “Objectives, concepts and strategies for the management of radioactive
waste arising from nuclear power programmes”, Report by a Group of Experts of the OECD
Nuclear Energy Agency, OECD/NEA, Paris (1977) 153.
[2] TASAKA, K., DCHAIN: Code for Analysis of Build-up and Decay of Nuclides, Japan
Atomic Energy Research Institute Rep. JAER I 1250 (1976).
[3] INTERNATIONAL ATOMIC ENERGY AGENCY, Characteristics of Solidified High-Level
Waste Products, Tech. Rep. Ser. No. 187, IAEA, Vienna (1979).
[4] MENDEL, J.E., et al., Annual Report on the Characteristics of High-Level Waste Glasses,
Batelle Rep. BNWL - 2252 (1977).
[5] Editorial Board of Clay Handbook, “Characteristics of clay”, Clay Handbook, Gihodo Rep.
Tokyo (1967) 99.
[6] JENNY, H., J. Phys. Chem. 36 (1935) 2217.
[7] PALLMAN, H., Bodenk. und Forsch. 6 (1938) 21.
[8] W IKLANDER, L., Chemistry of the Soil (BEAR, F.E., Ed.),Waverly Press (1955) 122.
[9] ZIMMERMAN, U., et al., “Downward movement of soil moisture traced by means of
hydrogen isotopes”, Geophysical Monograph No 11, Isotope Techniques in the Hydrologie
Cycle (STOUT, G.E., Ed.), American Geophysical Union, Washington (1967) 29.
[10] JAKUBICK, A.T., “Migration of plutonium in natural soils”, Transuranium Nuclides in the
Environment (Proc. Symp. San Francisco, 1975), IAEA, Vienna (1976) 47.
[11] BURKHOLDER, H.C., et al., Incentives for Partitioning High-level Waste, Battelle-Northwest
Rep. BNWL-1927 (1975) B .l.
[12] ISHERWOOD, D., Preliminary Report on Retardation Factors and Radio-nuclide Migration,
Lawrence Livermore Lab. Rep. UCID 17551 (1977).
[13] KAMATA, H., Parameters for migration of nuclides in soil, Genshiryoku-Gakkaishi 99
(1977) 3 (in Japanese).
[14] GERA, F., Geochemical Behavior of Long-lived Radioactive Wastes, Oak Ridge Natl Lab.
Rep. ORNL-TM-4481 (1975) 39.
38 ARAKI et al.
DISCUSSION
G.E. COURTOIS: Have you really measured the leach rate at a pressure of
80 kg/cm2?
K. ARAKI: Yes, I have measured the Ieachability in an autoclave with a
refluxing cooler at 295°C, and the pressure increases to 80 kg/cm2.
F.L.H. LAUDE: Did you observe any influence of temperature and pressure
on the leach rates?
K. ARAKI: The influence of temperature on leachability is shown in Fig. 8 ;
the leach rate increases as the temperature rises from 100°C to 295°C, and this
also raises the pressure to 80 kg/cm2.
The effect of the pressure increase at constant temperature has not yet been
tested, but I intend to measure this, too.
IAEA-SM-243/132 39
G. ROCHLIN: May we infer from your high-pressure tests, corresponding to
conditions at great depths, that you have identified a tentative site? Or are these
data acquired solely for determining leach rate parameters?
K. ARAKI: These values do not simulate any actual repository conditions.
I chose the pressure of 80 kg/cm2 for my testing device in order to have test
conditions corresponding to a temperature of 300°C. These are the temperature
and the pressure that will be produced by the decay heat with the penetration of
water under tectonic pressure. Recently, I have installed a new testing device for
800°C and 1000 kg/cm2, corresponding to the tectonic pressure at 2000 m below
ground level.


IAEA-SM-243/2
INVESTIGATIONS ENTREPRISESPOUR PRECISER LES CARACTERISTIQUESDU SITE ARGILEUX DE MOLCOMME LIEU DE REJET SOUTERRAIN POURLES DECHETS RADIOACTIFS SOLIDIFIES*
A. BONNE, R. HEREMANS,
P. MANFROY, P. DEJONGHE
Centre d’étude de l’énergie nucléaire,
Studiecentrum voor Kemenergie,
Mol, Belgique
Abstract-Résumé
STUDIES UNDERTAKEN TO DETERMINE THE SUITABILITY OF THE MOL CLAY
SITE FOR THE UNDERGROUND DISPOSAL OF SOLIDIFIED RADIOACTIVE WASTE.
As part of its research and development programme on the possible burial of solidified
radioactive waste in a clay formation (Boom clay) the Nuclear Research Centre at Mol is
conducting studies aimed at determining the characteristics of the potential site at Mol more
precisely. The studies involve field measurements, laboratory tests and experiments on
samples, and mathematical simulations. Geological (drilling), geophysical (seismic campaign)
and hydrological investigations (installation of piezometers and periodic measurements of
groundwater) have confirmed the geological and hydrological structure of the Mol site.
A number of internal parameters of the Boom clay have been determined from samples taken
at different levels during drilling, namely, the chemical and mineralogical composition, t.he
ion exchange potential, physical properties in general and geomechanical characteristics
in particular. Various mathematical models have been constructed to help assess the magnitude
of certain technical and safety problems. The migration of ions through a sorbant medium
has been evaluated in this way, taking into account the numerical values obtained in the field
or in the laboratory. The various factors studied, the methods of data acquisition and the
results obtained are reviewed in the paper.
INVESTIGATIONS ENTREPRISES POUR PRECISER LES CARACTERISTIQUES DU SITE
ARG ILEUX DE MOL COMME LIEU DE REJET SOUTERRAIN POUR LES DECHETS
RADIOACTIFS SOLIDIFIES.
Une partie du programme de recherche et de développement du Centre d’étude de
l’énergie nucléaire sur les possibilités d ’enfouissement de déchets radioactifs solidifiés dans
une formation argileuse (argile de Boom) concerne des recherches qui doivent permettre de
mieux caractériser le site potentiel de Mol. Ces recherches se rapportent à des mesures sur
le terrain, à des essais et expériences de laboratoire sur des échantillons, et à des modélisations
mathématiques. Des investigations géologiques (sondages), géophysiques (campagne sismique)
* Travaux réalisés dans le cadre d’un contrat avec la Commission des Communautés
européennes.
41
42 BONNE et al.
et hydrologiques (installation de piézomètres et mesures périodiques des nappes aquifères)
ont confirmé la structure géologique et hydrologique du site de Mol. Nombre de paramètres
intrinsèques de l’argile de Boom ont été déterminés sur des échantillons prélevés à différents
niveaux lors des sondages; il s’agit notamment de la composition chimique et minéralogique,
du pouvoir d’échange ionique, des propriétés physiques générales et géomécaniques en
particulier. Divers modèles mathématiques ont été développés en vue de mieux apprécier
l’importance de certains problèmes techniques et de sécurité. La migration d’ions à travers
un milieu sorbant a été évaluée de cette façon en tenant compte des valeurs numériques obtenues
sur le terrain ou en laboratoire. Les divers facteurs étudiés, le mode d’acquisition des données
et les résultats sont passés en revue dans le mémoire.
INTRODUCTION
Une étude exclusivement bibliographique, exécutée par le CEN/SCK en
collaboration étroite avec le Service géologique de Belgique, a constitué un
inventaire des formations géologiques connues dans le sous-sol du territoire belge,
qui seraient susceptibles de convenir comme roche hôte pour l’enfouissement
de déchets radioactifs insolubilisés. Cette recherche a mis en évidence que parmi
les milieux géologiques continentaux, mondialement reconnus comme acceptables
dans ce but, seules les formations pélitiques méritent pour la Belgique une
attention plus approfondie, les autres formations n’étant pas connues, ou de par
leur nature sans intérêt.
Parmi les roches pélitiques, une formation argileuse d’âge oligocène (dite
argile de Boom) s’est avérée attrayante tant pour ses facteurs géométriques que
pour son homogénéité. Cette couche stratiforme se rencontre dans le sous-sol du
nord-est de la Belgique, où se situent aussi les installations nucléaires de Mol.
L’analyse des données en provenance des recherches géologiques antérieures
effectuées dans la région a porté à croire qu’aux environs de Mol l’argile de Boom
satisferait aux critères de sélection imposés à savoir:
— critères géométriques: épaisseur de la couche et profondeur du toit égales
ou supérieures à 100 mètres;
— critères lithologiques: homogénéité de la formation et absence de passages
perméables importants;
— critères de stabilité: aséismicité de la région et absence d’activités minières
profondes.
Sur cette base le CEN/SCK a mis au point et entrepris, en collaboration
étroite avec des instituts nationaux et internationaux, un programme de recherche
et de développement, en vue d’évaluer la possibilité d’un rejet définitif de certains
déchets radioactifs dans la formation argileuse de Boom aux environs de Mol.
Ce vaste programme se développe suivant trois axes principaux:
IAEA-SM-243/2 43
a) Etude de l’acceptabilité de l ’argile plastique comme formation hôte pour
l’enfouissement de déchets radioactifs: il s’agit surtout de l’étude de l’interaction
entre les déchets et le milieu géologique (analyse d’impact), et de l’analyse de
sécurité tant du point de vue déterministe que du point de vue probabiliste.
b) Conception d ’une installation pour l’enfouissement de déchets radio
actifs dans une formation argileuse. Des coauteurs du présent document exposent
par ailleurs les résultats d’une première étude (IAEA-SM-243/3).
c) Confirmation du site potentiel de Mol: les investigations pour la
confirmation du site de Mol ont pour but d’examiner si la formation sélectionnée,
à cet endroit, présente les qualités attendues pour garantir un confinement à très
long terme et une possibilité d’excavation.
1. RECONNAISSANCE DE LA GEOMETRIE SPATIALE DE LA FORMATION
Dans les décennies passées des dizaines de forages profonds ont été réalisés
poiir l’exploration des couches de houille du socle paléozoïque dans le nord-est
de la Belgique. Ces sondages ont aussi permis au Service géologique de Belgique
de mettre au point une esquisse géologique relativement détaillée des terrains
céno et mésozoïques dans cette région. Les terrains de couverture y présentent
une structure d’alternances de couches gréseuses et argileuses, donc perméables et
imperméables, aquifères et aquicludes. Des cartes d’isohypses et d’isopaques ont
été tracées pour l’argile; celles-ci laissaient présumer que l’argile de Boom à Mol
se présenterait à une profondeur d’environ 150 mètres et jusqu’à 250 mètres.
Un sondage par carottage sur le site du CEN/SCK à Mol, profond de
570 mètres, une diagraphie subséquente et un échantillonnage des différentes
formations ont permis une description détaillée de la séquence géologique du site.
La colonne stratigraphique est représentée sur la figure 1. Elle met en évidence la
structure entrelardée des formations perméables et imperméables, typique pour
la région du pays. L’argile de Boom y est rencontrée entre —160 et —270 mètres.
Elle est compacte et homogène. Toutefois, au niveau — 237 mètres, une straticule
de sable a été mentionnée dans la description du sondage géologique. D’autres
sondages ont été effectués à proximité immédiate du premier sur le site du
CEN/SCK. Ceux-ci ont atteint les nappes aquifères les plus importantes afin
d’y installer des piézomètres (voir infra).
Tous ces sondages, qui se situent dans un cercle de 50 m de diamètre, ne
fournissent qu’une observation ponctuelle. Pour définir plus précisément la
géométrie spatiale on a procédé à la recherche de structures de discontinuité par
une étude d’imagerie spatiale et par une reconnaissance de sismique-réflexion de
haute résolution.
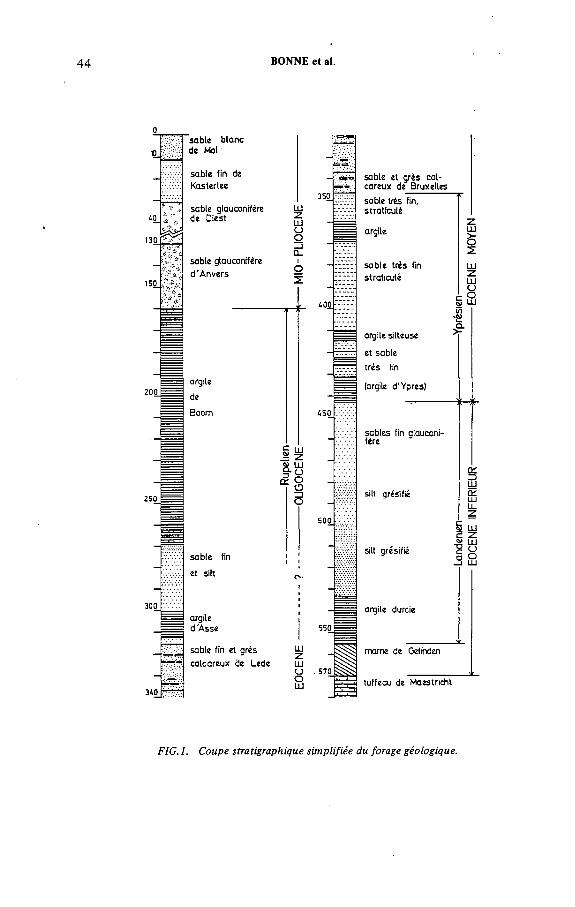
BONNE et al.
sable et grès cal- careux de Bruxellessable très fin, stratlculé
argile
sable très fin straticulé
argile silteuse
et sable très fin
(argile d'Ypres)
sables fin glauconi- fère
silt grèsifié
silt grésifié
argile durcie
marne de Gelinden
tuffeau de Maestricht
FIG.l. Coupe stratigraphique simplifiée du forage géologique.
Land
enie
n----
------
------
------
------
------
-> e--
------
------
-----Y
prés
ien-
---EO
CENE
IN
FER
IEU
R---
------
«-E
OCEN
E M
OYE
N
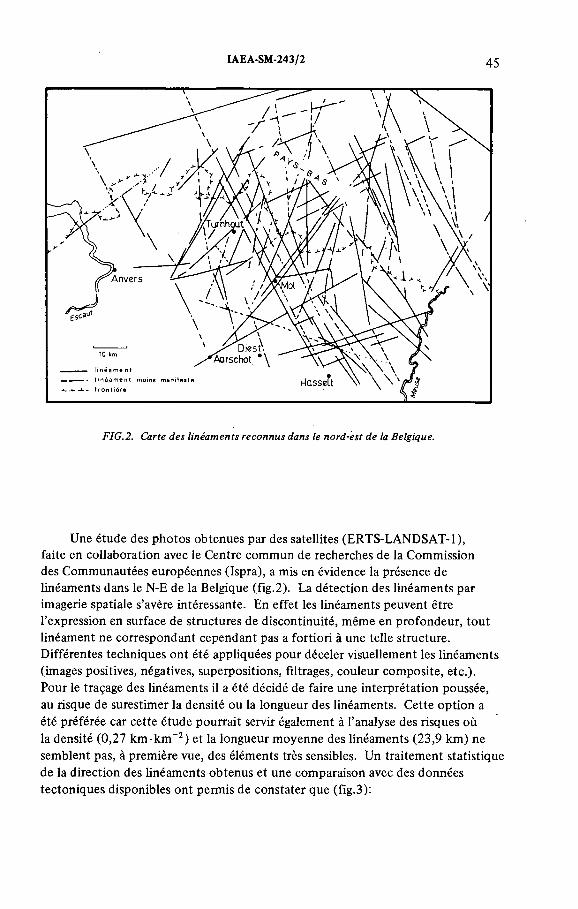
IAEA-SM-243/2 45
FIG.2. Carte des linéaments reconnus dans le nord-est de la Belgique.
Une étude des photos obtenues par des satellites (ERTS-LANDSAT-1),
faite en collaboration avec le Centre commun de recherches de la Commission
des Communautées européennes (Ispra), a mis en évidence la présence de
linéaments dans le N-E de la Belgique (fig.2). La détection des linéaments par
imagerie spatiale s’avère intéressante. En effet les linéaments peuvent être
l’expression en surface de structures de discontinuité, même en profondeur, tout
linéament ne correspondant cependant pas a fortiori à une telle structure.
Différentes techniques ont été appliquées pour déceler visuellement les linéaments
(images positives, négatives, superpositions, filtrages, couleur composite, etc.).
Pour le traçage des linéaments il a été décidé de faire une interprétation poussée,
au risque de surestimer la densité ou la longueur des linéaments. Cette option a
été préférée car cette étude pourrait servir également à l’analyse des risques où
la densité (0,27 km -km"2) et la longueur moyenne des linéaments (23,9 km) ne
semblent pas, à première vue, des éléments très sensibles. Un traitement statistique
de la direction des linéaments obtenus et une comparaison avec des données
tectoniques disponibles ont permis de constater que (fig.3):

46 BONNE et al.
NО
2 0 \ i i 20
Linéaments Inombre 12в.)
N
N0
F a i l l e s à la b a s e du C ré ta c i ¡ n o m b r e 6 3 )
FIG.3. Diagrammes fréquentiels de direction des linéaments et des failles pour le nord-est de la Belgique.
— une des directions prépondérantes (NNW) des linéaments correspond à la
direction prépondérante des failles reconnues à la base du Tertiaire et à une
direction importante des failles reconnues à la base du Crétacé;
— les deux autres directions importantes (NNE et ENE) des linéaments ne se
retrouvent pas parmi les directions importantes des failles.

IAEA-SM-243/2 47
Sur le site potentiel même deux linéaments nets et un linéament vague ont
été identifiés. Cette constatation a comme conséquence la nécessité de vérifier
si les linéaments détectés correspondaient à des structures de discontinuité (failles)
ou non. Une reconnaissance géophysique de surface (prospection sismique par
réflexion à faible profondeur et de haute résolution) a été entreprise. En plus
du but déjà mentionné ci-avant cette campagne, du type dit en nappe ou
tridimensionnel, devait permettre de:
— déterminer de façon précise les dimensions dans l’espace de la couche d’argile
de Boom, ainsi que les variations de ces dimensions;
— s’informer sur toute structure (tectonique, sédimentaire, etc.) tant au sommet
du socle paléozoïque que dans les terrains méso et cénozoïques de couverture.
Pour atteindre ces buts il a été procédé à une prospection fine par nappe et
par quelques lignes sismiques additionnelles orientées de manière à recouper les
linéaments trouvés (fig.4).
La surface à prospecter a été couverte par quatre nappes contiguës de
180 mètres de large et de =2,5 kilomètres de long.
Les paramètres choisis pour l’acquisition des données (pas d’échantillonnage
de 1 milliseconde, temps d’enregistrement de deux secondes et couverture d’ordre
cinq) sont tels que l’on peut escompter une résolution verticale du toit et du mur
de l’argile de l’ordre de deux à trois mètres et obtenir des informations
significatives sur les terrains sous-jacents. Les résultats, provisoires encore,
semblent confirmer que le toit et la base de l’argile de Boom sont intacts, continus
et équidistants. Dans la zone occidentale de l’aire prospectée l’argile semble
plutôt horizontale tandis que dans la zone orientale un léger pendage est
observable ( I o NE). Une discordance entre les terrains de couverture et le
socle, plissé et (probablement) faillé, est bien nette. Au moment de la rédaction
de cet article plusieurs essais sur le traitement des données obtenues (migration,
etc.) sont encoré en cours en vue d’optimiser les résultats de la campagne.
2. RECONNAISSANCES HYDROGEOLOGIQUES
La structure géologique profonde des terrains à Mol, constituée d’alternances
de formations subhorizontales perméables et imperméables, permet de prédire
les unités hydrologiques suivantes:
— sables de Mol et Kasterlee: nappe phréatique;
- nappe semi-phréatique des sables de Diest, de Berchem et de Dessel (Anversien),
séparée de la précédente par un lit argileux;
— argile de Boom: aquiclude;
- sables de Berg: nappe captive du Rupélien inférieur;

48 BONNE et al.
FIG
.4.
Loca
lisat
ion
des
puits
pié
zom
étriq
ues
et de
s lig
nes
et ba
ndes
de
pros
pect
ion
sism
ique
.
IAEA-SM-243/2 49
— argile d’Asse: aquiclude;
— sables de Lede, de Bruxelles et de la formation d’Ypres: nappe captive;
— argile d’Ypres: aquiclude;
— sables du Landenien: nappe captive;
— argile du Landenien et marnes du Heersien: aquiclude;
— craie du Mæstrichtien: nappe captive.
Afin de vérifier si toutes les couches aquifères constituent effectivement
des unités hydrologiques individuelles, des piézomètres ont été introduits dans
ces aquifères sur le site de Mol. La position de ces puits d’observation est
représentée sur la figure 4.
Depuis 1976 le niveau piézométrique de ces puits et de puits existants est
mesuré périodiquement. Pour le premier semestre de 1978 les niveaux moyens
(par rapport au niveau de la mer du Nord à Ostende) étaient les suivants:
— nappe phréatique: +23,35 m;
— nappe du Diestien-Anversien: +22,53 m;
— nappe du Rupélien inférieur (Berg): +21,63 m;
— nappe du Lédien, Bruxellien et Yprésien: +20,65 m;
— nappe du Landenien: 30,95 m;
— nappe du Mæstrichtien: + 18,97 m.
Chaque couche aquifère a donc bien une pression hydrostatique propre et
les données ci-dessus démontrent aussi qu’il existe un gradient hydraulique à
travers l’argile de Boom, du haut vers le bas, de l’ordre de 0,01 m-m-1. Ceci
indique, actuellement, une drainance dans l’argile vers le bas.
La mesure périodique des niveaux piézométriques au site de Mol a permis
également de constater que les unités hydrologiques sous-jacentes à l’argile de
Boom présentent une réponse aux variations de la pression atmosphérique.
L’effet barométrique pour ces puits est: Rupélien inférieur: 32%; sables de
Lede, de Bruxelles et d’Ypres: 31%; Landenien: 34% (? ); Mæstrichtien: 62%.
Les observations faites par le Service géologique de Belgique font apparaître
que, du fait de la présence d’intercalations de lits ou lentilles aquitardes (passages
argileux) à l’intérieur de l’unité hydrologique sus-jacente à l’argile de Boom, cette
dernière peut présenter une plus grande complexité que celle que nous avons
décrite ci-avant. Un programme de reconnaissance hydrologique locale et régionale
plus détaillé est en préparation. Le but de ce programme sera de caractériser en
détail la nappe phréatique et la nappe semi-phréatique (directions et vitesses des
écoulements à différentes niveaux, influence du système oro et hydrographique,
etc.).
Un essai de pompage dans la nappe des sables de Berg (Rupélien inférieur)
a donné les paramètres hydrauliques suivants: k (perméabilité): 4,2 • 10-7 m • s-1 et S (coefficient d’emmagasinement); 4,3 -10-4 (méthode de Jacob). Pour
l’unité hydrologique au-dessus de l’argile de Boom ces paramètres varient de
1,1 • 10~4 m - s-1 à 1,4 10-6 m - s-1 pour k et de 3-10-3 à 4,9-10-6 pour S.

50 BONNE et al.
TABLEAU I. POURCENTAGE MOYEN DES COMPOSES
IMPORTANTS DETERMINES SUR L’ARGILE DE
BOOM A MOL
Echantillons prélevés entre 190 et 230 m séchés à 110°C
Si02 59,43 H20 + 7,82
A120 3 16,94 S 0 3 2,62
Fe20 3 5,82 p2o5 0,07
Ti02 0,87 C 1,32
CaO 1,58
MgO 1,69
K20 2,80 H20 ” (humidité] 22,45%
Na20 0,53
3. DETERMINATION DE PROPRIETES ET PARAMETRES INTRINSEQUES
DE L’ARGILE DE BOOM A MOL
L’argile de Boom doit posséder au droit du site en question plusieurs
qualités, tant pour son éligibilité comme barrière à la migration que pour son
aptitude a être excavée. L’homogénéité lithologique, la capacité d’échange
ionique, les propriétés géomécaniques et physiques de la roche sont autant de
propriétés qui doivent être connues avec précision.
3.1. Homogénéité lithologique
L’homogénéité de l’argile de Boom a pu être évaluée grâce aux analyses
minéralogiques et chimiques et aux déterminations granulométriques effectuées
sur des échantillons prélevés lors du sondage de reconnaissance sur le site même.
Ces échantillons sont conservés en emballage plastique dans une cave à atmosphère
saturée en eau. Par l’analyse minéralogique on a cherché à:
— déterminer l’homogénéité minéralogique au niveau des associations de minéraux
argileux;
— déterminer la nature des constituants argileux pour les fractions granulométriques
de dimensions inférieures à 20 дт, 5 дт, 2 дт et 1 дт;
— estimer quantitativement les constituants présents dans chaque fraction
granulométrique;,
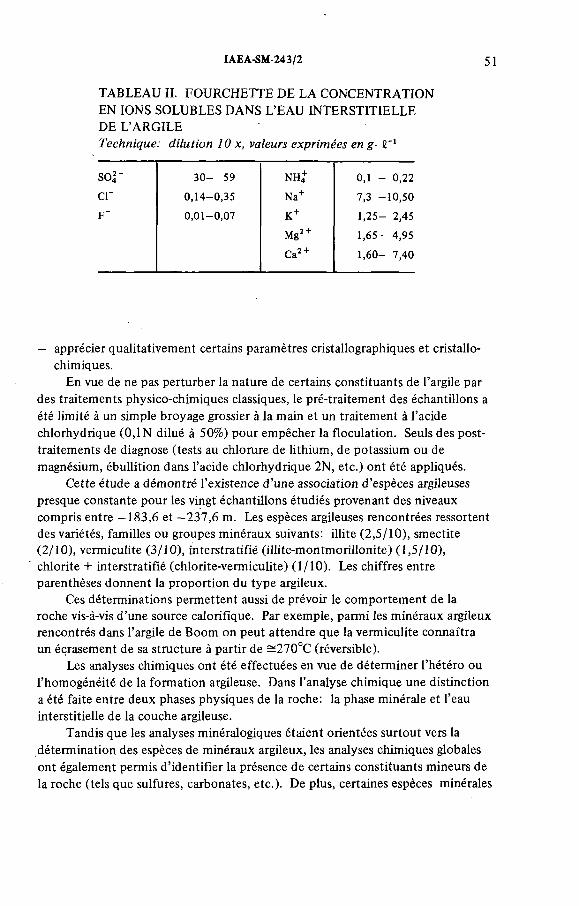
IAEA-SM-243/2 51
TABLEAU II. FOURCHETTE DE LA CONCENTRATION
EN IONS SOLUBLES DANS L’EAU INTERSTITIELLE
DE L’ARGILE
Technique: dilution 10 x, valeurs exprimées en g■
s o r 30— 59 NHÍ 0,1 - 0,22
СГ 0,14-0,35 Na+ 7,3 -10,50
F" 0,01-0,07 K+ 1,25- 2,45
Mg2 + 1,65- 4,95
Ca2 + 1,60- 7,40
— apprécier qualitativement certains paramètres cristallographiques et cristallo-
chimiques.
En vue de ne pas perturber la nature de certains constituants de l’argile par
des traitements physico-chimiques classiques, le pré-traitement des échantillons a
été limité à un simple broyage grossier à la main et un traitement à l’acide
chlorhydrique (0,1 N dilué à 50%) pour empêcher la floculation. Seuls des post
traitements de diagnose (tests au chlorure de lithium, de potassium ou de
magnésium, ébullition dans l’acide chlorhydrique 2N, etc.) ont été appliqués.
Cette étude a démontré l’existence d’une association d’espèces argileuses
presque constante pour les vingt échantillons étudiés provenant des niveaux
compris entre —183,6 et —237,6 m. Les espèces argileuses rencontrées ressortent
des variétés, familles ou groupes minéraux suivants: illite (2,5/10), smectite
(2/10), vermiculite (3/10), interstratifié (illite-montmorülonite) (1,5/10),
chlorite + interstratifié (chlorite-vermiculite) (1/10). Les chiffres entre
parenthèses donnent la proportion du type argileux.
Ces déterminations permettent aussi de prévoir le comportement de la
roche vis-à-vis d’une source calorifique. Par exemple, parmi les minéraux argileux
rencontrés dans l’argile de Boom on peut attendre que la vermiculite connaîtra
un écrasement de sa structure à partir de =270°C (réversible).
Les analyses chimiques ont été effectuées en vue de déterminer l’hétéro ou
l’homogénéité de la formation argileuse. Dans l’analyse chimique une distinction
a été faite entre deux phases physiques de la roche: la phase minérale et l’eau
interstitielle de la couche argileuse.
Tandis que les analyses minéralogiques étaient orientées surtout vers la
détermination des espèces de minéraux argileux, les analyses chimiques globales
ont également permis d’identifier la présence de certains constituants mineurs de
la roche (tels que sulfures, carbonates, etc.). De plus, certaines espèces minérales
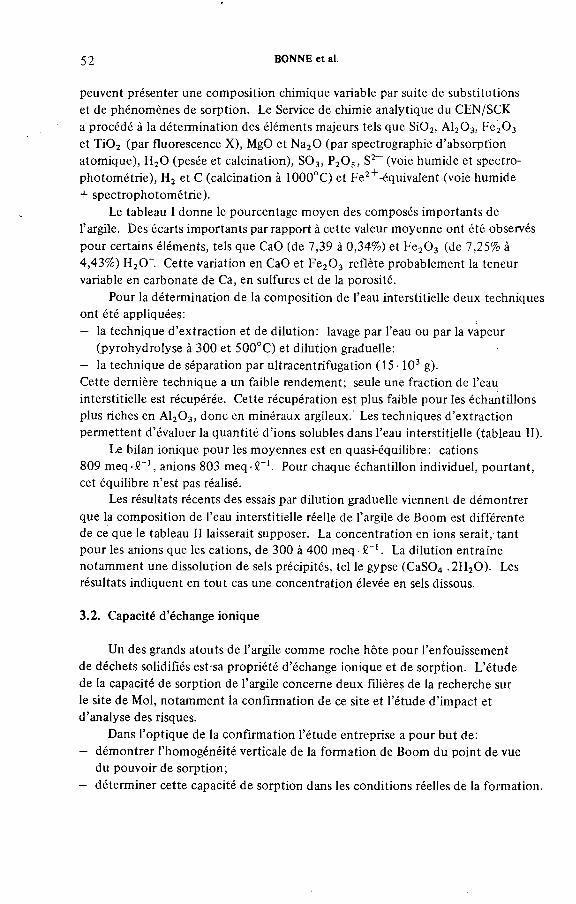
52 BONNE et al.
peuvent présenter une composition chimique variable par suite de substitutions
et de phénomènes de sorption. Le Service de chimie analytique du CEN/SCK
a procédé à la détermination des éléments majeurs tels que Si02, A120 3, Fe20 3 et Ti02 (par fluorescence X), MgO et Na20 (par spectrographie d’absorption
atomique), H20 (pesée et calcination), S03, P20 5, S2-(voie humide et spectro-
photométrie), H2 et C (calcination à 1000°C) et Fe2+-équivalent (voie humide
+ spectrophotométrie).
Le tableau I donne le pourcentage moyen des composés importants de
l’argile. Des écarts importants par rapport à cette valeur moyenne ont été observés
pour certains éléments, tels que CaO (de 7,39 à 0,34%) et Fe20 3 (de 7,25% à
4,43%) Н2СГ. Cette variation en CaO et Fe20 3 reflète probablement la teneur
variable en carbonate de Ca, en sulfures et de la porosité.
Pour la détermination de la composition de l’eau interstitielle deux techniques
ont été appliquées:
— la technique d’extraction et de dilution: lavage par l’eau ou par la vapeur
(pyrohydrolyse à 300 et 500°C) et dilution graduelle;
- la technique de séparation par ultracentrifugation (15-103 g).
Cette dernière technique a un faible rendement; seule une fraction de l’eau
interstitielle est récupérée. Cette récupération est plus faible pour les échantillons
plus riches en A120 3, donc en minéraux argileux. Les techniques d’extraction
permettent d’évaluer la quantité d’ions solubles dans l’eau interstitielle (tableau II).
Le bilan ionique pour les moyennes est en quasi-équilibre: cations
809 meq-£_1, anions 803 meq-2-1. Pour chaque échantillon individuel, pourtant,
cet équilibre n’est pas réalisé.
Les résultats récents des essais par dilution graduelle viennent de démontrer
que la composition de l’eau interstitielle réelle de l’argile de Boom est différente
de ce que le tableau II laisserait supposer. La concentration en ions serait, tant
pour les anions que les cations, de 300 à 400 meq ■ ST1. La dilution entraîne
notamment une dissolution de sels précipités, tel le gypse (CaS04 .2H20). Les
résultats indiquent en tout cas une concentration élevée en sels dissous.
3.2. Capacité d’échange ionique
Un des grands atouts de l’argile comme roche hôte pour l’enfouissement
de déchets solidifiés est sa propriété d’échange ionique et de sorption. L’étude
de la capacité de sorption de l’argile concerne deux filières de la recherche sur
le site de Mol, notamment la confirmation de ce site et l’étude d’impact et
d’analyse des risques.
Dans l’optique de la confirmation l’étude entreprise a pour but de:
- démontrer l’homogénéité verticale de la formation de Boom du point de vue
du pouvoir de sorption;
— déterminer cette capacité de sorption dans les conditions réelles de la formation.
IAEA-SM-243/2 53
La technique appliquée pour la détermination du pouvoir d’échange ionique
est la technique de mise en équilibre entre l’argile et une solution de traceurs.
Les expériences peuvent se faire soit en statique (batch), soit en dynamique (sur
colonne). Elles permettent de calculer le paramètre KD (coefficient de distribu
tion), qui donne une mesure de la fraction de l’élément sorbée sur l’argile. La
capacité d’échange cationique de l’argile de Boom est de l’ordre de 0,2 meq-g' 1 ; néanmoins certaines techniques, par exemple celles utilisant des cations comme
la thio-urée d’Ag, indiquent des capacités d’échange cationique s’élevant jusqu’à
~0,35 meq-g-1.
Dans une première phase de reconnaissance l’eau de la nappe du Diestien-
Anversien a été employée comme solution mère pour les déterminations de KD.
Cette eau représente, du point de vue de l’étude des risques, une eau potentielle
d’inondation des installations souterraines. Les valeurs de KD pour cette solution
et pour des concentrations de Cs, Sr, Eu, Pu et I comprises entre 0,1 (0,02 pour
Pu) et 1000 mg-C' 1 sont les suivantes: Cs: max. 6657; Sr: max. 1061;
Eu: max. 13 809; Pu: max. 59 000; I: max. 5. Ces valeurs concernent l’argile
non traitée saiif un séchage à 110°C et une solution à pH initial de ~8,3 (exception:
î à pH initial de 3).
Quant à la variation de cette propriété à travers toute l’épaisseur de la couche,
les expériences ont démontré une capacité de sorption plus élevée au milieu de la
couche (dans la zone moyenne de 230 m) que vers le toit et le mur. Pour le Sr
et le Cs, le KD peut être un ordre de grandeur moins élevé aux limites de la couche.
Comme les analyses de l’eau interstitielle de l’argile ont démontré une activité
chimique élevée de la solution, la capacité de sorption de l’argile doit être évaluée
pour ces conditions réelles, c’est-à-dire pour l’argile en contact avec son eau
interstitielle.
Des expériences ont notamment été menées en travaillant avec des rapports
argile/solution variant entre 1 g/50 ml et 1 g/2 ml. Il a été possible ainsi de
constater que les valeurs de KD obtenues dans le milieu leau interstitielle» sont
inférieures à celles obtenues dans le milieu «eau Diestien-Anversien». Les travaux
se poursuivent actuellement dans cette voie et les premiers résultats obtenus
démontrent toute l’importance qu’il y a à bien connaître les conditions physico
chimiques régnant in situ.
3.3. Propriétés géomécaniques et physiques
L’étude des techniques à appliquer pour le creusement de cavités souterraines
dans l’argile nécessite la détermination préalable de certains paramètres
géomécaniques. Dans ce but un forage géotechnique jusqu’à 270 m de profondeur
a été fait et 62 échantillons peu perturbés ont été prélevés dans l’argile. Plusieurs
essais ont été faits sur ces échantillons au Rijksinstituut voor Grondmechanica
à Gand (Belgique). Des essais triaxiaux consolidés non drainés ont permis de

TABLEAU III. PROPRIETES PHYSIQUES DE L’ARGILE DE BOOM A MOL
54 BONNE et al.
Composition granulométrique (tamisage suivant normes ASTM, méthode de Casagrande-Bouyoucos)
d < 2 iim : 49%2 д т < d < 60 цт : 47%60 цт < d < 200 pm : 3,5% d > 200 цт : 0,5%
Poids volumétrique 1,93 g-crn"3
Conductivité thermique (moyenne de 5 échantillons)
à 100°C: 0,37 W m '1 0 C '' à 300°C: 0,56 W m”1 ■°C’ 1
Chaleur spécifique à 25 °C: 0,26 W h kg’ 1 • °C~' à 275°C: 0,41 W-h k g '1 • °C_1
Limite de plasticité Limite de liquidité Indice de plasticité
33,1% r limites d’Atterberg: 82,1% moyenne de 40 échantil- 49 Ions d’après les normes
allemandes D1N 18122
Coefficient de perméabilité de 4,7 • 10~10 cm s’ 1 à 1,4-10-8 cm ■ s_I
Porosité de 34,6% à 44%
Degré de saturation 88,4 à 100%
Module d’élasticité de 1000 à 3500 kg-cm"2
chiffrer des paramètres pour la résistance au cisaillement: cohésion apparente
c' = 0 ,15 kg cm -2 et angle de frottem ent ф = 2 2 ° . Ces valeurs sont en concordance avec celles obtenues lors des essais de reconnaissance dans l’argile de Boom dans
la région anversoise.
Les résultats des essais triaxiaux non consolidés et non drainés sont assez
dispersés (Cu entre 3 et 7 kg-cm"2) et de ce fait une confirmation complémentaire
des résultats est nécessaire.
Un grand nombre de propriétés physiques ont également été déterminées
sur des échantillons (non perturbés et perturbés). Elles sont données dans le
tableau III.
4. MODELISATION
Divers modèles mathématiques ont été mis au point et appliqués pour les
conditions régnant sur le site potentiel de Mol. Le développement de ces
modèles s’est effectué dans l’optique de l’analyse de risque, de l’étude de
l’impact, ou dans le cadre de l’étude de faisabilité. Ces exercices ont permis une
première appréciation de la convenance du site pour un rejet en toute sécurité
de déchets radioactifs solidifiés.
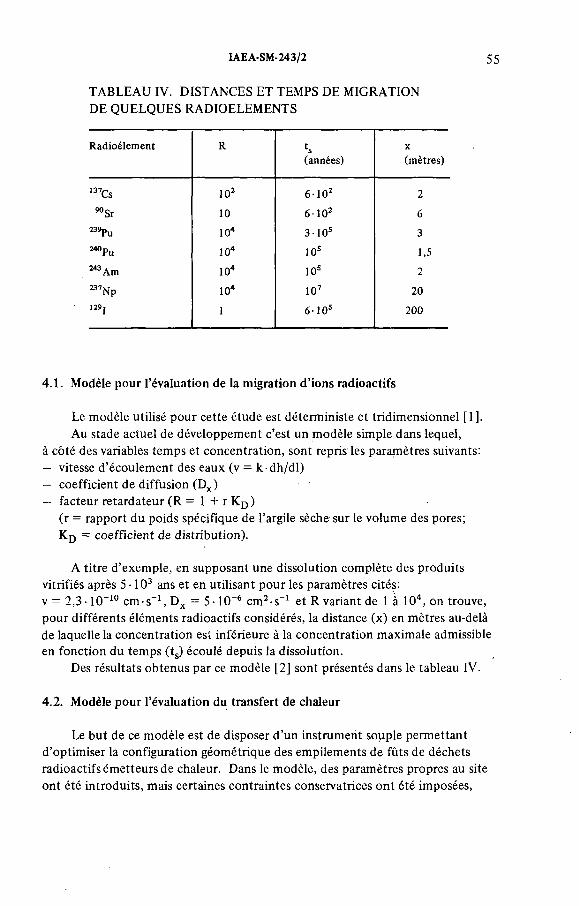
IAEA-SM-243/2 55
TABLEAU IV. DISTANCES ET TEMPS DE MIGRATION
DE QUELQUES RADIOELEMENTS
Radioélément R 4(années)
x(mètres)
137Cs 102 6 1 0 2 2
90 Sr 10 6 102 6
239Pu 104 3 1 0 5 3
^ P u 104 10s 1,5
243 Am 104 10s 2
M7Np 104 107 2012 9 j 1 6 1 0 5 200
4.1. Modèle pour l’évaluation de la migration d’ions radioactifs
Le modèle utilisé pour cette étude est déterministe et tridimensionnel [ 1 ].
Au stade actuel de développement c’est un modèle simple dans lequel,
à côté des variables temps et concentration, sont repris les paramètres suivants:
— vitesse d’écoulement des eaux (v = k-dh/dl)
— coefficient de diffusion (Dx)
— facteur retardateur (R = 1 + r KD)
(r = rapport du poids spécifique de l’argile sèche sur le volume des pores;
KD = coefficient de distribution).
A titre d’exemple, en supposant une dissolution complète des produits
vitrifiés après 5 -103 ans et en utilisant pour les paramètres cités:
v = 2,3 • 10-10 cm-s'1, Dx = 5 • 10~6 cm2 s-1 et R variant de 1 à 104, on trouve,
pour différents éléments radioactifs considérés, la distance (x) en mètres au-delà
de laquelle la concentration est inférieure à la concentration maximale admissible
en fonction du temps (ts) écoulé depuis la dissolution.
Des résultats obtenus par ce modèle [2] sont présentés dans le tableau IV.
4.2. Modèle pour l’évaluation du transfert de chaleur
Le but de ce modèle est de disposer d’un instrument souple permettant
d’optimiser la configuration géométrique des empilements de fûts de déchets
radioactifs émetteurs de chaleur. Dans le modèle, des paramètres propres au site
ont été introduits, mais certaines contraintes conservatrices ont été imposées,

56 BONNE et al.
par exemple une augmentation maximale de 100°C pour la température du massif
argileux et de 5°C pour la température à l’interface argile-aquifère. C’est ainsi
qu’une charge thermique maximale globale de 15 kW par hectare a été retenue
actuellement pour l’étude de faisabilité et que des empilements de 12 fûts,
distants l’un de l’autre de 10 m, sur trois rangées de 2,5 km de long et écartées
de 200 m, ont été envisagés.
\
5. TRAVAUX COMPLEMENTAIRES FUTURS EN VUE DE CONFIRMER
LA CONVENANCE DU SITE
Un des objectifs des travaux futurs est de recueillir plus de données
scientifiques in situ, c’est-à-dire au sein même de la formation retenue et à la
profondeur envisagée pour l’enfouissement. Le CEN/SCK envisage donc la
construction d’un laboratoire expérimental à moins 225 m de profondeur, dans
le plan médian de la formation argileuse à Mol. Les travaux de fonçage du puits
d’accès débuteront fin 1979 et le laboratoire souterrain devrait être opérationnel
dans le courant de 1982.
Le programme expérimental détaillé est en cours d’élaboration; il concerne
quatre aspects particuliers de la recherche:
- expériences et essais en rapport avec la mécanique du sol et l’hydrologie;
— expériences et essais en rapport avec le transfert de chaleur et la corrosion
des matériaux;
- expériences en rapport avec la migration (il s’agit d’essais avec traceurs
chimiques ou radioactifs);
— expériences et essais technologiques en rapport direct avec les techniques
minières à mettre en oeuvre pour résoudre les problèmes particuliers posés
dans ce domaine.
En plus des travaux expérimentaux en sous-sol, de nombreuses mesures à
long terme comme la mesure des contraintes mécaniques de la poussée de terrain
et des contrôles de laboratoire sur échantillons prélevés devront être effectuées.
REFERENCES
[1] PUT, M., HEREMANS, R., cModélisation mathématique de la migration de radionuclides dans une formation argileuse homogène», Analyse des risques et élaboration de modèles géologiques en relation avec l’évacuation de déchets radioactifs dans les formations géologiques (C.R. Réunion de travail AEN/CCE, Ispra, 1977).
[2] BAETSLE, L., HEREMANS, R., (Investigation on the use of a clay formation for terminal disposal of radioactive wastes), NUCLEX 78, Int. Fair and Technical Meeting of Nuclear Industries, Basel, 1978.

IAEA-SM-243/2 57
DISCUSSION
H. RÔTHEMEYER: What type of waste is your future repository planned
for?
A.A. BONNE: The wastes we are considering are by-products of the nuclear
power programme in Belgium, namely, solidified high-level waste, medium-level
waste, cladding hulls and alpha-bearing waste. The waste types are described in
more detail in paper SM-243/3.
C. DAVISON: Are the aquifers which are located within the system of
sediments you are investigating useful for water supply?
A.A. BONNE: The uppermost aquifer above the Boom clay is used at present
for water supply. The others in the Mol area are not used because of their low
transmissivity, depth and/or salt content, which make them unsuitable.
F. GERA: In Table IV you have given the retardation factors for several
actinides. The value for neptunium is the same as that for the other elements.
However, the data available in the literature indicate that neptunium is much more
mobile than other transuranics. Is the neptunium retardation value in your table
based on a simplifying assumption or on experimental data?
A.A. BONNE: The value is an assumed one. In constructing the migration
model we assumed a retardation factor of 102, 103, 104 for Np. Table IV is given
only as an example of the output of the model.
R. PUSCH: The heat conductivity value given in Table III is only
0.37 W-m-1-°C-1. This is a very low value (probably due to lack of quartz
particles) and it should result in very high temperatures if you store high-level
waste. Could you please comment on this?
R.HEREMANS: The heat conductivity value of 0.37 W m _1-°C_1 given in
the paper was obtained on a laboratory sample at a temperature of 100°C, i.e. on
dry clay. Other laboratory experiments have shown that at 20°C, i.e. at a
temperature at which the clay still contains its natural water, heat conductivity
is of the order of 1 W m-1 °C_1. An in situ simulation experiment on a full scale
is now under way and should give a value still closer to the actual value of the heat
conductivity. In any case, this heat conductivity is low in comparison with that
of salt or granite, and this is one of the factors limiting the permissible heat load
(in the present state of our knowledge) to 15 kW/ha.
J.B. ROBERTSON: Do you plan to do any in situ measurements or studies
of Kd or retardation factors?
A.A. BONNE: In the underground experimental room which is being planned
we intend to carry out in situ experiments on the migration of radionuclides.
Within this framework it will be possible to perform experiments for the specific
identification of Kd and retardation factors. However, a good estimate of in situ
Kd values can be obtained by laboratory experiments backed up by physico
chemical and thermodynamic work.

58 BONNE et al.
D.L. RANÇON: In your studies on radionuclide retention you use the term
“ion exchange”. Do you think that in the case of Pu and Eu the process involved
is essentially ion exchange? Are not other phenomena such as precipitation
predominant?
R. HEREMANS: The case of Pu and Eu is obviously very special. The
experiments carried out at our Centre indicate that Pu in solution and in contact
with the Boom clay can be present in various forms - colloids, complexes,
precipitates etc.
At the present stage of our studies it is not possible to distinguish properly
between ion exchange and other sorption phenomena. The CEN/SCK has
embarked on an experimental programme which is expected to provide a reply
to this question. This is obviously of importance for the study and modelling
of migration.
IAEA-SM-243/3
CONCEPTION D UNE INSTALLATION
POUR L’ENFOUISSEMENT DANS L’ARGILE
DE DECHETS RADIOACTIFS CONDITIONNES*
P. MANFROY, R. HEREMANS,
M. PUT, R. VANHAELEWYN
Centre d’étude de l’énergie nucléaire,
Studiecentrum voor Kernenergie,
Mol
M. MAYENCE
Association momentanée
Tractionel-Courtoy,
Bruxelles,
Belgique
Abstract-Résu mé
DESIGN OF A FACILITY FOR DISPOSAL OF TREATED RADIOACTIVE WASTE IN CLAY.
As part of its research and development programme on the disposal of insolubilized radioactive waste in clay formations, the Nuclear Research Centre at Mol commissioned two specialist engineering and design offices to carry out a feasibility study on the establishment of a complete facility for burying waste in clay, covering all the technological, financial and time-scale problems involved. One of the first tasks was to study the different technologies for drilling into very deep beds of plastic clay and to evaluate the extent of stability problems. A careful study was made to assess the permissible heat load for the clay, and this resulted in the establishment of a limited number of possible underground geometries. The general characteristics were then determined for both the surface infrastructure and the underground facilities. Problems such as those raised by the possibility of recovering waste for a certain length of time or by the permanent closure of the site were studied and solutions suggested. Finally, an initial evaluation of the capital and operating costs was performed.
CONCEPTION D’UNE INSTALLATION POUR L’ENFOUISSEMENT DANS L’ARGILE DE DECHETS RADIOACTIFS CONDITIONNES.
Dans le cadre de son programme de recherche et de développement sur le rejet en formation argileuse de déchets radioactifs insolubilisés, le Centre d’étude de l’énergie nucléaire de Mol (CEN/SCK) a confié à deux bureaux d’études spécialisés, la réalisation d’une étude de faisabilité qui avait pour but d’évaluer les possibilités de réaliser une installation complète
* Travaux réalisés dans le cadre d’un contrat avec la Commission des Communautés européennes.
59
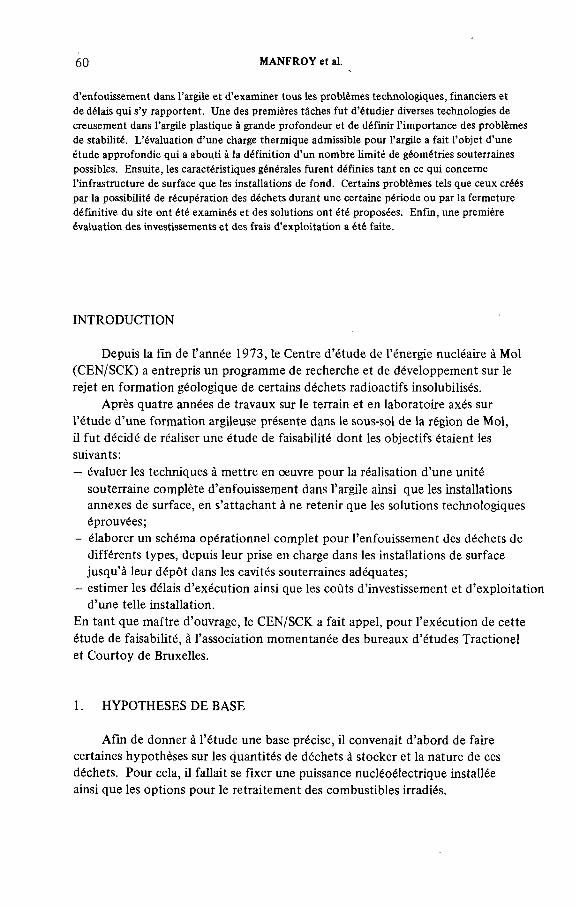
6 0 MANFROY et al.
d’enfouissement dans l’argile et d’examiner tous les problèmes technologiques, financiers et de délais qui s’y rapportent. Une des premières tâches fut d’étudier diverses technologies de creusement dans l’argile plastique à grande profondeur et de définir l’importance des problèmes de stabilité. L’évaluation d’une charge thermique admissible pour l’argile a fait l’objet d’une étude approfondie qui a abouti à la définition d’un nombre limité de géométries souterraines possibles. Ensuite, les caractéristiques générales furent définies tant en ce qui concerne l’infrastructure de surface que les installations de fond. Certains problèmes tels que ceux créés par la possibilité de récupération des déchets durant une certaine période ou par la fermeture définitive du site ont été examinés et des solutions ont été proposées. Enfin, une première évaluation des investissements et des frais d’exploitation a été faite.
INTRODUCTION
Depuis la fin de l’année 1973, le Centre d’étude de l’énergie nucléaire à Mol
(CEN/SCK) a entrepris un programme de recherche et de développement sur le
rejet en formation géologique de certains déchets radioactifs insolubilisés.
Après quatre années de travaux sur le terrain et en laboratoire axés sur
l’étude d’une formation argileuse présente dans le sous-sol de la région de Mol,
il fut décidé de réaliser une étude de faisabilité dont les objectifs étaient les
suivants:
— évaluer les techniques à mettre en oeuvre pour la réalisation d’une unité
souterraine complète d’enfouissement dans l’argile ainsi que les installations
annexes de surface, en s’attachant à ne retenir que les solutions technologiques
éprouvées;
— élaborer un schéma opérationnel complet pour l’enfouissement des déchets de
différents types, depuis leur prise en charge dans les installations de surface
jusqu’à leur dépôt dans les cavités souterraines adéquates;
— estimer les délais d’exécution ainsi que les coûts d’investissement et d’exploitation
d’une telle installation.
En tant que maître d’ouvrage, le CEN/SCK a fait appel, pour l’exécution de cette
étude de faisabilité, à l’association momentanée des bureaux d’études Tractionel
et Courtoy de Bruxelles.
1. HYPOTHESES DE BASE
Afin de donner à l’étude une base précise, il convenait d’abord de faire
certaines hypothèses sur les quantités de déchets à stocker et la nature de ces
déchets. Pour cela, il fallait se fixer une puissance nucléoélectrique installée
ainsi que les options pour le retraitement des combustibles irradiés.
IAEA-SM-243/3 61
1.1. Hypothèses sur la puissance nucléoélectrique installée
Il a semblé raisonnable de baser l’étude sur une puissance nucléoélectrique
installée de 10 000 MW(e) pendant une période de 30 ans (cette période de
30 ans correspondant à la durée moyenne d’exploitation des centrales nucléo-
électriques).
1.2 Hypothèses sur le retraitement des combustibles irradiés
Il a été supposé que dans l’avenir et dans le cadre du programme nucléo
électrique précédemment défini, la Belgique procéderait au retraitement du
combustible usé. Dans cette hypothèse, les déchets dont il faut tenir compte
pour l’enfouissement se subdivisent suivant les différentes classes qui suivent:
a) Déchets hautement actifs, de longue période et fortement générateurs
de chaleur (produits de fission). Ces déchets seraient finalement inclus dans une
matrice de verre, elle-même conditionnée dans une enveloppe métallique étanche
de forme cylindrique (diamètre 0,3 m, hauteur 1,5 m) et d’un volume de
s 100 litres; ces cylindres seraient au nombre de 9000.
b) Déchets hautement actifs, de longue période et faiblement générateurs
de chaleur (matériaux de gainage). Ces déchets seraient compactés et inclus dans
une matrice métallique, elle-même confinée dans une enveloppe métallique
identique à celle définie sous a). Il y aurait également 9000 cylindres contenant
ce type de déchets.
c) Déchets moyennement actifs de longue période et non générateurs de
chaleur. Ces déchets, ainsi que ceux de basse activité mais de longue période
provenant du retraitement et du recyclage du plutonium, seraient inclus dans une
matrice de béton ou de bitume et confinés dans des fûts cylindriques en métal,
d’un volume de s 220 litres (diamètre 0,56 m, hauteur 0,86 m). La quantité
de ces fûts serait de = 150 000 unités.
2. CONTRAINTES DE BASE
Ces contraintes concernent la nature même de la formation géologique retenue,
l’environnement du site choisi, l’aspect thermique, important dans le cas de
certains types de déchets, et, enfin, l’option de récupération possible.
6 2 MANFROY et al.
2.1. Contraintes géologiques
La formation retenue comme roche hôte pour l’étude de faisabilité est une
couche d’argile d’âge cénozoi'que (oligocène) subhorizontale et épaisse d’une
centaine de mètres, connue sous le nom d’argile de Boom. Du fait d’un très léger
pendage NE, les profondeurs respectives du toit et de la base de cette couche
d’argile sont comprises entre 160 et 170 m d’une part, et 260 et 270 m d’autre
part en dessous du site du CEN/SCK. Les couches encaissantes sont constituées
de sables aquifères. Une analyse géophysique poussée du sous-sol de la zone
choisie a montré que ces formations n’étaient affectées-par aucun accident
tectonique ou synsédimentaire susceptible d’interrompre leur continuité géométrique.
L’argile elle-même est compacte sur toute son épaisseur et présente une grande
homogénéité et une grande imperméabilité. Le comportement rhéologique de
l’argile est tel que dans l’état actuel des techniques de creusement en sol meuble
et à ces profondeurs, seules deux techniques ont été envisagées: le creusement
traditionnel après congélation préalable d’un cylindre d’argile entourant la
galerie, ou l’utilisation d’un tunnelier avec revêtement simultané par claveaux
juxtaposés.
2.2. Contraintes en surface
A côté de ses installations techniques, le CEN/SCK dispose d’une vaste zone
forestière dans laquelle une aire rectangulaire de 150 hectares (2,5 km X 0,6 km)
a été réservée à l’emprise en surface des installations souterraines. L’occupation
réelle du terrain par les bâtiments de surface des installations de stockage est
évidemment beaucoup moins importante, de l’ordre de quelques hectares. La
proximité des installations techniques du CEN/SCK impose aux techniques de
creusement des galeries de ne produire aucun affaissement en surface.
2.3. Contraintes thermiques
L’enfouissement de déchets fortement générateurs de chaleur entraîne pour
la roche hôte un important problème de charge thermique maximale admissible.
En effet, celle-ci détermine la densité d’enfouissement par unité de volume; or,
le volume total disponible étant limité, c’est la configuration même des
installations souterraines qui en sera affectée.
D’autre part, la charge thermique maximale admissible détermine également
le temps de refroidissement préalable en surface avant l’enfouissement.
Afin de baser l’étude de faisabilité sur des valeurs conservatrices, les hypothèses
suivantes ont été faites:
— augmentation maximale de la température de 100°C dans l’argile à proximité
immédiate des cylindres de déchets,
IAEA-SM-243/3 63
— augmentation maximale de la température de 5°C au contact entre le toit de
l’argile et les sables sus-jacents,
— augmentation maximale de la température de 0,5°C au niveau du sol.
Compte tenu des propriétés thermiques de l’argile et des sables encaissants,
ces hypothèses impliquent une charge thermique de = 15 kW/ha uniformément
répartie sur la zone réservée. Une telle charge thermique ne peut, pour la quantité
de déchets considérée, être obtenue qu’après un temps préalable de refroidissement
en surface compris entre 50 et 75 ans.
2.4. Contraintes liées à l’option de récupération
Il a été jugé nécessaire de prévoir la possibilité d’une récupération aisée des'
déchets enfouis pendant un laps de temps suffisant. Cette option implique la
nécessité de conserver ouverts pendant le temps jugé raisonnable les galeries et
leurs accès, qui représentent une proportion importante d’espace souterrain non
utilisable directement pour l’enfouissement.
3. CONFIGURATIONS GEOMETRIQUES DES INSTALLATIONS
SOUTERRAINES D’ENFOUISSEMENT (fig. 1)
L’étude de faisabilité a permis de développer diverses géométries souterraines
se distinguant les unes des autres par la méthode d’enfouissement des déchets
de haute activité.
Il sera fait état ici de la configuration qui a été jugée la plus simple et la plus
sûre tout en étant d’un coût raisonnable. Dans tous les cas, toutes les configurations
étudiées comprennent d’une part des puits d’accès et de ventilation et d’autre part
un réseau de galeries subdivisées en galeries d’accès (principales) et galeries
d’évacuation (secondaires), toutes de section circulaire.
3.1. Puits d’accès et de ventilation
a) Les puits d ’accès sont au nombre de deux. Le premier puits relie les
installations de surface où les déchets conditionnés sont reçus de l’extérieur et
inspectés avant enfouissement, aux galeries souterraines. Le diamètre utile de
4,5 m retenu pour ce puits permet le transit du tunnelier prévu pour creuser les
galeries secondaires, et permet également le passage de l’air de ventilation du
jour vers le fond sans vitesse excessive. Pendant la phase de creusement des
premières galeries, ce puits servira au transit des déblais. Lorsqu’une première
partie du réseau de galeries sera achevé, l’entreposage de certains déchets pourra
commencer; il faudra alors construire un deuxième puits de façon à séparer les
activités d’enfouissement des travaux purement miniers.

64 MANFROY et al.
FIG.l. Installations souterraines pour l’enfouissement dans l'argile de déchets radioactifs conditionnés.
@ Puits d'accès Q) Puits de ventilation Q) Galerie principale@ Galeries secondaires pour déchets de haute activité ® Galeries secondaires pour déchets de moyenne activité © Galeries secondaires pour matériaux de gainage.
b) Les puits de ventilation, également au nombre de deux dans la configura
tion retenue, ne serviront qu’au retour de l’air de ventilation; de ce fait ils auront
un diamètre plus restreint (= 2 m).
3.2. Réseau de galeries (fig. 2)
Le réseau de galeries sera constitué d’une série de galeries secondaires
parallèles entre elles et reliées en leur milieu par une galerie principale d’accès
les coupant à angle droit. La galerie principale, d’un diamètre de 4,50 m et d’une
longueur de 550 m, sera dévolue au transport des déchets dans leurs conteneurs
vers les galeries secondaires.
A chaque intersection entre la galerie principale et les galeries secondaires,
une carrure massive de grande dimension, de forme cylindrique, permettra le
montage du tunnelier avant le creusement de chaque galerie secondaire. Celles-ci

IAEA-SM-243/3 65
auront toutes le même diamètre, c’est-à-dire 3,5 m, de façon à uniformiser la
méthode de creusement. Dans la configuration actuellement retenue, leur
longueur maximale sera de 2500 m et elles se subdiviseront en trois types distincts
suivant la classe des déchets qui y seront entreposés.
Galeries d ’évacuation pour déchets de moyenne activité
Ces déchets n’étant pas générateurs de chaleur et étant faiblement générateurs
de rayonnements, ils seront empilés de manière à remplir la quasi-totalité de la
section de la galerie. Une longueur totale d’un peu de moins de 7 km de galeries
sera nécessaire pour stocker l’ensemble des déchets de cette classe. La distance
séparant deux galeries consécutives de ce type sera d’environ 35 m.
Galeries d ’évacuation pour déchets de haute activité
Les cylindres contenant ce type de déchets seront empilés par groupes de
12 au maximum dans des trous cylindriques d’un diamètre de 0,5 m et longs d’une
vingtaine de mètres, gainés d’un alliage résistant à la corrosion, creusés perpendicu
lairement à l’axe de la galerie secondaire et inclinés de 45° par rapport au plan
horizontal. La distance séparant deux trous consécutifs, le long de la galerie
principale, sera de l’ordre d’une vingtaine de’ mètres. L’espacement entre deux
galeries consécutives de ce type sera de l’ordre de 200 m. Le respect des
hypothèses de base quant aux quantités de déchets de haute activité entraîne
le creusement de trois galeries de 2500 m chacune, soit 7500 m de galeries.
Galeries d ’évacuation pour matériaux de gainage
Le conditionnement de ce type de déchets est supposé être le même que celui
des déchets de haute activité, le type de stockage en sera donc identique à la
différence près que la distance entre les trous inclinés sera moindre (4,5 m au lieu
de 20 m). Une longueur totale de 1800 m de galeries serait suffisante pour stocker
la totalité de ce type de déchets.
4. METHODES DE CREUSEMENT
4.1. Méthode de fonçage des puits
Le fonçage des puits, compte tenu de la nature des terrains recouvrant
l’argile, se fera soit par la technique de congélation, soit par la technique de
l’outil rotatif à pleine section sous bentonite (procédé Honigman).

M ANFROY et al.
I I
. i I I I I
II
hIIsX J L1X 1
Г!%
w ¡ y
COaэоо
áосчO
Во
R
ЕС
B в вoO 00 чОOO r-
840 00• •Г” VO VÛТ“II Л И
Q нrH «гН э 4»3» 0н
< < о
» гН Ээ tí « и 2Ф Ф ФЬО ъо ьо сб « (вЛ Л J4и о оО О О 4 * 4 * 4 *( О О О
« фн ив -но, «•Н 73 О tíа о *Н о t* ф о. в
Ets
L&J Ф фg î t а н л ч & &
(Отз а аS RФа -*■О Qk.
э♦-Jмафт>ао♦н■р«
аф►
ф•dи и ф ф
гН Н Св 4to ьо
Í !
•H -н 5
О Ф
оог оо гos s
FIG
.2.
Géo
mét
rie
du
stoc
kage
so
uter
rain
(en
mètr
es).
HLW
: dé
chet
s de
haut
e ac
tivité;
Hul
ls
= m
atér
iaux
de
gai
nag
e;
MLW
=
déch
ets
de
moyenne
activité.
IAEA-SM-243/3 67
4.2. Méthode de creusement des galeries
Plusieurs méthodes de creusement de l’argile ont été étudiées. Seules deux
méthodes réalistes ont été retenues: le creusement par tunnelier et le creusement
par congélation.
Méthode par tunnelier
C’est la méthode qui semble s’adapter le mieux aux propriétés rhéologiques
de l’argile in situ. La totalité de la section sera creusée en une seule fois par le
tunnelier. La galerie serait revêtue de claveaux jointifs au fur et à mesure de son
creusement, la machine prenant appui sur chaque anneau de revêtement nouvelle
ment placé pour avancer.
Creusement par congélation
La nécessité d’obtenir avant creusement un cylindre de massif congelé
parfaitement homogène et rectiligne impose un contrôle très poussé de
l’horizontalité et du parallélisme des tubes congélateurs sur une grande distance.
Ces tubes devront être munis de systèmes déviateurs très précis.
4.3. Méthode de creusement des trous d’enfouissement des déchets de haute
activité
La méthode actuellement retenue pour le creusement de ces puits radiaux
est celle qui consiste à pousser dans le massif, à l’aide de vérins hydrauliques, un
fourreau muni d’une trousse coupante, en procédant simultanément à la
désagrégation de l’argile et à l’évacuation des déchets à l’aide d’une tarrière
tournant à l’intérieur du fourreau.
5. REVETEMENTS
Compte tenu des propriétés rhéologiques de l’argile, aucune cavité ne
pourrait y être maintenue sans revêtement à la profondeur envisagée.
5.1. Revêtement des puits d’accès et d’aérage
Le revêtement des puits sera constitué de béton armé d’épaisseur croissante
vers le bas, coulé par passes successives derrière des coffrages couUssants.
L’étanchéité sera renforcée par une couche continue de matériau imperméable,
isolant le puits des terrains environnants.
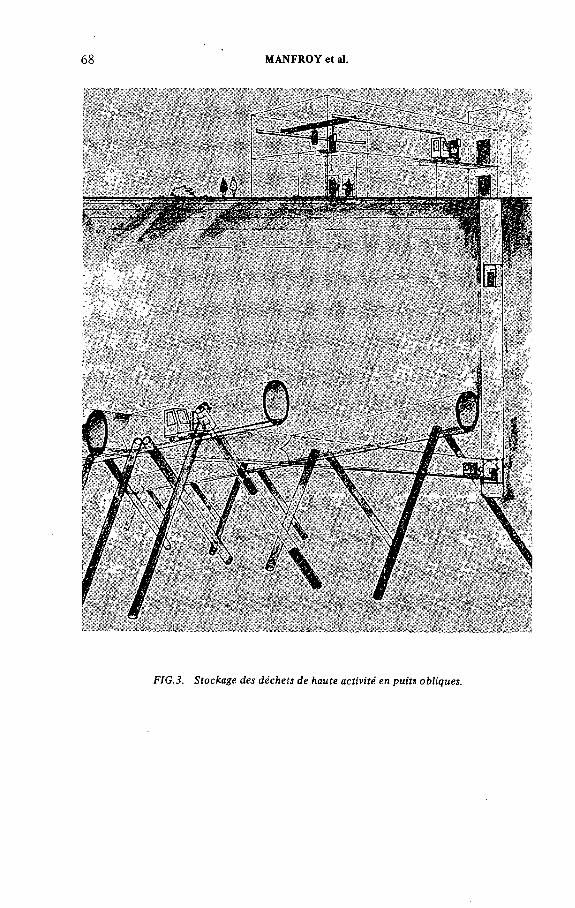
6 8 MANFROY et al.
FIG.3. Stockage des déchets de haute activité en puits obliques.
IAEA-SM-243/3 69
5.2. Revêtement des galeries principales et secondaires
Eu égard aux pressions considérables devant être reprises par les revêtements
des galeries horizontales dans l’argile, le béton a été rejeté en raison de la masse et
du volume beaucoup trop grands qu’il imposerait. Comme, d’autre part, la
technique par tunnelier nécessite le placement du revêtement au fur et à mesure
du creusement, c’est le revêtement en fonte nodulaire constitué de claveaux
nervurés, jointifs et boulonnés, qui a été choisi. Le prix d’un tel revêtement
représentera une part importante du coût total des galeries.
5.3. Revêtement des trous d’enfouissement des déchets de haute activité
Ces déchets devant être parfaitement isolés, aussi bien du massif argileux
que de la galerie secondaire, les trous radiaux qui les contiennent devront
présenter un revêtement particulièrement soigné, constitué d’acier doublé
extérieurement de ciment spécialement résistant à la dilatation thermique. De
plus, pour assurer une bonne conductivité thermique, l’espace compris entre
les cylindres et la face interne du revêtement du trou sera rempli d’un matériau
aisément récupérable pendant la période de réversibilité.
6 . MANUTENTION ET TRANSPORT
L’étude de faisabilité a pris en compte les différents aspects de la manutention
et du transport des déchets. La conception et la réalisation du matériel adéquat '
ne dépasse en aucune manière les possibilités de la technologie actuelle.
6.1. Conteneurs
Les conteneurs de transport sont de types différents suivant les déchets qu’ils
transportent.
a) Les conteneurs pour déchets de haute activité et pour matériaux de
gainage sont du type à ouverture par le bas. Ils sont prévus pour un seul cylindre
de déchets. Le poids total de l’ensemble conteneur plus cylindre est de l’ordre de
10 t. Le conteneur a son propre treuil de levage pour la manutention du
cylindre de déchets. Le blindage gamma est assuré par un recouvrement de
plomb et la protection neutronique par une épaisseur de matériau léger (fig. 3).
b) Les conteneurs pour déchets de moyenne activité ou pour déchets
émetteurs alpha seront du type à barillet et ouverture vers le haut. Ils pourront
contenir trois fûts. Le poids de l’ensemble conteneur plus fûts sera également
de 10 t (fig. 4).
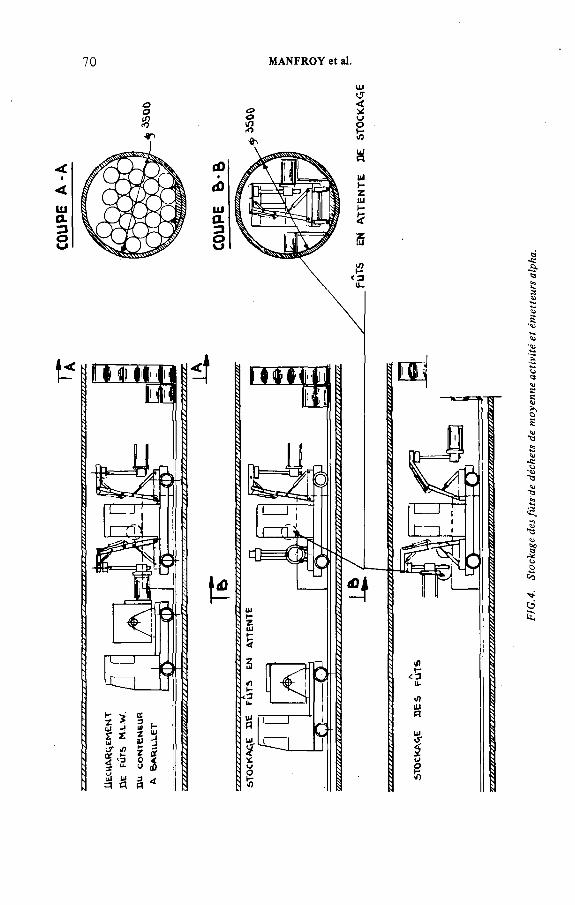
70 MANFROY et al.
FIG.4.
Stockage des fûts de
déchets
de moyenne
activité et
émetteurs alpha.

IAEA-SM-243/3 71
6.2. Equipement de transport
Le transport au fond sera assuré par des chariots montés sur des rails
spécifiques à chaque type de conteneur. Les chariots destinés au transport et
à la manutention des fûts de déchets de moyenne activité seront pourvus de
systèmes de préhension permettant leur empilement régulier à front de galerie.
Les chariots destinés au transport des cylindres de déchets de haute activité
n’assureront aucune manutention; les cylindres seront directement introduits
dans les trous d’enfouissement à l’aide du treuil incorporé au conteneur. Ces
chariots devront également permettre l’injection de sable dans l’espace compris
entre les parois du trou d’enfouissement et le revêtement des cylindres.
7. VENTILATION
La ventilation des installations souterraines aura pour but de rendre
l’atmosphère du fond sans danger pour les personnes qui y travailleront, tant du
point de vue de la température que de la qualité de l’air. De plus, la ventilation
pourra éliminer une certaine fraction des calories générées par les déchets de
haute activité, ce qui fera diminuer d’autant les quantités de chaleur absorbées
par la formation argileuse. Afin d’éviter tout risque de contamination, le réseau
souterrain de galerie sera en dépression par rapport à l’atmosphère. Les galeries
pour déchets de moyenne activité et matériaux de gainage auront un aérage
secondaire par canars. Avant d’être restitué à l’atmosphère, l’air de ventilation
devra pouvoir, en cas de besoin, être détourné vers des batteries de filtres absolus.
8 . INSTALLATIONS DE SURFACE
Les installations de surface comprendront une partie purement minière
constituée par les recettes de puits et une partie nucléaire constituée par diverses
installations de réception et de contrôle des déchets de diverses catégories. Les
étapes de contrôle des déchets et de réparation éventuelle de leur conditionnement
ne constituent pas des opérations fondamentalement nouvelles et sont couramment
réalisées dans les installations nucléaires existantes.
9. ANALYSE DES PRIORITES
)
A l’heure actuelle, il est logique de penser que les premiers déchets à devoir
être stockés en sous-sol seront ceux de moyenne activité et ceux contenant des
émetteurs alpha. Si le projet se réalise suivant le déroulement qui a été prévu dans

72 MANFROY et al.
l’étude de faisabilité, les premières opérations d’enfouissement de déchets de
moyenne activité et de déchets émetteurs alpha devraient intervenir à la fin de la
prochaine décennie. Il n’en va pas de même pour les premiers déchets de haute
activité: leurs temps de refroidissement en surface ne les rendront susceptibles
d’être évacués que dans le courant du premier quart de siècle prochain au plus tôt.
La réalisation des différentes tranches du réseau souterrain de galeries devra être
échelonnée en fonction de la disponibilité des déchets des différents types.
10. FERMETURE DU SITE
Après la fin de l’exploitation débutera une période de surveillance s’étendant
sur plusieurs décennies pendant laquelle la récupération de tous les déchets restera
possible. Il faudra ensuite prendre la décision de refermer le site de façon définitive.
La fermeture des galeries consistera à combler tous les espaces vides de façon à
former un ensemble rigide non susceptible de s’effondrer. La fermeture des puits
nécessitera leur démantèlement sur une certaine longueur depuis leur base jusque
dans les sables surincombants, afin de reconstituer, à l’aide des déblais conservés
en surface, la formation argileuse remaniée.
11. ANALYSE DES COUTS
Du budget total consacré au projet comprenant la construction des
installations et leur exploitation pendant la période nécessaire à l’enfouissement,
la part la plus importante, soit 80%, est constituée par les investissements et
parmi ceux-ci, c’est la part réservée aux installations souterraines qui est
prépondérante, ceci étant dû, pour la plus grande partie, à l’influence majeure
du prix du revêtement.
Pour la solution qui, durant l’étude de faisabilité, a paru la plus fiable et la
moins onéreuse, et compte tenu du fait que la récupération doit rester possible
pendant une longue période de temps, un budget global de 25 milliards de francs
belges sera nécessaire (en valeur actuelle). L’option de non-réversibilité entraînerait
une réduction sensible de cette somme.
Si on calcule ce budget en fonction du nombre de kW-h consommés pendant
les 30 ans sur lesquels l’étude a été basée, on arrive à une valeur comprise entre
1 et 2 centimes par kW h, au tarif de 1979.
DISCUSSION
J.R. GRIFFIN: What will be the stability of the inclined disposal tunnels for
the heat-generating waste over a period of time, particularly when the clay dries out?

UNDERGROUND DISPOSAL OF RADIOACTIVE WASTES
(STI/PUB/528)
CORRIGENDUM
In the front matter of this publication, the
International Standard Book Numbers (ISBN)
should read as follows:
Vol.I: ISBN 92-0-020180-6
Vol.II: ISBN 92-0-020280-2


IAEA-SM-243/3 73
P. MANFROY: The clay drying out in the proximity of inclined disposal
tunnels for high-level wastes is indeed a problem of great concern.
We have carried out a theoretical study of the behaviour of the water included
in clay at right angles to the locations where the waste is emplaced. The mathe
matical treatment of the model resulting from this study is now in progress.
However, the low temperatures in the constraints which we have imposed will
probably limit the extent of drying. In situ experiments in the clay in the outcrop
zone are under way and will certainly be indicative.
G. ROCHLIN: I understand that you plan to keep your mine open for
perhaps 100 years. What you have there are lined tunnels in clay, which must be
made stable in the face of a large asymmetrical linear heat load under the main
and secondary galleries. Do you expect any serious maintenance problems in
keeping the galleries open for such a long period?
P. MANFROY : It is true that maintenance of inclined galleries and
tunnels over very long periods of time is a great problem. On the other hand,
there is, first of all, the favourable experience of coal mines, which are kept open
for several decades in some cases and remain in operation. Secondly, in the
feasibility study we have tried systematically to use oversized linings so as to
obtain the maximum stability. Lastly, the rheological behaviour of plastic clay is
such that we can expect progressive compacting of the clay mass around the
inclined tunnels. The latter are lined with metal and are in contact with the thick
nodular cast iron lining of the galleries. Since the heat conductivity of metal and
of cast iron in particular is appreciably higher than that of clay, a considerable
part of the heat generated by the high-level waste will probably propagate by
conduction towards the gallery lining, from where it will be eliminated by
ventilation.
L. GILLY: I should like to elaborate on this reply. The stability of the
tunnels, the main and secondary galleries and the small storage shafts should be
ensured during excavation and after the storage of waste so as to permit reversi
bility. This is done by using a cast iron lining of appropriate thickness (with
allowance for corrosion) and injecting bentonite between the cást iron and the
clay. The small storage shafts will be lined with steel and filled with sand or
bentonite for the purpose of heat removal. These linings will be made as imper
meable as possible to minimize water infiltration.
H. ROTHEMEYER: Did you consider the disadvantages of keeping all parts
of the mine open (i.e. with access to the waste) for such a long time under accident
conditions (for example, the risk of water inflow)?
P. MANFROY: Water inflow problems in underground facilities are
indeed of importance. However, numerous tunnels have already been excavated
in the Boom clay formation below the River Scheldt near Antwerp. So far none
of the tunnels has shown even the slightest degree of water incursion. In any case,
in the final waste repositories steps will be taken to provide against accidental
entry of water.

74 M ANFROY et al.
R. PUSCH: Do you consider your clay layer to be uniform and homogeneous?
Do you rely upon laboratory and borehole studies where permeability is concerned?
I ask this because I am aware of the difficulty of determining the presence of very
thin, more or less continuous permeable laminae (silt and sand) which could
invalidate your recorded values and which certainly are the most important structural
components. It is here that water circulation under the influence of the induced
temperature fields takes place, leading to serious corrosion conditions for metal
tubes and canisters and to rapid distribution of radionuclides. In principle, this
critical point applies to seabed concepts as well. Would you please comment on
this aspect?
P. MANFROY: Whether the clay layer is uniform and homogeneous
depends on the scale on which we consider it. On the microscopic or even milli-
metric scale to which you refer there is no homogeneity - there isn’t in any rock
for that matter. On the macroscopic scale (metric) the stratigraphie logs taken from
experimental boreholes show a very satisfactory lithological homogeneity. There
are no intercalary layers of sand but at most layers of silt (or perhaps lenses).
As you say, water circulation can certainly occur in the more permeable
layers under the influence of the thermal load of heat-generating waste. (Note
in this connection the constraints which we have imposed). The impact of
temperature on water migration will be studied in the experimental room to be
built in the clay at the final site. Furthermore, account must also be taken of the
ion-exchange and sorption properties of these layers which are more permeable
because of their considerable clay mineral content.
The corrosion of the metal components of the lining is a very important
problem. Laboratory studies are now being conducted at CEN/SCK on corrosion
in various types of lining metals and aqueous solutions which can occur in clay.
These studies are being carried out under various temperature and pressure
conditions. The laboratory experiments will be followed by in situ experiments
in the tunnel and the experimental gallery.
IAEA-SM-243/36
STATUS REPORT ON STUDIES TO ASSESS
THE FEASIBILITY OF STORING NUCLEAR
WASTE IN COLUMBIA PLATEAU BASALTS
R. A. DEJU
Rockwell Hanford Operations,
Richland, Washington
United States of America
Abstract
STATUS REPORT ON STUDIES TO ASSESS THE FEASIBILITY OF STORING NUCLEAR WASTE IN COMUMBIA PLATEAU BASALTS.
In February 1976, the US Energy Research and Development Admistration (currently the US Department of Energy) expanded the commercial radioactive waste management programmes and established the National Waste Terminal Storage Programme. Its mission was to provide multiple facilities in various deep geologic formations within the USA. The Office of Waste Isolation was established within the Union Carbide Corporation Nuclear Division to provide programme management of the National Waste Terminal Storage Programme. The overall programme consisted of investigating a number of geologic rock types to determine their suitability for terminal storage of radioactive waste. Basalts, such as the Columbia Plateau basalts, which underlie a large portion of the Pacific Northwest and the Hanford Site, were selected for initial geologic reconnaissance. Atlantic Richfield Hanford Company was asked in May 1976 by the Office of Waste Isolation to plan and execute a basalt feasibility study. Geologic exploration of Columbia Plateau basalts was needed to determine the feasibility of utilizing those formations as a site for terminal storage of commercial nuclear waste.In September 1977, the National Waste Terminal Storage Programme was restructured.While emphasis was still on a salt repository, additional funds were given to support investigations of two US Department of Energy sites — Hanford and Nevada. The Hanford programme is presently the responsibility of the US Department of Energy, Richland Operations Office. Rockwell Hanford Operations (successor to Atlantic Richfield Hanford Company) is the prime contractor responsible for this work. The staff of the Basalt Waste Isolation Programme within Rockwell Hanford Operations has been chartered with the responsibility of conducting these investigations. This programme is divided into systems integration, geology, hydrology, engineered barriers studies, engineering testing, and the construction of a near-surface test facility .
SYSTEMS INTEGRATION
The systems integration program involves the definition of studies required as part of the qualification of basalt as a repository medium for nuclear waste storage. These studies include the planning of demonstration facilities, as well as the specifying of scientific studies to be undertaken during
75

76 DEJU
and for the licensing process. In addition, the systems integration program is responsible for utilizing the results of ongoing research and development insofar as needed to select repository sites in basalt and assess the feasibility of nuclear waste storage in basalt. Thus, the systems integration program is responsible for integrating all our research and development studies and preparing the information needed for licensing a basalt nuclear waste repository.
During fiscal year 1978:
1. Research and development tasks needed for licensing a basalt repository were identified;
2. Siting criteria for a geologic repository were outlined;
3. A demonstration program for the in situ definition of heat and heat-plus-radiation effects on the basalt was designed;
4. Information required for the license application was proposed and a detailed format and content of the license application for the basalt repository was drafted;
5. The proposed contents of the environmental report were outl i ned ;
6. Work was initiated to examine the types of facilities required as part of the repository, model these facilities, and establish guidelines to be used in the preconceptual design phase.
The systems integration program placed special emphasis on planning a demonstration program to provide information on the response of in situ basalt under heat loads similar to those which would be developed in a repository. In addition, the demonstration program will examine the in situ effect of heat and radiation resulting from the actual emplacement of spent fuel canisters. Test plans for these demonstrations were prepared. Results from the heater tests will provide data on borehole decrepitation, thermal stability, structural integrity, temperature and displacement fields, and the influence of fractures and joints upon in situ basalt properties. These studies will provide the basis for the design of key repository elements such as canister storage, borehole criteria, borehole liner performance, acceptable waste canister power levels, storage borehole array criteria, and repository step-loading evaluation. An equally important aspect of the in situ testing program is the development and verification of design models simulating the performance of a repository. The plan for testing the behavior of a basalt repository where an array of spent fuel canisters is emplaced was drafted.
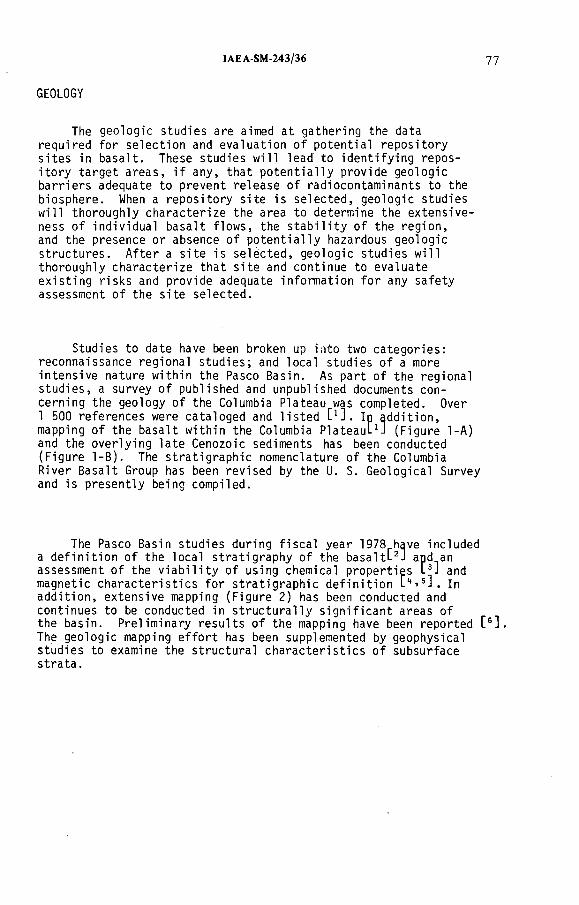
IAEA-SM-243/36
GEOLOGY
The geologic studies are aimed at gathering the data required for selection and evaluation of potential repository sites in basalt. These studies will lead to identifying repository target areas, if any, that potentially provide geologic barriers adequate to prevent release of radiocontaminants to the biosphere. When a repository site is selected, geologic studies will thoroughly characterize the area to determine the extensiveness of individual basalt flows, the stability of the region, and the presence or absence of potentially hazardous geologic structures. After a site is selected, geologic studies will thoroughly characterize that site and continue to evaluate existing risks and provide adequate information for any safety assessment of the site selected.
Studies to date have been broken up into two categories: reconnaissance regional studies; and local studies of a more intensive nature within the Pasco Basin. As part of the regional studies, a survey of published and unpublished documents concerning the geology of the Columbia Plateau was completed. Over1 500 references were cataloged and listed С1] . In addition, mapping of the basalt within the Columbia PlateauL1] (Figure 1-A) and the overlying late Cenozoic sediments has been conducted (Figure 1-B). The stratigraphie nomenclature of the Columbia River Basalt Group has been revised by the U. S. Geological Survey and is presently being compiled.
The Pasco Basin studies during fiscal year 1978 have included a definition of the local stratigraphy of the b a s a l U 2] and an assessment of the viability of using chemical properties t3J and magnetic characteristics for stratigraphie definition L1* > 53 . In addition, extensive mapping (Figure 2) has been conducted and continues to be conducted in structurally significant areas of the basin. Preliminary results of the mapping have been reported [6 The geologic mapping effort has been supplemented by geophysical studies to examine the structural characteristics of subsurface strata.
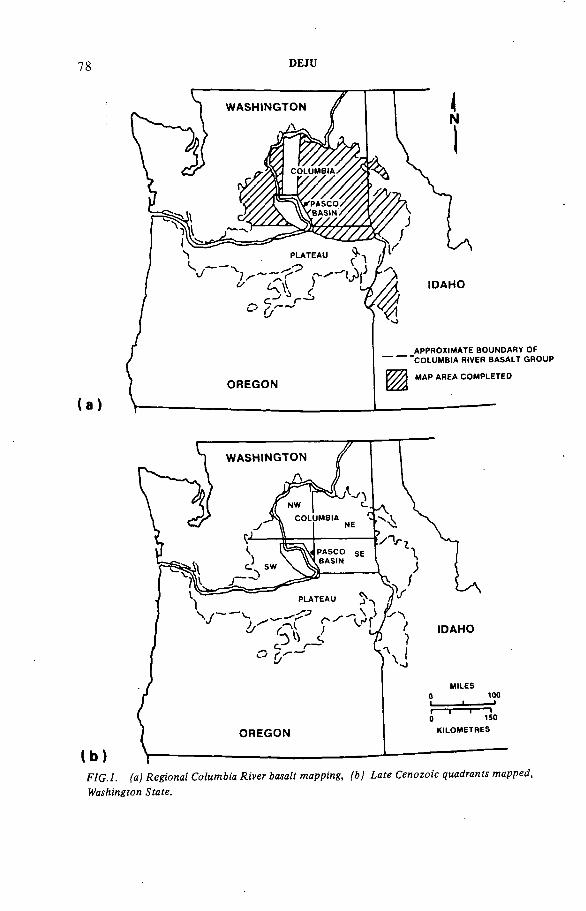
78 DEJU
(a)
(b)
Washington State.

IAEA-SM-243/36 79
1. SURFACE GEOLOGIC MAPPING AND RELATED FIELD STUDIES (REPORTS ON INDIVIDUAL AREAS HAVE BEEN PREPARED)
® SADDLE MOUNTAINS AREA
(B) UMTANUM RIDGE AREA
© GABLE MOUNTAIN-GABLE BUTTE AREA (§) SOUTHWEST PASCO 8ASIN AREA
@ NINE CANYON AREA
Q INTRAFLOW STRUCTURES STUDY. GRANDE RONDE BASALT,SENTINEL GAP
Q PALEOMAGNETIC MEASUREMENTS, GRANDE RONDE BASALT.UMTANUM RIDGE
3. TECTONIC STABILITY STUDIES
• GEOLOGIC MAPPING LATE CENOZOIC SEDIMENTS,WESTERN PASCO BASIN (DASHED PATTERN)
• SURFACE GEOLOGIC MAPPING(1A TO 1E) ALSO INCLUDES TECTONIC STABILITY STUDIES
2. BOREHOLE GEOLOGIC STUDIES M/i/ф/i/i/LITHOLOGIC AND GEOMECHANICAL LOGGING AND CORE PHOTOGRAPHY • • •
MAJOR AND TRACE ELEMENT ANALYSES • • •PALEOMAGNETIC MEASUREMENTS • • •
NOTE: ALL DATA ON FILE IN THE BASALT WASTE ISOLATION PROGRAM LIBRARY
NO PASCO BASIN GEOLOGIC STUOIES WERE CONDUCTED IN DH-4 OR RSH-1 DURING FY-78.
FIG.2. The Pasco Basin

8 0 DEJU
The hydrologie program provides hydrologie criteria and evaluation techniques by which potential repository sites can be selected and evaluated. The studies of the ground water regimes underlying the Columbia Plateau are important, since the ground water pathway probably affords the fastest avenue of contact between the repository and the biosphere. Thus, our hydrologie studies have emphasized the gathering of data to characterize the ground water systems underlying the plateau and the modeling of such data so as to evaluate radiocontaminant transport potential to the biosphere. The hydrologie studies include reconnaissance regional studies within the Columbia Plateau and intensive local studies within the Pasco Basin where the Hanford Site is located. The Pasco Basin was selected for detailed study because of its unique structural significance in the region; i.e. the greatest accumulation of basalt rock appears to occur within the Pasco Basin.
During fiscal year 1978 as part of the regional studies, a bibliographic search of information ora the regional hydrology of the Columbia Plateau was completed L7-L This bibliography includes over 640 references. In addition, analysis of the regional data was initiated and work is well under way in adapting and checking out the three-dimensional ground water flow code to be used in ground water modeling of the Columbia Plateau. A model of unidimensional diffusion was completed to examine transport through a dry repository layer by diffusion. This model provides the diffusion time for contaminants to reach a permeable interbed and will be used as a base line for modeling other scenarios L8J-
The Pasco Basin studies were scoped to determine, in key areas, specific parameters that would allow modeling of this basin. The Pasco Basin appears to possess the smallest quantity of ground water compared to other basins within the Columbia Plateau. The basin has numerous thin beds of clay-rich sediment and saprolite which were deposited between the outpourings of Columbia River Basalt. This material has since plugged pore and fracture spaces causing slow ground water movement. This sealing has also reduced the ability of the rock to store water.
HYDROLOGIC STUDIES
As part of the Pasco Basin hydrology studies, a geohydrologic annotated bibliography of the Pasco Basin was completed [9] . This bibliography contains over 225 annotated references. The Pasco Basin hydrology studies required the drilling of several holes. As-builts and core hole histories of individual holes were prepared and reported after completion of each hole i10'11'1 . All drilling activities to date indicate that the basalts are present in a predictable pattern beneath the Hanford Site. Formation depths and thicknesses are consistent with previous estimates based on earlier data.
IAEA-SM-243/36 81
The newly drilled holes and existing holes were used to conduct various hydrologie tests. Rockwell Hanford Operations interpreted drill stem tests from Well RSH-1 in the Rattlesnake Hills. This analysis shows hydraulic conductivity values between 10-7 and 10-9 cm/s within the dense basalt flows themselves. Science Applications, Inc. conducted more sensitive tests and found hydraulic conductivities ranging from 10~7 to 10-13 cm/s in the zpnes tested. Lawrence Berkeley Laboratory completed multiple static pressure tests and fluid level measurements in various holes. They also obtained water samples from selected horizons. Their results appear to indicate a downward hydraulic gradient in several of the wells tested. Their results also appear to substantiate that some basalt flows act as barriers to vertical ground water flow. An apparent regional flow barrier (the Umtanum Ridge-Gable Mountain anticline) was also postulated .from the preliminary field results.
In subsequent years, the regional and Pasco Basin hydrologie studies will use the data being gathered in the field and through bibliographic studies to model the subsurface hydrologie systems and calculate transport times from a potential repository site to the biosphere under various conditions.
ENGINEERED BARRIERS
The emplacement of nuclear waste in a geologic repository may cause physicochemical perturbations to the surrounding environment The engineered barriers program attempts to identify from a physicochemical standpoint, the features of various barriers to transport of radioactive contaminants. The program looks at four potential barriers: the waste; the rock; the container ; andthe overpack. In addition, a borehole plugging system is analyzed as a final barrier once the repository is sealed and abandoned.To assess the effectiveness of such a multiple barrier system, one examines chemical changes which could lead to chemical reactions, both at the canister (phase transformations, dissolution) and outside the repository (dissolution/precipitation, and sorption/ desorption).
During the past fiscal year, work in this program was aimedat:
1. Defining the characteristics of various nuclear waste forms insofar as these are important to the long-term isolation of the waste in basalt L15J 5
2. Defining the geochemical environment expected near a basalt repository, and the effect of the waste form on the environment;

82 DEJU
3. Identifying the chemical characteristics and past history of the basalts and associated secondary minerals with emphasis on assessing the conditions that existed during and after their formation or emplacement C16] ;
4. Simulating the reactions that take place when nuclear wasteis emplaced in a basalt environment under repository conditions and identifying the resulting reaction products L17_19J 5
5. Thermodynamically modeling reactions in a basalt repository with emphasis on those cases where reaction rates are slow and needed experiments require long times to observe a significant alteration; and
6. Planning a borehole plugging program to demonstrate the applicability of plugging technology in a basalt environment.
Considerable progress has been made toward characterizing basalt and the alteration products found in basalt. Pétrographie studies, electronmicroprobe studies, X-ray diffraction studies and scanning electronmicroscopy studies have been made on core samples taken from various depths. In addition, preliminary computer simulations of the chemical environment in a basalt repository have been made from these findings.
The results of work completed during this report period indicate that there is a pattern to the alteration of the Columbia River Basalt. Vertical zonation of secondary minerals occurs with smectite dominating the upper portion of the stratigraphie column and the zeolite clinoptilolite and silica dominating the lower portion. A similar zonation occurs within individual vesicles found in the Grande Ronde Formation. One or more layers of smectite line vesicle walls and are followed in sequence by silica and/or clinoptilolite and clay. Different vesicles sometimes contain different portions of the alteration pattern and sometimes include phases not generally observed, such as erionite, halloysite, mordenite, analcite, and illite. This loss of historical information is probably due to the vesicles isolation from moving fluid; i.e., the fluid pathway leading to or exiting from the vesicles becomes blocked and mass transport must take, place by diffusion instead of advection.
Measurement of time-dependent Kd values for a number of radionuclides has continued. The radionuclides included 2Z6Ra, 75Se, 125I, 237Pu, 60Co, 85Sr, 137Cs, 95^Tc, and natural uranium. Sorption on Umtanum basalt, heulandite (a zeolite), and non- tronite (a clay) were measured at 25 degrees centigrade and ambient pressure.

IAEA-SM-243/36
In all cases except uranium, sorption experiments showed that, on a unit surface area basis, basalt adsorbs larger quantities of radionuclides than the clays, heulandite, and nontronite. This is true of selenium, radium, iodine, and cobalt as well.
Extensive progress has been made in isolating those interaction products resulting from waste-basalt-ground water reactions which are primary hosts for various cations and anions. Interaction experiments have been conducted with individual phases in the waste form and individual mineral constituents in the basalt to zero in on more specific identification of reaction products.
During fiscal year 1978, a plan for assessing the feasibility of backfilling a basalt repository with a reliable plug was drafted. The plan included an overview analysis and a synthesis of work to date in this field.
ENGINEERING TESTING
The engineering testing program conducted those tests required to define those engineering characteristics of basalt needed for conceptual engineering design studies and qualification of basalt as a storage medium for a nuclear waste repository. Engineering testing began with a literature review of laboratory and field studies of the engineering properties of basaltic rocks L20J .This study involved a search of published and unpublished data on the physical, thermal and mechanical properties of basaltic rocks. After this literature search was completed, and existing literature tabulated, samples from several core holes from the Hanford Site were subjected to extensive thermal and mechanical tests L21J . In addition, the testing program was designed to gain basic input data from numerical models, as well as to determine lateral and vertical variation of properties between individual basalt flows and within individual basalt flows.
In addition to laboratory studies, in situ demonstration programs will further examine the behavior of an entire basalt rock mass composed of rooms embedded in the central portion of a basalt flow. These data are aimed at examining the natural geologic material in situ. This is important because laboratory testing, among other things, fails to consider the presence of joints and joint filling.

84 DEJU
These in situ tests, as noted in the systems integration section, include experiments with heaters, followed by experiments with nuclear materials, where the combined effect of heat and radiation will be examined.
Results from these tests will be integrated by the systems integration program as they become available and used in the qualification of basalt as a repository medium for nuclear waste.
THE NEAR-SURFACE TEST FACILITY DESIGN AND CONSTRUCTION
During the early phase of the Basalt Waste Isolation Program, the need for in situ thermal and mechanical testing of basalt was identified. This immediate need of engineering data, to qualify basalt as an acceptable repository medium and to provide the design basis for repository design, could be met by construction of an in situ test facility. Detailed planning was initiated in October 1977. Construction of the facility began in June 1978, and the first two tests are now scheduled for startup in early 1980.
A site selection committee was established and criteria were developed for the selection of the site. A preliminary review of areas within and around Hanford indicated that potential sites could be found within Hanford itself. The site selected as meeting all of the criteria was located on the north face of Gable Mountain,within Hanford.
The Near-Surface Test Facility is located approximately 150 feet below the surface, and approximately 50 feet into the Pomona basalt. This allows a sufficient portion of basalt to remain undisturbed below the test room for the conduct of the test. The facility (Figure 3) will have a heater test area and a nuclear waste test area.
GABLE MOUNTAIN
FIG.3. Near-Surface Test Facility, Hanford Site. (Dimensions are in feet: 1 ft - 30.48 cm).
IAEA-SM-243/36 85
The heater test area will require the excavation of approximately 21 000 cubic yards of material from the 2 portal areas and the development of approximately 1 800 feet of underground workings. These will vary in size from an 8-foot diameter for the east access tunnel to 23-foot diameter for the time-scale test room. The nuclear waste test area will require the excavation of an additional 25 000 cubic yards of material from the portal area and another 1 200 feet of underground excavation.
REFERENCES
[1] TUCKER, G. B. and RIGBY, J. G., Bibliography of the Geology of the Columbia Basin and Surrounding Areas of Washington with Selected References to Columbia Basin Geology of Idaho and Oregon, RH0-BWI-C-10, Rockwell Hanford Operations, Richland, Washington (March 1978).
[2] LEDGERW00D, R. K., MYERS, C. W. , and CROSS, R. W., Pasco Basin Stratigraphie Nomenclature, RH0-BWI-LD-1, Rockwell Hanford Operations, Richland, Washington (May 4, 1978).
[3] ASAR0, F., MICHEL, H. V., and MYERS, C. W., A Statistical Evaluation of Some Columbia River Basalt Chemical Analyses, RH0-BWI-ST-3, Rockwell Hanford Operations, Richland, Washington (May 1978).
[4] COE, R. S., BOGUE, S., and MYERS, C. W., Paleomagnetismof the Grande Ronde (Lower Yakima) Basalt Exposed at Sentinel Gap: Potential Use of Stratigraphie Correlation,RH0-BWI-ST-2, Rockwell Hanford Operations, Richland, Washington (January 1978).
[5] BECK, M. E. Jr., ENGEBRETSON, D. C., and PLUMLEY, P. W., Magnetostratigraphy of the Grande Ronde Sequence, RH0-BWI-C-18, Rockwell Hanford Operations, Richland, Washington (July 1978).
[6] STAFF, Basalt Waste Isolation Program, Basalt Waste Isolation Program Annual Report - Fiscal Year 1978, RHO-BWI-78-100, Rockwell Hanford Operations, Richland, Washington (October 1978).
[7] TANAKA, H. H. and WILDRICK, L., Hydrologie Bibliography of the Columbia River Basalts in Washington, RHO-BWI-C-14, Rockwell Hanford Operations, Richland, Washington(July 1978).

86 DEJU
[8] GOLDSTEIN, P., HULTGREN, G. L., and NELSON, R. W., A Model of Contaminant Diffusion from a Finite Line Source in a Dense Basalt Stratum to an Overlying Permeable Interbed,RHO-BWI-C-3, Rockwell Hanford Operations, Richland,Washington (February 1978).
[9] SUMMERS, W. K. and SCHWAB, G. E., Bibliography of the Geology and Ground Water of the Basalts of the Pasco Basin, Washington, RHO-BWI-C-15, Rockwell Hanford Operations, Richland, Washington (June 1978).
[10] FENIX & SCISSON, INC., Hole History-Rotary Hole DC-3, Hanford, Washington, RH0-C-11, Rockwell Hanford Operations, Richland, Washington (October 1977).
[11] FENIX & SCISSON, INC., Hole History-Core Hole DC-10, Hanford, Washington, RH0-BWI-C-8, Rockwell Hanford Operations, Richland, Washington (December 1977).
[12] FENIX & SCISSON, INC., Hole Hi story-Rotary Hole DC-7, Hanford, Washington, RH0-BWI-C-1, Rockwell Hanford Operations, Richland, Washington (December 1977).
[13] FENIX & SCISSON, INC., Hole History-Core Hole DC-11, Hanford, Washington, RHO-BWI-C-9, Rockwell Hanford Operations, Richland, Washington (January 1978).
[14] FENIX & SCISSON, INC., Hole History-Rotary Hole DC-5, Hanford, Washington, RHO-BWI-C-7, Rockwell Hanford Operations, Richland, Washington (February 1978).
[15] McCARTHY, G. j . and GRUTZECK, M. W., Preliminary Evaluation ofthe Characteristics of Nuclear Wastes Relevant to Geologic Isolation in Basalt, RHO-C-12, Rockwell Hanford Operations, Richland, Washington (May 1978).-
[16] BARNES, М., Hanford and Columbia River Basin Basalts: X-RayCharacterization Before and After Hydrothermal Treatment, RHO-BWI-C-17, Rockwell Hanford Operations, Richland, Washington (June 30, 1978).
[17] McCARTHY, G. J. and SCHEETZ, В. E., High-Level Waste-Basalt Interactions, Annual Progress Report for the Period February 1, 1977 through September 30, 1977, RHO-BWI-C-2, Rockwell Hanford Operations, Richland, Washington (May 1978).
[18] Mc Ca r t h y , g . j ., s c h e e t z , b . e ., k o m a r n e n i , s ., b a r n e s , м.,SMITH, С. A., LEWIS, J. F., and SMITH, D. K., Simulated High- Level Waste-Basalt Interaction Experiments, First Interim Progress Report, RHO-BWI-C-12, Rockwell Hanford Operations, Richland, Washington (March 24, 1978).

IAEA-SM-243/36 87
[19] Mc Ca r t h y , g . j ., s c h e e t z , b . e ., k o m a r n e n i , s ., b a r n e s , м.,SMITH, C. A., SMITH, D. K., and LEWIS, J. F., Simulated High-Level Waste-Basalt Interaction Experiments, Second Interim Progress Report, RHO-BWI-C-16, Rockwell Hanford Operations, Richland, Washington (June 30, 1978).
[20] AGAPITO, J.F.T., HARDY, M. P., and ST. LAURENT, D. R., Geo-Engineering Review and Proposed Program Outline for the Structural Design of a Radioactive Waste Repository in Columbia Plateau Basalts, RHO-ST-6, Rockwell Hanford Operations, Richland, Washington (September 30, 1977).
[21] DUVALL, W. I., MILLER, R. J., and WANG, F. D., Preliminary Report on Physical and Thermal Properties of Basalt; Drill Hole DC-10; Pomona Flow-Gable Mountain, RHO-BWI-C-11, Rockwell Hanford Operations, Richland, Washington (May 1978).
DISCUSSION
P. J. SLIZEWICZ: Do you know at this stage what the Nuclear Regulatory
Commission (NRC) will require in order to license a storage facility in basalt?
R. A. DEJU: The NRC criteria for repositories of nuclear waste have not
been fully specified. A number of proposals together with the findings of the
Committee on Radioactive Waste Management entitled “Geological Criteria for
Repositories of Nuclear Waste" serve at present as a basis for repository
qualification criteria. It is expected that NRC criteria will be available in 1980.
At that stage we expect that a licence application for a basalt repository would
be required.
P.-E. AHLSTRÜM: I understand that the experiments to be carried out at
the Near-Surface Test Facility include tests with spent nuclear fuel. Could you
give some more details of these tests, such as the type of spent fuel, age and burn
up? What type of canister do you plan to use? What kind of backfill material
do you have in mind?
R. A. DEJU: At that time we expect to use 12 canisters of spent fuel in
three experimental configurations. The fuel will be emplaced in the boreholes with
no backfill material. We expect to obtain the fuel from the Turkey Point reactor
in Florida after five years of cooling. The fuel will be packaged in the EMAD
Facility at the Nevada Test Site of the United States Department of Energy.
When emplaced at the Near-Surface Test Facility, each canister would have a power
output of less than 1 kW.
K. G. ERIKSSON: Are your conceptual studies for a basalt repository near
Hanford being carried out for the entire American programme of nuclear
facilities or for only a part of it?
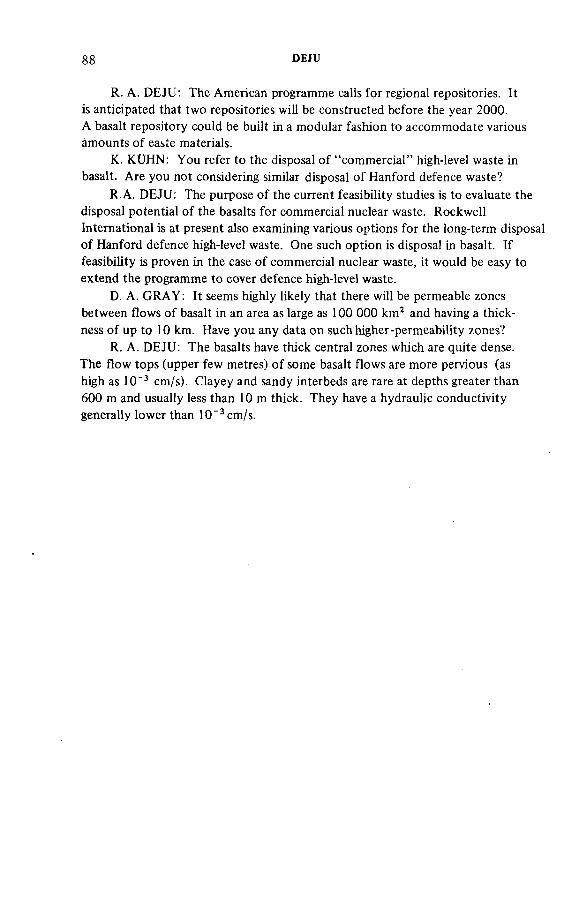
88 DEJU
R. A. DEJU: The American programme calls for regional repositories. It
is anticipated that two repositories will be constructed before the year 2000 .
A basalt repository could be built in a modular fashion to accommodate various
¿mounts of easte materials.
K. KÜHN: You refer to the disposal of “commercial” high-level waste in
basalt. Are you not considering similar disposal of Hanford defence waste?
R.A. DEJU: The purpose of the current feasibility studies is to evaluate the
disposal potential of the basalts for commercial nuclear waste. Rockwell
International is at present also examining various options for the long-term disposal
of Hanford defence high-level waste. One such option is disposal in basalt. If
feasibility is proven in the case of commercial nuclear waste, it would be easy to
extend the programme to cover defence high-level waste.
D. A. GRAY : It seems highly likely that there will be permeable zones
between flows of basalt in an area as large as 100 000 km2 and having a thick
ness of up to 10 km. Have you any data on such higher-permeability zones?
R. A. DEJU: The basalts have thick central zones which are quite dense.
The flow tops (upper few metres) of some basalt flows are more pervious (as
high as 10~3 cm/s). Clayey and sandy interbeds are rare at depths greater than
600 m and usually less than 10 m thick. They have a hydraulic conductivity
generally lower than 10“ 3 cm/s.

IAEA-SM-243/14
GEOSCIENTIFIC INVESTIGATIONS IN
THE ABANDONED IRON ORE MINE KONRAD
FOR SAFE DISPOSAL OF CERTAIN
RADIOACTIVE WASTE CATEGORIES
W. BREWITZ
Institut für Tieflagerung Braunschweig
der Gesellschaft für Strahlen- und Umweltforschung mbH
Munich
U. LOSCHHORN
Kernforschungszentrum Karlsruhe GmbH,
Karlsruhe,
Federal Republic of Germany
Abstract
GEOSCIENTIFIC INVESTIGATIONS IN THE ABANDONED IRON ORE MINE KONRAD FOR SAFE DISPOSAL OF CERTAIN RADIOACTIVE WASTE CATEGORIES.
Besides the disposal of high-active waste in a salt formation the national policy of the Federal Republic of Germany provides for a second underground storage facility for non- a-emitting and low-active waste. Due to the short decay times of such wastes the demands made on the geological barrier are in some respect different, in particular as regards long-term stability and impermeability to liquids. Within the 1000-year-phase all wastes will have reached a concentration with a content of radionuclides far below that of a uranium deposit. The abandoned iron ore mine Konrad (Lower Saxony) has some exceptional geological features which make it a very good choice for a radioactive waste repository. The mine is 1200 m deep. Stopes and galleries are extremely dry. The hanging rock formations are mainly claystones. The mining installations are of modern design. The geological, hydrogeological and geophysical investigations have to examine in detail the covering claystone formations for their extension and mineralization, the origin and the age of the mine’s seepage water as well as the mechanical stability of the underground cavities during and after the operational period. Via radiological investigations a catalogue of various low-active waste types, the waste volumina and the total activities accumulating over a period of 30 years is being established. For a safety assessment the hazard indices of a uranium ore deposit containing 0.2 wt% U30 8 and a waste repository corresponding to the above figures were compared. The research programme has not been terminated yet since it is being financed by the Bundesminister fürForschung und Technologie (BMFT) of the Federal Republic of Germany until the end of 1981. In 1978 and 1979 the work is being performed partly under a research contract between the European Community and the Gesellschaft für Strahlen- und Umweltforschung mbH, Munich (GSF) in co-operation with the Kernforschungszentrum Karlsruhe GmbH (KfK).
89

90 BREWITZ and LÔSCHHORN
The Konrad iron ore mine is situated near the city of Salzgitter in the
eastern part of Lower Saxony, Federal Republic of Germany. The mine belongs
to an iron ore district where there has been mining activity for centuries. The
sedimentary ores appear in various geological formations of Cretaceous and
Jurasssic age. Due to the Mesozoic folding with its Saxonian type of fold
structures and to the diapir folding caused by salt domes, at some places the
Cretaceous iron ores have several outcrops in this area.
The Konrad iron ore is a part of the Upper Oxfordium (Jurassic) and has no
outcrops in the area at all. The deposit is completely covered by Cretaceous
formations and was unknown until 1933, when an intensive drilling programme
was started for oil. Between 1933 and 1962 about 147 prospecting holes, totalling
some 166 000 metres, were drilled. As the result of this exploration venture,
only one iron mine, the Konrad mine, was developed. In 1960 the main shaft
was sunk down to its final depth of 1232 m. In late 1962 the ventilation shaft,
999 m deep, was completed. Both shafts were connected by the first mine level
in January 1963. Up to 1976, 6.6 Mt of ore were hauled and a total cavity
volume of 2.5 X 10⁶ m3 was opened for production.
The iron content of the ore cuts about 31 to 33 wt% Fe. The silica makes
up 15 wt% of which approximately 10 wt% is free silica. There were severe
difficulties in blending the oolitic and calcareous ore with high-grade ores of the
hematite type. Production was terminated in September 1976. To avoid the,
closure of the mine, which had some good aspects for the disposal of radioactive
wastes, a joint research programme was started by the GSF and the KfK on
behalf of the Ministry of Research and Technology of the Federal Republic of
Germany. Geoscientific, technical and radiochemical investigations are in
progress and will be completed by the end of 1981.
Regarding the FRG’s national policy on the disposal of nuclear wastes in
geological formations, this feasibility study has a prime distinct task. It has
to be determined whether the Konrad mine has all the necessary features to
provide for the safe disposal of low-active wastes as well as for suitable com
ponents from operating and decommissioned power plants.
There are three good reasons why the Konrad mine was chosen for such
a feasibility study:
(1) The mine workings are 800 to 1200 m below surface. Except for
2 shafts, there are no conduits, or any other man-made connections
between the biosphere and the ore deposit. The ore bearing
formation has no outcrops.
1. INTRODUCTION
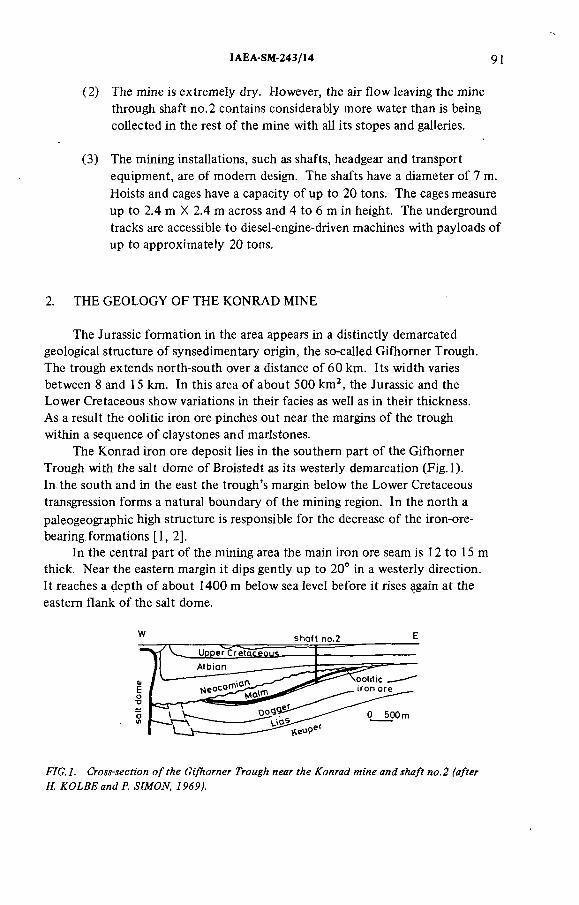
IAEA-SM-243/14 91
(2) The mine is extremely dry. However, the air flow leaving the mine
through shaft no. 2 contains considerably more water than is being
collected in the rest of the mine with all its stopes and galleries.
(3) The mining installations, such as shafts, headgear and transport
equipment, are of modern design. The shafts have a diameter of 7 m.
Hoists and cages have a capacity of up to 20 tons. The cages measure
up to 2.4 m X 2.4 m across and 4 to 6 m in height. The underground
tracks are accessible to diesel-engine-driven machines with payloads of
up to approximately 20 tons.
2. THE GEOLOGY OF THE KONRAD MINE
The Jurassic formation in the area appears in a distinctly demarcated
geological structure of synsedimentary origin, the so-called Gifhomer Trough.
The trough extends north-south over a distance of 60 km. Its width varies
between 8 and 15 km. In this area of about 500 km2, the Jurassic and the
Lower Cretaceous show variations in their facies as well as in their thickness.
As a result the oolitic iron ore pinches out near the margins of the trough
within a sequence of clay stones and marlstones.
The Konrad iron ore deposit lies in the southern part of the Gifhomer
Trough with the salt dome of Broistedt as its westerly demarcation (Fig.l).
In the south and in the east the trough’s margin below the Lower Cretaceous
transgression forms a natural boundary of the mining region. In the north a
paleogeographic high structure is responsible for the decrease of the iron-ore-
bearing formations [1, 2].
In the central part of the mining area the main iron ore seam is 12 to 15m
thick. Near the eastern margin it dips gently up to 20° in a westerly direction.
It reaches a depth of about 1400 m below sea level before it rises 9gain at the
eastern flank of the salt dome.
shaft no. 2
FIG. I. Cross-section of the Gifhorner Trough near the Konrad mine and shaft no.2 (after H. KOLBEandP. SIMON, 1969j.

92 BREW1TZ and LÔSCHHORN
The Jurassic formations in the trough were faulted during several
tectonic phases. Faults and joints are mainly orientated east-westerly
and north-westerly to northnorth-easterly. Both Jurassic and lower
Lower Cretaceous formations were intensively displaced along east-westerly
directed faults [ 1 ]. In the Konrad mine the Bleckenstedter Sprung, a down
throw, separates the northern mining section from the southern section 355 m
horizontally and 100 m vertically. In the Albian and the Upper Cretaceous no
evidence was found of the existence of such faults.
A very important geological feature is the transgression of Lower Cretaceous
sediments over sediments of the Gifhomer Trough. The Jurassic sequence is covered
by Neocomian claystones and marlstones, which are 640 m to 455 m thick.
Together with the Jurassic claystones they form a geological barrier of uniform
petrology [2]. Measuring 800 to 1000 m, these formations are not only non-aquifers
but also an effective barrier against water inflows from the surface or the ground
water horizons.
3. GEOLOGICAL AND HYDROGEOLOGICAL INVESTIGATIONS
A favourable hydrogeological setting is crucial for any underground waste
depository. On the one hand, the over- and underlying formations have to be
effective geological barriers; on the other hand, the host rock formation has to
be almost dry. With this in mind, two aspects were thoroughly investigated,
the petrology of the hanging formations and the age and origin of the mine waters.
Concerning the geological barrier, evaluation of the exploration boreholes
and the Schlumberger logs show positive results. The claystones of the Neocomian
are almost free of limestone-, siltstone- and sandstone-interbeds. Tectonic
faulting has affected these formations only little, and displacements of great
extent do not exist.
The sequence of the claystone formations (see Fig.2) reveals lithographic
differences in respect to the mineral content and the grain sizes of the various
stratigraphie units [4]. In the Lower Cretaceous about 5 wt% of the mineral
grains are smaller than 63 fim and 40 to 50 wt% are smaller than 2 цт. In the
Jurassic claystones this proportion is nearly inverse. About 40 wt% of the
material is coarser than 2 цт and smaller than 63 дт. The 2 ^т -fraction was
used for the determination of the clay minerals by DTA and X-ray diffraction.
The claystones consist of quartz, calcite, pyrite, feldspar, cristobalite,
zeolites and varying quantities of clay minerals such as kaolinite, montmorillonite
and hydromica and mixed-layer minerals. In particular the amounts of
montmorillonite and mixed-layer minerals are of great importance since they
have a tendency to swell if water is present. At the same time, they enlarge
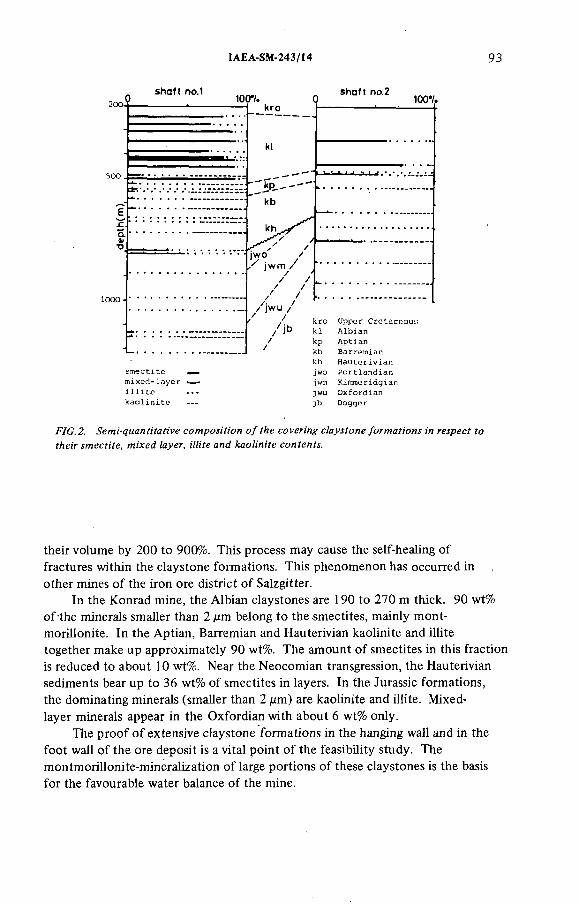
IAEA-SM-243/14 93
shaft no.1200.
1000
100*/. shaft no.2
kro
kb
kh .
jwo / / jwm /
/ /
/jwu // /
/ j b//
100*/.
smectite mixed-layer «— » illitckaolinite —
kro Upper Cretaceouskl Albiankp Aptiankb Barremiankh Hauterivianjwo Portlandianjwm Kirraneridgianjwu Oxfordianjb Dogger
FIG.2. Semi-quantitative composition of the covering clay stone formations in respect to their smectite, mixed layer, illite and kaolinite contents.
their volume by 200 to 900%. This process may cause the self-healing of
fractures within the claystone formations. This phenomenon has occurred in
other mines of the iron ore district of Salzgitter.
In the Konrad mine, the Albian claystones are 190 to 270 m thick. 90 wt%
of the minerals smaller than 2 дт belong to the smectites, mainly mont-
morillonite. In the Aptian, Barremian and Hauterivian kaolinite and illite
together make up approximately 90 wt%. The amount of smectites in this fraction
is reduced to about 10 wt%. Near the Neocomian transgression, the Hauterivian
sediments bear up to 36 wt% of smectites in layers. In the Jurassic formations,
the dominating minerals (smaller than 2 цт) are kaolinite and illite. Mixed-
layer minerals appear in the Oxfordian with about 6 wt% only.
The proof of extensive claystone formations in the hanging wall and in the
foot wall of the ore deposit is a vital point of the feasibility study. The
montmorillonite-mineralization of large portions of these claystones is the basis
for the favourable water balance of the mine.

94 BREWITZ and LÔSCHHORN
0m
— - — • nк.4
\V
>
\4
' V0 < * ^
\N
4 (4
44
\ 4 Ns AOOm
\4.
\\
N•
N\
•4■4
V i\
t
\
o4 о
V \\
\\
\к
, r
•\ . 1
\• 0 ■ a
1 *1 X)
L i * \1
K* M9 2- 'Ç a 2* Na1 "1 e r
» I •1
• • • I \I*
( 800m,1 О
Ir| *
II
\1
\ili
>| «
1Гi 1
T '11200m
1 1r,3 11I '*( m g/1)rw
FIG.3. Anion/cation contents of the underground waters in relation to the depths of the samples.
In spite of the hydrogeological barrier, there is still a small inflow of water
in the mine. Attempts are being made to determine the hydraulic potential
and the efficacy of the water pathways through the iron ore and its neighbouring
rock formations by hydrochemical analyses and water volume measurements.
The assessment of the age and the origin of the seepage water is an important result.
Today 8 ltr/min are being collected within the entire mine, except for
shaft no. 2, the ventilation shaft. Depending on the moisture content of the
ventilation air, the rate of the air flow and the climate at the surface, about
30 to 50 ltr/min collect in shaft no.2. On the other hand, shaft no.l is almost
dry. With some degree of certainty, part of the seepage water is surface water
which was pumped into the mine for operational purposes. The rest of water
comes from the rock formation itself.
At places where there is little doubt about the origin of the water, a hydro
chemical testing programme was carried out (Fig.3). The Li+, K+, Mg++, Ca++
and Na++-contents in the water from the various formations show sharp increases,
especially in the upper part of the geological sequence down to 470 m. Water
from the Upper Cretaceous contains approximately 5400 mg/1 NaCl and from
the Lower Albian up to 160 g/1 NaCl. Below this depth there is only a slight rise

IAEA-SM-243/14 95
in the mineral content. Water found in the oolitic iron ore of the Kimmeridgian
carries up to 190 g/1 NaCl. The SO4 "-content increases with the depth to an
asymptotic limit, which is only little higher than in the surface water. The HCOJ-
content decreases slightly with the depth.
The analyses proved that there is little difference between the mineralization
of the mine water and other water of deep-lying formations in the northwestern
part of the FRG. This water is fossil and was withdrawn from the biosphere
millions of years ago [3]. The fact that the mineral content of the water did
not change during the investigation period demonstrates the closed system the
underground water belongs to. There is no decrease of the seepage water’s
salinity as there would be if a communication between surface water and mine
water existed.
A spot test on the 3H-content of the seepage water confirmed an age older
than 20 years.
For the identification of the water’s source and the extent of a possible
water path, tracing elements were assayed. A first testing series showed certain
results in respect to Br"- and J "-concentrations; 640—1100 mg/1 Br" and
22—34 mg/1 J" are specific for the seepage water in the mine. All other water
samples assayed showed far smaller amounts of these halogens. Such high
Br/J-concentrations only exist in saline water in the neighbourhood of oil fields.
As far as the Konrad area is concerned, there are oil-bearing formations in the
Wealdian, Valanginian and Dogger.
None of those formations are intersected by the mining operations. They
belong to the lower part of the geological sequence, below the covering Lower
Cretaceous claystone formations. A hydraulic connection, if there is any,
between those formations and the iron ore is no risk to the depository, as the
investigations have proved. The claystones of the Lower Cretaceous cover these
and prevent an interchange of water between the surface and the deeper
formations. The high sorption capacity of the claystones gives additional
radiochemical protection.
4. GEOMECHANICAL AND GEOPHYSICAL INVESTIGATIONS
The overall qualification of a mine for underground waste disposal also
depends on the problem of rock mechanics. The mechanical behaviour of a rock
formation is a significant parameter for the mine layout and operational safety.
In an underground waste repository galleries and any other open rooms have
to be very stable. The depression of the surface caused by gravity and compression
of the mine workings has to be minimized. Even the seismic risk has to be considered.
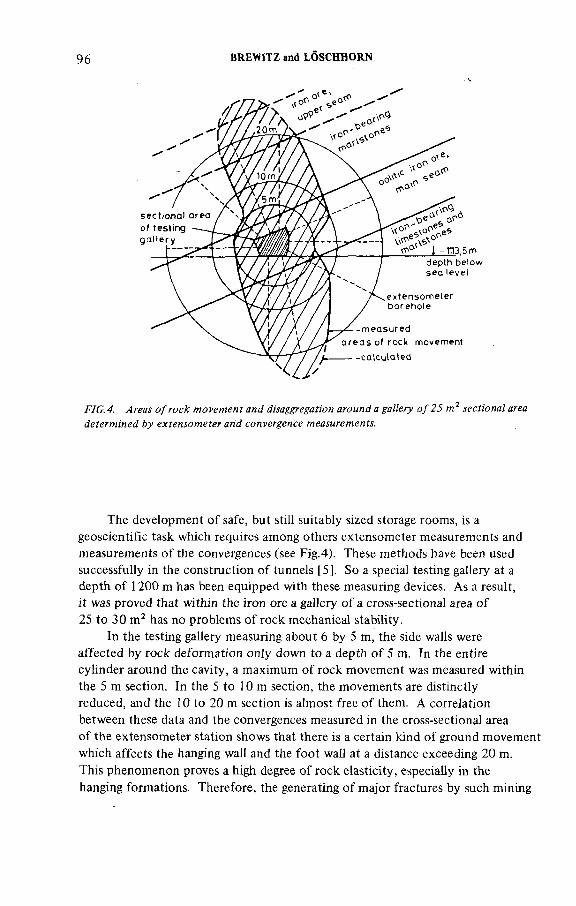
96 BREWITZ and LÓSCHHORN
FIG.4. Areas of rock movement and disaggregation around a gallery of 25 m 2 sectional area determined by extensometer arid convergence measurements.
The development of safe, but still suitably sized storage rooms, is a
geoscientifie task which requires among others extensometer measurements and
measurements of the convergences (see Fig.4). These methods have been used
successfully in the construction of tunnels [5]. So a special testing gallery at a
depth of 1200 m has been equipped with these measuring devices. As a result,
it was proved that within the iron ore a gallery of a cross-sectional area of
25 to 30 m2 has no problems of rock mechanical stability.
In the testing gallery measuring about 6 by 5 m, the side walls were
affected by rock deformation only down to a depth of 5 m. In the entire
cylinder around the cavity, a maximum of rock movement was measured within
the 5 m section. In the 5 to 10m section, the movements are distinctly
reduced, and the 10 to 20 m section is almost free of them. A correlation
between these data and the convergences measured in the cross-sectional area
of the extensometer station shows that there is a certain kind of ground movement
which affects the hanging wall and the foot wall at a distance exceeding 20 m.
This phenomenon proves a high degree of rock elasticity, especially in the
hanging formations. Therefore, the generating of major fractures by such mining
IAEA-SM-243/14 97
activities seems to be unlikely. The operational safety and the long-term stability
of those galleries will not be endangered if they are developed at a distance of
about 40 m apart.
The elastic properties of the covering rock formations were confirmed by
a precision survey of the surface. The lowering of the surface runs steadily. Its
speed decreases gradually after production has ceased. The depression is uniform
and shows no sign of any irregularities which might be caused by an uncontrolled
collapse of abandoned workings and the subsequent fracturing of the covering
rock formations.
For the exact evaluation of the rock mechanics in and around the mine,
in situ stress measurements are being carried out. At the test site, two methods
are being used. The absolute stresses in the interior of the oolitic iron ore will
be determined by bi- and triaxial strain gauges in boreholes, a stress relief method.
The regional stress field will be measured by hydraulic fracturing tests at various
points in the mine. Both methods are accompanied by laboratory tests, mainly
tension and pressure tests on iron ore and claystone samples.
The deformation and elasticity moduli are important parameters for a
mechanical safety assessment of the mine.
The propagation of artificially generated elastic waves within the entire
geological system of the mine makes it possible to determine the elastic constants
(Young’s and shear moduli) by seismic methods. A result so far is the
determination of the travel time of seismic body waves within the mine. In the
north-south direction the velocity of waves is greater than it is in the east-west
direction. This proves a certain anisotropism in respect to the elasticity of the
rock masses which may be caused by the tectonic system. The east-west-running
fault zones seem to have only little effect on the propagation velocity. This
differs in the series of north-south striking joints which, in particular, have to
be investigated as regards their attenuation factor.
A network of seismic stations has been installed in the mine for detection
and localization of seismic events. It has to be determined if there are any
connections between primary events, such as earthquakes, explosions etc., and
secondary reaction within the underground workings. In addition, the tectonic
stability of the mine and eventually the long-term trend of tectonic movement
along faults and fractures will be measured by geophysical tilt meters. Periodic
events, such as the waves of the Earth’s tides, will also be registered. First data
are expected by the middle of next year.
5. RADIOLOGICAL INVESTIGATIONS
The radiological investigations are being performed for all kinds of waste
not being produced in a national reprocessing facility. These waste categories
98 BREW1TZ and LÔSCHHORN
come from operating and decommissioned nuclear power plants, from nuclear
research centres and central depots operated by the various States of the
Federal Republic of Germany. The following considerations are based on the
quantities of waste from the operation of 12 nuclear power plants (6 BWR and
6 PWR, 1000 MW(e) per reactor).
The wastes from operating nuclear power plants consist of metallic
activated or contaminated components which are replaced during routine
maintenance or because of wear, and of concentrates, resins, filter elements and
activated carbon which are products of the water-processing cycle. Some
types, such as contaminated papers, cotton waste and clothes originate from the
general operation of the power plants. The dominant nuclides in all of these
wastes are Cs- and Co-isotopes; sometimes the content of 3H is worth considering,
For the calculations it was assumed that the waste is packed in 400-ltr drums
or concrete shieldings (VBA), depending on the type of waste and the activity
of the inventory. The matrix material will be cement.
Table I shows the numbers of containers per year, the activity, the nuclide
inventory and the percentage of the main nuclides as part of the total
activity [6 , 7].
In respect to the numbers of containers and a possible storage room of
600000 m3, an operating time for the repository Konrad of 30 years was
calculated. The total activities of the various waste categories were determined
taking into consideration the decay of the nuclides during this period [8].
In order to estimate the hazards resulting from the radioactive waste and
the period of time involved, the hazard indices of the radioactive waste within
the repository and the hazard index of uranium ore equivalent to the volume
of the waste can be compared. This is a conservative comparison, since the
uranium ore deposits are near the earth’s surface and there are no comparable
barriers to those of a repository in deep geological formations.
The hazard index is defined as the ratio of activity A of the radionuclide
inventory and the MPC by ingestion or inhalation [9]
AHazard index (HI) = --- (nr)
MPC
With the hazard index of the nuclides only a risk assessment is incomplete
since the physical barriers between the repository and the biosphere have to be
taken into account.
Assessing the radiological risk to man via ingestion of radionuclides spread
out into the biosphere and despite the geological barrier the ingestion-hazard
index of the waste is lower than the hazard index from a comparable uranium
ore layer.
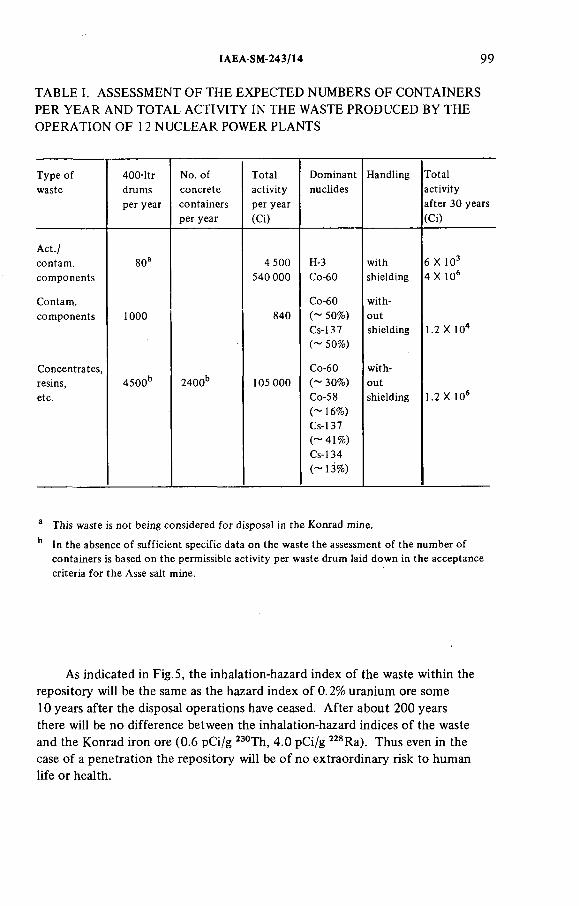
IAEA-SM-243/14 99
TABLE I. ASSESSMENT OF THE EXPECTED NUMBERS OF CONTAINERS
PER YEAR AND TOTAL ACTIVITY IN THE WASTE PRODUCED BY THE
OPERATION OF 12 NUCLEAR POWER PLANTS
Type of waste
400-ltr drums per year
No. of concrete containers per year
Total activity per year (Ci)
Dominantnuclides
Handling Total activity after 30 years (Ci)
H-3 with 6 X 10³Co-60 shielding 4 X 10⁶
Co-60 with(~ 50%) outCs-137 shielding 1.2 X 10⁴(~ 50%)
Co-60 with(~ 30%) outCo-58 shielding 1.2 X 10⁶(~16%)Cs-137(-41% )Cs-134(-13% )
Act./contam.components
Contam.components
Concentrates,resins,etc.
80
1000
4500° 2400°
4 500 540 000
840
105 000
a This waste is not being considered for disposal in the Konrad mine.
b In the absence of sufficient specific data on the waste the assessment of the number of containers is based on the permissible activity per waste drum laid down in the acceptance criteria for the Asse salt mine.
As indicated in Fig.5, the inhalation-hazard index of the waste within the
repository will be the same as the hazard index of 0 .2% uranium ore some
10 years after the disposal operations have ceased. After about 200 years
there will be no difference between the inhalation-hazard indices of the waste
and the Konrad iron ore (0.6 pCi/g 230Th, 4.0 pCi/g 228 Ra). Thus even in the
case of a penetration the repository will be of no extraordinary risk to human
life or health.

100 BREWITZ and LÔSCHHORN
FIG. 5. Relative hazard indices of the radionuclides in the waste from nuclear power plants standardized to the hazard index of uranium ore (0.2%), permissible activity-inhalation per year.
6. SUMMARY
Although the various geoscientific investigations are not finished yet, the
results so far show that the Konrad mine has some outstanding geological
features as required for safe disposal of radioactive wastes.
The iron ore formation is extremely dry. Seepage water is no threat to
the waste disposal operation and the repository itself. The construction of
stable underground storage rooms which are sufficiently large in volume is
possible. Galleries containing wastes in drums or contaminated components
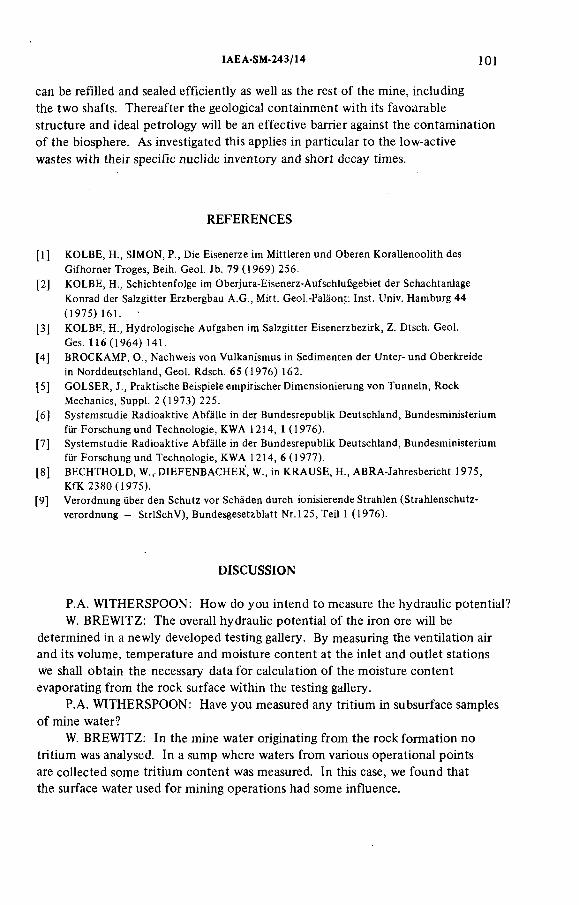
IAEA-SM-243/14 101
can be refilled and sealed efficiently as well as the rest of the mine, including
the two shafts. Thereafter the geological containment with its favourable
structure and ideal petrology will be an effective barrier against the contamination
of the biosphere. As investigated this applies in particular to the low-active
wastes with their specific nuclide inventory and short decay times.
REFERENCES
[1] KOLBE, H., SIMON, P., Die Eisenerze im Mittleren und Oberen Korallenoolith des Gifhorner Troges, Beih. Geol. Jb. 79 (1969) 256.
[2] KOLBE, H., Schichtenfolge im Oberjura-Eisenerz-Aufschlufigebiet der SchachtanlageKonrad der Salzgitter Erzbergbau A.G., Mitt. Geol.-Palàont. Inst. Univ. Hamburg 44 (1975) 161. ■
[3] KOLBE, H., Hydrologische Aufgaben im Salzgitter Eisenerzbezirk, Z. Dtsch. Geol.Ges. 116(1964) 141.
[4] BROCKAMP, O., Nachweis von Vulkanismus in Sedimenten der Unter- und Oberkreide in Norddeutschland, Geol. Rdsch. 65 (1976) 162.
[5] GOLSER, J., Praktische Beispiele empirischer Dimensionierung von Tunneln, Rock Mechanics, Suppl. 2 (1973) 225.
[6] Systemstudie Radioaktive Abfalle in der Bundesrepublik Deutschland, Bundesministerium für Forschung und Technologie, KWA 1214, 1 (1976).
[7] Systemstudie Radioaktive Abfalle in der Bundesrepublik Deutschland, Bundesministerium für Forschung und Technologie, KWA 1214, 6 (1977).
[8] BECHTHOLD, W., DIEFENBACHER, W., in KRAUSE, H., ABRA-Jahresbericht 1975, KfK 2380(1975).
[9] Verordnung über den Schütz vor Schàden durch ionisierende Strahlen (Strahlenschutz- verordnung - StrlSchV), Bundesgesetzblatt Nr.125, Teil 1 (1976).
DISCUSSION
P.A. WITHERSPOON: How do you intend to measure the hydraulic potential?
W. BREWITZ: The overall hydraulic potential of the iron ore will be
determined in a newly developed testing gallery. By measuring the ventilation air
and its volume, temperature and moisture content at the inlet and outlet stations
we shall obtain the necessary data for calculation of the moisture content
evaporating from the rock surface within the testing gallery.
P.A. WITHERSPOON: Have you measured any tritium in subsurface samples
of mine water?
W. BREWITZ: In the mine water originating from the rock formation no
tritium was analysed. In a sump where waters from various operational points
are collected some tritium content was measured. In this case, we found that
the surface water used for mining operations had some influence.
102 BREWITZ and LÔSCHHORN
P.A. WITHERSPOON: How do you plan to make the water volume
measurements you mention?
W. BREWITZ: The water volume measurements are performed by metering
all pumping water and the fresh water used for mining operations. In addition,
the moisture content of the ventilation air is checked at various points of the
mine, together with the condensed water in the ventilation shaft. The water
balance gives a fair picture of the water potential of the iron ore since there
are no groundwater horizons de watering into the mine.
P. PEAUDECERF: May I ask you to give further details of the manner
in which the hydraulic potential is measured? Will the value which you measure
not be greatly distorted by the earlier mine operation? I would think that it is
necessary to know the natural, unperturbed potential in order to evaluate any
subsequent migrations.
W. BREWITZ: As I have explained, the ventilation test in a fresh gallery
will not be disturbed by any mining operation. Except for an inlet and outlet
for ventilation air, the gallery will be sealed off from the rest of the mine by a
concrete wall. As the testing site is situated at a fair distance from other
workings, there will be no groundwater movement in the surrounding rocks which
could possibly affect the in situ measurements.
DISPOSAL IN DEEP GEOLOGICAL FORMATIONS:
THERMAL ASPECTS
(Session VII)

L.B. NILSSON
Sweden
Chairman

IAEA-SM-243/79
THE APPLICATION OF FIELD DATA FROM
HEATER EXPERIMENTS CONDUCTED AT
STRIPA, SWEDEN, TO PARAMETERS FOR
REPOSITORY DESIGN
M. HOOD
Department of Materials Science
and Mineral Engineering,
University of California,
Berkeley, California
H. CARLSSON, P.H. NELSON
Earth Sciences Division,
Lawrence Berkeley Laboratory,
Berkeley, California,
United States of America
Abstract
THE APPLICATION OF FIELD DATA FROM HEATER EXPERIMENTS CONDUCTED AT STRIPA, SWEDEN, TO PARAMETERS FOR REPOSITORY DESIGN.
Experiments currently in progress are designed to yield information about both the near- field and the far-field effects of thermomechanical loading of an in situ, granitic rock mass. Electrically heated canisters, constructed to represent high-level radioactive waste canisters, are emplaced in boreholes from excavations some 340 m below the surface. Thermally induced spelling along the heater borehole wall, a near-field effect, has been monitored and two types of spalling, one serious and one not serious, have been identified. A suggested failure criterion for the serious type of spalling is Omax > C 0 (where amax is the maximum induced compressive stress at the borehole wall and C0 is the uniaxial compressive strength of the rock). In these experiments this criterion was exceeded, and gross failure at the wall occurred when the equivalent power to the heater was increased beyond 5 kW. The far-field effects of the applied loading are investigated by measuring the temperature, displacement and stress fields and then comparing the results with predictions which were made based on linear thermoelastic theory. The results show that the dominant mode of heat transfer through the rock is by conduction and therefore that predictions of the temperature field are made readily using simple calculations. However, displacements and stresses within the rock mass are measured to be only one half or less of the values predicted. Two reasons for this major discrepancy are suggested. Work to verify this result is in progress but the implications are profound since, for a given canister power level and canister spacing, the magnitude of the stresses induced in the rock mass would be reduced by at least a factor of two. Alternatively, given a maximum canister power level, canister spacing within the repository could be halved for the same applied stress loading.
105

106 HOOD et al.
The preferred method for disposal of radioactive waste
materials is burial in deep underground repositories [1,2].The main requirement for such repositories is that they be capable of isolating these waste materials from the biosphere for very long time periods. Two main prerequisites in the selection of sites for repositories will be that the sites have been, and will remain, geologically stable; and that groundwater flow through the rock, which could act as a transport medium for
radionuclides, is low, and will remain low, during a thermal perturbation such as would be induced in the rock by the decay of radioactive wastes. Cook [3] in an overview summary has examined, from a theoretical viewpoint, the characteristics desirable in a repository in hard rock. Cook recommends that repositories should be sited at depths greater than 0.5 km but less than 2.0 km below the surface and that the uniaxial compressive strength of the rock should be of the order of 200 MPa. To obviate the occurrence of faulting and to retard ground
water flow he recommends further that the horizontal component of stress be greater than two thirds that of the vertical stress and that the maximum value of this stress difference should be 25 MPa.
This paper focuses on two specific considerations affecting repository design: firstly, the limits on canister power levelsin the near field as imposed by decrepitation of the borehole wall and secondly, the ability to predict the thermally induced stresses and their impact upon far-field effects. Both problems are discussed in terms of recent field results from the experimental program at Stripa.
INTRODUCTION
REPOSITORY DESIGN CONSIDERATIONS
a) Near Field. A desirable feature of a repository, and a feature which probably will be a prerequisite for any future repository in the United States, is an assurance of the ability to retrieve canisters from the boreholes in which they are em-
placed, should the need arise during a reasonable time period after burial. In order to be able to give this assurance probably it will be necessary to ensure.that thermal spelling of the rock at the borehole wall does not occur to any significant extent. This is likely to be a design requirement for the repository regardless of whether the borehole is protected by a liner which could be inserted between the canister and the
rock wall.
\

IAEA-SM-243/79 107
The main factors tending to cause rock failure at the borehole wall are the induced compressive tangential and axial stresses acting at this surface. These stresses are given by
aE T , n3 az = a e = T ^ J x 10
where a = axial component of stress (MPa)ae = tangential component of stress (MPa) a = linear coefficient of thermal expansion (°C“ )T = temperature at borehole wall (°C)
v = Poisson's RatioE = Young's Modulus (GPa)
If these stresses exceed some accepted failure criterion, such as the Mohr-Coulomb criterion, then the rock is likely to fail. Experience with mining in deep-level hard rock formations has shown that a reliable criterion for rock failure around small circular openings is for the induced hoop stress to exceed the uniaxial compressive strength of the rock. Although this experience is derived from situations where the induced stresses are mechanical, there is no reason to expect that thermomechanical stresses would produce a significantly different result.
From the equation above, the stresses induced at the canister borehole wall are functions of the rock temperature which, in •turn, for a given canister-borehole geometry and rock thermal conductivity, are dependent on the power level of the canister.
Thus, prevention of major rock spelling is likely to be the dominant factor in the determination of maximum canister power levels and thus, since this power is a strong function of the age of the material, this factor will determine the minimum
age of the wastes prior to burial. The range of heater power levels and geometries used in Stripa experiments was selected to study the spelling phenomena in detail. Thus the experiments are designed so that the maximum induced compressive stress at the borehole wall is in excess of the uniaxial compressive
strength of the rock for at least one of the tests.
The minimum spacing of canisters within a repository follows directly once the basic design criteria for the far-field are specified and the maximum canister power level is determined,
since this power level and the spacing will determine the total thermal loading of the rock surrounding the repository.
b) Far Field. It can be shown using the theory of linear
thermoelasticity that as a result of the decay of radioactive
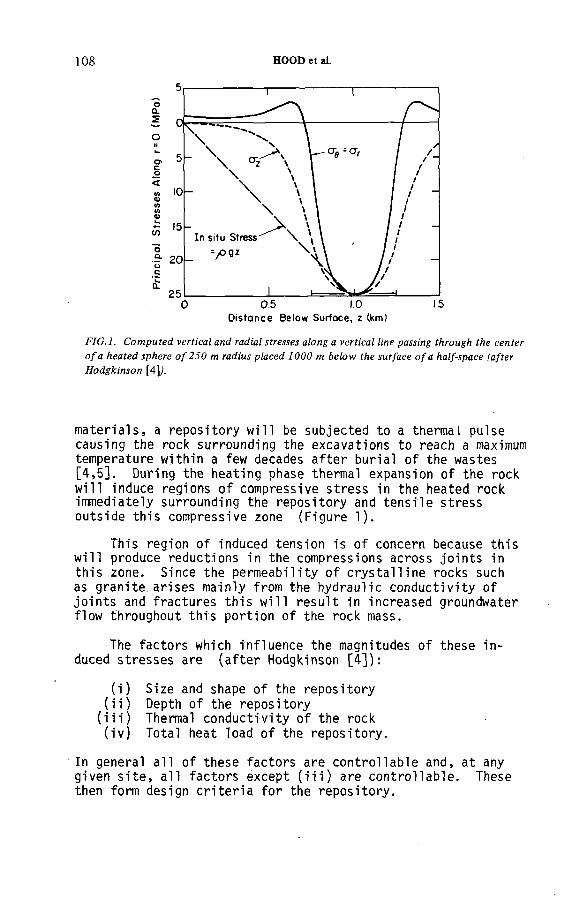
108 HOOD et al.
Distance Below Surface, z (km)FIG.l. Computed vertical and radial stresses along a vertical line passing through the center of a heated sphere of250 m radius placed 1000 m below the surface of a half-space (after Hodgkinson [4p.
materials, a repository will be subjected to a thermal pulse causing the rock surrounding the excavations to reach a maximum temperature within a few decades after burial of the wastes[4,5]. During the heating phase thermal expansion of the rock
will induce regions of compressive stress in the heated rock immediately surrounding the repository and tensile stress outside this compressive zone (Figure 1).
This region of induced tension is of concern because this will produce reductions in the compressions across joints in this zone. Since the permeability of crystalline rocks such as granite arises mainly from the hydraulic conductivity of joints and fractures this will result in increased groundwater flow throughout this portion of the rock mass.
The factors which influence the magnitudes of these induced stresses are (after Hodgkinson [4]):
(i) Size and shape of the repository
(ii) Depth of the repository (iii) Thermal conductivity of the rock
(iv) Total heat load of the repository.
In general all of these factors are controllable and, at any given site, all factors except (iii) are controllable. These then form design criteria for the repository.
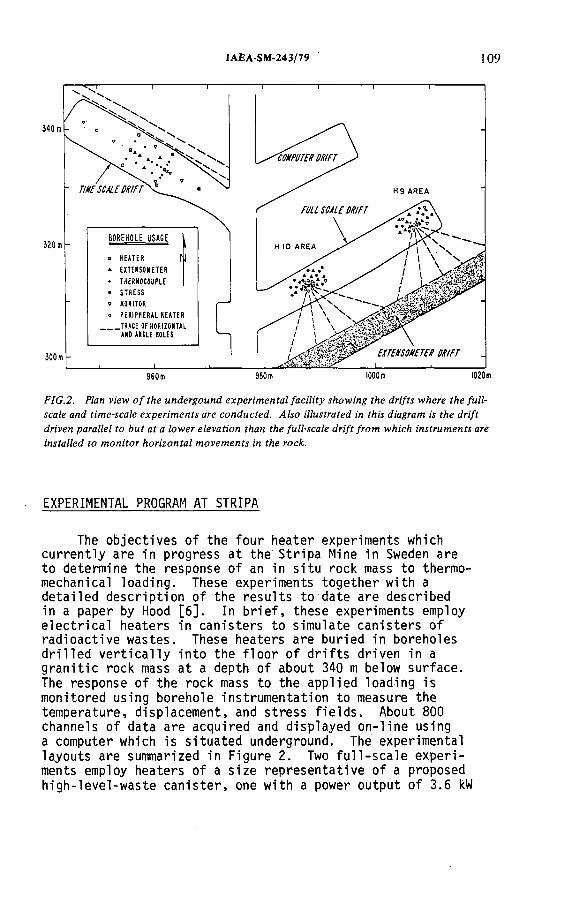
IAEA-SM-243/79 109
340 m
320 m ■BOREHOLE USAGE
□ HEATER \ J* EXTEHS0 И ETER* ш ш с о и р и* STRESSv MONITORо PERIPHERAL HEATER
______TRACE OF HORIZONTALAND ANGLE HOLES
300 m ■ EXTEHSOMETER Dill FT
960m 980 m 1000 m 1020m
FIG.2. Plan view o f the u n dergound experim en ta l fa c ility sh ow ing the d r if ts w here the full- scale and tim e-scale ex p erim en ts are con du cted . A lso illu stra ted in th is diagram is the d r if t driven parallel to b u t a t a lo w er eleva tion than the fu ll-scale d r if t fro m w hich in strum ents are in sta lled to m o n ito r h o rizo n ta l m ovem en ts in the rock.
EXPERIMENTAL PROGRAM AT STRIPA
The objectives of the four heater experiments which currently are in progress at the' Stripa Mine in Sweden are to determine the response of an in situ rock mass to thermomechanical loading. These experiments together with a detailed description of the results to date are described in a paper by Hood [6]. In brief, these experiments employ electrical heaters in canisters to simulate canisters of radioactive wastes. These heaters are buried in boreholes drilled vertically into the floor of drifts driven in a granitic rock mass at a depth of about 340 m below surface. The response of the rock mass to the applied loading is monitored using borehole instrumentation to measure the temperature, displacement, and stress fields. About 800 channels of data are acquired and displayed on-line using a computer which is situated underground. The experimental layouts are summarized in Figure 2. Two full-scale experiments employ heaters of a size representative of a proposed high-level-waste canister, one with a power output of 3.6 kW
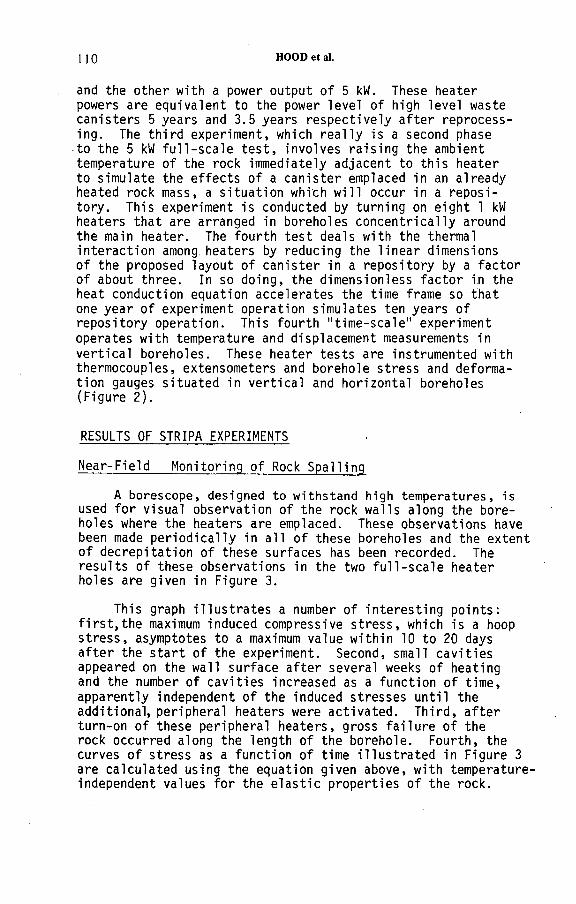
1 1 0 HOOD et al.
and the other with a power output of 5 kW. These heater powers are equivalent to the power level of high level waste canisters 5 years and 3.5 years respectively after reprocessing. The third experiment, which really is a second phase to the 5 kW full-scale test, involves raising the ambient temperature of the rock immediately adjacent to this heater to simulate the effects of a canister emplaced in an already heated rock mass, a situation which will occur in a repository. This experiment is conducted by turning on eight 1 kW heaters that are arranged in boreholes concentrically around the main heater. The fourth test deals with the thermal interaction among heaters by reducing the linear dimensions of the proposed layout of canister in a repository by a factor of about three. In so doing, the dimensionless factor in the heat conduction equation accelerates the time frame so that one year of experiment operation simulates ten years of repository operation. This fourth "time-scale" experiment operates with temperature and displacement measurements in vertical boreholes. These heater tests are instrumented with thermocouples, extensometers and borehole stress and deformation gauges situated in vertical and horizontal boreholes (Figure 2).
RESULTS OF STRIPA EXPERIMENTS
Near-Field Monitoring of Rock Spa1 ling
A borescope, designed to withstand high temperatures, is used for visual observation of the rock walls along the boreholes where the heaters are emplaced. These observations have been made periodically in all of these boreholes and the extent of decrepitation of these surfaces has been recorded. The results of these observations in the two full-scale heater holes are given in Figure 3.
This graph illustrates a number of interesting points: first,the maximum induced compressive stress, which is a hoop stress, asymptotes to a maximum value within 10 to 20 days after the start of the experiment. Second, small cavities appeared on the wall surface after several weeks of heating and the number of cavities increased as a function of time, apparently independent of the induced stresses until the additional, peripheral heaters were activated. Third, after turn-on of these peripheral heaters, gross failure of the rock occurred along the length of the borehole. Fourth, the curves of stress as a function of time illustrated in Figure 3 are calculated using the equation given above, with temperature- independent values for the elastic properties of the rock.

IAEA-SM-243/79 1 1 1
50 100 150 200Tim e a f te r start of experim ent (days)
250
T im e a f te r s ta r t o f experim ent (days)
F IG .3. M axim um in du ced com pressive stress a t w alls o f bo th the 5 kW (u pper graph) and the 3 .6 kW (lo w er graph) hea ter boreholes p lo tte d as a fu n c tio n o f tim e, to g e th er w ith lines den o tin g th e uniaxial com pressive strength o f the rock. A lso p lo tte d are the n um ber o f cavities in du ced in the borehole wall as a resu lt o f therm al spoiling.
The results indicate that the extent of spelling along the borehole walls was extremely limited, and may be considered insignificant, prior to turn-on of the peripheral heaters.After this event, when the induced compressive stresses at the surface were caused to increase, gross failure of the wall occurred.
The nature of the spelling phenomena prior to and after the perturbation ceused by the peripherel heeters is illustrated diagrammatically in Figure 4. Deterioration of the rock wall immediately after the start of the experiment was very limited and was characterized by the enlargement of pre-existing fractures intersecting the borehole and the formation of small rock chips, typically 10 mm in diameter and 1 mm thick along this surface.
1 1 2 HOOD et al.
Day 7 Day 97
Insulation
Rock I25°C at 0 .4 m radius
I9 0 *C
WVMWAiW
г5 m
Views of Heater Hole Wan Through Bore Scope
3 2 0 *C
Oí • 148 MPa £¿■215 MPa
Rock I75°C at 0 .4 m rodius
3 5 mm
Day 211 Day 232
FIG.4. R esu lts o f borehole decrep ita tio n around the 5 .0 kW full-scale heater. Peripheral heaters w ere s ta r ted a t d a y 204 .
This type of damage increased with time but, even after continuous heating for more than 200 days-only 50 to 60 of these minor spalls could be observed along the complete length of the borehole. This amount of damage can be regarded as negligible. Gross failure of the wall,which followed the activation of the peripheral heaters, occurred rapidly so that within a few days of this event it became impossible to continue observations because the annul us between the canister and the borehole became filled with debris.
IAEA-SM-243/79 113
These results indicate that two distinct mechanisms are involved in this spelling phenomenon. First the time-dependent behavior obviously is not explained by thermoelastic theory.Cook [3] has suggested other mechanisms for thermal deterioration of rock,including: dehydration of clay minerals withinthe rock and differential thermal expansion of individual
crystals within the rock. These or other mechanisms may be the cause of this observed behavior. At the present time this behavior is not well understood and further investigation is required. Second, the gross failure appears to be a stress- related event and further work is required to determine positively the stress criterion beyond which the rock will fail.
Finally,regarding thermally induced failure of the heater borehole wall, it is of interest to note that the increased stresses induced at this surface as a result of turn-on of the peripheral heaters could be reproduced simply by using increased power levels in the main heater. The equivalent full-scale heater power to generate these same stress levels at the rock wall is 7 kW [7]. Thus, the results obtained show that with heater power levels of 5 kW, in this rock type, borehole wall decrepitation is negligible. However, at heater power levels of 7 kW gross failure of the borehole is induced. An upper limit for acceptable power levels of about 5 kW for canisters of this geometry in this rock type therefore has been determined.
Far-Field Temperature, Displacement and Stress Measurements
The thermocouple readings show that the rock temperatures are symmetrical about the heater midplanes and heater axes, that is,the heat flow is not affected by the discontinuities in the rock mass [6]. Furthermore, analysis demonstrates that the dominant mode of heat transfer is by conduction and for this reason the temperature field is amenable to prediction using relatively simple semi-analytical methods [8].
Unlike the temperature results, the displacement measurements are not consistent with values predicted using linear thermoelastic theory. The extensometer readings, which are the easiest to interpret,since displacement is measured directly, show two distinct types of behavior. During early time periods after the turn-on of the heaters the displacements measured with these instruments are very much less than those predicted by linear thermoelastic theory. (Predictions, based on linear thermoelasticity, have been developed for rock movements at each of the extensometer and stress gauge locations [9]). After this initial period the measured displacements increase uniformly but at a rate such that the observed rock movements are only
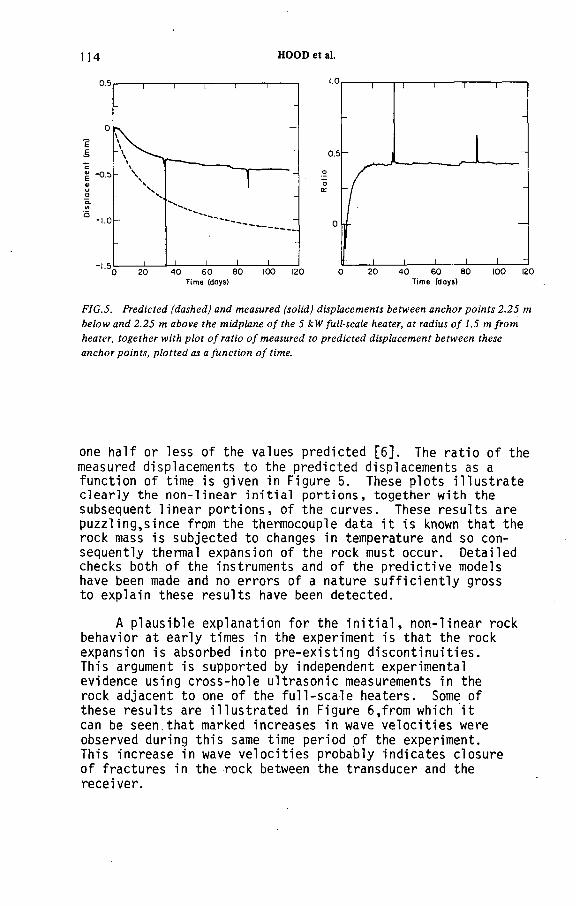
1 14 HOOD et al.
FIG.5. P red ic ted (dashed) and m easured (so lid) d isp lacem en ts be tw een anchor p o in ts 2 .2 5 m b e lo w and 2 .2 5 m above the m idplane o f the 5 kW full-scale heater, a t radius o f 1.5 m fro m heater, to g e th er w ith p lo t o f ra tio o f m easured to p re d ic ted d isp lacem en t be tw een these anchor po in ts, p lo tte d as a fu n c tio n o f time.
one half or less of the values predicted [6]. The ratio of the measured displacements to the predicted displacements as a function of time is given in Figure 5. These plots illustrate clearly the non-linear initial portions, together with the subsequent linear portions, of the curves. These results are puzzling,since from the thermocouple data it is known that the rock mass is subjected to changes in temperature and so consequently thermal expansion of the rock must occur. Detailed checks both of the instruments and of the predictive models have been made and no errors of a nature sufficiently gross to explain these results have been detected.
A plausible explanation for the initial, non-linear rock behavior at early times in the experiment is that the rock expansion is absorbed into pre-existing discontinuities.This argument is supported by independent experimental evidence using cross-hole ultrasonic measurements in the rock adjacent to one of the full-scale heaters. Some of these results are illustrated in Figure 6,from which it can be seen,that marked increases in wave velocities were observed during this same time period of the experiment.This increase in wave velocities probably indicates closure of fractures in the rock between the transducer and the receiver.

IAEA-SM-243/79 115
Days a f t e r tu rn -o n o f H 9 heo te r
F IG .6. U ltrasonic v e lo c ity m easurem en ts be tw een boreholes 4 m apart a t the hea ter m idplane eleva tion in the rock m ass ad jacen t to the 3 .6 kW heater.
The puzzling feature of the linear portion of the displacement ratio plot (Figure 5) is that this curve trends to a constant value other than unity. Recent experimental data [10] has provided some data for the temperature dependence for some of the rock properties. Preliminary calculations using these values in the predictive models indicate that the magnitude of the predicted displacement curve is reduced substantially, so that the ratio curve asymptotes to a value close to unity [7]. More work is required in the area of laboratory testing to determine fully the thermomechanical behavior of specimens of this rock type.
Measurements of changes in stress in the rock mass using the vibrating-wire Creare gauges (Figure 7) show a trend similar to the extensometer measurements, namely that the observed results have a value only about one half or less of the values predicted. This result then is supportive of the argument given above, namely that the induced far-field stresses appear to have values much less than the values that are predicted by thermoelastic theory. Detailed analysis of these results still is in progress. Stress measurements obtained using U.S. Bureau of Mines borehole deformation gauges have not been analyzed as a result of an error in the original calibration of these gauges.
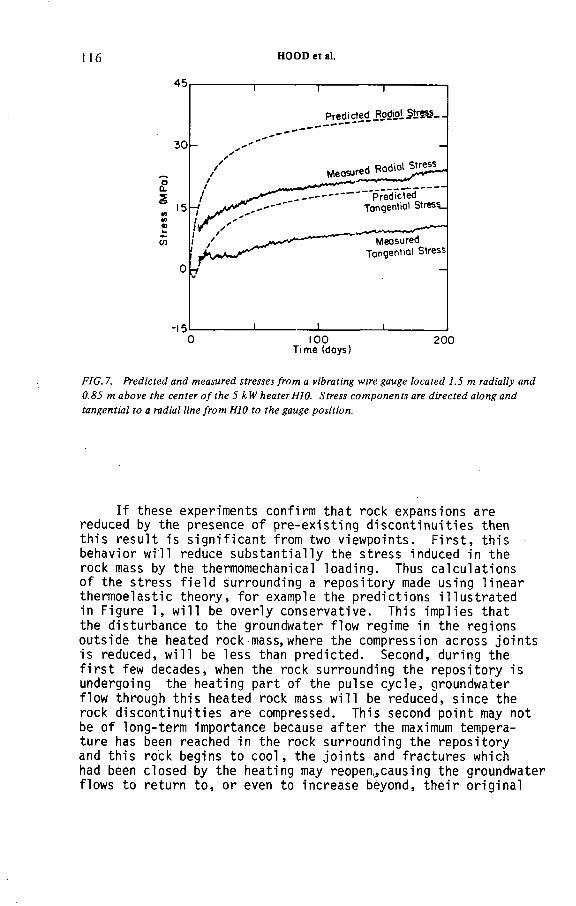
116 HOOD et al.
Time (doys)
FIG. 7. P red ic ted and m easured stresses fro m a vibrating wire gauge loca ted 1 .5 m radially and 0 .8 5 m a b o ve the cen ter o f th e 5 kW hea ter H10. S tress co m p o n en ts are d ire c ted a long and tan gen tia l to a radial line fro m H10 to the gauge position .
If these experiments confirm that rock expansions are reduced by the presence of pre-existing discontinuities then this result is significant from two viewpoints. First, this behavior will reduce substantially the stress induced in the rock mass by the thermomechanical loading. Thus calculations of the stress field surrounding a repository made using linear thermoelastic theory, for example the predictions illustrated in Figure 1, will be overly conservative. This implies that the disturbance to the groundwater flow regime in the regions outside the heated rock mass, where the compression across joints is reduced, will be less than predicted. Second, during the first few decades, when the rock surrounding the repository is undergoing the heating part of the pulse cycle, groundwater flow through this heated rock mass will be reduced, since the rock discontinuities are compressed. This second point may not be of long-term importance because after the maximum temperature has been reached in the rock surrounding the repository and this rock begins to cool, the joints and fractures which had been closed by the heating may reopen^causing the groundwater flows to return to, or even to increase beyond, their original

IAEA-SM-243/79 117
levels. The experimental program at Stripa will monitor rock behavior and groundwater flow through the rock for a minimum period of 6 months after the heaters are turned off so that questions of this kind can be answered in a quantitative manner.
SUMMARY
The results of the field experiments to the extent that they have been analyzed at the present time, and the impact of these results on the design of a repository in hard rock, are as follows:
a) The maximum power level for proposed radioactive wastecanisters, one of the near-field design criteria for a repository, has been determined within close limits. For the Stripa granite rock type this power limit is between 5 kW and 7 kW, probably closer to the former. It is suggested that a failure criterion for the onset of gross decrepitation of the heater borehole wall may be = oz > c0. Further work is requiredto confirm this as a failure criterion.
b) Displacements and stresses induced by thermomechanical loading generally are less than the values predicted by linear thermoelastic theory. Reasons for these lower measured stress values, including instrument calibration, are still the subject of investigation but it is postulated that two mechanisms may be responsible. First, evidence exists, in the form of time lags in the displacements as measured by extensometers and by ultrasonic wave velocity measurements, which indicates that during the initial phase of the experiments rock expansions are absorbed into pre-existing fractures. Second, if temperature-dependent rock properties are used in the predictive numerical codes the magnitudes of the theoretical displacements and stresses are reduced substantially. Further work in this important area is required and it is anticipated that the data gathered during the monitoring of the cool-down period after the heaters are turned off will provide crucial data in this regard.
It follows that if the stresses induced in the rock surrounding the repository are significantly less than those predicted by linear thermoelastic theory, then the concerns regarding the increased permeability of the rock will be reduced.

118 HOOD et al.
This work, which was conducted by the Earth Sciences Division of the Lawrence Berkeley Laboratory, was funded by the Department of Energy under contract No. W-7405-ENG-48.The contract is administered by the Office of Nuclear Waste Isolation at Batelle Memorial Institute. B. Paulsson provided the ultrasonic velocity data, and L. Andersson assisted with the borehole decrepitation observations. The observations of T. Schrauf (Terra Тек, Inc.) concerning the stress measurements were useful for this analysis.
ACKNOWLEDGEMENTS
REFERENCES
[1] National Research Council: "The Disposal of RadioactiveWaste on Land", Committee on Waste Disposal, Division ofEarth Sciences. Washington, D. C. National Academy of Science, 1957.
[2] American Physical Society: "Report of Study Group onNuclear Fuel Cycles and Waste Management", Reviews of Modern Physics, 50, 1, January 1978.
[3] Cook, N. G. W . : "An Appraisal of Hard Rock for PotentialUnderground Repositories of Radioactive Wastes", Part 1 LBL Report 7073, SAC 10, Lawrence Berkeley Laboratory, Berkeley, California, October 1978.
[4] Hodgkinson, D. P.: "Deep Rock Disposal of High LevelRadioactive Waste: Initial Assessment of the ThermalStress Field", AERE Report R-8999, Harwell, Didcot,Oxon, United Kingdom, January 1978.
[5] St. John, C. N. : "Computer Models and the Design ofUnderground Radioactive Waste Repositories", prepared for special Summer Session "Current Developments inRock Engineering", Massachusetts Institute of Technology, June 26-30, 1978.
[6] Hood, М.: "Some Results from Field Investigation ofThermomechanical Loading of a Rock Mass when Heater Canisters are Emplaced in the Rock", presented at 20thU. S. Rock Mechanics Symposium, Austin, Texas, June 1979.
[7] Chan, T.: Private Communication, 1978.

IAEA-SM-243/79 119
[8] Chan, T., Cook, N. G. W. and Tsang, С.: "TheoreticalTemperature Fields for the Stripa Project", Vols. 1 and2,LBL Report 7082 1/2, SAC-09, Lawrence Berkeley Laboratory,Berkeley, California, September 1978.
[9] Chan, T. and Cook, N. G. W . : "Calculation of ThermallyInduced Displacements and Stresses for Experiments at Stripa", LBL Report 7061, Lawrence Berkeley Laboratory, Berkeley, California, 1979.
[10] Swan, G.: "The Mechanical Properties of Stripa Granite",LBL Report 7074, SAC-03, Lawrence Berkeley Laboratory, Berkeley, California, August 1978.
DISCUSSION
F.L.H. LAUDE: Y ou mention a 10% error in temperatures. Is this the difference
between the temperatures obtained by calculation and those predicted by the
in situ simulation model? If so, what are the reasons for this discrepancy?
M. HOOD: The calculations were performed using thermal conductivity
values obtained by laboratory testing on intact rock samples. In the field we are
obviously dealing with a discontinuous rock mass. The 10% discrepancy between
our measurements and our predictions is the result of the difference in thermal
conductivity between intact and in situ rock.
The model will be refined in the light of our experimental results. Pre
liminary calculations in this regard have shown that the discrepancy between
measurements and the refined model predictions is negligible. Thus we have an
important result, namely, that accurate predictions of the temperature field can be
made using a relatively simple, semi-analytical model based on heat conduction.
C. DAVISON : Does the theory you use predict a reversible displacement
pattern? And in fact, what type of displacement pattern has been observed in the
Stripa tests?
M. HOOD: The cool-down period for these experiments started only a
month ago for one of the experiments; the other experiments are still in the
heating phase. The models used to predict displacements are based on linear
' thermoelasticity and therefore reversible displacements are predicted. However,
we expect that the discontinuities in the in situ rock will result in hysteresis to the
system.
J. HAMSTRA: You gave a 5 kW maximum value for each heat source. This
value is definitely dependent on geometry. Would you please comment on the
applicability to your project of the Harwell approach in which the length of the
individual heat sources is increased, thus possibly lowering the linear thermal load
in each borehole.

1 2 0 IAEA-SM-243/79
M. HOOD: Obviously the 5 kW value is geometry-dependent and this value
applies to the canister geometry given in the paper (this geometry was used since
it is related to the length of spent-fuel rods and for this reason the canister geometry
is currently proposed by the United States Department of Energy). It should be
noted, however, that our objective in conducting this experiment is to determine
the mechanism causing the spalling. Once this mechanism is understood, proper
design calculations can be made.
K. HANNERZ: What is said in the paper by Beale et al. (IAEA-SM-243/26),
about uncertainties in groundwater flow calculations certainly indicates the need
for a multibarrier type of repository concept. The temperature levels quoted in
your paper (300—400°C) appear totally incompatible with the use of a long-lived
local barrier around the waste packages. Could you please comment on this?
M. HOOD: The purpose of the current experiments at Stripa is to improve
our understanding of the fundamental processes involved in the thermomechanical
loading of an in situ rock mass. These tests are conducted over a range of heater
power levels for the purpose of investigating a wide variety of phenomena. We
expect that at the conclusion of these experiments we shall understand rock
behaviour under this type of loading (which will apply to a complete range of
thermal loading conditions). This is not to say that we disagree with the concept
of multibarriers in a repository. Indeed, a comprehensive experiment on this
subject is planned for the next year at Stripa.
IAEA-SM-244/164
MODELLING OF TEMPERATURE FIELDS
AND DEFORMATIONS FOR RADIOACTIVE WASTE
REPOSITORIES IN HARD ROCK
O. STEPHANSSON
University of Luleá,
Luleâ
R. BLOMQUIST
Studsvik Energiteknik,
Nykôping
T. GROTH, P. JONASSON
Royal Institute of Technology,
Stockholm
T. TARANDI
Vattenbyggnadsbyrân AB,
Stockholm, Sweden
Abstract
MODELLING OF TEMPERATURE FIELDS AND DEFORMATIONS FOR RADIOACTIVE
WASTE REPOSITORIES IN HARD ROCK.
Heating of the rock mass surrounding a repository for high-level radioactive waste will
result in increasing temperatures over large areas for a long time. Thermal expansion of the
rock leads to stresses which, together with virgin stresses and swelling pressure of compacted
bentonite in the disposition hole, could alter the joint pattern and thereby the permeability of
the rock mass. The estimates of these phenomena in relation to the Swedish concept of final
storage of vitrified high-level waste and spent fuel are presented. Temperature fields are calcu
lated and a model constructed for a single-level repository of vitrified waste and single- and two-
-level repositories of spent fuel. Finite element modelling of a storage tunnel and deposition
hole in jointed rocks is described. Analyses are performed to simulate the effects of mining,
thermal loading, swelling of bentonite and penetration of bentonite in joints.
1. INTRODUCTION
Underground storage of radioactive wastes in hard rock may be a safe and effective means of isolating them from the environment and from man. Several vital questions must be answered before this solution can be assessed or the final design of a repository commenced. These include the effects on a repository of the heat released by the fission production of the reprocessed waste or the spent fuel. Heating of the rock mass surrounding a repository will result in increasing temperatures and thermal gradient over distances of several •
1 2 1
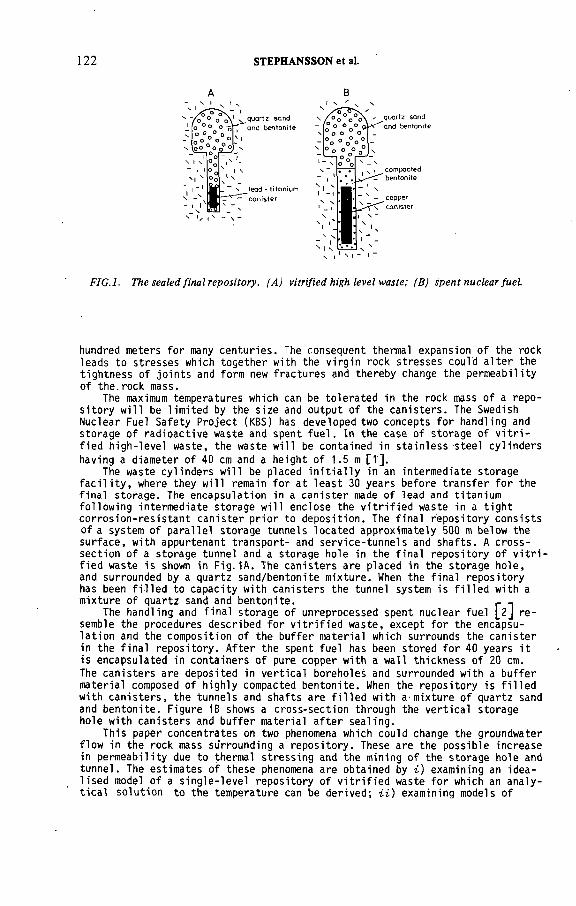
1 2 2 STEPHANSSON et al.
quartz sand and bentonite
F IG .l. The sealed fin a l re p o sito ry . (A ) v itr ified high leve l w aste; (B) sp e n t nuclear fuel.
hundred meters for many centuries. The consequent thermal expansion of the rock leads to stresses which together with the virgin rock stresses could alter the tightness of joints and form new fractures and thereby change the permeability of the.rock mass.
The maximum temperatures which can be tolerated in the rock mass of a repository will be limited by the size and output of the canisters. The Swedish Nuclear Fuel Safety Project (KBS) has developed two concepts for handling and storage of radioactive waste and spent fuel. In the case of storage of vitrified high-level waste, the waste will be contained in stainless steel cylinders
having a diameter of 40 cm and a height of 1.5 m [1].The waste cylinders will be placed initially in an intermediate storage
facility, where they will remain for at least 30 years before transfer for the final storage. The encapsulation in a canister made of lead and titanium following intermediate storage will enclose the vitrified waste in a tight corrosion-resistant canister prior to deposition. The final repository consists of a system of parallel storage tunnels located approximately 500 m below the surface, with appurtenant transport- and service-tunnels and shafts. A cross- section of a storage tunnel and a storage hole in the final repository of vitrified waste is shown in Fig.1A. The canisters are placed in the storage hole, and surrounded by a quartz sand/bentonite mixture. When the final repository has been filled to capacity with canisters the tunnel system is filled with a mixture of quartz sand and bentonite. r ..
The handling and final storage of unreprocessed spent nuclear fuel j_2J resemble the procedures described for vitrified waste, except for the encapsulation and the composition of the buffer material which surrounds the canister in the final repository. After the spent fuel has been stored for 40 years it is encapsulated in containers of pure copper with a wall thickness of 20 cm.The canisters are deposited in vertical boreholes and surrounded with a buffer material composed of highly compacted bentonite. When the repository is filled with canisters, the tunnels and shafts are filled with a mixture of quartz sand and bentonite. Figure IB shows a cross-section through the vertical storage hole with canisters and buffer material after sealing.
This paper concentrates on two phenomena which could change the groundwater flow in the rock mass surrounding a repository. These are the possible increase in permeability due to thermal stressing and the mining of the storage hole and tunnel.. The estimates of these phenomena are obtained by i) examining an idealised model of a single-level repository of vitrified waste for which an analytical solution to the temperature can be derived; ii) examining models of

IAEA-SM-243/164 123
single- and multilevel repositories of spent fuel for which numerical solutions to the temperature field and thermal stresses can be obtained; Hi) examining a model of storage tunnel and hole for spent fuel in a jointed rock mass for which a finite-element technique gives displacements and stresses in the vicinity of the tunnels and holes.
HEAT DISSIPATION OF VITRIFIED WASTE IN A SINGLE-LEVEL REPOSITORY
2.1 Design criteria for waste and repository
Each waste canister is assumed to contain 150 litres of radioactive glass enclosed in a steel container 1 500 mm long and 400 mm in diameter. The steel container will be entirely surrounded by 100 mm lead which, in turn, is coated with 5 mm of titanium. The deposition presumably occurs after a decay of 40 years. The decay power is then about 525 W/canister [з].
The following assumptions were made concerning the repository:
Horizontal area 1000 x 1000 m
Number of levels 1
Number of horizontal tunnels 41
Distance between tunnels 25 m
Distance between canisters 4 m
Hole diameter 1 m
Total number of canisters
Thermal conductivity of buffer material
Thermal conductivity of rock
Specific heat of rock
Initial rock temperature
10250
2.5 W/m-К
3.0 W/m-К
2.3 MJ/m3-K
20°C
2.2 Method of calculation
The three-dimensional transient temperature distribution in the repository has been calculated for a time-dependent decay of heat. When the transient heat production is uniformly distributed in a parallelepipedic volume, the transient temperature inside and outside this volume can be calculated from [4].
ATX = ^ 1 л 8c
•Xt
erfz + d
erfz - d
V4kyl /4k y'
where
a b d сerf к
q
erf i l l - erf x ' a\ДiqT;
du
erf У * в . erf У-Ь
( V4ku l/ïky i
o:
half-length of heat generating volumehalf-width of heat generating volumehalf-height of heat generating volumeheat capacityerror functionthermal conductivityheat generation at time of deposition
tAT;
X
heat generation at time ofdisposaltimetemperature disturbance related to Adecay constant variable of integration
By dividing the heat generation isotopes into suitable groups and prescribing initial heat generation and decay constant for each group, the temperature disturbance from each individual group can be calculated from eq. (1). The total temperature disturbance can then be determined by superposition. It is also possible to divide the volume of the repository into suitable elements, calculate the temperature disturbance from each element and then estimate the total temperature disturbance by superposition.
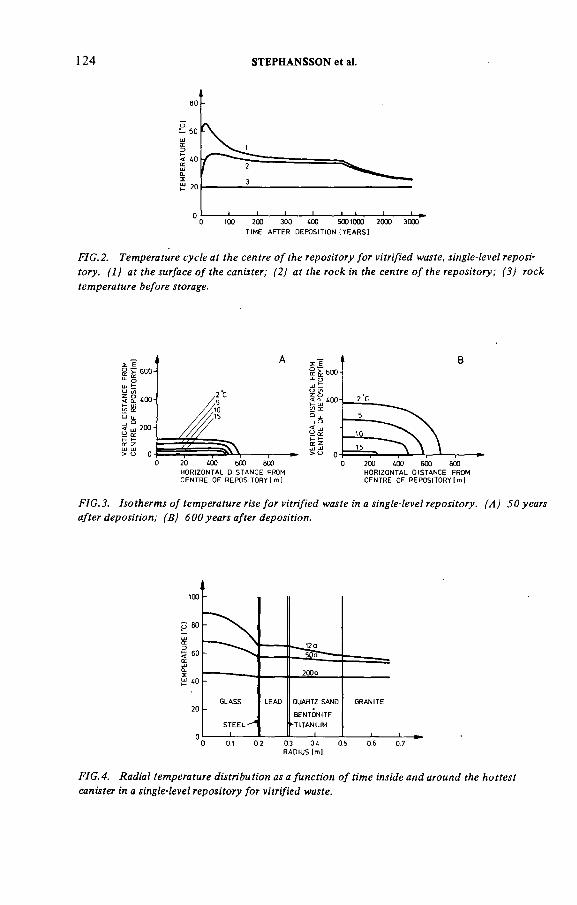
124 STEPHANSSON et al.
F IG .2. T em perature cyc le a t th e cen tre o f the re p o sito ry fo r vitrified w aste, single-level reposito ry . (1 ) a t th e surface o f th e canister; (2) a t the rock in the cen tre o f the rep o sito ry ; (3 ) rock tem pera tu re before storage.
HORIZONTAL DISTANCE FROM HORIZONTAL DISTANCE FROMCENTRE OF REPOSITORY I m| CENTRE OF REPOSITORY Im|
F IG .3. Iso th erm s o f tem pera tu re rise f o r vitrified w aste in a single-level rep o sito ry . (A ) 5 0 yea rs a fte r dep o sitio n ; (B) 6 0 0 yea rs a fte r d eposition .
F IG .4. R ad ia l tem pera tu re d istr ib u tio n as a fu n c tio n o f tim e inside a n d arou n d the h o tte s t canister in a single-level re p o sito ry fo r v itr ified w aste.

IAEA-SM-243/164 125
On the basis of the method described above a computer code has been developed. The program evaluates eq. (1) and performs the superposition, and is well suited for parametric studies of the influence of container size, amount of waste in each container, repository layout, decay time before deposition etc.
2.3 Results
Curve 1 in Fig.2 shows the calculated temperature cycle at the surface of the titanium for the hottest canister in the repository.
Calculations were also performed of the temperature cycle of the repository as a whole, assuming the generated heat is uniformly distributed throughout a volume of rock which is 1000 m long by 1000 m wide and 1.7 m high, see curve2 of Fig.2. The temperature distribution in the surrounding rock mass after 50and 600 years of deposition is illustrated in Fig.3. The radial temperature distribution inside and around the hottest canister in the repository is presented in Fig.4, for 12, 50 and 200 years after deposition. The maximum of the titanium shell is reached after about 12 years.
These results formed a basis for the design for storage of vitrified high level waste in the Swedish concept m -
3. HEAT DISSIPATION OF SPENT FUEL IN SINGLE- AND MULTILEVEL REPOSITORIES
3.1 Design criteria for repository of spent fuel
The temperature calculations were performed for three different arrangements of tunnels in the repository:
- single-level depository- two-level depository with 60 m vertical distance between the levels- two-level depository with 100 m vertical distance between the levels.
The design of the sealed final repository is shown in Fig.1,where the horizontal distance between the tunnels is 25 m, and the canisters are 6 m apart.
The waste is assumed to be for c. 40 years in an intermediate facilityafter removal from the reactor. The amount of fuel is 1.4 tons1, correspondingto 772 W/canister at the time of deposition.
3.2 Method of analysis
The calculation was executed in two steps with a finite-difference code Г53. Firstly a coarse model is used to determine the broad temperature distribution. With the resulting mean temperature distribution as the limit a new calculation is made with a model of finer caliber. The procedure is repeated with more and more detailed models. The code can be used both for steady-state analysis and transient analysis with varying limits and heating.
For the conditions near the vertical centre-line of the repository, with highest temperatures, there is very low heat flow in radial direction, and aone-dimensional model is used to calculate the far-field temperature.
For determination of the near-field temperature two successive calculations were performed. In the first step of the analysis, half the opening of the tunnel is simulated as a ring with wide radius. The boundary temperatures are then obtained from the far-field temperature. In the second step of the analysis the results of the first step are used as input and the temperature increase in concentric cylinders of rock and bentonite calculated analytically as a steady-state increase.
metric tons
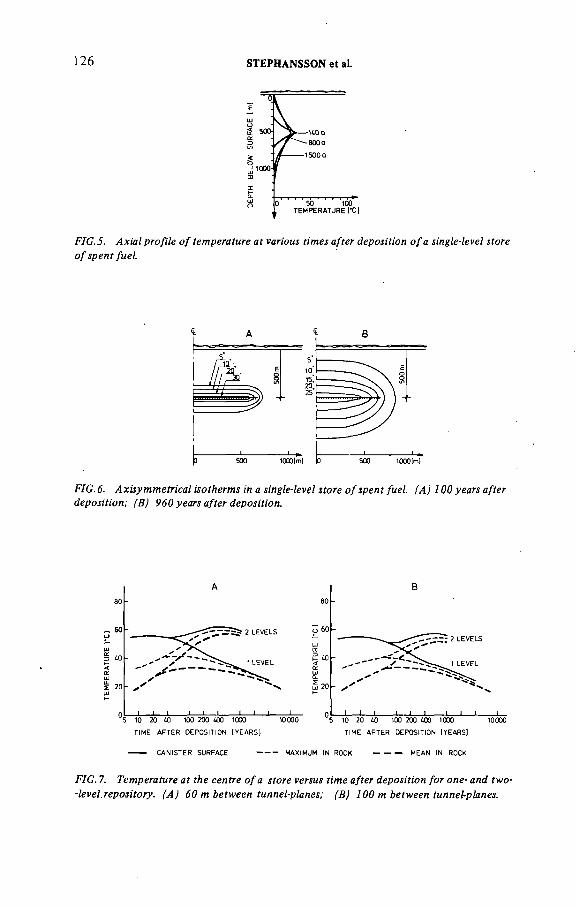
126 STEPHANSSON et aL
FIG.S. A x ia l p ro file o f tem pera tu re a t various tim es a fte r depositio n o f a single-level sto re o f sp e n t fuel.
FIG. 6. A x isym m etr ica l iso th erm s in a single-level sto re o f sp e n t fuel. (A ) 1 0 0 yea rs a fter d ep o sitio n ; (B) 9 6 0 yea rs a fte r d eposition .
------- CANISTER SURFACE -------- MAXIMUM IN ROCK ------------- MEAN IN ROCK
FIG. 7. T em pera ture a t th e cen tre o f a s to re versus tim e a fte r d ep o sitio n fo r one- an d tw o- -leve l.rep o sito ry . (A ) 6 0 m be tw een tunnel-planes; (В) 1 0 0 m be tw een tunneVplanes.

IAEA-SM-243/164 127
The number of canisters stored is 7 000, corresponding to an equivalent outer radius of the storage of 578 m in the case of single-plane arrangement and to 409 m in the case of two planes.
The following thermal properties were used:
3.3 Results of temperature calculations
The temperature changes due to the heat generation are here presented. Temperature distribution at various times after deposition at the vertical centreline for the one-plane storage is shown in Fig.5.
Figures 6A,B show isotherms at 100 and 960 years after the time of deposition. Temperature distribution is almost constant in radial direction, justifying the use of a one-dimensional model for calculation of temperature at the centre of the store.
The temperature distribution in two-level storage for 60 and 100 m distance between the levels is illustrated in Fig. 7. Loading of the lowermost store takes place first and a constant temperature between the levels is reached about 100 years after the deposition. The maximum temperature of the rock mass is 59 oc for storage with 60 m between the levels being attained800 years after deposition, Fig.8. The peak mean temperature in the rock massin the case of two-level storage is almost twice as high as in the one-level storage, but the change in mean temperature is moderate for a distance of 60 or 100 m between the levels. When the initial rock temperature of 20 ®C is added
to these temperatures at the depth of the storage, the maximum temperature of the rock mass will be less than 80 °C.
The heat from the repository reaches the surface c. 200 years after deposition. The maximum heat flow, 0.156 W/m2, occurs c. 2 000 years after deposition and is very low as compared with solar energy heat flow of about 100 Ы/т2[_б].
4. THERMAL LOADINGS OF SPENT FUEL IN SINGLE- AND MULTILEVEL REPOSITORIES
The analysis of stress due to thermal loading is performed with the finite element computer code STARDYNE 3 [7], with the same mesh as for the temperature analysis. The rock mass is assumed to have linear elastic properties with a modulus of elasticity of 40 GPa, and Poisson's number of 0.21 and a coefficient of thermal expansion of 8.5 • 10"6/°C.
4.1 Results of thermal stress calculations
The thermal stresses in the rock mass along the vertical centre-line of a repository with spent fuel are shown in Fig.9. The calculations are valid for a single-level and two-level depository 140 years after deposition of the spent fuel. The maximum compressive stress, 24 MPa, is found at the centre of a two- level depository with 60 m between the tunnel-levels, Fig.9B. Calculations with 100 m distance between the levels give somewhat lower stresses.
The principal stresses in a horizontal plane of the repository 140 years after deposition are illustrated in Fig.10. Tensile stresses in tangential and vertical direction are found at the boundary of the repository for any repositories. The peak values of principal compressive stresses for the centre of the store are reached 140 years after deposition, Fig.10, and are reduced by 50 % after 1 500 years. At the ground surface the peak value in principal tensile stress is 5 MPa for a two-level storage 1 000 years after deposition.
- thermal conductivity of rock- thermal conductivity of bentonite- specific heat of rock mass- specific heat of the bentonite- mean temperature at the surface
3 W/m • С n 0.75 W/m - C 2 MJ/m3-°C 2 MJ/m3- °C 6.6 oc
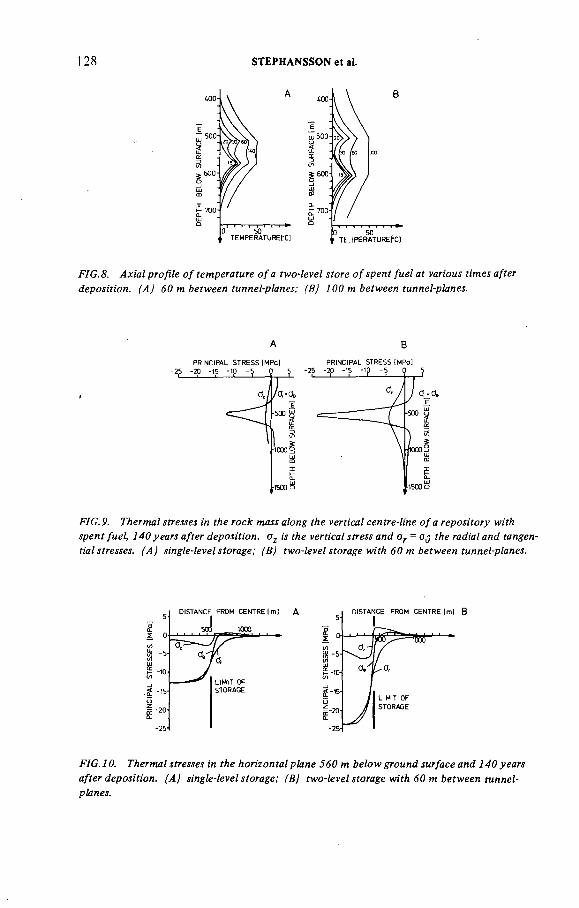
128 STEPHANSSON et al.
F IG .8. A x ia l p ro file o f tem pera tu re o f a tw o -leve l s to re o f sp e n t fu e l a t various tim es a fter dep o sitio n . (A ) 60 m be tw een tunnel-planes; (B) 1 0 0 m be tw een tunnel-planes.
PRINCIPAL STRESS [MPal PRINCIPAL STRESS IMPa]
FIG. 9. Therm al stresses in th e ro c k m ass along th e vertica l centre-line o f a re p o sito ry w ith sp e n t fue l, 1 4 0 yea rs a fter depositio n . oz is the vertica l stress an d or = од the radial an d tangentia l stresses. (A ) single-level storage; fВ) tw o-level storage w ith 6 0 m be tw een tunnel-planes.
FIG. 10. Therm al stresses in th e h o rizo n ta l plane 5 6 0 m b e lo w grou n d surface an d 1 4 0 yea rs a fte r d ep o sitio n . (A ) single-level storage; (B j tw o -leve l storage w ith 60 m b e tw e en tunnel- planes.
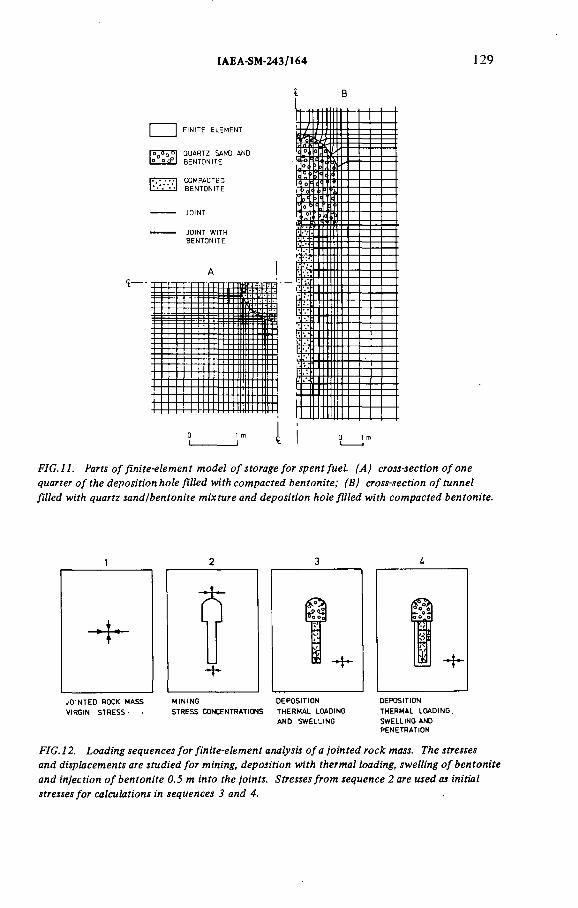
IAEA-SM-243/164 129
F IG .11. Parts o f fin ite -e lem en t m o d e l o f storage fo r sp e n t fue l. (A ) cross-section o f one quarter o f th e d ep o s itio n h ole f ille d w ith c o m p a c ted b en to n ite ; (B) cross-section o f tunnel f ille d w ith qu artz sa n d /b en to n ite m ix tu re an d d ep o s itio n h ole f ille d w ith co m p a c ted ben to n ite .
1 2 3 U
J O I N T E D R O C K M A S S M IN IN G D E P O S IT I O N D E P O S IT IO N
V IR G IN S T R E S S - ■ S T R E S S C O N C E N T R A T IO N S T H E R M A L LO A D IN G T H E R M A L L O A D I N G ,
A N D S W E L L I N G S W E L L I N G A N DP E N E T R A T IO N
F IG .12. L oading sequences fo r fin ite -e lem en t analysis o f a jo in te d ro c k mass. The stresses a n d d isp lacem en ts are s tu d ied fo r m ining, d ep o sitio n w ith therm al loading, sw elling o f b en to n ite a n d in jection o f b en to n ite 0 .5 m in to the jo in ts. S tresses f ro m sequence 2 are u sed as in itia l stresses f o r calcu lations in sequences 3 an d 4.

130 STEPHANSSON et al.
5. FINITE-ELEMENT MODELLING OF A STORAGE TUNNEL AND HOLE IN JOINTED ROCK
Finite-element analysis is immediately useful where displacements and stresses must be known in heterogeneous or discontinuous materials, like a jointed rock mass L8].
Modelling of a storage tunnel and hole in one and the same model is a difficult problem. The tunnel has a horizontal axis of symmetry and the hole has a vertical axis of symmetry. Hence, a correct analysis must be executed by three-dimensional modelling. In this paper we present a two-dimensional model of a vertical cross-section of the tunnel and hole and a two-dimensional model of a horizontal cross-section of the storage hole. As a result of geometrical symmetry only one half, or one quarter, of the model need be analysed with the finite-element technique, Fig.11. The total size of the model with tunnel and hole is 26 by 56 m. Joints in the models are concentrated in a horizontal and vertical band through the centre of the models. All corners of the models are fixed, and interjacent nodal points along the boundaries are free to move in a direction parallel with the boundary.
5.1 Material models
The finite-element analysis for each model is performed in four sequences
which correspond to the real situation in a repository. For the first sequence of calculation a virgin stress is applied to a jointed rock mass, Fig.12. The stresses are chosen in accordance with our présent knowledge of the state of stress in the Earth's crust [.9]. For the model of the hole the horizontal stresses at 500 m depth are uniform and have the value = ац2 = 20 MPa. A two-dimensional model of the tunnel and hole rather resembles a tunnel and ditch. The horizontal stresses are therefore reduced to = 10 MPa,which gives a vertical stress of ov = 7 MPa.
The model has a Young's modulus of 40 GPa and a Poisson's ratio of 0.2 ,i.e. the same properties as for the calculations of thermal stresses. The zone
of joints in the vicinity of the openings has the same material property as was achieved by means of the composite model of Goodman [10].
Joint elements form the link between the faces of the blocks in the jointed rock mass. A joint element can part in response to tension, transmit normal forces in response to compression, slide in response to shear and rotate in response to moment. The material model of the joint with respect to shearing is in accordance with the Barton's criterion for shear strength, shear stiffness and dilation [11]. The joint properties are chosen in accordance with the analysis presented in the KBS report [123. The second sequence of modelling is the mining of the tunnel and the hole, Fig.12. This causes displacements of the periphery of the openings, which is found to be 6 mm at the top of the deposition hole for the model with tunnel and hole and 2.7mm for the model with horizontal cross-section of deposition hole. The stresses formed in the model after mining are stored and used as initial stresses for the following sequence of deposition, Fig.12.
Deposition of canisters in the hole causes a thermal loading of the rock mass. Hence, the maximum thermal stresses of a single-level repository, which are az= 2 MPa and ar = a@ = 12 MPa according to the calculations in section 4, are added to the stresses of the rock mass after mining. The swelling of the bentonite transmits a load to the periphery of the tunnel and hole. A swelling pressure of 0.5 MPa is assumed for the tunnel and 10 MPa for the compacted ben
tonite in the deposition hole [13]. The maximum displacement is now 4.6 mm for
the model with tunnel and hole, and 0.6 mm for the model with deposition hole.The last sequence of modelling is deposition with thermal loading, swelling
pressure in the bentonite and 0.5 m penetration of bentonite into the joints.The penetration of bentonite causes a swelling pressure of 3 MPa to build up in the outer 0.2 m of the joint and 1 MPa for the interval 0.2 - 0.5 m, in accordance with data in [13], Fig.12. The pressure acts perpendicular to the surface of the joint.
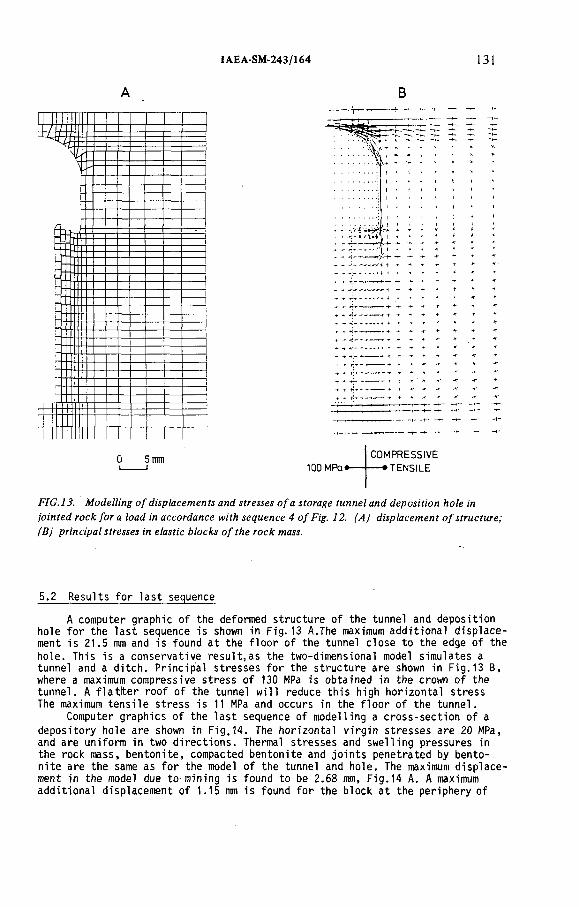
IAEA-SM-243/164 131
100 MPa*COMPRESSIVE — • TENSILE
F IG .13. M odelling o f d isp lacem ents and stresses o f a storage tunnel an d d ep o sitio n h ole in jo in te d ro c k fo r a load in accordance w ith sequence 4 o f Fig. 12. (A ) d isp la cem en t o f stru ctu re; (B j prin cipa l stresses in elastic b locks o f th e ro c k mass.
5.2 Results for last sequence
A computer graphic of the deformed structure of the tunnel and deposition hole for the last sequence is shown in Fig.13 A.The maximum additional displacement is 21.5 mm and is found at the floor of the tunnel close to the edge of the
hole. This is a conservative result,as the two-dimensional model simulates a tunnel and a ditch. Principal stresses for the structure are shown in Fig.13 B, where a maximum compressive stress of 130 MPa is obtained in the crown of the tunnel. A flatter roof of the tunnel will reduce this high horizontal stress The maximum tensile stress is 11 MPa and occurs in the floor of the tunnel.
Computer graphics of the last sequence of modelling a cross-section of a
depository hole are shown in Fig.14. The horizontal virgin stresses are 20 MPa, and are uniform in two directions. Thermal stresses and swelling pressures in the rock mass, bentonite, compacted bentonite and joints penetrated by bentonite are the same as for the model of the tunnel and hole. The maximum displacement in the model due to mining is found to be 2.68 mm, Fig.14 A. A maximum additional displacement of 1.15 mm is found for the block at the periphery of
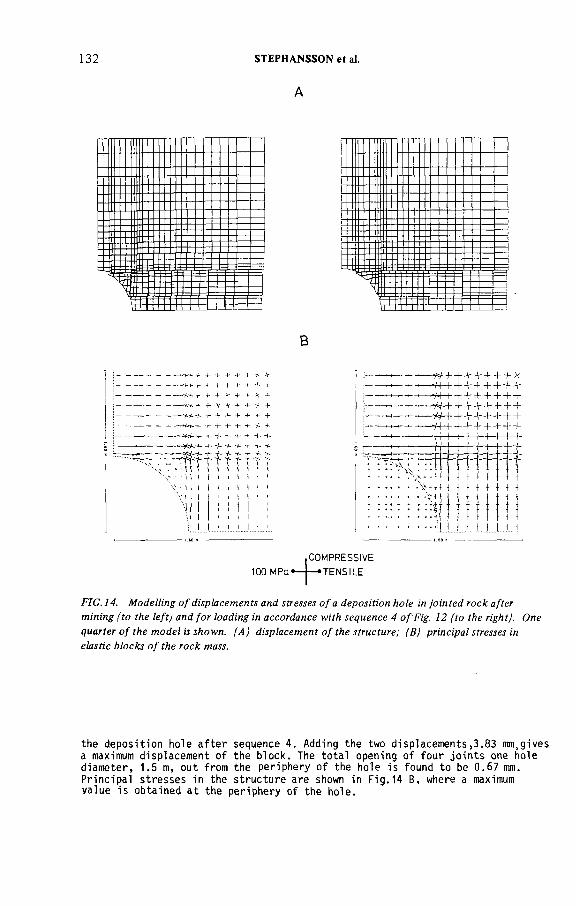
132
A
STEPHANSSON et al.
B
.COMPRESSIVE 100 MPa* |~ «TENSILE
F IG .14. M odelling o f d isp lacem ents and stresses o f a deposition hole in jo in te d ro c k a fter m ining ( to the le ft) and fo r loading in accordance w ith sequence 4 o f Fig. 12 ( to the right). One quarter o f the m o d el is show n. (A ) d isp lacem en t o f the stru ctu re; (B) prin cipa l stresses in elastic b locks o f the rock mass.
the déposition hole after sequence 4. Adding the two displacements,3.83 mm.gives a maximum displacement of the block. The total opening of four joints one hole diameter, 1.5 m, out from the periphery of the hole is found to be 0.67 mm. Principal stresses in the structure are shown in Fig.14 B, where a maximum value is obtained at the periphery of the hole.
IAEA-SM-243/164 133
ACKNOWLEDGEMENT
This work was sponsored by the Nuclear Fuel Safety Project (KBS) of the Swedish Nuclear Fuel Supply Co.
REFERENCES
Cl 3 Handling of Spent Nuclear Fuel and Final Storage of Vitrified High LevelReprocessing Waste, I General, Nuclear Fuel Safety Project (KBS), Stockholm (1977) 162.
f2] Handling and Final Storage of Unreprocessed Spent Nuclear Fuel, I General, Nuclear Fuel Safety Project (KBS), Stockholm (1978) 111.
[3] EKBERG, K., KJELLBERT, N., OLSSON, G., Decay Power Studies for KBS, Part 1and 2. KBS Technical Report 7 (1977) 60.
[4] MUFTI, I.R., Journ Geophys.Res.76 35 (1971) 8568.[5] TARANDI, T., Computer programs and their application for temperature and
stress analysis of reactor pressure vessels. 1st Int.Conference in Pressure Vessel Technology, Delft, Sept 29 - Oct 02 (1969).
[.6] KAUER, R., The potential of solar energy, Atomkernenergi 25 3 (1975) 161.[7 ] MRI/STARDYNE, User Information Manual, Control Data, (197БТ.[8] STEPHANSSON, 0., BRCKBLOM, G., GROTH, T., JONASSON, P., Deformation of a
jointed rock mass. Geol Foren Stockh Forh.100 3 (1978).[_9] STEPHANSSON, 0., LEIJ0N, B., Rock Mechanical effects of a repository
(English summary). SKBF/KBS 79-03 (1979) 34. •'[10J GOODMAN, R.E., Methods of geological engineering. West Publishing Co (1976). . 4 7 2 .L 11J BARTON, N.R..Estimating the shear of rock joints, Proceedings of 3rd
Congress of International Society of Rock Mechanics, Denver, September(1974) 219.
L12] STEPHANSSON, 0., МШ, K., GROTH, T., JONASSON, P., Finite element analysis for repository with bentonite (English summary). KBS,Technical Report 104, Stockholm (1978) 74.
£.13] PUSCH, R., Self-injection of highly compacted bentonite into rock joints. KBS Technical Report 73 (1978) 37.
DISCUSSION
P.A. WITHERSPOON: In the first part of your paper the stresses have been
calculated on the assumption of intact rock, so the real stress in a discontinuous
rock mass should be ón the conservative side when it comes to applying failure cri
teria. Do you intend to continue this analysis for a more realistic system of a frac
tured rock mass?
How did you measure the shear and normal stiffness values which you used for
the fractures in your fmite-element modelling of the canister/tunnel complex?
O. STEPHANSSON: In the finite-element modelling we have used a modulus
of deformation or a Young’s modulus for the rock mass equal to 40 GPa and Pois-
son’s ratio of 0.2. In the fractured zone we have chosen a value of 60 GPa for the

134 STEPHANSSON et al.
blocks and varied the joint spacing, d, and normal stiffnesses, kn, according to the
Goodman equation
In a paper to appear in Geologiska Fôreningens Forhandlingar, Volume 100, we
have modelled the displacements and stresses for a rock mass with various distances
between the blocks; data on far-field modelling can be found there. The model
ling of the far-field stresses for a discontinuous rock mass will continue.
The stiffness values for this analysis were chosen partly in accordance with the
above equation and the results of shear tests on large specimens in the 300-ton
shear test machine at the Department of Rock Mechanics at Luleâ.
W.R: BURTON: The United Kingdom dry repository design described in
paper SM-243/93 evens out the heat over the tunnel walls so that canisters of any
age can be loaded, provided that the overall heat loading in kW/m of tunnel is not
excessive.
Will not emplacement in tunnels with heat flow over surfaces greater than
boreholes reduce temperatures at the walls and a simple circular tunnel cross-section
reduce local stresses?
O. STEPHANSSON: Yes, the temperature will decrease. However, in the case
of the KBS project no temperature calculations have been performed for an air-filled
tunnel and/or a deposition hole.
D.B. STEWART: Are these feedback mechanisms identified in the various
modelling efforts? For example, if failure of part of the rock occurs, are all
stresses relieved, or do stresses capable of causing continued failure; still remain,
possibly in different directions? Are other physical properties (thermal conduc
tivity etc.) isotropically affected?
O. STEPHANSSON: Failure can occur only in the joint elements. The shear
strength of joints is defined in accordance with the Barton equation. If the stresses
exceed the strength, a residual value equal to 75% of the peak value is applied to the
joints and the calculation is continued until a stable solution is obtained.
D.B. STEWART: Does the thermal pulse affect all orientations of joints simi
larly? Specifically, the expansion against incompressible country rock of vertical
joints might close them. But are flat-lying joints similarly affected?
O. STEPHANSSON: The thermal pulse affects all joints similarly and simul
taneously.
J J.K . DAEMEN: How thick is the bentonite layer which penetrates the joint
in the last step of the analysis? How far does the joint open beyond the bentonite
penetration? Have you any information on the uniqueness of the solution obtained
with your finite-element programs for jointed rock mass modelling?

IAEA-SM- 243/164 135
О. STEPHANSSON: Penetration of bentonite into the rock mass has been
simulated to a depth of 0.5 m. The swelling of the bentonite gives a swelling pres
sure of 5 MPa for. the outermost 0.2 m and 3 MPa for the distance of 0.2-0.5 m.
The thickness of the bentonite is infinitesimal but the swelling pressure causes
additional displacements of the joints of the order of 0 .1 mm and less.
The data I have available now show that the joints are open to a distance of
1 .6 m away from the periphery of the hole (for joints in a direction perpendicular
to the line of symmetry).
As for the uniqueness of the fmite-element results, the calculations for each
of the six loading steps and for the four individual sequences are performed until a
stable solution is obtained. In our modelling we have attained stable solutions, so
in that respect the solutions are unique. Any changes in the joint pattern will lead
to other results.


IAEA-SM-243/26
THERMAL ASPECTS OF RADIOACTIVE
WASTE DISPOSAL IN HARD ROCK
H. BEALE, P.J. BOURKE,
D.P. HODGKINSON
Atomic Energy Research Establishment,
Harwell, Didcot,
Oxfordshire,
England
Abstract
THERMAL ASPECTS OF RADIOACTIVE WASTE DISPOSAL IN HARD ROCK.
Buried heat emitting radioactive waste will appreciably raise the temperature of the
surrounding rock over distances of several hundred metres for many centuries. This paper describes
continuing research at Harwell aimed at understanding how this heating affects the design of hard
rock depositories for the waste. It also considers how water-borne leakage of radionuclides from
a depository to the surface might be increased by thermal convection currents through the rock
mass and by thermally induced changes in its permeability and porosity. A conceptual design for
a three-dimensional depository with an array of vitrified waste blocks placed in vertical boreholes
is described. The maximum permissible power outputs of individual blocks and the minimum
permissible separations between blocks to limit the local and bulk average rock temperatures will
be determined by heat transfer through the rock and are reviewed. Interim results of a field heat
ing experiment to study transient heat transfer through granite are discussed subsequently. Field
experiments are now being started to measure the fracture permeability and porosity over large
distances in virgin granite and to investigate their variation on heating and cooling the rock.
Theoretical estimates of the temperatures, thermal stresses and thermal convection currents
around a depository are next presented. The implications for water-borne leakeage are that
the induced stresses could change the fracture permeability and porosity, and thermal convection
could cause substantial water movement vertically towards the surface. Finally some conclusions
from the work are presented.
1. Conceptual Depository Design
The term disposal is taken to mean terminal emplacement of waste in such a way that without any action at a later date, the waste remains effectively isolated from man's environment for as long as necessary to ensure health and safety. The present conceptual design has therefore been prepared on the basis that there is no intention to retrieve the waste after closure of the depository. In any case it is considered unlikely that provision could be made at the time of emplacement for an engineered retrieval capability which would remain reliable for any significant fraction of the life of a depository. While it is difficult to envisage any occurrence
137
138 BEALE et al.
which would lead to the decision to retrieve the waste, retrieval would remain technically feasible, albeit with increasing difficulty as time passes and temperatures rise.
If the highly active waste resulting from reprocessing irradiated fuel elements is immobilised by vitrification using the Harvest process, then the waste will be incorporated into glass blocks (typically 2m long and 0.45m diameter) cast in steel canisters 3m in length [1,2]. The glass will contain 15% by weight of fission product oxides and, based for example on PWR waste reprocessed at 4.5 years, each block will have a heat output of lkW after 70 years storage. A U.K. nuclear power programme building up to an installed generating capacity of 40 GW(e) by the year 2000 would produce 3500 Harvest canisters.
The proposed depository design envisages a number of inseries barriers to leakage of the radioactivity. The aim is to encase the Harvest canisters with materials which will contain the waste absolutely for at least 500 years. During this time the radioactivity falls by several orders of magnitude. Thereafter migration of the waste will be retarded by the low leach rate of the glass and slow progress through the fractures, retarded by sorption on the rock [3]. It would seem reasonable beyond this time to accept slow dispersion and dilution of the waste such that the rate of return of radioactivity to the environment does not create a hazard.
Over long time periods, the most probable mode of release is through groundwater contacting the waste [3]. It is therefore of prime importance in selecting a depository site to ensure that the prevailing hydrogeological conditions result in minimum groundwater movement and that this is not significantly perturbed by ei ther excavation of a depository or placing heat-emitting waste within it.
A minimum depth of 300m has been suggested for the construction of a depository [4] in order to avoid regions of the earth's crust subjected to micro-cracking during previous periods of glaciation. However, to achieve the desired hydrogeological conditions it may be necessary to go to greater depth.
The heat generated by radioactive decay of the waste impinges on virtually all aspects of depository design. It is intended that this heat will be dissipated by thermal conduction using the rock mass as a heat sink. At present a maximum rock temperature of approximately 100°C has been adopted to avoid physical and chemical changes which may be induced in crystalline rocks at higher temperatures [5].
IAEA-SM-243/26 139
If this limit is not to be exceeded then the heat output of individual canisters must be less than 1 kW at the time of disposal [6,7,8]. This implies a 70 year intermediate storage period for Harvest blocks. Storage of vitrified waste for several decades is entirely credible and is likely to be demanded by logistic considerations in any case. Furthermore, if the temperature close to a single block is not to be appreciably raised by the presence of other blocks in, the depository, then they should be separated by a least 20m in three-dimensional ' arrays and 15m in two dimensional arrays [7,8].
For all canister emplacement configurations, the overall depository dimensions and required excavation decrease markedly as the heat output of the canisters is reduced in storage for up to 100 years. After this period longer-lived radionuclides start to dominate the heat output and the benefits of storage dimi nish.
The depository has been kept as simple as possible,with the intention that it can be readily adapted to sites which may be inland, coastal or on an island and in an area of high or low relief.
A three-dimensional rather than two-dimensional array of canisters has been chosen (see fig. 1) since at any given depth in a hard rock formation the vertical extent of good quality rock is likely to be considerably greater than the lateral extent. In addition a three-dimensional configuration reduces the length of horizontal galleries, which are likely to represent the major excavation cost, and reduces spoil production.
A preliminary study of possible methods of excavating a depository suggests that emplacing the blocks in a cubic array could be achieved at minimum cost by driving 5m diameter horizontal galleries at depth with vertical boreholes in the floor up to 150m deep. The canisters could be placed in oversized holes which would be backfilled with materials having suitable heat transfer properties in addition to offering resistance to the migration of radionuclides.
Openings connecting a depository to the surface represent a direct route for the inflow of surface water and for the waterborne leakage of radionuclides. Their number must therefore be minimised and they must be effectively sealed at the end of the emplacement period to form a barrier at least equal to the host rock. One possible backfill material is bentonite clay, which is plastic and has exceptionally high water-absorbing and cation exchange capacities, in addition to being highly impermeable to flowing water.

1. RECEPTION A R E A FOR V I T R I F I E D WASTE
2. A D M I N I S T R A T I O N B U I L D I N G
3. I N C L I N E D S H A F T
U. W I ND I N G HOUSE FOR V E R T I C A L S H AF T TO REPOSI TORY
5. W I N D I N G HOUSE FOR V E R T I C A L S H A F T TO M I N I N G OP E R A T I ON
6. ACCESS T U N N E L S
7. D I S P O S A L HOLES
8. SPOI L
-P*О
F IG .L C onceptual design o f a d e p o s ito ry in hard rock.
BEALE
et al.

IAEA-SM-243/26 141
2. Experimental Programme
2.1 Heat Transfer
The temperatures occurring within and around a depository in lowly permeable rock (see eg. fig. 2) will be dependent on transient heat conduction over hundreds of metres for several centuries [7,8,9]. Existing data for the thermal conductivity and specific heat of granites are mainly limited to laboratory measurements with small specimens for short times [10] and lie in the range 3±1 W.m_l-i,"l.
To extend the distance and time ranges of these data, a field experiment has been started with an 18kW, 5m-long electrical heater at 50m depth in a 0.3m diameter, steel-cased hole in Cornish granite. The heater hole is surrounded by 16 holes containing 48 resistance thermometers. Earlier measurements in these holes showed that the permeability of the rock at the experimental depth is sufficiently low to ensure that heat transfer by free and forced convection is negligible compared to conduction. Further details and preliminary results of the heating experiment have been published [11].
This experiment has now been run for nine months with the temperature of the rock wall of the heater hole thermostated to 100°C, which required a constant power of 2.9kW. During this time the temperatures out to about 5m from the heater hole approached close to their steady state values. At distances greater than 10m the temperature rises remained less than the smallest accurately measurable rise of 1°C. The ambient temperature remained constant at 11.0 ± 0.5°C during the run.The results after 170 days operation are plotted as temperatures against radial distance from the heater in fig. 3, and compared with the theoretical prediction for a conductivity of 4W-m-l-°C-l.
Accurate analysis of .these data will not be possible until some ± lm uncertainty about the heater depth has been resolved by accurate measurement of its suspension cable at the end of the experiment. Subject to this uncertainty the specific heat per unit volume and thermal conductivity have been calculated to be 2.1 ± 0.2 MJ m_3-oc-l and 4±1 W-nH-° C“l respectively.
Shortly before the time of writing, the heater power was raised to 9kW and this condition will be maintained for some 6 to 12 months to increase the distances, temperatures and times over which data are being obtained. The conditions for these first two runs have in part been chosen so that the heater approximately simulates Harvest blocks in size and initial heat output at burial after 10 and 50 years storage. A decision on a final run at 18kW will depend on the results obtained at 9kW.
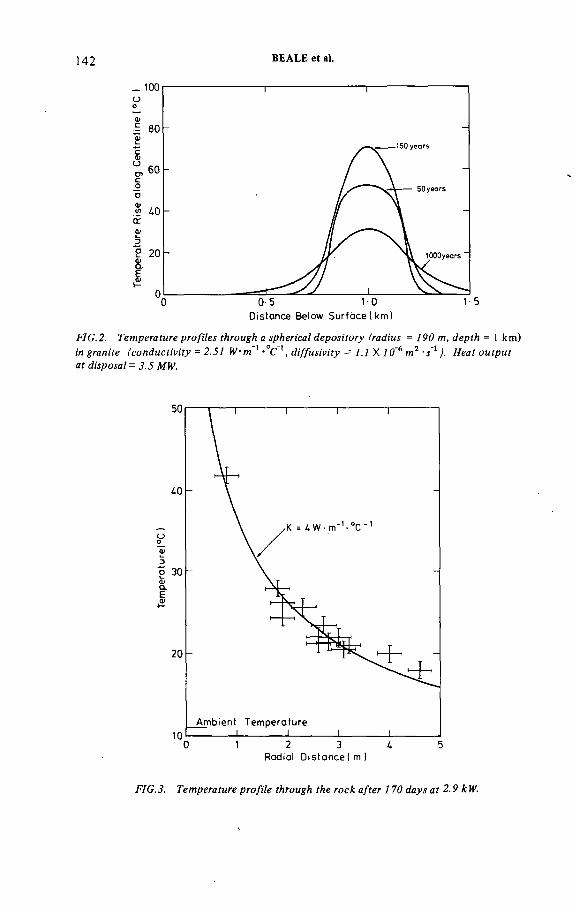
142 BEALE et al.
FIG.2. Tem perature p ro files through a spherical d e p o s ito ry (radius = 1 9 0 m , d ep th = 1 km)
in granite (co n d u c tiv ity = 2 .51 W- m 1 -°C 1, d iffu siv ity = 1.1 X 1 0 '6 m 2 - s '1 J. H ea t o u tp u t a t d isposa l = 3 .5 MW.
FIG.3. T em perature p ro file through the ro c k a fte r 1 7 0 d a ys a t 2 .9 kW.
IAEA-SM-243/26 143
Our conclusion from the present interim results of the Cornish heating experiment, and from comparison with results from the Karn-Bransle-Sakerhet/Lawrence Berkeley Laboratory experiments [12,13] at Stripa in Sweden, is that they show no unusual behaviour in conduction over the ranges of distance, temperature and time tested in granite. It may therefore be possible to predict reliably the temperatures in a full-size depository.
2.2 Fluid and Rock Mechanics
Naturally occurring and thermally induced water movement have been considered [14,15] and the latter may produce the faster flow to the surface for some millennia after burial.To quantify this thermal effect more accurately it is necessary to know the effective permeability and porosity of the rock mass. Experiments to measure these properties over appreciable distances have been designed [16] and are now being started in Cornwal1.
These properties of the rock in its natural state may also be affected by heating and thermal stressing due to constrained expansion. In particular, thermal tension and shear may change the natural water-conducting fractures in the rock. Repeats of the above measurements of permeability and porosity will be made after heating the rock.
In addition, measurements of the in-situ strain and elastic moduli of the heated rock will be made with the difficult but important objective of relating thermal stress to consequent changes in hydraulic properties. Understanding of these relationships is needed to improve the reliability of predicted water movements. Attempts to design further suitable experiments will be made in the light of experiences now being gained at Stripa [13].
3. Theory
At the present time there is a lack of information on the physical laws and associated parameters which characterise the response of a fractured rock mass to a large thermal load [17]. Consequently the preliminary estimates described here make the simplest assumptions, namely that temperatures, stresses and water movement are described by heat conduction, linear elasticity and Darcy flow respectively. In addition, the depository is idealised as a spherical region of rock with the same volume and average heat output as that described in section 1.
Temperature profiles along the centreline of the depository are shown in fig. 3 for 50, 150 and 1000 years after disposal [9,18]. The temperature rise at the centre of the depository

144 BEALE et al.
FIG.4. Therm al stresses along the vertica l axis o f a spherical d e p o s ito ry (radius = 1 9 0 m, d ep th = 1 k m ) in granite (Young's m odu lus = 4 0 GPa, P o isso n ’s ra tio = 0.3, c o e ff ic ie n t o f linear expansion = 8 X 1 0 6 °C 1). H eat o u tp u t a t d isposa l = 3 .5 MW.
reaches a maximum value of 70°C after about 150 years and then slowly decays as the heat is distributed over an ever-increasing volume of rock.
The corresponding thermal stresses [18,19] after 150 years are shown in fig. 4,together with an estimate [20] of the virgin stress state due to the weight of overlying rock. Near the centre of the depository the thermal stresses are compressive and of the same order of magnitude as the virgin stresses. This exacerbates the problems of building stable tunnels in an excavated depository [13].
In the cooler region surrounding the large volume of heated rock, thermally induced tensions tend to reduce the compressive stress state in the rock. This is likely to increase the aperture of fractures and hence increase the permeability of the rock mass to water flow [21]. Also, shear failures may occur along fracture planes [13,22] but it is not clear whether this would increase or decrease the permeability.

IAEA-SM-243/26 145
Distance from Centreline of Sphere! km)
FIG .5. Pathlines o f g rou n dw ater f lo w fro m a spherical d e p o s ito ry (radius = 1 9 0 m,d ep th = I km ) in granite (perm ea b ility = 10 16m 2, p o ro s ity = 10 4). Travel tim es are in d ica tedin years. H ea t o u tp u t a t d isposa l = 3 .5 MW.
It should be emphasised that the theory presented here assumes that the rock is a homogeneous, isotropic, linear elastic medium with a Young's modulus as measured for small intact samples [19]. In practice, the presence of fractures will mean that the mechanical response is not so simple.However, the present approach should provide a general guide to the design of depositories and to experiments aimed at elucidating the true response of the rock mass to a large thermal loading.
The temperature gradients arourid a depository provide a driving force for any water present in fractures. If the water had previously leached away some of the radionuclides in the waste, then this convective transport could shorten the transit time to the surface.
Assuming that the rock mass can be treated as a uniformly permeable medium, fig. 5 shows the pathlines [14,23] that would be followed by water present at various points within the depository at 1000 years after disposal. The water is seen to rise a few hundred metres above the depository level, thus

146 BEALE et al.
reducing the isolating effect of depository depth. At a sufficient distance from the depository, the flow is dominated by the regional pressure gradient.which has been taken to be horizontal and equal to 10~3 metres of water per metre.
The permeability ( l ( H 6m2) and porosity (10"^) used in these calculations are within the range of values measured for deep crystalline rock [15,24,25]. However, these may vary by many orders of magnitude from site to site, in different directions, and at different depths. The travel times marked on fig. 5 are correspondingly uncertain.
4. Conclusions
There is little doubt that the engineering capability exists to excavate and construct a depository in hard rock. However, many questions relating to the long-term isolation of the waste remain to be answered. From present heat transfer measurements it is thought possible to predict reliably temperatures for a full-scale depository. In contrast, predictions of thermally induced stress and water movement are uncertain because of a lack of appropriate experimental data.
ACKNOWLEDGEMENTS
The authors wish to thank A. Batchelor, J. Deane,M. George, A. Hollis, M. Ivanovich, J. Rae, D. Shelley,B. Watkins, B. Watson and M. Williams for a wide range of helpand advice during the course of this work. Funding from theCommission for the European Communities as part of the European Economic Community programme of research into underground disposal of radioactive waste, is gratefully acknowledged.
REFERENCES
[1] ROBERTS, L.E.J., Radioactive Waste: Policy and Perspectives, Lecture to the British Nuclear Energy Society, London9 November 1978, reprinted in Atom 267 (1979) p8.
[2] GRIFFIN, J.R., BEALE, H., BURTON, W.R., DAVIES, J.W., Geological Disposal of High Level Radioactive Waste: Conceptual Repository Design in Hard Rock, these Proceedings, SM-243/93.

IAEA-SM-243/26 147
[3] HILL, M.D., GRIMWOOD, P.D., Preliminary Assessment of the Radiological Protection Aspects of Disposal of High Level Waste in Geologic Formations, NRPB-R69 (1978).
[4] GRAY, D.A., et al, Disposal of Highly-Active Solid Radioactive Wastes into Geological Formations - Relevant Geological Criteria for the United Kingdom, London, HMSO,Inst.Geol.Sci., Report No. 76/12(1976).
[5] CHAPMAN, N.A., Minerological and Geochemical Constraintson Maximum Permissible Repository Temperatures, these Proceedings, SM-243/28. '
[6] DEANE, J.S., HOLLIS, A.A., Practical Aspects of Heat Transfer in Radioactive Waste Repository Design, UKAEA Rep. AERE-R9343 (1979).
[7] HODGKINSON, D.P., Deep Rock Disposal of High Level Radioactive Waste: Transient Heat Conduction from Dispersed Blocks, UKAEA Rep. AERE-R8763 (1977).
[8] BOURKE, P.J., HODGKINSON, D.P., Granite Depository for Radioactive Waste - Size, Shape and Depth v Temperatures,UKAEA Rep. AERE-M29Û0 (1977).
[9] HODGKINSON, D.P., BOURKE, P.J,, The Far Field Heating Effects of a Radioactive Waste Depository in Hard Rock, proceedings of OECD-NEA Seminar on In Situ Heating Experiments in Geological Formations, Stripa, Sweden (1978) p237.
[10] BOURKE, P.J., Heat Transfer Aspects of Underground Disposal of Radioactive Waste, UKAEA Rep. AERE-R8790 (1976).
[11] BOURKE, P.J., HODGKINSON, D.P., BATCHELOR, A.S., ThermalEffects in Disposal of Radioactive Waste in Hard Rock,proceedings of the OECD-NEA Seminar on In Situ Heating Experiments in Geological Formations, Stripa, Sweden (1978) pi 09.
[12] CARLSSON, H., A Pilot Heater Test in the Stripa Granite, LBL-7086/SAC-06 (1978).
[13] COOK, N.G.W., WITHERSPOON, P.A., Mechanical and Thermal Design Considerations for Radioactive Waste Repositories in Hard Rock, LBL-7073/SAC-10 (1978).
[14] BOURKE, P.J., HODGKINSON, D.P., Assessment of ThermallyInduced Water Movement Around a Radioactive Waste Depositoryin Hard Rock, proceedings of the OECD-NEA Workshop on Low- Flow, Low Permeability Measurements in Largely Impermeable Rocks, Paris, France (1979).
[15] BURGESS, A.S., CHARLWOOD, R.G., SKIBA, E.L., RATIGAN, J.L., GNIRK, P.F., STILLE, H., LINDBLOM, V.E., Analysis of Groundwater Flow Around a High-Level Waste Repository in

148 BEALE et al.
Crystalline Rock, Proceedings of the OECD-NEA Workshop on Low-Flow, Low Permeability Measurements in Largely Impermeable Rocks, Paris, France (1979).
П6] BOURKE, P.J., GALE, J.E., HODGKINSON, D.P., WITHERSPOON, P.A., Tests of Porous Permeable Medium Hypothesis for Flow Over Long Distances in Fractured Deep Hard Rock, proceedings of the OECD-NEA Workshop on Low-Flow, Low Permeability Measurements in Largely Impermeable Rocks, Paris, France (1979).
[17] Geotechnical Assessment and Instrumentation Needs for Nuclear Waste Isolation in Crystalline and Argillaceous Rocks, Berkeley, California, 1978, Symposium proceedings LBL-7096 (1979).
[18] HODGKINSON, D.P., Deep Rock Disposal of High Level Radioactive Waste: Initial Assessment of the Thermal Stress Field, UKAEA Rep. AERE-R8999 (1978).
[19] BATCHELOR, A.S., BOURKE, P.J., HACKETT, P., HODGKINSON, D.P., Initial Assessment of the Effects of Thermal Expansion ofa Granitic Repository for Radioactive Waste, UKAEA Rep. AERE-R9017 (1978).
[20] EVERLING, G., Discussion in State of Stress in the Earth's Crust, Ed. W.R. Judd, Elsevier, New York, p377 (1964).
[21] WITHERSPOON, P.A., AMICK, C.H., GALE, J.E., Stress-Flow Behaviour of a Fait Zone with Fluid Injection and Withdrawal, Univ. of California Berkeley Mineral Engineering Report 77-1 (1977).
[221 STEPHANSSON, 0., LEIJON, B., Temperature Loading and Rock Mechanics at Final Storage of Radioactive Waste, Univ. of LuleS Report 01-10 (1979).
[23] HODGKINSON, D.P., A Mathematical Model for Hydrothermal Convection Around a Radioactive Waste Depository in Hard Rock, UKAEA Rep. AERE-R9149 in preparation (1979).
[24] LUNDSTROM, L., STILLE, H., Large Scale Permeability Test of the Granite in the Stripa Mine and Thermal Conductivity Test, LBL-7052/SAC-02 (1978).
[25] HULT, A., GIDLUND, G., THOREGREN, U., Permeability Determinations and Geophysical Borehole Measurements in Southeastern Sweden for Radioactive Waste Studies, KBS-TR61 (1978).
IAEA-SM-243/120
TEMPERATURE DISTRIBUTION AND
THERMALLY INDUCED STRESSES
IN A HIGH-LEVEL WASTE REPOSITORY
H. HÂRKÔNEN
Technical Research Centre of Finland,
Reactor Laboratory,
Espoo
K. IKONEN, H. NORO
Technical Research Centre of Finland,
Nuclear Engineering Laboratory,
Helsinki,
Finland
Abstract
TEMPERATURE DISTRIBUTION AND THERMALLY INDUCED STRESSES IN A
HIGH-LEVEL WASTE REPOSITORY.
The disposal of heat-generating high-level waste in a geological formation induces a
considerable temperature rise in the rock mass surrounding the repository. This temperature
rise, together with the thermally induced stresses, may have adverse effects on the hydrogeological
and structural conditions in the repository, thus impairing the waste containment. The paper
gives the results of a preliminary analysis concerning temperature and stress distribution in a
high-level waste repository in hard crystalline rock. The disposal schemes analysed are con
cerned with solidified high-level waste from LWR fuel reprocessing. Temperature and stress
distributions were calculated using approximative two-dimensional repository models. The
stress state around the repository excavations depends to a great extent on the mechanical
properties of the rock mass and the applied gross thermal loading. By reducing the gross thermal
loading the region of strength failure can be considerably reduced.
1. INTRODUCTION
Emplacement into deep geological formations is at present considered one of the most promising solutions in the ultimate disposal of spent fuel or solidified high-level waste generated by spent fuel reprocessing. Several types of geological formations including salt, clay and hard rocks have recently been studied to assess their capability in accommodating a high- level waste repository. The bedrock in Finland is constituted mainly of hard crystalline rock of various types. The national research work in the field of geologic disposal is therefore directed toward the disposal into hard roek formations.
149

150 IAEA-SM-243/120
TIME AFTER DISCHARGE (YEARS)
FIG. 1. The h ea t generation ra te o f a w aste canister.
F IG .2. B oundary co n d ition s an d f in ite -e lem en t m odellin g o f th e storage room .
INITIAL PRESSURE
LOAD 13.2
MP
a

HÂRKÔNEN et aL 151
The high heat generation rate of high-level waste is one of the main problems associated with geologic disposal. The relatively low heat conductivity of granitic bedrock induces high temperatures in the vicinity of the waste canisters during the first decades after waste emplacements. Further diffusion of the released heat will raise the temperature in a large volume of rock surrounding the repository for centuries. This temperature rise may have adverse effects on the structural integrity and isolation capacity of the surrounding rock mass. Evaluation of the temperature rise is a preliminary step in the overall assessment of the geomechanical and hydrogeological response of the rock mass to the thermal loading due to waste emplacement.
The present paper will give the results of a preliminary analysis concerning temperature and stress distributions in the rock mass in and around a high-level waste repository. Calculations were performed using approximative two-dimensional repository models. This modelling does not yield exact temperature and stress distributions in the whole repository area but gives reasonably good local approximations for preliminary evaluation purposes.
2. REPOSITORY MODELLING
2.1 Characteristics of the high-level waste and repository layout
The high-level waste in this study refers to solidified reprocessing waste from LWR fuel reprocessing. The characteristic heat generation rate is presented in Figure 1. The curve in Figure 1 is based on PWR fuel with a burnup of 33000 MWd/tU.[l]. Reprocessing and vitrification are assumed to be performed 10 years after removal from the reactor.The volumetric yield of the solidified product is taken to be 0.15 nr/tU. The diameter and length of a typical waste canister are 0.4 m and 1.5 m, respectively. Every canister thus contains the waste from the reprocessing of 1.25 tU.
The conceptual repository analyzed in this study consists of parallel storage tunnels excavated in the bedrock at a depth of 500 m . ' The distance between the centerlines of adjacent storage tunnels is 20 m. Waste canisters are placed in drillholes spaced at 4 m along the tunnel floors. Figure 2 illustrates half of the cross-section of a typical storage room. The repository is dimensioned for the emplacement of a total of 1000 waste canisters, this corresponding to about 40 GW.a nuclear power generation.
The heat generation rate of a waste canister containing waste 10 years old is about 1.5 kW. The emplacement of these canisters in a 4 m by 20 m grid system corresponds to the

152 HARKÓNEN et al.
average initial gross thermal loading of 18 W/m¿ . Assuming the same canister size,the initial gross thermal loading can be reduced either by using a coarser emplacement network or by extended interim storage of the waste prior to emplacement.Two alternative disposal schemes were analyzed as a way of comparison: the emplacement of 10 years old waste in a 6 mby 25 m network and the emplacement of 50 years old waste in a 4 m by 20 m network. The corresponding initial values of the gross thermal loading are 9.7 W/m^ and 6.7 W/m^, respectively.
2.2 Rock mass modelling
Crystalline rock mass is characterized by many kinds of discontinuities, such as joints, fractures and shear zones. These features may have a significant effect on the deformation properties of the rock mass. For numerical calculations this complicated structure must be idealized with appropriate mathematical modelling.
In temperature calculations the rock mass has been considered a homogeneous and isotropic medium with a constant heat conductivity of 2.5 W/m*°C .This value has been chosen with a view to the eventual discontinuity of the rock mass and the tendency of the heat conductivity of many rocks to decrease with increasing temperature.
The mechanical properties for the structural analysis are the following [2]:- Young's modulus 21000 MPa- P o i s s o n ' s ratio 0.25
- coefficient of thermal expansion 8 x 10 1/°CThe material is assumed to be homogeneous,including no planes of weakness. The nonlinearity of the material properties is founded on the linear Mohr-Coulomb failure criterion: t = C-atancj) (compression negative), where т and a stand for the shearing stress and principal stress, respectively. The following coefficient values have been used in numerical calculations [2]:- cohesion, С 10 MPa- angle of internal friction, ф 34°
2.3 Mathematical modelling of the repository
A detailed thermomechanical analysis of a high-level waste repository must be based on a three-dimensional model of the repository area. The large dimensions of an actual repository will render such an analysis very expensive. Considerable savings in computation efforts can be achieved by employing approximative two-dimensional repository models.
IAEA-SM-243/120 153
Temperature fields were calculated by means of a computer code based on the finite-difference method. The near field temperature distribution was calculated utilizing a two- dimensional unit cell model in plane geometry (see Figure 2),
while the maximum waste temperatures were estimated by means of an axisymmetrical unit cell with gross thermal loading of 18 W/m^. The far-field temperature distribution was determined using axisymmetric repository modelling in which the repository area was taken to be a homogeneous disk with evenly distributed heat generation. The pre-emplacement temperature distribution is supposed to owe to the average geothermal gradient of 20°C/ km. Adiabatic boundary conditions were assumed on the unit cell boundaries, while the effect of tunnel backfilling was studied using adiabatic and conductive boundary conditions on the tunnel periphery.
The structural analysis of the repository was carried out with the finite element method in a state of plane strain.The program had been made in the Technical Research Centre of Finland. Elastoplastic strain hardening of the stress strain behaviour of the material was assumed. Figure 2 illustrates the model, boundary conditions and initial loads. The vertical in-situ stress was taken to stem from gravity and to be equal to the rock mass density times depth. According to the results of several field investigations the horizontal in situ stress is greater as a rule than the vertical stress at the depth of some hundred meters. In the presented analysis the horizontal in situ stress is assumed to be twice the vertical stress at a depth of 500 m.
3. RESULTS
3.1 Near-field temperature distribution
Near-field temperature distribution calculated by means of unit cell modelling is presented in Figure 3, which displays the temperature rise at various points of the local model during the first hundred years after the emplacement of 10 years old waste. The canister centerline temperature peaks at 200°C after three years, while the canister periphery temperature peaks at 140°C after 10 years. The maximum temperature rises of the hole periphery (a trench in plane geometry), tunnel floor and pillar centerline are 98°C, 84°C and 75°C, respectively.
The effect of tunnel backfilling was studied by applying a conductive boundary condition on the tunnel, periphery^ssuming the heat conductivity of the backfill material to be equal to that of rock. This change in the boundary condition has a minor effect on the overall temperature distribution. The most pronounced modifications occur in the regions near the tunnel periphery. The maximum floor temperature is about ten degrees lower, if heat transfer through the floor is assumed.
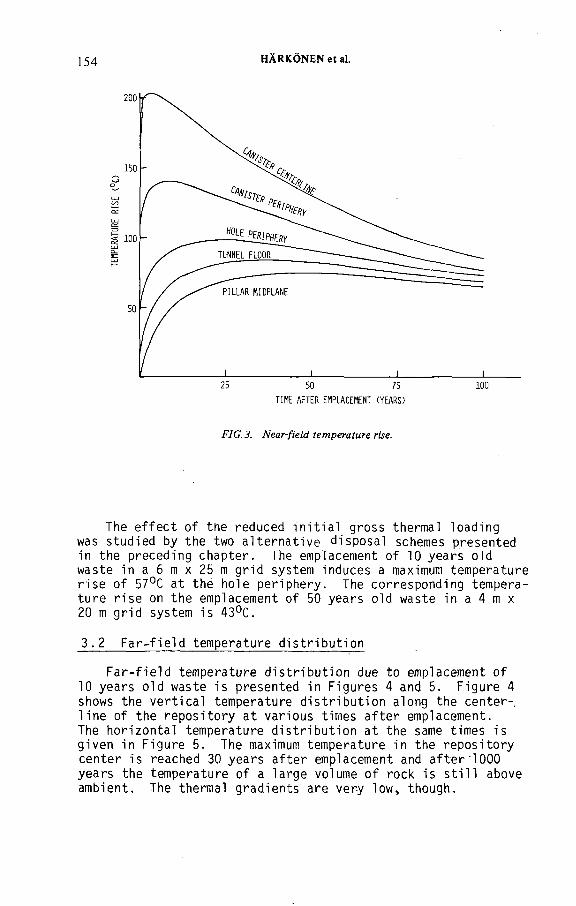
154 HÂRKÔNEN et al.
TIME AFTER EMPLACEMENT (YEARS)
FIG .3. N ear-field tem pera tu re rise.
The effect of the reduced initial gross thermal loading was studied by the two alternative disposal schemes presented in the preceding chapter. The emplacement of 10 years old waste in a 6 m x 25 m grid system induces a maximum temperature rise of 57°C at the hole periphery. The corresponding temperature rise on the emplacement of 50 years old waste in a 4 m x 20 m grid system is 43°C.
3.2 Far-field temperature distribution
Far-field temperature distribution due to emplacement of10 years old waste is presented in Figures 4 and 5. Figure 4 shows the vertical temperature distribution along the center- line of the repository at various times after emplacement.The horizontal temperature distribution at the same times is given in Figure 5. The maximum temperature in the repository center is reached 30 years after emplacement and after 1000 years the temperature of a large volume of rock is still above ambient. The thermal gradients are very low, though.

IAEA-SM-243/120 1
FIG.4. T em perature d istr ib u tio n a long th e vertica l cen terline o f th e re p o sito ry a t various tim es.
DISTANCE FROM REPOSITORY CENTER (Ю
F IG.5. H orizon ta l tem pera tu re d istr ib u tio n a t th e re p o sito ry plane a t various tim es.

156 HÂRKÔNEN et a l
FIG. 6. P ost-excavation strength failure.
FIG. 7. The region o f strength failure du e to the em pla cem en t o f 1 0-year-old waste.
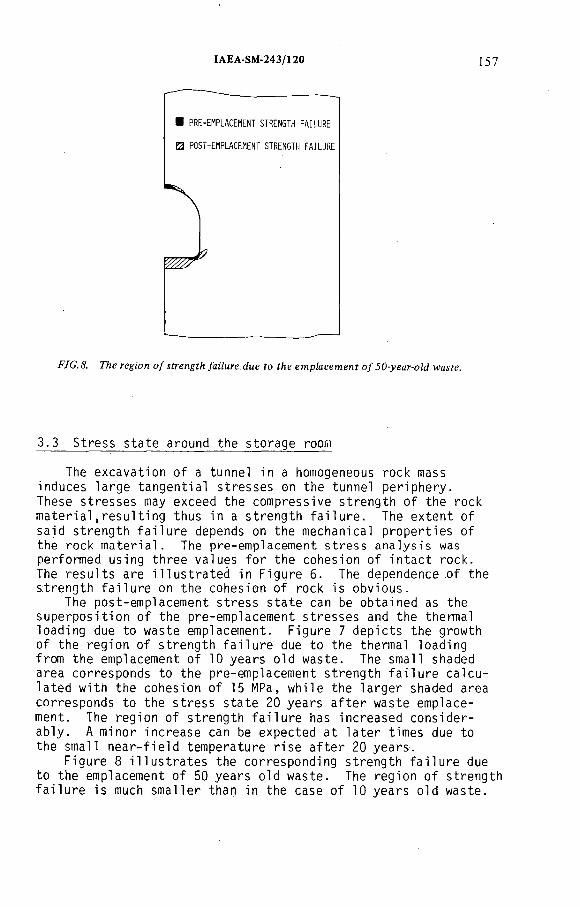
IAEA-SM-243/120 157
FJG.8. The region o f strength failure due to the em pla cem en t o f 50-year-o ld waste.
3.3 Stress state around the storage room
The excavation of a tunnel in a homogeneous rock mass induces large tangential stresses on the tunnel periphery.These stresses may exceed the compressive strength of the rock material,resulting thus in a strength failure. The extent of said strength failure depends on the mechanical properties of the rock material. The pre-emplacement stress analysis was performed using three values for the cohesion of intact rock.The results are illustrated in Figure 6. The dependence of the strength failure on the cohesion of rock is obvious.
The post-emplacement stress state can be obtained as the superposition of the pre-emplacement stresses and the thermal loading due to waste emplacement. Figure 7 depicts the growth of the region of strength failure due to the thermal loading from the emplacement of 10 years old waste. The small shaded area corresponds to the pre-emplacement strength failure calculated with the cohesion of 15 MPa, while the larger shaded area corresponds to the stress state 20 years after waste emplacement. The region of strength failure has increased considerably. A minor increase can be expected at later times due to the small near-field temperature rise after 20 years.
Figure 8 illustrates the corresponding strength failure due to the emplacement of 50 years old waste. The region of strength failure is much smaller than in the case of 10 years old waste.

158 HÀRKONEN et al.
The thermal analysis performed reveals the essential features of the temperature rise in connection with the disposal of high-level wastes in bedrock. Two-dimensional repository models used in the calculations give reasonably good results except in the immediate vicinity of the waste canisters. The eventual maximum temperatures cannot be expected to be essentially higher, though.The structural analysis was made with the assumption of the rock mass being homogeneous. This assumption usually does not hold true in actual rock mass. Consequently, the results presented must not be considered as an exact representation of the mechanical response of the rock mass to the thermal loading. However, the trend can be clearly seen.
In connection with the design of an actual repository,a detailed thermomechanical analysis must be carried out simultaneously taking into account the site-specific qeological and hydrological conditions. As the results presented above indicate, the extent of the strength failure depends upon the mechanical properties of the mass. Consequently, a more elaborate analysis must be based on three-dimensional repository models with appropriate mathematical modelling of the actual rock mass discontinuities.
The parameters for the thermal optimization of a repository design include the waste content of the solidified product, canister dimensioning, interim storage of the waste prior to emplacement and the emplacement geometry. With a proper combination of these parameters the temperature rise can be limited to meet the eventual thermal criteria concerning the maximum allowable temperatures or related strength failure in the rock mass surrounding an underground high-level repository.
4. RESULT EVALUATION AND CONCLUSIONS
REFERENCES
[1] EKBERG, K., KJELLBERT, N., OLSSON, G., Resteffektssudier for KBS Del 1. Litteraturomgâng’ Del 2. Berakningar,KBS teknisk rapport 7 (1977);
[2] RATIGAN, J.L., Groundwater Movement around A Repository, Rock Mechanical Analyses, KBS teknisk rapport 54:04 (1977) .

IAEA-SM-243/86
DIFFUSION DE LA CHALEUR DEGAGEE
PAR DES DECHETS VITRIFIES DE
HAUTE ACTIVITE DANS UN SOL HOMOGENE
N. JUIGNET, S. GOLDSTEIN, J. GEFFROY
CEA, Centre d’études nucléaires de Saclay,
Gif-sur-Yvette
R. BONNIAUD, F:L.H. LAUDE
CEA, Centre de Marcoule,
Bagnols-sur-Cèze,
France
Abstract-Résu mé
DIFFUSION OF THE HEAT RELEASED BY HIGH-LEVEL VITRIFIED WASTE IN
HOMOGENEOUS GROUND.
The paper deals with the calculation of the temperatures attained in an underground
storage zone consisting of a regular lattice of glass cylinders situated in homogeneous ground.
The calculations are performed by a numerical method using the finite-element theory in
which the temperatures are calculated as a function of time at the nodes of a mesh representing
either a single cell or the whole of the storage zone. After confirming the validity of the
single-cell model for calculating the maximum ground temperatures around a container, the
authors investigate the effect of the cell geometry — container dimensions and lattice
spacing — and the nature of the ground on the maximum ground temperatures. The accuracy
of the results is verified for a particular case using the point-source method of analysis.
DIFFUSION DE LA CHALEUR DEGAGEE PAR DES DECHETS VITRIFIES DE HAUTE
ACTIVITE DANS UN SOL HOMOGENE.
Le mémoire traite du calcul des températures atteintes dans une zone de stockage souterrain
composé d’un réseau régulier de cylindres de verre disposés dans un sol homogène. Les calculs
sont faits par une méthode numérique utilisant la théorie des éléments finis et où les tempéra-
tures sont calculées en fonction du temps aux noeuds d’un maillage représentant soit une cellule
unique, soit l’ensemble de la zone de stockage. Après confirmation de la validité du modèle de
cellule unique pour le calcul des températures maximales du sol au voisinage d’un conteneur,
on étudie l’influence de la géométrie de la cellule — dimensions du conteneur et du pas élémentaire
du réseau - et de la nature du sol sur les températures maximales du sol. On vérifie la précision
des résultats dans un cas particulier; on utilise la méthode analytique du point source.
159
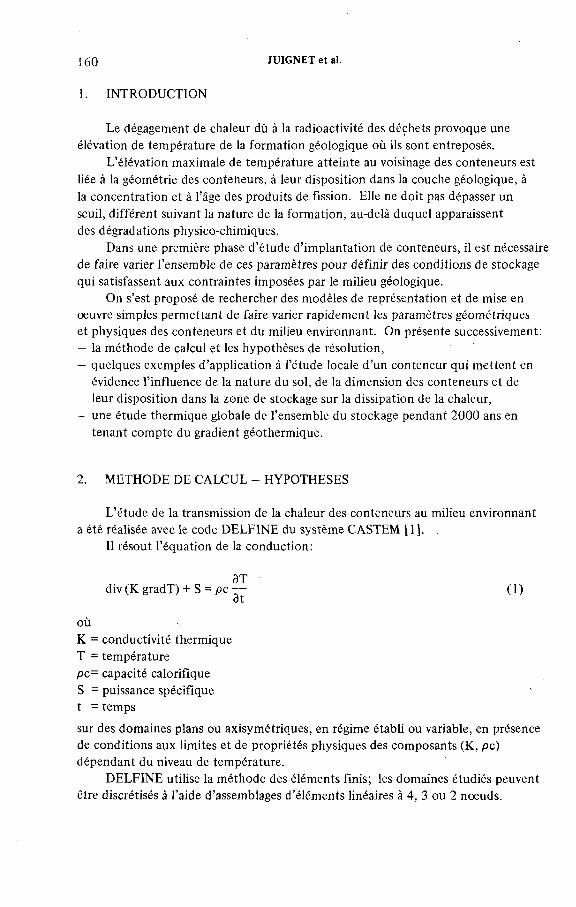
160 JUIGNET et al.
1. INTRODUCTION
Le dégagement de chaleur dû à la radioactivité des déchets provoque une
élévation de température de la formation géologique où ils sont entreposés.
L’élévation maximale de température atteinte au voisinage des conteneurs est
liée à la géométrie des conteneurs, à leur disposition dans la couche géologique, à
la concentration et à l’âge des produits de fission. Elle ne doit pas dépasser un
seuil, différent suivant la nature de la formation, au-delà duquel apparaissent
des dégradations physico-chimiques.
Dans une première phase d’étude d’implantation de conteneurs, il est nécessaire
de faire varier l’ensemble de ces paramètres pour définir des conditions de stockage
qui satisfassent aux contraintes imposées par le milieu géologique.
On s’est proposé de rechercher des modèles de représentation et de mise en
oeuvre simples permettant de faire varier rapidement les paramètres géométriques
et physiques des conteneurs et du milieu environnant. On présente successivement:
— la méthode de calcul et les hypothèses de résolution,
— quelques exemples d’application à l’étude locale d’un conteneur qui mettent en
évidence l’influence de la nature du sol, de la dimension des conteneurs et de
leur disposition dans la zone de stockage sur la dissipation de la chaleur,
— une étude thermique globale de l’ensemble du stockage pendant 2 0 0 0 ans en
tenant compte du gradient géothermique.
2. METHODE DE CALCUL - HYPOTHESES
L’étude de la transmission de la chaleur des conteneurs au milieu environnant
a été réalisée avec le code DELFINE du système CASTEM [ 1 ]. .
Il résout l’équation de la conduction:
div (K gradT) + S = pc (1)ot
où
K = conductivité thermique
T = température
pc= capacité calorifique
S = puissance spécifique
t = temps
sur des domaines plans ou axisymétriques, en régime établi ou variable, en présence
de conditions aux limites et de propriétés physiques des composants (K, pc)
dépendant du niveau de température.
DELFINE utilise la méthode des éléments finis; les domaines étudiés peuvent
être discrétisés à l’aide d’assemblages d’éléments linéaires à 4, 3 ou 2 noeuds.

IAEA-SM-243/86 161
Cette méthode conduit à résoudre le système linéaire [c] {T} = {F} o ù [c]
est la matrice de conductivité du domaine symétrique et de dimension égale au
nombre de noeuds du maillage. {F} est un vecteur qui contient les termes
«sources» (S).
A ce système on superpose les conditions aux limites du domaine qui peuvent
être du type Fourier, ou Dirichlet, ou Neumann.
La résolution du système se fait par la méthode de Choleski.
3. ETUDE LOCALE DU STOCKAGE
L’élévation de température maximale de la roche est atteinte au voisinage des
conteneurs situés au centre du réseau de stockage, zone où les effets de diffusion
de la chaleur dans la roche environnante hors stockage sont négligeables. Son
amplitude peut être déterminée par l’étude de la dissipation du flux de chaleur
dans une cellule élémentaire du réseau entourant un conteneur, n’échangeant aucun
flux avec les cellules alentour.
Le but d’une étude locale est de déterminer les dimensions optimales de la
cellule du réseau de stockage répondant aux critères thermiques imposés, en fonction
des divers paramètres:
— géométriques: dimensions du conteneur et distances radiale et axiale entre
conteneurs,
— physiques: nature du sol et densité de puissance dissipée.
On assimile la cellule élémentaire à un cylindre, le conteneur étant placé en
son centre (fig.l).
Au cours de l’étude, on fait varier les dimensions AR et AZ de la cellule et h
la demi-hauteur du conteneur. Cette représentation correspond sensiblement à un
réseau d’implantation hexagonal (9% de volume de roche n’est pas représenté).
Sur les limites extérieures de la cellule on impose un flux nul.
Pour une géométrie de conteneur et un âge des produits de fission donnés, la
température maximale la plus faible est obtenue quand le conteneur est placé seul
dans un milieu infini (ATmax°°). Cette température est comparée à la température
limite qui ne doit pas être atteinte et permet de sélectionner rapidement les condi
tions de stockage qui sont compatibles avec les critères imposés.
Si, à partir d’un milieu infini, on diminue les dimensions de la maille du
réseau, on définit une zone de pas de maillage (AR, AZ) à l’intérieur de laquelle
l’élévation de température maximale est égale à ДТщахоо.
Pour simplifier l’étude paramétrique, on a choisi d’utiliser toujours la même
discrétisation du domaine à étudier, quelles que soient ses dimensions et la nature
du sol. Le maillage est constitué d’éléments finis rectangulaires à quatre noeuds, et
représenté sur la figure 2 .
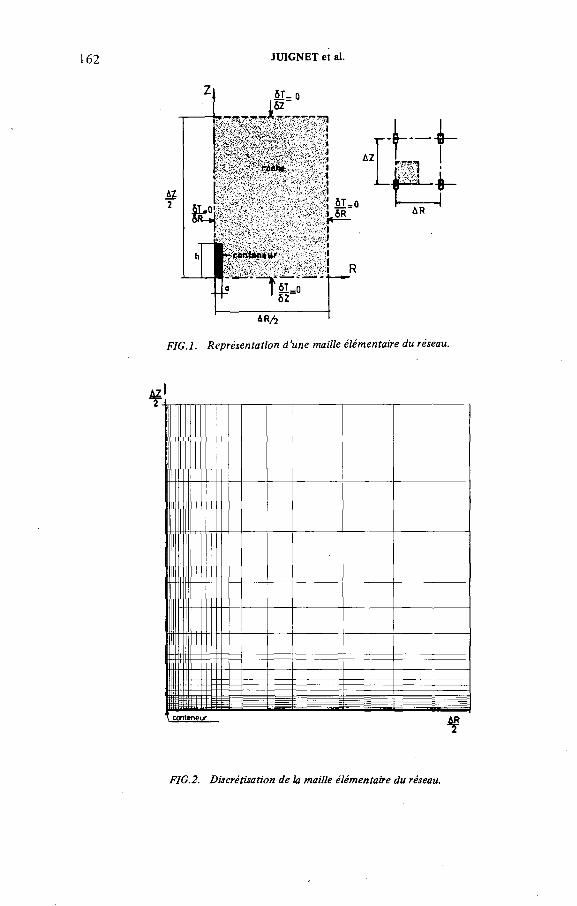
JUIGNET et al.
Л2 " H t "e±FIG. 1. R eprésen ta tion d ’une m aille élém en ta ire du réseau.
AZ2 -
* conteneur
F IG .2. D iscré tisa tion d e la m aille é lém en ta ire du réseau.

IAEA-SM-243/86 163
L’équation (1) est résolue en variables adimensionnelles, avec comme valeurs
de référence:
— pour les longueurs, le rayon (a) et la demi-hauteur (h) du conteneur,
— pour les valeurs physiques, la conductivité (K) et la capacité calorifique du
sol (pc),
— pour la puissance spécifique, (q0) des conteneurs au début de leur mise en
stockage géologique, quelle que soit la date d’origine du stockage.
Elle s’écrit en coordonnées cylindriques:
a2 Э / ЭТ*\ * Э /К* ЭТ*\ * *ЭТ*
tf 5? (K* ^ j +г 5? Ь J?)avec:
К* = 1 et pc* = 1 dans le sol. Kv pcyK = — et pc = — dans le conteneur
Ks pcs
KsT* = -r L- T
a q0
a2pcs
Les indices v et s sont relatifs au verre et au sol.
* indique les variables sans dimension.
L’évolution de la puissance spécifique en fonction du temps peut se mettre
sous la forme S(t) = q0 e'at,„ce qui permet de tenir compte du temps de séjour en
surface par simple variation du paramètre q0. Il vient:
a 2p c s
S*(t*) = e Ks ¿ans le conteneur
S*(t*) = 0 dans le sol
Les calculs sont effectués avec les hypothèses suivantes:
— Le sol est isotrope et homogène, ses propriétés physiques sont supposées
constantes dans l’étude paramétrique. L’influence de leur variation en fonction
de la température a été étudiée dans un cas particulier.
— Le conteneur est en contact parfait avec la roche. Il est assimilé à un
cylindre de verre dans lequel les produits de fission sont uniformément répartis.
— On ne calcule que les élévations de température par rapport à la température
initiale de la roche avant stockage. Le gradient géothermique n’est pas représenté.
— Les dimensions de la zone maillée sont suffisamment grandes pour
représenter une cellule isolée en milieu infini, c’est-à-dire que l’élévation maximale
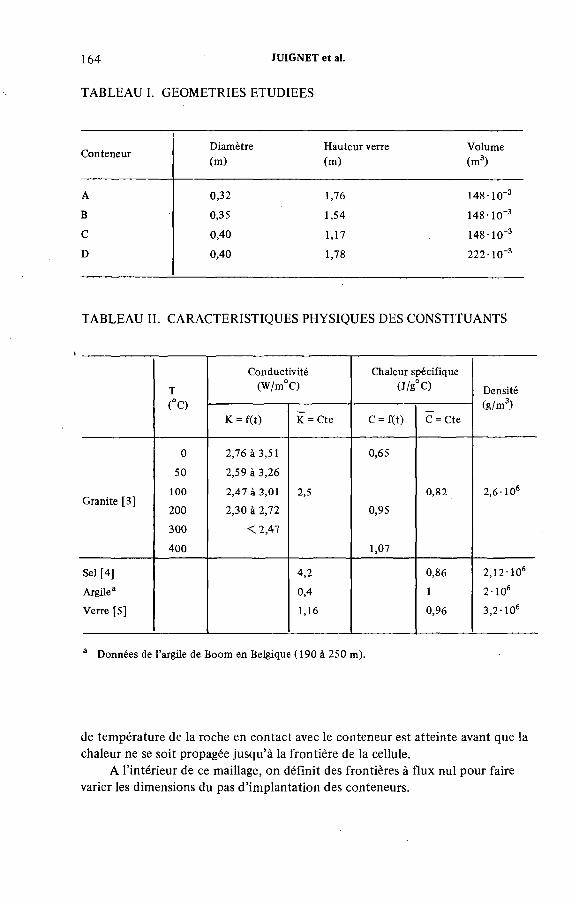
164 JUIGNET et al.
TABLEAU I. GEOMETRIES ETUDIEES
ConteneurDiamètre
(m)
Hauteur verre
(m)
Volume
(m3)
A 0,32 1,76 148-10'3
B 0,35 1,54 148-10-3
C 0,40 1,17 148 • 10"3
D 0,40 1,78 222-10'3
TABLEAU II. CARACTERISTIQUES PHYSIQUES DES CONSTITUANTS
T
(°C)
Conductivité
(W/m°C)
Chaleur spécifique
(J/B°C) Densité
(g/m3)
K = f(t) K = Cte C = f(t) C = Cte
0 2,76 à 3,51 0,65
50 2,59 à 3,26
100 2,47 à 3,01 2,5 0,82 2,6-106Granite [3]
200 2,30 à 2,72 0,95
300 <2,47
400 1,07
Sel [4] 4,2 0,86 2,12-106
Argile8 0,4 1 2-106
Verre [5] 1,16 0,96 3,2-106
a Données de l’argile de Boom en Belgique (190 à 250 m).
de température de la roche en contact avec le conteneur est atteinte avant que la
chaleur ne se soit propagée jusqu’à la frontière de la cellule.
A l’intérieur de ce maillage, on définit des frontières à flux nul pour faire
varier les dimensions du pas d’implantation des conteneurs.

IAEA-SM-243/86 165
La géométrie des conteneurs étudiés est indiquée dans le tableau I. Les
caractéristiques physiques du verre et des formations géologiques sont rassemblées
dans le tableau II. La loi de décroissance de la source de chaleur radioactive est
S(t) = q0 e-°’024t.
3.1. Détermination des dimensions optimales du pas de stockage
Cette étude est réalisée pour le conteneur A placé dans du granite. Les
caractéristiques physiques du granite sont prises constantes. Pour chaque dimension
du pas d’implantation des conteneurs on cherche l’élévation maximale de tempéra
ture atteinte en paroi du conteneur à partir de la mise en stockage.
Si on reporte sur un graphique les valeurs de ДТщах trouvées soit en fonction
de AZ pour chaque AR (fig.3), soit en fonction de AR pour un AZ donné (fig.4)
on obtient un faisceau de courbes paramétrées soit en AR, soit en AZ tendant vers
une valeur asymptotique. Sur ces deux graphiques on reporte la valeur de ДТщах à
AR ou AZ considéré infini. Ces deux courbes donnent les valeurs de ДТщах
minimales que l’on puisse obtenir à AZ ou AR imposé. Pour un stockage à une
nappe (AZ = °°) ou à un puits (AR = °°) elles indiquent à partir de quelle distance
les conteneurs interfèrent entre eux. Dans l’exemple traité, on relève pour un
stockage en plan un AR minimal entre conteneurs d’environ 2 1 m, pour un
stockage vertical un AZ minimal d’environ 18 m. L’influence radiale est prépondé
rante par rapport à la distance verticale.
La figure 5 fait la synthèse des résultats précédents. On représente en fonction
de AR et AZ la zone de pas de répartition des conteneurs qui permet d’obtenir
l’élévation de température minimale soit ДТщах°°. On observe à la frontière de
cette zone qu’à une élévation de ДТщах d’environ 1°C correspond une diminution
de AR de 1 m et de AZ de 4 m. Il apparaît qu’il existe sur le pourtour de cette
zone une plage de variation de AR très faible où l’élévation de la température
croît brutalement. Pour le conteneur A mis en stockage à l’âge de 25 ans on
obtient:
- si AR= AZ = 21 m, ДТщах = 81°C
- si AR = AZ = 19 m, ДТщах = ЮЗ°С.
3.2. Influence de l’âge des produits de fission
Si la courbe de décroissance de la puissance spécifique est constante dans le
temps, la diffusion de la chaleur dans le milieu environnant le conteneur est
identique quel que soit l’âge des déchets au début du stockage; seul le niveau
général de la température est différent, il est proportionnel à la puissance dégagée
à l’origine du stockage.
QUELQUES EXEMPLES D ’ETUDES PARAMETRIQUES

166 JUIGNET et al.
ai l_ ' Э4-»Di_
*<VQ.eeu
Q)■D_Q)"oEXоEcо
LU
Distance axiale entre conteneurs
FIG.3. E lévation m axim ale de tem péra tu re de la roche en fo n c tio n de la d istan ce axiale en tre conteneurs.
Distance radiale entre conteneurs
F IG .4. E lévation m axim ale d e tem péra tu re d e la roche en fo n c tio n de la d istan ce radiale en tre conteneurs.
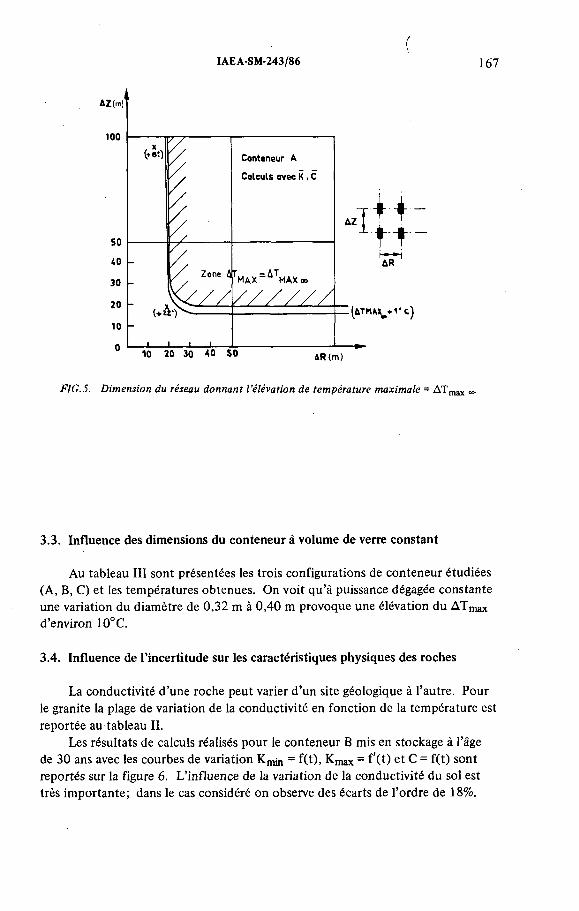
IAEA-SM-243/86
f167
FIG.S. D im ension du réseau don n an t l ’éléva tion d e tem péra tu re m axim ale = ДТтах
3.3. Influence des dimensions du conteneur á volume de verre constant
Au tableau III sont présentées les trois configurations de conteneur étudiées
(A, В, C) et les températures obtenues. On voit qu’à puissance dégagée constante
une variation du diamètre de 0,32 m à 0,40 m provoque une élévation du AT max
d’environ 10°C.
3.4. Influence de l’incertitude sur les caractéristiques physiques des roches
La conductivité d’une roche peut varier d’un site géologique à l’autre. Pour
le granite la plage de variation de la conductivité en fonction de la température est
reportée au tableau II.
Les résultats de calculs réalisés pour le conteneur B mis en stockage à l’âge
de 30 ans avec les courbes de variation Kmjn = f(t), Кщдх = f'(t) et C = f(t) sont
reportés sur la figure 6 . L’influence de la variation de la conductivité du sol est
très importante; dans le cas considéré on observe des écarts de l’ordre de 18%.

0 \oo
TABLEAU III. ELEVATIONS DE TEMPERATURE MAXIMALES OBTENUES POUR DIFFERENTES
CONFIGURATIONS ETUDIEES
Date d ’origine du stockage t0 = 25 ans; q0 = 7,314 X 103 W/m3
Valeurs de
K, CConteneur
AR
(m)
AZ(m)
Granite Sel Argile
ДТ (°C) t (an) ДТ (°C) t (an) ДТ (°C) t (an)
A OO oo 81 ~ 0,5 50 ~ 0,5 464 2
B OO oo 87 1,5
K C oo oo 92 1,5 55 0,5 524 2
D oo oo 106 1
A 13 oo 89 6 84 5 467 2
C B 12 oo 97 8
D 12 oo 125 12
K , n i n , C = f ( T ) B 12 oo 97,3 6
JUIG
NET
et
al.

IAEA-SM-243/86 169
FIG. 6. In fluence de la variation de la co n d u c tiv ité du granite.
3.5. Influence de la nature de la roche
La différence de comportement vis-à-vis de la diffusion de la chaleur entre
trois sortes de milieux géologiques, granite, sel et argile, apparaît au vu des
résultats obtenus pour deux configurations de maille d’implantation de conteneurs,
l’une de dimensions infinies, l’autre simulant un stockage, sur une seule nappe, les
conteneurs étant distants de 12 m les uns des autres. L’argile, de plus faible
conductivité, donne les élévations de températures maximales mais cette valeur
est réduite de moitié à une distance d’environ 50 cm du conteneur et n’est pas
influencée par le rapprochement des conteneurs. Par contre, dans un stockage
dans le sel, pour lequel ДТщах est le plus faible, АТщах s’accroît fortement quand
la distance entre conteneurs diminue et est sensiblement égal à ce que l’on obtient
dans le granite, qui a une diffusivité plus faible.
3.6. Précision des résultats
3.6.1. Influence du pas de temps et des maillages
L’utilisation de la méthode numérique des éléments finis pour résoudre
l’équation de la chaleur nécessite de mailler le domaine. La précision des résultats
dépend de la dimension des mailles et du pas de temps. Le mode de découpage
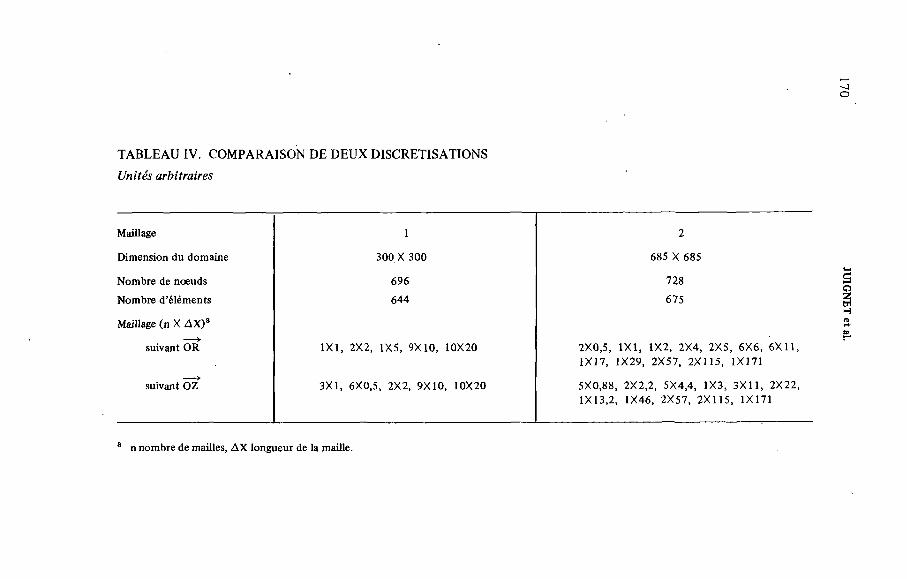
TABLEAU IV. COMPARAISON DE DEUX DISCRETISATIONS
Unités arbitraires
Maillage 1 2
Dimension du domaine 300 X 300 685 X 685
Nombre de noeuds 696 728
Nombre d’éléments 644 675
Maillage (n X AX ')3
suivant OR 1X1, 2X2, 1X5, 9X10, 10X20 2X0,5, 1X1, 1X2, 2X4, 2X5, 6X6, 6X11,
1X17, 1X29, 2X57, 2X115, 1X171
suivant OZ 3X1, 6X0,5, 2X2, 9X10, 10X20 5X0,88, 2X2,2, 5X4,4, 1X3, 3X11, 2X22,
1X13,2, 1X46, 2X57, 2X115, 1X171
a n nombre de mailles, ДХ longueur de la maille.
170 lU
lGN
ET
etal.
IAEA-SM-243/86 171
espace-temps est lié aux constantes physiques du domaine. Toutefois, plus le
maillage est fin et le pas de temps faible, plus le calcul est coûteux. On cherche
donc une discrétisation optimale qui donne des coûts de résolution raisonnables
en favorisant les zones de fort gradient, c’est-à-dire au voisinage du conteneur aux
dépens des zones de faibles gradients de températures.
Pour l’étude de la cellule élémentaire nous avons effectué deux maillages
différents (voir tableau IV). Le maillage 2 a une discrétisation plus fine autour du
conteneur; il donne un ATmax°° 3% plus élevé que le maillage 1.
Une étude sur la période d’évolution de 4 ans suivant le début du stockage a
montré qu’un découpage en pas de temps deux fois plus petit (0,25 an X 8 +
0,5 an X 4, au lieu de 0,5 an X 4 + 1 an X 2) a une incidence sur la valeur de
ДТщах oo inférieure à 1 %.
3.6.2. Calcul de ДТщах °° par une méthode analytique
La méthode analytique du point source de chaleur [2] appliquée à unxylindre
de verre actif permet de déterminer l’élévation de la température en tout point du
domaine étudié.
L’élévation de la température en paroi du conteneur s’exprime en fonction
du temps par l’expression:
t
f Í z + h . z “h j __ S(t)a2
J S(W (' ' e* )etf -erf-jmо
a et h = rayon et demi-hauteur du conteneur
S (t ) = pu issance spécifique du verre par m 3
U = variable intermédiaire de temps.
Pour des calculs réalisés avec les mêmes hypothèses que précédemment on a
obtenu, pour un conteneur B placé dans un milieu infini, par la méthode du point
source, ДТщах oo = 83,4°C, et par la méthode des éléments finis, ДТщах °° = 80,4°C
(t0 = 30 ans). Cet écart est partiellement dû à la discrétisation du domaine.
4. ETUDE THERMIQUE GLOBALE DE L’ENSEMBLE DU STOCKAGE
Comme pour l’étude précédente, on assimile la zone de stockage et la roche
alentour à des cylindres. La zone de stockage est située au centre et la partie
supérieure correspond à la surface du sol au niveau zéro.
ДТЯ =2pc
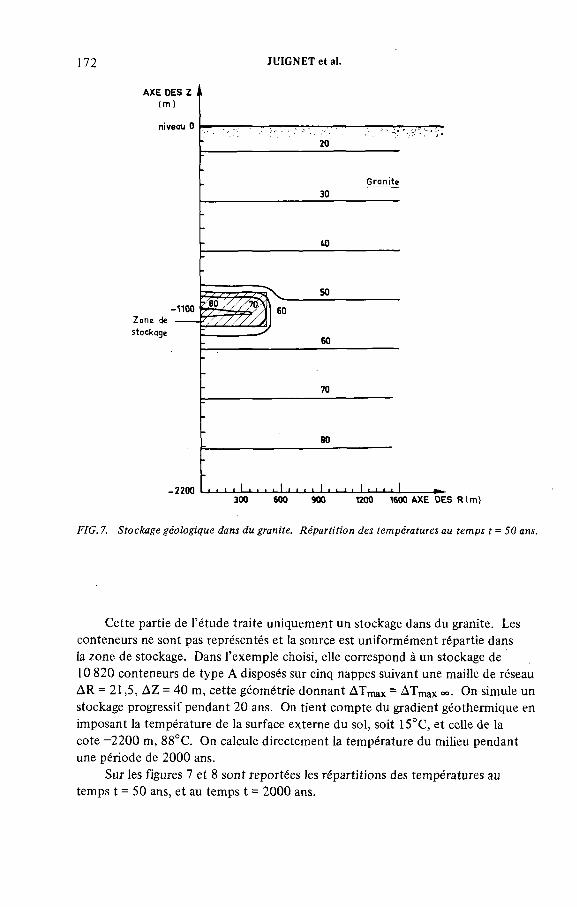
172 JUIGNET et al.
FIG. 7. Stockage géologique dans du granite. Répartition des températures au temps t = 50 ans.
Cette partie de l’étude traite uniquement un stockage dans du granite. Les
conteneurs ne sont pas représentés et la source est uniformément répartie dans
la zone de stockage. Dans l’exemple choisi, elle correspond à un stockage de
10 820 conteneurs de type A disposés sur cinq nappes suivant une maille de réseau
AR = 21,5, AZ = 40 m, cette géométrie donnant ДТтах= ДТщахоо. On simule un
stockage progressif pendant 20 ans. On tient compte du gradient géothermique en
imposant la température de la surface externe du sol, soit 15°C, et celle de la
cote —2200 m, 88°C. On calcule directement la température du milieu pendant
une période de 2000 ans.
Sur les figures 7 et 8 sont reportées les répartitions des températures au
temps t = 50 ans, et au temps t = 2000 ans.

IAEA-SM-243/86 1 173
FIG.8. Stockage géologique dans du granite. Répartition des températures au temps t = 2000 ans.
T(°C)
FIG.9. Evolution de la température à la profondeur Z = — 1100 m.
174 JUIGNET et al.
La répartition radiale des températures dans la zone de stockage (fig.9) montre
que pendant les 100 premières années du stockage, il n’y a pratiquement pas de
dissipation radiale de la chaleur dans une zone centrale de 300 à 400 m de rayon,
ce qui permet de confirmer les hypothèses sur la représentation de la maille
élémentaire utilisée pour l’étude du stockage local. On vérifie les déphasages des
phénomènes locaux et globaux pour une configuration d’implantation des
conteneurs donnant une élévation maximale de température égale à ДТщдх <*>;
cette élévation est atteinte localement quelques années après le début du stockage
tandis que l’élévation maximale moyenne de l’ensemblè est atteinte après une
période de 100 ans, à une époque où les effets locaux sont atténués.
5. CONCLUSION
L’utilisation de la méthode des éléments finis pour traiter l’équation de la
chaleur permet, à partir de représentations simples de la maille élémentaire du
réseau ou de l’aire de stockage dans son ensemble, sans coût de calcul élevé, de
faire varier un grand nombre de paramètres géométriques ou physiques et
d’éliminer des cas de stockage qui ne sont pas compatibles avec les contraintes
imposées par le milieu géologique et les conteneurs.
Ainsi l’étude paramétrique a mis en évidence les effets importants, observés
sur l’élévation maximale de la température, de la plage de variation de la conduc
tivité thermique de la roche, tandis qu’à puissance thermique constante, le
changement de géométrie du conteneur apparaît comme un paramètre secondaire.
On constate, si l’on désire réaliser un stockage des conteneurs sur plusieurs
niveaux, qu’il existe toute une plage de combinaisons de pas d’implantation
(AR, AZ) des conteneurs qui permet d’obtenir l’élévation maximale de température
identique à celle d’un conteneur isolé. On a déterminé la frontière de cette zone
qui indique les valeurs de AR et AZ minimales au-dessous desquelles la température
maximale et le temps mis pour l’atteindre croissent fortement.
Cette modéUsation simple du stockage a permis de faire une première
approche du problème posé.
REFERENCES
[1] GOLDSTEIN, S., JOLY, J., JUIGNET, N., Système CEA-SEMT-DELFINE, Rapport
CEA SMTS 78/25 (1978).
[2] CARSLAW, JAEGER, Conduction of Heat in Solids, Oxford Univ. Press, London, New
York (1959).
[3] BIRCH, F., SHAIRER, J.P., SPICER, М., Handbook of Physical Constants, Geol. Soc.
Am., Spec. Pap. 36 (Jan. 1942).
[4] The Selection and Evolution of Thermal Criteria for a Geologic Waste Isolation Facility
in Salt, Y/OWI/SUB 76/7220 (1976).
[5] BONNIAUD, R., CEA, Note interne.

IAEA-SM-243/15
INVESTIGATIONS ON TEMPERATURE RISE
AND RELATIVE DISPOSAL AREA REQUIREMENTS
FOR LWR-WASTE DISPOSAL STRATEGIES
IN SALT DOMES*
E. KORTHAUS, P. DONATH
Kernforschungszentrum Karlsruhe GmbH, Karlsruhe
P. PLOUMEN, G. STRICKMANN, P. W1NSKE
Rheinisch-Westfalische Technische Hochschule, Aachen,
Federal Republic of Germany
Abstract
INVESTIGATIONS ON TEMPERATURE RISE AND RELATIVE DISPOSAL AREA
REQUIREMENTS FOR LWR-WASTE DISPOSAL STRATEGIES IN SALT DOMES.
Parameter studies were performed for four different high-level waste categories from
LWRs — high-level waste without actinides (i.e. fission products), high-level waste including
actinides, high-level waste from mixed oxide LWr | fuel (Pu recycling), and spent fuel - in
order to determine the maximum salt and waste temperatures in a salt dome HLW repository.
The results are summarized in closed form interpolation formulae that allow easy estimates
to be made of these characteristic temperatures and of disposal area requirements at given
maximum salt temperatures. Furthermore some considerations are presented of the long-term
thermal load and its effect on relative disposal area requirements. For accurate prediction!
about the temperature distribution in the environment of disposed radioactive waste, model
calculations were performed taking into account the charging sequence of the waste. The
calculational results are compared with those which are obtained when supposing instantaneous
loading of a borehole, a sequence of boreholes, and a complete repository. This comparison
shows that on the one hand the temperature distributions obtained become quite different.
On the other hand even in the worst case maximum temperature is only insignificantly higher.
* Work partially performed under contracts 15-76-1 WASD and 058-78-1 WASD
with the Commission of the European Communities.
175
176 KORTHAUS et al.
Parti
(E. Korthaus, P. Donath)
1. MAXIMUM TEMPERATURES AND RELATIVE DISPOSAL AREA
REQUIREMENTS
In the Federal Republic of Germany (FRG), it is foreseen to dispose of
solidified high-level waste in rock salt formations. An important safety criterion
in this concept is the maximum temperatures arising in the waste blocks
(borosilicate glass) and in the surrounding salt. The maximum salt temperature
may also be used as a reference basis for estimating the relative disposal area
requirements in different waste and disposal strategies.
The complex dependency of these quantities on several waste and repository
design parameters is difficult to present extensively by graphics or in tables in a
form suitable for use. Therefore, closed form interpolation formulae were
developed which allow easy estimates in the most interesting cases. They are based
on the results of a large number of case studies (Section 1.1.).
With respect to possible consequences of the temperature rise, one has to
consider not only the maximum temperatures occurring within an 80-year period
after disposal, but also the long-term global heat load of the geologic formation.
Some aspects of the influence of waste and disposal field parameters on the
global heat load are discussed in Section 1.2. with a view to the relative area
requirements.
1.1. Interpolation formulae
The non-stationary temperature distributions in HLW disposal fields with
different waste and repository design characteristics were calculated using the
TEFELD 2-dimensional computer code [ 1 ].
The following model assumptions were made in these calculations:
Unit cell calculation supposing a periodic hexagonal borehole arrangement
and simultaneous filling of the storage holes.
Corridors situated above the boreholes are not considered.
No backfilling between waste blocks and borehole wall.
The following four waste categories were considered:
FP: High-level waste from LWR [2] without actinides (i.e. fission
products); bumup 33000 MW-d/t at 30 MW/t.

IAEA-SM-2^3/15 177
HLW: LWR high-level waste including actinides corresponding to 99%
of Pu-separation 3 years after removal from the reactor (derived
from [2]).
HLW(MOX): High-level waste from LWR fuel cycle with 3-fold Pu-recycling [3]
(preliminary).
SF: Spent fuel from LWR [2]; same bumup as for HLW.
For the various waste and repository design parameters the following variation
ranges were considered. These generally represent present ideas of possible
concepts:
К (fission product concentration in the waste blocks) 200-700 g/ltr
tRE (cooling time before storage) 6—30 a
D (waste block diameter) 0.2-0.3 m
L (source length, i.e. stack height in the storage hole) 10—500 m
A (borehole pitch) 8— 50 m
Combinations of these parameters were selected so that maximum salt
temperatures between 120°C and 350°C were obtained.
Using the results of these calculations and guided by some theoretical
considerations, analytical expressions were developed that describe in a good
approximation the correlation between the various parameters and the maximum
waste and salt temperatures. A fundamental feature of these interpolation
formulae is the formal consideration of the superposition of the temperature field
from a single source and the contribution by the remaining boreholes.
The maximum temperatures in the salt, i.e. at the borehole wall, are
described by the following expression:
Tmax=:c1-X-(l+ c2X) + To ;
X = K D 2 ^1-e °3Lj ^ 2 - - c 4] + c5L- (1 + c L 6)/(L + c7) f(tRE )
f( tR E ) a!= l Si =0.024
T0 is the initial salt temperature at the disposal horizon. The fitted coefficients
c¡ and ai as well as the characteristic decay constants Si are given in Table I for
the four different waste categories.

178 KORTHAUS et al.
TABLE I. INTERPOLATION FORMULA CONSTANTS FOR MAXIMUM SALT TEMPERATURE
Wa s t e
Ty p e C1 c 2 c 3 c 4 c 5 c 6 c 7 a 2 a 3 s 2 s 3
F P 9 6 .0 0 .1 4 0.0082 0.00002 0.022 - .0 0 0 3 5 2 .5 0 .04 0.17 0 .0 8 1 0 .3 3 0HLW 1 0 3 .0 0 .1 4 0 .0 0 3 2 0 .0 0 0 0 2 0 .0 2 2 - .0 0 0 3 5 2 .5 0 .0 4 0 .1 7 0 .0 8 1 0 .3 3 0
HLW(MOX) 1 1 2 .2 0 .1 4 0 .0 0 8 2 0 .0 0 0 0 2 0 .0 2 2 - .0 0 0 3 5 2 .5 1 .0 0 0 .2 5 0 .0 3 8 0 .3 3 0SF 8 8 .7 0 .1 4 0 .0 0 7 8 .000017 0 .0 2 2 0 .0 0 1 2 .5 0 .0 0 0 .3 5 - 0 .0 0 3
TABLE 11. INTERPOLATION FORMULA CONSTANTS FOR MAXIMUM WASTE TEMPERATURE
Ha s t e
T y p e C1 c 2 c 3 c 4 c 5 c 6 c 7 a 2 °3 s 2 s 3
FP 9 5 .8 0 ,1 2 0 .0 0 8 8 0 ,0 0 0 0 4 0 ,0 3 0 - .0 0 0 1 5 1 .0 0 .0 3 0 .2 8 0 .0 8 1 0 .3 3HLW 9 9 .7 0 .1 2 0 .0 0 8 8 0 ,0 0 0 0 4 0 ,032 - .0 0 0 1 5 1 .0 0 .0 3 0 .2 8 0 .0 8 1 0 .3 3
HLW(HO X) 122.0 0.12 0 .0 0 8 8 0 .0 0 0 0 4 0 ,0 3 2 - .0 0 0 1 5 1 .0 0 .8 0 0 .2 8 0 ,0 3 8 0 ,3 3
The accuracy of the formulae relative to the fitted temperature values
amounts to about 1-4%, unless extremely unfavourable configurations are
selected.
With the same formula also the maximum temperatures in the waste blocks
may be described, when a direct thermal contact exists between the waste blocks
and the borehole wall. The corresponding fitting constants are given in Table II.
The accuracy is somewhat lower here (1—6%). The reason is that the
maximum waste block temperature occurs from case to case at strongly varying
times (1 — 60 a). This is difficult to describe with simple interpolation formulae.
Spent fuel is not considered here, because no German concept currently exists
for a possible design of such waste blocks.
Today it is still not known at what time an air gap initially present between
the blocks and the borehole wall will be closed due to borehole closure. It is
therefore interesting to know the maximum waste block temperatures in the
presence of such an air gap.
A corresponding interpolation formula can be found when an additional term
is introduced in the first equation:
Tmax= СГ X ' 0 +C2X) + C8-K- D- f ( t R E ) + T0
Assuming an air gap of 0.03 m, one finds c8 = 0.86 and fitting constants as given
in Table III.

IAEA-SM-243/1 S 1 7 9
T A BLE I I I . IN T ERPO LA T IO N FORMULA CONSTANTS FOR MAXIMUM WASTE TEM PERATURE (W ITH A IR G A P )
Wa s t eTy p e C1 c2 c 3 Ci, c 5 ,c 6 c 7 a 2 a 3 s 2 s3
FP 8 2 .5 0 .0 7 0 .0 0 8 0 .00002 0 ,0 4 5 - 0 .0 0 0 5 0 ,0 0 .0 3 0 .6 5 0 .0 8 1 0 .3 3HLW 8 8 .0 0 .0 7 0 .0 0 8 0 ,0 0 0 0 2 0 ,0 4 5 - 0 .0 0 0 5 0 ,0 0 .0 4 0 .6 5 0 ,0 8 1 0 ,3 3
HLW(MOX) 9 0 .9 0 .0 7 0 .0 0 8 0 .0 0 0 0 2 0 .0 4 5 - 0 .0 0 1 0 0 ,0 1 .2 0 0 .6 5 0 ,0 3 8 0 ,3 3
T A BLE IV , IN TERPO LA T IO N FORMULA CONSTANTS FOR BO REHOLE P IT C H
W a s t e
T y p e C1 c 2 c 3 c 4 c 5 c 6 a 2 a 3 s2 s 3
F P 9 .6 4 0 .0 0 6 9 0 .0 0 1 2900 2 .7 0 .0 0 1 6 0 .0 4 0 ,1 4 0 .0 8 1 0 .3 3 0HLW 9 .5 7 0 .0 0 6 9 0 ,0 0 1 2900 2 ,7 0 .0 0 1 6 0 .0 3 0 .1 2 0 .0 8 1 0 .3 3 0
HLW(HOX) 1 0 ,0 0 0 .0 0 6 9 0 .0 0 1 2900 2 .7 0 ,0 0 1 6 1 .0 0 0 .2 0 0 .0 3 8 0 .3 3 0SF 9 .6 0 0 ,0 0 6 6 0 ,0 1 0 250 2 ,5 0 ,0 0 1 8 0 .0 0 0 .2 0 - 0 .0 0 3
Here also the accuracy is somewhat lower ( 1 —8%) for the reasons mentioned
above.
The borehole pitch needed at a given maximum salt temperature T can be
described by the following expression, which is an approximate inversion of the
initial equation:
A = C!(T-T0) c2 c 3 - ( L + c 4 )
K-D2-(l-e°*L)f(tRE) L + cs
-0.5
( 1 + C 6T).0.5
T he co rre spond ing coeffic ients are given in Tab le IV . The accuracy o f this
fo rm ula is about 1 — 3%.
TJsing the borehole pitch thus determined, the disposal area requirement
per tonne of heavy metal can be found easily:
F/M = B-A2/(K-D2-L) [m2It]
В is a constant factor proportional to the fission product mass per tonne of heavy
metal. It amounts to 0.0387 if 35.1 kg/t of heavy metal (HM) fission products
are assumed [2].
Some results obtained with the interpolation formulae developed are shown
in Figs 1—4. The results for HLW(MOX) must be considered as very preliminary,
because the data available on the actinide inventory are highly uncertain, in
particular with respect to 244Cm, which has a decisive effect on the heat generation
of this type of waste.

180 KORTHAUS et al.
-------w aste, air gap
50 100 150 200 250 300
Source length [m l
FIG.l. Maximum salt and waste temperatures for varying source length (HLW disposal).
l°Cl
300-
200-•
1 0 0 -
K = 300 g/1
Ws 10a D = 0,3m L = 50 m \ = 40 °C
-t- -H
woste w ith gap
waste no gap salt
Ю 20 30 Д0 50
Borehole pitch [m l
FIG.2. Maximum salt and waste temperatures for varying borehole pitch (HLW).
70
60
50
i0
30
20 + A В
10 + С
[m2/t HM1
F P HLWHLW (MOX) SF
■t
K r 250 g /l A ,В
5 10 15 20 25 30W aste cooling time l a l
FIG.3. Disposal area requirement for different waste types (220°C max. salt temperature).

IAEA-SM-243/15 181
4m 2/tHM]К = 150 g/1 ф
= 250 g/l @ = ¿00g/l Q)
tRE=10a D =0.3m
50 100 150 200 250 300Source length Iml
FIG.4. Disposal area requirement for HL W at different maximum salt temperatures.
The given values of К refer to idealized, i.e. homogeneous, sources with the
diameter D and the height L. They therefore represent a somewhat higher fission
product concentration in the waste product, in real waste block stacks.
1.2. Long-term far-field thermal aspects
The far-field thermal load after longer times (> 100 a) depends on the global
characteristics of the repository and the geologic formation. It represents an
important safety criterion because of the possible consequences for the stability
and integrity of the geologic formation and with respect to certain transport
mechanisms in the presence of water.
Far-field effects must therefore be considered to estimate relative disposal
area requirements for different repository concepts and types of waste. It is, how
ever, difficult to define a quantitative criterion for this purpose.
Lincoln, Larson and Sisson [4] have introduced for this purpose the maximum
thermal energy (MTE) per unit square added to the geologic formation. It is based
on a 1-dimensional model that does not consider horizontal heat diffusion from the
repository.
The authors have shown that this is a conservative criterion for comparison
of the relative disposal area requirements of different waste types with given site
characteristics.
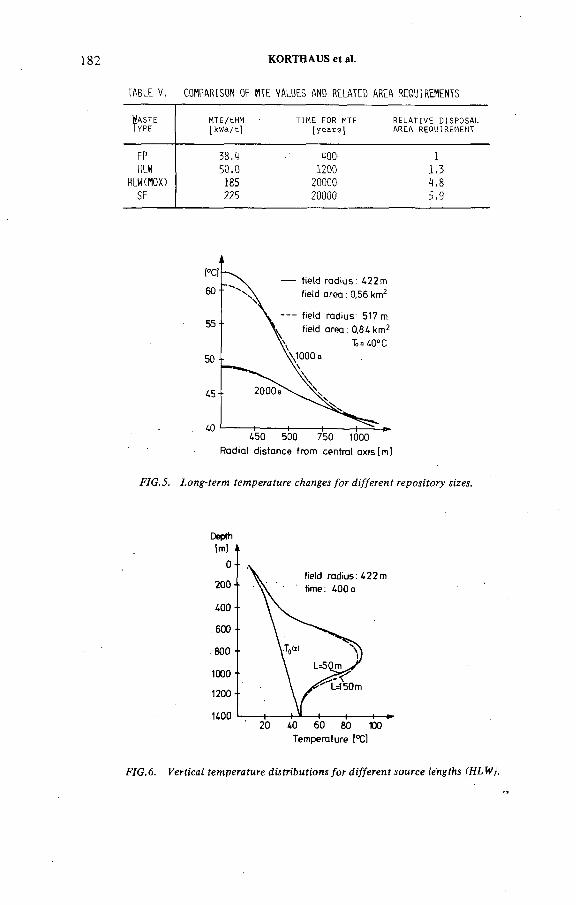
182 KORTHAUS et al.
TABLE V, COMPARISON OF МТЕ VALUES AND RELATED AREA REQUIREMENTS
Wa s t e
T y p eMTE/tHM [ kWa/t]
T IM E FOR MTE [years]
R E L A T IV E D I S P O S A L AREA REQUIREMENT
FP 38,4 400 1HLW 50.0 1200 1.3
HLW(MOX) 185 20000 4,8SF 225 20000 5,9
— field rad ius . 422m field area : 0,56 km2
----- field radius: 517 mfield area: 0,84km2
To =40° С\ \ 1 0 0 0 а \\
450 500 750 1000Radial distance from central a x is lm ]
FIG.5. Long-term temperature changes for different repository sizes.
Depth
Temperature [°C]
FIG.6. Vertical temperature distributions for different source lengths (HLW).
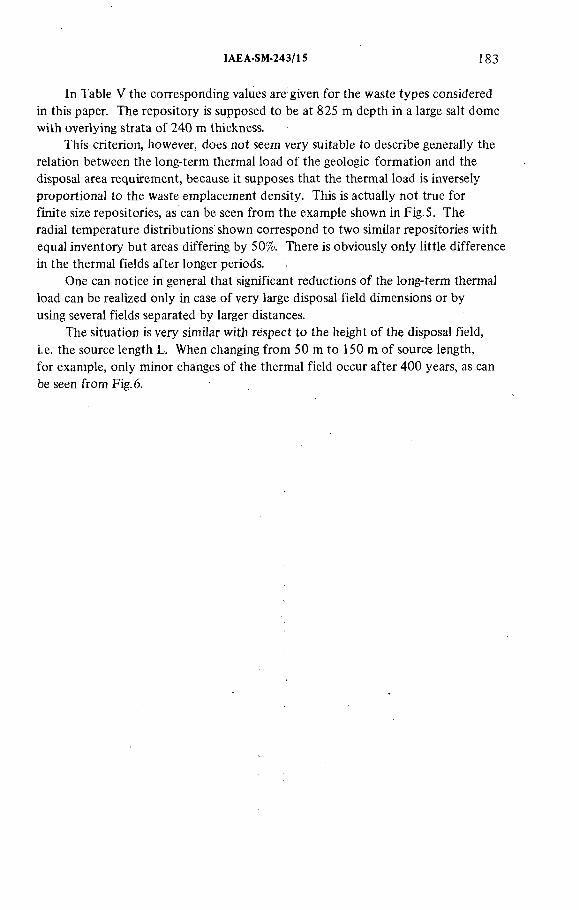
IAEA-SM-243/15 183
In Table V the corresponding values are given for the waste types considered
in this paper. The repository is supposed to be at 825 m depth in a large salt dome
with overlying strata of 240 m thickness.
This criterion, however, does not seem very suitable to describe generally the
relation between the long-term thermal load of the geologic formation and the
disposal area requirement, because it supposes that the thermal load is inversely
proportional to the waste emplacement density. This is actually not true for
finite size repositories, as can be seen from the example shown in Fig.5. The
radial temperature distributions shown correspond to two similar repositories with
equal inventory but areas differing by 50%. There is obviously only little difference
in the thermal fields after longer periods.
One can notice in general that significant reductions of the long-term thermal
load can be realized only in case of very large disposal field dimensions or by
using several fields separated by larger distances.
The situation is very similar with respect to the height of the disposal field,
i.e. the source length L. When changing from 50 m to 150 m of source length,
for example, only minor changes of the thermal field occur after 400 years, as can
be seen from Fig. 6.

184 KORTHAUS et al.
Part II
(P. Ploumen, G. Strickmann, P. Winske)
2. TEMPERATURE CALCULATIONS FOR RADIOACTIVE WASTE DISPOSAL
WITH RESPECT TO LOADING SEQUENCES
To make accurate predictions about the temperature distributions in the
environment of disposed radioactive waste, computer codes have been developed
which can take into account the actual loading of a borehole, a sequence of
boreholes, and a complete repository or a cavity.
Considering these loading sequences, the temperature distribution will be
different from that with instantaneous burial because the temperature field of
the last heat source buried will be superimposed on the field caused by the earlier
buried sources.
For these cases Table VI shows the analytical as well as the numerical pro
cedures of the developed transient heat conduction codes. In the two-dimensional
numerical codes finite difference methods for approximating the differential
operator and in the three-dimensional numerical analysis finite elements for
spatial interpolation are used. In both cases a step-forward finite difference
integration algorithm in time (Crank-Nicolson-Operator) and an iterative procedure
(Successive Overrelaxation) are applied.
In these codes the following effects must be considered:
Changing geometry of heat sources;
Heat transfer by heat convection at free surfaces of the boreholes or caverns
(a = heat transfer coefficient).
To demonstrate the applicability of the codes, the following results of test
calculations carried out for charging a complete repository and a single borehole
will be discussed.
2.1. High-level waste disposal in a repository
The disposal area (0.5 km2) considered in this analysis has a diameter of
approx. 800 m and a height of 50 m. It can contain approx. 70000 glass blocks
(nZyl) ° f the specifications described in Fig. 7. This is the 20-year production of a
1400 t/а reprocessing plant. In one instance the disposal are was divided into nine
sections and the charging times of these sections (see Fig. 7) were determined with
the aid of possible forecasts for the need of energy in the FRG [ 1 ]. The time
prior to burial of the waste íre was supposed to be 10 years.
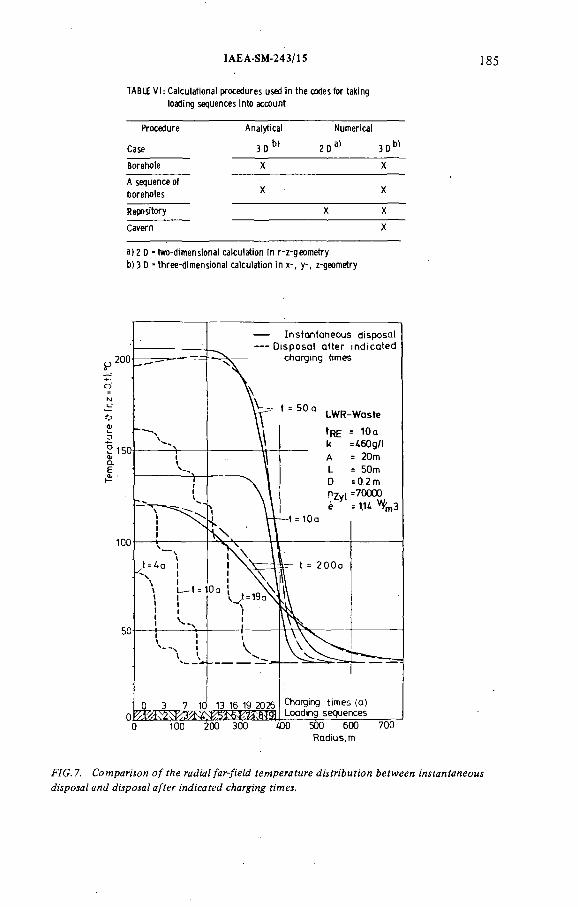
Tem
pera
ture
(r,
z =0
,t),°
C
IAEA-SM-243/15 185
TABLE V I: Ca lcu la tion! procedures used in the codes for taking
loading sequences into account
Procedure
Case
Analytical
3 D b)
Numerical
2 D a) 3 D b)
Borehole X X
A sequence of
boreholes X X
Repository X X
Cavern X
3)2 D - two-dimensional calculation in r-z-geom etry
b) 3 D - three-dimensional calculation in x-, y-, z-geometry
200
150
100
50
0
R a d iu s , m
FIG.7. Comparison of the radial far-field temperature distribution between instantaneous disposal and disposal after indicated charging times.
186 KORTHAUS et al.
A x ia l direction z, m
FIG.8. Axial temperature distribution for sequential charging of a single borehole with HLR wastes (for specific heat generation see Ref. [ 1 ]).
The dashed lines in Fig. 7 show the radial far-field temperature distribution
at half of the height of the burial zone for 4 a, 10 a, 19 a, 50 a, and 200 a after
charging the first section of the disposal area. For comparison, the temperature
distribution for instantaneous disposal of all the sections is given for 10 a, 50 a and
200 a (continuous lines). ^
For the time t= 10 a very large differences exist between the two cases,
because at this time only a third of the waste is disposed in case one. In both
cases the maximum temperature of the salt will be reached after approx. 50 a; for

IAEA-SM-243/1 S 187
these special loading sequences however the maximum salt temperature for
instantaneous disposal will not be reached. After a long time period (200 a) the
differences between the results for the two considered cases will be very small,
since the effect of different kinds of loading is now negligible.
2.2. High-level waste disposal into a single borehole
To demonstrate the temperature effects when a borehole is filled successively
with waste, in Fig. 8 two different kinds of loading are shown. In the upper part
of the figure a 0.3 a time delay between the first 25 m filling and the second 25 m
filling of the borehole (height of the heat source = H hs) is assumed; in the lower
part of the figure the time delay is 2 a. The, differences between the temperature
curves disappear for times greater than approx. 5 a. Before that the successive
loading leads to a local and temporal displacement of the maximum temperature.
In comparison to instantaneous filling of the complete borehole the maximum
temperature is 4 К higher.
Also, the results of calculations carried out for charging a sequence of bore
holes [ 1 ] show that on the one hand the temperature distributions obtained
become quite different, but on the other hand even in the worst case the maximum
temperature is only insignificantly higher than in a corresponding case with
instantaneous disposal.
With the computer code developed the loading sequences of medium-level
waste disposal in a cavern can also be considered. In these cases, the heat transfer
by convection at the free surfaces of the waste becomes quite important. Test
results show that the maximum temperature of the waste can be lowered
significantly compared with instantaneous loading [5].
REFERENCES
[1] PLOUMEN, P., STRICKMANN, G., Berechnung der zeitlichen und râumlichen Temperatur-
verteilung bei der sakularen Lagerung hochradioaktiver Abfalle in Salzstôcken, Lehrauftrag
Leistungsreaktoren im Institut für Elektrische Anlagen und Energiewirtschaft, RWTH
Aachen (1977).
[2] OAK RIDGE NATIONAL LABORATORY, Siting of Fuel Reprocessing Plants and Waste
Management Facilities, Rep. ORNL 4451 (1970).
[3] LESSMANN, E., Kernforschungszentrum Karlsruhe, AFAS, internal communication (1979).
[4] LINCOLN, R.C., LARSON, D.W., SISSON, C.E., Estimâtes of Relative Areas for the
Disposal in Bedded Salt of LWR Wastes from Alternative Fuel Cycles, Sandia Labs. Rep.
SAND 77-1816 (1978).
[5] EHLERT, С., LUCHTMAN, G., PLOUMEN, P., SCHÔN, R., STRICKMANN, G.,
WINSKE, P., Development of Computational Models for the Calculation of Nonsteady
Temperature-, Stress- and Strain-Distributions, Annual Report, under contract 058—78 — 1
WASD between KFK GmbH and the CEC.

188 KORTHAUS et al.
DISCUSSION
J.A. ANGELO: Did you perform sensitivity analyses involving the tempera
ture dependence of thermophysical properties?
E. KORTHAUS: In our parameter studies we used a finite-difference calcu-
lational model which takes into account the temperature dependence of the
thermal material properties. During the studies we did not vary the thermal
conductivity of the salt because we think it is fairly correct. We drew this con
clusion from the good agreement between calculation and experiment — about
10Ъ — found in the evaluation of the heater experiments performed in the Asse
salt mine.
J. HAMSTRA: In your unit cell calculations you show temperature curves
for source lengths varying from 50 to 300 m, thus increasing the heat source
correspondingly. In the case of far-field effects, for the vertical temperature
distributions you show hardly any difference between source lengths of 50 and
150 m. Did you compare two identical total heat sources or two sources which
differed by a factor of six?
E. KORTHAUS: The far-field result for different source lengths refers to two
repositories with equal total heat source per unit disposal area As regards the
single sources there, this could mean, for example, that the longer sources are
stronger by a factor of three, with correspondingly larger borehole pitch.
IAEA-SM-243/104
A PROCEDURE FOR DETAILED 3-D ANALYSIS
APPLIED TO TEMPERATURE RISES IN MULTI
LAYER HIGH-LEVEL WASTE REPOSITORIES
IN A SALT DOME
J. HAMSTRA, J.W.A.M. KEVENAAR, J. PRIJ
Netherlands Energy Research Foundation,
Petten,
The Netherlands
Abstract
A PROCEDURE FOR DETAILED 3-D ANALYSIS APPLIED TO TEMPERATURE RISES IN MULTI-LAYER HIGH-LEVEL WASTE REPOSITORIES IN A SALT DOME.
For detailed 3—D thermal analysis of.high-level waste repositories a computer program TASTE (Three-dimensional Analysis of Salt dome Temperatures) is under development, based on an analytical model of a continuous time-dependent point source in an infinite solid of homogeneous isotropic material with temperature-independent properties. The program is based on the assumption that the high-level waste will be disposed of in a number of boreholes placed in a square, rectangular or hexagonal pattern in one or more burial layers. Heat generation, borehole pitch and length, burial layer area, relative distance between the layers, loading sequence and loading tempo can be varied arbitrarily. Preliminary versions of the program were applied to establish the influence of the following variables relevant to the temperature rise distribution in a high-level waste burial area in a salt dome: (1) Disposal borehole patterns: it was established that the influence on the temperature is very limited. Hence quite some flexibility is allowed with respect to the disposal pattern to be chosen. (2) Loading tempi: it was established that the maxima of the temperature rises are hardly influenced by differences in loading tempi. For a multi-layer burial configuration an underlying burial area may be judged to give no problems for the disposal operations in an overlying burial area, even with a very slow loading rate.(3) Leaving certain borehole positions unused: not utilizing certain borehole positions has a very positive effect on the reduction of local temperature rises.
1. INTRODUCTION
The application of finite-element programs for detailed 3-D thermal analysis
of a high-level waste repository encounters considerable problems due to the
complex geometry of the structure and the relatively small areas in which signifi
cant local temperature effects occur. Therefore a computer program TASTE
(Three-dimensional Analysis of Salt dome Temperatures) is under development,
based on an analytical model of a continuous time-dependent point source in an
infinite solid of homogeneous isotropic material with temperature-independent
properties.
189

190 HAMSTRA et al.
Preliminary versions of the program were applied to establish the influence
of the following variables relevant to the temperature rise distribution in a high-
level waste burial area in a salt dome:
Disposal borehole patterns (hexagonal, square, rectangular); /
Loading tempi, applied to a given loading sequence for a 3—layer
circular disposal area;
Local temperature reduction due to leaving certain borehole positions
unused.
2. FUNDAMENTALS OF THE TASTE PROGRAM
The program is based on an analytical expression for the temperature
distribution due to a continuous point source in an infinite solid of homogeneous
isotropic material. If heat is liberated at the rate <р(т) per unit time for 0 < r < t
at a point, the temperature rise T at distance r and time t is given by:
T(r,t)t , . -r2г Ф(-г) exp (■
8рс(ттк)3/20
( t ~ ü 3/2dx (1)
This equation was derived assuming material properties to be constant [1].
The program being intended to calculate temperature rises due to buried high-
level radioactive waste, the rate of heat generation ip(r) will be expressed as:
Ф(т) = A exp (-at) (2)
Substitution of Eq.(2) into Eq.(l) and using the transformation t-r=t*
leads to:
t * r2e X p ( a t "
KZ - dt* (3)T(r,t) - A -exp (7 Д > 8 p c (ttk) u * > 3/2
This expression may be considered to describe the temperature rise at an
arbitrary point in space at time t due to a point source at distance r generating
heat from t-t until t. As the material properties are assumed to be temperature-
independent the principle of superposition may be used to calculate at point P
and time t the temperature rise due to any number N of point sources at arbitrary
distances r¡, generating heat during arbitrary times (t-t; until t):

IAEA-SM-243/104 191
T(XP> УР> zp> с ) =
NI
i=lI ( r . , t . ) (4)
This principle is used to calculate the temperature rise at a point in or
around a burial area of arbitrary shape, considering the waste as a number of point
sources. Each stack of canisters is hereby modelled by point sources.
The method is based on a number of assumptions, the consequences of which
will be discussed briefly:
(1) The rock salt properties are assumed to be constant.
Comparisons between calculations considering the temperature-dependent
material behaviour and calculations based on constant properties have been
carried out [2, 3]. Deviations in calculated temperatures remain within a
few per cent of the maximum value, provided the temperature range is less
than 200°C and the constant material properties are chosen for an average
temperature.
(2) The rate of heat generation iр(т) can be described as A exp (-or).
This description is exact as far as one isotope is considered. The high-level
waste consisting of a great number of isotopes, a more complex function
for the heat generation results. If this function cannot be simplified with
reasonable accuracy to A exp (-ат), then a number of governing contributions
can be calculated separately, the results of which can be superimposed.
(3) The salt dome may be considered as an infinite solid.
A number of temperature calculations of comparable salt dome geometries
including the surrounding and overlying sediment were performed [4].
Comparisons between a number of relevant temperatures thus calculated
and the results obtained assuming an infinite solid consisting of rock salt
show no significant deviations.
(4) A stack of canisters can be modelled by point sources.
A convergence study has shown that the calculated temperature rises at an
arbitrary point are independent of the number of point sources per stack,
provided this number is larger than a critical value depending on the distance
between point and stack.

192 HAMSTRA et al.
The magnitude of deviations arising from these assumptions is considered to be
sufficiently small for engineering purposes.
Numerical integration of Eq.(3) is performed using Simpson’s rule. As the
time domain ranges from 0 to about 1010s, the application of equal time steps
throughout the entire domain is prohibitively time-consuming. Therefore the time
domain is divided into a sequence of subdomains each formed by multiplication
of the previous one with a factor depending on r and t*.
Moreover, the initial subdomain is determined as a function of r such that the
value of the integrand may be taken as zero. Each subdomain is integrated using
two Simpson steps. The number of point sources modelling a stack of canisters
is determined in the program depending on r. In order to avoid large numbers of
point sources, stacks at distances less than 10% of the stack length from the point
where temperature is to be calculated are conservatively modelled as a continuous
line source.
The temperature rise due to this line source is given by [4]:
Integration of Eq.(5) is performed in an analogous way.
The program is based on the assumption that the high-level waste will be
disposed of in a number of vertical boreholes placed in a square, rectangular or
hexagonal pattern in one or more burial layers. Initial heat generation and half-
life, borehole pitch and length, canister diameter, number of burial layers, burial
layer area, relative distances between the layers, loading sequence and tempo can
be varied. The program calculates temperature rises at specified positions and
times due to the buried waste characterized by the above parameters.
3. UTILIZATION OF THE TASTE PROGRAM
3.1. General
A preliminary version of the TASTE program was used to establish rock salt
temperature rise consequences of different variables in support of a design study [5],
in which a 3-layer burial configuration was chosen to dispose of 2500 m3 solidified
HLW in'a salt dome. For the three burial areas of 550 m radius a square disposal
borehole pattern was chosen with a borehole spacing of 34.5 m to provide for the
required number of 50 m deep boreholes to dispose of the HLW in canisters of
; exp (ax -
(5)T
0
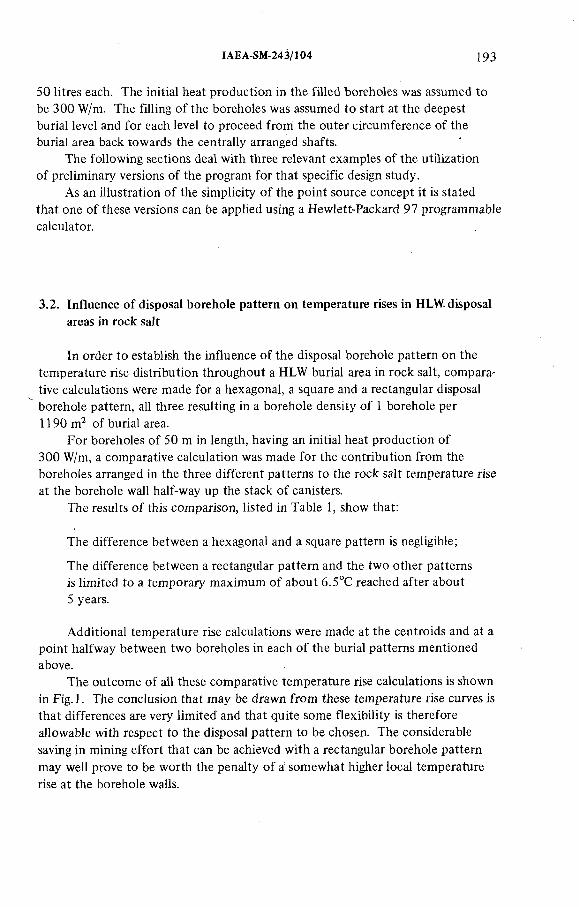
IAEA-SM-243/104 193
50 litres each. The initial heat production in the filled boreholes was assumed to
be 300 W/m. The filling of the boreholes was assumed to start at the deepest
burial level and for each level to proceed from the outer circumference of the
burial area back towards the centrally arranged shafts.
The following sections deal with three relevant examples of the utilization
of preliminary versions of the program for that specific design study.
As an illustration of the simplicity of the point source concept it is stated
that one of these versions can be applied using a Hewlett-Packard 97 programmable
calculator.
3.2. Influence of disposal borehole pattern on temperature rises in HLW. disposal
areas in rock salt
In order to establish the influence of the disposal borehole pattern on the
temperature rise distribution throughout a HLW burial area in rock salt, compara
tive calculations were made for a hexagonal, a square and a rectangular disposal
borehole pattern, all three resulting in a borehole density of 1 borehole per
1190 m2 of burial area.
For boreholes of 50 m in length, having an initial heat production of
300 W/m, a comparative calculation was made for the contribution from the
boreholes arranged in the three different patterns to the rock salt temperature rise
at the borehole wall half-way up the stack of canisters.
The results of this comparison, listed in Table 1, show that:
The difference between a hexagonal and a square pattern is negligible;
The difference between a rectangular pattern and the two other patterns
is limited to a temporary maximum of about 6.5°C reached after about
5 years.
Additional temperature rise calculations were made at the centroids and at a
point halfway between two boreholes in each of the burial patterns mentioned
above.
The outcome of all these comparative temperature rise calculations is shown
in Fig. 1. The conclusion that may be drawn from these temperature rise curves is
that differences are very limited and that quite some flexibility is therefore
allowable with respect to the disposal pattern to be chosen. The considerable
saving in mining effort that can be achieved with a rectangular borehole pattern
may well prove to be worth the penalty of a somewhat higher local temperature
rise at the borehole walls.
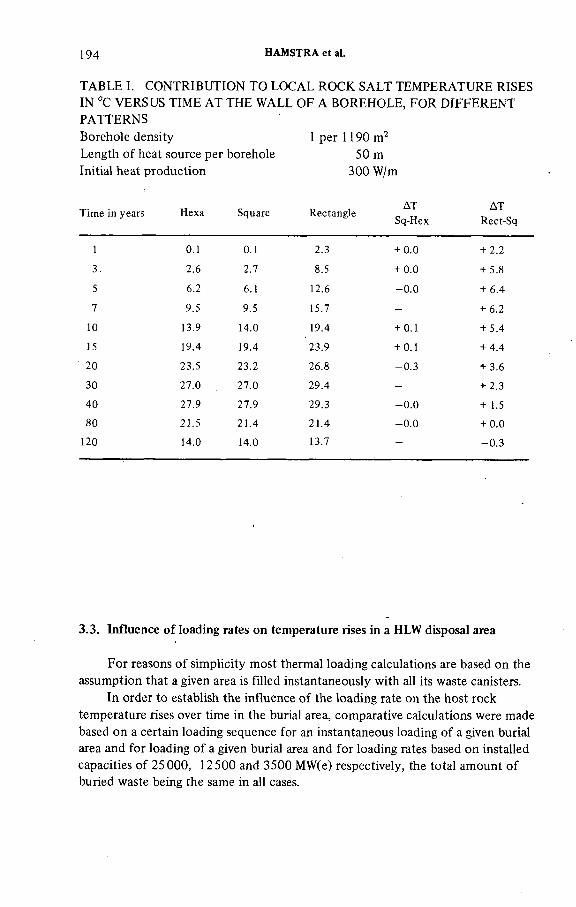
194 HAMSTRA et al.
TABLE I. CONTRIBUTION TO LOCAL ROCK SALT TEMPERATURE RISES
IN °C VERSUS TIME AT THE WALL OF A BOREHOLE, FOR DIFFERENT
PATTERNS
Borehole density 1 per 1190 m2
Length of heat source per borehole 50m
Initial heat production 300 W/m
Time in years Hexa Square RectangleДТ
Sq-Hex
ДТ
Rect-Sq
1 0.1 0.1 2.3 + 0.0 + 2.2
3. 2.6 2.7 8.5 + 0.0 + 5.8
5 6.2 6.1 12.6 -0.0 + 6.4
7 9.5 9.5 15.7 - + 6.2
10 13.9 14.0 19.4 + 0.1 + 5.4
15 19.4 19.4 23.9 + 0.1 + 4.4
20 23.5 23.2 26.8 -0.3 + 3.6
30 27.0 27.0 29.4 - + 2.3
40 27.9 27.9 29.3 -0.0 + 1.5
80 21.5 21.4 21.4 -0.0 + 0.0
120 14.0 14.0 13.7 - -0.3
3.3. Influence of loading rates on temperature rises in a HLW disposal area
For reasons of simplicity most thermal loading calculations are based on the
assumption that a given area is filled instantaneously with all its waste canisters.
In order to establish the influence of the loading rate on the host rock
temperature rises over time in the burial area, comparative calculations were made
based on a certain loading sequence for an instantaneous loading of a given burial
area and for loading of a given burial area and for loading rates based on installed
capacities of 25 000, 12 500 and 3500 MW(e) respectively, the total amount of
buried waste being the same in all cases.
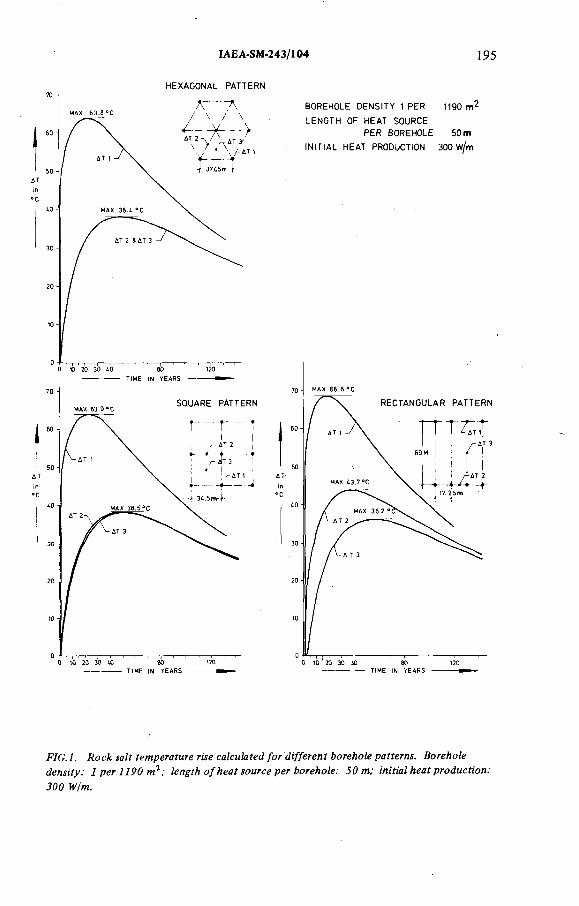
I AE A-SM-243/104 195
H EXA G O N A L P A T T E R N
S Q U A R E P A T T ER N
B O R EH O LE D E N S IT Y 1 P E R 1190 m 2
L E N G T H O F H E A T SO U R CE
P E R B O R EH O LE 50 m
IN IT IA L H E A T PRODUCTION 300 w/m
FIG. 1. Rock salt temperature rise calculated for different borehole patterns. Borehole density: 1 per 1190 т г ; length of heat source per borehole: 50 m; initial heat production: 300 W/m.
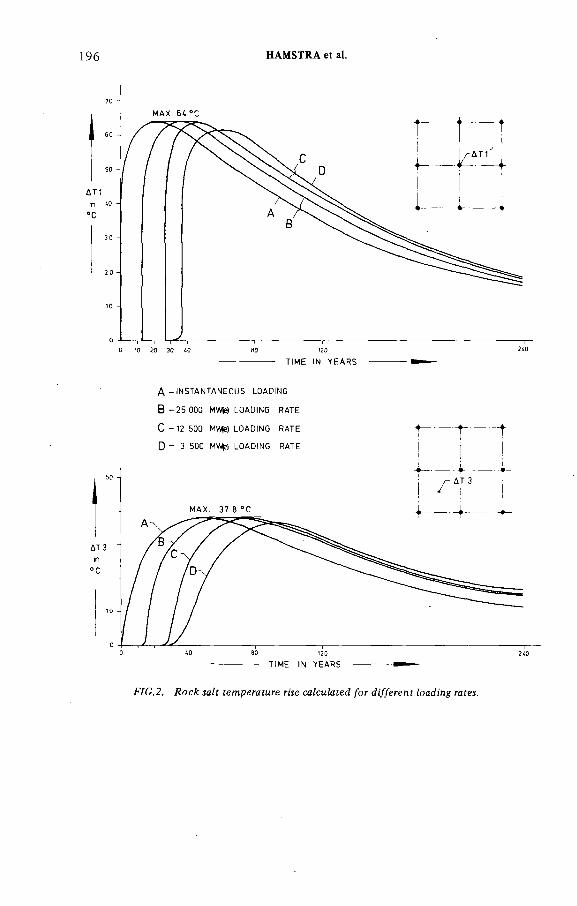
196 HAMSTRA et al.
ЛТ1
in°c
TIM E IN Y E A R S
A - IN S T A N T A N E O U S LOADING
В - 2 5 ООО MWH LOADING R A TE
С - 12 500 MV4e) LOADING R A TE
D - 3 500 MWfcl LOADING R A TE" Г — r
FIG.2. Rock salt temperature rise calculated for different loading rates.
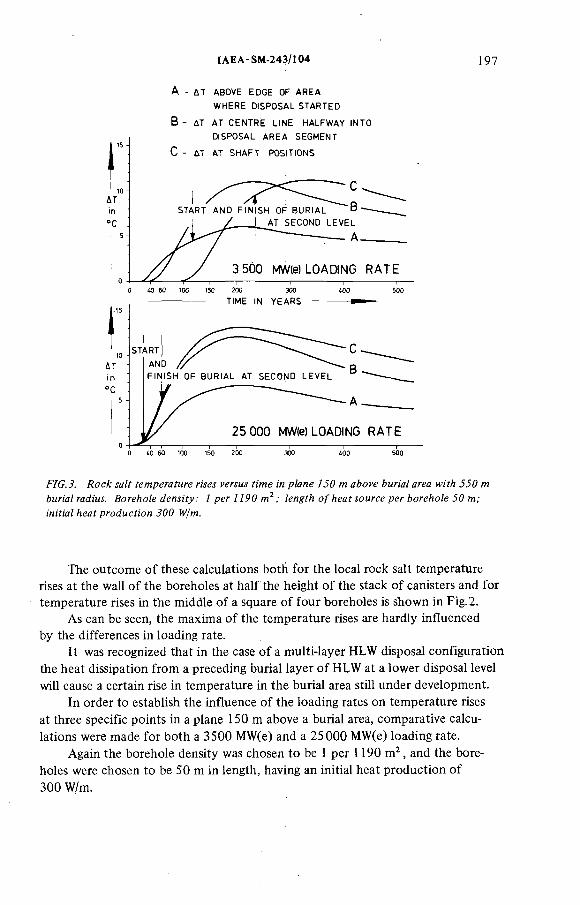
IAEA-SM-243/104 197
A - ÙT ABOVE ED G E OF A R E A
W H ER E D ISP O SA L ST A R T E D
В - ДТ AT C E N T R E L IN E HALFW AY INTO
FIG.3. Rock salt temperature rises versus time in plane 150 m above burial area with 550 m burial radius. Borehole density: 1 per 1190m2; length of heat source per borehole 50 m; initial heat production 300 W/m.
The outcome of these calculations both for the local rock salt temperature
rises at the wall of the boreholes at half the height of the stack of canisters and for
temperature rises in the middle of a square of four boreholes is shown in Fig.2.
As can be seen, the maxima of the temperature rises are hardly influenced
by the differences in loading rate.
It was recognized that in the case of a multi-layer HLW disposal configuration
the heat dissipation from a preceding burial layer of HLW at a lower disposal level
will cause a certain rise in temperature in the burial area still under development.
In order to establish the influence of the loading rates on temperature rises
at three specific points in a plane 150 m above a burial area, comparative calcu
lations were made for both a 3500 MW(e) and a 25 000 MW(e) loading rate.
Again the borehole density was chosen to be 1 per 1190m2, and the bore
holes were chosen to be 50 m in length, having an initial heat production of
300 W/m.
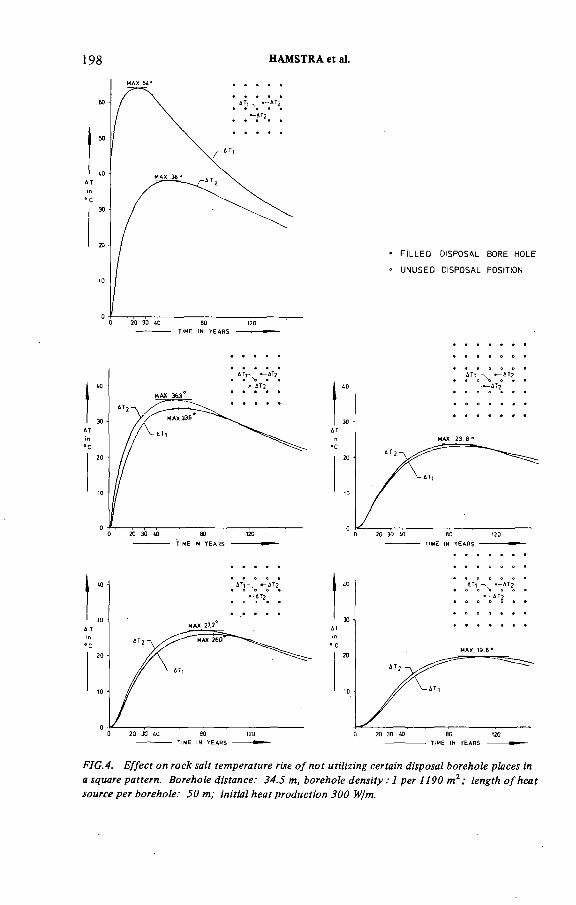
198 HAMSTRA et al.
дт
" с
S T
F IL L E D D ISPO SAL BORE HOLE
UN USED DISPOSAL POSITION
TIME IN YEARS ■
TIME IN YEARS
FIG.4. Effect on rock salt temperature rise of not utilizing certain disposal borehole places in a square pattern. Borehole distance: 34.5 m, borehole density : 1 per 1190 m 2 ; length of heat source per borehole: 50 m; initial heat production 300 W/m.

IAEA-SM-243/104 199
The outcome of these comparative temperature rise calculations is shown
in Fig.3. This level of temperature rises caused by an underlying burial area
may be judged to present no problems for the disposal operations in an overlying
burial area, even in the case of the very slow 3500 MW(e) loading rate.
3.4. Effect of not utilizing certain disposal borehole positions
It is recognized that the internal structure of a salt dome may be a very
complex one in which the dominating areas of good quality rock salt are abruptly
interrupted by irregularly folded layers of potassium-magnesium salts or by banks
of anhydrite. Especially the less favourable viscoplastic behaviour of certain
inclusions other than halite may require additional limitations on the local
temperature rises.
In order to permit corrective measurements, a general approach for a con
ceptual design should allow for an excess of disposal borehole positions in the
first layout. The presence of certain less favourable rock salts being established
during the exploration of a burial area under development, a number of bore
hole positions in and around the inclusion should not be used.
The following model calculations were made to establish the effect on the
rock salt temperature rises of not utilizing certain disposal borehole positions.
Again the calculations were made for a square borehole pattern, with a distance of
34.5 m between the boreholes, a length of heat source per borehole of 50 m and
an initial heat production of the heat sources of 300 W/m.
The calculated temperature rise versus time in the case of one central position,
and with clusters of respectively 7, 13 and 19 positions remaining unused, is shown
in Fig.4. The decrease in maximum temperature rise that can be obtained appears
to be considerable. It should be recognized that appreciable limitations in area1
temperature rises can be achieved at a distance of less than 75 m from filled disposal
borehole positions.
This positive effect of not utilizing certain disposal borehole positions on
limiting the local temperature rises may therefore be assumed to be a very realistic
answer to the possible local presence of less favourable rock salt in a burial area.
The incorporation of surplus borehole positions in the first burial mine layout is a
rather simple measure to provide for the required flexibility in this respect.
REFERENCES
[1] CARSLAW, H.S., JAEGER, J.C., Conduction of Heat in Solids, Oxford University Press
(1950).
[2] KEVENAAR, J.W.A.M., PLOUMEN, P., JANSSEN, L.G.J., WINSKE, P., Comparison of
Temperature Calculations for an Arbitrary High-Level Waste Disposal Configuration in Salt
Formations, Netherlands Energy Research Foundation Rep. ECN-79-63 (1979).
200 HAMSTRA et al.
[3] PLOUMEN, P., STRICKMANN, G., Berechnung der zeitlichen und râumlichen Temperatur-
verteilung bei der Sâkularen Lagerung hochradioaktiver Abfâlle in Salzstôcken, Rheinisch- •
Westfàlische Technische Hochschule, Aachen ( 1977).
[4] HAMSTRA, J., KEVENAAR, J.W.A.M., Temperature Calculations on Different Configur
ations for Disposal of High-Level Reprocessing Waste in a Salt Dome Model, Netherlands
Energy Research Foundation Rep. ECN-42 (1978).
[5] HAMSTRA, J., VELZEBOER, P.T., Design Study of a Radioactive Waste Repository to be
Mined in a Medium-Size Salt Dome, Netherlands Energy Research Foundation Rep.
ECN-78-023 (1978), (5th Int. Symp. on Salt, Hamburg, 1978).
DISCUSSION
J.J.K. DAEMEN: Could you specify at what point the temperatures are calculated
in Fig.4, (i.e. with unused boreholes)?
J.W. A.M. KEVENAAR: Temperatures were calculated at the centre line of
the central borehole position at half-height of the stacks (ATj). The other positions
(ДТ2) are at the same height centred between four borehole positions, one of which
is the central one.
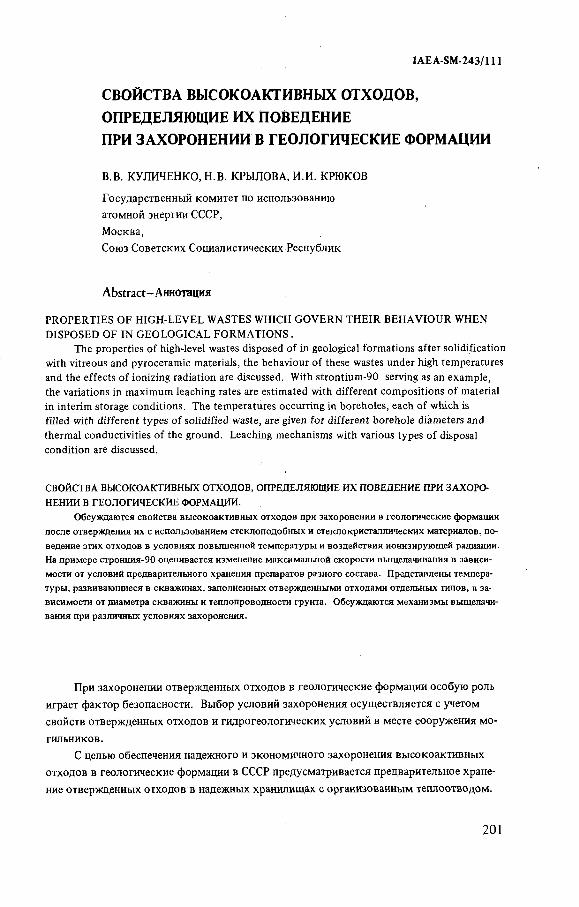
IAEA-SM-243/111
СВОЙСТВА ВЫСОКОАКТИВНЫХ отходов,ОПРЕДЕЛЯЮЩИЕ ИХ ПОВЕДЕНИЕПРИ ЗАХОРОНЕНИИ В ГЕОЛОГИЧЕСКИЕ ФОРМАЦИИ
В.В. КУЛИЧЕНКО, Н.В. КРЫЛОВА, И.И. КРЮКОВ
Государственный комитет по использованию
атомной энергии СССР,
Москва,
Союз Советских Социалистических Республик
Abstract- Аннотация
PROPERTIES OF HIGH-LEVEL WASTES WHICH GOVERN THEIR BEHAVIOUR WHEN
DISPOSED OF IN GEOLOGICAL FORMATIONS .
The properties of high-level wastes disposed of in geological formations after solidification
with vitreous and pyroceramic materials, the behaviour of these wastes under high temperatures
and the effects of ionizing radiation are discussed. With strontium-90 serving as an example,
the variations in maximum leaching rates are estimated with different compositions of material
in interim storage conditions. The temperatures occurring in boreholes, each of which is
filled with different types of solidified waste, are given for different borehole diameters and
thermal conductivities of the ground. Leaching mechanisms with various types of disposal
condition are discussed.
СВОЙСТВА ВЫСОКОАКТИВНЫХ ОТХОДОВ, ОПРЕДЕЛЯЮЩИЕ ИХ ПОВЕДЕНИЕ ПРИ ЗАХОРОНЕНИИ В ГЕОЛОГИЧЕСКИЕ ФОРМАЦИИ.
Обсуждаются свойства высокоактивных отходов при захоронении в геологические формации после отверждения их с использованием стеклоподобных и стеклокристаллических материалов, поведение этих отходов в условиях повышенной температуры и воздействия ионизирующей радиации. На примере стронция-90 оценивается изменение максимальной скорости выщелачивания в зависимости от условий предварительного хранения препаратов разного состава. Представлены температуры, развивающиеся в скважинах, заполненных отвержденными отходами отдельных типов, в зависимости от диаметра скважины и теплопроводности грунта. Обсуждаются механизмы выщелачивания при различных условиях захоронения.
При захоронении отвержденных отходов в геологические формации особую роль
играет фактор безопасности. Выбор условий захоронения осуществляется с учетом
свойств отвержденных отходов и гидрогеологических условий в месте сооружения мо
гильников.
С целью обеспечения надежного и экономичного захоронения высокоактивных
отходов в геологические формации в СССР предусматривается предварительное хране
ние отвержденных отходов в надежных хранилищах с организованным теплоотводом.
201

202 КУЛИЧЕНКО и др.
Т А Б Л И Ц А I. ХАРАКТЕРИСТИКИ Р А З ЛИЧНЫХ ТИПОВ ОТВЕРЖДЕННЫХ ОТХОДОВ*
Включение Уд. Коэффициент Объем Темпера Скоростьотходов вес теплопровод захорани тура при- выщелачива
Материалности ваемого
продуктаготовле-материала
ния радионуклидов
(вес %) (кг/м 3) (Вт/(мград) ) (мэ) (°С) (г/(см2-сут) )
уЬ ji ц я £ & 5 н
Силикатныематериалы 40 ~2,8 1-1,2 140 1100-1150 ю -5- ю - 6
2 л ^ 3?s i <5 g
Фосфатныематериалы 40 ~2,8 1-1,1 140 900 io - s- ю - ‘
Сгеклчески
окристалли- е материалы 70 ~3 2-2,5 70 1400-1900 10"7
* Расчет дан для материалов, полученных при отверждении 1м3 раствора отходов с концентрацией солей 500 г/л.
В настоящее время в СССР и за рубежом разрабатываются методы включения отходов в стеклоподобные, стеклокристаллические материалы, а также включение отвержденных отходов в металлические матрицы [ 1]. Наряду с обеспечением локализации радионуклидов одним из требований является максимально возможное уменьшение объемов отходов, что позволяет сократить площади, требуемые для создания могильников.
В зависимости от типа материала объемы захораниваемых материалов, полученные при отверждении равных количеств исходных отходов, существенно отличаются друг от друга (табл.1).
В процессе хранения высокоактивные материалы будут длительное время находиться при повышенной температуре и под воздействием ионизирующей радиации. Поэтому при организации могильников необходимо учитывать изменение свойств захораниваемых материалов под действием этих 2-х факторов. При этом следует рассматривать два периода хранения. Первый период — в условиях высоких температур при отсутствии контакта с водой и второй — при снижении температуры, обусловленной теплом радиоактивного распада, и при возможном контакте радиоактивных материалов с водой.
Длительное воздействие высоких температур может приводить к изменению структуры, что в свою очередь, может вести к изменению химической устойчивости отходов [2, 3]. При этом величина и характер изменений зависят от состава и структуры стекла.
При длительном воздействии высоких температур на отвержденные отходы возможна делокализация радионуклидов из них за счет перехода нуклидов в газовую фазу. Переход этот обуславливается как упругостью пара соединений, входящих в состав
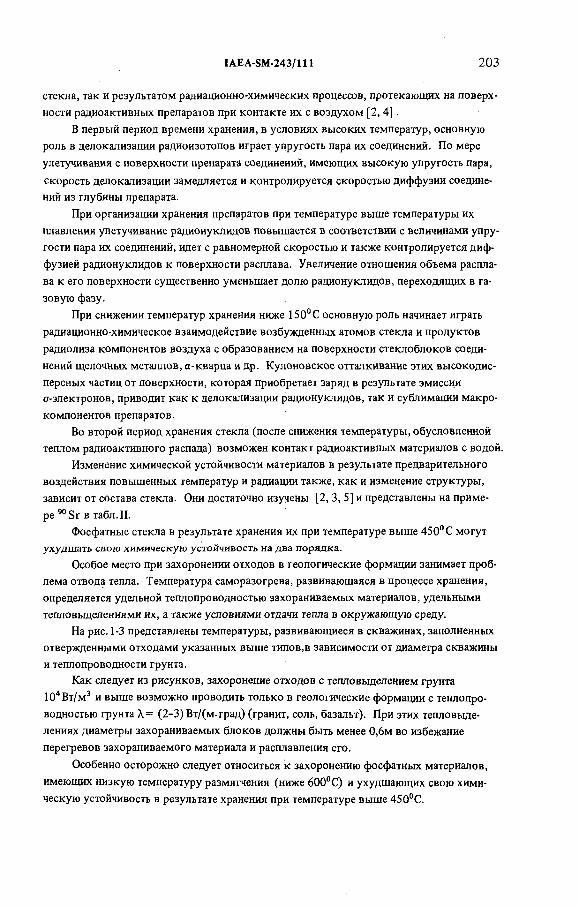
IAEA-SM-243/111 203
стекла, так и результатом радиационно-химических процессов, протекающих на поверхности радиоактивных препаратов при контакте их с воздухом [2, 4] .
В первый период времени хранения, в условиях высоких температур, основную роль в делокализации радиоизотопов играет упругость пара их соединений. По мере улетучивания с поверхности препарата соединений, имеющих высокую упругость пара, скорость делокализации замедляется и контролируется скоростью диффузии соединений из глубины препарата.
При организации хранения препаратов при температуре выше температуры их плавления улетучивание радионуклидов повышается в соответствии с величинами упругости пара их соединений, идет с равномерной скоростью и также контролируется диффузией радионуклидов к поверхности расплава. Увеличение отношения объема расплава к его поверхности существенно уменьшает долю радионуклидов, переходящих в газовую фазу.
При снижении температур хранения ниже 150° С основную роль начинает играть радиационно-химическое взаимодействие возбужденных атомов стекла и продуктов радиолиза компонентов воздуха с образованием на поверхности стеклоблоков соединений щелочных металлов, а-кварца и др. Кулоновское отталкивание этих высокодисперсных частиц от поверхности, которая приобретает заряд в результате эмиссии а-электронов, приводит как к делокализации радионуклидов, так и сублимации макрокомпонентов препаратов.
Во второй период хранения стекла (после снижения температуры, обусловленной теплом радиоактивного распада) возможен контакт радиоактивных материалов с водой.
Изменение химической устойчивости материалов в результате предварительного воздействия повышенных температур и радиации также, как и изменение структуры, зависит от состава стекла. Они достаточно изучены [2, 3, 5] и представлены на примере 90 Sr в табл. II.
Фосфатные стекла в результате хранения их при температуре выше 450° С могут ухудшать свою химическую устойчивость на два порядка.
Особое место при захоронении отходов в геологические формации занимает проблема отвода тепла. Температура саморазогрева, развивающаяся в процессе хранения, определяется удельной теплопроводностью захораниваемых материалов, удельными тепловыделениями их, а также условиями отдачи тепла в окружающую среду.
На рис. 1-3 представлены температуры, развивающиеся в скважинах, заполненных отвержденными отходами указанных выше типов,в зависимости от диаметра скважины и теплопроводности грунта.
Как следует из рисунков, захоронение отходов с тепловыделением грунта 104 Вт/м3 и выше возможно проводить только в геологические формации с теплопроводностью грунта Х= (2-3) Вт/(м. град) (гранит, соль, базальт). При этих тепловыделениях диаметры захораниваемых блоков должны быть менее 0,6м во избежание перегревов захораниваемого материала и расплавления его.
Особенно осторожно следует относиться к захоронению фосфатных материалов, имеющих низкую температуру размягчения (ниже 600°С) и ухудшающих свою химическую устойчивость в результате хранения при температуре выше 450°С.
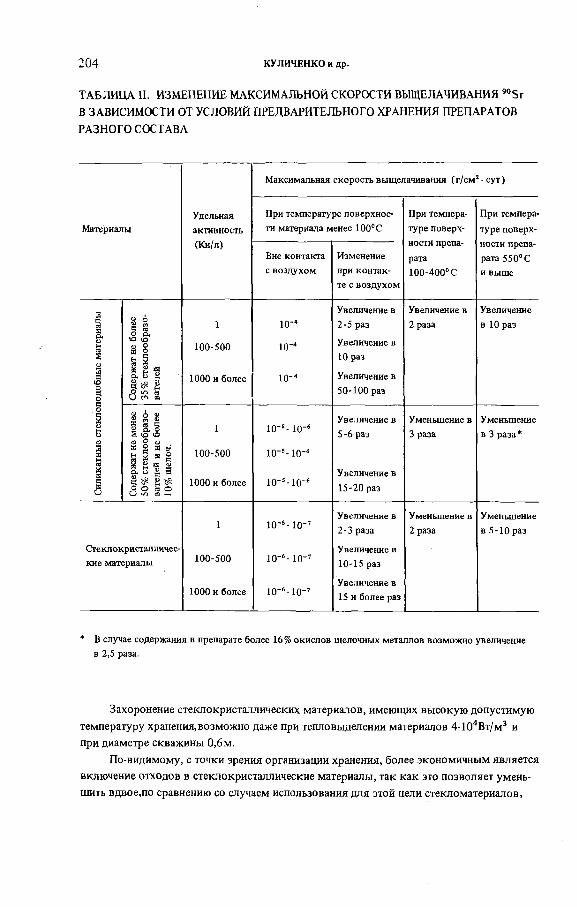
204 КУЛИЧЕНКО и др.
Т А Б Л И Ц А И. И З М ЕНЕНИЕ М А К С И М А Л Ь Н О Й СКОРОСТИ В Ы Щ Е Л А Ч И В А Н И Я Sr В ЗАВИСИМОСТИ ОТ УСЛОВИЙ ПРЕДВАРИТЕЛЬНОГО ХРАНЕНИЯ ПРЕПАРАТОВ РАЗНОГО СОСТАВА
МатериалыУдельнаяактивность(Ки/л)
Максимальная скорость выщелачивания (г/см . сут)
При температуре поверхности материала менее 100° С
При температуре поверхности препарата100-400°С
При температуре поверхности препарата 550° С и выше
Вне контакта с воздухом
Изменение при контакте с воздухом
Сили
катн
ые
стек
лопо
добн
ые
мате
риал
ы !
Соде
ржат
не
боле
е 35%
ст
екло
обра
зо-
вате
лей
1
100-500
1000 и более
Ю'4
10-"
ю-4
Увеличение в 2-5 раз
Увеличение в 10 раз
Увеличение в 50-100 раз
Увеличение в 2 раза
Увеличение в 10 раз
Соде
ржат
не
мене
е 50%
стек
лооб
разо
- 1
вате
лей
и не
боле
е 10%
щел
оч.
j
1
100-500
1000 и более
1 0 '5- Ю‘в
ю-мо-6
10-М0-6
Увеличение в 5-6 раз
Увеличение в 15-20 раз
Уменьшение в 3 раза
Уменьшение в 3 раза*
Увеличение в Уменьшение в Уменьшение1 ю-6-ю-7 2-3 раза 2 раза в 5-10 раз
Стеклокристалличес Увеличение вкие материалы 100-500 10-6- ю - 7 10-15 раз
Увеличение в1000 и более ю-6-ю-’ 15 и более раз
* В случае содержания в препарате более 16% окислов щелочных металлов возможно увеличение в 2,5 раза.
Захоронение стеклокристаллических материалов, имеющих высокую допустимую температуру хранения,возможно даже при тепловыделении материалов 4104Вт/м3 и при диаметре скважины 0,6 м.
По-видимому, с точки зрения организации хранения, более экономичным является включение отходов в стеклокристаллические материалы, так как это позволяет уменьшить вдвое,по сравнению со случаем использования для этой цели стекломатериалов,
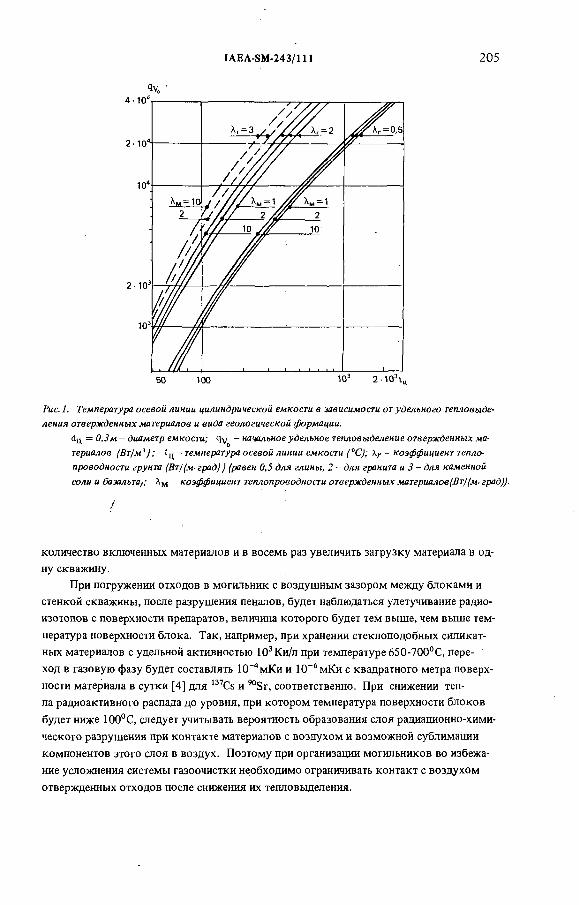
<ч •
IAEA-SM-243/111 205
Рис. 1. Температура осевой линии цилиндрической емкости в зависимости от удельного тепловыде
ления отвержденных материалов и вида геологической формации.
<1ц = 0 ,3м - диаметр емкости; q y - начальное удельное тепловыделение отвержденных ма
териалов ¡Вт/м3) ; t j j - температура осевой линии емкости ("С ); Хг - коэффициент тепло
проводности грунта (Вт/(м-град) ) (равен 0,5 для глины, 2 - для гранита и 3 - д л я каменной
солы и базальта); Лм - коэффициент теплопроводности отвержденных материалов (Вт/(м- град)).
;
количество включенных материалов и в восемь раз увеличить загрузку материала в одну скважину.
При погружении отходов в могильник с воздушным зазором между блоками и стенкой скважины, после разрушения пеналов, будет наблюдаться улетучивание радиоизотопов с поверхности препаратов, величина которого будет тем выше, чем выше температура поверхности блока. Так, например, при хранении стеклоподобных силикатных материалов с удельной активностью 10эКи/л при температуре 650-700°С, переход в газовую фазу будет составлять Ю ^ м К и и 1СГ6 мКи с квадратного метра поверхности материала в сутки [4] для 137Cs и Sr, соответственно. При снижении тепла радиоактивного распада до уровня, при котором температура поверхности блоков будет ниже 100°С, следует учитывать вероятность образования слоя радиационно-химического разрушения при контакте материалов с воздухом и возможной сублимации компонентов этого слоя в воздух. Поэтому при организации могильников во избежание усложнения системы газоочистки необходимо ограничивать контакт с воздухом отвержденных отходов после снижения их тепловыделения.

206 КУЛИЧЕНКО н др.
Рис. 2. Температура осевой линии цилиндрической емкости в зависимости от удельного тепловыде
ления отвержденных материалов и вида геологической формации.
<3ц = 0,6м — диаметр емкости; q y — начальное удельное тепловыделение отвержденных материалов (Вт/м3/; Гц температура осевой линии емкости ( йС): лг — коэффициент теплопровод
ности грунта (Вт/(м-град)/(равен 0,5 для глины, 2 - для гранита и 3 - для каменной соли и ба
зальта); * - м - коэффициент теплопроводности отвержденных материалов (ВтЦм- град)).
Рис. 3. Температура стенки скважины могильника в зависимости от вида геологической формации
и удельного тепловыделения отвержденных материалов.
йц —диаметр емкости (м); q y — начальное удельное тепловыделение отвержденных матери
алов (Вт/м3) ; t a - температура стенки скважины могильника ( ° С ) ; \ г - коэффициент
теплопроводности грунта (ВтЦм■ град)) (равен 0,5 для глины, 2 - для гранита и 3 - для каменной соли и базальта).

IAEA-SM-243/111 207
Т А Б Л И Ц А III. ВРЕМЯ Д О С Т И Ж Е Н И Я (At) ТЕМПЕРАТУРЫ 100°С Н А СТЕНКЕ М О ГИЛЬНИКА, Р А С П О Л О Ж Е Н Н О Г О В ГЕОЛОГИЧЕСКИХ ФОРМАЦИЯХ, З А П О Л Н Е Н Н О Г О О Т В Е Р Ж Д Е Н Н Ы М И О Т Х О Д А М И С Р А З Н Ы М И У Д Е Л Ь Н Ы М И Т Е П Л О В Ы Д Е Л Е Н И Я М И [qv — тепловыделение продукта (Вт/м3); du — диаметр скважины могильника(м) ; Хг — теплопроводность грунта (Вт/(мград)); At в годах]
qV 4-10* 2104 10э
0ц .0,3 0,6 0,3 0,6 0,6
*г 2 3 3 0,5 2 3 2 3 0,5
At 45 25 90 70 9 4 50 20 3
Высокие температуры на стенке скважины могильника обеспечивают наличие теплового барьера в окружающей формации, затрудняющего доступ воды в могильники в течение ряда лет. Продолжительность существования теплового барьера определяется тепловыделением захороненного материала, его размерами и теплопроводностью грунта (табл. III).
Структурные изменения захораниваемых материалов и изменения химической устойчивости материалов (см. табл. II) следует особенно учитывать при хранении отвержденных материалов во второй период, когда в результате снижения температуры на поверхности захороненных материалов снимается тепловой барьер и возможен контакт материалов с водой.
ЛИТЕРАТУРА
[ 1 ] Management of Radioactive Wastes from the Nuclear Fuel Cycle, v. I, II (Proc. Symp. Vienna, 1976), IAEA, Vienna (1976).
[ 2] КУЛИЧЕНКО, B.B., КРЫЛОВА, H.B., МУСАТОВ, H.Д., Management of Radioactive Wastes from the Nuclear Fuel Cycle, v. II (Proc. Symp. Vienna, 1976) IAEA, Vienna (1976) 75.
1 3] КУЛИЧЕНКО, B.B. и др., Отчет по контракту с МАГАТЭ №340/RB/RL (1969).[4] ДУХОВИЧ, Ф.С., КУЛИЧЕНКО, В.В., Ат. Энерг. 18 4(1965)361.[5] КУЛИЧЕНКО, В.В. и др., в сб. "Исследования в области обезвреживания жидких, твердых
и газообразных радиоактивных отходов и дезактивации загрязненных поверхностей”, вып. I I , Атомиздат, М., 1978, стр. 103.

208 КУЛИЧЕНКО и др.
DISCUSSION
J. HAMSTRA: You gave a maximum diameter of 60 cm for the borehole
or the glass blocks to be disposed of in the borehole. You also indicated a heat
production of 104 W/m3. What is the maximum temperature you allow on the
contact surface between the glass block and the host rock for blocks of this size?
Are these data based on phosphate glass?
Nina KRYLOVA: In the paper we have given different borehole diameters,
depending on the type of material to be disposed of and its heat generation. The
maximum permissible temperatures on the surface of the material also depend
on the type of material disposed of. In the case of materials of the phosphate-glass
type, the permissible temperature at the centre of the material should not exceed
450°С and that at the surface of the material ~ 300°C. These temperatures are
higher for borosilicate glasses and pyroceramics.
R. KOSTER: You mentioned that you are considering loading ceramic material
up to 70% with fission products (in the case of 70% total oxide content, this would
correspond to >35% fission products). I think this is a very high content and one
would have many separate phases, for example, the Pu02 phase. Besides, with this
high loading you will have problems in connection with the reproducibility of
product quality.
Nina KRYLOVA: The value given in Table I for waste fixation in pyro
ceramics (70%) relates not only to fission products but also to non-active ballast
material. The formation of a separate U02 phase cannot be observed in the
materials chosen by us because in the fuel element reprocessing technology
adopted in the Soviet Union all transuranics are separated and are not treated
together with high-activity products.
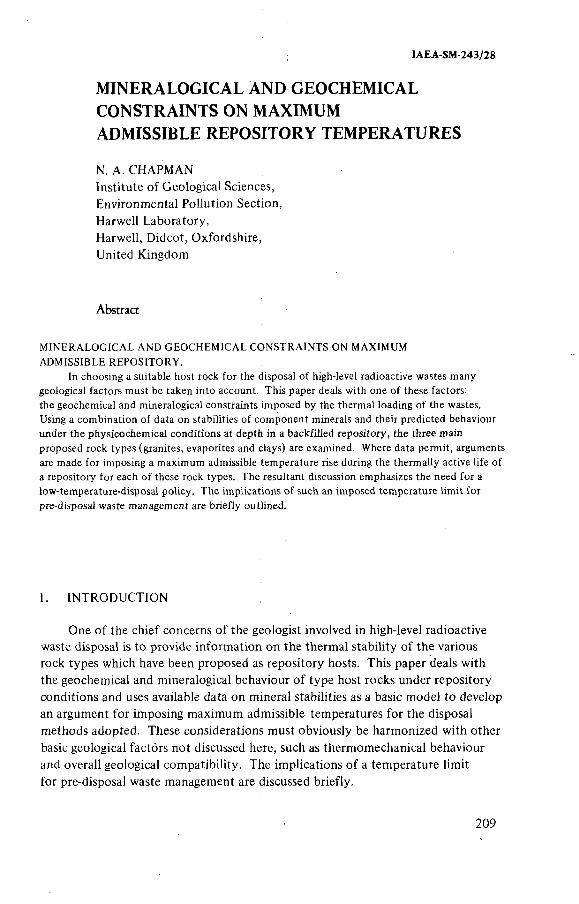
IAEA-SM-243/28
MINERALOGICAL AND GEOCHEMICAL
CONSTRAINTS ON MAXIMUM
ADMISSIBLE REPOSITORY TEMPERATURES
N. A. CHAPMAN
Institute of Geological Sciences,
Environmental Pollution Section,
Harwell Laboratory,
Harwell, Didcot, Oxfordshire,
United Kingdom
Abstract
MINERALOGICAL AND GEOCHEMICAL CONSTRAINTS ON MAXIMUM
ADMISSIBLE REPOSITORY.
In choosing a suitable host rock for the disposal of high-level radioactive wastes many
geological factors must be taken into account. This paper deals with one of these factors:
the geochemical and mineralogical constraints imposed by the thermal loading of the wastes.
Using a combination of data on stabilities of component minerals and their predicted behaviour
under the physicochemical conditions at depth in a backfilled repository, the three main
proposed rock types (granites, evaporites and clays) are examined. Where data permit, arguments
are made for imposing a maximum admissible temperature rise during the thermally active life of
a repository for each of these rock types. The resultant discussion emphasizes the need for a
low-temperature-disposal policy. The implications of such an imposed temperature limit for
pre-disposal waste management are briefly outlined.
1. INTRODUCTION
One of the chief concerns of the geologist involved in high-level radioactive
waste disposal is to provide information on the thermal stability of the various
rock types which have been proposed as repository hosts. This paper deals with
the geochemical and mineralogical behaviour of type host rocks under repository
conditions and uses available data on mineral stabilities as a basic model to develop
an argument for imposing maximum admissible temperatures for the disposal
methods adopted. These considerations must obviously be harmonized with other
basic geological factors not discussed here, such as thermomechanical behaviour
and overall geological compatibility. The implications of a temperature limit
for pre-disposal waste management are discussed briefly.
209

210 CHAPMAN
2. CONTROLLING FACTORS
The important factors controlling the geochemical behaviour of the rock
and any engineered components of the repository during the thermally active life
of the waste are the effects of the basic thermodynamic variables, pressure and
temperature, on the relevant solid/fluid equilibria. These factors will govern all
the geochemical events and interactions, together with other significant features
of the repository, such as the state of the rock, its grain size and fabric, the amount
of groundwater present and its flow rate and path, and the structural geometry of
openings and fractures in the rock body. Emplacing a large but diffuse heat source
in the rock at depth makes the repository a vast open-system pressure cooker and
effectively disturbs all pre-existing geochemical equilibria and the slow but progres
sive reactions which otherwise occur under ambient conditions in the undisturbed
rock.
The significance of this is inescapable; the higher the temperatures attained,
the higher are the thermally induced stresses and the more advanced and wide
spread are the geochemical effects. Hence the less the repository behaves like,
or has the characteristics of, the rock type for which it was originally chosen.
Under even quite low thermal loads the host rock of a shallow repository can
behave locally as it would under ambient conditions existing at 4—5 km depth.
Why is this of importance in the central issue of waste containment? It is
known that even at relatively low pressures and temperatures, given sufficient
time, there can be significant geochemical and mineralogical changes in a rock,
often amplified by chemical interaction between the rock and the fluid phase,
such that some of the fundamental properties of the rock are changed.
Temperature profiles of the transient heat output of a granite repository over its
thousand-year ‘active’ life indicate that such changes would be restricted to the
repository itself and an enveloping rock body of about three times the volume
of the repository. In other words the purely geochemical effects will be limited
to what is termed the ‘near-field’, and the major rock barrier between the reposi
tory and the surface would remain mineralogically intact. However, these near
field surface chemistry and physical properties changes will affect the nuclide
adsorptive capacity of the geological barrier adjacent to the waste canisters, as
well as the hydrogeological behaviour of the repository itself.
3. THERMAL BEHAVIOUR OF TYPE HOST ROCKS
The geochemical behaviour of granites over a wide temperature spectrum up
to the beginning of melting has been reviewed [ 1 ] and a similar approach was
taken to all three currently favoured host rock types in subsequent work [2].

IAEA-SM-243/28
In examining these systems an initial approach is to define solid-state thermal
events which would occur if there were negligible groundwater present (for
example simple decomposition of minerals and structural changes). Since the
stress/pressure conditions in a repository can be defined with reasonable confi
dence these ‘dry’ events can be abstracted from available data and used to provide
a first estimate of maximum admissible temperatures. For example, the presence
of significant amounts of certain thermally unstable hydrated chloride and sulphate
minerals (such as camallite, mirabilite, and epsomite) in an evaporite unit would
limit temperatures to such an extent that the unit could not be seriously consider
ed as a repository host. In this respect evaporites are probably the easiest of the
proposed hosts to evaluate on the basis of mineralogical compatibility. Granites
rarely possess significant modal proportions of any mineral which displays low-
temperature instability and the problems related to geochemical behaviour are
largely those which involve retrogressive interaction with a fluid phase.
Argillaceous rocks must be treated on a much more site-specific basis, as the
behaviour of unconsolidated deposits is-completely different to that of the older
more compact units, which have generally already undergone some degree of
thermal metamorphism.
At the outset then it is necessary to define an absolute temperature for any
given rock type above which thermal effects lead to unpredictable and large-scale
mineralogical change or incipient melting. This provides an upper limit and it is
then possible to work back down temperature until the known effects at given
pressure and rock composition are felt to be acceptable. At this stage it is
important to realize that the presence of even a few weight percent fluid drastically
reduces the upper limit temperature owing to its ability to enhance diffusion and
reaction rates. For example, the melting curve for granite can be reduced by
several hundred degrees. Figures for these fluid-buffered upper limit temperatures
are roughly 700°C for granite and argillaceous rocks and 400°C for evaporite units
of predominantly halite composition. At these temperatures and under the stress
conditions in a repository at 1 km depth or greater the rocks might locally be
approaching their melting points. The following sections consider the sub-solidus
behaviour of the three main rock types, i.e. the thermal effects on mineralogy-
and geochemistry below the upper-limit temperatures.
4. GRANITIC ROCKS
The predominant mineral phases of granite are quartz and feldspar, both of
which are stable on dry heating to very high temperatures, displaying only
structural state modifications or adjustments of solid-solution composition.
Many of the data relating to thermal stabilities of minerals are only relevant
to heating in air at atmospheric pressure. In a backfilled repository the environ
ment will be considerably different and the surrounding pressurized fluid phase

212 CHAPMAN
will have a much lower oxygen activity and be dominated by water of neutral
to alkaline pH with minor dissolved components. Under ambient conditions
fluid composition at depth is buffered by the rock mineral chemistry and it is the
disturbance of these equilibria by heating which causes alteration of the rock.
The composition of the fluid phase at a particular temperature and pressure may
be calculated from simple buffer reactions between minerals and a gas species.
Depending on the mineralogy the proportion of H20, C02, CO and S2 in the
fluid phase may be estimated. Whilst the composition of the solids remains
constant the fluid activities may be calculated from experimental determinations
of solid-fluid equilibria or by using enthalpy, entropy and volume data for the
pure mineral phases, coupled with mixing models for multicomponent phases.
An example of the effect on stability is the behaviour of muscovite (the white
mica found in granites) which, while being stable in air to 1000°C, breaks down
completely under 10 Mpa pressure in the presence of alkaline water at 315°C.
Biotite (the black mica) breaks down according to the prevailing PQj to an iron
oxide phase plus quartz or feldspar. If both total pressure and P0¡ are high this
can occur at relatively low temperatures (less than 400°C). Dehydration reactions
such as these generally proceed more rapidly with increasing pressure. Dissolution
kinetics of quartz and feldspar in supercritical water are largely dependent on
temperature. For example, the solubility of Si02 increases markedly above 200°C.
Since the breakdown of muscovite is a reversible process linked with the
formation of a vapour phase and potassium feldspar, it can be seen that there are
a series of finely balanced fluid-buffered equilibria in any common granite minera
logy which will be grossly disturbed as temperatures exceed about 200°C.
The presence of minute fluid inclusions in quartz can lead to mechanical
disintegration of the rock fabric by decrepitation if rapid heating occurs such
that internal crystal stresses are unable to readjust. The critical temperature will
depend on the geometry of inclusions and their composition, and their behaviour
at different rates can be found only by experiment.
From the geochemical point of view a granite could thus be quite stable up
to 200°C for the requisite thermal lifetime of waste containment were it not for
the effects of fluid-buffered reactions. The actual fluid content of a granite at
depth is debatable, and many more field data must be collected before this can
be quantified for any given site. However, using available data on the hydro
geology of deep crystalline rocks it is possible to make a rough estimate of flux
and hence residence time; probably in the order of 0.2 - 4.0 X 10² ltr per m3
per year and 10 - 200 days/m3 respectively assuming some degree of thermally
driven flow. These figures are probably within an order of magnitude for a depth
of 1 km, and allow some estimate to be made of rock/fluid ratio. Assuming
rate control by surface area of reactant, this value can then be time-scaled to
allow long-term rock behaviour modelling by using varying ratios of rock to
fluid. A very preliminary estimate of 4 : 1 seems reasonable for intergranular
IAEA-SM-243/28 213
ratios over a hundred-year time span, but as the bulk of flow will be via fissures
the value for rock surface/fluid ratio will be very much lower (i.e. fluid/rock
will be very large). It is this latter ratio which is of most significance geo-
chemically. The issue of intergranular geochemical reaction as opposed to fissure
surface alteration also has a bearing on prediction of fluid pressure and gas
species fugacities. Again the latter can be calculated to some extent. Pressures
replicating repository conditions will fall into three theoretical groups:
(1) Intergranular and essentially static fluid pressures
(2) Fissure or interconnecting ‘void’ pressures
(3) Thermally induced point load pressures.
At a depth of one kilometre a ‘saturated’ rock would have an intergranular
fluid pressure of about 30 MPa - i.e. equivalent to the lithostatic load. If one
assumes total interconnection of fissures to the surface group (2) would approxi
mate to about 10 MPa. The value of group (3) will be very difficult to estimate,
but a conservative figure of up to 200 MPa locally might be reasonable.
At present, without detailed experimental modelling of rock-fluid inter
actions, it is not possible to define very accurate limiting temperatures to these
hydrothermal events. Nor is it yet possible to define whether, over a period of
1000 years, such effects would actually be disadvantageous in the main problem of
waste containment. Formation of surface coatings of clay minerals in the major
fissures involved in groundwater movement might cause selective hold-up of
radionuclide migration in the near-field. This must be balanced against possible
bulk rock deterioration causing marked permeability and porosity increases which
may be widespread in and around the repository; it is clear however that without
these results temperatures must be minimized to well below the theoretical maxi
mum of 200°C. A value of less than 100°C has been suggested when it was felt
that there might be a ‘steam problem’ but it is clear that at ambient backfilled
repository pressures of between 10 and 30 MPa, this would not occur, as the
hydrous phase would be below the vapour curve up to very high temperatures.
It may however be a local problem during the ‘operational’ phase of disposal.
For the present, 200°C can be taken as an absolute maximum, with an eventually
acceptable temperature being some 50—100°C lower.
5. ARGILLACEOUS ROCKS
Argillaceous rocks being considered for disposal purposes are very variable
in composition and physical properties and cannot be treated as simply as granites.
They vary from very old, compacted slatey rocks through softer shales to true
plastic clays. The obvious difference is in their water content and basic hydro-
geological properties resulting largely from their fabric, or lack of it.

214 CHAPMAN
In many ways the older units can be treated in a similar manner to crystal
line rocks and during the processes of diagenesis they may have already equilibrated
to temperatures equivalent to or greater than those likely to be encountered in a
repository. Clay mineral content and composition is to a large extent a function
of age, and if the unit has been thermally metamorphosed, most of the unstable
accessory minerals found in juvenile plastic deposits will have disappeared or
been replaced. Progressive heating of a clay mineral assemblage inevitably leads
to total loss of adsorbed and loosely bound water in the interlayer lattices. This
total quantity of water lost depends again on the age and condition of the deposit
but will vary between 10 and 25 wt% of the total clay mineral content.
The bulk of this loss takes place in the temperature range 110—400°C and
in certain minerals is a reversible process. Mobilization of this water will have
considerable effect on the stability of the minor minerals present in an argillaceous
unit, which may themselves be thermally unstable at low temperatures.
Carbonates and sulphides are stable to relatively high temperatures (say
above 450°C) but their stability is dependent on the activities of C02 and S present
in the released fluid phase (for example the solubility of calcite increases with
increasing feo, , but decreases with increasing temperature). In a juvenile plastic
deposit, quantities of organic material may be present which may decompose
to add 02 and S to the fluid. (Naturally significant concentrations of organic
materials are to be avoided). If oxygen activity is high in the deposit then break
down of sulphide phases and chlorite could occur at temperatures above 200°C.
Similarly, the pH of the fluid phase will affect stability of carbonate phases and
mica/illite minerals (which may decompose above 300°C). Sporadic occurrence
of sulphate minerals such as baryte (BaS04) and gypsum (CaS04.2H20) can be
found in the less compacted argillaceous units and these minerals can dissolve or
decompose at very low temperatures (between 70—250°C).
It can be seen that geochemical equilibria in an impure argillaceous unit
are extremely complex and dependent on the pH of the pore fluid and released
water and the activities such as 0 2, H2, C02, and S in that fluid. During
compaction of a newly formed deposit pore-fluid content decreases slowly with
overburden pressure such that at 1 km depth the unit may be 20% free water while
at 5 km the retention of pore-water is insignificant. Since the older mudstone and
phyllitic rocks have already undergone such compaction and metamorphism they
are mineralogically considerably more stable than the plastic clays but lack the
excellent hydrogeological properties of the latter. The main consequence of heating
a large volume of plastic clay is basically the hydrogeological problem of the ulti
mate destiny of the pore and released water.
From the foregoing it is clear that above about 110-120°C considerable
mineralogical changes would occur in a plastic clay and a complex fluid chemistry
would be.generated, but neither of these events may affect the hydrologie integrity
of the repository. Drying out the backfilled repository volume is unlikely to occur

lAEA-SM-243/28 215
unless the pore-fluid pressures generated by heating exceed the lithostatic load
pressure by a considerable margin, hence permitting upward or lateral migration
of fluid through self-generated fissures. More significant is the complex chemistry
of the fluid phase and its corrosive capacity.
If the argillaceous unit is a bedded and jointed rock, i.e. a mature deposit,
then the possibility of generating solute voids and fissure surface alteration would
be parallel to that already discussed for granites.
The main constraint on thermal loading of argillaceous rocks is thus the
release and mobilization of water from the hydrous mineral assemblages and the
effect this would have on mechanical properties of the repository rock and the
corrosion rate of the waste and its containment. Other mineralogical events at
high (> 250°C) temperatures are likely to be insignificant in terms of repository
integrity. Assuming a unit is chosen so as to avoid unstable phases a maximum
temperature value of 150°C seems reasonable, although in this case thermo
mechanical properties are of considerably more influence than mineralogical ones.
6. EVAPORITE FORMATIONS
At an early stage in disposal research it was appreciated that the exceptionally
complex admixture of evaporite minerals which can occur in both bedded and
dome ‘salts’ was to be avoided in potential host rocks. Those currently under
study are predominantly halite (NaCl) bodies, although more complex units of
interbedded mixed evaporites and clay/mudstones offer some potential. In the
introductory section of this paper it was suggested that the thermal constraints
on use of evaporites were considerably easier to determine than for other rocks
simply because so few of the eighty or more possible evaporitic minerals are stable
enough to countenance as even minor constituents of a disposal zone. Of the
remainder very few form bodies of sufficient extent to host a repository.
Nevertheless, it is of importance to carry out detailed searches for unstable phases
in any proposed site. The three prime geochemical factors involved in evaporite
stability are (a) presence of unstable hydrous minerals; (b) the behaviour of free
fluid and fluid inclusions and (c) effect of complex solid solutions in some minerals
on their thermal behaviour. In addition, when dealing with evaporites, their
physical behaviour will be of more importance than their geochemical properties.
Of the thermally unstable hydrated minerals only three are likely to be
present in considerable quantities. Polyhalite (K2 MgCa2(S04 )4,2H20) loses
water at temperatures above 300°C with major loss at 340-360°C. Gypsum
(CaS04.2H20) loses 1| molecules of water of crystallization at 70°C but its
inherent instability often leads to replacement by anhydrite (CaS04 ) in many
natural evaporite sequences. Camallite (MgKCl3,6H20) dehydrates above 130°C
and melts at 490°C. Several other chlorides and sulphates are highly unstable
216 CHAPMAN
below 200°€ and some down to 40°C (e.g. bischofite, tacihydrite, hexahydrite,
leonite, kainite) and some, such as mirabilite (Na2S04. 10H20), would contribute
large amounts of water to a deposit if they dehydrated.
The thermal behaviour of fluid inclusions in halite is a well known subject
and it is not intended to dwell on it here. In itself it has no geochemical effect
but could lead to local fluid concentrations around individual waste blocks and
pose both corrosion and heat transfer problems. Halite is considerably more
soluble than many other evaporite minerals (e.g. sylvine, gypsum, anhydrite) and,
unlike some, its solubility increases with temperature over the 30-200°C range.
Solid solutions of some evaporite components can significantly lower their melting
temperatures. For example halite-sylvine solid solution displays a eutectic 150°C
lower than the melting point of pure halite, and the addition of MgCl2 can further
reduce this value to 385°C.
If a unit contained none of the problematic hydrous minerals discussed
above, then fluid content (as fluid inclusions, in disseminated clay particles, and
as intercrystalline films) would amount to about 0.5 wt%, emphasizing the inherent
dryness of salt deposits. However this apparent paucity of free water is debatable
and some recent work [3, 4] has shown that fluid distribution is often highly
irregular but not as trivial as sometimes supposed, locally amounting to 5 wt%.
The spatial distribution and thermal behaviour of such zones require careful
research although available data suggest that in drier formations much of the free
water remains static up to quite high temperatures (> 200°C) although migration
of fluid inclusions would occur at lower temperatures. If a unit is carefully
chosen so as to avoid the thermally unstable minerals and obviously strongly
hydrated zones, then this latter figure provides a first approximation at a
temperature limit. However, there is a complicating factor introduced by the
radiation dose energy which can be stored in a halite unit [5, 6]. Above 150°C
a negligible amount of energy is stored, but this increases on decreasing temperature
to a saturation limit of 60 cal/g below 120°C. Thus if the salt temperature is
maintained above 150°C no release of energy by subsequent thermal annealing can
occur. The authors envisaged no natural method of heating to annealing point, even
in the peripheral areas of the zone where temperatures were cool enough to allow
energy to have been stored during irradiation. In a reported incident of simultan
eous release of 200 cal/g from a salt volume at 260°C the thermal and mechanical
perturbations caused were small and short-lived.
There is obvious scope in this contex for modelling these processes for specific
halite samples (and other pertinent minerals) using predicted values of decay in
dosage with repository age, and cooling subsequent to loss of short-lived fission
products.
A final point linking the fluid migration and irradiation properties of salt
is that irradiated salt dissolves much more rapidly in water than normal salt. No
modelling data are known for the combination of these near-field effects, which
IAEA-SM-243/28 217
would enhance migration rates of fluid, and also lead to release of H2 from
dissolved salt.
The geochemical problems in a salt repository can thus be seen to be con
centrated on the very near field, in fact on a single canister scale. Again assuming
absence of unstable phases, the problem is one of modelling halite behaviour when
it is undergoing combined radiation damage and encroachment of fluid inclusions.
A combination of increased solubility and stored energy release could cause
considerable localized change in the immediate canister environment. Mechanical
breakdown and enhanced dissolution could form brine pools which may be mobile
and effect an alteration in disposal geometry. It is clear that despite the resultant
increased facility for crystal energy storage, temperatures in a generic salt repository
should be kept low, possibly not higher than 120°C, although the final value is
very site-specific (possibly more so than with any other rock type).
7. CONCLUSIONS
The geochemical and mineralogical responses to heating of any body of rock
are extremely important in deciding whether it would make a feasible high-level
waste repository host. It is possible to impose a theoretical maximum permissible
repository temperature for any unit and this must be dovetailed into interpretations
of transient thermal fields to model localized phenomena. Such an approach is an
important component of a comprehensive assessment.
The role of fluid-buffered reactions is probably the most influential in
setting any temperature limits, or in deciding whether certain mineralogical
assemblages are favourable for disposal. Reactions must be modelled by a
combination of experiment simulating actual repository conditions and pre
dictive equilibrium thermodynamics, and in many cases will be specific in detail
to any particular site studied.
It is very difficult to use the geochemical data outlined in this report in
isolation to make a value judgement as to which rock type would be most suitable
for disposal. When examining all the necessary requirements of thermal stability,
mechanical stability, workability, suitable groundwater flow regimes, waste/rock
chemical compatibility, etc., it becomes clear that one has to make a trade-off
between theory and practice. This can only emphasize the need for comprehensive
modelling of repository processes to define those areas which can be safely
neglected. The need to adopt a ‘low-temperature’ disposal policy is emphasized.
In order to maintain the vital element of long-term predictability it is important
to minimize bulk rock temperatures within the limits imposed by safe handling
and pre-disposal storage of the waste. For example, an imposed limit of 200°C
for granite rocks implies that, for currently favoured granitic repository geometry,
vitrified HARVEST waste blocks would be limited to a maximum thermal output

218 CHAPMAN
of 2.5 kW a piece at the time of disposal. This in turn means that they must be
stored for 20 years prior to emplacement. Reduction of the maximum admissible
temperature to around 120—1309C would increase the surface storage period
considerably, to around 50 years. If the surface storage requirements necessitated
by the imposition of a maximum temperature are not compatible with long-term
safety then the initial production thermal rating of the blocks must be limited.
In other words block size of waste content must be reduced or otherwise adjust
ed to the disposal system. As a final point, it is worth considering the effect of
a relatively high maximum temperature (anything over 100°C) on operational
environment in a repository. Since initial bulk rock temperatures in granite
rapidly approach a maximum within the operational phase of waste emplacement
it is conceivable that certain zones of a repository would become inaccessible or
untenable for normal operating procedures. This is very dependent on repository
geometry and the emplacement and backfilling procedure. Thus, apart from
thermomechanical constraints on temperature, the purely geochemical evidence
presented here must be further weighed against waste management and repository
operation policy.
ACKNOWLEDGEMENTS
This work was funded jointly by the European Economic Community
(Contract No. 018-76—7 WASUK) and the United Kingdom Atomic Energy
Authority. The paper is published with permission of the Commission and the
Authority together with that of the Director of the Institute of Geological
Sciences.
REFERENCES
[1] CHAPMAN, N. A., “Application of laboratory hydrothermal studies to heating
experiments”, In situ Heating Experiments in Geological Formations (Proc. Seminar
Stripa, Sweden, 1978) OECD (1978) 229.
[2] CHAPMAN, N.A., Geochemical Considerations in the Choice of a Host Rock for the
Disposal of High-Level Radioactive Wastes, Institute of Geological Sciences Report
Series, HMSO London (in press).
[3] ROEDDER, E., BELKIN, H. E., “Application of studies of fluid inclusions in
Permian Salado salt New Mexico to problems of siting a nuclear waste repository” ,
Abstracts H2; Symp. A., Materials Res. Soc. Ann. Meeting, Boston (1978).

IAEA-SM-243/28 219
[4] STEWART, D. B., POTTER, R. W., “Application of physical chemistry of fluids
in rock salt at elevated temperature and pressure to repositories for radioactive
waste” , Abstracts H I; Symp. A., Materials Res. Soc. Ann. Meeting, Boston
(1978).
[5] JENKS, G.H., BOPP, C.D., Storage and Release of Radiation Energy in Salt in
Radioactive Waste Repositories, Oak Ridge Nat. Lab. Rep. ORNL-TM-4449 (1974).
[6] JENKS, G.H., Gamma Radiation Effects in Geological Formations of Interest in
Waste Dispoal, Oak Ridge Nat. Lab. Rep. ORNL-TM^827 (1975).
DISCUSSION
J. HAMSTRA: On what basis did you set an upper limit on thermal loading
for a pure halite host rock resulting in rock salt temperatures no greater than
120°C? You give a value of 130°C for the temperature at which carnallite starts
hydrating. Thereby you add another value to a whole list, ranging from 70°C to
167.5°C which is to be found in the recent literature. I should like to stress
that for the disposal of high-level waste in rock salt we are interested only in
the temperature level at which camallite will dehydrate under representative
in situ conditions — that is, in my view, when fully surrounded by sodium
chloride. Under those conditions, the full value is 167°C or slightly higher,
depending on the lithostatic pressure.
N.A. CHAPMAN: Discussing a maximum temperature for pure halite, I
noted an apparent value of about 200°C as a first approximation. However, 1
then discussed the complicating factors induced by combined effects of stored
energy, increase of dissolution rate with temperature and the thermally induced
migration of fluid inclusions. These factors must be modelled in combination,
and I reiterate the point made several times in the paper by Stewart et al.
(IAEA-SM-243/97) that the current models of fluid migration are not yet
exhaustive. There is no threshold temperature for inclusion migration and the
ambiguity of existing data necessitates a cautious approach to setting an upper
temperature limit until the resultant effects of these combined factors are
thoroughly understood. For this reason, the apparent value of ~ 200°C is too
high for a prelimirary limiting temperature and a value of ~ 120°C represents a
more reasonable interim working temperature. In this context, I would stress
two points. First, any eventual value is bound to be site-specific and may vary
considerably from that obtained elsewhere, for it depends entirely on the local
properties of the halite. Secondly, the point I made in the paper concerning the
necessity for adequate experiments and modelling of thermal processes under
realistic repository conditions is emphasized by the very nature of this discussion.
This is clear from your second point, which I fully appreciate, regarding the
diversity of carnallite breakdown temperature values. Specific site-geochemical
conditions must be replicated exactly if a meaningful figure is to be obtained.

220 CHAPMAN
L. R. HILL: To pursue Dr. Hamstra’s question, I do not understand what
are the bases for a maximum temperature of 120°C for “pure halite” (T, ). Is
the number an arbitrary but reasonable one ? Personally, I would subscribe
to a figure greater by a factor of about two.
N. A. CHAPMAN: To a large extent I have answered this point in the reply
to Dr. Hamstra. What may be reasonable in the WIPP context may not be so in
another evaporite unit. As I emphasized above, we are going to need more
exhaustive data at each site and a far better understanding of combined processes
dominated by fluid inclusion migration before we can countenance very high
temperatures (> 200°C) as a generic model. In your own situation 120°C may
seem a little over-cautious but I feel that such an approach is necessary until
the modelling data are further refined.
Valentina BALUKOVA: Did you study geochemical conversions, taking
into account the kinetics of the processes ?
N. A. CHAPMAN: In this paper, which attempts to define preliminary
limiting temperatures, I have taken no account of reaction kinetics. This is
because in most cases we lack the relevant thermodynamic data under the
pertinent repository conditions. However, in my presentation I discussed the
laboratory programme which we are carrying out to determine just these para
meters under the pressure and temperature environment of a deep repository.
Our initial work will seek to define the significant limiting reactions and the rate
constants involved. This will be supported by computer simulations of reaction
paths using available and derived thermodynamic data. In the course of this work
we must take into account the prolonged thermal life of a high-level waste
repository, induced fluid and geochemical fluxes and available surface areas of
reactants under realistic hydrogeological regimes.
RADIONUCLIDE MIGRATION
(Session VIII)

Chairman
V.I. SPITSYN
Union of Soviet Socialist Republics
IAEA-SM-243/8
Rapport établi sur demande
ENSEIGNEMENTS TIRES DE L’ETUDE DES
REACTEURS NATURELS FOSSILES D’OKLO POUR
LE STOCKAGE DES DECHETS RADIOACTIFS
R. HAGEMANN*, R. NAUDET**
CEA, Centre d’études nucléaires de Saclay,
Gif-sur-Yvette
F. WEBER
Université Louis Pasteur,
Institut de géologie,
Strasbourg,
France
Abstract-Résumé
KNOWLEDGE GAINED FROM THE STUDY OF NATURAL FOSSIL REACTORS AT
OKLO FOR RADIOACTIVE WASTE DISPOSAL.
The natural reactors of Oklo operated about two thousand million years ago and since
then the uranium has remained in place almost in its entirety; this remarkable state of
preservation has made it possible to make some interesting observations regarding the
containment or, conversely, the dispersion of fission-produced or radiogenic elements in the
ground. Many studies have been performed, the scale of which ranges from the microscopic
to that of the reaction zones as a whole. The geological environment of the reactors is
described briefly; the most important fact is that the thermal convection currents associated
with the heat release from nuclear reactions have completely desilicated the sandstones which
contained uranium, thereby forming argillaceous lenses. The behaviour of the elements
studied is described, these being classified into three categories according to their geochemical
stability: (1) Elements that have been almost entirely preserved apart from occasional small
redistributions. These are mainly the rare earths, zirconium, the elements of platinum ore
(Ru, Rh and Pd) and radiogenic thorium. It is moreover fairly certain that the plutonium
remained intact in the uranium before decaying; (2) Elements that have migrated but still
exist in considerable quantities, notably radiogenic lead and bismuth and molybdenum;
and (3) Elements that have been practically eliminated apart from small traces. These are
the rare gases (Kr and Xe), iodine, cadmium, the alkali metals (Rb and Cs) and the
alkaline-earth metals (Sr and Br). It seems, however, that in certain cases the migration of
these elements from uranium may not have been very rapid. The main conclusion to be
drawn from these observations is that uraninite was largely responsible for the preservation;
* Division de chimie, Département de recherche et analyse.
** Division d’étude et de développement des réacteurs.
223

224 HAGEMANN et al.
it has exhibited a very remarkable retentive capacity, especially for weakly volatile elements
having ionic radii compatible with its crystal lattice. On the other hand, the retentive
capacities of argillaceous gangue and of the environment seem to have been rather poor.
ENSEIGNEMENTS TIRES DE L’ETUDE DES REACTEURS NATURELS FOSSILES
D’OKLO POUR LE STOCKAGE DES DECHETS RADIOACTIFS.
Les réacteurs naturels d’Oklo ont fonctionné il y a près de deux milliards d’années, et
depuis cette époque, l’uranium est resté presque intégralement en place; ce remarquable
état de préservation a permis des observations intéressantes relativement au confinement ou au
contraire à la dispersion des éléments fissiogéniques ou radiogéniques dans les terrains. De
nombreuses études ont été effectuées depuis l’échelle microscopique jusqu’à l’échelle globale
des zones de réaction. L’environnement géologique des réacteurs est présenté brièvement:
le fait essentiel est que les courants de convection thermique Ués au dégagement de chaleur des
réactions nucléaires ont intégralement désilicifié les grès qui contenaient l’uranium, formant
ainsi des lentilles argileuses. On décrit le comportement des éléments étudiés, qui sont classés
en trois catégories suivant leur stabilité géochimique : 1 ) Certains ont été presque intégralement
préservés, bien qu’on observe parfois de petites redistributions: ce sont principalement les terres
rares, le zirconium, les éléments de la mine du platine (Ru, Rh, Pd), et le thorium radiogénique.
On est à peu près certain d’autre part que le plutonium est resté intégralement dans l’uranium
avant sa décroissance. 2) D’autres éléments ont migré, mais subsistent en quantité notable:
on peut citer en particulier le plomb et le bismuth radiogéniques, ainsi que le molybdène.
3) Enfin des éléments ont été presque totalement éliminés, bien qu’on en retrouve de faibles
traces: ce sont les gaz rares (Kr, Xe), l’iode, le cadmium, les alcalins (Rb, Cs) et les alcalino-
terreux (Sr, Br). Il semble toutefois que dans certains cas la sortie de ces éléments de l’uranium
n’a peut-être pas été très rapide. La principale conclusion des observations est que c’est
l’uraninite qui a assuré l’essentiel de la préservation: elle a eu un très remarquable pouvoir de
rétention, en particulier vis-à-vis des éléments peu volatils et dont les rayons ioniques étaient
compatibles avec son réseau cristallin. Au contraire les capacités de rétention de la gangue
argileuse et de l’environnement semblent avoir été plutôt médiocres.
INTRODUCTION
Il était bien difficile de prévoir que les spéculations de WETHERILL (1953)1 et de KURODA ( 1956)2 seraient confirmées, près de vingt ans plus tard,par la découverte du phénomène d’Oklo, et qu’ainsi le fonctionnement d’un réacteur nucléaire et le stockage de ses propres déchets seraient un phénomène naturel, représentant une source d ’informations intéressantes pour les problèmes posés' par l’utilisation de l’énergie nucléaire.
Depuis qu’on a découvert durant l’été 1972 que des réactions de fission en chaîne s’étaient produites, il y a près de deux milliards d ’années
1 W ETHERILL, G., INGHRAM, M., “ Spontaneous fission in uranium and thorium” ,Proc. Conf. on Nuclear Processes in Geologic Settings (William Bay, Wisconsin, 2 1 -2 3 Sept. 1953), National Research Council, Washington D.C. (1953).
2 KURODA, P.K., On the nuclear physical stability of the uranium minerals, J . Chem.Phys. 25 (1956) 781.
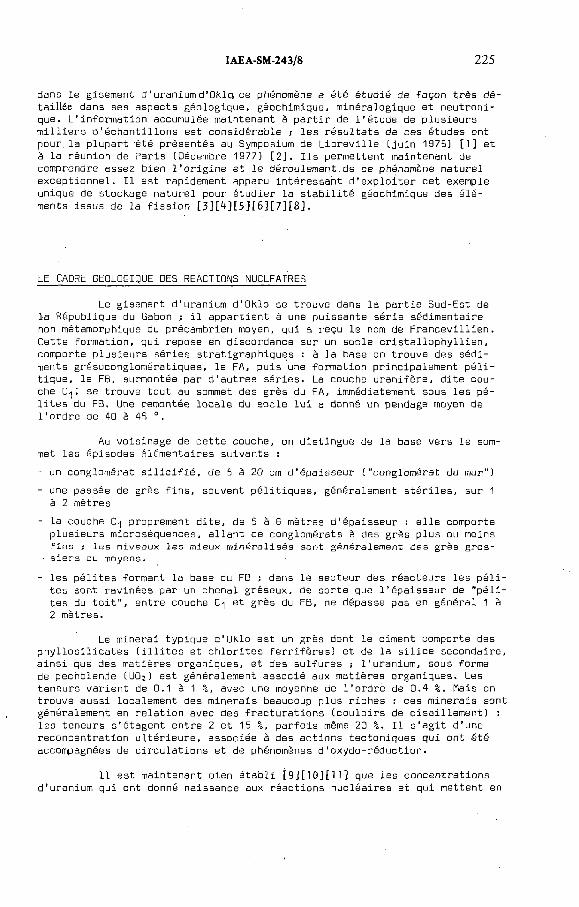
IAEA-SM-243/8 225
dans le gisement d ’uranium d’Okla ce phénomène a été étudié de façon très détaillée dans ses aspects géologique, géochimique, minéralogique et neutroni- que. L'information accumulée maintenant à partir de l'étude de plusieurs milliers d'échantillons est considérable ; les résultats de ces études ont pour la plupart été présentés au Symposium de Libreville [juin 1975) [1] et à la réunion de Paris [Décembre 1977) [2]. Ils permettent maintenant de comprendre assez bien l'origine et le déroulement.de ce phénomène naturel exceptionnel. Il est rapidement apparu intéressant d’exploiter cet exemple unique de stockage naturel pour étudier la stabilité géochimique des éléments issus de la fission [3][^][5][6][7][8].
LE CADRE GEOLOGIQUE DES REACTIONS NUCLEAIRES
Le gisement d'uranium d'Oklo se trouve dans la partie Sud-Est de la République du Gabon ; il appartient à une puissante série sédimentaire non métamorphique du précambrien moyen, qui a reçu le nom de Francevillien. Cette formation, qui repose en discordance sur un socle cristallophyllien, comporte plusieurs séries stratigraphiques : à la base on trouve des sédiments grésoconglomératiques, le FA, puis une formation principalement péli- tique, le FB, surmontée par d'autres séries. La couche uranifère, dite couche se trouve tout au sommet des grès du FA, immédiatement sous les pé- lites du FB. Une remontée locale du socle lui a donné un pendage moyen de l’ordre de 40 à 45 °.
Au voisinage de cette couche, on distingue de la base vers le sommet les épisodes élémentaires suivants :- un conglomérat silicifié, de 5 à 20 cm d'épaisseur ("conglomérat du mur")- une passée de grès fins, souvent, pélitiques, généralement stériles, sur 1
à 2 mètres- la couche C-] proprement dite, de 5 à 6 mètres d'épaisseur : elle comporte plusieurs microséquences, allant de conglomérats à des grès plus ou moins fins ; les niveaux les mieux minéralisés sont généralement des grès gros-
■ siers ou moyens.- les pélites formant la base du FB ; dans le secteur des réacteurs les péli- tes sont ravinées par un chenal gréseux, de sorte que l'épaisseur de "pélites du toit’’, entre couche C-| et grès du FB, ne dépasse pas en général 1 à2 mètres.
Le minerai typique d’OKlo est un grès dont le ciment comporte des phyllosilicates (illites et chlorites ferrifères) et de la silice secondaire, ainsi que des matières organiques, et des sulfures ; l’uranium, sous forme de pechblende (UOj) est généralement associé aux matières organiques. Les teneurs varient de 0.1 à 1 %, avec une moyenne de l'ordre de 0.4 %. Mais on trouve aussi localement des minerais beaucoup plus riches : ces minerais sont généralement en relation avec des fracturations (couloirs de cisaillement) : les teneurs s'étagent entre 2 et 15 %, parfois même 20 %. Il s’agit d ’une reconcentration ultérieure, associée à des actions tectoniques qui ont été accompagnées de circulations et de phénomènes d'oxydo-réduction.
Il est maintenant bien établi [9][10][11] que les concentrations d’uranium qui ont donné naissance aux réactions nucléaires et qui mettent en

226 HAGEMANN et al.
FIG. 1. Les réacteurs d 'O klo .
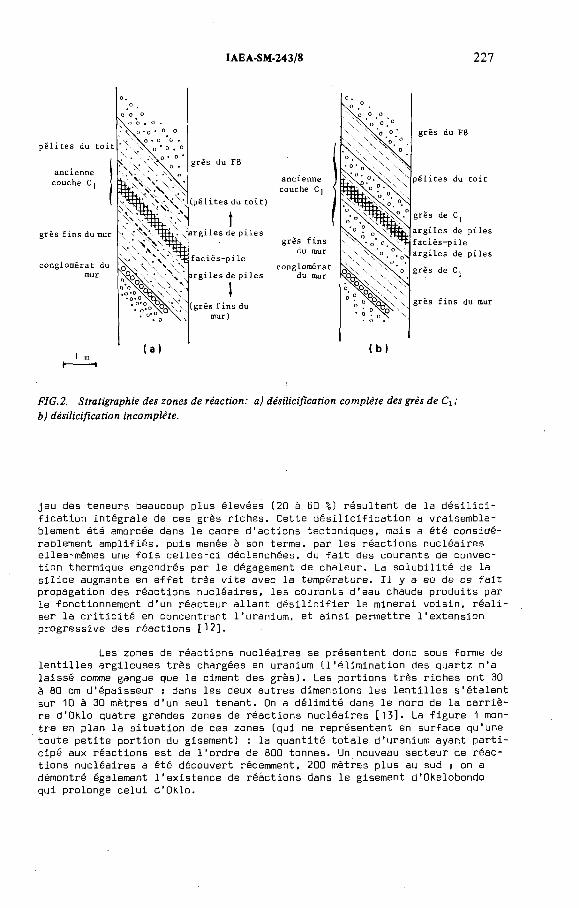
IAEA-SM-243/8 227
F IG .2. Stratigraphie des zon es d e réaction: a) désilic ifica tion co m p lè te des grès d e C \ ; b) désilic ifica tion in com plète .
jeu des teneurs beaucoup plus élevées (20 à 60 %) résultent de la désilicification intégrale de ces grès riches. Cette désilicification a vraisemblablement été amorcée dans le cadre d’actions tectoniques, mais a été considérablement amplifiée, puis menée à son terme, par les réactions nucléaires elles-mêmes une fois celles-ci déclenchées, du fait des courants de convection thermique engendrés par le dégagement de chaleur. La solubilité de la silice augmente en effet très vite avec la température. Il y a eù de ce fait propagation des réactions nucléaires, les courants d ’eau chaude produits par le fonctionnement d'un réacteur allant désilicifier le minerai voisin, réaliser la criticité en concentrant l'uranium, et ainsi permettre l'extension progressive des réactions [12].
Les zones de réactions nucléaires se présentent donc sous forme de lentilles argileuses très chargées en uranium (l'élimination des quartz n'a laissé comme gangue que le ciment des grès]. Les portions très riches ont 30 à 80 cm d’épaisseur ; dans les deux autres dimensions les lentilles s'étalent sur 10 à 30 mètres d'un seul tenant. On a délimité dans le nord de la carrière d ’Oklo quatre grandes zones de réactions nucléaires [13]. La figure 1 montre en plan la situation de ces zones (qui ne représentent en surface qu'une toute petite portion du gisement) : la quantité totale d'uranium ayant participé aux réactions est de l'ordre de 800 tonnes. Un nouveau secteur de réactions nucléaires a été découvert récemment, 200 mètres plus au sud ; on a démontré également l’existence de réactions dans le gisement d'Okelobondo qui prolonge celui d'Oklo.

228 HAGEMANN et al.
La désilicification a affecté non seulement les minerais les plus riches, qui ont constitué le coeur des réacteurs, mais l’environnement immédiat. Les portions argilisées débordent donc latéralement les réacteurs proprement dits -, dans le sens de la stratification, on trouve deux situations différentes, illustrées par Iss figures 2 a et 2 b. Dans le premier cas, qui correspond aux zones 1 et 2 où les taux de réaction ont été les plus élevés, la totalité des grès de C-| a été désilicifiée, et il y a donc maintenant des argiles sans interruption depuis les grès fins du mur jusqu'aux pélites du toit. Dans le deuxième cas de figure, il reste des grès de C-| de part et d'autre de la portion argilisée. Dans le coeur des réacteurs, où les teneurs moyennes sont le plus souvent comprises entre 40 et 50 %, le "faciès-pile" est caractérisé notamment par la restructuration de la pechblende en gros grains d'uraninite ; de part et d'autre on trouve des "argiles de piles” où les teneurs chutent plus ou moins rapidement et où la minéralisation est plus diffuse. Des remaniements géochimiques se sont produits pendant les réactions : la totalité des quartz a été éliminée, y compris dans les bordures, et de grandes quantités de magnésium ont été fixées sous forme de chlorites magnésiennes.
L'élimination de la silice a eu pour effet, en concentrant l'uranium, de diminuer le volume total du minerai, ce qui a provoqué des réajustements tectoniques locaux. Dans le cas où au toit des réacteurs il subsiste des grès, ceux-ci ont cassé par compartiments successifs ; dans le cas où la zone argilisée va jusqu'aux pélites, celles-ci ont eu tendance à fluer vers l'aval, en donnant lieu à des flexurations.
L’appauvrissement isotopique de l'uranium dû aux fissions est souvent important, ceci malgré une récupération partielle par décroissance du plutonium 239 : le rapport 235U/238U s'abaisse dans certains échantillons jusqu'à 0.3 % au lieu de 0.725% dans l 'uranium naturel normal. Au total dans les quatre premières zones, l’uranium 235 manquant - qui est maintenant connu avec précision puisque la quasi-totalité de cet uranium a été exploitée - est d'un peu plus de 6Ü0 Kg. Cela représente à l’époque des réactions environ six tonnes d'uranium 235 fissionné, et un peu plus de trois tonnes de plutonium transitoirement formé. Le dégagement total de chaleur a été d'environ 500 milliards de mégajoules (16 500 MW-an), mais la puissance n ’a jamais dépassé quelques dizaines de Kilowatts ; les durées de fonctionnement locales s'étagent entre 100 000 et B00 000 ans, le phénomène ayant vraisemblablement duré au total plusieurs millions d'années.
Les réactions,qui ont pu se poursuivre grâce à la destruction neu- tronique des "poisons" nucléaires, étaient contrôlées par la température.A l'époque des réactions le gisement était assez profondément enfoui, l'épaisseur de recouvrement probable étant de l'ordre de 3 à 4 000 mètres ; la pression était donc suffisamment élevée pour que l’eau ait été à l’état surcritique. L’étude des circulations fluides montre que les températures se sont élevées jusqu’à 400 °C, sans vaporisation. A la suite des réactions, les minéraux argileux du coeur ont recristallisé, et on n’y trouve plus trace de dégâts d’irradiation.
Depuis l’époque des réactions nucléaires, il n ’y a pas eu, semble- t-il, d ’événement géologique majeur dans ce secteur. Néanmoins, on connaît une phase de diagénèse tardive, et il y a eu aussi une activité volcanique vraisemblablement postérieure aux réactions. Beaucoup plus tard, vers 1000 MA, le gisement d’OKlo a été traversé par des filons de dolérite. Enfin la remontée du gisement jusqu’à son niveau actuel, dont une partie au moins est

IAEA-SM-243/8 229
probablement relativement récente, a été accompagnée de petits réajustements tectoniques, qui ont provoqué des remises en circulation et des altérations.A notre époque, le secteur des réacteurs naturels était parvenu très près de la surface, mais il ne semble pas que les phénomènes d’altérations oxydantes par les eaux superficielles aient eu le temps de s'exercer notablement.
LE riAINTIEN EN PLACE DE L'URANIUM
Le fait certainement le plus remarquable du phénomène d'OKlo est que l'uranium des réacteurs est resté à peu près intégralement en place, sans remobilisation notable, pendant les réactions nucléaires et pendant les deux milliards d'années qui ont suivi.
Dès le début de l'exploration du site, il est apparu que l'uranium à forte dégradation isotopique se trouvait exclusivement au sein des accumulations de minerai à haute teneur. On a montré ensuite, en faisant des coupes à travers ces réacteurs, que l'appauvrissement isotopique variait de manière très régulière, et conformément à ce que prévoient les calculs de physique neutronique. En outre, on a pu mettre en évidence de nombreuses corrélations avec les indications tirées des produits de fission, notamment les terres rares : les transferts isotopiques liés au flux neutronique sont cohérents, ainsi que les quantités de produits de fission, et on peut même mettre en évidence des corrélations au deuxième degré, concernant des grandeurs physiques déduites de la confrontation des mesures.
Des études très minutieuses ont montré qu’en réalité les corrélations ne sont pas parfaites : il y a eu en particulier une petite redistribution des terres rares, mais en revanche, au moins dans certains cas, l’uranium n'a subi aucune remobilisation décelable dans le coeur [14]. On est certain qu'il n’y a pas eu de restructuration de l'uranium donc de réhomogénéisation isotopique depuis l'époque des réactions, car on a observé des traces de dégâts d'irradiation sur les grains d'uraninite, et ceux-ci contiennent des produits de fission qui n'ont pas d’affinité particulière pour l'ura nium, et qui se trouvent exclusivement dans ces grains (comme le montre la sonde ionique). Dans ces conditions, l'excellente homogénéité isotopique de l'uranium à l'échelle microscopique prouve qu'il n'y a pas eu de redistribution. Par ailleurs l'étude du bilan entre néodyme de fission et thorium radio génique [issu de l’uranium 236 avec une période de 24 millions d ’années) montre que dans le coeur il n'y a pas eu de départ appréciable d'uranium entre le début des réactions et la disparition de l'isotope 236.
On trouve cependant, en bordure des réacteurs, une ’’auréole" de contamination contenant un peu d’uranium appauvri déplacé. Les études ont montré que cette auréole remonte à l’époque des réactions et a été la conséquence des courants de convection thermique ; il s'y superpose de minimes perturbations dues aux altérations récentes. Il semble que les déplacements d'uranium ont eu lieu avant la désilicification intégrale des grès j celle- ci, ne laissant subsister que les minéraux argileux, a formé des amas imperméables, contournés par les courants de convection. Or, dans certains cas au moins - en particulier le haut de la zone 2 qui a été le plus étudié - on pense que la désilicification était achevée dans le coeur, et que celui-ci était stabilisé, au moment où les réactions se sont installées : c'est ce qui expliquerait que le coeur ait été préservé, alors que de petits déplacements ont continué dans les bordures dont la désilicification n'était pas complète.

COMPORTEMENT DES DIFFERENTS ELEMENTS FISSIOGENIQUES OU RADIOGENIQUES
230 HAGEMANN et al.
On peut classer les éléments en trois catégories : ceux qui ont été en première approximation bien conservés - ceux qui ont plus ou moins massivement migré, mais qui sont restés néanmoins en quantité appréciable dans les zones de réaction - enfin ceux qui ont été presque totalement éliminés.
a) Dans la première catégorie, on peut placer le thorium radiogéni- que, toute la série des terres rares (La, Ce, Pr, Nd, Sm, Eu, Gd, Tb), le zirconium, le ruthénium, le rhodium et le palladium, et vraisemblablement 1'yttrium, le niobium et le tellure.
On peut ajouter à cette liste le plutonium, bien que naturellement il soit maintenant absent des zones de réaction, car on peut avoir des indications sur son comportement avant sa décroissance en considérant l'uranium 235 qui en est issu. Il est apparu très vite que par comparaison avec les fluences mesurées, l'appauvrissement isotopique de l'uranium est insuffisant, ce qui prouve qu'on a récupéré des quantités notables d'isotope 235 ; les études neutroniques [15] ont montré qu'on retrouve très bien les ordres de grandeur prévisibles pour le "coefficient de restitution”. Mais bien entendu cette vérification ne peut pas être suffisamment précise pour qu’on puisse affirmer que l'intégralité du plutonium a été conservée.
Sur ce point la microanalyse ionique apporte des renseignements très précieux [16]. Compte tenu de ce que dans les échantillons très irradiés, plus de la moitié de l'uranium 235 résiduel est d'origine radiogénique,une migration significative du plutonium avant sa décroissance devrait avoir provoqué des inhomogénéités de composition isotopique de l'uranium. Or des examens nombreux et minutieux ont montré qu'il n'en était rien. D'une part les grains d'uranium ont une composition parfaitement homogène (citons par exemple une étude américaine [17] où 27 mesures effectuées en des points différents de trois petits grains d'un échantillon ont donné la même valeur0.522 % avec une dispersion de seulement 0.004 %). D'autre part les imagesioniques obtenues à partir des deux isotopes sont absolument superposables : on ne peut discerner aucune différence, même minime,à l'échelle du ym ; comme le plutonium déplacé redonne de l’uranium 235 pur, tout déplacement ayant donné un grain enrichi même minuscule devrait être immédiatement repéré.
Par ailleurs, malgré plus de mille analyses isotopiques, on n’a jamais trouvé d’uranium à teneur isotopique supérieure à la normale dans l’environnement des zones de réaction. On peut estimer que si un millième seulement du plutonium formé s’était redéposé dans ces bordures très pauvres, on aurait constaté à coup sûr des anomalies.
On peut donc considérer comme extrêmement probable que le plutonium est resté intégralement dans l'uranium jusqu’à sa décroissance complète. Cela n'a rien de surprenant, compte tenu de l'analogie de propriétés des deux éléments !+il y a Jsomorphisme entre les oxydes UO2 et РиОг et les noyaux ioniques U et Pu1* sont extrêmement voisins (1.0B Â et 1.04 Â respectivement, à la coordinance 8). Les deux éléments forment des solutions solides et comme un noyau de plutonium à sa formation prend dans le réseau la place d'un noyau d'uranium, sa présence ne crée aucune perturbation. En outre, contrairement à l'uranium, le plutonium ne passe pas en valence B et est donc plus stable vis-à-vis des solutions oxydantes.
Le thorium radiogénique, issu de la décroissance de 236U, ne peut pas être distingué du thorium naturel, mais compte tenu de la faible abondance de ce dernier, il est certain que dans les zones de réaction à fluence
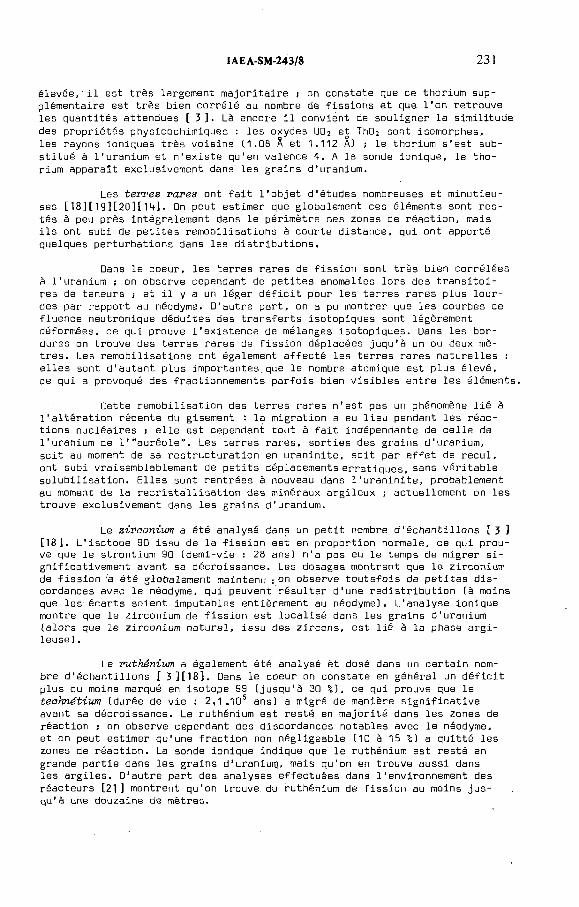
IAEA-SM-243/8 231
élevée,'il est très largement majoritaire ; on constate que ce thorium supplémentaire est très bien corrélé au nombre de fissions et que l'on retrouve les quantités attendues [3]. Là encore il convient de souligner la similitude des propriétés physicochimiques : les oxydes UO2 et ThOî sont isomorphes, les rayons ioniques très voisins (1.08 Â et 1.112 A] ; le thorium s'est substitué à l'uranium et n'existe qu'en valence 4. A la sonde ionique, le thorium apparaît exclusivement dans les grains d'uranium.
Les terres rares ont fait l'objet d'études nombreuses et minutieuses [18][19][20][14]. On peut estimer que globalement ces éléments sont restés à peu près intégralement dans le périmètre des zones de réaction, mais ils ont subi de petites remobilisations à courte distance, qui ont apporté quelques perturbations dans les distributions.
Dans le coeur, les terres rares de fission sont très bien oorrélées à l'uranium ; on observe cependant de petites anomalies lors des transitoires de teneurs ; et il y a un léger déficit pour les terres rares plus lourdes par rapport au néodyme. D’autre part, on a pu montrer que les courbes de fluence neutronique déduites des transferts isotopiques sont légèrement déformées, ce qui prouve l'existence de mélanges isotopiques. Dans les bordures on trouve des terres rares de fission déplacées juqu'à un ou deux mètres. Les remobilisations ont également affecté les terres rares naturelles ; elles sont d'autant plus importantes.que le nombre atomique est plus élevé, ce qui a provoqué des fractionnements parfois bien visibles entre les éléments.
Cette remobilisation des terres rares n'est pas un phénomène lié à l'altération récente du gisement : la migration a eu lieu pendant les réactions nucléaires ; elle est cependant tout à fait indépendante de celle de l'uranium de 1'"auréole”. Les terres rares, sorties des grains d'uranium, soit au moment de sa restructuration en uraninite, soit par effet de recul, ont subi vraisemblablement de petits déplacements erratiques, sans véritable solubilisation. Elles sont rentrées à nouveau dans 1'uraninite, probablement au moment de la recristallisation des minéraux argileux ; actuellement on les trouve exclusivement dans les grains d ’uranium.
Le zirconium a été analysé dans un petit nombre d'échantillons [3 ] [18]. L'isotope 90 issu de la fission est en proportion normale, ce qui prouve que le strontium 90 (demi-vie : 28 ans) n'a pas eu le temps de migrer significativement avant sa décroissance. Les dosages montrent que le zirconium de fission 'a été globalement maintenu ; on observe toutefois de petites discordances avec le néodyme, qui peuvent résulter d'une redistribution (à moins que les écarts soient imputables entièrement au néodyme). L’analyse ionique montre que le zirconium de fission est localisé dans les grains d'uranium (alors que le zirconium naturel, issu des zircons, est lié à la phase argileuse) .
Le ruthénium a également été analysé èt dosé dans un certain nombre d ’échantillons [ 3][18], Dans le coeur on constate en général un déficit plus ou moins marqué en isotope 99 (jusqu'à 30 %), ce qui prouve que le technétium (durée de vie : 2,1 ,105 ans) a migré de manière significative avant sa décroissance. Le ruthénium est resté en majorité dans les zones de réaction j on observe cependant des discordances notables avec le néodyme, et on peut estimer qu'une fraction non négligeable (1D à 15 %) a quitté les zones de réaction. La sonde ionique indique que le ruthénium est resté en grande partie dans les grains d'uraniurç, mais qu’on en trouve aussi dans les argiles. D'autre part des analyses effectuées dans l'environnement des réacteurs [21] montrent qu’on trouve du ruthénium de fission au moins jusqu'à une douzaine de mètres.

232 HAGEMANN et al.
Le rhodium et le palladium n’ont pas été dosés, mais la sonde ionique montre que ces éléments sont restés parfaitement confinés dans les grains d ’uranium, et on a des raisons de penser que leur conservation a été meilleure que celle du ruthénium. L'analyse isotopique du palladium montre qu’on retrouve correctement sous forme d'isotope 104 la marque de la capture neutronique de 103Rh.
Pour 1'yttrium et le niobium, qui n'ont qu'un isotope, les indications sont beaucoup moins nettes, le spectromètre à étincelles donne des ordres de grandeur à peu près convenables et l’analyseur ionique montre que ces éléments sont présents dans l'uranium. Il semble également que le tellure ait été relativement bien conservé.
b) Dans la seconde catégorie, il convient d'abord de placer le plomb radiogénique puisqu'on ne retrouve en moyenne que 30 à 35 % de la production depuis l’âge supposé des réactions [22 ] [23 ]. Il est remarquable que le plomb actuellement présent reste étroitement corrélé à l'uranium. L’analyseur ionique montre qu'une petite partie du plomb résiduel se trouve encore dans l'uraninite, mais que la majorité est ou bien concentrée dans des galènes, ou bien à l'état diffus dans la gangue argileuse.
Les analyses isotopiques montrent qu'il faut faire intervenir à la fois des perturbations anciennes et d'autres relativement récentes, la majeure partie de la migration s'étant néanmoins produite à une époque subactuelle, On peut d'autre part distinguer plusieurs composantes dans cette migration : une composante à l’échelle décimétrique, correspondant vraisemblablement à une sortie très récente, et qui a provoqué un étalement des distributions à courte distance j une composante à échelle métrique, plus diffuse, qui affecte l'environnement des réacteurs, enfin une composante à beaucoup "plus grande échelle qui s’est traduite par l'élimination effective de la plus grande partie du plomb.
Le bismuth [ 3 ] a été produit par décroissance radioactive du neptunium 237 [ce dernier étant formé au cours des réactions par trois processus distincts : capture thermique de 236U, réaction (n, 2n) dans 238U, décroissance de 2l,1Pu). Malgré les incertitudes de calcul, on trouve un assez large déficit par rapport aux quantités prévues -, il n'y a vraisemblablement pas lieu de mettre en cause la stabilité du neptunium ; il s'agit presque certainement d ’une migration du bismuth, dont les propriétés chimiques sont voisines de celles du plomb.
Le molybdène de fission a été très largement éliminé des zones de réaction, mais il en reste néanmoins une quantité appréciable (environ 10 %) j les quantités résiduelles semblent encore corrélées à l'uranium [18]. D’autre part on est certain qu'il reste des quantités significatives d 'argent de fission, mais on n’a pas de données précises ; le spectromètre à étincelles semble montrer une dilution variable par l’argent naturel.
c) Il reste enfin à considérer les produits de fission qui ont été presque totalement éliminés des zones de réaction ; il s’agit des gaz rares (Kr, Xe), de l’iode, du cadmium, des alcalins (Rb, Cs) et des alcalino-ter- reux (Sr, BaJ.
Le krypton et le xénon ont presque totalement disparu : les quantités restantes sont de l'ordre de 10~2 à 1□“4 par rapport à ce qui a été formé. Les analyses Isotopiques montrent qu'il s'agit exclusivement de

IAEA-SM-243/8 233
produits de fission, mais les indications de fluence tirées des transferts isotopiques sont en désaccord avec les autres mesures (on trouve dans le coeur des valeurs nettement plus faibles) 0 . Ch a pensé d'abord que cela pouvait résulter d'une migration qui aurait eu lieu pendant les réactions elles- mêmes. Toutefois, des mesures [24] ont montré qu’on trouve encore des gaz rares au moins jusqu’à deux mètres des réacteurs, avec la composition des produits de fission thermique dans l’uranium 235, sans qu’on puisse l’expliquer par l’uranium présent. Cela tend à montrer que de petites quantités de gaz rares échappées de l'uranium ont été piégées dans l'environnement à l'état de traces. Dans ces conditions, même dans le coeur,, les gaz rares résiduels pourraient n'être pas forcément dans l'uranium qui leur a donné naissance.
Il se trouve par ailleurs que 129Xe est en proportion presque normale dans tous les échantillons étudiés ; cet isotope provient de la décroissance de 129I avec une période de 16 millions d’années. Si donc on suppose que les gaz rares se sont échappés très significativement de l'uranium pendant les réactions elles-mêmes, il faudrait admettre que l’iode est parti exactement dans les mêmes proportions dans tous les cas. Il est sans doute plus plausible de penser qu’en réalité les gaz rares ont diffusé progressivement au cours des âges géologiques, donc pour l'essentiel après la décroissance de l'iode.
Cette interprétation tendrait à monter que 1'iode n'est pas sorti massivement de l'uranium pendant les quelques dizaines de millions d'années qui ont suivi les réactions ; actuellement cependant, on ne retrouve pratiquement plus d'iode 127 dans les réacteurs. On n'a pas d'information sur le brome (dont les rendements de fission sont extrêmement petits), mais il est très probable que cet élément a été au moins aussi mobile que l'iode.
□es analyses de cadmium ont été effectuées dans trois зéchantillons d'Oklo [25]. On a trouvé des traces de cet élément (de l'ordrede 100 ppb) avec des compositions isotopiques perturbées par la fission : l’échantillon le plus irradié contenait 0.013 yg/g de cadmium de fission, soit moins d'un demi pour cent de ce qu'on aurait dû trouver. Le cadmium a été en très grande majorité renouvelé depuis cette époque, sans que toutefois la trace des réactions ait été complètement perdue.
On peut faire des remarques analogues en ce qui concerne le rubidium, le strontium et le baryum. Ces éléments sont présents en quantités non négligeables dans les minerais actuels mais leur composition isotopique est en première approximation celle des éléments naturels. Il faut des analyses extrêmement minutieuses pour reconnaître de très légères altérations isotopiques témoignant de la présence d'infimes proportions de produits de fission. De telles mesures ont été faites aux Etats-Unis sur six échantillons [26]- On note que les légers accroissements de 135Ba et 137Ba sont corrélés avec la dimunution de 85Rb/87Rb ; or 13sBa résulte de la décroissance de 135Cs avec une période de 2.6 millions d'années. Cette corrélation suggèrequ'il y a peut-être eu une certaine rétention du césium 135 pendant quelquesmillions d'années. Quant au césium 133 de fission on ne peut évidemment pas le distinguer de l'élément naturel puisque c'est le seul isotope stable, mais outre l’analogie avec le rubidium, la très faible quantité présente dans le minerai actuel prouve qu'il a été très largement éliminé.
d) On n'a pas d'informations sur quelques éléments : le sélénium,1'étain, l'indium et l'antimoine, dont les rendements de fission sont tous très petits.

234 HAGEMANN et al.
On doit par ailleurs rappeler que la plupart des éléments de la 'gangue non produits par la fission, qui auraient dû présenter des anomalies isotopiques du fait des captures neutroniques s'ils avaient été présents au moment des réactions, ont été trouvés normaux. La seule exception concerne les terres rares lourdes (à partir du dysprosium), dont le comportement est analogues aux terres rares issues de la fission, avec néanmoins une mobilité encore un peu plus grande. L'hydrogène de l'eau de structure des argiles (pour la fraction extraite au-dessus de 800 °C) a sa composition naturelle. Le bore et le lithium, qui possèdent pourtant des isotopes à très forte section de capture, ont été trouvés parfaitement normaux. On n’a pas pu mettreen évidence, en ce qui concerne le potassium et le fer, les transferts 40K Ц1К, et 56Fe -*• 57Fe. Dans le dernier cas, l'imprécision de la mesure limite la portée de la conclusion : on peut néanmoins affirmer que la pertur bation isotopique, si elle existe, ne dépasse pas 10 % de ce qu'on aurait dûtrouver si la totalité du fer présent avait été irradiée.
COMMENTAIRES - CAPACITE 0E RETENTION DE L’URANIUM ET DE LA GANGUE
Une première remarque est l'étroite corrélation qui existe entre l'intégrité de la conservation et le confinement dans l'uranium. Tous les éléments que l’on retrouve exclusivement dans les grains d ’uranium ont été presque intégralement préservés, et on peut dire réciproquement que tous les éléments qui ont bénéficié d'une bonne rétention ont été ’’vus” à la sonde ionique dans les grains d'uraninite. Inversement, tous les éléments produits avec un rendement de fission élevé et qu'on ne retrouve pas dans l'uranium [comme par exemple le baryum) ont été massivement éliminés des zones de réac tion. Tout se passe donc comme si c’était l’uraninite qui avait assuré l’essentiel de la préservation.
Cette conclusion est renforcée si on examine la liste des éléments qui ont une bonne rétention. Pour le' plutonium et le thorium, on a souligné 1’isomorphisme et la parfaite compatibilité des réseaux UOi - PuÛ2 _ ThOi. Pour les produits de fission on constate que ceux qui sont restés sont ceux qui à la fois sont les moins volatils et ont le rayon ionique le plus compatible avec celui de l’uranium, autrement dit ceux qui avaient le moins de raison de d i f f u s e r ou d’être expulsés du réseau de l’uraninite.
Particulièrement frappante est la comparaison avec l’expérience acquise sur le comportement des produits de fission dans les combustibles des réacteurs nucléaires industriels et plus spécialement les réacteurs à eau [27]. On peut distinguer, de ce point de vue, trois groupes d’éléments : tout d ’abord ceux qui sont gazeux (Kr, Xe) ou volatils (I, Te, Cs), qui ont tendance à diffuser les premiers dans la porosité ouverte, les seconds en direction de la gaine plus froide - puis ceux qui se rassemblent en inclusion métalliques relativement stables (Ru - Rh - Pd - Te - Mo) - enfin ceux qui forment des oxydes^ Ces derniers se répartissent en deux catégories, ceux dont les rayons ioniques sont trop éloignés de ceux de l’oxyde d ’uranium pour être acceptés par le réseau (Ba, Sr) (ils migrent en direction de la gaine) et ceux qui forment des solutions solides dans la matrice (Y, Nb, Zr, terres rares). On constate que cette classification rend compte pour l’essen tiel de la rétention des éléments observés à Oklo (même s’il y a lieu d ’observer quelques nuances : par exemple, parmi les éléments classés comme vola tils, le tellure semble avoir ici été relativement bien conservé ; en sens inverse le molybdène, considéré dans les réacteurs comme formant des inclusions stables, a assez largement migré).

IAEA-SM-243/8 235
Il est remarquable qu'on ait eu quelques doutes sur l'intégrité de conservation du ruthénium à la suite des observations à la sonde ionique qui le montraient "en train de sortir" des grains d ’uranium, avant même que les dosages aient mis en évidence une certaine dispersion de cet élément.Il faut souligner aussi que les terres rares se sont "relogées" dans l'uranium après leur migration, et que c ’est probablement ce qui les a stabilisées au cours des âges géologiques. De même, parmi les alcalins, les éléments initialement présents tlithium, potassium) semblent avoir été encore plus dispersés que ceux qui sont sortis de l'uranium (rubidium, césium). La gangue ne semble donc avoir eu que de très médiocres qualités de rétention.
Est-ce à dire que la gangue n ’a rien conservé de l'époque des réactions ? Ce serait sans doute excessif. La plupart du temps, on ne sait pas sous quelle forme minéralogique sont les résidus, et s’ils sont sortis ou non de l’uranium. Même dans le cas d ’éléments bien conservés, il y a des incertitudes : par exemple la sonde ionique, si elle montre une grande quantité de zirconium de fission dans l’uranium, ne permet pas d ’affirmer qu’il n ’y en a pas un tout petit peu dans la gangue (car on ne peut y mesurer avec suffisamment de précision les rapports isotopiques). Les éléments qui sont sortis de l’uranium, que ce soit par diffusion ou par effet de recul ont pu dans certains cas réintégrer l’uranium ou Être dispersés, mais ils ont pu aussi être piégés dans la gangue. Par exemple une partie du plomb sorti de l’uranium a été fixée s d u s forme de sulfure, et la composition isotopique des galènes montre que cette sortie est parfois assez ancienne,
Gn a dit aussi qu’on retrouve du ruthénium au moins jusqu’à une douzaine de mètres des réacteurs j il semble d ’autre part que le technétium migrant n’ait pas été rapidement dispersé puisque dans certains échantillons on trouve des excédents de 59Ru (alors qu’il y a toujours déficit dans le coeur) [21], A vrai dire, on n'a pas beaucoup d ’informations sur le degré de dispersion des éléments qui ont migré ; il est probable néanmoins que s’il est normal que des métaux "nobles", peu oxydables, comme le ruthénium n ’aient pas été très loin, ceux qui sont passés en solution sous forme oxydée ont été beaucoup plus complètement dispersés.
A l'époque des réactions, la gangue, qui était d'autre part portée à température relativement élevée et parcourue par des courants de convection, a été sans doute déstructurée par les dégâts d'irradiation. Les éléments n'étant plus fortement intégrés dans des structures cristallines, les échanges ioniques avec les solutions circulantes ont été facilitées ¡ c’est ce qui explique sans doute que les différences de composition isotopique aient été diluées, et que même le fer ne porte pas trace de l’irradiation.On comprend que dans ces conditions, la.gangue n ’ait pas été un excellent milieu de confinement. Cela n'explique pas tout, puisqu’il semble que certains éléments, comme l'iode, qui actuellement ont été éliminés ne soient sortis de l'uranium que longtemps après la fin des réactions. Mais on a rappelé que d'autres événements sont survenus par la suite, et il n'y a pas lieu de s'étonner que beaucoup d'éléments aient finalement été dispersés, . la durée ayant été extraordinairement longue.
L'étonnant à Oklo reste finalement le comportement de l'uraninite, c’est-à-dire non seulement sa remarquable conservation, alors que l'uranium est un élément facilement mobilisable par oxydation en valence B, mais aussi son extraordinaire capacité de rétention vis-à-vis de certains éléments.G. COWAN [ 7 ] a très justement souligné que si on mettait sous la formeg-iff D/a )t le rapport entre la concentration finale et la concentration initiale d'un élément, le "coefficient de diffusion équivalent” D/a2 serait in-
236 HAGEMANN et al.
férieur à 5.1CT11! par an pour quelques éléments, en tout cas Inférieur à 1G-l0/an pour d'autres, c'est-è-dire considérablement plus petit que ceux des meilleures matrices proposées pour le stockage des déchets, comme par exemple les verres.
Sur le premier point, on peut noter un certain nombre de circonstances favorables : la restructuration de l'uranium en gros grains, la formation d'une gangue imperméable, l’enfouissement prolongé du gisement, l'absence de mouvements tectoniques importants, enfin et surtout le maintien dans une ambiance réductrice : on trouve encore dans le minerai actuel beaucoup de sulfures et même de soufre natif, et il est possible qu'au moins à l’époque des réactions les matières organiques aient joué le rôle de tampon vis-à- vis de l'oxydation.
Mais un autre facteur est peut-être intervenu, comme l'a souligné G. DEARNLEY [28]. Cet auteur a montré que la présence en faibles quantités de certains éléments comme le titane, le manganèse et le calcium, que l'on trouve effectivement dans l’uranium d'Oklo, est susceptible de bloquer à la fois la diffusion de l'oxygène et celle des produits de fission. En effet la diffusion s'effectue préférentiellement le long de défauts ou dislocations ; or certaines impuretés, telles que celles qui viennent d ’être mentionnées, ont tendance à précipiter dans les défauts en formant avec le matériau h6te des oxydes mixtes, comme les pérowskites, et ces structures tendent à inhiber la diffusion. Il serait certainement intéressant en tout cas de chercher à mieux comprendre le comportement de l’uraninite d'Oklo.
CONCLUSION
L'expérience d'Oklo montre que la dispersion de nuclides radioactif n’est pas un phénomène inéluctable puisque, deux milliards d ’années après le fonctionnement de ces réacteurs naturels, un certain nombre d'isotopes produits par la fission sont restés confinés dans les zones de réaction. Mais le confinement n'a été réalisé que pour un petit nombre d ’éléments, et il a été obtenu dans des conditions qu'il faut bien préciser.
La rétention a été exercée en presque totalité par l’oxyde d ’uranium lui-même ; par contre la gangue et l'environnement argileux des réacteurs semblent n’avoir joué qu’un râle assez modeste, et d'ailleurs médiocre. Il n'y a donc pas lieu de faire état des qualités particulières aux milieux argileux, telles que les phénomènes d'échanges d ’ions. De même, il faut savoir que si le plutonium a été intégralement conservé avant sa décroissance, c’est dans la mesure, et dans la mesure seulement, où il n'a jamais quitté le réseau de l'uranium dans lequel il a pris naissance.
Il est certainement délicat de transposer les conditions auxquelles a été soumis l'environnement des réacteurs à celles d'un problème réel de stockage. Cependant les études sur le phénomène d'Oklo apportent de nombreux résultats intéressants dans le domaine de la géochimie. Un enseignement impor tant est que l’uraninite est une matrice extrêmement bien adaptée, sous certaines conditions, au confinement d’un certain nombre d ’éléments, en particulier du plutonium et vraisemblablement des autres transuraniens.
REFERENCES
IAEA-SM-243/8 237
Les cotes IAEA-SM-204/. . . et 1АЕА-ТС-119/. . . sont celles des mémoires présentés aux réunions de Libreville (1975) et de Paris (1977) respectivement (références [1] et [2]).
[1] AGENCE INTERNATIONALE DE L’ENERGIE ATOMIQUE, Le phénomène d’Oklo (C.R. Coll. Libreville, 1975), AIEA, Vienne (1975) 650 p.
[2] AGENCE INTERNATIONALE DE L’ENERGIE ATOMIQUE, Les réacteurs de fission naturels (C.R. Réunion Paris, 1977), AIEA, Vienne (1978) 756 p.
[3] FREJACQUES, C., et al., IAEA-SM-204/24, p. 509.[4] FREJACQUES, C., Trans. 1st Conf. Europ. Nucl. Soc., Paris, April 1975, p. 695.[5] FREJACQUES, C., HAGEMANN, R., Proc. Int. Symp. on the Management of Wastes
from LWR Fuel Cycle, Denver, July 1976, p. 678.[6] WALTON, R.D., COWAN, G.A., IAEA-SM-204/1, p. 499.[7] COWAN, G.A., IAEA-TC-119/26, p. 693.[8] LEACHMAN, R.B., BISHOP, W.P., IAEA-TC-119/30, p. 700.[9] GAUTHIER-LAFAYE, F„ IAEA-TC-119/3, p. 75.
[10] GAUTHIER-LAFAYE, F., WEBER, F., IAEA-TC-119/8, p. 199.[11] WEBER, F„ IAEA-TC-119/24, p. 623.[12] NAUDET, R., IAEA-TC-119/27, p. 715.[13] NAUDET, R., IAEA-TC-119/1, p. 3.[14] NAUDET, R., IAEA-TC-119/25, p. 643.[15] NAUDET1 R., IAEA-TC-119/21, p. 569.[16] HAVETTE, A., et al., IAEA-SM-204/13, p. 463 et IAEA-TC-119/13, p. 397.[17] DUFFY, C.J., IAEA-TC-119/36, p. 229.[18] MAECK, W.J., et al., IAEA-SM-204/2, p. 319.[ 19] RUFFENACH, J.C., IAEA-TC-119/16, p. 441.[20] CESARIO, J., et al., IAEA-TC-119/17, p. 473.[21] MAECK, W.J., Table ronde, IAEA-TC-119, p. 675.[22] DEVILLERS, C., MENES, J., IAEA-TC-119/18, p. 495.[23] GANCARZ, A.J., IAEA-TC-119/40, p.513.[24] SHUKOLYUKOV, Y., et al., At. Ehnerg. 41 (1976) 53.[25] De LAETER, J.R., et al., IAEA-SM-204/7, p. 425.[26] BROOKINS, D.G., et al., IAEA-SM-204/3, p. 401.[27] RUFFENACH, J.C., Communication personnelle.[28] DEARNLEY, G., Table ronde, IAEA-TC-119, p. 708.
DISCUSSION
F. GERA: The conclusion that the clay has not been an effective containment
medium for many elements is very interesting. Furthermore, the stratigraphie
situation of the stratum containing the reaction zones is not what we would
consider to be suitable for location of a waste repository, primarily because of its
limited thickness and proximity to water-bearing sandstones. Could you please
comment on this point?

238 HAGEMANN et al.
R. HAGEMANN : This is true. As I have pointed out, there are several valid
reasons which can be cited in order to explain the “transparency” of the reaction
zone clay. Besides, to the reasons mentioned we should add perhaps another — the
nature of the reaction zone clay.
P.J. SLIZEWICZ: Has any calculation been made of the integrated dose (in
rads) to the minerals surrounding the reactors?
R. HAGEMANN: Not as far as I know. However, we can calculate it
approximately by considering all fission products and transuranics formed in a
given volume. The calculation can be made by taking into account the fact that
all fission products did not necessarily decay on the spot.

IAEA-SM-243/129
238U/234U DISEQUILIBRIA AS A MEASURE
OF URANIUM MIGRATION IN CLAY OVER
THE PAST 250 000 YEARS
P.J. SHIRVINGTON
Australian Atomic Energy Commission,
Coogee, New South Wales,
Australia
Abstract
238U/234U DISEQUILIBRIA AS A MEASURE OF URANIUM MIGRATION IN CLAY OVER THE PAST 250 000 YEARS.
The mobility of hexavalent uranium in groundwater-clay environments has been studied to provide possible upper limits for the migration of the less soluble man-made transuranics.Data have been obtained from measurements in oxidized clays associated with an Australian uranium orebody and a nearby prospect. Use is made of the measured disequilibria in the uranium decay series between 238U and 234U for contained uranium (a) accessible to dissolution by dilute reagents and (b) inaccessible to such media. It is proposed that the isotope fractionation found in the clay is due to entrapment of W U within the clay crystallite lattices following а-decay of adsorbed 238U and the associated recoil. Expressions are derived for the period for which clay crystallite surfaces have been host to uranium and for the migration velocity of soluble (accessible) uranium through the clay. Host periods ranging from 2 X 10⁴ a to at least SX 10s a are indicated, and illustrative calculations, based on limited data, yield uranium migration velocities ranging from 19 m/ 10s a at depths of 25—50 m to 80 m/10s a in surface zones.
INTRODUCTION
Clay is being examined as a candidate packing material for proposed radioactive waste repositories in hard rock and as a primary geological containment. This interest stems from the ability of clay to retard the migration of colloidal, ionic and liquid material should the repositories be breached by groundwater. Estimates of the likely rates of radionuclide migration in clay, particularly over the very long containment periods required for the isolation of transuranic wastes from the biosphere, may need to rely upon observations of naturally occurring phenomena.
There are some 25 natural radionuclides in the decay chains of 238U and 235U. Although these do not contain exactlythe same elements as those of interest in reactor waste, they do
239
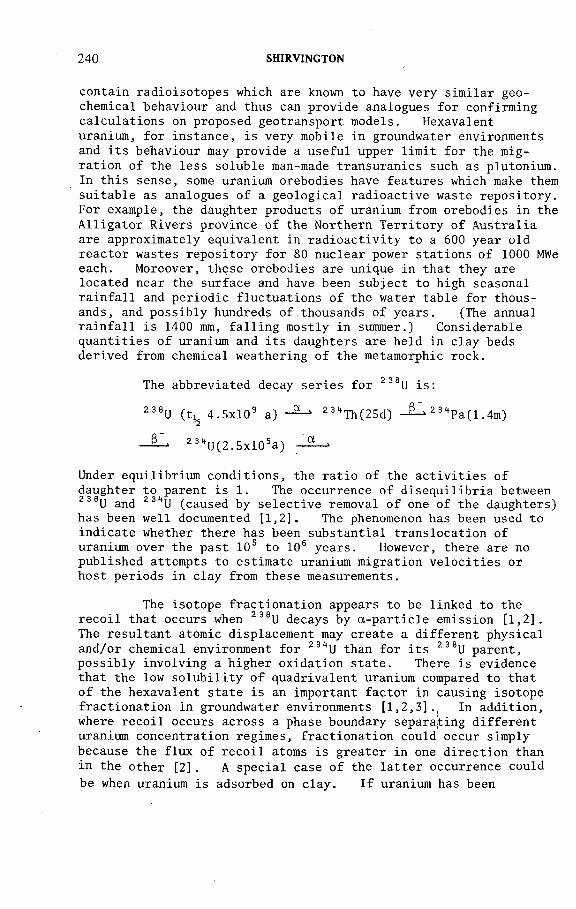
240 SHIRVINGTON
contain radioisotopes which are known to have very similar geochemical behaviour and thus can provide analogues for confirming calculations on proposed geotransport models. Hexavalent uranium, for instance, is very mobile in groundwater environments and its behaviour may provide a useful upper limit for the migration of the less soluble man-made transuranics such as plutonium. In this sense, some uranium orebodies have features which make them suitable as analogues of a geological radioactive waste repository. For example, the daughter products of uranium from orebodies in the Alligator Rivers province of the Northern Territory of Australia are approximately equivalent in radioactivity to a 600 year old reactor wastes repository for 80 nuclear power stations of 1000 MWe each. Moreover, these orebodies are unique in that they are located near the surface and have been subject to high seasonal rainfall and periodic fluctuations of the water table for thousands, and possibly hundreds of thousands of years. (The annual rainfall is 1400 mm, falling mostly in summer.) Considerable quantities of uranium and its daughters are held in clay beds derived from chemical weathering of the metamorphic rock.
The abbreviated decay series for 238U is:
2 3 8U (t, 4.5xl09 a) 2 31,Th(25d) 2 34Ра(1,4m)"2
— ^ 231*U(2.5xl05a) ‘
Under equilibrium conditions, the ratio of the activities of daughter to parent is 1. The occurrence of disequilibria between 238U and 234J (caused by selective removal of one of the daughters) has been well documented [1,2]. The phenomenon has been used to indicate whether there has been substantial translocation of uranium over the past 105 to 106 years. However, there are no published attempts to estimate uranium migration velocities or host periods in clay from these measurements.
The isotope fractionation appears to be linked to the recoil that occurs when 238U decays by a-particle emission [1,2]. The resultant atomic displacement may create a different physical and/or chemical environment for 231tU than for its 2 3 8U parent, possibly involving a higher oxidation state. There is evidence that the low solubility of quadrivalent uranium compared to that of the hexavalent state is an important factor in causing isotope fractionation in groundwater environments [1,2,3]., In addition, where recoil occurs across a phase boundary separating different uranium concentration regimes, fractionation could occur simply because the flux of recoil atoms is greater in one direction than in the other [2]. A special case of the latter occurrence could be when uranium is adsorbed on clay. If uranium has been
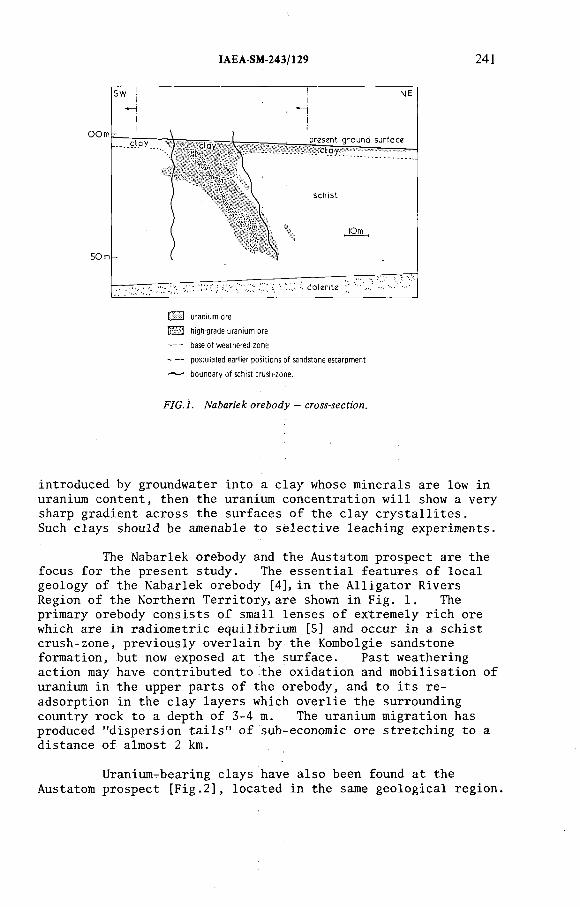
IAEA-SM-243/129 241
\Ш uranium ore
[• ;:v j high-grade uranium ore
-------base o f weathered zone
------- postulated earlier positions of sandstone escarpment
^ — boundary o f schist crush-zone.
FIG.l. Nabarlek orebody - cross-section.
introduced by groundwater into a clay whose minerals are low in uranium content, then the uranium concentration will show a very sharp gradient across the surfaces of the clay crystallites.Such clays should be amenable to selective leaching experiments.
The Nabarlek orebody and the Austatom prospect are the focus for the present study. The essential features of local geology of the Nabarlek orebody [4], in the Alligator Rivers Region of the Northern Territory, are shown in Fig. 1. The primary orebody consists of small lenses of extremely rich ore which are in radiometric equilibrium [5] and occur in a schist crush-zone, previously overlain by the Kombolgie sandstone formation, but now exposed at the surface. Past weathering action may have contributed to the oxidation and mobilisation of uranium in the upper parts of the orebody5 and to its readsorption in the clay layers which overlie the surrounding country rock to a depth of 3-4 m. The uranium migration has produced "dispersion tails" of sub-economic ore stretching to a distance of almost 2 km.
Uranium-bearing clays have also been found at the Austatom prospect [Fig.2], located in the same geological region.

242 SHIR VIN GTON
E F
A R , A R .[165] [3 0 0 ]
A R , A R .
7 0 m
A R î obtained on to ta l uranium, i.e. clay com pletely dissolved in conc. H F/H N O 3 ; A R 2 on accessible U, i.e. eluted w ith 0.01 M K2 CO3 or 2 M HNO3 .Uranium concentrations, дд -д '1, given in parenthesis. 1 a error in AR » 0.02.
U mineralization
шт low level U mineralization
FIG.2. Austatom prospect - cross-section. 7MU/228Uactivity ratios in clay.
This prospect differs from Nabarlek in that the uranium is isolated from surface water but not from groundwater, and occurs as secondary mineralisation in fully weathered schist, unconfor- mably overlain by sandstone. The schists are underlain by dolomite.
EXPERIMENTAL
Samples of clay were taken at different depths near the high-grade mineralisations and some distance from them. Parts of each sample were completely dissolved in concentrated nitric/ hydrofluoric acid; the uranium was then separated chemically, and the Z31*U/2 3 8U activity ratio (AR) measured by a-spectrometry The remainder of each sample was leached (using agitation) with0.01 M K 2C 0 3; later the leachant was changed to 2 M HN03, which had no effect on the isotopic results, but improved experimental conditions. The leachate (i.e. the soluble or accessible uranium) was analysed for uranium and the AR determined.
RESULTS AND DISCUSSION
Some of the results are presented in Figs 2-4. Activity ratios for completely dissolved clay (total uranium, ARj) differed significantly from those for uranium eluted with dilute reagents (AR2) . Total uranium tended to have a slight excess of зци (ARi>l), although there were some exceptions. On the

IAEA-SM-243/129 243
~l г[ 7 0 0 ] M O O ] [161
• [2 4 0 0 ]
1-2-
w1-1
1-0-
W0 - 9 -
■ т- t -
í ....4J __________L
т----- 1----- 1----- r[16] 2 0 2
He 3 8.
• Ю О
- О
iJ _______________I_______________I_______________! _
1 0 0 2 0 0 3 0 0 4 0 0 5 0 0 6 0 0 7 0 0 8 0 0
Distance from primary ore (m )
o A R i obtained on to ta l uranium, i.e. clay com pletely dissolved in conc. H F/H N O 3
■ A R 2 on accessible U, i.e. eluted w ith 0.01 M K2 CO3 o r 2 M HNO3
о equivalent period fo r which clay crysta llite surfaces have been host to accessible uranium, calculated from equation (2 ).
Samples taken at 0.5 m depth in clay. Uranium concentrations, ¿tg-g-1, given in parenthesis. Uranium concentrations, p g g -1 , given in parenthesis.
FIG.3. Nabarlek 234/7/238{/ activity ratios and equivalent host periods as a function of distance from primary ore.
other hand, accessible uranium almost invariably showed a deficiency in 231*U (AR2< 1), i.e. up to 12% at Nabarlek and 42% at Austatom. If the accessible uranium on the clay is deficient in 2314J and the total uranium is not, then there must be a corresponding inaccessible phase, possibly locked into the clay crystallite lattices, with an excess of 231*U. This phase must be resistant to leaching by oxidising groundwaters over long periods of time, otherwise such sharp differences in isotopic ratio could not be maintained against the effects of chemical exchange.
More exhaustive laboratory leaching experiments support the above conclusion [Fig.4]. Fractions eluted from a typical clay sample with distilled water, K 2C 0 3 or H N 0 3consistently gave an eluate AR close to 0.95, even as exhaustion was approached (3% removal for distilled water, 43% for 0.1 M K 2C 0 3 and 65% for2 M HNO3) . Since the total uranium had an AR of 1.07, some of

244 SHIRVINGTON
О/о U re m o v e d ( c u m u la t iv e )
▼ leached w ith d istilled water fo r 1 0 days, activ ity ratio in leachate• leached w ith 0.1 M K2 CO3 fo r 0.1, 5 and 14 d, a ctiv ity ratio in leachate* leached w ith 2 M HNO 3 fo r 0.1, 5 and 11 d, a ctiv ity ratio in leachatea no previous leaching, activ ity ratio of to ta l uranium, i.e. tha t com pletely dissolved in H F /H N O 3
о leached w ith 0.1 M K2 CO3 fo r 14 d, a ctiv ity ratio of residue com pletely dissolved in H F/H N O 3
' д leached w /th 2 M H N O 3 fo r 11 d, activ ity ratio o f residue com pletely dissolved in H F/H N O 3
FIG.4. ^ U / ^ U activity ratios as a function o f per cent uranium removed from clay (clay
samples taken from 30 m mark (Fig. 3) at a depth of 1.5 m).
the 231tU must have been entrapped in the clay, beyond the reach of these reagents. This hypothesis was confirmed by the measured AR of uranium in the residues [Fig.4].
The results tend to support the hypothesis that isotope fractionation has occurred in the clay, due to the "stripping" of some of the newly formed 231,U precursor from the surface of the clay crystallites into the crystallite lattices, by a-recoil (Fig.5) . The short-lived intermediates 23l*Th and зцРа could have a chemical role in this, unrelated to a-recoil, but it is unlikely. It is difficult to conceive how the transients could have produced chemical changes capable of retarding 23ци dissolution in clay without having done likewise in unweathered rock; yet in the latter case a deficit of 231*U is frequently observed in the leached rock [1-3].
The occurrence of isotope fractionation in clay provides an opportunity to measure the transit time during which accessible uranium has moved, via clay surfaces, from its source and the period for which particular sections of clay have been host to accessible uranium (the two measures are conceptually different). Provided chemical exchange has not occurred between
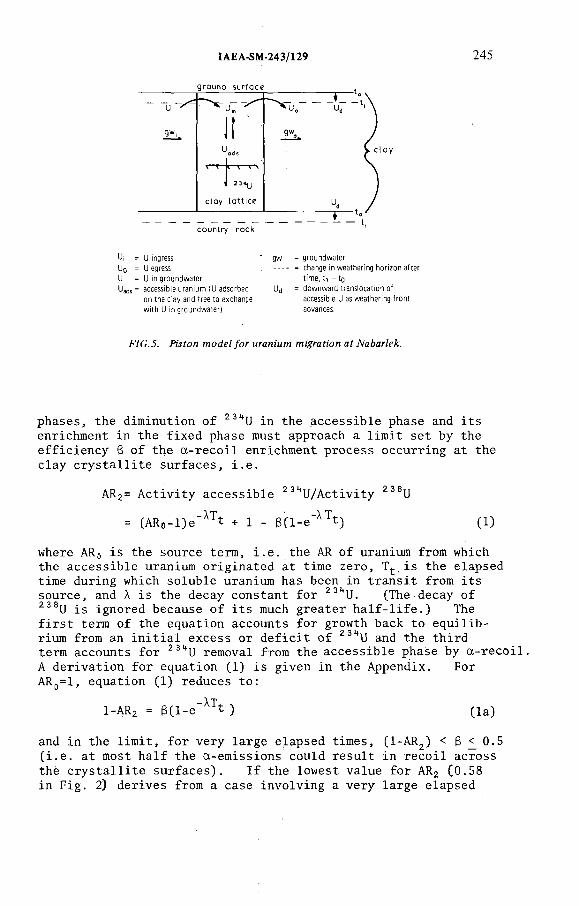
lAEA-SM-243/129 245
U¡ = U ingress Uo = U egress U = U in groundwater Ugds = accessible uranium (U adsorbed
on the clay and free to exchange w ith U in groundwater)
gw = groundwater-------= change in weathering horizon after
tim e, t i - to Ud = downward translocation of
accessible U as weathering fro n t advances.
FIG.5. Piston model for uranium migration at Nabarlek.
phases, the diminution of 231tU in the accessible phase and its enrichment in the fixed phase must approach a limit set by the efficiency В of the a-recoil enrichment process occurring at the clay crystallite surfaces, i.e.
A R 2 = Activity accessible 2 3l,U/Activity 2 3 8U
= (AR0-l)e"XTt + 1 - 3(l-e~X T t) (1)
where A R 0 is the source term, i.e. the AR of uranium from which the accessible uranium originated at time zero, T . is the elapsed time during which soluble uranium has been in transit from its source, and A is the decay constant for 231,U. (The decay of238U is ignored because of its much greater half-life.) Thefirst term of the equation accounts for growth back to equilibrium from an initial excess or deficit of 23Ци and the third term accounts for 231tU removal from the accessible phase by a-recoil. A derivation for equation (1) is given in the Appendix. For A R Q=1, equation (1) reduces to:
At1-AR2 = BCl-e" 1 ) (la)
and in the limit, for very large elapsed times, (1-AR2) < В £ 0.5 (i.e. at most half the а -emissions could result in recoil across thè crystallite surfaces). If the lowest value for AR2 (0.58 in Fig. 2) derives from a case involving a very large elapsed

246 SHIRVINGTON
time, then 0.42 < 3 £ 0.5. The limiting value would be reached for elapsed times of the order of 1 x 10 a or more, which isseveral times the half-life of 23>tU.
The period for which clay crystallite surfaces have been host to uranium may be found if both A R X and AR2 are known. Assuming that uranium concentration in the clay has been constant from time zero,
A R 1 - A R 2 = В (l-e"XTh) (2)
where T^ is the equivalent host period. A derivation for equation (2) is given in the Appendix.
The application of equations (1) and (2) to the preliminary Nabarlek and Austatom data has met with mixed success. Application of equation (1) requires that both A R 0 and the pointof entry of source material into the clay be known precisely.The preliminary Nabarlek and Austatom data do not provide this information. At Nabarlek a large reservoir of source material (AR2 , 0.95) is located in the clay above the orebody and up to 30 m from it [Figs 1 and 3]. The proposed model predicts that A R 2 should gradually fall to a limiting value of 0.5-0.6 as uranium migrates out from the source into the dispersion tail. Values of AR2 fall between 30 m and 80 m but then rise beyond this, eventually reaching 0.97 at 1.2 km,near the leading edge of the dispersion tail. The short-circuiting effects of preferred flow paths may possibly be involved. In addition there are at least three other phenomena that could complicate the pattern of results:(a) the existence of undiscovered primary ore near the surface; (b) the emergence of 2 31*U-enriched groundwater originating from the unweathered parts of the main orebody; (c) the reduction of uranium by organic matter over- lying the clay, and subsequent release of 23 U-enriched groundwater. The situation will not be clear until a large number of sample points have been analysed on a grid basis. By way of illustration,a transit time for accessible uranium of 0.6 x 10®, a was obtained for migration between 30 m and 80 m (calculated from equation (1), using an arbitrary 3 value of 0.5). This gives an inferred migration velocity of 80 m/105 a.
A model of uranium migration in the Austatom prospect is being developed. There is a strong likelihood that uranium is migrating in the clay directly underlying the water-saturated sandstone in the direction E to F [Fig.2]. If this has been so over the past 5 x 10⁵ y then a migration velocity of 19 m/105 a is indicated. However, the analysis is complicated by the likelihood that the weathering front, which initially mobilised the uranium, passed through F ~ 5 x 10® a ago and through
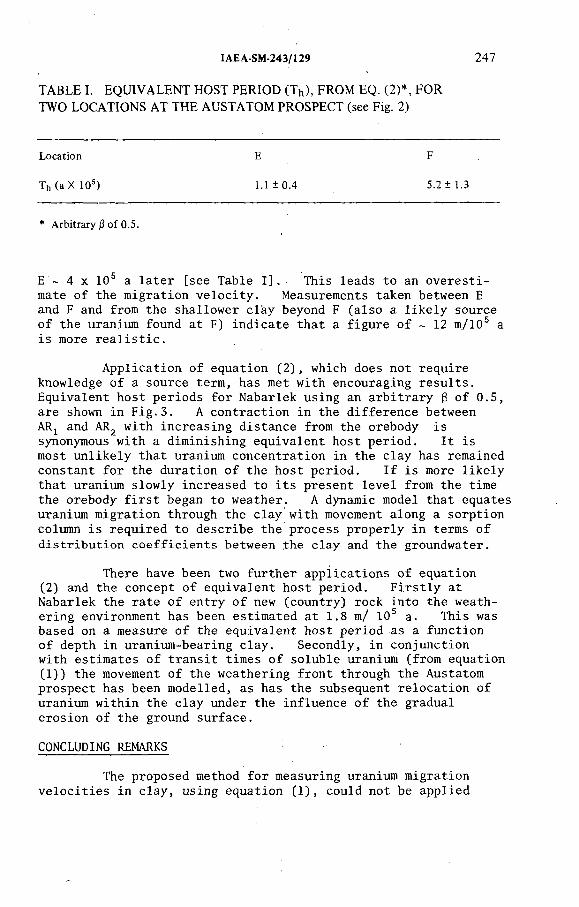
IAEA-SM-243/129 247
TABLE I. EQUIVALENT HOST PERIOD (Th), FROM EQ. (2)*, FOR
TWO LOCATIONS AT THE AUSTATOM PROSPECT (see Fig. 2)
Location E F
Th (a X 10s) 1.1 ±0.4 5.2 11.3
* Arbitrary 0 of 0.5.
E ~ 4 x 10s a later [see Table I]. This leads to an overestimate of the migration velocity. Measurements taken between E and F and from the shallower clay beyond F (also a likely source of the uranium found at F) indicate that a figure of ~ 12 m/105 a is more realistic.
Application of equation (2), which does not require knowledge of a source term, has met with encouraging results. Equivalent host periods for Nabarlek using an arbitrary g of 0.5, are shown in Fig.3. A contraction in the difference between A R X and AR 2 with increasing distance from the orebody is synonymous with a diminishing equivalent host period. It is most unlikely that uranium concentration in the clay has remained constant for the duration of the host period. If is more likely that uranium slowly increased to its present level from the time the orebody first began to weather. A dynamic model that equates uranium migration through the clay with movement along a sorption column is required to describe the process properly in terms of distribution coefficients between the clay and the groundwater.
There have been two further applications of equation(2) and the concept of equivalent host period. Firstly at Nabarlek the rate of entry of new (country) rock into the weathering environment has been estimated at 1.8 m/ 105 a. This was based on a measure of the equivalent host period as a function of depth in uranium-bearing clay. Secondly, in conjunction with estimates of transit times of soluble uranium (from equation(1)) the movement of the weathering front through the Austatom prospect has been modelled, as has the subsequent relocation of uranium within the clay under the influence of the gradual erosion of the ground surface.
CONCLUDING REMARKS
The proposed method for measuring uranium migration velocities in clay, using equation (1), could not be applied

248 SHIRVINGTON
successfully more than 80 m from the Nabarlek orebody. The distorting effects of surface phenomena, coupled with decreasing uranium concentrations in the clay, are the most likely causes.On the other hand, the inverse relationship between the equivalent host period, found from equation (2), and distance from the orebody [Fig.3] indicates that the surrounding clay layers have been efficiently absorbing the uranium released by the passage of ground and surface water over the top of the orebody.
The possibilities for an in-depth study of radionuclide migration are promising at the Austatom prospect. The absence of surface phenomena has allowed the activity ratios in the clay to span almost the full range predicted by equation (1). The indicated uranium migration velocity of 10-20 m / 105 a would not be intolerable to the designers of reactor wastes repositories if adopted as an upper limit for the migration of transuranics. Further, since uranium migration at the Austatom prospect has apparently involved internal rearrangements within the clay bed, rather than any net losses to the system, there are good prospects for measuring comparative migration rates of all the 25 radionuclides associated with uranium orebodies. This could provide additional analogies for elements in the reactor waste spectrum and so further assist in the validation and/or construction of geotransport models.
Appendix
DERIVATION OF EQUATIONS (1) AND (2)
Case 1 : Accessible (mobile) Uranium (dynamic model)
At time zero, 2 3 8U of activity A 8 0 and 2зци of activity A4o are present at any point A, adsorbed on clay crystallite surfaces and accessible to dissolution by or chemical exchange with groundwater.
After transit-time (Tt) , all adsorbed uranium has moved to another point B. During transition, 238U and accompanying 23l4U have been adsorbed on crystallite surfaces in the clay at points between A and В and some 231tU has become entrapped inside the crystallite lattices due to 238U decay and recoil. In this
IAEA-SM-243/129 249
way it has become separated from the mobile (accessible) uranium. Considering only the adsorbed (accessible) uranium at point B:
for 238U : activity remains constant and no 238U is inaccessibleto groundwater within the clay;
for 23-U : in the ábsence of any isotope separation, activitywould be given by
- AtA4T = (A40 - A 8 0) e 1 + A 8 0
i.e. the decay of any initial excess or make up of any initial deficit in 234J plus that initially in equilibrium with 238U (X is the decay constant for 231,U);
for 231tU : taking account of isotope separation, activity isgiven by
A4T (accessible) = (A40 - A 8 0) e XTt + A 8 0 - 3 A 8 0 (1 - e XTt)
i.e. that given by the previous expression, less that whichbecomes inaccessible as a result of 238U decay and recoil. The efficiency 0 of the latter process has values between 0 and 1.
Hence, if the 231*U/2 3 8U activity ratio at time zero is given by ARo and the 231tU/2 3 8U activity ratio of accessible uranium at time Tt is given by AR2 , then
ARo = A4o / A8o
and
AR2 = A4T (accessible) / A 8 0
= (AR0 - l)e"XTt + 1 - В (1 - e'XTt) (1)4
(The decay of 238U is ignored because of its much greater half- life . )
Case 2 : Inaccessible 234U (static model)
At time zero, uranium is first introduced into clay at a point C. 2 3 8U has total activity A 8 0 and 231*U total activity A 4 0. All uranium is adsorbed on clay crystallite surfaces and is accessible to dissolution by groundwater.
250 SHIRVINGTON
After time (equivalent host period of clay for uranium), at point С :
for 238U : total activ ity remains constant and no 238U isinaccessible to groundwater in the clay;
for 231tU : some is entrapped inside crystallite latticesowing to 2 3 8U decay and recoil. This 231tU is inaccessible to groundwater (and dilute reagents). Its activ ity is given by:
A4,p (inaccessible) = 3 A8o (1 - e
В has values between 0 and 1.
But :
A4,j, (inaccessible) = A4^(total) . - А4 (accessible)
Dividing throughout by A80:
A4,j, (inaccessible)/A80 = A4^,(total)/A8o - A4 (accessible)/A8o
ARi - AR2
i .e . ARi - AR2 = B(1 - e"XTh) (2)
(The decay of 238U is ignored because of its much greater half- l i fe .)
Note that a step function is assumed for uranium deposition into the clay at time zero and, thereafter, total 23 U concentration at point С is assumed constant. These are not rea lis tic assumptions. Hence the 'equivalent host period', in effect, is a lower lim it for clay in the leading edge of a moving sorption band of uranium (Nabarlek) or an upper lim it for clay in the tra iling edge.
REFERENCES
[1 ] CHERDYNTSEV, V.V., Uranium-234, Israel Program for Scientific Translations, Jerusalem (1971), English Trans, of Uran-234, Atomizdat, Moscow (1968).
[2] OSMOND, J.K., COWART, At. Energy Rev. 144 (1976) 621-679.[3] ROSHOLT, T.N., HARSHMAN, E.N., SHIELDS, W.R., GARNER, E.L., Econ. Geol. 5 9
(1964) 570-585.[4] ANTHONY, P.T., Econ. Geol. of Australia and Papua New Guinea, Vol. 1 — Metals, Aust.
Inst. Min. Met. ( 1975) 304-308.[5] HILLS, J.H., RICHARDS, J.R., Miner. Deposita (Berlin) 11 (1976) 133-154.
IAEA-SM-243/129 251
DISCUSSION
R.E. GRIM: The weathered schist has kaolinite and illite clay minerals. Is
only one of these minerals responsible for fixation of the uranium or are both of
them?
P.J. SHIRVINGTON: We have not yet measured the relative proportion of
absorption power of the two major clay fractions. Both are capable of absorbing
uranium.
P.J. SLIZEWICZ: The 234U fixed in clays gives rise to 230Th, which in its
turn gives 226 Ra. Is this radium found in clay in a quantity corresponding to that
of 234U?
P.J. SHIRVINGTON: Yes. In the weathered part of the orebody, 234U,
234Th and 226 Ra are in equilibrium. However, another study in Australia has
indicated that 226 Ra migrates faster than 234 U in the rock below the lower limit
of weathering. It is thought that oxidizing conditions produce sulphate and this
immobilizes the radium.
G.E. COURTOIS: Papers SM-243/8 and 129 confirm the importance of
natural phenomena which can provide us with information about radionuclide
movements in the natural environment. The general methods of geochronology and
in particular radiochronology abound in examples. Radiochronology with its
uranium daughter methods and ionium-thorium methods brings out movements in
situ clearly. It may be recalled that such methods have been used to estimate
sedimentation rates in the Atlantic and the Pacific in pelitic media over several
hundreds of thousands of years. The fact that this marine environment is subjected
to intense leaching in saturated medium considerably increases the reliance that
we can place on data obtained under less severe conditions.
I suggest that the Agency should, at a future symposium, include an invited
paper dealing with questions of geochronology associated with geochemical
problems from the standpoint of mobility of actinides and transuranics in geologic
media.
P.A. WITHERSPOON : When you have measured the residual concentration
of a given uranium species in situ and attempt to determine rates of migration
over hundreds of thousands of years, how do you know whether certain quantities
of that species have not moved ahead of the point of observation in very low
concentrations so that the result does not properly reflect the rate of migration?
In other words, how do we use your result to predict movement of nuclides which
will be below any given concentration after a certain period of time?
P.J. SHIRVINGTON: It is assumed that the uranium concentration in the
clay has been constant over the age indicated by the results, hence use of the
term “equivalent host period” in the text. This is not a valid assumption.
However, it does not lead to order-of-magnitude errors if we are considering the
solid phase of the clay but only to errors of a factor of up to about 2. This is

252 SHIRVINGTON
because the process of isotope fractionation occurs in situ in the clay and evidence
for it is left behind. Bulk uranium and isotopic results obtained on a grid basis
would indicate if any sharp changes in uranium or other radionuclide concentrations
have occurred at times which are short in comparison with the half-lives.
Where radionuclides are migrating in the groundwater, the system is more
open. It will be necessary to perform comprehensive measurements on a grid
basis aided by computer analyses. It is important to appreciate that a large orebody
can be assumed to produce a constant input of radionuclides into the clay on a
10s a time-scale.
IAEA-SM-243/152
SHALLOW LAND BURIAL OF LOW-LEVEL
RADIOACTIVE WASTES IN THE USA
Geohydrologic and nuclide migration studies
J.B. ROBERTSON
US Geological Survey,
Reston, Virginia,
United States of America
Abstract
SHALLOW LAND BURIAL OF LOW-LEVEL RADIOACTIVE WASTES IN THE USA: GEOHYDROLOGIC AND NUCLIDE MIGRATION STUDIES.
Nearly all low-level radioactive waste in the USA has been disposed of in five government and six commercial shallow land burial sites. The yearly accumulation (1976) of waste for all sites has a volume of 1.2 X 10s m3, including about 1 X 10⁶ Ci total activity and 40 kg plutonium. The total inventory as of 1976 had a volume of 1.7 X 10⁶ m3, including about 1.3 X 10⁷ Ci total activity and 860 kg plutonium. The capacity of present commercial sites will be saturated by the 1990s and questions of environmental effects have been raised regarding a number of existing government and commercial sites. In order to minimize negative effects on the environment, the selection of future sites should be based on better geohydrologic guidelines. These guidelines will be based partially on information being developed by the US Geological Survey. Previous and ongoing site studies include five government sites and five commercial sites, six in humid climates and four in arid to semi-arid climates. Waste tritium apparently has migrated distances of a few metres to more than 700 m in the groundwater beneath eight of the ten sites, including all six of the humid-zone sites. Other nuclides such as 60Co, 137Cs, ^Sr, and transuranics have migrated short distances. Organic complexing appears to be a potentially significant transport factor at some sites.As might be expected, burial trenches excavated in low-permeability media in humid locations tend to accumulate water; also, arid-zone sites appear to have the least potential for nuclide migration in groundwater. Quantitative determination of groundwater flow has proved to be extremely difficult at sites located in fractured rocks or in arid regions.
1. INTRODUCTION
The dawn of nuclear power in the 1940s brought a new era in which
another class of undesirable residues, referred to as low-level radioactive waste,
was introduced to the environment. Although definitions have changed from
time to time and place to place, low-level waste in the United States currently
means waste which does not result directly from fuel reprocessing and contains
less than 10 nCi/g of transuranium alpha-emitting nuclides, such as plutonium.
Prior to 1970, there was generally no distinction between transuranic (TRU) and
low-level wastes (LLW), and most LLW sites contain TRU wastes.
253
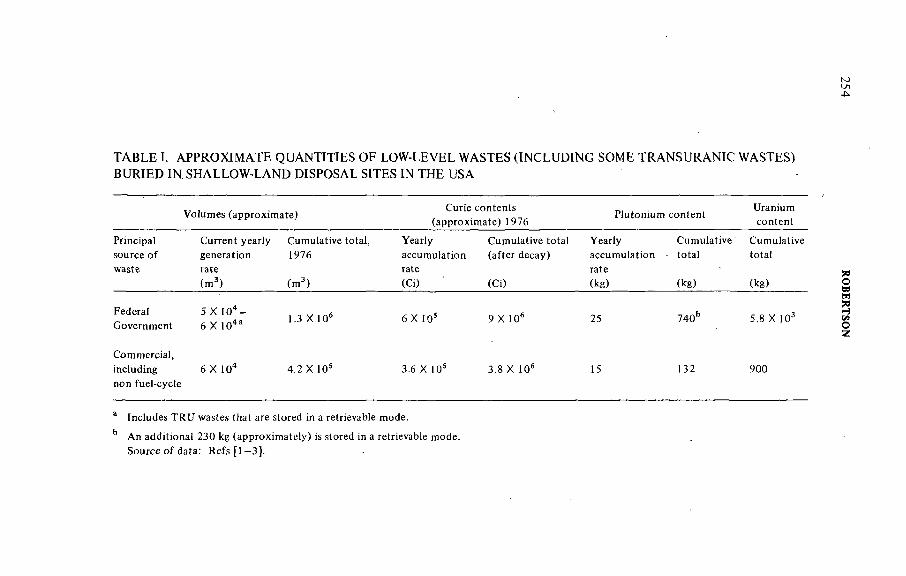
TABLE I. APPROXIMATE QUANTITIES OF LOW-LEVEL WASTES (INCLUDING SOME TRANSURANIC WASTES)
BURIED IN. SHALLOW-LAND DISPOSAL SITES IN THE USA
Volumes (approximate) Curie contents (approximate) 1976 Plutonium content Uranium
content
Principal Current yearly Cumulative total, Yearly Cumulative total Yearly Cumulative Cumulativesource of generation 1976 accumulation (after decay) accumulation total totalwaste rate rate rate
(m3) (m3) (Ci) (Ci) (kg) (kg) (kg)
FederalGovernment
5 X IO4-6 X 10⁴a 1.3 X 10⁶ 6 X 10s 9 X 10⁶ 25 740b 5.8 X 10³
Commercial,including 6 X 10⁴ 4.2 X 10⁵ 3.6 X 10⁵ 3.8 X 10⁶ 15 132 900non fuel-cycle
a Includes TRU wastes that are stored in a retrievable mode.
b An additional 230 kg (approximately) is stored in a retrievable mode. Source of data: Refs [1—3].

IAEA-SM-243/152 255
Eni
P3
YEAR
FIG. 1. Cumulative volumes o f commercial and government low-level radioactive waste
in the USA, dashed where estimated.
Shallow land burial has been the dominant method of low-level-waste
disposal since the first wastes were generated. Early disposal sites were not
generally selected on the basis of carefiil geohydrologic analyses.
Generation rates of low-level waste burgeoned during the 1950s with
expanding military applications, and during the 1960s with the advent of
commercial nuclear power reactors.
In 1962, the first two privately operated commercial radioactive waste
burial sites were licensed in the USA. Four additional commercial sites have
opened since then. Use of non-commercial government disposal sites for military
and other government-generated waste has also increased correspondingly.
The size of the present buried waste inventory, as well as the magnitude of
future anticipated accumulations, demand that better understanding be developed
of the long-term fate of these nuclides and their influence on the environment.
256 ROBERTSON
As the US Government’s leading earth-science research agency, the Geological
Survey has been investigating hydrologie impacts of shallow land burial technology
for many years. In 1975 the Survey intensified its effort to develop more
quantitative geohydrologic information upon which to base guidelines for
selecting and managing future shallow land disposal sites. Preliminary results of
these continuing studies are summarized in this report.
1.1. Quantities of low-level waste
Approximate quantities of low-level waste buried in the USA as of 1976
are summarized in Table I. Current and projected waste generation rates from
industry and the federal government’s Department of Energy (DOE) are shown
on Fig. 1. Total capacity of existing commercial burial sites (three currently
operating) suggests that additional sites will be required in the 1990s (Fig.l,
line A). Projections are based on 70 currently operating power reactors, 91 under
construction, and 42 planned [4].
1.2. Locations of low-level waste burial sites
Figure 2 depicts the locations of principal LLW burial sites in the USA,
with more specific information for each site listed in Table II.
2. GEOHYDROLOGIC PROBLEMS AND APPROACHES
The principal means of subsurface migration from any of these sites is
assumed to be flowing groundwater. Assessing the extent of or potential for
migration at any burial site requires:
(1) definition of the groundwater flow system;
(2) determination of controlling geochemical factors; and
(3) determination of leach rates and other source term factors.
Such studies are difficult, costly and time-consuming to carry out properly.
In the early 1970s, the Geological Survey carried out limited, site-specific
reconnaissance and field investigations at some of the government disposal
areas. A more intensive, five-year programme was begun in 1975 which includes
field studies at existing disposal sites and related research.
Five of the six commercially-operated sites were selected for the five-year
intensive study: Beatty, Nevada; Sheffield, Illinois; Barnwell, South Carolina;
Maxey Flats, Kentucky ; and West Valley, New York. In addition, the Survey

IAEA-SM-243/152 257
Kilometres
0 200 400 600 800 1000 1____ I_____I_____ I----1-----1
M ile s
FIG.2. Locations of principal low-level waste disposal sites in the USA.
continued DOE-sponsored studies of the burial grounds at the Idaho National
Engineering Laboratory and the Oak Ridge National Laboratory, Tennessee.
Another site investigation was begun in 1978 on the abandoned Argonne National
Laboratory burial site in Illinois. The main goals of these studies are:
(1) quantitatively to describe the subsurface groundwater flow system, and
(2) to determine the extent, rate, and concentration of any nuclide migration.
3. RESULTS
3.1. Hanford Reservation, Washington
The US Government burial areas at the Hanford site are in unconsolidated,
unsaturated glacial-fluvial deposits ranging in thickness from 6 m to more than
60 m. Depth to the water table ranges from about 4 m to 25 m. The average
annual precipitation is 163 mm, with average monthly temperatures ranging
from -1°C in January to about 24°C in July.
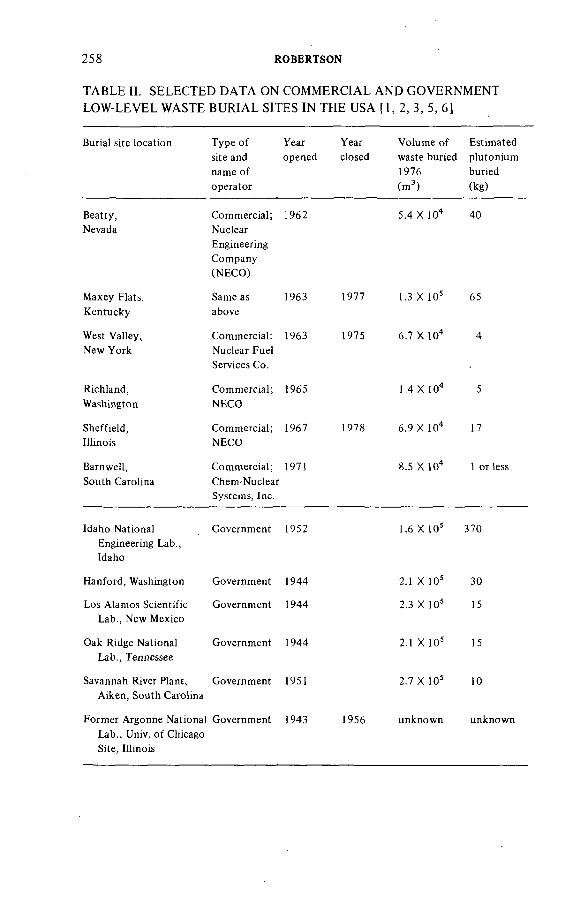
258 ROBERTSON
TABLE II. SELECTED DATA ON COMMERCIAL AND GOVERNMENT
LOW-LEVEL WASTE BURIAL SITES IN THE USA [1, 2, 3, 5, 6]
Burial site location Type of site and name of operator
Yearopened
Yearclosed
Volume of waste buried 1976 (m3)
Estimatedplutoniumburied(kg)
Beatty,Nevada
Commercial;NuclearEngineeringCompany(NECO)
1962 5.4 X 10⁴ 40
Maxey Flats, Kentucky
Same as above
1963 1977 1.3 X 10⁵ 65
West Valley, New York
Commercial; Nuclear Fuel Services Co.
1963 1975 6.7 X 10⁴ 4
Richland,Washington
Commercial;NECO
1965 1.4 X 10⁴ 5
Sheffield,Illinois
Commercial;NECO
1967 1978 6.9 X 10⁴ 17
Barnwell, South Carolina
Commercial; Chem-Nuclear Systems, Inc.
1971 8.5 X 10⁴ 1 or less
Idaho National Engineering Lab., Idaho
Government 1952 1.6 X 10s 370
Hanford, Washington Government 1944 2.1 X 10s 30
Los Alamos Scientific Lab., New Mexico
Government 1944 2.3 X 10⁵ 15
Oak Ridge National Lab., Tennessee
Government 1944 2.1 X 10s 15
Savannah River Plant, Aiken, South Carolina
Government 1951 2.7 X 10s 10
Former Argonne National Government Lab., Univ. of Chicago Site, Illinois
1943 1956 unknown unknown

IAEA-SM-243/152 259
A reconnaissance study [7] concluded that potentially significant quantities
of precipitation could infiltrate many of the burial grounds, even though the
annual precipitation is relatively low. That study indicates that some waste
isotopes were present in groundwater beneath or downgradient from most of the
solid waste disposal sites. However, radioactive liquid wastes have also been
discharged near areas of solid waste disposal, making it impossible to distinguish
the source of nuclides in the groundwater.
3.2. Los Alamos Scientific Laboratory, New Mexico
This DOE facility is located on a dissected plateau at an altitude of about
2100 m. Average annual precipitation and temperature are about 450 mm
and 9°C, respectively. Burial trenches have been excavated at several locations
in volcanic tuff which has non-uniform fracture permeability. Depth to the main
aquifer in thé area ranges from 274 m to more than 305 m.
Geohydrologic aspects of most of the burial sites have not been studied
quantitatively. Investigations at one burial site indicate that tritium had migrated
32 m laterally in five years, and perhaps further vertically [8, 9]. In another
area where both solid and liquid wastes had been discharged, plutonium was
found to have migrated at least 8 m downward into tuff.
3.3. Idaho National Engineering Laboratory, Idaho
This burial ground is situated on unconsolidated sand, silt, and clay ranging
in thickness from 1 m to about 8 m, which are underlain by more than 220 m
of layered basalts with some interbedded sediments. The water table of the
Snake River Plain aquifer is at a depth of about 175 m. The area receives an
average of 200 mm precipitation per year and the average annual temperature
is 6°C. Although the climate is arid, the site has been flooded at least twice
during periods of unusual spring rains and runoff. This site contains more
plutonium than any other shallow land burial site in the country (370 kg, Table II).
Barraclough et al. [ 10] and Humphrey and Tingey [11] indicate that
significant quantities of water have come in contact with some of the buried
wastes and percolated downward. Samples from thin perched water lenses
beneath the site at depths of 26 m and 64 m contain low concentrations of waste
isotopes and traces of 137Cs, 90Sr, 60Co, 241 Am and 234’238-24opu have been
found in core samples from depths of 80 m or more. However, waste isotopes
from this site have not been found in the underlying Snake River Plain aquifer.
Sediment samples have been collected directly beneath the floor of two
older burial pits from which the buried waste had been exhumed [11]. Those
samples indicated that small amounts of plutonium had moved downward at
least 3 m from the buried waste through sedimentary material. Although traces

260 ROBERTSON
of 60Co, 90Sr, and 241 Am were found down to 2 m beneath the burial pit floor,
most of the isotopes appear to have been adsorbed within the first 60 cm.
3.4. Oak Ridge National Laboratory (ORNL), Tennessee
Wastes have been buried since 1944 in weathered shale of Paleozoic age at
this DOE laboratory. It has a relatively high annual average precipitation of
1370 mm and an average annual temperature of 14.4°C. The water table ranges
in depth from 0 to 12 m. Filled trenches tend to accumulate water and cause
the water table to rise, submerging much of the buried waste.
Several seeps of contaminated groundwater have issued downhill from
burial sites; 3H, 60Co, Am, Pu, U, Cm, Sr, Th and Ra have been detected
in some of these seeps, as far as 100 m from burial trenches [12—14]. Means
et al. [13] analysed leachates from liquid waste disposal pits at ORNL and
demonstrated that 60Co and possibly other isotopes are being transported in
groundwater as organic complexes. Because many of the same organic compounds
are present in the solid waste trenches, complexing could be a significant migration
factor there also.
3.5. Former Argonne National Laboratory Site, Illinois
This site was used from 1943 to 1956 for some of the world’s earliest
nuclear reactor experiments. Two waste burial sites were excavated in the
clay-rich glacial till near the top of a morainal ridge.
This area normally receives about 840 mm of precipitation per year and
has an average annual temperature of 10.5°C.
The water table is about 15 m beneath the ground surface. A confined
aquifer in dolomitic bedrock underlies the till.
A plume of waste tritium has moved more than 700 m laterally downgradient
from the disposal site [15]. Field studies and groundwater-flow models suggest
that groundwater would flow downward from the burial area and laterally to
the nearest discharge area in about four years. The migration of isotopes other
than tritium has not been studied.
3.6. Maxey Flats, Kentucky
This commercial facility operated from 1963 until 1977, when it was
closed because of controversy concerning its environmental effects. The site
is located on a ridge of Paleozoic and Mesozoic shales and sandstones, with
trenches excavated in weathered shale. It has an average precipitation of
1170 mm and an average temperature of 13°C.

IAEA-SM-243/152 261
NORTHWEST SOimHEAST
>
Metres
FIG.3. Geologic cross-section showing conceptual flow system of groundwater beneath
Maxey Flats, Kentucky, waste burial ground, based on field data and two-dimensional
computer model. Arrows indicate flowlines; solid lines represent lines o f equal hydraulic
head [16].
Because of the very low permeability and the fractured-layered character
of rocks beneath this site, it has been difficult to construct wells that yield
meaningful samples and water-level information. However, limited field data
and computer model analyses have helped to provide a conceptual analysis of
the complex groundwater flow system (Fig.3). Actual subsurface flow rates
and directions have not been defined quantitatively.
As at Oak Ridge, groundwater tends to accumulate in the waste-filled
trenches. Samples of the trench water contain a wide variety of nuclides,
organic compounds, and inorganic solutes, some of which are summarized in
Table III. The organic components are of interest primarily because of their
complexing potential.
Although well-water samples or down-hole gamma spectrometry have
indicated the presence of 60Co, 137Cs and tritium in some on-site wells, it might
be due to contamination resulting from well construction.
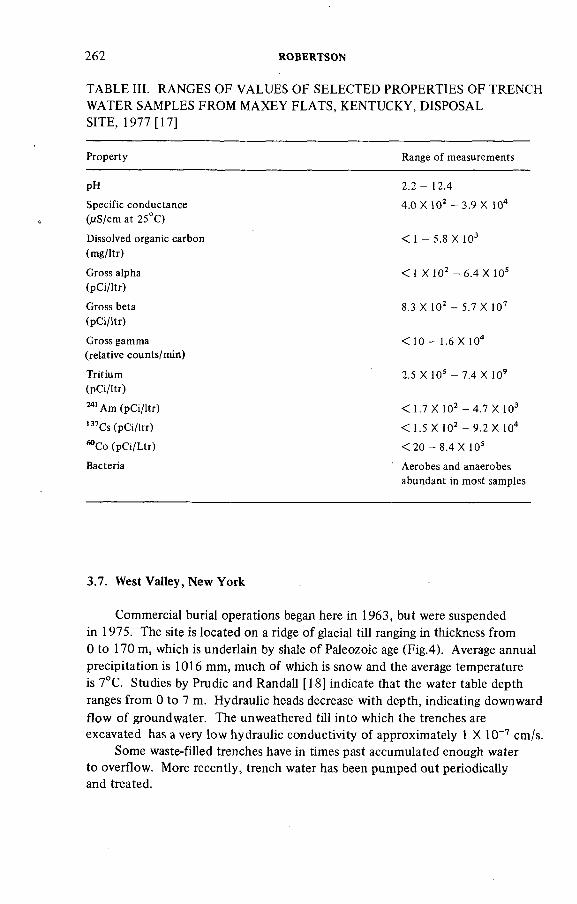
262 ROBERTSON
TABLE III. RANGES OF VALUES OF SELECTED PROPERTIES OF TRENCH
WATER SAMPLES FROM MAXEY FLATS, KENTUCKY, DISPOSAL
SITE, 1977 [17]
Property Range of measurements
pH 2.2 - 12.4Specific conductance 4.0 X 10² - 3.9 X 10⁴
(liS/cm at 25°C)
Dissolved organic carbon < 1 - 5.8 X 10³
(mg/ltr)
Gross alpha < 1 X10² — 6.4 X 10s(pCi/ltr)
Gross beta 8.3 X 10² - 5.7 X 10⁷
(pCi/ltr)
Gross gamma < 10 - 1.6 X 10⁴
(relative counts/min)
Tritium 2.5 X 10s - 7.4 X 10⁹
(pCi/ltr)
241 Am (pCi/ltr) < 1.7 X 10² - 4 .7 X 103
137Cs (pCi/ltr) < 1 .5 X 102 - 9.2 X 10⁴
60Co (pCi/Ltr) < 2 0 - 8.4 X 10sBacteria Aerobes and anaerobes
abundant in most samples
3.7. West Valley, New York
Commercial burial operations began here in 1963, but were suspended
in 1975. The site is located on a ridge of glacial till ranging in thickness from
0 to 170 m, which is underlain by shale of Paleozoic age (Fig.4). Average annual
precipitation is 1016 mm, much of which is snow and the average temperature
is 7°C. Studies by Prudic and Randall [18] indicate that the water table depth
ranges from 0 to 7 m. Hydraulic heads decrease with depth, indicating downward
flow of groundwater. The unweathered till into which the trenches are
excavated has a very low hydraulic conductivity of approximately 1 X 10⁻⁷ cm/s.
Some waste-filled trenches have in times past accumulated enough water
to overflow. More recently, trench water has been pumped out periodically
and treated.
IAEA-SM-243/152 263
Trench water samples were found laden with various organic solutes, radio
nuclides and other inorganic solutes similar to the Maxey Flats trench water
(Table III). Many analyses of well waters and core samples and some down-hole
gamma spectrometry indicate that tritium, 60Co and 137Cs have migrated
laterally at least a few metres from the trenches [ 18].
Core samples collected directly beneath the floors of filled trenches indicate
that tritium has migrated vertically downward about 2.5 m while cesium migration
was limited by adsorption to less than 10 cm.
3.8. Barnwell, South Carolina
This is the only commercial disposal site operating in the Eastern United
States, where'more than 80% of the Nation’s commercial nuclear waste is
generated. Average annual temperature and precipitation are 18°C and 1190 mm,
respectively. Burial trenches are excavated in a thick section of unconsolidated
coastal plain sands, silts, and clays. The water table is about 11 m below the
ground surface. Filled trenches at this site do not tend to collect water, except
during periods of extremely heavy rainfall. Therefore, the potential for leaching
nuclides is lower than at some previously discussed sites in humid zones. Samples
of trench water have generally had much lower concentrations of dissolved
solids, dissolved organic carbon- and radionuclides than trench waters from the
Kentucky and New York sites.
Samples from one well indicate that tritium and dissolved organic carbon
have migrated laterally at least a few metres from one trench. No other isotopes
have been detected in the groundwater.
3.9. Sheffield, Illinois
This commercial site operated from 1967 until its licensed area became
filled in 1978. It has a mean annual temperature of 10.5°C and about 890 mm
per year average precipitation.
Burial trenches are excavated primarily, in Pleistocene loess and glacial
deposits of clay, silt, sand, and gravel, 3 m to 15 m thick, which are underlain
by consolidated Paleozoic shales. The depth of the water table ranges from
about 1 m to 15 m, depending on the topography. The permeability of the upper
sediments is high enough to prevent accumulation of water in the waste-filled
trenches, except during periods of heavy rainfall and rapid snow-melt, such as
the Spring of 1979, when water percolated into the trenches from sink holes
in the covers.
Of particular interest and difficulty at this site is the analysis of unsaturated
flow regimes from the trenches to the water table. To facilitate studies and
sampling in this zone, a tunnel, 88 m long and 2 m in diameter, has been constructed

ALTI
TUDE
, IN
MET
RES
EXPLANATION
40060 90 120 150
DISTANCE FROM WEST EDGE OF BURIAL SITE, IN METRES
210
ATest hole
• • *Y • • •Assumed water table
Equipotential line,
altitude, in metres
Backtill
Weathered Till
Till with oxidized fractures
Un weathered Till
FIG.4. Cross-section through north trenches of West Valley, New York, burial site showing head distribution during February 1976 [18\.
264 R
OBERTSO
N
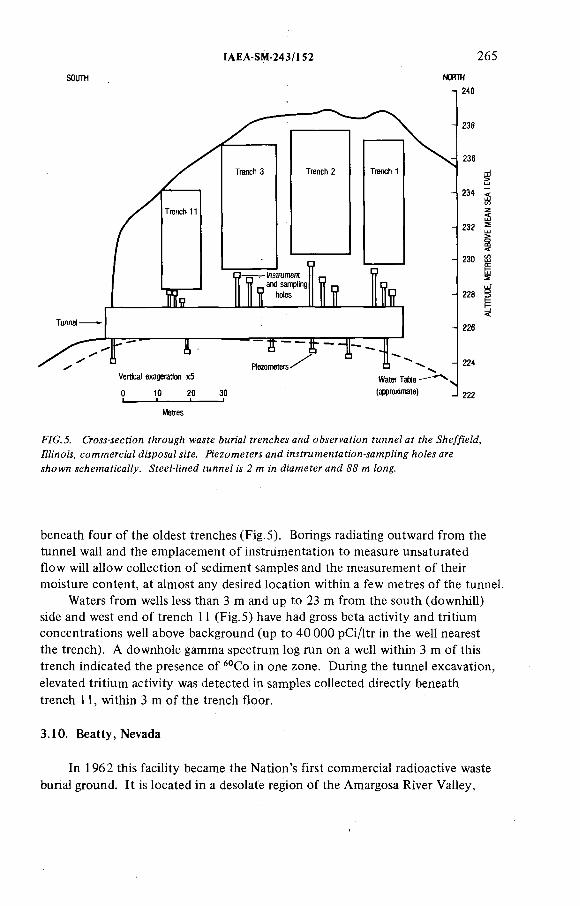
IAEA-SM-243/152 265
soim NORTH
Metres
FIG.5. Cross-section through waste burial trenches and observation tunnel at the Sheffield,
Illinois, commercial disposal site. Piezometers and instrumentation-sampling holes are
shown schematically. Steel-lined tunnel is 2 m in diameter and 88 m long.
beneath four of the oldest trenches (Fig.5). Borings radiating outward from the
tunnel wall and the emplacement of instrumentation to measure unsaturated
flow will allow collection of sediment samples and the measurement of their
moisture content, at almost any desired location within a few metres of the tunnel.
Waters from wells less than 3 m and up to 23 m from the south (downhill)
side and west end of trench 11 (Fig.5) have had gross beta activity and tritium
concentrations well above background (up to 40 000 pCi/ltr in the well nearest
the trench). A downhole gamma spectrum log run on a well within 3 m of this
trench indicated the presence of 60Co in one zone. During the tunnel excavation,
elevated tritium activity was detected in samples collected directly beneath
trench 11, within 3 m of the trench floor.
3.10. Beatty, Nevada
In 1962 this facility became the Nation’s first commercial radioactive waste
burial ground. It is located in a desolate region of the Amargosa River Valley,

266 ROBERTSON
known as the Amargosa Desert, where rainfall averages only 100 mm per year
and the average temperature is about 19°C over the year. The site is underlain
by mixed fanglomerates and other unconsolidated alluvial and lacustrine
sediments to a depth of 175 m. The water table is about 90 m deep. The aridity
and thickness of the unsaturated zone have made it difficult quantitatively to
analyse subsurface flow conditions.
A vertical shaft, 10 m deep and 2 m in diameter, was excavated near the
site to enable collection of undisturbed samples and emplacement of soil
moisture instrumentation. An observation tunnel similar to the one excavated
beneath the Sheffield, Illinois site is also being planned. Measurements of
subsurface unsaturated flux parameters indicate extremely low moisture contents,
in the range of 4 to 7 vol.%, down to depths of 10 m, and, similarly, low
moisture tension or suction in the range of - 30 to - 70 bars. Neutron logs and
soil psychrometer measurements indicate significant seasonal variations in
moisture content to depths as low as 6 m, although apparent flux rates are very low.
There is no current evidence to indicate that any buried wastes have been
saturated with groundwater. There is evidence, however, that some precipitation
and local runoff water haver entered the filled trenches through cracks and
and fissures in the trench caps. The quantities of water and frequency of
occurrence are unknown but appear to be relatively small. Because moisture
tension in the undisturbed sediments adjacent to the trenches is probably much
higher than the moisture tension within the buried refuse and backfill, it is
unlikely that significant quantities of water would move into the filled trenches
from adjacent natural sediments. It appears, therefore, that conditions have
not been favourable for nuclide leaching and transport at this site.
4. CONCLUSIONS
In eight of the ten disposal sites considered in these studies, groundwater
apparently has contacted buried waste and some nuclides have migrated limited
distances from the burial trenches. Climatic conditions are relatively humid
at six of the ten sites, and arid to semi-arid at the other four. Nuclide leaching
and migration in groundwater is apparent at all the humid zone sites and at two
of the arid zone sites. Accumulation of water in filled trenches has been a
chronic problem at three of the humid sites (Maxey Flats, Kentucky; Oak Ridge,
Tennessee; and West Valley, New York). The trench waters are rich in various
dissolved organic components as well as many nuclides and other inorganic
solutes. Both anaerobic and aerobic bacteria are active in the trench water.
The extent of subsurface nuclide migration detected ranges from only a few
metres at the West Valley, New York, and Barnwell, South Carolina, sites to
more than 700 m at the former Argonne National Laboratory site in Illinois.
IAEA-SM-243/152 267
Tritium is the most commonly observed migratory solute; 6?Co has apparently
moved at Maxey Flats, Kentucky, and Oak Ridge, Tennessee. At the Oak
Ridge site, 60Co is only one of the many nuclides that have migrated in the
groundwater. Generally, the concentrations of migrating waste isotopes detected
in groundwater have been low in comparison with concentrations specified in
current health standards. No off-site water supplies presently appear threatened
by subsurface migration from these sites.
Cationic isotopes such as 137Cs and 90Sr are generally more retarded in
their movement than tritium, because of adsorption. 60Co and probably other
isotopes are moving as organic complexes in groundwater at Oak Ridge from
liquid disposal trenches and perhaps solid wastes, as well. Complexingcould
also be a significant factor at other sites.
Efforts quantitatively to define the groundwater-flow system by conventional
methods at Maxey Flats, Kentucky, have not been successful, due to the fractured
and layered nature of the rocks and their low permeability. Similar problems
have been encountered at arid-zone sites such as Beatty, Nevada, because of the
very dry, coarse-grained and heterogeneous-nature of the sediments.
Current information suggests that all sites discussed, except Oak Ridge,
Tennessee, and possibly Maxey Flats, Kentucky, might have acceptable geohydro
logic conditions, if the quantity of water entering the filled trenches through the
trench caps could be adequately controlled. The arid-zone sites, especially
Beatty, Nevada, appear to have the lowest potential for subsurface nuclide
migration.
REFERENCES
[1] UNITED STATES NUCLEAR REGULATORY COMMISSION, NRC Task Force Report on Review of the Federal/State Program for Regulation of Commercial Low-Level Radioactive Waste Burial Grounds, NUREG-0217 (1977) 60.
[2] WILLRICH, М., LESTER, R.K., Radioactive Waste Management and Regulation, the Free Press, New York (1977) 138.
[3] HOLCOMB, W.F., A summary of shallow land burial of radioactive wastes at commercial sites between 1962 and 1976, with projections, Nucl. Safety 19 1 (1978) 50.
[4] UNITED STATES DEPARTMENT OF ENERGY, Nuclear Reactors BuUt, Being Built, or Planned in the United States as of June 30, 1978, Rep. TID-8200-R38 (1978) 44.
[5] NATIONAL RESEARCH COUNCIL, The Shallow Land Burial of Low-Level Radio- actively Contaminated Solid Waste (1976) 150.
[6] UNITED STATES DEPARTMENT OF ENERGY, Western New York Nuclear Service Center Study 2 (1978) 94.
[7] LA SALA, A.M., Jr., DOTY, G.C., Geology and Hydrology of Radioactive Solid-Waste Burial Grounds at the Hanford Reservation, Washington, U.S. Geol. Survey, Open-File Rep. 75-625 (1975) 73.
[8] KELLY, T.E., Evaluation of Monitoring of Radioactive Solid-Waste Burial Sites at Los Alamos, New Mexico, U.S. Geol. Survey, Open-File Rep. 75-406 (1975) 82.
268 ROBERTSON
[9] PURTYMUN, W.D., Underground movement of Tritium from Solid-Waste Storage Shafts, Los Alamos Scientific Lab. Rep. LA-5 286-MS (1973) 7.
[10] BARRACLOUGH, J.T., et al., Hydrology of the Solid Waste Burial Ground, as Related to the Potential Migration of Radionuclides, Idaho National Engineering Laboratory, U.S. Geol. Survey, Open-File Rep. 76-471 (1976) 183.
[11] HUMPHREY, T.G., TINGEY, F.H., The Subsurface Migration of Radionuclides at the Radioactive Waste Management Complex 1976—1977, EG&G Idaho, Inc., TREE-1171(1978) 98.
[12] STEVENS, P.R., DEBUCHANANNE, G.D., Problems in shallow land disposal of solid low-level radioactive waste in the United States, Bull. Int. Assn. Eng. Geol. 14 (1976) 161.
[13] MEANS, J.L., et al., Migration of radioactive wastes: Radionuclide mobilization by complexing agents, Science 200 (1978) 1477.
[14] DUGUID, J.O., “Hydrologie transport of radionuclides from low-level waste burial ground”, Management of Low-Level Radioactive Waste, Pergamon Press, New York 2(1979) 1119.
[15] SHERRILL, MARVIN, U.S. Geol. Survey, written commun., (1978).[16] ZEHNER, H.H., U.S. Geol. Survey, written commun. (1978).[17] COLOMBO, P., et al., Evaluation of Isotope Migration — Land Burial, Water Chemistry
at Commercially Operated Low-Level Radioactive Waste Disposal Sites, Progress Rep.8, Brookhaven Natl. Lab. (1978) 42.
[18] PRUDIC, D.E., RANDALL, A.D., Ground-Water Hydrology and Subsurface Migration of Radioisotopes at a Low-Level, Solid Radioactive-Waste Disposal Site, West Valley, New York, U.S. Geol. Survey Open-File Rep. 77-566 (1977) 28.
DISCUSSION
F.A. VAN КОТЕ: You pointed out that some commercial sites would be
saturated. Could you say on what bases the capacities of these sites have been
determined?
J.B. ROBERTSON: The commercial sites are licensed by the Government
to occupy a specified area. The volume that can be accommodated by the site
can be calculated from the dimensions of the licensed area and the depth of
the trenches.
P. COHEN : What methods do you propose to use to overcome the problem
of water which you find in the waste trenches (humid zones)?
J.B. ROBERTSON: Several techniques and ideas are being investigated by
other Government agencies, such as the Department of Energy, the Nuclear
Regulatory Commission and the Environmental Protection Agency. The techniques
being considered include: better trench cap compaction; use of bentonite
and other low-permeability clays in the trench covers; use of more engineered
containment facilities such as concrete-lined trenches and covers.
C. MYTTENAERE: Don’t you think that certain “ageing” phenomena,
which are known in the case of several radionuclides (Pu etc.), will seriously
increase the migration levels observed at present?
IAEA-SM-243/152 269
J.B. ROBERTSON: This is possible but we do not have sufficient data on
these complex solutions to draw well-founded conclusions at this time. The
ageing process can produce both mobilizing and retarding effects, depending on
the physico-chemical and biochemical processes and conditions.
C.N. MURRAY : In Table III you give a range of pH values from 2.2 to
12.4 for ground water. At what distance from the storage zones were these
measurements made?
J.B. ROBERTSON: The measurements were made on samples of water
directly within the filled trenches.
C.N. MURRAY: Given the large variations in the pH of these waters, is it
possible to correlate the activities of actinides with these differences?
J.B. ROBERTSON: It may be possible but we do not have enough data yet.
The trench waters are extremely complex solutions involving many inorganic
and organic species, organo-metallic complexes, micro-organisms, colloids and
particulates, and insufficiently understood pH-Eh influences. We hope to obtain
enough information to make the correlation you suggest and to gain a more
quantitative understanding of transuranic chemistry in general.


IAEA-SM-243/155
RECHERCHE EN LABORATOIRE
SUR LA RETENTION ET LE TRANSFERT
DE PRODUITS DE FISSION ET DE
TRANSURANIENS DANS LES MILIEUX POREUX
J. ROCHON*, D. RANÇON**, J.P. GOURMEL*
* Bureau de recherches géologiques et minières,
Orléans
**CEA, Institut de protection et de sûreté nucléaire,
Centre d’études nucléaires de Cadarache,
Saint-Paul-lez-Durance,
France
Abstract-Résumé
LABORATORY STUDIES ON THE RETENTION AND TRANSFER OF FISSION PRODUCTS AND TRANSURANICS IN POROUS MEDIA.
The distribution of simple or complex species of an element in solution is strongly dependent on the concentration of the element and on the type of water in which it is located. It is the species which, depending on their characteristics, govern retention of the element on minerals. Element transfer is linked with the concept of the reversibility of retention, and the simplest way of approaching the problem is to perform dynamic retention tests in a column, analysing the migration mechanisms in hydrodynamic and physicochemical terms. Simulation of transfer is considered in cases where the dominant mechanism of interaction is precipitation, adsorption or ion exchange.
RECHERCHE EN LABORATOIRE SUR LA RETENTION ET LE TRANSFERT DE PRODUITS DE FISSION ET DE TRANSURANIENS DANS LES M ILIEUX POREUX.
La distribution des espèces simples ou complexes d’un élément en solution dépend étroitement de la concentration de cet élément et du type d’eau dans lequel il se trouve. Ce sont ces espèces qui, selon leur nature, régissent la rétention de l’élément sur les minéraux. Quant au transfert de l’élément, il est lié à la notion de réversibilité de la rétention et la façon la plus simple de l’aborder est de recourir à des essais de rétention dynamique en colonne, les mécanismes de migration étant analysés en termes hydrodynamiques et physico-chimiques.La simulation du transfert est envisagée dans le cas où le mécanisme d’interaction prépondérant est la précipitation, 1’adsorption ou l’échange d’ions.
1 - INTRODUCTION
A partir de diverses études [i, 2], et de récents travaux effectués conjointement par le Bureau de Recherches Géologiques et Minières et l'Institut de Protection et de Sûreté Nucléaire
271
sous contrat avec la Commission des Communautés Européennes en vue de la qualification de barrières géochimiques Сз], nous avons analysé la diversité des processus de rétention des éléments radioactifs par des minéraux en milieu aqueux. En effet, les interactions entre une solution et un solide peuvent être t rès différentes selon la nature du soluté et les conditions du milieu. Les radioéléments peuvent se trouver en solution sous forme anionique, cationique ou neutre, mais certains d'entre eux peuvent précipiter totalement ou en partie sous certaines conditions du milieu ; la nature de celui-ci peut aussi influer sur la valence des éléments susceptibles d'exister sous plusieurs degrés d ’oxydation en modifiant les phénomènes de sorption ; enfin dans les études de transfert en milieu poreux et dans leurmodélisation, il faut tenir compte de la réversibilité de larétention variable selon les radioéléments et leurs formesphysico- chimiques.
Dans cette étude, nous avons sélectionné des éléments radioactifs dont le comportement est exemplaire des divers phénomènes considérés (cf.523. Pour servir de support aux expériences, nous avons choisi trois minéraux :
- le quartz, minéral le plus abondant dans la nature- l'illite, argile phylliteuse souvent utilisée comme
adsorbant [4 ,5]- la vermiculite, argile phylliteuse utilisée dans le trai
tement des effluents radioactifs [4 , 5].
272 ROCHON et al.
i
1 Contrat de la Communauté Economique Européenne pour l'E nerg ie Atomique C .E .E . 019-76-7-WASFLes travaux ré a lis é s par le B.R.G.M. ont é té e ffectués dans les labo rato ires du Groupe d 'A pp lica tio n s des Réactions N ucléaires à l'A nalyse Chimique (G.A.R.N.A.C.) du C.N.R.S., Service du Cyclotron à ORLEANS.
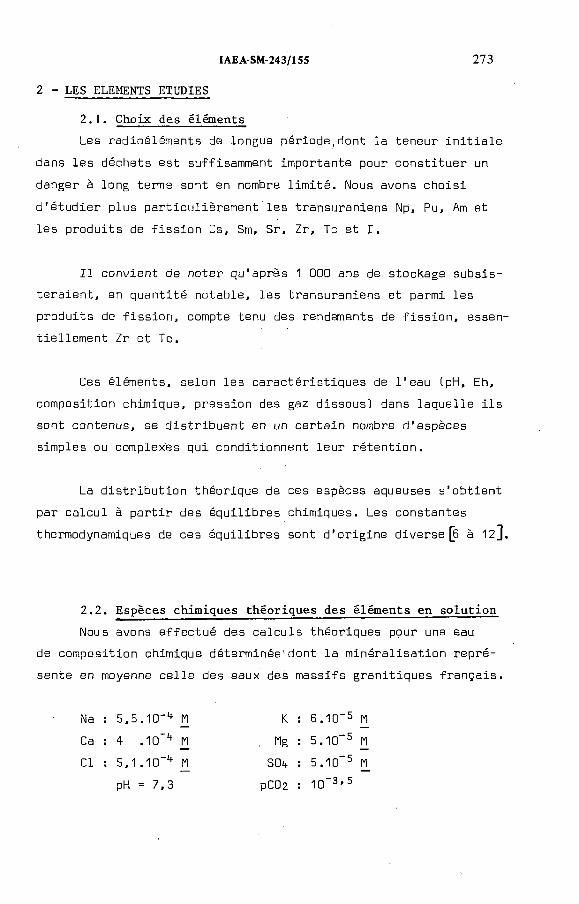
IAEA-SM-243/155 273
2.1. Choix des élémentsLes radioéléments de longue période,dont la teneur initiale
dans les déchets est suffisamment importante pour constituer un danger à long terme sont en nombre limité. Nous avons choisi d'étudier plus particulièrement les transuraniens Np, Pu, Am et les produits de fission Cs, Sm, Sr, Zr, Te et I.
Il convient de noter qu’après 1 ODÜ ans de stockage subsisteraient, en quantité notable, les transuraniens et parmi les produits de fission, compte tenu des rendements de fission, essentiellement Zr et Te.
Ces éléments, selon les caractéristiques de l'eau CpH, Eh, composition chimique, pression des gaz dissous] dans laquelle ils sont contenus, se distribuent en un certain nombre d ’espèces simples ou complexes qui conditionnent leur rétention.
La distribution théorique de ces espèces, aqueuses s’obtient par calcul à partir des équilibres chimiques. Les constantes thermodynamiques de ces équilibres sont d'origine diverse (б à 12].
2.2. Espèces chimiques théoriques des éléments en solutionNous avons effectué des calculs théoriques pour une eau
de composition chimique déterminée'dont la minéralisation représente en moyenne celle des eaux des massifs granitiques français.
2 - LES ELEMENTS ETUDIES
Na : 5,5. 1Ü-4 M Ca : 4 .1ü_lt n
Cl : 5,1.10_1+ M
К : 6.10"5 П
Mg : 5.1G-5 П Süit : 5.1 G-5 M
pK = 7,3 pCÜ2 : 10 3,5
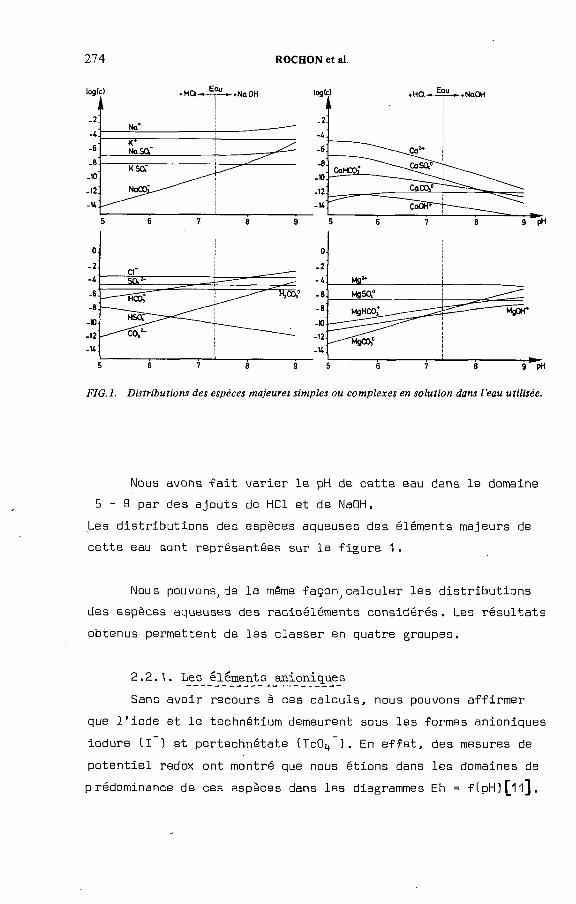
274 ROCHON et al.
FIG.l. Distributions des espèces majeures simples ou complexes en solution dans l'eau utilisée.
Nous avons fait varier le pH de cette eau dans le domaine 5 - 9 par des ajouts de HC1 et de NaOH.
Les distributions des espèces aqueuses des éléments majeurs de cette eau sont représentées sur la figure 1.
Nous pouvons; de la même façon^calculer les distributions des espèces aqueuses des radioéléments considérés. Les résultats obtenus permettent de les classer en quatre groupes.
2.2.1. Les éléments anioniquesSans avoir recours à ces calculs, nous pouvons affirmer
que l'iode et le technétium demeurent sous les formes anioniques iodure Cl 3 et pertechnétate (TcO^ ). En effet, des mesures de potentiel redox ont montré que nous étions dans les domaines de prédominance de ces espèces dans les diagrammes Eh = f(pH)£ll],

IAEA-SM-243/155 275
FIG. 2. Distributions des espèces aqueuses du Cs et du Sr et distributions des principales
espèces aqueuses du Zr et du Sm.
2.2.2. Les _é_léments catJ.on_i_quesLa figure 2 montre que dans le domaine de pH considéré,
le césium et le strontium à la concentration 1СГ6 M restent sous les formes cationiques Cs+ et Sr++.
2.2.3. jÆS__êl_%nent_s c_atjijD n i que s_ _s use eptibles de s'hydrolyserLe zirconium et le samarium ont des produits de solubilité
faible et s ’hydrolysent à des pH voisins de la neutralité (si la concentration est pondérable). Les calculs faits pour Zr 2,5.10 8 И et Sm 4,5.10 6 J4 donnent les résultats de la figure 2.
2.2.U. L e s_ jt r ал sjor a n i en s_En solution aqueuse, ces éléments peuvent se trouver à
plusieurs degrés d'oxydation dont les principaux sont AmCIII),
Np(IV,V), P u ( l l l , i v , v n .
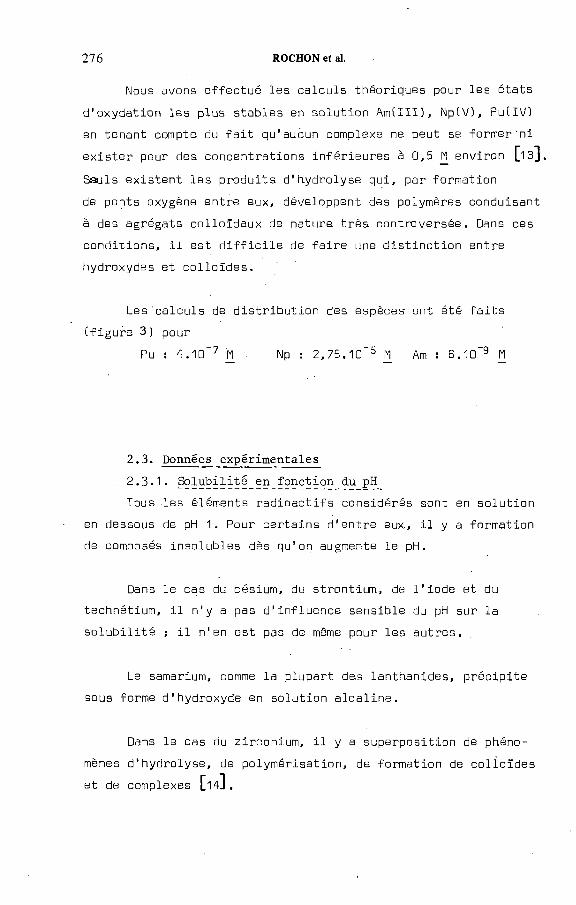
276 ROCHON et al.
Nous avons effectué les calculs théoriques pour les états d'oxydation les plus stables en solution Am(III), Np(V), PutIV) en tenant compte du fait qu’aucun complexe ne peut se former'ni exister pour des concentrations inférieures à 0,5 fl environ [13]
Sauls existent les produits d’hydrolyse qui, par formation de ponts oxygène entre eux, développent des polymères conduisant à des agrégats colloïdaux de nature très controversée. Dans ces conditions, il est difficile de faire une distinction entre hydroxydes et colloïdes.
Les calculs de distribution des espèces ont été faits (figure 3) pour
Pu : 4.10”7 П Np : 2,75.10'5 И Am : 6.10"9 П
2.3. Données expérimentales2.3.1. §o lub ilité_en_fonc tion_âu pH
Tous les éléments radioactifs considérés sont en solution en dessous de pH 1. Pour certains d’entre eux, il y a formation de composés insolubles dès qu’on augmente le pH.
□ans le cas du césium, du strontium, de l’iode et du technétium, il n ’y a pas d ’influence sensible du pH sur la solubilité ; il n ’en est pas de même pour les autres.
Le samarium, comme la plupart des lanthanides, précipite sous forme d ’hydroxyde en solution alcaline.
Dans le cas du zirconium, il y a superposition de phénomènes d ’hydrolyse, de polymérisation, de formation de colloïdes

IAEA-SM-243/155 277
logic)
FIG. 3. Distributions des principales espèces aqueuses de Am, Pu et Np.
Les sels solubles de Pu (IV) n ’existent sous forme de Pu1** qu'en solutions très acides (pH < 1) ; au-dessus, ils subissent une hydrolyse intense avec formation de colloïdes polymérisés
Isous forme d'agrégats, d ’hydroxydes ou d ’oxydes hydratés avec des particules de'masses molaires élevées, phénomènes d'autant plus intenses que le pH est plus élevé [jO, 151.
О +L hydrolyse de Am° en milieu' acide non complexant survient seulement au-dessus de pH 5. avec formation en' particulier de Ат(0Н)з-
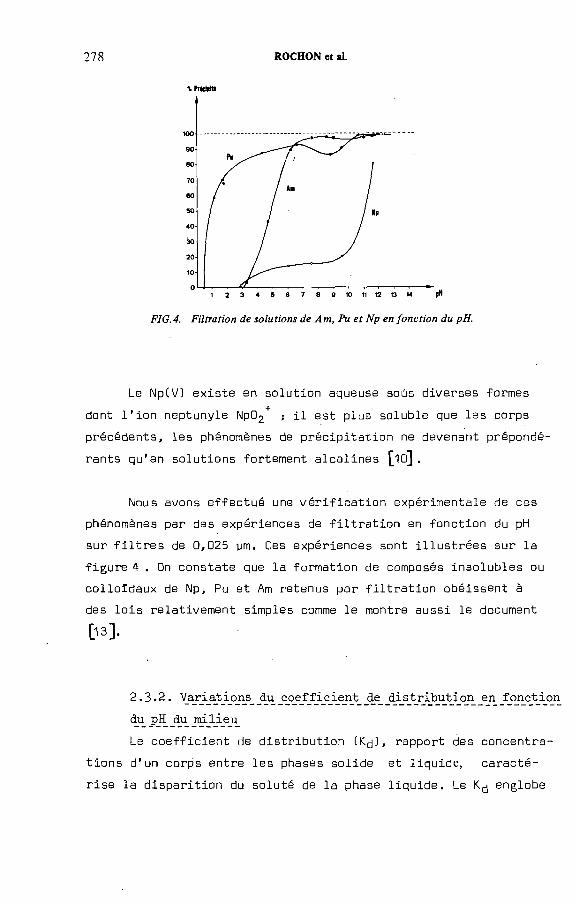
278
IPrteWtt
ROCHON et al.
FIG.4. Filtration de solutions de Am, Pu et Np en fonction du pH.
Le NpCV) existe en solution aqueuse soûs diverses formes dont l ’ion neptunyle Np02+ ; il est plus soluble que les corps précédents, les phénomènes de précipitation ne devenant prépondérants qu'en solutions fortement alcalines [10].
Nous avons effectué une vérification expérimentale de ces phénomènes par des expériences de filtration en fonction du pH sur filtres de 0,025 ym. Ces expériences sont illustrées sur la figure 4 . On constate que la formation de composés insolubles ou colloïdaux de Np, Pu et Am retenus par filtration obéissent à des lois relativement simples comme le montre aussi le document[13].
2.3«2. Variations _du cœ_ffi_c_ient_ de distribution en fonctiondu pH du milie_uLe coefficient de distribution CK^), rapport des concentra
tions d'un corps entre les phases solide et liquide, caractérise la disparition du soluté de la phase liquide. Le K.,-¡ englobe

IAEA-SM-243/155 279
tous les mécanismes intervenant dans la rétention : sorption des ions ou des colloïdes, échange d'ions, réactions chimiques, précipitation, etc...
Le pH du milieu, comme nous l ’avons vu en 2.2.1., peut influer sur la distribution des espèces chimiques en solution Ccas des lanthanides, des actinides, du zirconium) j il peut aussi avoir une grande influence sur la rétention des ions solubles CCs+, Sr++) [l, 2, з]. Comme une faible variation du pH peut induire de grandes variations du K^, les mesures pour un matériau donné doivent être effectuées à divers pH de façon à obtenir la courbe = f (pH) .
Les variations en fonction du pH des K,-) de Sr, Zr, Тс, I, Cs, Sm, Np, Pu et Am sont illustrées pour:
- le mélange eau-quartz sur la figure 5- le mélange eau-illite sur la figure B- le mélange eau-vermiculite sur la figure 7 .
□n peut séparer les radioéléments en quatre catégories, selon :
- les corps peu ou pas retenus : I, Te- les corps moyennement retenus par sorption ionique : Sr,
Np- les corps fortement retenus par sorption ionique : Cs- les corps fortement retenus par précipitation et sorption
ionique : Zr, Sm, Pu, Am.
I et Te se trouvent en solution sous forme anionique I [ iodure) et TcG^- (pertechnétate) Ccf.J2.2.1.] ; le décroît quand le pH augmente, la sorption étant d'autant plus faible quela densité de charges positives du minéral argileux décroît.
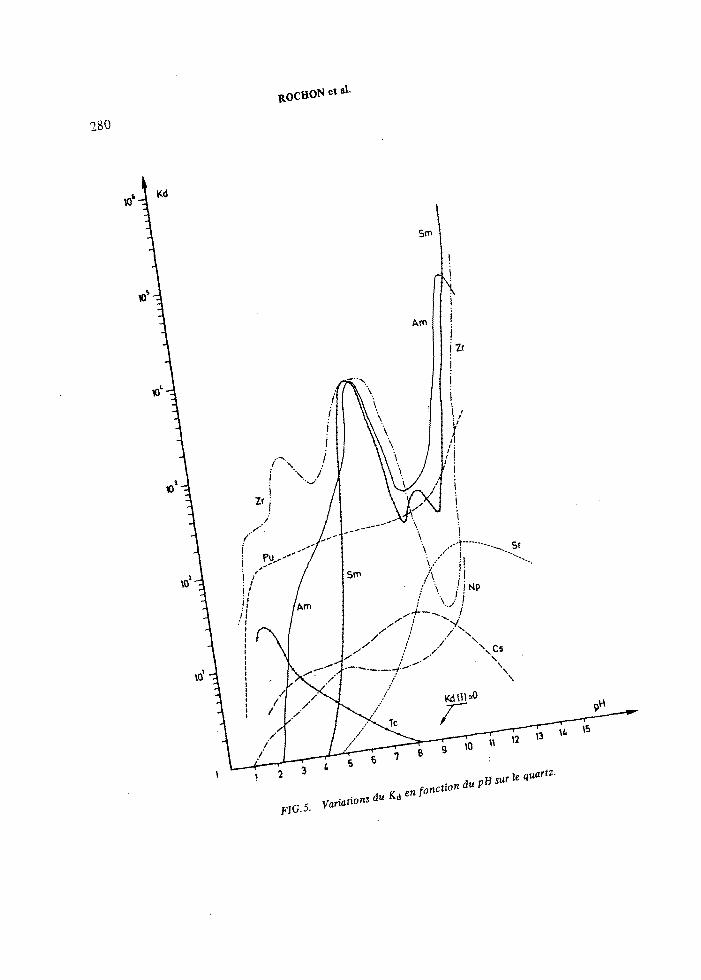
RO C H O N e t a l
FIG.5. Variations
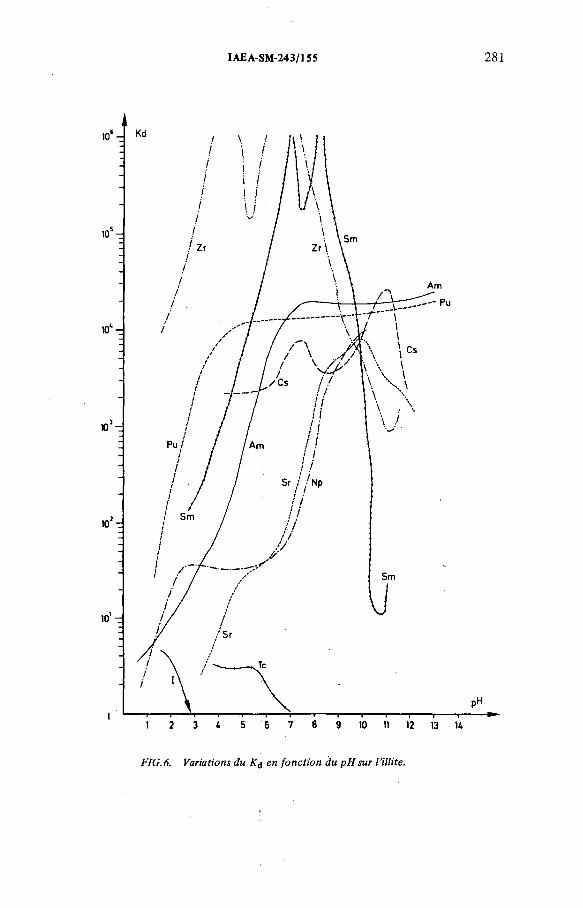
IAEA-SM-243/155 281
FIG. 6. Variations du K¿ en fonction du pH sur l ’illite.
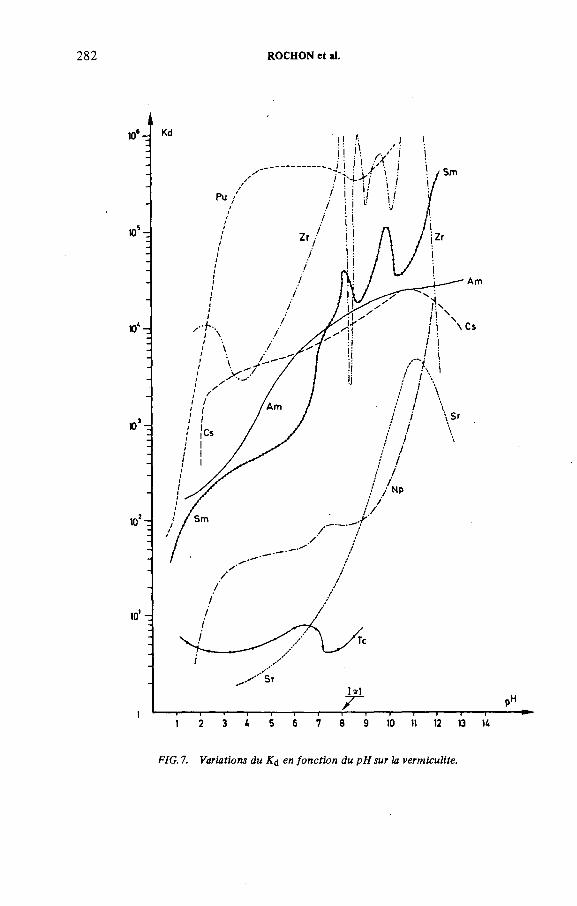
282 ROCHON et al.
FIG. 7. Variations du K¿ en fonction du pH sur la vermiculite.

Le strontium en solution, sous forme Sr++ (cf. 52 .2 .2 . ), est retenu par adsorption et échange d ’ions ¡ l'augmentation du K,-] avec le pH est due à l ’augmentation, des sites présentant une charge négative.
Le neptunium existe en solution sous forme Np02+ [cf.52.2.4.) les processus de rétention par les argiles ne sont pas encore connus et il est probable que l'échange d'ions y joue aussi un rôle [l, з].
Le césium (Cs+ en solution) (cf . 52 .2 .2 . ), est aussi retenu par échange d'ions,mais de façon plus importante, du fait de son faible rayon ionique hydraté.
La forme des courbes = f(pH) des Np, Pu et Am, par comparaison avec la figure 4, montre que la rétention des actinides est liée aux phénomènes de précipitation. Toutefois, la précipitation n ’est pas seule en cause si on compare, à même pH, les valeurs des sur les argiles à ceux mesurés sur le quartz où le phénomène de précipitation est prépondérant. On peut penser qu’avec les argiles, il y a superposition de trois m é c a n i s m e s : p r é c i p i t a t i o n , s o r p t i o n d e s c o l l o ï d e s , r é t e n t i o n
par échange du Pu et de l ’Am restant en solution (cf.52 .2.4. ) .
La précipitation joue aussi un r61e prépondérant dans la rétention du Sm et du Zr, mais les grandes variations du Kj en fonction du pH ne peuvent recevoir qu’une explication partielle à partir de la distribution théorique des espèces (cf .5 2,2.3.) .
3 - REVERSIBILITE DE LA RETENTION'
Dans les expériences précédentes, nous avons établi les K. qui définissent un passage en phase solide à l ’équilibre par
IAEA-SM-243/1 S5 283
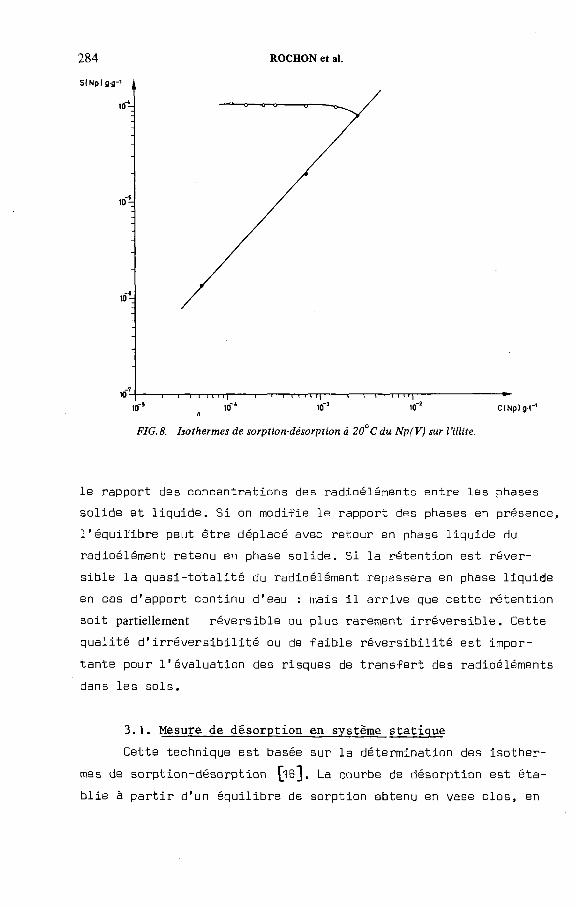
284 ROCHON et al.
le rapport des concentrations des radioéléments entre les phases solide et liquide. Si on modifie le rapport des phases en présence, 1'équilibre peut être déplacé avec retour en phase liquide du radioélément retenu en phase solide. Si la rétention est réversible la quasi-totalité du radioélément repassera en phase liquide en cas d'apport continu d'eau : mais il arrive que cette rétention soit partiellement réversible ou plus, rarement irréversible. Cette qualité d ’irréversibilité ou de faible réversibilité est importante pour l'évaluation des risques de transfert des radioéléments dans les sols.
3.1. Mesure de desorption en système statiqueCette technique est basée sur la détermination des isother
mes de sorption-désorption [16]. La courbe de desorption est établie à partir d ’un équilibre de sorption obtenu en vase clos, en
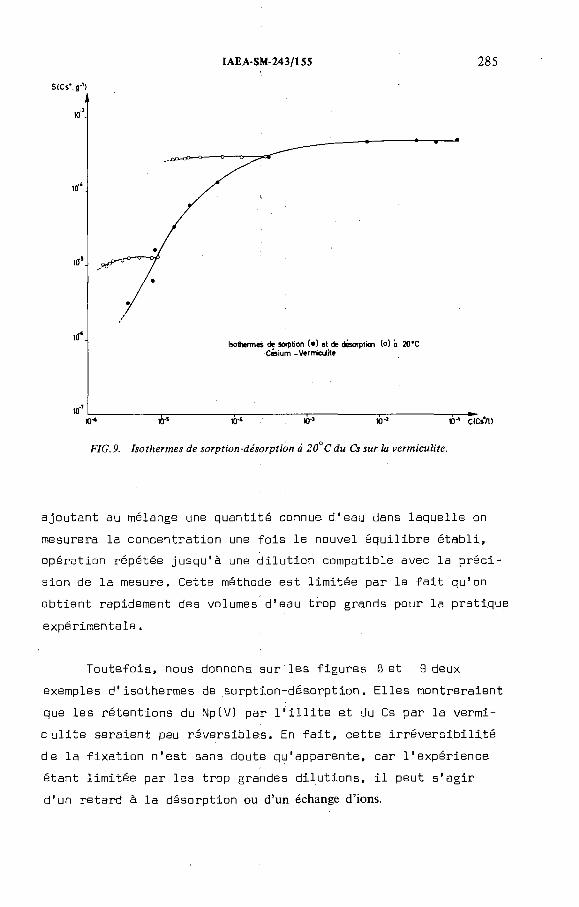
SICs*, g'1)
IAEA-SM-243/155 285
ajoutant au mélange une quantité connue d ’eau dans laquelle on mesurera la concentration une fois le nouvel équilibre établi, opération répétée jusqu'à une dilution compatible avec la précision de la mesure. Cette méthode est limitée par le fait qu'on obtient rapidement des volumes d'eau trop grands pour la pratique expérimentale.
Toutefois, nous donnons sur les figures 8 et 9 deux exemples d ’isothermes de sorption-désorption. Elles montreraient que les rétentions du NpCV] par l'illite et du Cs par la vermi- culite seraient peu réversibles. En fait, cette irréversibilité de la fixation n ’est sans doute qu’apparente, car l ’expérience étant limitée par les trop grandes dilutions, il peut s'agir d’un retard à la désorption ou d’un échange d’ions.
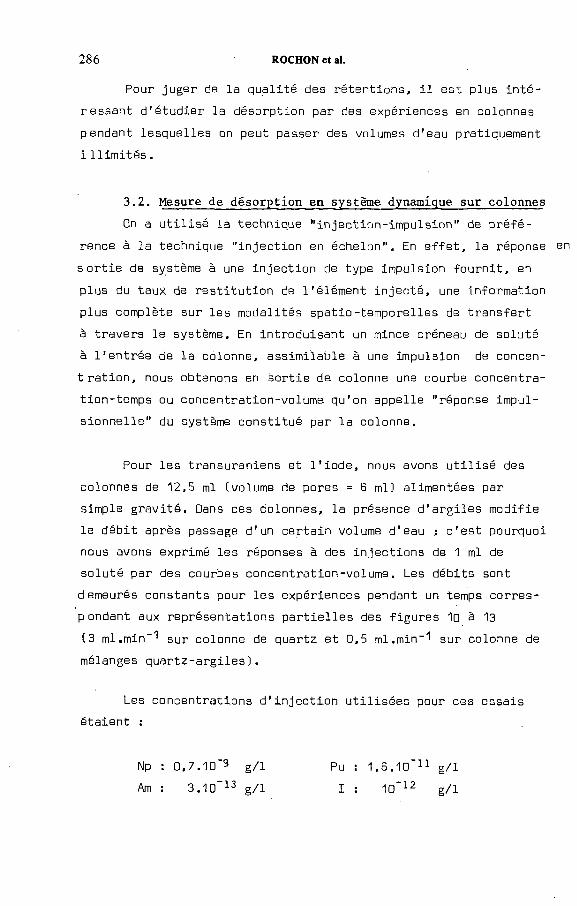
286 ROCHON et al.
Pour juger de la qualité des rétentions, il est plus intéressant d'étudier la désorption par des expériences en colonnes pendant lesquelles on peut passer des volumes d'eau pratiquement illimités.
3.2. Mesure de désorption en système dynamique sur colonnes□n a utilisé la technique "injection-impulsion" de préfé
rence à la technique "injection en échelon”. En effet, la réponse en sortie da système à une injection de type impulsion fournit, en plus du taux de restitution de l'élément injecté, une information plus complète sur les modalités spatio-temporelles de transfert à travers le système. En introduisant un mince créneau de soluté à l ’entrée de la colonne, assimilable à une impulsion de concen- t ration, nous obtenons en sortie de colonne une courbe concentration-temps ou concentration-volume qu'on appelle "réponse impulsionnelle" du système constitué par la colonne.
Pour les transuraniens et l'iode, nous avons utilisé des colonnes de 12,5 ml [volume de pores = B ml] alimentées par simple gravité. Dans ces colonnes, la présence d'argiles modifie le débit après passage d ’un certain volume d'eau ; c'est pourquoi nous avons exprimé les réponses à des injections de 1 ml de soluté par des courbes concentration-volume. Les débits sont demeurés constants pour les expériences pendant un temps corres- p ondant aux représentations partielles des figures 10 à 13
(3 ml.min-”' sur colonne de quartz et 0,5 ml.min-'' sur colonne de mélanges quartz-argiles].
Les concentrations d'injection utilisées pour ces essais étaient :
Np : 0,7.10"9 g/l Am : З . Ю ”13 g/l
Pu : 1,6.10"n g/lI : Ю ' 12 g/l

IAEA-SM-243/155 287
_Ç.100(dV=2,5em3)
FIG. 10. Restitutions comparées des éléments transuraniens et de l'ióde sur le quartz.
55-
50-
45
40
35
30'
25
20
15
10
5
1.
ROCHON et al.
-£-■100 |dV=2,5cm5)
destitutions du Np(V) sur le quartz et sur les mélanges à 2% d ’illite et de vermiculite.
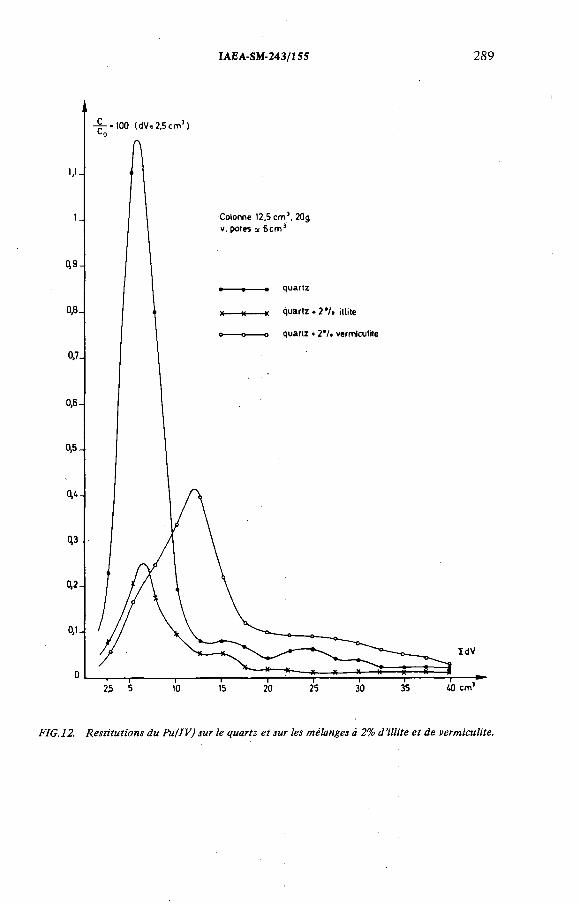
IAEA-SM-243/155 289
FIG. 12. Restitutions du Pu(IV) sur le quartz e t sur les mélanges à 2% d ’illite et de vermiculite.
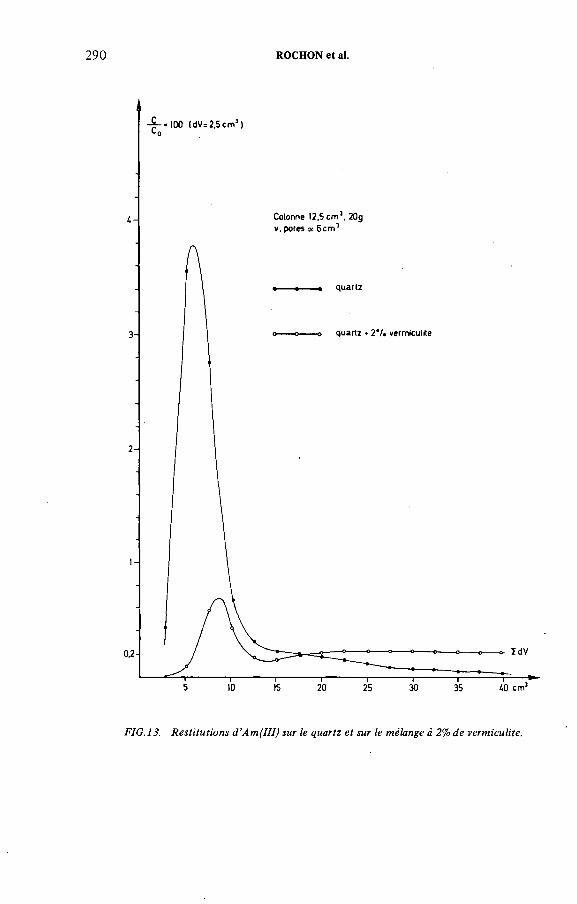
290 ROCHON et al.
FIG.13. Restitutions d ’Am(III) sur le quartz et sur le mélange à 2% de vermiculite.
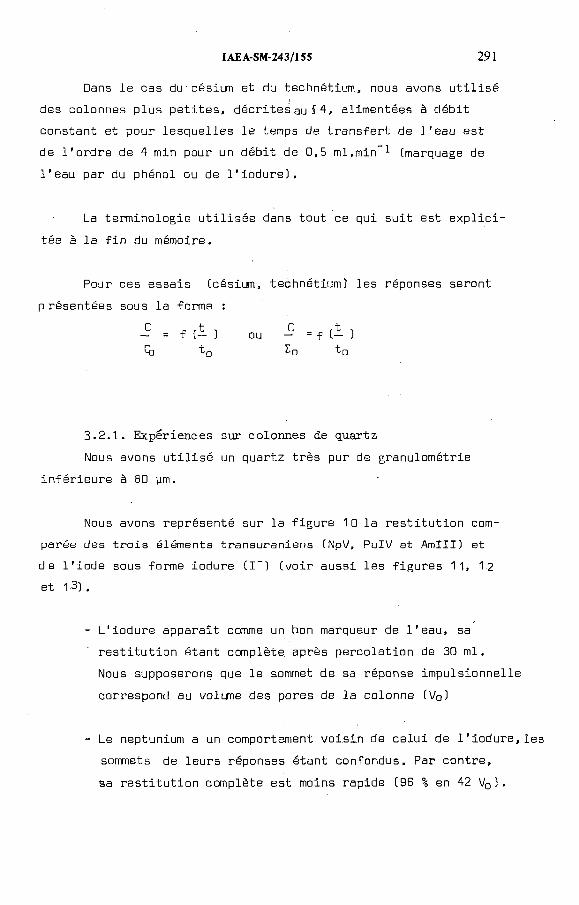
Dans le cas du césium et du technétium, nous avons utilisé des colonnes plus petites, décrites au Í 4, alimentées à débit constant et pour lesquelles le temps de transfert de l'eau est de l'ordre de 4 min pour un débit de 0,5 ml.min 1 (marquage de l'eau par du phénol ou de l'iodure).
La terminologie utilisée dans tout ce qui suit est explicitée à la fin du mémoire.
Pour ces essais (césiun, technétium) les réponses seront présentées sous la forme :
- = f (- )Qd t 0
IAEA-SM-243/155 291
3.2.1. Expériences sur colonnes de quartzNous avons utilisé un quartz très pur de granulométrie
inférieure à 80 ym.
Nous avons représenté sur la figure 1ü la restitution comparée des trois éléments transuraniens (NpV, PuIV et AmIII) etde l ’iode sous forme iodure (I-) (voir aussi les figures 11, 12et 1 3) .
- L'iodure apparaît comme un bon marqueur de l'eau, sa restitution étant complète après percolation de 3D m l .Nous supposerons que le sommet de sa réponse impulsionnellecorrespond au volune des pores de la colonne (Vo)
- Le neptunium a un comportement voisin de celui de l'iodure,les sommets de leurs réponses étant confondus. Par contre,sa restitution complète est moins rapide (96 % en 42 V0 ) .
C rt , - = f (- )

292 ROCHON et al.
- Le plutonium et l’américium ont un comportement différent. Leurs réponses présentent un petit pic au niveau du volume des pores prouvant qu'une faible partie de ces éléments est entraînée avec l'eau (2,5 % Pu et 7 % Am sont restitués après percolation de 30 ml soient 5 VQ ) .
En poursuivant l'élution jusqu'à 1000 V0 , nous avons constaté un enlèvement continu d'environ 0,01 % du Puet 0,005 % de l'Am pour chaque aliquote de volume équivalent à V q .
- Le comportement du technétium (figure 14.],à une concentration d'injection de l'ordre de l O ^ g / l , est comparable à celui de l'iode (bilan de restitution de 100 %, temps moyen de transfert - t0 ). Les anions I et TcO^ne sont pas, ou peu retenus par le support siliceux comme l'avaient déjà montré les essais statiques.
- Le cas du césium est détaillé au § 4.
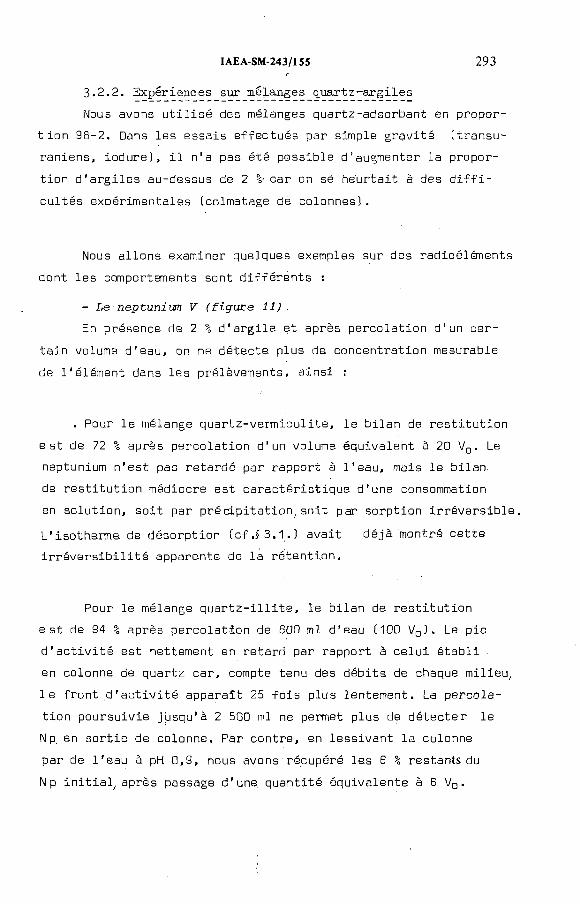
IAEA-SM-243/155 293f
3.2.2. Expériences sur mélanges quartz-argilesNous avons utilisé des mélanges quartz-adsorbant en propor
tion 98-2. Dans les essais effectués par simple gravité (transu- raniens, iodure), il n'a pas été possible d ’augmenter la proportion d ’argiles au-dessus de 2 %■ car on se heurtait à des difficultés expérimentales (colmatage de colonnes].
Nous allons examiner quelques exemples sur des radioéléments dont les comportements sont différents :
- L e n e p t u n i u m V ( f i g u r e 1 1 )
En présence de 2 % d'argile et après percolation d'un certain volume d ’eau, on ne détecte plus de concentration mesurable de l'élément dans les prélèvements, ainsi :
. Pour le mélange quartz-vermiculite, le bilan de restitution est de 72 % après percolation d ’un volume équivalent à 20 V0 . Le neptunium n ’est pas retardé par rapport à l ’eau, mais le bilan- de restitution médiocre est caractéristique d ’une consommation en solution, soit par précipitation,soit par sorption irréversible.
L ’isotherme de désorption (cf.53.1.) avait déjà montré cetteirréversibilité apparente de la rétention.
Pour le mélange quartz-illite, le bilan de restitution est de 94 % après percolation de 600 ml d ’eau (100 V0 ). Le pic d ’activité est nettement en retard par rapport à celui établi en colonne de quartz car, compte tenu des débits de chaque milieu, le front d ’activité apparaît 25 fois plus lentement. La percolation poursuivie jusqu’à 2 500 ml ne permet plus de détecter le Np. en sortie de colonne. Par contre, en lessivant la colonne par de l'eau à pH 0,9, nous avons récupéré les S % restants du Np initial, après passage d'une quantité équivalente à 6 V0 .
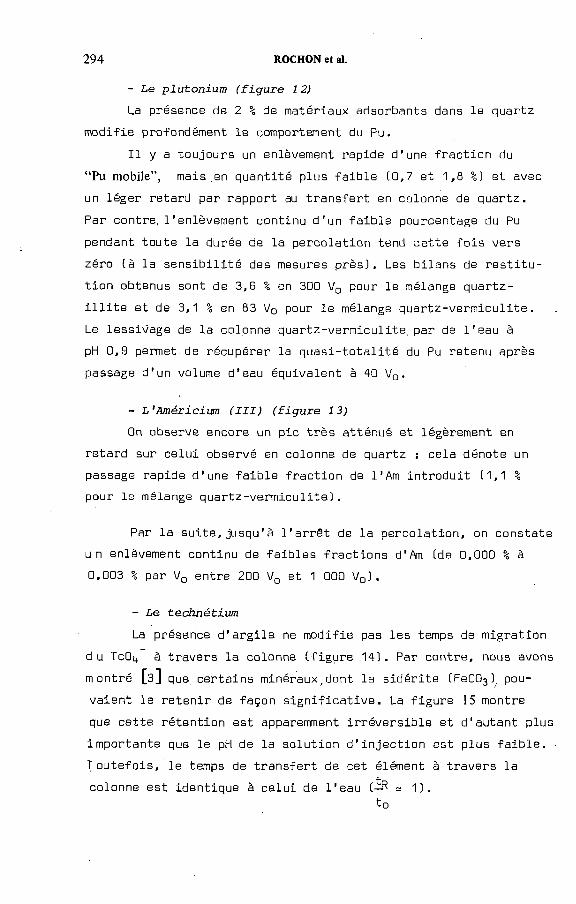
- L e p l u t o n i u m ( f i g u r e 1 2)
La présence de 2 % de matériaux adsorbants dans le quartz modifie profondément le comportement du Pu.
Il y a toujours un enlèvement rapide d'une fraction du “Pu mobile”, mais .en quantité plus faible (0,7 et 1,8 %] et avec un léger retard par rapport au transfert en colonne de quartz.Par contre, 1 ’enlèvement continu d'un faible pourcentage du Pu pendant toute la durée de la percolation tend cette fois vers zéro (à la sensibilité des mesures près]. Les bilans de restitution obtenus sont de 3,6 X en 3G0 V0 pour le mélange quartz- illite et de 3,1 % en 83 V0 pour le mélange quartz-vermiculite.Le lessivage de la colonne quartz-vermiculite. par de l ’eau à pH 0,9 permet, de récupérer la quasi-totalité du Pu retenu après passage d ’un volume d ’eau équivalent à 40 VQ .
- L ' A m é r i c i u m ( I I I ) ( f i g u r e 1 3 )
On observe encore un pic très atténué et légèrement en retard sur celui observé en colonne de quartz ; cela dénote un passage rapide d ’une faible fraction de l ’Am introduit (1,1 % pour le mélange quartz-vermiculite].
Par la suite,jusqu’à l’arrêt de la percolation, on constate un enlèvement continu de faibles fractions d ’Am (de 0,000 % à 0,003 % par V0 entre 200 V0 et 1 000 V0 ].
- L e t e c h n é t i u m
La présence d ’argile ne modifie pas les temps de migrationd u ТсОц. à travers la colonne (figure 14]. Par contre, nous avonsm ontré [3] que certains minéraux,dont la sidérite (FeC03). pouvaient le retenir de façon significative. La figure 15 montre que cette rétention est apparemment irréversible et d ’autant plus importante que le pH de la solution d ’injection est plus faible.T outefois, le temps de transfert de cet élément à travers lacolonne est identique à celui de l’eau (ÍR = 1].
to
294 ROCHON et al.
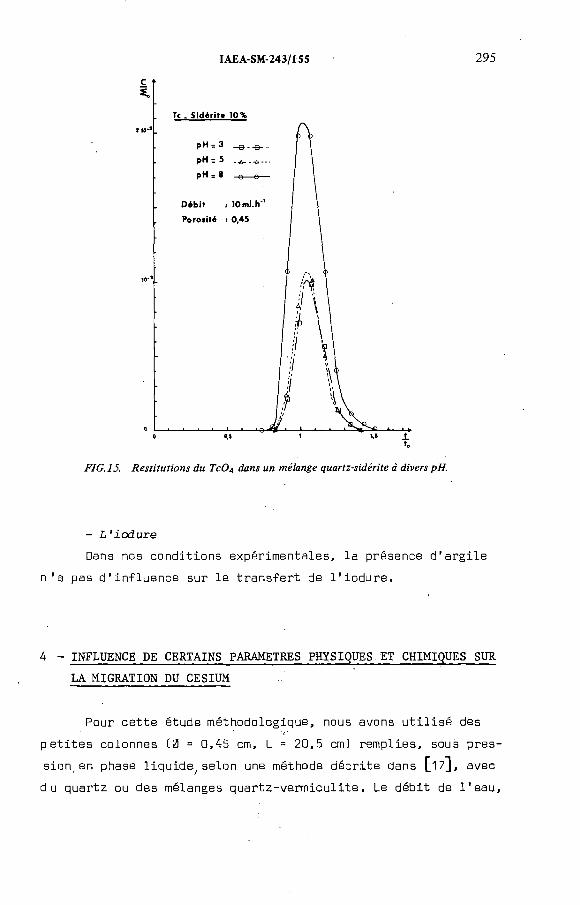
IAEA-SM-243/155 295
FIG. 15. Restitutions du Tc04 dans un mélange quartz-sidérite d divers pH.
- L 'io d u re
Dans nos conditions expérimentales, la présence d 'a rg ile
n 'a pas d 'in flu en ce sur le trans fe rt de l 'io d u re .
4 - INFLUENCE DE CERTAINS PARAMETRES PHYSIQUES ET CHIMIQUES SUR
LA MIGRATION DU CESIUM
Pour cette étude méthodologique, nous avons u t i l i s é des
p e t ite s colonnes (0 = 0,45 cm, L = 20,5 cm) remplies, sous pres
sion, en phase liqu ide^se lon une méthode décrite dans ^17], avec
du quartz ou des mélanges quartz-verm icu lite . Le déb it de l 'e a u ,
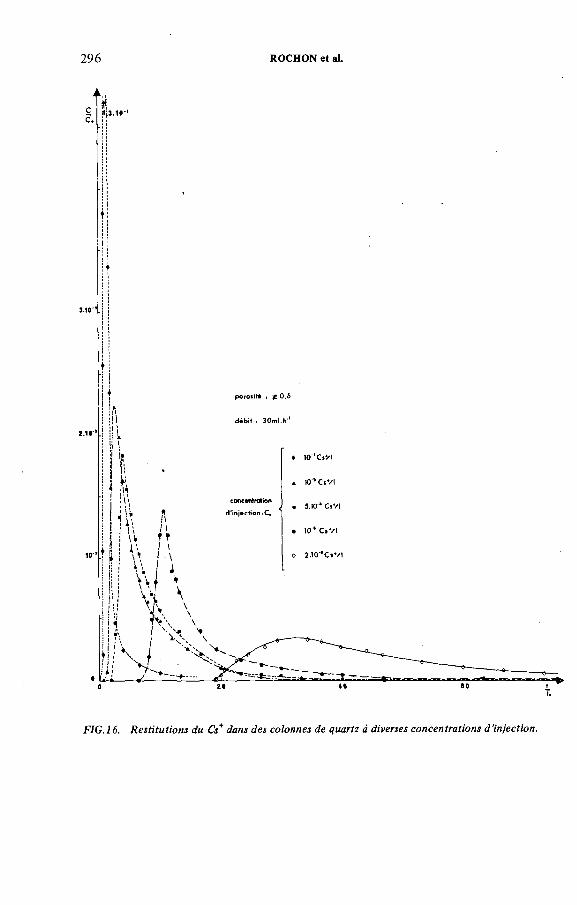
296 ROCHON et al.
FIG. 16. Restitutions du Cs* dans des colonnes de quartz à diverses concentrations d'injection.
IAEA-SM-243/155 297
assuré par une pompe de type seringue, est parfaitement constant.
Le volume in je c té est constant C nj = 0,2 ml].
L'élément cho is i pour cette étude a été le césium, du f a i t
de l ’u n ic ité de son é ta t ionique en so lu tion Ccfi 2 .2 .2 .] .
4.1. Migration du césium à travers des colonnes de quartzNous avons étud ié la s e n s ib il ité de deux paramètres :
- la concentration d ’ in je c tio n du césium,
- le déb it de perco la tion .
La figure 16 confirme la non- linéarité de la ré ten tion , le
retard du césium par rapport à ' l ’ eau augmentant lorsque la con
cen tra tio n d 'in je c t io n diminue.
Sur la figure 17, nous voyons que l ’ amplitude rédu ite desI
réponses im pulsionnelles ohtenues pour une même concentration
d ’ in je c tio n c ro ît avec la Vitesse in te r s t i t ie l le de l ’ eau. Cela
peut s ig n if ie r que la constante c inétique globale de trans fe rt
entre les phases mobiles et s ta tionna ires augmente avec la v itesse
in te r s t i t ie l le [is] .
Notons que toutes ces réponses impulsionnelles ont des bilans de re s t itu tio n s proches de 100 % ;; toutes ces in te ractions dyna
miques sur le quartz sont donc révers ib les .
4.2. Migration du césium à travers des colonnes de mélangesquartz-verm iculite
Pour fa ire cette étude, nous avons cho is i de t r a v a il le r dans
le domaine des fortes concentrations ( 10~2 Cs+ Г 1) ce qui a le double avantage de:
- réduire les temps de passage à travers la colonne,
- pouvoir incorporer une quan tité plus importante de vermi-
c u lite au support s ilic eux en obtenant néanmoins une
réponse exp lo itab le en sortie de colonne.

OIO
298 ROCHON et al.
FIG. 1 7. Restitutions du Cs* dans des colonnes de quartz à divers débits de percolation.

IAEA-SM-243/155 299
FIG. 18. Influence de divers pourcentages de vermiculite dans le quartz sur la restitution du Cs'

3 0 0 ROCHON et al.
FIG.19. Influence de la concentration d ’injection du Cs sur la forme des courbes de restitution.
Nous avons étudié la s e n s ib il ité de quatre paramètres :
- L’_au_gmenta_t_ion d_u j30ui c_e_n_t_ag_e d_e_ v_ermi_culitè_ dans le
quartz (figure 18] augmente les temps de re s t itu t io n du
césium et la d ilu t io n de la concentration maximale des
réponses.
- : la figure 19 met en évidence
deux sortes de c inétique de trans fe rt entre phases. Pour
la fa ib le concentration d’ in je c tio n , la c inétique est
gouvernée par une d iffu s io n in te rg ranu la ire rapide. Pour
les plus fortes concentrations,, v ient s 'y a jou ter une
d iffu s io n in tragranu la ire plus lente qui impose la c iné
tique globale au trans fe rt [le].

IAEA-SM-243/155 301
FIG.20. Restitutions du Cs* sur des colonnes de mélange quartz-vermiculite à divers débits
de percolation.
- (figu re 20] n'a pas beaucoup
d 'in fluence sur les temps caractéristiques des réponses
im puls ionne lles . I l est fo r t probable qu'une constante
lim ite de trans fe rt s o it a tte in te .
- La fig u re 2\ met en évidence l 'in f lu e n c e de la nature
d _ U _ 5 U B B Q C t. A chaque a rg ile correspond une réponse im pulsionnelle
d iffé re n te s .
Notons que, cette fo is encore, les b ilans de re s t itu t io n
sont proches de 100 % et donc que ces in te ractions support-
césium sont révers ib les .
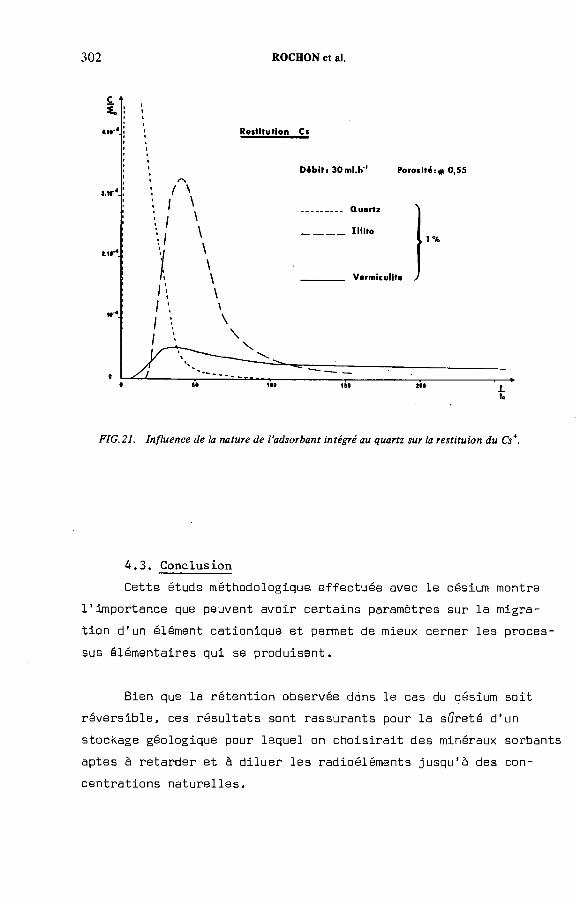
3 0 2 R O C H O N et al.
FIG.21. Influence de la nature de l ’adsorbant intégré au quartz sur la restituion du Cs*.
4.3. ConclusionCette étude méthodologique effectuée avec le césium montre
l ’ importance que peuvent avoir certa ins paramètres sur la m igra
tio n d'un élément cationique et permet de mieux cerner les proces
sus élémentaires qui se produisent.
Bien que la ré ten tion observée dans le cas du césium so it
révers ib le , ces ré su lta ts sont rassurants pour la sûreté d ’ un
stockage géologique pour lequel on c h o is ir a it des minéraux sorbants
aptes à retarder et à d ilu e r les radioéléments ju squ 'à des con
centrations na tu re lles .
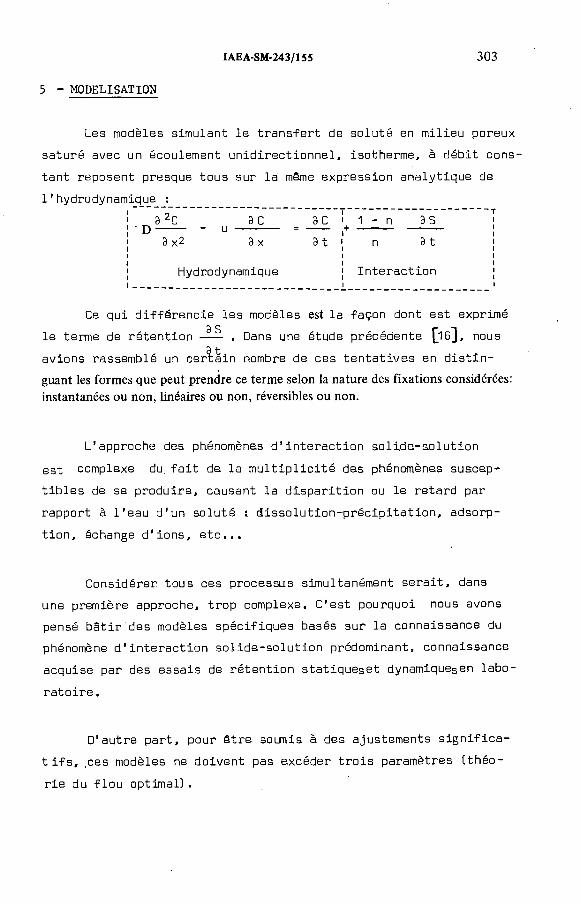
IAEA-SM-243/155 303
5 - MODELISATION
Les modèles simulant le trans fe rt de soluté en m ilieu poreux
saturé avec un écoulement un id irec tionne l, isotherme, à déb it cons
tan t reposent presque tous sur la même expression analy tique de
l'hydrodynamique :
D3 c
Эх2 Эх
Hydrodynamique
3 C
Э t
1 - n 3 S
n 31
In te rac tion
Ce qui d iffé renc ie les modèles est la façon dont est exprimé
le terme de ré ten tion . Dans une étude précédente [16], nous
avions rassemblé un certa in nombre de ces ten ta tives en d is t in
guant les formes que peut prendre ce terme selon la nature des fixations considérées:
instantanées ou non, linéaires ou non, réversibles ou non.
L’ approche des phénomènes, d 'in te ra c tio n solide-so lution
est complexe du. f a i t de la m u lt ip l ic it é des phénomènes suscep
t ib le s de se produire, causant la d isp a r it io n ou le retard par
rapport à l'e au d'un soluté : d isso lu tio n- p réc ip ita tio n , adsorp
t io n , échange d 'io n s , e t c . . .
Considérer tous ces processus simultanément se ra it , dans
une première approche, trop complexe. C'est pourquoi nous avons
pensé b â t ir des modèles spécifiques basés sur la connaissance du
phénomène d 'in te ra c t io n solide-so lution prédominant, connaissance
acquise par des essais de ré ten tion sta tiqueset dynamiquesen labo
ra to ire .
D 'autre part, pour être soirr\is à des ajustements s ig n if ic a
t i f s , ces modèles ne doivent pas excéder tr o is paramètres (théo
r ie du f lo u optimal) .

A p a r t ir de ces princ ipes, nous avons testé plusieurs
modèles phénoménologiques pour simuler la m igration de certa ins
ions à travers certa ins m ilieux poreux,en appliquant une méthode
d ’ ajustement en cascade : avant chaque essai d ’ in te rac tion dyna
mique, nous avons ré a lis é un essai avec un "bon marqueur" de
l ’ eau (phénol, io d u re . . .] . Ceci nous a permis d’ a ju s te r , indépen-
darrment de l ’ in te rac tio n , les deux paramètres □ et u de l ’ hydro
dynamique (notons qu’ en m ilieu saturé et à débit constant, u
t ie n t compte implicitement de la porosité cinématique n] .
Nous pouvons alors cho is ir des modèles ayant jusqu 'à tro is
paramètres à a jus te r pour le terme d ’ in te rac tio n .
La réso lu tion de tous les modèles que nous proposons ci-
dessous a été f a i te par d isc ré tis a t io n des équations en différences
f in ie s .
5.1. Modèle simulant l'irréversibilité de la rétention5 . 1 . 1 . E x p l i c i t a t i o n du ter m e d ' i n t e r a c t i o n
Si nous supposons que le passage en phase so lide de l ’ é lé
ment en so lu tion est irréve rs ib le (sorption irré ve rs ib le , p ré c i
p ita t io n e t c . . . ) et que la c inétique de ce trans fe rt solution-
so lide est l in é a ire , le terme de ré ten tion s 'é c r it :
Э-1 = КС Э t
D et u étant d é fin is indépendamment par un essai de marquage/
l 'é q u a tio n globale de la m igration de l ’ élément est à un seul
paramètre chimique. K.
5 .1 .2 . Application^
Pour la m igration du pertechnétate tTcO^ ) à travers le
mélange quartz-s idérite (cf .53.2 .2 .) , nous sommes dans les condi-
3 0 4 R O C H O N et al.
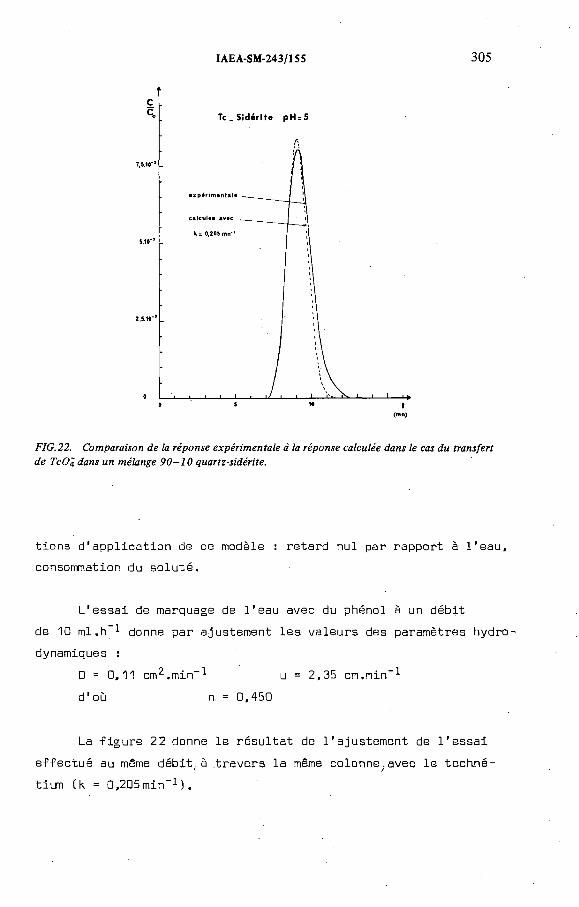
IAEA-SM-243/155 305
(mu)
FIG.22. Comparaison de la réponse expérimentale à la réponse calculée dans le cas du transfert
de TcOq dans un mélange 90-10 quartz-sidérite.
tions d 'ap p lic a tio n de ce modèle : retard nul par rapport à l 'e a u ,
consommation du so lu té .
L 'essai de marquage de l'eau avec du phénol à un débit
de 10 m l.h 1 donne par ajustement le s valeurs des paramètres hydro
dynamiques :
D = 0,11 cm2.min-1 u = 2,35 cm.min-1
d'où n. = G, 450
La fig u re 22 donne le ré su lta t de l'a justem ent de l 'e s s a i
e ffectué au même d éb it ,à travers la même colonne,avec le techné-t f
tium (k = 0,205min-1).
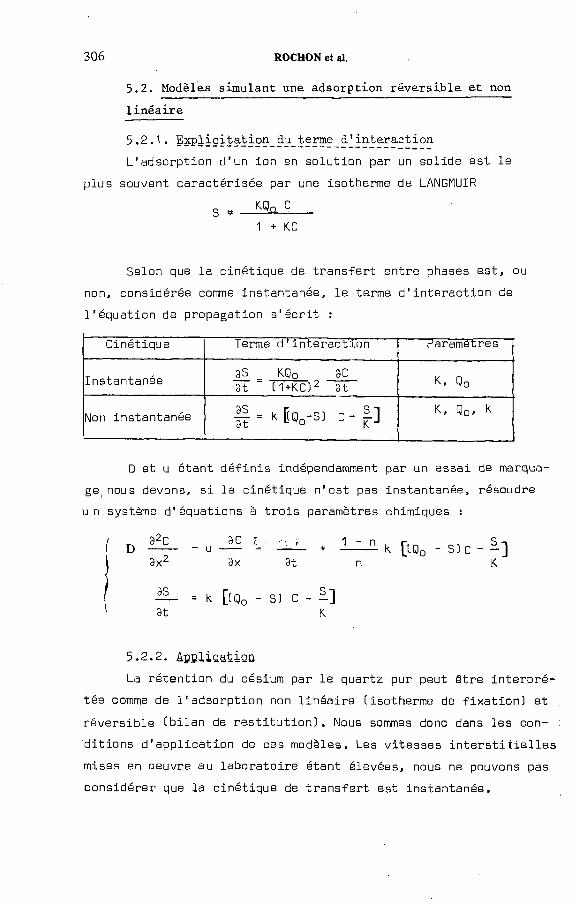
3 0 6 ROCHON et al.
5 . 2 . M odèles s im u la n t une a d s o r p t io n r é v e r s ib le e t non
l i n é a i r e
5 .2 .1 . E x p lic ita t io n du term e_d 'in teraction
L 'adsorption d ’ un ion en so lu tion par un solide est le
plus souvent caractérisée par une isotherme de LANGMUIR
1 + КС
Selon que la c inétique de transfe rt entre phases est, ou
non, considérée corrme instantanée, le terme d 'in te ra c tio n de
l ’ équation de propagation s 'é c r it :
Cinétique Terme d 'in te rac tio n Paramètres
Instantanée0S _ KQq ЭС 3t (1+KC)2 3t
K, Q0
Non instantanée f - K [ 1 V s, c - f ] K-, Qo» ^
□ et u étant d é f in is indépendamment par un essai de marqua-
ge; nous devons, s i la c inétique n’ est pas instantanée, résoudre
un système d 'équations à tro is paramètres chimiques :
3 С эс 3C 1 " n , rfr, 0 , S n---- - u --- = ----- + ------ K [[Q0 - S) c - - JЭх2 Эх 3t n K.
— = k [(Q0 - S) C - -]3t K
5 .2 .2 . Application
La ré ten tion du césium par le quartz pur peut être in te rp ré
tée comme de 1 'adsorption non lin é a ire (isotherme de f ix a tio n ) et
réversib le (b ilan de r e s t i t u t io n ) . Nous sommes donc dans les con
d itio n s d 'ap p lica tio n de ces modèles. Les vitesses in te r s t i t ie l le s
mises en oeuvre au laborato ire étant élevées, nous ne pouvons pas
considérer que la c inétique de trans fe rt est instantanée.
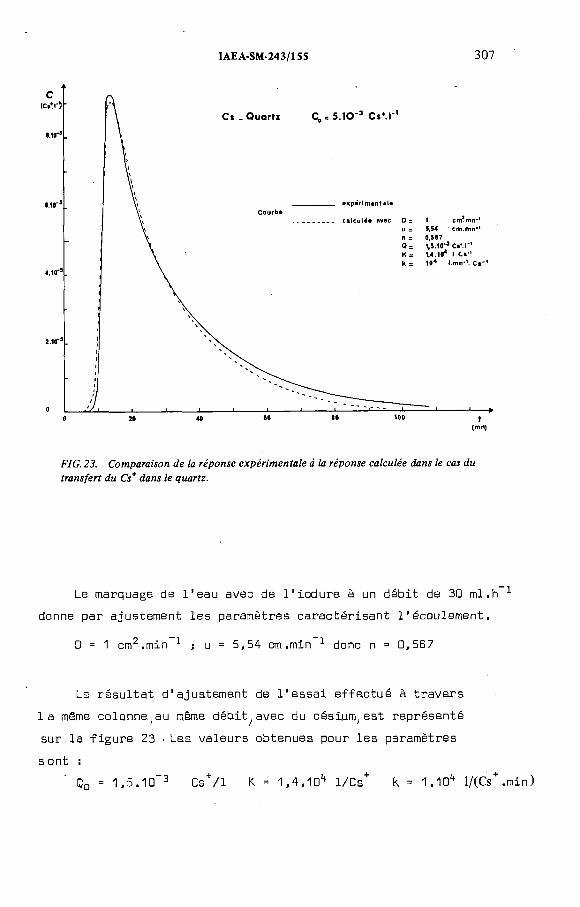
IAEA-SM-243/155 307
(«1
FIG. 23. Comparaison de la réponse expérimentale à la réponse calculée dans le cas du
transfert du Cs* dans le quartz.
Le marquage de l ’ eau avec de l 'io d u re à un déb it de 30 ml.h 1
donne par ajustement les paramètres caractérisant l'écoulem ent.
D = 1 cm2.min 1 -, u = 5,54 cm .min 1 donc n = 0,567
Le ré su lta t d'ajustement de l 'e s s a i effectué à travers
l a même colonne;au même déhit^avec du césium, est représenté
sur la f ig u re 23 • Les valeurs obtenues pour les paramètres
s ont :
Q0 = 1 ,5 . 10~3 Cs+/1 K = 1 ,4 .1o1* 1/Cs+ К = 1.10ц l/(Cs+.min)

308 ROCHON et al.
'5.3. Modèles simulant l'échange d'ions5 .3 .1 . E ^ lic ita tio n _du_ te rm e_d^ in te rac tion
Pour simuler la m igration d'un soluté avec échange d ’ ions
[19], phénomène de ré ten tion des cations prépondérant ; dans les
a rg ile s , i l fau t te n ir compte du devenir de tous les ions
ex is tan t en so lu tion et dans l ’ échangeur so lide .
Nous pouvons considérer que tous les cations en so lu tion ,
autres que le cation considéré, se comportent globalement comme
un ion unique de même chargeron t les concentrations à l'équ i-
1 ibre sont :
en solu tion A = T - C
dans 1 'échangeur F = Q0 - S
où T représente la somme de tous les cations en so lu tion et
Q0 la capacité maximale d ’ échange de l ’ échangeur.
La lo i d ’ action de masse de cet échange homovalent s 'é c r it
„ _ S. (T - C)1
C. (Q0 - S)
Cette équation peut encore se mettre sous la forme :
3 = K-m Qo C_________
T + C Km - 13 C
Lors d’ une m igration du so lu té , s i Q0 est une constante
dépendant uniquement de l ’ échangeur, la somme T des cations
en so lu tion dépend de l ’ é ta t an térieur du système.
Nous pouvons connaître la façon dont varie T en fonction
du temps an écrivant l ’ équation d ’ é le c tro n e u tra lité .
£ c a t i o n s = T = 2 a n io n s .

Une de nos hypothèses de base étant que les anions ne sont
pas retenus, nous pouvons en déduire que la somme des cations T
migre de la même façon que la somme des anions.donc que l ’ eau,
f lu id e vecteur. En supposant que les coe ffic ien ts de dispersion
cinématique sont à peu près identiques pour tous les cations,
nous pouvons écrire :
ЭТ Э2Т ЭТ— = D --- - u ----9t _ Эх2 Эх
Pour simuler la m igration du cation considéré, i l faudra
donc résoudre le système d 'équations :
IAEA-SM-243/155 309
Selon que la cinétique de transfert entre phases est, ouЭ-S
non, considérée comme instantanée , le terme d 'in te ra c tio n —
s é c r it :
C inétique Terme d ’ in te rac tion Paramètres
Instantanée$ Km Qo ч/ГуЭС £ ЭГ\
at [т ♦CKm-iK]2 at э г^m* Qo
Non
InstantanéeKm, Q0, k-
9t L Km J
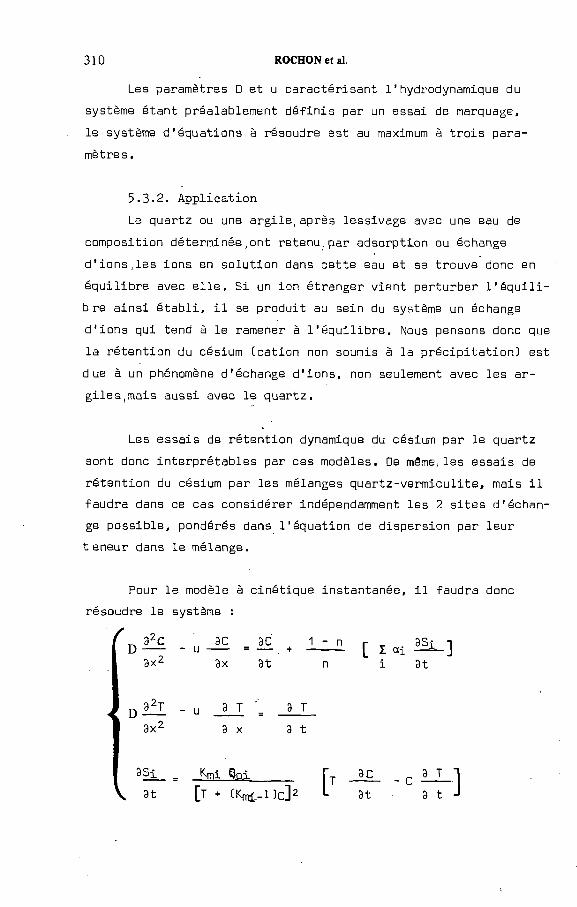
Les paramètres D et u caractérisant l ’ hydrodynamique du
système étant préalablement d é fin is par un essai de marquage,
le système d ’équations à résoudre est au maximum à tro is para
mètres.
5 .3 .2 . A pp lica tion
Le quartz ou une a rg ile ,après lessivage avec une eau de
composition déterm inée,ont retenu,par adsorption ou échange
d ’ ions ..les ions en so lu tion dans cette eau et se trouve donc en
é q u ilib re avec e l le . S i un ion étranger v ient perturber l ’ é q u i l i
bre a in s i é ta b li , i l se produit au sein du système un échange
d ’ ions qui tend à le ramener à l ’ é q u ilib re . Nous pensons donc que
la ré ten tion du césium (cation non soumis à la p ré c ip ita t io n ) est
due à un phénomène d ’ échange d ’ ions, non seulement avec les a r
g ile s ,mais aussi avec le quartz.
Les essais de ré ten tion dynamique du césium par le quartz
sont donc in te rp ré tab les par ces modèles. De mâme, les essais de
ré ten tion du césium par les mélanges quartz-verm iculite , mais i l
faudra dans ce cas considérer indépendamment les 2 s ite s d ’ échan
ge possib le , pondérés dans l ’ équation de dispersion par leur
teneur dans le mélange.
Pour le modèle à c inétique instantanée, i l faudra donc
résoudre le système :
u _ i £ = + 1 - п г ^ 9S i
310 ROCHON et al.
[ I « iЭх 3t n i 3t
32T _ u 3 T "= 3 T
Э х 3 t
_ К-mi Qoi_______ Гу Эс _ £ 3 T
3t [ ï + CKiri.-l)c]2 *- 3t 3 t

Les sim ulations des ré su lta ts obtenus pour les essais
effectués avec les mélanges quartz-verm iculite sont en cours.
E tan t donné que les v itesses in te r s t i t ie l le s (u ), u t ilis é e s pour
ces essais , sont élevées, nous u t ilis o n s le modèle qui considère
la c iné tique du trans fe rt chimique.
IAEA-SM-243/155 311
6 - CONCLUSION
Cette étude montre la grande d ive rs ité des paramètres phy
sico-chimiques à considérer dans les évaluations des modalités
de trans fe rt des radioéléments dans les m ilieux poreux.
I l fau t te n ir compte :
- de la composition de la so lu tion aqueuse
- de la concentration et de la nature du radio-élément
- de la nature et de la composition des minéraux
- des conditions opératoires
- de la nature des in te rac tio n s .
Parmi les grandeurs u t i l is é e s pour déterminer la ré ten tion
d 'un corps par un matériau, le coe ff ic ie n t de d is tr ib u tio n Kj
est très souvent employé. Toutefois, s i le Kj est nécessaire,
i l n ’est pas su ff is an t s i les paramètres précédents ne sont pas
p réc isés .
Les premiers ré su lta ts de modélisation montrent que la
conception du modèle global de trans fe rt do it d'abord passer par
l a conception d'un modèle ré a lis te pour simuler les ré ten tions .
Chëque mise au po in t de modèle de trans fe rt do it donc être précé
dée d'une reconnaissance géochimique sur le te rra in suivied'une
étude expérimentale en labo ra to ire .
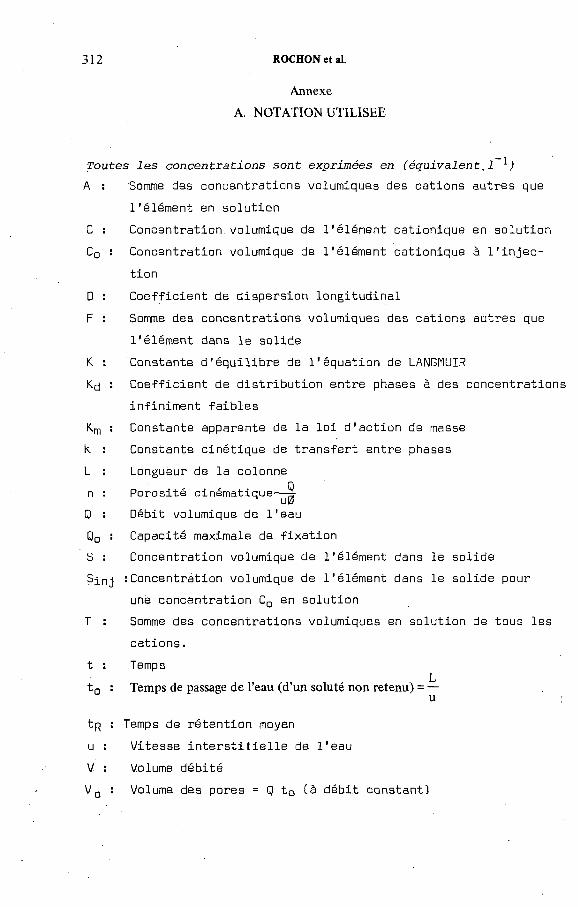
312 ROCHON et al.
Annexe
A. NOTATION UTILISEE
Toutes les concentrations sont exprimées en (éq u iv a le n t.! )
A : 'Somme des concentrations volumiques des cations autres que
l'é lém ent en so lu tion
C : Concentration.volumique de l ’ élément cationique en so lu tion
C0 : Concentration volumique de l ’ élément cationique à l ' i n j e c
tion
D : Coeffic ien t de d ispersion long itud ina l
F : Somme des concentrations volumiques des cations autres que
l'é lém ent dans le solide
K : Constante d 'é q u ilib re de l'équ a tio n de LANGMUIR
K(j : Coeffic ien t de d is tr ib u tio n entre phases à des concentrations
in fin im ent fa ib le s
K.m : Constante apparente de la lo i d 'ac tion de masse
k. : Constante c inétique de trans fe rt entre phases
L : Longueur de la colonne
n : Porosité cinématique=-j-jj^
Q : Débit volumique de l'eau
Q0 : Capacité maximale de fix a tio n
S : Concentration volumique de l'é lém ent dans le solide
Sj_nj ¡Concentration volumique de l'é lém ent dans le solide pour
une concentration C0 en so lu tion
T : Somme des concentrations volumiques en so lu tion de tous les
ca tio ns .
t : Temp sL
t Q : Temps de passage de l’eau (d’un soluté non retenu) = —u
tp : Temps de ré ten tion moyen
u : Vitesse in te r s t i t ie l le de l'e au
V : Volume débité
VQ : Volume des pores = Q t Q (à déb it constant)

V in j: Volume d 'in je c t io n
dV : Fraction volumique re c u e il lie par échan tillon
x : Abscisse ax ia le
a i : Teneur re la tiv e du minéral échangeur
0 : Diamètre de la colonne
E0 : Concentration d 'in je c t io n ramenée au volume des pores de la
colonne
y = C V i n iLo LoVq
IAEA-SM-243/155 313
REFERENCES
[1 ] R A N Ç O N , D ., L ’a s p e c t g é o c h im iq u e p o u r le s é v a lu a t io n s d e s t r a n s f e r ts d e r a d io é lé m e n ts
d a n s le s m ilie u x p o r e u x s o u te r r a in s , R a p p o r t C E A -R -4 9 3 7 ( 1 9 7 8 ) .
[2 ] A G E N C E IN T E R N A T IO N A L E D E L ’E N E R G IE A T O M IQ U E , U se o f L o c a l M in era is
in th e T r e a tm e n t o f R a d io a c tiv e s W aste s , T e c h n ic a l R e p o r ts S e rie s N o . 1 3 6 , A IE A ,
V ie n n e (1 9 7 2 ) .
[3 ] R A N Ç O N , D ., R O C H O N , J . , « R é te n t io n d e s r a d io n u c lé id e s à v ie lo n g u e p a r d iv e rs
m in é ra u x n a tu re ls » , in L a m ig ra t io n d e s r a d io n u c lé id e s à v ie lo n g u e d a n s la g é o s p h è re ,
C o m m is s io n d e s C o m m u n a u té s e u ro p é e n n e s , A g en ce d e l’O C D E p o u r l ’é n e rg ie n u c lé a ir e ,
R é u n io n d e tra v a il , B ru x e lle s , 2 9 - 3 1 ja n v ie r 1 9 7 9 .
[4 ] G R IM , R .E ., C lay M in e ra lo g y , M cG raw -H ill, L o n d o n ( 1 9 6 3 ) .
[5 ] C A IL L E R E , S ., H E N IN , S ., M in é ra lo g ie d e s a rg ile s , M asso n , P a ris ( 1 9 6 3 ) .
[6 ] S IL L E N , L .G ., S ta b i l i ty C o n s ta n ts o f M e ta l- Io n C o m p le x e s , S p e c ia l P u b l ic a t io n N o . 17 ,
T h e C h e m ic a l S o c ie ty , L o n d o n ( 1 9 6 4 ) .[7 ] S M IT H , R .M ., M A R T E L L , A .E ., C r it ic a l S ta b i l i ty C o n s ta n ts , V o l.4 : In o rg a n ic c o m p le x e s ,
P le n u m P ress , N e w Y o rk , L o n d o n ( 1 9 7 6 ) .
[8 ] G E L ’M A N , A .D ., M O S K V IN , A .I ., Z A IT S E V , L .M ., M E F O D ’E V A , M .P ., C o m p le x C o m p o u n d s o f T r a n s u ra n iu m E le m e n ts , C o n s u l ta n ts B u re a u , N e w Y o rk ( 1 9 6 2 ) .
[9 ] Y A T S IM IR S K II , K .B ., V A S IL ’E V , V .P ., I n s ta b i l i ty C o n s ta n ts o f C o m p le x C o m p o u n d s , P e rg a m o n P ress , O x f o r d , L o n d o n , N e w Y o rk , P a ris ( 1 9 6 0 ) .
[ 1 0 ] G M E L IN H A N D B U C H d e r a n o rg a n is c h e n C h e m ie , E rg a n z u n g s w e rk z u r I . A u fla g e ,
B an d 2 0 : T ra n s u ra n e , T e il D .l : C h e m ie in L ô s u n g , B erlin ( 1 9 7 5 ) .[1 1 ] P O U R B A IX , М ., A tla s d ’é q u i l ib re s é le c tr o c h im iq u e s à 2 5 ° C , G a u th ie r -V illa r s , P a ris
( 1 9 6 3 ) .[1 2 ] A L L A R D , B ., K IP A T S I, H ., T O R S T E N F E L T , B ., S o r p t io n a v la n g liv a d e r a d io n u k l id e r
i le ra o c h b e rg , D e l 2 , K .B .S ., T e k n is k R a p p o r t , S to c k h o lm ( 1 9 7 8 ) .
[1 3 ] H A R D O U IN , J . , C o n tr ib u t io n à l ’é tu d e d u c o m p o r te m e n t p h y s ic o -c h im iq u e d u
p lu to n iu m e t d e sa m ig r a t io n d a n s le m ilie u c o ra ll ie n , T h è s e d ’in g é n ie u r d ip lô m é d ’E ta t ,
C o n s e rv a to ir e n a t io n a l d e s a r t s e t m é tie r s , P a ris , 5 d é c e m b re 1 9 7 8 .[1 4 ] C O N N IC K , R .E ., G A M M IL , A .M ., J . A m . C h e m . S o c . 71 ( 1 9 4 9 ) 3 1 8 2 - 9 1 .
[1 5 ] F A U G E R A S , M .P ., H E U B E R G E R , M ., « C o m b in a is o n d u p lu to n iu m av e c le s a u tr e s
é lé m e n ts » , in P A S C A L , N o u v e a u t r a i t é d e c h im ie m in é ra le X V 3 , M a sso n , P a ris ( 1 9 6 2 ) .
R O C H O N , J . , P ro p a g a t io n d e s u b s ta n c e s m is c ib le s e n in te r a c t io n p h y s ic o -c h im iq u e
av ec le s u b s t r a t , A p p ro c h e s im p lif ié e p o u r l ’u t i l i s a t io n e n h y d ro g é o lo g ie , T h è se de
d o c te u r - in g é n ie u r e n c h im ie m in é ra le -p h y s iq u e , I n s t i t u t n a t io n a l p o ly te c h n iq u e de
G re n o b le , 25 ja n v ie r 1 9 7 8 .
B A R , D ., C A U D E , M ., R O S S E T , R ., A n a ly s is 4 3 ( 1 9 7 6 ) 1 0 8 - 1 4 .
G O L U B E V , V .S ., G A R IB Y A N T S , A .A ., H e te r o g e n e o u s p ro c e ss e s o f g e o c h e m ic a l
m ig r a t io n , C o n s u l ta n ts B u re a u , N e w Y o rk , L o n d o n (1 9 7 1 ) .
R O C H O N , J . , « E c h a n g e c a t io n iq u e a u c o u rs d ’u n é c o u le m e n t u n id ir e c t io n n e l e n m ilie u
p o r e u x s a tu r é : s o lu t io n n u m é riq u e » , in L ’u t i l i s a t io n d e s m a té r ia u x a rg ile u x p o u r
l’i s o la t io n d e s d é c h e ts r a d io a c t i f s , A g en ce d e l’O C D E p o u r l’é n e rg ie n u c lé a ir e , R é u n io n
d e tra v a il , P a ris , 10 —12 s e p te m b r e 1 9 7 9 .
ROCHON et al.
DISCUSSION
C.N. MURRAY : In any experimental investigations on the possible
environmental behaviour of actinides the basic conditions of the experiments
must be very carefully considered (and defined) in order to make sure that
interpretation of any results can be carried out without too much ambiguity.
Considering the large amount of important interpretation you have given,
I should be interested in the details of certain points: The Pu was added to the
experimental system in the IV form. How was this controlled and what was
the isotope? In Fig.4 you present data on the variation of particulate formation
(for actinides) with pH. Particle formation has been shown to depend not only
on the water chemistry but also on how it was treated (filtration) before conta
mination. How were your water samples handled: Did you consider Eh?
J. ROCHON: Mr. Rançon would be better able to reply to your questions.
However in so far as the last part is concerned, I can inform you that we have
systematically measured the Eh for the experiments carried out with the fission
products Tc and Sm.
D.L. RANÇON: The 239Pu used was, in principle, in valency state IV.
Because of the nature of experiments in columns, we could not know in what
form (degree of oxidation, complexes, hydroxides etc) it was in solution in the
numerous samples collected. We arrived at an overall result; the presence of two
forms of Pu, called the mobile and immobile forms, was confirmed by a large
number of experiments on a variety of materials. This result which was used in
the migration studies calls for an explanation, and we shall try to find it. However,
any study has to have a beginning. We would be interested if you could indicate
a simple and rapid method for solving the complicated problems of the behaviour
of Pu in solution in a porous medium.
[1 6 ]
[1 7 ]
[1 8 ]
[1 9 ]
314
IAEA-SM-243/108
TRANSPORT MECHANISMS AND RATES OF
TRANSPORT OF RADIONUCLIDES
IN THE GEOSPHERE AS RELATED
TO THE SWEDISH KBS CONCEPT
I. NERETNIEKS
Department of Chemical Engineering,
Royal Institute of Technology,
Stockholm, Sweden
Abstract
TRANSPORT MECHANISMS AND RATES OF TRANSPORT OF RADIONUCLIDES IN THE GEOSPHERE AS RELATED TO THE SWEDISH KBS CONCEPT.
The bedrock investigated in the KBS project has a permeability of less than 1СГ9 m/s at the depths and in the areas of interestfor disposal ofradioactive waste. The water flow rate will typically be 0.2 ltr/m2 per year in the bedrock surrounding the repository. The diffusion resistances, which have been measured in the buffer material and in the laminar water in the fissures, strongly limit the amount of water which can leach the glass or uranium oxide matrix. They also severely limit the amount of oxidants which can reach a copper capsule in the KBS concept for disposing of unreprocessed fuel. This capsule is nearly 5 m long with a diameter of 0.75 m and it is placed in a hole of diameter 1.5 m. The buffer material is a strongly compacted bentonite clay. The capsule contains about 1.4 tonnes of U 02. Such a capsule will be ‘reached’ by less than 1 litre of water per year. The time needed to corrode through the 20 cm copper wall is in the range of many millions of years. Similar periods of time are needed to dissolve the uranium oxide matrix in this concept and also to dissolve the glass matrix of reprocessed waste. The bentonite buffer surrounding the canister is a strong cation exchanger. The diffusion of ^Sr, 137Cs and M1Am will be so retarded that they will decay by a factor of more than 10~7 during their transport in the buffer. The rock has also been found to have strong sorbing properties. Under the reducing conditions in the repository Np, U and Pu will travel 1 mm or less per year in the fissures in the rock.
1. INTRODUCTION
In late 1976 work was started in Sweden to design a finalrepository for spent fuel from the 6 operating and 7 planned nuclear reactors. Two concepts were investigated. In the first the spent fuel is to be reprocessed in France.whereby about 99.9% of the uranium and 99.5% of the plutonium is separated out. The waste is shipped back to Sweden in vitrified form and placedin canisters. The second concept is to deposit canisters with the spent fuel rods without reprocessing. The repository is ingranitic rock at 500 m depth. It consists of a series of paral-
olel tunnels covering an area of roughly 1 km • Hie canisters
315

316 NERETNIEKS
FIG .l. The sealed final repository. The canister is surrounded in the storage hole by highly
compacted bentonite. The gaps are filled with bentonite powder. The tunnel is filled with
a mixture of quartz sand and bentonite. A copper plate can, if desired, be placed on top
of the bentonite block to serve as a diffusion barrier. Dimensions are in mm.

IAEA-SM-243/108 317
are placed in boreholes in the floor in the tunnels. The tunnels are filled with a backfill consisting of 10-20% bentonite clay and 80-90% quartz sand. The holes are also backfilled.
The details of the canisters and backfill are shown in Fig. 1 for the vitrified waste and Fig. 2 for the spent fuel.For the vitrified waste, the canister consists (from the outside in) of titanium 6 mm, lead 100 mm, and stainless steel 3 mm.The backfill is 10% bentonite and 90% quartz. For the spent fuel, the canister is a 200 mm thick walled copper canister and the backfill is a compacted bentonite.
2. BARRIERS
Fig. 3 shows the activity of various radionuclides in aspent fuel. It is seen that after a million years there isabout 20 Ci/ton activity still in the fuel.1 The vitrifiedwaste has about the same amount of the short-lived isotopes 1 3 7 9 0C s , Sr, and Am but is very much lower on the long-lived Pu.
OQAlso li3i is taken out during the reprocessing..
For the radionuclides to leave the repository and reach the biosphere they must penetrate the following barriers, or the barriers must break down: canister, waste form, buffer material, and bedrock.
Such disruptive events as major earthquakes, large meteorites, and other very improbable events are excluded in this paper. The "normal" events leading to a radionuclide escaping from the repository are:
о penetration of the canister by corrosion;о leaching of the nuclide from the waste;о penetration of the backfill; andо transport out to the biosphere.
In the first mechanism corrosive agents coming from the backfill material itself or the water flowing past outside the backfill must get through the backfill and reach the canister. Both lead and copper are stable in pure water at the pH which is expected in the repository [1]. The corrosion thus will depend on how many corrosive agents can reach the canister. This depends on the water flow rate near the canister and the concentration of corrosive agents in the water.
The leaching of the nuclides is governed by either of two mechanisms: either the matrix as a whole dissolves and simultaneously releases the radionuclide, or the nuclide is released
1 Tons are metric.

318 NERETNIEKS
FIG.2. Encapsulated waste cylinder with vitrified high-level waste in a sealed final
repository. Dimensions are in mm.
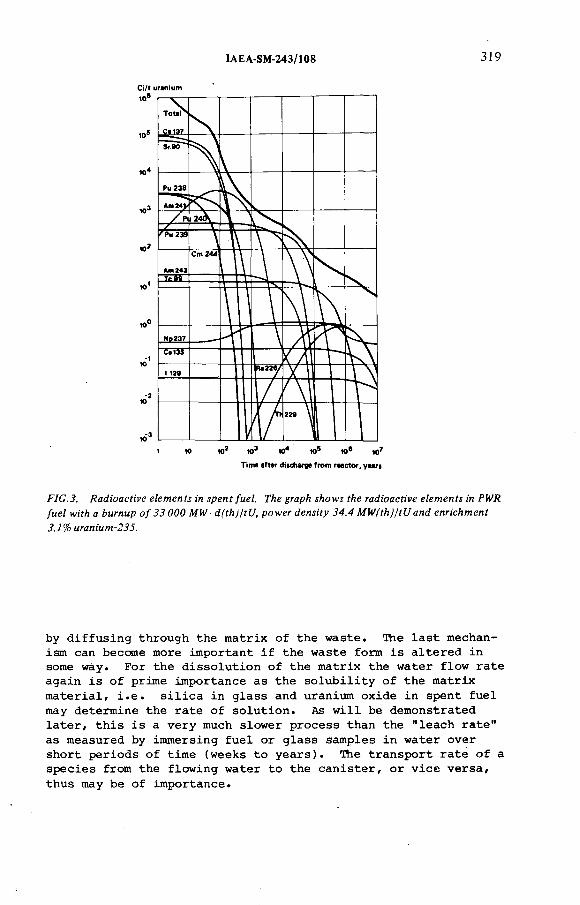
IAEA-SM-243/108 319
1 Ю 10J Ю3 to4 10* 10е to*Time after discharge from reactor, years
FIG.3. Radioactive elements in spent fuel. The graph shows the radioactive elements in PWR
fuel with a burnup of 33 ООО MW ■ d(thj/tU, power density 34.4 MW(th)/tUand enrichment
3.1% uranium-235.
by diffusing through the matrix of the waste. The last mechanism can become more important if the waste form is altered in some way. For the dissolution of the matrix the water flow rate again is of prime importance as the solubility of the matrix material, i.e. silica in glass and uranium oxide in spent fuel may determine the rate of solution. As will be demonstrated later, this is a very much slower process than the "leach rate" as measured by immersing fuel or glass samples in water over short periods of time (weeks to years). Hie transport rate of a species from the flowing water to the canister, or vice versa, thus may be of importance.

320 NERETNIEKS
-Capsule -Clay in hole
Clay-filledfissures
FIG.4. Arrangement of canister and clay in the repository.
3. TRANSPORT OF SPECIES TO AND FROM A CANISTER
In order to be able to estimate the magnitude of this mass transport, the borehole with surrounding fissures has been assumed to conform to the model illustrated in Fig. 4. In the cal culations, the fissures have been assumed to run perpendicular to the axis of the borehole and to be of infinite length. Other orientations have also been studied. The width of the fissures and their internal spacing have been assigned different values on the basis of measurements of the permeability of the undisturbed rock. Clay from the borehole is assumed to have penetrated out into the fissure to a certain distance.
3.1 Flow
Beyond the clay in the fissures, the groundwater flows at a velocity which is determined by the hydraulic gradient (i m/m), the permeability of the rock (Kp m/s), and the porosity of the rock (e m 3 fissures/m3 rock) in accordance with Darcy's equation
Up = Kp . i/e m/s (1)The permeability of the clay is-much lower than that of the fissured host rock [2]s
Kp < 10“13 m/s
3.2 Diffusion
Besides flow when the entire mass of liquid moves, mass transport can take place by the diffusion of individual substances under the influence of a concentration gradient. The diffusion rate depends on the nature of the substances.
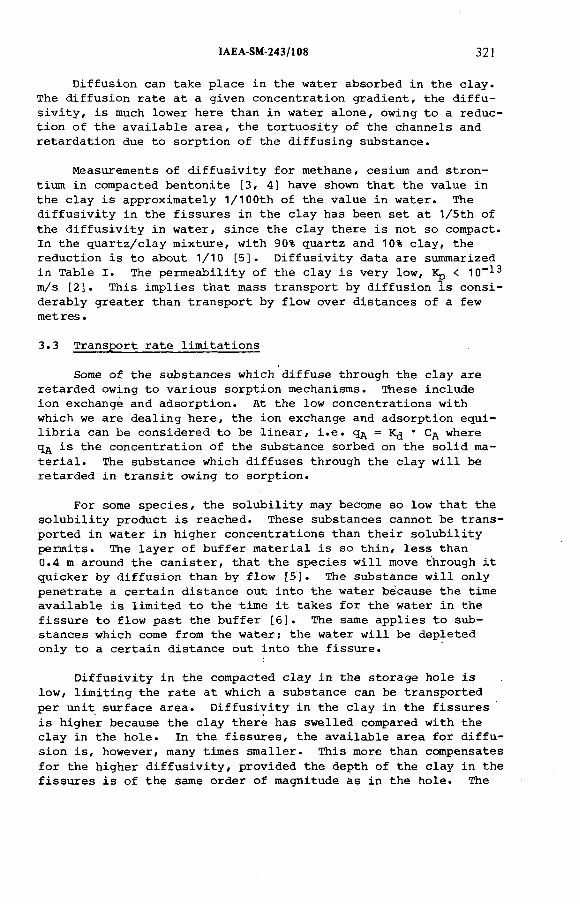
IAEA-SM-243/108 321
Diffusion can take place in the water absorbed in the clay. The diffusion rate at a given concentration gradient, the diffusivity, is much lower here than in water alone, owing to a reduction of the available area, the tortuosity of the channels and retardation due to sorption of the diffusing substance.
Measurements of diffusivity for methane, cesium and strontium in compacted bentonite [3, 4] have shown that the value in the clay is approximately 1/100th of the value in water. The diffusivity in the fissures in the clay has been set at 1/5th of the diffusivity in water, since the clay there is not so compact. In the quartz/clay mixture, with 90% quartz and 10% clay, the reduction is to about 1/10 [5]. Diffusivity data are summarizedin Table I. The permeability of the clay is very low, Kjp < 10- *3m/s [2]. This implies that mass transport by diffusion is considerably greater than transport by flow over distances of a few met res.
3 . 3 Transport rate limitations
Some of the substances which diffuse through the clay are retarded owing to various sorption mechanisms. These include ion exchange and adsorption. At the low concentrations with which we are dealing here, the ion exchange and adsorption equilibria can be considered to be linear, i.e. Чд = • Сд whereqA is the concentration of the substance sorbed on the solid material. The substance which diffuses through the clay will beretarded in transit owing to sorption.
For some species, the solubility may become so low that the solubility product is reached. These substances cannot be transported in water in higher concentrations than their solubility permits. The layer of buffer material is so thin, less than0.4 m around the canister, that the species will move through it quicker by diffusion than by flow [5]. The substance will only penetrate a certain distance out into the water because the time available is limited to the time it takes for the water in the fissure to flow past the buffer [6]. The same applies to substances which come from the water; the water will be depleted only to a certain distance out into the fissure.
Diffusivity in the compacted clay in the storage hole is low, limiting the rate at which a substance can be transported per unit surface area. Diffusivity in the clay in the fissures is higher because the clay there has swelled compared with the clay in the hole. In the fissures, the available area for diffusion is, however, many times smaller. This more than compensates for the higher diffusivity, provided the depth of the clay in the fissures is of the same order of magnitude as in the hole. The

OJtoto
TABLE I. DIFFUSIVITIES Dpe FOR COMPACTED BENTONITE CLAY AND A
QUARTZ/CLAY MIXTURE '
Waterquartz/clay 90%/10%
Clay 1.9 g/cm *
(estimated)
Clay 2.1 g/cm*
Clay in fissures (estimated)
Relativediffusivity
1 1/10 1/50 1/100 1/5
Diffusivity at 50° С m 2/s for C>2
3.9 • 10-9 3.9 * 10-10 7.8 * 10"11 3.9 * 10-11 7.8 * 10-10
Anion 3.9 • 10-9 3.9 * 10-10 7.8 • 10"11 3.9 * 10-11
О■41О00r-
Cation 2.0 • 10-9
©pH!о•оCN 4.0 • 10"11 2.0 * 10- n О О 1 t—*
О
* The density is measured on compacted air dry clay with about 10% water. Diffusivities are measured on completely wetted clay.
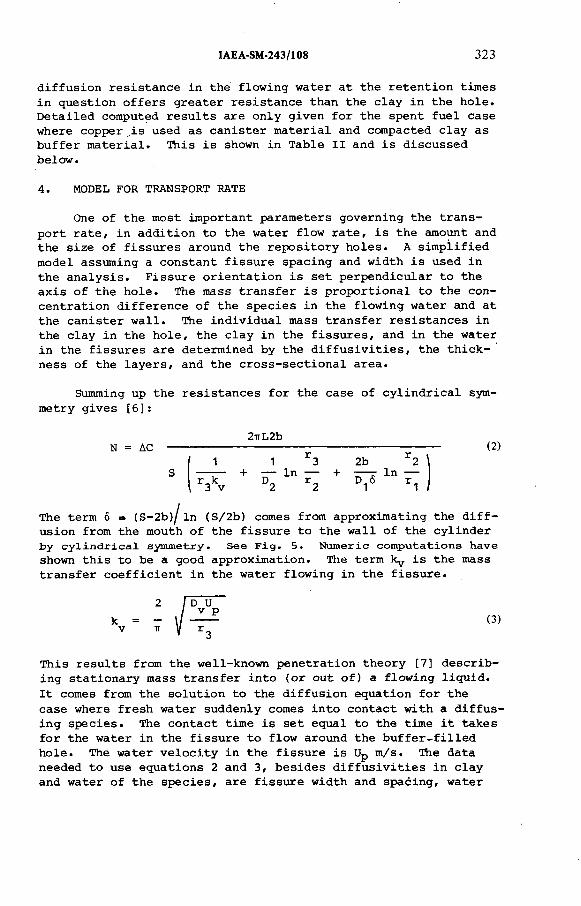
IAEA-SM-243/108 323
diffusion resistance in the flowing water at the retention times in question offers greater resistance than the clay in the hole. Detailed computed results are only given for the spent fuel case where copper ,is used as canister material and compacted clay as buffer material. This is shown in Table II and is discussed below.
4. MODEL FOR TRANSPORT RATE
One of the most important parameters governing the transport rate, in addition to the water flow rate, is the amount and the size of fissures around the repository holes. A simplified model assuming a constant fissure spacing and width is used in the analysis. Fissure orientation is set perpendicular to the axis of the hole. The mass transfer is proportional to the concentration difference of the species in the flowing water and at the canister wall. The individual mass transfer resistances in the clay in the hole, the clay in the fissures, and in the water in the fissures are determined by the diffusivities, the thickness of the layers, and the cross-sectional area.
Summing up the resistances for the case of cylindrical symmetry gives [6]:
2nL2bN = ЛС --------------------------------------------- (2)
1 1 Г3 2b Г 2— ;— + ТГ* ln — + 7ГТ ln —r3kv 2 Г2 V г 1
The term <5 » (S-2b)/ ln (S/2b) comes from approximating the diffusion from the mouth of the fissure to the wall of the cylinder by cylindrical symmetry. See Fig. 5. Numeric computations have shown this to be a good approximation. The term ky is the mass transfer coefficient in the water flowing in the fissure.
(3)
This results from the well-known penetration theory [7] describing stationary mass transfer into (or out of) a flowing liquid.It comes from the solution to the diffusion equation for the case where fresh water suddenly comes into contact with a diffusing species. The contact time is set equal to the time it takes for the water in the fissure to flow around the buffer-filled hole. The water velocity in the fissure is Up m/s. The data needed to use equations 2 and 3, besides diffusivities in clay and water of the species, are fissure width and spacing, water
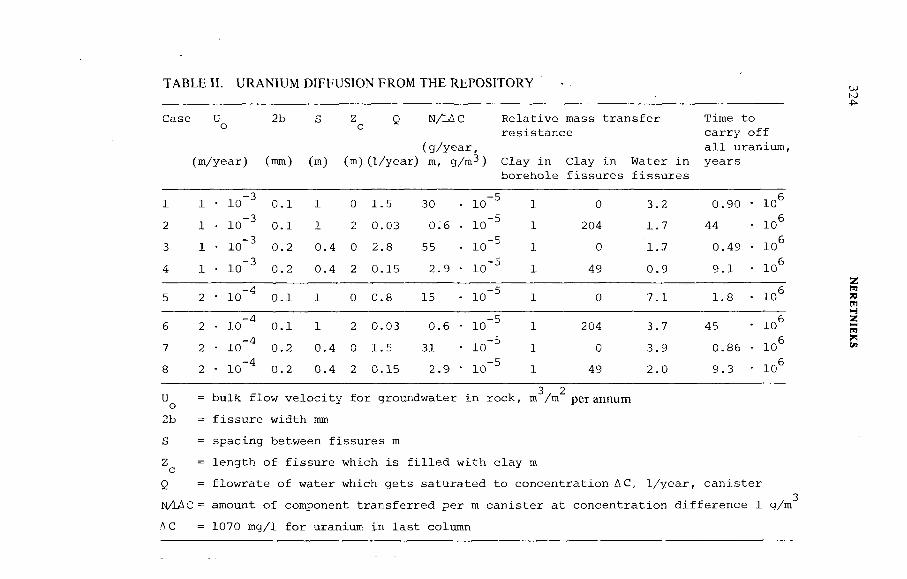
T A B L E I I . U R A N IU M D IF F U S IO N F R O M T H E R E P O S IT O R Y
Case U 2b S Z O N/LAC Relative mass transfer Time to° с . . „resistance carry off
(g/year, all uranium,(m/year) (mm) (m) (m) (1/year) m, g/m^ ) Clay in Clay in Water in years
borehole fissures fissures
1 1
Г01о
1—1 0.1 1 0
LOH
30 l o ' 5 1 0 3.2 0.90 io 6
2 1
CO1о1—1 0.1 1 2 0.03 0.6 10-5 1 204 1.7 44 106
3 1 lo " 3 0.2 0.4 0 2.8 55 10-5 1 0 1..7 0.49 106
4 1 l o ' 3 0.2 0.4 2 0.15 2.9
? о
1—1 1 49 0.9 9.1 106
5 2
1О
1—1 0.1 1 0 0.8 15
m :
i i
о
1—1 1 0 7.1 1.8 106
6 2 io 4 0.1 1 2 0.03 0.6
Ю1Оi—1 1 204 3.7 45 106
7 2 l o ' 4 0.2 0.4 0 1.5 31 l o ' 5 1 0 3.9 0.86 106
8 2 10-4 0.2 0.4 2 0.15 2.9
in1О
1—1 1 49 2.0 9.3 106
U = bulk flow velocity for groundwater in rock, m /m per annumо2b = fissure width mmS = spacing between fissures mZ^ = length of fissure which is filled with clay mQ = flowrate of water which gets saturated to concentration ДС, 1/year, canisterryLAC = amount of component transferred per m canister at concentration difference 1 g/mЛС = 1070 mg/1 for uranium in last column
324 N
ERETN
IEKS
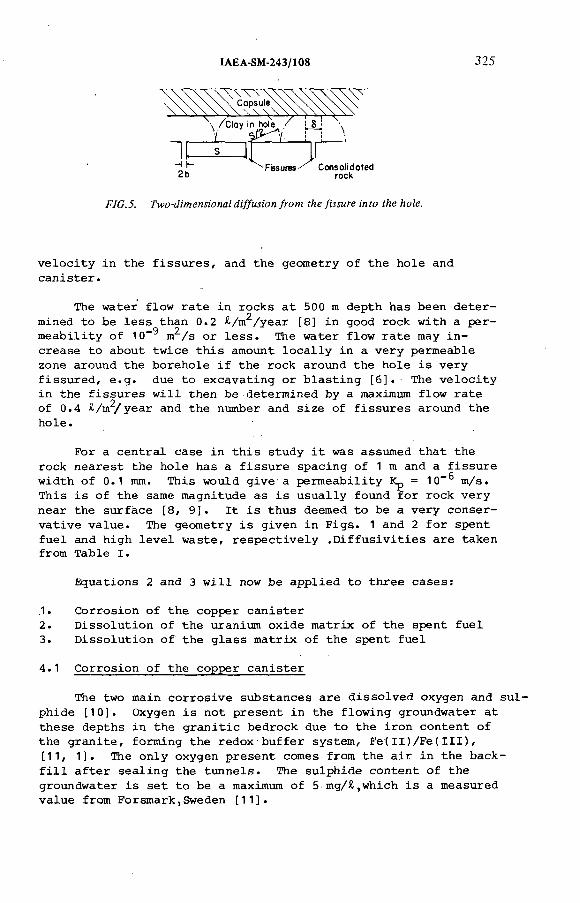
IAEA-SM-243/108 325
Fissures Consolidoted rock
FIG.5. Two-dimensional diffusion from the fissure into the hole.
velocity in the fissures, and the geometry of the hole and canister.
The water flow rate in rocks at 500 m depth has been determined to be less than 0.2 £/m2/year [8] in good rock with a per-
Q Оmeability of 10 m /s or less. The water flow rate may increase to about twice this amount locally in a very permeable zone around the borehole if the rock around the hole is very fissured, e.g. due to excavating or blasting [6]. The velocity in the fissures will then be determined by a maximum flow rate of 0.4 &/m2/year and the number and size of fissures around the hole.
For a central case in this study it was assumed that the rock nearest the hole has a fissure spacing of 1 m and a fissure width of 0.1 mm. This would give a permeability Kp = 10” ® m/s.This is of the same magnitude as is usually found for rock very near the surface [8, 9]. It is thus deemed to be a very conservative value. The geometry is given in Figs. 1 and 2 for spent fuel and high level waste, respectively .Diffusivities are taken from Table I.
Equations 2 and 3 will now be applied to three cases:
1. Corrosion of the copper canister2. Dissolution of the uranium oxide matrix of the spent fuel3. Dissolution of the glass matrix of the spent fuel
4.1 Corrosion of the copper canister
The two main corrosive substances are dissolved oxygen and sulphide [10]. Oxygen is not present in the flowing groundwater at these depths in the granitic bedrock due to the iron content of the granite, forming the redox buffer system, Fe(II)/Fe(III),[11, 1]. The only oxygen present comes from the air in the backfill after sealing the tunnels. The sulphide content of the groundwater is set to be a maximum of 5-mg/ Я ,which is a measured value from Forsmark,Sweden [11].
326 NERETNIEKS
With these data and the assumption that all sulphide which reaches the copper immediately reacts, it would take nearly 40 million years to corrode away 1 cm of copper evenly around the canister. As there may be some pitting with a pitting factor of up to 25 [12], this would be the life expectancy due to corrosion. The calculations were done for a case where there is no clay in the fissures. The only resistances are the diffusion in t h e 'clay in the hole and the diffusion in the slowly flowing water.
4.2 Dissolution of the uranium oxide matrix
In one canister there are about 1.4 tons of spent fuel;95% of this is uranium oxide. Except for some iodine and cesium which have migrated to the pellet surface to some degree, most nuclides are evenly distributed within the pellet. These will be released either by migration through the matrix of the pellets or when the matrix dissolves. Leach tests of up to 2 years in the laboratory [13, 14, 15] indicate that dissolution rates can be expected to be 10“ ®*- 10“7 g/cm2/day. This would indicate a dissolution time of a few thousand to a few tens of thousands of years, if all pellets were exposed at the same time and did not increase their surface. These experiments take no account of the amount of water which must be available to dissolve the pellet. Results from application of the model equations 2 and 3 to this case are given in Table II. The central case is case 5. The concentration difference ДС is set equal to the highest conceivable concentration of uranium in the type of groundwaters which can be expected. The solubility is determined by the content of carbonate ions which form strong complexes with hexavalent uranyl ions [16]. With a maximum carbonate content of 550 mg/i., the uranium solubility might be as high as 1070 mg/Я. Observed values around uranium mines show much lower values: 9 mg/A [17].
In the central case, the amount of water Q which encounters the canister is 0.8 i/year, This is the amount which gets saturated to concentration ДС. In this case, it would take 1.8 million years to dissolve the contents of one canister. The table also shows that a five-fold increase in flow-rate coupled to a 2.5-fold decrease in fissure spacing and a 2-fold increase in fissure width (case 5) increases the dissolution rate by only a factor of 4. Various other combinations of fissure widths, flow- rates, fissure spacings, and clay depths in fissures have also been investigated. Some are shown in Table II.
The main resistance to mass transfer in the central case is in the water in the fissure. This resistance is 7 times larger
IAEA-SM-243/108 327
than the resistance in the clay in the hole. If the fissures could be injected with clay 2 m deep (case 6), as compared to the central case, dissolution time would increase to 45 million years. Electrokinetic injection of montmorillonite clay in fissures in rock has been proved to be possible [18].
The dissolution rate of the spent fuel is very much influenced by the very large change of solubility of uranium as it changes from the + VI state to the + IV state. Solubility decreases by nearly 5 orders of magnitude to 0.05 тд/Я. This can be calculated from thermodynamic data [16] and is also seen around some uranium deposits where the environment changes from oxidizing to reducing conditions [17, 19]. If this lower solubility is used instead in equation 2, the dissolution rates increase to tens of billions of years. Such time spans lose meaning.
These very large dissolution times, millions of years, even in the very conservative cases as given in Table II, are deemed to be much more relevant than those obtained by measuring leach rates of fuel pellets in the laboratory. They may not, however, determine the leach rate of the radionuclides,as these may m i grate faster in the matrix than the matrix dissolves. No data for migration at ambient temperature of the species of interest, or similar species in uranium-oxide pellets have been found in the literature. Solid state diffusion, however, normally is very slow and may not be much faster than the matrix dissolution. As can be seen from this analysis, there is a lack of knowledge on a potentially major factor governing the leach rate of spent fuel.
4.3 Dissolution of the glass matrix in vitrified waste
The same applies to the leaching of the glass of the vitrified high-level waste. The time to dissolve all the glass in a canister, under the same conditions as in case 5, is 12 million years. The solubility of the silica which is the main constituent of the glass is then set at 100 mg/Z.
In the safety analysis in the KBS studies [20, 21], for themain cases, dissolution times for the glass was taken to be30 000 years, and for the uranium oxide, 500 000 years.
5. DECAY OF RADIONUCLIDES DURING TRANSPORT THROUGH THE BUFFER
The nuclides migrate by diffusion in the bentonite buffer. Some nuclides diffuse without interacting much with the benton-1 О Q q Qite. Among these are I and Tc under oxidizing conditions.
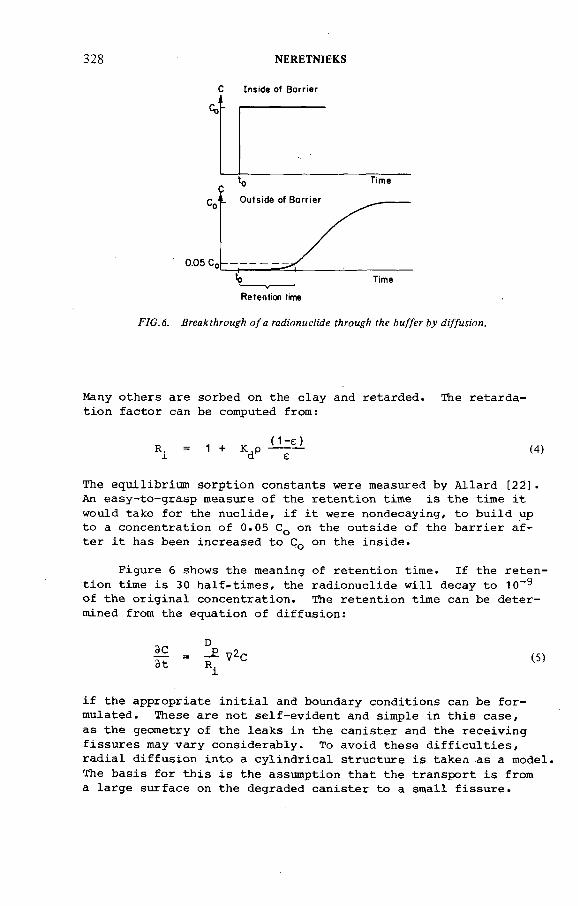
328 NERETNIEKS
C In s id e o f B a r r ie r
FIG. 6. Breakthrough o f a radionuclide through the buffer by diffusion.
Many others are sorbed on the clay and retarded. The retardation factor can be computed from:
Ri = 1 + V - ^ T 1 {4)
The equilibrium sorption constants were measured by Allard [22]. An easy-to-grasp measure of the retention time is the time it would take for the nuclide, if it were nondecaying, to build upto a concentration of 0.05 CQ on the outside of the barrier after it has been increased to C0 on the inside.
Figure 6 shows the meaning of retention time. If the retention time is 30 half-times, the radionuclide will decay to 10- of the original concentration. The retention time can be determined from the equation of diffusion:
ЭС = D
' V Z C ( 5 )3t R.i
if the appropriate initial and boundary conditions can be formulated. These are not self-evident and simple in this case, as the geometry of the leaks in the canister and the receiving fissures may vary considerably. To avoid these difficulties, radial diffusion into a cylindrical structure is taken as a model. The basis for this is the assumption that the transport is from a large surface on the degraded canister to a small fissure.

IAEA-SM-243/108 329
For such a case, the solution to equation 5 gives the following approximate but simple expression for determining the retention time [7, 5].
0.1Z2R.l
where Z is the thickness of the barrier. This expression will underestimate the time because it assumes that the migration is over the shortest distance.
Table XII shows the retention times for the most important nuclides as well as their half-lives. The table has been computed for retardation factors based on Allard's et al. [22] measurements for a compacted clay barrier 0.37 m thick. 9^Sr and241 Am have retention times larger than 45 half-lives. This means
—9 7that they will decay to less than 10 during their migration through the clay. ■l-^7Cs will decay to 10~7 . This is for all practical purposes to be considered as total decay. All other nuclides will eventually break through the barrier although it will take considerable time.
6 RADIONUCLIDE MIGRATION THROUGH THE ROCK
The rock proposed for the repository is granite with low porosity and permeability. The water will flow in fissures in the rock. These may be fairly far apart, many metres. This means that it cannot be safely assumed, at present, that all the rock matrix can be contacted by the water and utilized for sorbing the nuclides. In the KBS study, the conservative assumption had to be used that all flow was in fissures and that the interaction of the nuclides with the rock was a surface reaction, utilizing only the fissure surfaces for reaction. This gives much higher water velocities, as can be seen from equation 4 , where £ is the volume of the fissures per volume of rock, the effective porosity. The porosity of the matrix is not utilized for water flow in this model.
It has not been possible to measure the porosity of the rock in situ. Even if this were possible, difficulties would arise in determining how large a portion of the fissures is closed and is therefore unable to conduct the water.
Various evaluations of the porosity accessible to the flowing water have led to values between 10~^ and 5 • Ю -*’[23, 5]. These evaluations have been carried out with the aid of a model proposed by Snow [9]. In this model, the fissures in the rock are described as equidistant channels with parallel
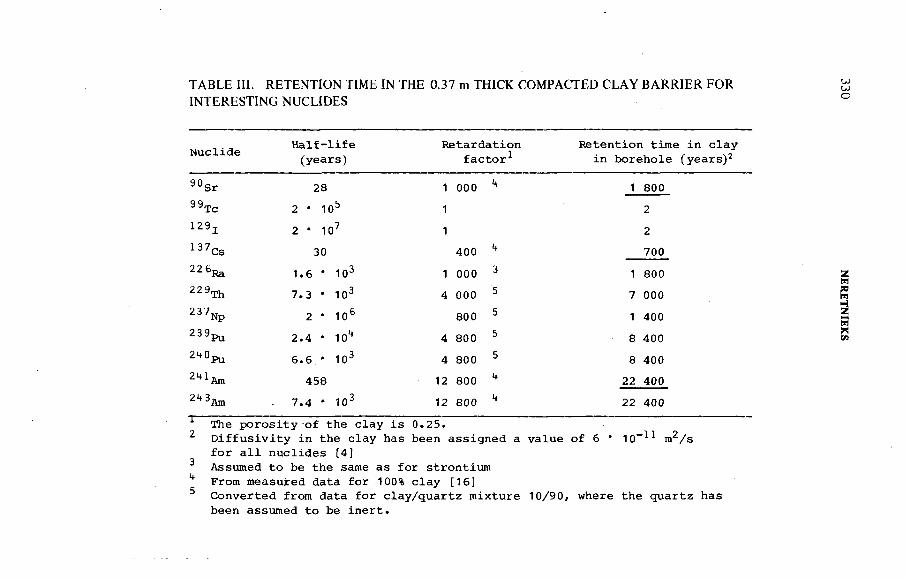
TABLE III. RETENTION TIME IN THE 0.37 m THICK COMPACTED CLAY BARRIER FOR
INTERESTING NUCLIDES
Nuclide Half-life(years)
Retardationfactor*
Retention time in clay in borehole (years)2
90Sr 28 1 000 4 1 80099Tc 2 • 105 1 2129 j 2 * 107 1 2137CS 30 400 4 700226Ra 1.6 * 103 1 000 3 1 800229Th 7.3 • 103 4 000 5 7 000237Np 2 * 106 800 5 1 400239Pu 2.4 • 10Ц 4 800 5 8 400240Ри 6.6 * 103 4 800 5 8 40021tlAm 458 12 800 4 22 4002“ 3Am 7.4 * 103 12 800 4 22 400
The porosity of the clay is 0.25.2 Diffusivity in the clay has been assigned a value of 6 • 10-1 m 2/s
for all nuclides [4]3 Assumed to be the same as for strontium ^ From measured data for 100% clay [16] Converted from data for clay/quartz mixture 10/90, where the quartz has
been assumed to be inert.

IAEA-SM-243/108 331
walls and of equal width. The values for fissure spacing and fissure widths have been estimated on the basis of water injection measurements [24, 23]. which give measured permeability values of about 10 m/s in good rock. Typical values for fissure widths 2b = 0.01 mm, spacings S are on the metre scale. For the calculations, a main case of S = 1m and 2b = 0.01 m m was chosen.
The fissure width is indirectly computed from the Snow model [9], which assumes laminary flow between 2 parallel flat plates. In such a case, the velocity is given by:
gU = — * (2b)2 i (?)p 12V
With the surface reaction assumption and for linear, reversiblesorption the nuclide velocity is
UU. = -------- ^ ---— (8)1 1 + К a J— —a £
Ka is a surface equilibrium constant and "a" the surface area available for sorption per volume of rock. For e << 1 and whenKaa(1-e)/e >> 1, a combination of Equations (8) and (1)gives:
К iU. = - f- (9)i К aa
The transport velocity of the nuclide, U¿, is thus dependent only upon the measured quantities Kp and Ka and the gradient, i, as well as the size of the fissure surface per rock volume a (m2/m^). It is independent in fissure width and porosity except by their indirect influence on the permeability.
7. EQUILIBRIUM DATA
Allard et al. [22, 16], have performed measurements for two different water compositions with 14 different elements including radium and the actinides thorium, uranium, neptunium, plutonium and americium. Besides measurements on clay and finely crushed granitic rock, adsorption on larger rock surfaces has also been carried out.
The measurements which are reported in [22] were all performed under oxidizing conditions. Later measurements under reducing conditions exhibit appreciably higher equilibrium constants for uranium and technetium [16].
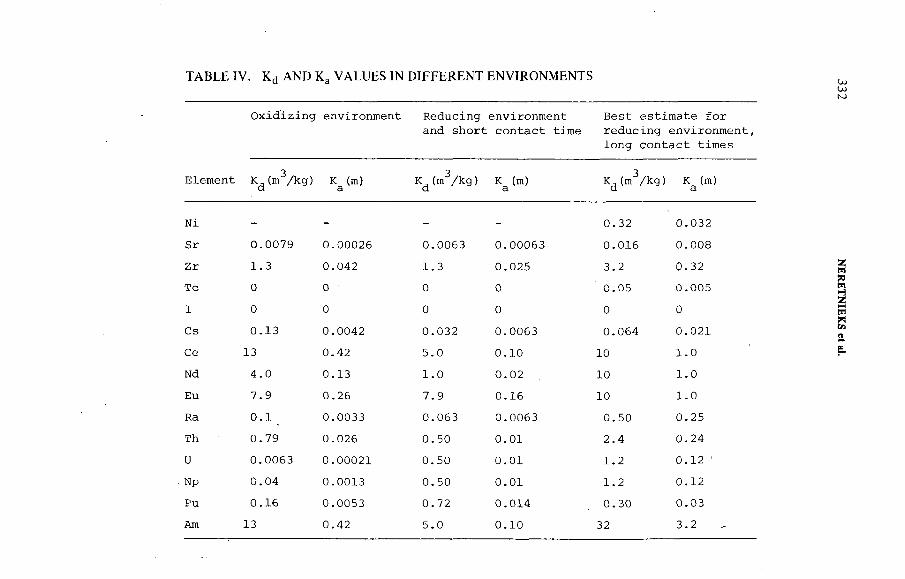
T A B L E IV . K d A N D K a V A L U E S IN D IF F E R E N T E N V IR O N M E N T S
Oxidizing environment Reducing environment Best estimate forand short contact time reducing environment,
long contact times
Element Kj(m3/kg) K (m)О K (m3/kg) d K (m)a. Kd (m3/kg) K (m;a.
Ni - - - - 0.32 0.032Sr 0.0079 0.00026 0.0063 0.00063 0.016 0.008Zr 1.3 0.042 1.3 0.025 3.2 0.32Te 0 0 0 0 0.05 0.005I 0 0 0 0 0 0Cs 0.13 0.0042 0.032 0.0063 0.064 0.021Ce 13 0.42 5.0 0.10 10 1.0Nd 4.0 0.13 1.0 0.02 10 1.0Eu 7.9 0.26 7.9 0.16 10 1.0Ra 0.1 0.0033 0.063 0.0063 0.50 0.25Th 0.79 0.026 0.50 0.01 2.4 0.24U 0.0063 0.00021 0.50 0.01 1.2 0.12 'Np 0.04 0.0013 0.50 0.01 1.2 0.12Pu 0.16 0.0053 0.72 0.014 0.30 0.03Am 13 0.42 5.0 0.10 32 3.2
332 NERETNIEK
S et al.
IAEA-SM-243/108 333
The equilibrium constants -Ka - for rock have been calculated from Allard's [22, 16] measured mass equilibrium data -K<j- and under the assumption of surface reaction. Kg values have primarily been calculated by using the geometric surface area "a" of the crushed rock as the adsorption area "a" = 30 m 2/kg. This value has been modified somewhat as a result of measurements where it has been possible to use measurements on rock surfaces of known area as a reference [25]. The results are summarized in Table IV.
In the safety analysis in the study on vitrified waste, the data in columns 2 and 3 were used [ 2 0 ] . In the later study on spent fuel [ 2 1 ] , the data in columns 4-7 became available and could be used. It is of special interest to note that Tc is retarded under reducing conditions and that the equilibrium values for uranium and plutonium have increased considerably. Furthermore, the increase in contact time from a few weeks to 6 to 7 months increased the sorption for the nuclides by a factor of 2 to 10.
Figure 7 shows the mean migration velocity of retarding and nonretarding nuclides as a function of permeability for a given gradient i = 0 . 0 0 3 m/m and fissure spacing 1 m. The figure is based on Snow's model for fissures and is constructed from equations (1), (7), and (8).
It is seen that under reducing conditions expected velocities of the actinides and lanthanides are expected to move a mil-Qlimeter or less per year in good rock, Kp = 10 m/s. Even in fairly poor rock for the depths of interest, Kp = 10“® m/s, the migration velocity can be expected to be of the magnitude of a few millimetres per year.
8. DISPERSION PHENOMENA
The velocities mentioned are mean velocities. In every fissure there is some dispersion in the direction of flow as well as perpendicular to the flow. This may decrease the concentration ,which is good, but if the longitudinal dispersion is large, the first of the nuclides may arrive very much faster than the mean travel time would indicate. Dispersion in sparsely fissured rock is not much studied. Molecular diffusion and hydro- dynamic dispersion is not expected to have a large influence over long distances. Another reason for early arrival cannot be neglected, however. This is due to the variation in fissure widths. Doubling of the fissure width will speed up the nuclide migration velocity by a factor of 8 as Kp ~ (2b)3 in fissured rock [9]. A variation in fissure widths may thus lead to very early arrival in some fissures and very late arrival in some
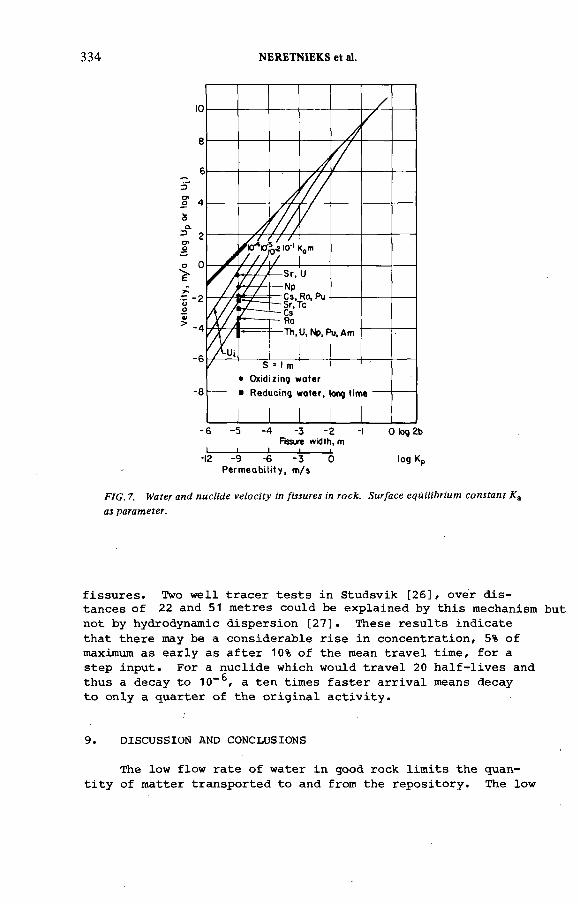
334 NERETNIEKS et al.
-6 -5 -4 -3 -2 -I 0 log 2bFissure width, m
I-------------1_________ I_________ i_________ LH2 -9 -6 -3 О log Kp
Permeability, m/s
FIG. 7. Water and nuclide velocity in fissures in rock. Surface equilibrium constant K3
as parameter.
fissures» Two well tracer tests in Studsvik [26], over distances of 22 and 51 metres could be explained by this mechanism but not by hydrodynamic dispersion [27]. These results indicate that there may be a considerable rise in concentration, 5% of maximum as early as after 10% of the mean travel time, for a step input. For a nuclide which would travel 20 half-lives and thus a decay to 10- 6 , a ten times faster arrival means decay to only a quarter of the original activity.
9. DISCUSSION AND CONCLUSIONS
The low flow rate of water in good rock limits the quantity of matter transported to and from the repository. The low

IAEA-SM-243/108 335
transport of oxidants to the canister may have a profound influence on its service life. The leaching of the radionuclides, if governed by the dissolution of the matrix, will also be very slow.
With a buffer of low permeability, the transport through it is by diffusion. This implies that even if there were an extreme increase in water flow rate through the rock, diffusion through the barrier would still limit the transport. In the central case 5 in Table II, the water exchanging some species with the canister was 0.8 I / a. This would increase to 6.5 Л/а at most if water flow increased to any amount, as long as the buffer was not swept away and the general geometry of "case 5" was kept. This means that a low permeability barrier has a very large impact on the safekeeping of the waste.
The montmorillonite barrier has the additional advantage that it retards three of the most active nuclides: ^ 7Cs, ®®Sr,and 241Am,so that they decay during their transport through the buffer.
The transport of radionuclides in the fissured rock is retarded by sorption. In order not to overestimate the retardation due to waste-rock interaction, reversible surface reaction was assumed. There are, however, indications that the radionuclides may diffuse into the rock matrix via microfissures. Although diffusion is slow, plenty of time is available. This may considerably decrease the migration velocity of the nuclides.
The larger fissures will have a major influence on the radionuclide flow rate as well as on the travel time.
Appendix
NOTATION
a specific surface m2/m^b half-width of fissure m m
c A concentration of A mol/m
DP diffusivity in water in pore m 2/s
°v diffusivity in free water m 2/sg gravitational constant m/s2i hydraulic gradient m/m
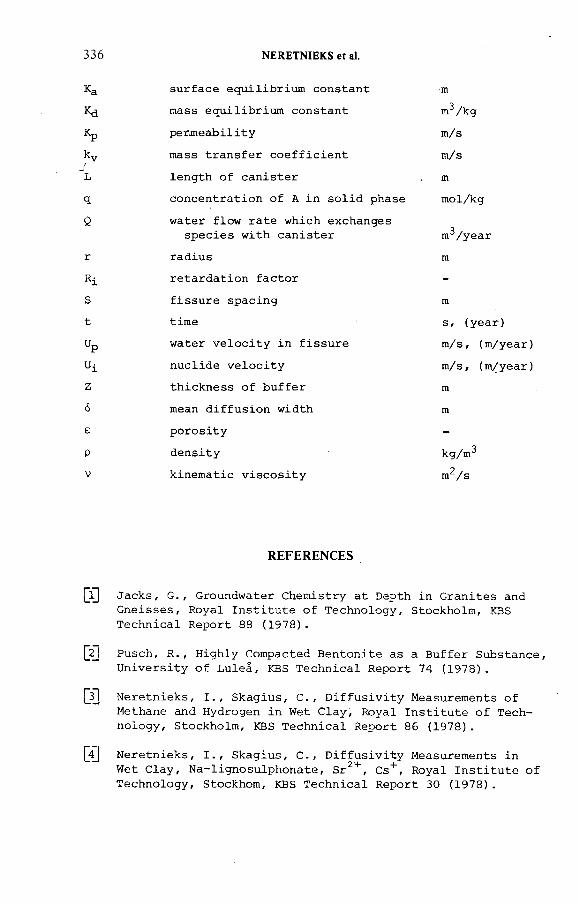
336 NERETNIEKS et al.
ка
Kd
К р
JLq
Q
z
6
ePv
surface equilibrium constant mass equilibrium constant permeabilitymass transfer coefficientlength of canisterconcentration of A in solid phasewater flow rate which exchanges
species with canisterradiusretardation factor fissure spacing timewater velocity in fissure nuclide velocity thickness of buffer mean diffusion width porosity densitykinematic viscosity
m^/kgm/sm/sm
mol/kg
Оnr/year
m
m
s, (year) m/s, (m/year) m / s , (m/year) m
m
kg/mdm 2/s
REFERENCES
[jQ Jacks, G . , Groundwater Chemistry at Depth in Granites and Gneisses, Royal Institute of Technology, Stockholm, KBS Technical Report 88 (1978).
Qf] Pusch, R . , Highly Compacted Bentonite as a Buffer Substance, University of Luleâ, KBS Technical Report 74 (1978).
QFj Neretnieks, I., Skagius, C-, Diffusivity Measurements ofMethane and Hydrogen in Wet Clay, Royal Institute of Technology, Stockholm, KBS Technical Report 86 (1978) .
QÍ] Neretnieks, I., Skagius, C-, Diffusivity Measurements inWet Clay, Na-lignosulphonate, Sr2+ , Cs+ , Royal Institute of Technology, Stockhom, KBS Technical Report 30 (1978).

IAEA-SM-243/108 337
Neretnieks, I . , Retardation of Escaping Nuclides from a Final Depository, Royal Institute of Technology, Stockholm, KBS Technical Report 30 (1977) .
Neretnieks, I,. Transport of Oxidants and Radionuclides Through a Clay Barrier, Royal Institute of Technology, Stockholm, KBS Technical Report 79 (1978).
Bird, R.B., Steward, W.F., Lightfoot, E.N., Transport Phenomena , John Wiley, N.Y. (I960)'.
Handling of Spent Nuclear Fuel and Final Storage of Vitrified High-level Reprocessing Waste, Volume II,Geology, KBS, Stockholm (1977).
Snow, D.T., Rock fracture spacings, openings and porosities, Journal of the Soil Mechanics and Foundations Division, Proceedings AIChE 94_ SMI (1968) 73.
The Swedish Corrosion Institute and its reference group, Copper as an Encapsulation Material for Unreprocessed Nuclear Waste - Evaluation from the Viewpoint of Corrosion, KBS Technical Report 90 (1978) .
Rennerfelt, J., Composition of Groundwater Deep Down in Granitic Bedrock, Orrje and Company, Stockholm, KBS Technical Report 36 (1977)
Ekbom, L . , Statistical Evaluation of Copper Corrosion in Soil from Tests Conducted by Denison and Romanoff,Appendix E to KBS Technical Report 90 (1978).
Katayama, Y.B., Leaching of Irradiated LWR Fuel Pellets in Deionized and Typical Ground Water, BNWL-2057 (1976).
Katayama, Y.B., Mendel, J.E., Leaching of irradiated LWR fuel pellets in deionized water, sea brine, and typical ground water. PNL-SA-6416, American Nuclear Society Winter Meeting, Nov. 22 - Dec. 2, 1977, San Francisco, Tansao 27 (1977) 447.
Forsyth, R.S., Eklund, U-В., Leaching of Irradiated UO^ Fuel, AB Atomenergi, KBS Technical Report 70 (1978).
Allard, B., Kipatsi, H . , Torstenfelt, B . , Absorption of Long-lived Radionuclides in Clay and Rock. Part 2,Chalmers Institute of Technology, Gothenburg, KBS Technical Report 98 (1978).

[17] Paces, T., Chemical equilibria and zoning of subsurfacewater from Jachymov ore deposit. Czechoslovakia, Geochimica et Cosmochimica, Acta 33 (1969) 591.
[le] Pusch, R. , Small-scale Bentonite Injection Test on Rock, University of Luleâ, KBS Technical Report 75 (1978).
[19] Germanov, A.I., Panteleyev, V.M., Behaviour of organicmatter in groundwater during infiltration epigenesis. Internat. Geology Rev., .10 826.
[20] Handling of Spent Nuclear Fuel and Final Storage of Vitrified High-level Reprocessing Waste, Volume IV, Safety Analysis, KBS-Report, Stockholm (1977).
[21] Handling and Final Storage of Unreprocessed Spent Nuclear Fuel, Volume II, Technical, KBS-Report, Stockholm (1978).
[22] Allard, B . , Kipatsi, H., Rydberg, J., Sorption of Long- lived Radionuclides in Clay and Rock, Part 1, Chalmers Institute of Technology, Gothenburg, KBS Technical Report 55 (1977).
[23] Lindblom et al., Groundwater Movements Around a Repository. Final Report, Hagconsul.t AB, KBS Technical Report 54:06 (1977).
p24_j Huit, A., Gidlund G . , Thoregren U . , Permeability Determinations, Geological Survey of Sweden, KBS Technical Report 61 (1978).
(25] Grundfelt, B., Nuclide Migration from a Rock Repository for Spent Nuclear Fuel, Kemakta Konsult AB, KBS Technical Report 77 (1978).
[26] Lanstrom, 0., Klockars, C. E., Holmberg, К. E . , Westerberg, S., In Situ Experiments on Nuclide Migration in Fractured Crystalline Rocks. Studsvik Energiteknik and The Geological Survey of Sweden, KBS Technical Report 110 (1978).
338 NERETNIEKS et al.
[27] Neretnieks, I., Analysis of some tracer runs in granite rock using a fissure model, Materials Research Society Meeting, Boston, Nov. - Dec. 1978 (1978).

IAEA-SM-243/108 339
DISCUSSION
J. AROD: I am surprised to see the proportions for the sand/bentonite
mixture (10-15% bentonite) provided for in the barriers under the Swedish
programme. Wy is there such a high percentage of bentonite? In France we
have done some experiments with bentonite percentages close to 2% and obtained
promising results. In future it will perhaps be necessary to specify in detail the
bentonies used and to give their analyses.
I. NERETNIEKS: A higher percentage of bentonite will reduce the
permeability and increase the sorption capacity of the backfill.
G. E. COURTOIS: In Section 4.3 of the paper you say that the dissolution
time for all the. glass is 12 million years, while in the safety analysis the dissolution
time was taken to be 30 000 years. What is your personal opinion as to the true
lifetime of a glass block?
I. NERETNIEKS: In the safety analysis for the KBS project very conser
vative values were used where it could not be proved beyond all doubt that dis
solution was the controlling mechanism for release. At the time of the study
not enough data were available to state definitely that diffusion in the glass
matrix could not be a faster release mechanism for at least some nuclides.
C. MYTTENAERE: In your computation, did you take into account the
possibility that the temperature gradients around a repository could provide a
driving force for any water present in fractures and that this convective transport
could shorten the transit time of the radionuclides?
I. NERETNIEKS: The estimated increase in flow due to a thermal gradient
is very small, according to the computations we have made. Furthermore, an
increase in water flow rate in the rock does not give a proportional increase in the
leach rate since part of the transport resistance is independent of flow rate.


IAEA-SM-243/6
GEOCHEMICAL AND ISOTOPIC INVESTIGATIONS
AT THE STRIPA TEST SITE (SWEDEN)
P. FRITZ, J. F. BARKER, J. E. GALE
University of Waterloo, Waterloo,
Ontario, Canada
P. A. WITHERSPOON
University of California, Lawrence Berkeley
Laboratories, Berkeley, United States of America
J. N. ANDREWS, R. L. F. KAY, D.J. LEE
University of Bath,
Bath, United Kingdom
J. B. COWART, J. K. OSMOND
University of Florida,
Tallahassee, United States of America
B. R. PAYNE
International Atomic Energy Agency,
Vienna
Abstract
GEOCHEMICAL AND ISOTOPIC INVESTIGATIONS AT THE STRIPA TEST SITE (SWEDEN).This paper presents the results of geochemical and isotopic analyses on water samples from
the granite at Stripa, Sweden. Groundwater samples collected from shallow, private wells; surface boreholes; and boreholes drilled from the 330 m and 410 m levels were analysed for their major ion chemistry, dissolved gases, and environmental isotope contents in order to describe their origin, age and geochemical history. Oxygen-18 and deuterium contents as well as chemical and rare gas analyses demonstrate that different fracture systems contain different water masses which recharged under different climatic conditions. Tritium analyses show that modern surface waters have not (yet? ) reached the test excavations in measurable amounts. Groundwater age determinations done on samples from different mine levels were attempted with 14C, elements of the uranium decay series, uranium and argon isotope ratios. Results indicate that waters discharging from boreholes drilled from test site levels (~ 330 m below ground surface) have ages greater than or about 25 000 years. Dates from the uranium decay series suggest that the deepest water analyses (~ 900 m below ground surface) could be considerably older than this but confirmation has to be obtained through 14C analyses. The 13C contents of the aqueous carbonate in these groundwaters indicate groundwater recharge through vegetated soil — presumably during an interglacial period. An important aspect of the chemistry of these waters is that the pH rises to values > 9.5 at the excavation levels and below. Carbonate contents decrease with depth but Cl~ Ca++, Na+ and SO4 increase. These changes are determined by rock/water interactions and the possible admixture of minor amounts of fossil sea water.
341

342 FRITZ et al.
For the long-term containment of wastes from the nuclear fuel cycle in repositories the u ltim ate barrier must be provided by the natural environment in which the repository is located. To gain pub lic acceptance i t w ill be necessary to demonstrate that the charac te ris tics of a potentia l repository s ite are indeed su itab le for the task of preventing the m igration of toxic m ateria ls from the s ite . This requires in tensive f ie ld studies which have to be carried out in such a manner as to preserve the in te g r ity of the s ite . This could l im it d r i l l in g programmes of an exploratory nature and not
related to the repository construction. Under those conditions i t could be d i f f i c u l t to assess the hydrogeologic regimes which ex ist,and arrive at an understanding o f th e ir geochemistry. Therefore, some basic information prim arily related to technology development must be collected at other s ites and, in th is context, studies carried out a t the test s ite at S tripa , Sweden, are very important.
The S tripa tes t s ite is located approximately 200 km WNW of Stockholm and constructed in a g ra n it ic in trus ion which is in contact with the north limb o f a plunging syncline of meta- sedimentary rocks (F ig. 1)[1]. The iron ore beds w ith in the metasedimentary rock sequence have been mined fo r about 400 years, ending in 1977, to levels as low as 410 m below ground surface. This long period of mining a c t iv ity must have greatly perturbed the local flow system, through the formation of a 410-m sink of considerable areal extent. Furthermore, local enrichments in uranium minerals could s ig n if ic a n t ly influence the geochemistry o f the S tripa granite waters, s p e c if ic a lly the abundance and iso top ic composition of uranium and its daughter products. These "interferences" w ill have to be taken in to account in the in te rp re ta tion o f the resu lts .
This report summarizes the resu lts of the geochemical tasks undertaken w ith in th is p ro ject, with special emphasis on the composition, geochemical h is to ry , age, and o rig in of groundwaters encountered at various depth w ith in the g ran it ic rocks at the tes t s ite . A summary of the data accumulated during the f i r s t year and very prelim inary in te rpre ta tions are presented by FRITZ et a l . [2].
F ield determinations of pH, a lk a l in i ty , Eh and dissolved oxygen combined with major ion analyses serve to describe the chemical charac te ris tics o f the groundwaters which arrive at the tes t s ite and w ill eventually f i l l the excavation. An in tegra l part o f the discussion are computer analyses using WATEQ-F [3] to define the spéciation o f the aqueous compounds and to define mineral water e q u il ib r ia .
Stable isotope analyses ( 180 and 2H) are used to characte r ize d iffe re n t water masses and to obtain information on
1 . INTRODUCTION

IAEA-SM-243/6 343
П П DIABASE I I LOWER LEPTITE ZONE UPPER LEPTITE ZONE
I'-' -1 GRANITE H H iron ore zone
FIG .l. A geologic cross-section of the Stripa mine area and a layout of the excavations at the
test site are shown. Not indicated are the large number of shallow boreholes drilled for heater
and monitoring devices in the various experimental rooms but only the two principal, flowing
boreholes used in the geochemical monitoring programme.
th e ir o r ig in . In normal groundwater environments these isotopes are a conservative property of the water and th e ir abundance can only be modified i f isotope exchange with the aqu ifer rocks occurs a t elevated temperatures. A comparison of the abundance of these two isotopes thus ind icates whether
"normal" groundwater is discharging from the fracture systems which act as aquifers in the S tripa g ran ite , under what environmental conditions i t has been recharged and whether deep c ircu la t io n systems, metamorphic f lu id s , fo ss il sea water, e tc . contribute to the discharging groundwaters.
344 FRITZ et al.
Ind irec t information on the environment of groundwater recharge is also obtained from inert gas analyses which were done in conjunction with analyses o f isotopes and elements of the uranium decay series.
Groundwater ages are estimated from the abundance of
radioactive elements and/or th e ir decay products: Tritium ( 3H)is used to id en tify waters which in part or to ta l are younger than about 40 years, older waters are recognized through analyses fo r llfC and elements of the uranium decay series.The la t te r include isotope ra tio measurements as well as the determination of helium, argon, and radon concentrations in the water samples. Deta ils about the ana ly tica l techniques used are presented by F r itz et a l . [2].
Sampling for the geochemical tasks was done wherever i t was possible to obtain s u ff ic ie n t uncontaminated water for chemical and iso top ic analyses. Three subsurface boreholes
have provided most of the water samples R-l located near the north end of the v e n tila t io n d r i f t (F iq. 1); M-3, located near the end of the time-scale room (Fig. l ] ; and a ve rtica l 470-m borehole d r ille d by Sveriges Geologiska Undersëning (SGU) for Kclrnbranslesclkerhet (KBS) from the 410-m mining leve l. All underground boreholes have pressure gradients directed in to the excavations and have reasonable flow rates: R-l, 30 m inlength , flows a t approximately 0.5 L/m in ; M3, 14 m in length discharges about 0.15 L/m in ; the 410-m-level ve rtica l borehole, 470 m in length , flows a t approximately 0.1 L/min.
Shallow groundwater was sampled from watertable wells d r il le d fo r the project as well as a number of private water supply wells in the area. The maximum sampling depth in these wells is about 100 m. A deep-surface borehole (SBH 3) w ill hopefully supply samples from the depth range between the shallow wells and the boreholes at the mine leve ls . Surface waters were co llected from streams in the project area.
2. GROUNDWATER CHEMISTRY
A summary of chemical charac teris tics o f the groundwaters
analyzed is given in Fig. 2. S ig n if ic an t changes in water q u a lity w ith sampling depth are observed.
Surface waters in the project are very d i lu te , with to ta l
dissolved so lid s (TDS) below 30 mg/L. Their pH values range from 6.5 to 6 . 8 , and they have re la t iv e ly high dissolved organic carbon contents. (> 5 mg/L). Computer ca lcu la tions show undersaturation with respect to c a lc ite but saturation with respect to quartz.
In the shallow groundwaters the to ta l dissolved solids increase and values between 120 and 325 mg/L were determined.

STRI
PA
FIEL
D pH
Ca
“ m
g/l
Mg
**m
g/l
Na*
m
g/l
K‘m
g/l
IAEA-SM-243/6 345
D E P T H (m > D E P T H ( m )
FIG.2. Major ions and pH of the water samples analysed for the geochemical tasks. The results
shown are mostly average values of two or more analyses done at different times at the same
sampling location. No time-dependent variations have yet been observed at any point, but note
the strong increase in chemical load below ~ 770 m. Sampling intervals in the 410-m level
borehole are given.
This is large ly due to an increase in inorganic carbonate because of c a lc ite d isso lu tion and is also re flected in the Ca and Mg contents. pH values are as high as 8 and c a lc ite saturation is approached in some waters. Quartz saturation is maintained and the aqueous s i l ic a contents remain constant at П-13 mg/L in a ll groundwaters,including the deep borehole
samples.The chemical ch arac te r is tic s of the deeper groundwaters
co llected a t the 330 m levels are, however, qu ite d iffe re n t and a s h if t from calcium-bicarbonate waters to sodium-chloride-
bicarbonate waters is noted. The to ta l dissolved load o f waters co llected a t the 330 m level is between 200 and 230 mg/l. C a lc ite saturation is reached fo r a ll samples and pH values vary between 8 . 8 and 9.1.
346 FRITZ et al.
Groundwaters flowing in to the 410 m borehole at various levels are not uniform in th e ir chemical charac te ris tics : toa depth of about 770 m below ground surface th e ir chemistry is s im ila r to those at the 330 m levels but a very sharp increase in s a l in ity is noted in deeper samples. The deepest sample co llected had a TDS o f 8.10 mg/L. The overall chemical charac te r is tic changes to a chloride-sodium-calcium-sulphate water, re fle c ting a dramatic decrease in to ta l dissolved in organic carbon (TIC), and increasing C l- , Na+, Ca++ and SOt/ contents. pH values are now as high as 9.8 and, therefore, c a lc ite saturation is maintained despite decreasing carbonate concentrations. Mg++ and K+ concentrations are below 1 mg/L.
These very high pH values were somewhat unexpected because in other c ry s ta llin e areas of Sweden most groundwaters have much lower pH values [4]. This makes i t mandatory to do pH measurements immediately a fte r sampling: these groundwatersare in equ ilibrium with a pC02 = 10“ 6 -5 atm and a fte r exposure to a ir w ill absorb very fas t s ig n if ic a n t amounts o f atmospheric carbon dioxide. This resu lts in a lowering o f the pH and, therefore , laboratory values are ty p ic a lly close to 7.They cannot be used fo r the in te rp re ta tion of chemical data.
The p r in c ipa l question with some im plication with respect to the re la tive ages o f these groundwaters is whether th is increase in to ta l dissolved load and changing chemical charac te ris tics with depth re flec ts geochemical evolutionary trends or whether simply d iffe re n t water masses are present.For example, i t has been argued tha t the high sodium and chloride contents observed in other lo c a lit ie s on the Fenno- scandian Shield were due to the presence of sea water which had been trapped in the rock from periods with higher sea levels [4][5].
In the S tripa groundwaters, the highest chloride contents are close to 450 mg/L, corresponding to about 2.5% of the s a l in ity o f open ocean and 10-15% o f today's B a ltic Sea. With such small con tr ibu tions , i t w ill be d i f f ic u l t to show tha t in deed fo ss il sea water is present because the waters have also undergone geochemical a lte ra tio n through rock-water in te r actions . Comparison o f Cl"/Na+ versus Ca++/Mg++ molar ra tio s (Figure 3) documents th is and shows tha t the observed chemistry cannot be explained by simple mixing of sea water with fresh water from the c ry s ta llin e rocks.
Chloride is probably the most conservative of the major ions contribu ting to the chemistry o f a groundwater. In c ry s ta llin e rocks usua lly only a few mg/L (ppm) o rig ina te in the d isso lu tion of s i l ic a te m inerals; higher concentrations ind ica te e ithe r d isso lu tion o f evaporite minerals in sedimentary or metasedimentary sequences, or add ition of fo ss il sea water. I t is thus in s truc tive to compare chloride contents to the concentrations o f other major ions (Table 1).
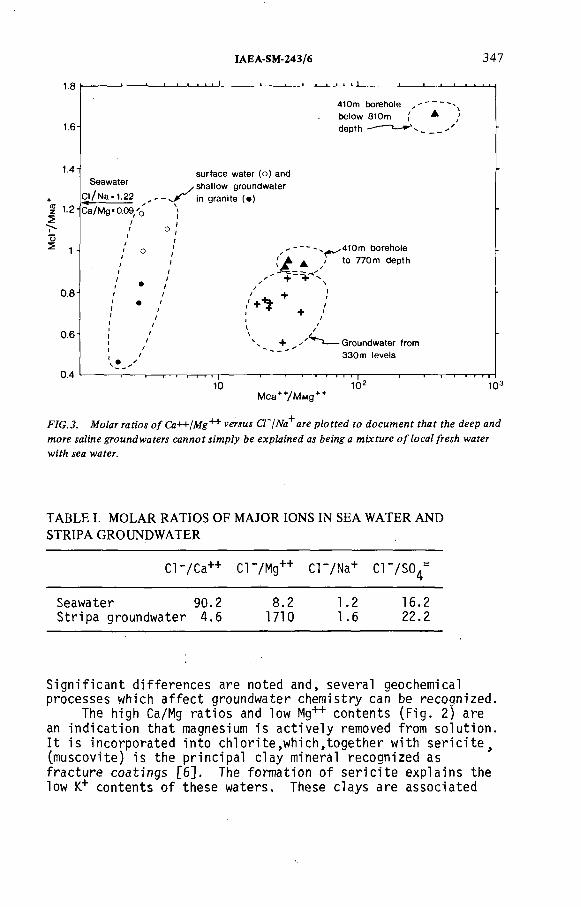
IAEA-SM-243/6 347
1.6
1.4
+2 1.2 5
о
1.8
0.8
0.6
0 .4
FIG.3. Molar ratios of Q z + + /A fg + + versus Q~/Na+are plotted to document that the deep and
more saline groundwaters cannot simply be explained as being a mixture o f local fresh water
with sea water.
TABLE I. MOLAR RATIOS OF MAJOR IONS IN SEA WATER AND
STRIPA GROUNDWATER
Cl-/Ca++ Cl~/Mg++ Cr/N a+ C17S04=
Seawater 90.2 8 . 2 1 . 2 16.2S tripa groundwater 4.6 1710 1 . 6 2 2 . 2
S ig n if ic a n t differences are noted and, several geochemical processes which a ffe c t groundwater chemistry can be recognized.
The high Ca/Mg ra tios and low Mg++ contents (F ig . 2) are an ind ica tion tha t magnesium is ac tive ly removed from so lu tion . I t is incorporated in to ch lorite ,w h ich ,toge ther with s e r ic ite , (muscovite) is the princ ipa l clay mineral recognized as fracture coatings [6]. The formation o f s e r ic ite explains the low K+ contents of these waters. These clays are associated
I . 1 1________ L
surface water (o) and
410m borehole «
below 810m f ^ ¡ d e p th ------- -— * " '4 _____У
Seawater у shallow groundwater in gran ite (•)C l/N a ■ 1.22 __
C a/M g-0 .09 /O \1
/11 ° !
/1 О
1' , ^ _ ^ 4 1 0 m borehole
/ to 770 m depth/
NS
1
1
! •
' i A1 ^ r . -
/ ' + >1•
1 / 1 /
+ +i
I
t//
* i! /
\\ ¿/
¡ / , / 4 + ^ ----- Groundwater from
330m levels
I I 1-*-1—I—I i — I---'--1-1—I—I—I—r-[---- 1--- 1--1 I-1-1' I I10 102 10
М с а + 7 М м д + +

348 FRITZ et al.
log SATURATION INDEX -CALCITE
FIG.4. Total inorganic carbon (TIC) and calcite saturation are compared. The calcite saturation
is reached in the groundwaters sampled in private wells and maintained in the deeper water
despite the apparent loss of inorganic carbon. The “evolutionary path’’ could reflect potential
geochemical changes in time. Whether the deepest water should be included is not yet clear,
although this should be done if fossil sea water does not influence the chemistry o f these waters.
with c a lc ite and quartz which,judging from the water chemistry, should form ac tive ly on fractures in which these groundwaters c ircu la te .
C a lc ite p rec ip ita tio n is probably responsible for the much lower inorganic carbonate contents in the deep waters compared to shallower ones ( F ig .4). The low C l”/Ca++ ra tio and constant s i l ic a concentrations ind ica te tha t calcium is added to the deep
waters through the incongruent d isso lu tion o f primary s i l ic a te
m inerals. This leads to the formation o f clay minerals and provides the s i l ic a found in the quartz crystals growing on fracture surfaces.
Sulphate also increases markedly in the deep groundwaters and again sea water may be responsible for it s o r ig in . This view is supported by the s im ila r ity of the Cl"/S0i+= in sea water and groundwater (Table I ) . Pyrite oxidation can be excluded as an important contributor because the associated generation o f hydrogen ions would lead to much lower pH values than those observed.

IAEA-SM-243/6 349
I t is also important to notice tha t the loss of inorganic carbon (TIC) is para lle led by a loss o f aqueous uranium compounds. The waters a t the 330 m levels have between 8 and 10 x 10' 6 g/L uranium and less than 2 x 10" 6 g/L is found in
the deepest groundwaters.The high pH values are not fu l ly explained although one
can assume that they are the resu lt o f s i l ic a te hydrolysis.
Conclusions: The chemical load o f the groundwaters in theS tripa granite increases with depth and reaches values exceeding 800 mg/L TDS. I t is suggested tha t small amounts of fo ss il sea water mixed with fresh water are in part responsible for th is . The increasing s a l in i t ie s with depth would then not necessarily be a function o f age. However, time-dependent rock-water in te ractions are also active and the d isso lu tion of primary s ilic a te s para lle led by the formation o f fracture coatings (c h lo r ite , s e r ic ite , c a lc ite and quartz) has a s ig n if ic a n t e ffe c t on groundwater chemistry and geochemical evolution o f these waters.
3. DEUTERIUM, 180 AND TRITIUM ABUNDANCES
In the introductory remarks i t was mentioned tha t in normal groundwaters 2H and 180 are conservative constituents of a given water mass. Their abundance w ill depend almost exclusively on the environmental and c lim a tic conditions of the recharge areas at the time o f in f i l t r a t io n and thus re fle c t the composition of p rec ip ita tio ns in the area. Under those conditions fo r any given area a simple lin e a r re la tionsh ip between 2H and 180 values does ex ist whose slope and in tercept are close to a global meteoric water l in e defined by Craig [7] and shown on Figure 5. A ll water samples co llected from the mine levels c lus te r around th is l in e but shallow groundwaters are displaced s lig h t ly to the r ig h t and surface waters (ponds and small streams) are almost a ll fa r removed. The la t te r is an ind ica tion that evaporation has affected the isotop ic composition o f the surface waters.
In the groundwaters, the abundance of both 2H and 180 is dependent on the temperature of condensation and the cooler p rec ip ita tio ns usua lly have the lower stable isotope concentrations [8 ].
The lower stable isotope contents in the mine waters s ig n ify tha t they were recharged under cooler c lim a tic conditions than the shallow groundwaters. Groundwaters d is charging in the mine have no measurable tr it iu m contents whereas a l l surface waters and shallow groundwaters have more than 10 Tritium Units. This demonstrates tha t modern surface waters and shallow groundwaters do not a t present reach the
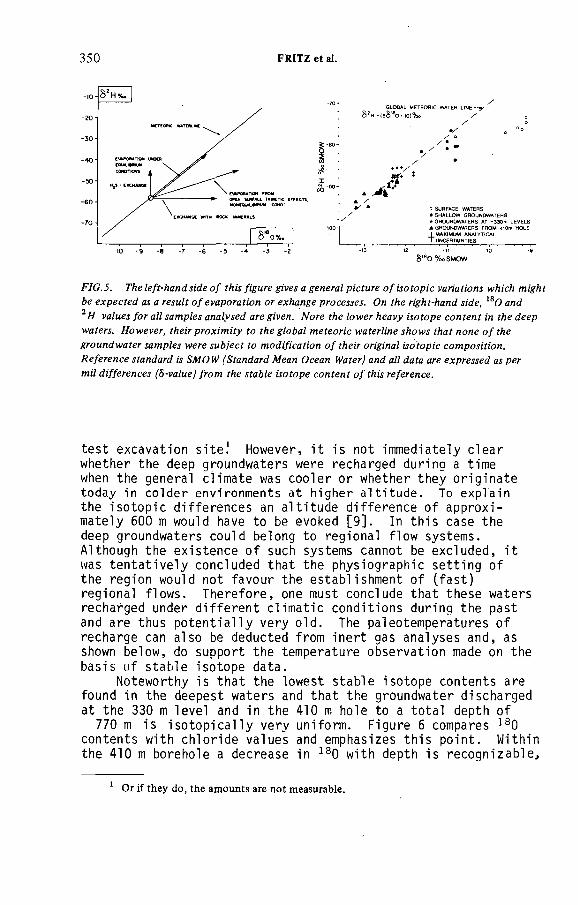
350 FRITZ et al.
GL06AL WETEOflIC WATER UNE H •(8§'a0 ‘ 10)%o /
// °/ • _
**, y k/ *■
S
■3 SURFACE WATERS• SHALLOW GROUNDWATERS♦ GROUNDWATERS AT '330m LEVELS A GROUNOWATERS FROM 410m HOLE IUAXIMUM ANALYTICALT UNCERTAINTIES
-11S10o %oSMOW
-10 -9
FIG.5. The left-hand side of this figure gives a general picture of isotopic variations which might
be expected as a result of evaporation or exhange processes. On the right-hand side, 180 and
2# values for all samples analysed are given. Nore the lower heavy isotope content in the deep
waters. However, their proximity to the global meteoric waterline shows that none o f the
groundwater samples were subject to modification of their original isotopic composition.
Reference standard is SMOW (Standard Mean Ocean Water) and all data are expressed as per
mil differences (6-value) from the stable isotope content of this reference.
test excavation s ite ! However, i t is not immediately clear whether the deep groundwaters were recharged during a time when the general climate was cooler or whether they o rig ina te today in colder environments a t higher a lt itu d e . To explain the iso top ic differences an a lt itu d e difference of approximately 600 m would have to be evoked [9]. In th is case the deep groundwaters could belong to regional flow systems.Although the existence o f such systems cannot be excluded, i t was ten ta tiv e ly concluded that the physiographic se tting of the region would not favour the establishment of (fas t) regional flows. Therefore, one must conclude tha t these waters recharged under d iffe re n t c lim a tic conditions during the past and are thus p o te n tia lly very o ld . The paleotemperatures of recharge can also be deducted from ine rt gas analyses and, as shown below, do support the temperature observation made on the basis o f stable isotope data.
Noteworthy is th a t the lowest stable isotope contents are found in the deepest waters and tha t the groundwater discharged at the 330 m level and in the 410 m hole to a to ta l depth of
770 m is is o to p ic a lly very uniform. Figure 6 compares 180 contents with chloride values and emphasizes th is po in t. Within the 410 m borehole a decrease in 180 with depth is recognizable,
1 Or if they do, the amounts are not measurable.
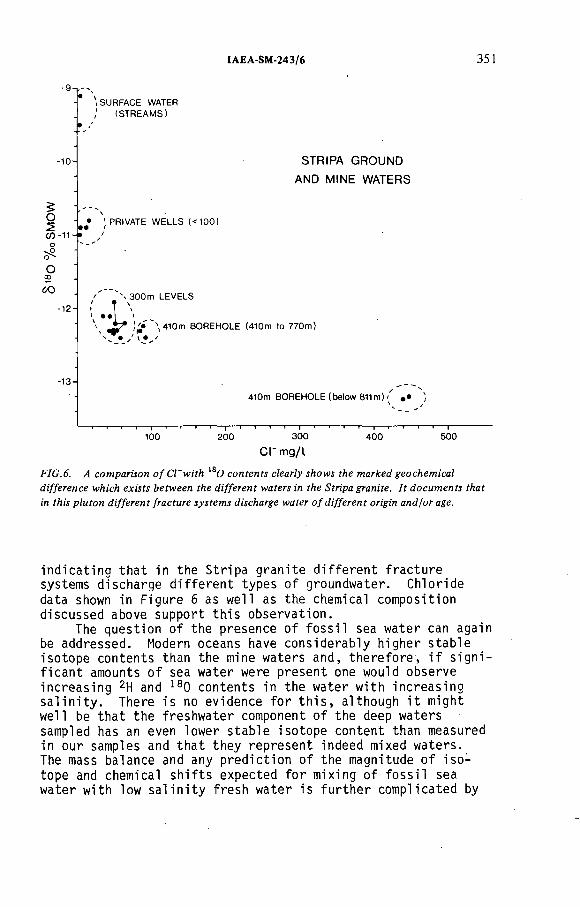
IAEA-SM-243/6 351
- 9 n
-10-
5О2СЛ-11
Осо
60
-12
-13-
.SURFACE WATER ; (STREAM S)
STRIPA GROUND
AND MINE WATERS
' PRIVATE W ELLS (< 1 0 0 )
\ 300 m LEVELS
•' 1 ''
'•410m BOREHOLE (410m to 770m )
410m BOREHOLE (below 811m) i
100 200 300
СГ mg/l
4 00 500
FIG.6. A comparison o f С Г with О contents clearly shows the marked geochemical
difference which exists between the different waters in the Stripa granite. It documents that
in this pluton different fracture systems discharge water of different origin and/or age.
ind ica ting tha t in the S tripa granite d iffe re n t fracture systems discharge d iffe re n t types of groundwater. Chloride
data shown in Figure 6 as well as the chemical composition discussed above support th is observation.
The question of the presence of fo ss il sea water can again be addressed. Modern oceans have considerably higher stable isotope contents than the mine waters and, therefore1, i f s ig n if ic a n t amounts o f sea water were present one would observe increasing 2H and 180 contents in the water with increasing s a l in i ty . There is no evidence for t h is , although i t might well be tha t the freshwater component o f the deep waters sampled has an even lower stab le isotope content than measured in our samples and tha t they represent indeed mixed waters.The mass balance and any pred iction of the magnitude o f iso tope and chemical s h if ts expected for mixing of fo s s il sea water with low s a l in ity fresh water is fu rther complicated by
352 FRITZ et al.
the fac t tha t the chemical and iso top ic composition of the B a ltic Sea at i t s maximum water leve ls (a time when the coastlin e was very close to the S tripa te s t s ite ) are unknown and both could have been considerably lower than values observed in the open ocean.
The conclusion is that the stable isotope data do not ind ica te that fo ss il sea water is present but they do not necessarily contrad ict th is e ith e r . Further d r i l l in g and sampling a t greater depth are required for a more conclusive statement.
Conclusions: 2H and 180 contents in the S tripa groundwaterprovide clear evidence tha t indeed d iffe re n t types of groundwaters c ircu la te at d iffe re n t leve ls . Modern surface waters do not penetrate to the mine leve ls . The waters discharging between about 300 and 770 m are is o to p ica lly s im ila r and probably have the same o r ig in . Chemical differences (Figure 2) can be explained by rock/water in te rac tions . The deepest groundwaters have the lowest 2H and 180 contents and recharged under the coolest c lim a tic cond ition . These data thus provide evidence tha t the d iffe re n t groundwaters have d iffe re n t ages although no absolute or re la tive age can be deduced. The resu lts do not provide any information on sea water contributions because the iso top ic compositions of both the freshwater and sea water end-member are unknown.
4. lk C GROUNDWATER DATING
The basic concept underlying the carbon-14 dating method is tha t waters in f i l t r a t in g through vegetated so ils become charged with soil-C02 before they become part o f a groundwater reservoir. Because th is soil-C02 has a pa rtia l pressure up to two orders of magnitude higher than the pa rtia l pressure of atmospheric C02 , i t dominates the carbon isotope content of in f i l t r a t in g waters. I ts 14C a c t iv ity is very close to the 1I+C a c t iv ity o f the atmosphere. Therefore, i f no other carbon were added to the water, and only decay a ltered the 14С contents o f the dissolved carbonate, th is residual a c t iv ity would be a function o f time only , and re f le c t the water age.
Unfortunately most groundwaters receive th e ir aqueous
carbonate not only from the soil reservo ir, but also from the aqu ifer carbonates. The la t te r are normally free o f 14C and th e ir carbon w ill therefore "d ilu te " the 14C contents of the in i t i a l so il carbon. The measured ages then become too o ld . Correction factors can be deduced from chemical data •
(considering the geochemical evolution o f a system) and 13C- analyses [10][11]. This has been done [1] and i t appears tha t the maximum geochemical correction w ill be close to 6000 years.
Removal of calcium carbonate from solu tion by simple prec ip ita t io n o f cal c ite as i t occurs in these fracture systems
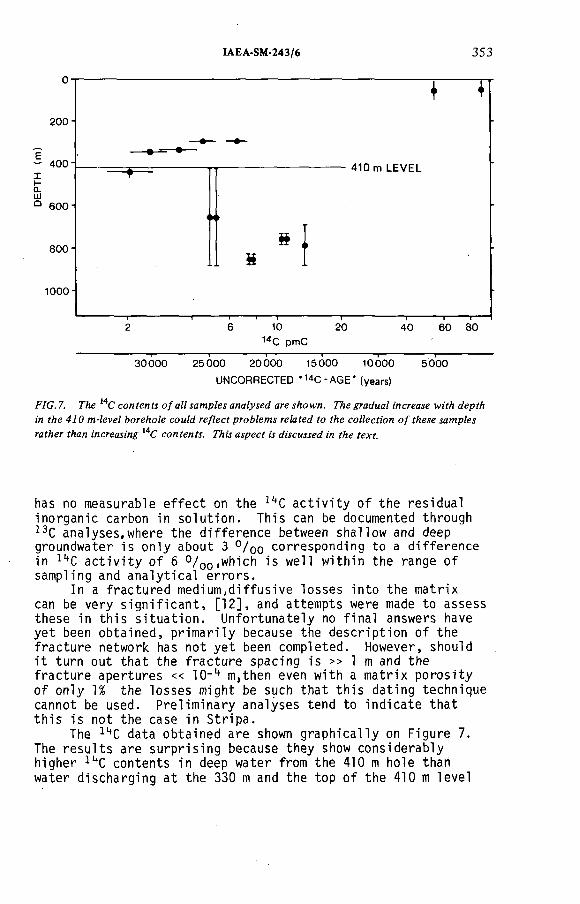
IAEA-SM-243/6 353
14C pmC
30000 25 000 20000 15000 10000 5000UNCORRECTED *14C-AGE' (years)
FIG. 7. The 14C contents o f all samples analysed are shown. The gradual increase with depth
in the 410 m-level borehole could reflect problems related to the collection o f these samples
rather than increasing 14C contents. This aspect is discussed in the text.
has no measurable e ffec t on the 1(tC a c t iv ity o f the residual inorganic carbon in so lu tion . This can be documented through 13C analyses,where the d ifference between shallow and deep groundwater is only about 3 ° / 00 corresponding to a d ifference in 14C a c t iv ity o f 6 ° / 00 .which is well w ith in the range of sampling and ana ly tica l errors.
In a fractured medium ,diffusive losses in to the matrix can be very s ig n if ic a n t , [1 2] , and attempts were made to assess these in th is s itu a tio n . Unfortunately no f in a l answers have yet been obtained, p rim arily because the description o f the fracture network has not yet been completed. However, should i t turn out tha t the fracture spacing is >> 1 m and the fracture apertures « 10 - 4 m,then even with a matrix porosity of only 1% the losses might be such tha t th is dating technique cannot be used. Prelim inary analyses tend to ind ica te that th is is not the case in S tr ip a .
The 1ЦС data obtained are shown graph ica lly on Figure 7. The resu lts are surpris ing because they show considerably higher lltC contents in deep water from the 410 m hole than water discharging a t the 330 m and the top o f the 410 m level

354 FRITZ et al.
hole. For the la t te r water ages exceeding 25 000 years are ind icated . S lig h t ly younger ages would be calcu lated for the waters from the R1 borehole (~ 300 m below ground surface) although some contamination with atmospheric CO2 during sampling is not excluded. I f minor amounts o f young surface waters would reach the R1 borehole then th is could also explain the higher 1¡tC contents. Other isotope and chemical data ava ilab le to date do, however, not support th is view. Further tes ting is done.
The highest 14C a c t iv it ie s measured (bottom o f 410 m hole) are almost certa in ly a resu lt o f a ir contam ination. Because of the very low inorganic carbon contents in the deep water (< 5 mg/L HCO3 ) several tons o f water have to be stripped before enough carbon can be co llected for conventional * 4 analyses.This s tripp ing is done in a flow through system where the incoming water is continuously a c id if ie d and stripped with p u r if ie d nitrogen. The libera ted carbon dioxide is absorbed
by a NaOH so lu tio n , a process which was found to be quan tita tive and nonfractionating . S tripping times increase with depth and i t may take as much as 3-4 weeks to co lle c t enough carbon from the deepest samples. Even very minor contam ination, e .g . trace amounts o f carbon dioxide le f t in the nitrogen gas, could then account for the observed increase in 11+C a c t iv ity with depth. The gradual increase of 14C a c t iv it ie s with depth (Fig.
7 ) p a ra lle l to increased sampling times could be an ind ica tion
for contamination espec ia lly i f compared to more abrupt changes observed in chemical and stable isotope compositions. E fforts are being made to solve th is problem and the la s t samples collected from th is depth have only about 7 pmC (uncorrected 14С age ~ 21 000 years (Figure 7 )) . No C02 was found in the ¿ tr ipp ing gas and no sources for contamination are known.However, further te s ting w ill be done and we also hope to obtain in co llaboration with Dr. R. M. Brown, Atomic Energy o f Canada L td ., 14С determinations on microsamples using the Chalk River accelerator. The sampling method fo r these samples d iffe rs from the one used for conventional 14С samples.
An in te resting aspect on the recharge conditions and thus,
in d ir e c t ly , the time of recharge is given by the 13C analyses.The 13C contents of a ll samples are so low that recharge can only have occurred through vegetated s o il . (6 13C values fo r a ll groundwaters are between -15 and -19 °/oo PDB). I f subglacial recharge had taken p lace, then much higher 13C contents
(ô13C = 0 % o ) would have to be expected and the 180 contents would probably be lower. Analyses o f 13C and 180 contents in fracture cal ci tes show tha t such recharge may once have occurred. Under those conditions the water had a 6180 2 -26 o/œ as compared to the -13.2 °/oo which is the lowest value measured in the presently discharging groundwaters (Figure 6 ).
IAEA-SM-243/6 355
This puts a time l im it on possible recharge periods and these waters would have to have recharged e ithe r less than approximately 10 000 years ago or considerably e a r lie r during an in te rg lac ia l period.
Conclusions. Radiocarbon analyses ind icate tha t the waters discharging from the M3 hole and the upper part of the 410 m hole are older than about 25 000 years. This assumes that no d iffu s ive loss o f 14C has occurred. No age can yet be given for the deeper and more sa line samples because sampling problems due to extremely low carbon contents may have led to some contamination with modern carbon dioxide.
13C analyses on water samples show that these waters recharged through vegetated so ils and do not represent sub
g lac ia l recharge.
5. INERT GAS MEASUREMENTS
5.1 Paleotemperatures o f Recharge
At recharge, an in f i l t r a t in g water dissolves the inert gases by a ir e q u ilib ra tio n in the unsaturated zone. The amounts o f gas dissolved are preserved as i t migrates to greater depth, because the increasing hydrostatic pressure large ly compensates for the decreasing s o lu b il ity resu lting from increasing groundwater temperatures. This temperature dependence o f the so lub il i t y of these noble gases in a groundwater provides a permanent record of the temperature o f recharge [13][14][15].
The in e r t gas contents of some S tripa samples are reported in Table Я . S tr ik ing are the high ^He contents in the groundwaters from the 330 m levels and the 410 m borehole. As w ill be shown below, they probably depend on additions o f radiogenic helium generated during the decay of radioactive elements o f the uranium and thorium decay series. However, also the Ar and nonradiogenic Ne are h igh , exceeding those tha t resu lt from w ater/a ir e q u ilib ra t io n at 0 C. This may suggest a ir contamination: There is a strong corre la tion of kHe, Ne and Ar
contents w ith depth (Figure 8 ) , which might be due to the uptake of entrained a ir d isso lv ing under increased hydrostatic pressure. When the Ne contents are used to correct for i t £14] the resu lting Ar contents remain much above "atmospheric concentrations" (Table H ) , but Kr and Xe no longer show any enhanced concentration leve ls . These enhanced Ar contents are ■ presently not explained and despite some minor doubts about the v a lid ity o f these corrections i t may be noted tha t the corrected Kr and Xe contents would ind ica te tha t the deeper water was recharged a t temperatures between 0 and 2°C w h ils t the shallower samples from the 330 m levels in f i l t r a te d at s ig n if ic a n tly higher temperatures (3 - 5°C). S lig h t ly higher temperatures would be obtained i f the Ne correction had been based on Ne s o lu b il ity at 5 С rather than the 0°C used.

о оTABLED. INERT GAS CONTENTS OF THE STRIPA GROUNDWATERS (cm STP/cm H20)
Sample Depth (m) No.
Date of collection
4 He
x 10'8
Ne
x Ю"7
Ar
x 10'4
Kr
x Ю'7001о
OI
X x
M3 borehole
16 338-352 14-2-78 a) 30300 3.61 6.26 1.21 1.56
b) 42200 4.22 6.52 1.21 1.58
29-3-78 30500 3.38 6.19 1.20 1.50
410 m level borehole
29 786.5-881 14-2-78 a) 156000 6.29 9.69 1.49 1.77
b) 129000 6.13 9.62 1.48 1.75
29-3-78 86000 4.31 9.12 1.50 1.86
59 810-840 20-11-78 a) 52200 4.70 7.95 1.48 1.92
b) 68000 4.13 7.21 1.37 1.77'
69 742-769.4 30-1-79 100000 6.26 8.16 1.46 1.78
Inert gas contents after correction of Ne contents to 2.3 x 10 cm3STP/cm3 H?0
M3 borehole
16 338-352 14-2-78 a) 30300 2.30 5.57 1.13 1.50
b ) 42200 2.30 5.51 1.09 1.49
29-2-78 30500 2.30 5.62 1.13 1.45
AVERAGE AND EQUIVALENT TEMPERATURE 5.57 (<0o°C) 1.12 (3.2°C) 1.48 (4.9°C)
410 m level borehole
29 786.5-881 14-2-78 a) 156000 2.30 7.58 1.24 1.59
b) 129000 2.30 7.60 1.24 1.58
29-3-78 86000 2.30 8.06 1.37 1.77
59 810- 840 20-11-78 a) 52200 2.30 6.68 1.34 1.81
b) 68000 2.30 6.24 1.25 1.69
69 742-769.4 30-1-79 100000 2.30 6.07 1.21 1.60
AVERAGE AND EQUIVALENT TEMPERATURE 7.04 (<0°C) 1.28 (0°C) 1.67 (1,8°C)
AIR SATURATED WATER AT 0°C . 5.09 2.35 5.00 1.27 1.79

IAEA-SM-243/6 357
D E P T H (m ) D E P T H (m)
FIG.8. Helium, neon and argon contents at different sampling points are shown in this figure.
Neon and argon data are relative to saturation with atmospheric air at 0°C.
The overall observation, however, is , that the groundwaters discharging at the various mine levels were recharged under cooler climatic conditions than the young groundwaters sampled in the shallow wells. This supports the statements made in the section on stable isotope analyses.
5.2 Groundwater Age Determinations
In the subsurface environment, the dissolved gases may be supplemented by radiogenic ‘♦He, 40Аг and 2 2 2 Rn. Assuming that all the 4He generated by the decay of uranium and thorium is dissolved by the interstitial water, the rate at which the ^He increases is given by the equation
Herate of solution
р .ф 'Ч и Э x 10-1 3 (U)
(Th)] cm3STPy-1 cm'3H20
+ 0.288 x 1 0 '■13
where p = bulk density of the rock and ф = fractional porosity, (U) and (Th) are uranium and thorium contents in ppm. I t is possible to u ti l ize this relationship to determine groundwater ages from helium concentration in the groundwater provided uranium contents of the rocks (thorium can be assumed to be about four times as abundant as uranium) and porosity are known [16].
At Stripa the total porosity of the granitic rock was measured to be close to 1 0 - 2 and uranium contents in the mine area were determined from borehole samples to be between 30

358 FRITZ et al.
and 160 ppm with an average value close to 45 ppm. With this average value and the measured 4He concentrations the calculated water ages would be close to 1.4 x 10⁵ years at the 330 m levels and close to 6 x 10⁵ years at the bottom of the 410 m hole. These are considerably higher age estimated than those ■ derived from the lltC data, even without assuming that some helium might have been lost from the waters during their long subsurface history.
Maximum effective matrix porosity can also be calculated from 222Rn released under laboratory conditions [17]. For the Stripa granite these tests on rock samples from the 330 m and 410 m levels yield a maximum matrix effective porosity of about 7 x 10"3. With this value the water age at the 330 m would be reduced to ~ 8 x 10ц years, and at the bottom of the 410 m hole to ~ 2 x 10⁵ years. Higher uranium and thorium contents and/or lower porosities would further reduce these ages, but unless more data on rock chemistry and local uranium enrichments are available no reasonable estimates can be made.
The rate at which 40Аг atoms are produced by Ц0К decay is much less than the 4He production rate because of the low abundance of Ц0К and the fact that only 11% of 40К decays produce 40Аг. However, isotopic analyses have shown that the argon dissolved in the Stripa groundwaters contain a few per cent of this radiogenic 40Аг. The following ratios of 40Аг/ЭбДг were measured:
Atmospheric argon = 295.5Stripa 16, dissolved argon (330 m level) = 302.8Stripa 29, dissolved argon (410 m hole) = 315.6This enrichment in radiogenic argon could reflect an
increasing age with depth of these groundwaters, and, for normal release rates, very high groundwater ages would have to be assumed. However, many minerals are very effective in retaining their radiogenic argon contents and i t is not known whether the mining and drill ing activities in the area as well as the release of hydrostatic pressures through the flowing wells could induce an enhanced release of such accumulated radiogenic argon (and helium). A long term monitoring program at the test site should provide an answer.
The 222Rn content of a groundwater is determined by the uranium content and porosity of the aquifer. I f the water/rock contact is greater than 25 days (5 222Rn half-lives) the 222Rn content of the groundwater is in dynamic equilibrium with the 222Rn generating rock phase. 222Rn is a daughter of 226Ra and their relationship in a groundwater will depend on the respective release mechanisms from the rocks. At Stripa the 226Ra contents of the groundwaters are much lower than their 222Rn contents because in order to generate an aqueous radium phase direct 226Ra recoil into the water must occur,whereas 222Rn
IAEA-SM-243/6 359
contents can be enhanced by diffusion (through pressure release in the system?). I t is possible that the 226Ra recoil rate is in equilibrium with the 226Ra decay in solution. This view is supported by the observation that the 226Ra contents in groundwaters at the 330 m levels and the 410 m holes are similar (TableUT). This requires that the water residence time is at least five half-lives of 2 2 6Ra, i .e . greater than 8000 years in order to reach 97% equilibrium.
Conclusions: Groundwater ages estimated from inert gas contentsand argon isotope ratios indicate that these groundwaters are probably many thousands of years old--as already suggested by the 14С measurements. The age would increase with depth and the deepest waters could have ages exceeding 105 years. For absolute age determinations factors such as porosity, gas release rates under the test site conditions and uranium contents in the rocks would have to be better known.
6 . URANIUM DATING
238U decays to 234U and one would expect that most natural systems containing uranium would be in a state of equilibrium with respect to the activities of the two uranium isotopes where the activity ratio A2 3 4 /A238 = 1. During the 1950s, however, Russian researchers discovered that most natural waters are enriched in 2 3 4U, and that a disequilibrium •is maintained.
The cause of disequilibrium has been the topic of many discussions, which were recently summarized in an article by Osmond and Cowart [18]. I t has been proposed that the magnitude of the disequilibrium and its change within an aquifer could be used for groundwater dating purposes. Several models can be considered.
Excess 234U could build up in confined groundwater bodies as a result of the continuous addition of 234Th injected from the rock matrix because of alpha recoil [19][20]. The age o f . the water could be calculated i f the in i t ia l activity ratio were known. In our case this would signify that the waters at the 330 m levels are considerably older than those in deeper fracture systems.
However, one could also argue that the activity ratio should decrease within a well-defined groundwater flow system; this decay would be an indication of age [21][22]. The deeper groundwaters would then be older than the young ones.
The latter model was used by Barr and Carter [22] to determine the possible age of brines encountered in a salt dome. Addition or loss of uranium are assumed to have no effect on the activity ratios and thus differences in excess

TABLE III. URANIUM, RADIUM AND RADON IN STRIPA GROUNDWATERS
S t r i p a L a b o r a to r y 3 Sample
Sampling Depth (m) below ground s u r fa c e
T o ta l d is s o lv e d i n o r g . c a rb . ^ ( l o g m o les /L )
Uranium(u g /L )
234u/2 3 8 u
A c t i v i t yR a t io
222Rn(uC i / L ) 226R a (p C i /L )
P r i v a t e W e l ls , s h a l lo w groundwate r
21-7 FSU < 100 -2 .8 5 1.61 3.11
23-9 FSU < 100 -2 .7 8 2.84 2.62 - -
23 U o f 8 < 100 2 .26 2 .57 - -
330-m le v e l
16-25
(M3 h o le )
FSU 336-350 -2 .91 8 .2 5 10.75 _ _16-30 FSU " 9.22 10.65 - -
16 U o f В " . 8 .33 10.70 1 .3 34
16 AT " — — - 1 .9 -
410-m l e v e l
17 AT 416-460 .. 0 .48 __17-30 FSU 416-460 -3 .0 7 10.43 5.55 - -
24-5 FSU 410-880 -3 .1 7 6.24 5.87 - -
6 FSU 560-880 -3 .4 4 4.56 3.87 - -
15-3 FSU 695-880 -3 .4 2 4.12 4 .08 - - -
29 U o f В 786-880 -3 .81 1.03 4 .02 0 .56 40
a ) F S U : F l o r i d a S t a t e U n i v e r s i t y , U . S . A .U o f В : U n i v e r s i t y o f B a t h , G r e a t B r i t a i n .A T : A B A t o m e n e r g i , S w e d e n .
b ) F i e l d d e t e r m i n a t i o n s .
360 FRITZ
et al.
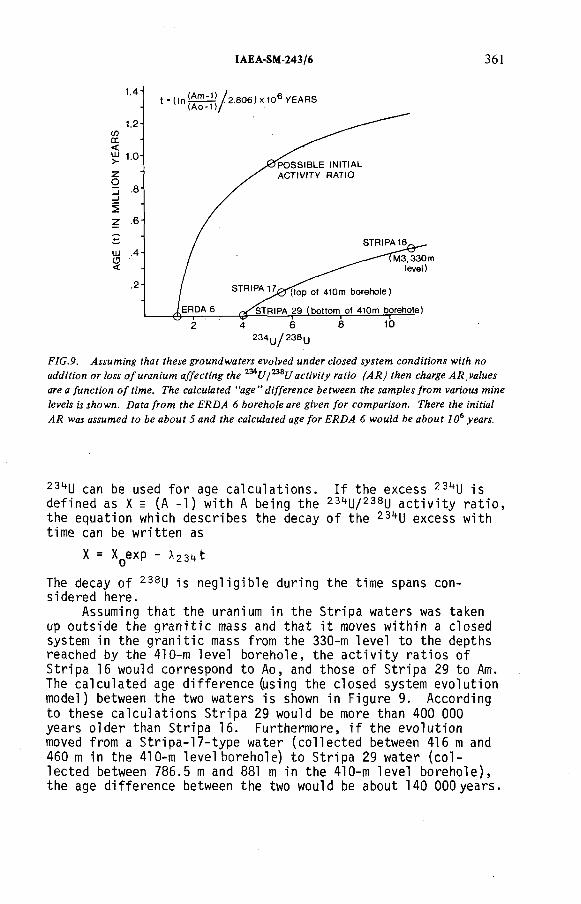
IAEA-SM-243/6 361
FIG.9. Assuming that these groundwaters evolved under closed system conditions with no
addition or loss o f uranium affecting the ^ U / ^ U activity ratio (AR) then charge AR values
are a function of time. The calculated “age ” difference between the samples from various mine
levels is shown. Data from the ERDA 6 borehole are given for comparison. There the initial
AR was assumed to be about 5 and the calculated age for ERDA 6 would be about 106 years.
234U can be used for age calculations. I f the excess 231tU is defined as X = (A-1) with A being the 234U/238U activity ratio, the equation which describes the decay of the 23IfU excess with time can be written as
X = XQexp - x231|fc
The decay of 238U is negligible during the time spans considered here.
Assuming that the uranium in the Stripa waters was taken up outside the granitic mass and that i t moves within a closed system in the granitic mass from the 330-m level to the depths reached by the 410-m level borehole, the activity ratios of Stripa 16 would correspond to Ao, and those of Stripa 29 to Am. The calculated age difference (using the closed system evolution model) between the two waters is shown in Figure 9. According to these calculations Stripa 29 would be more than 400 000 years older than Stripa 16. Furthermore, i f the evolution moved from a Stripa-17-type water (collected between 416 m and 460 m in the 410-m level borehole) to Stripa 29 water (collected between 786.5 m and 881 m in the 410-m level borehole), the age difference between the two would be about 140 000years.
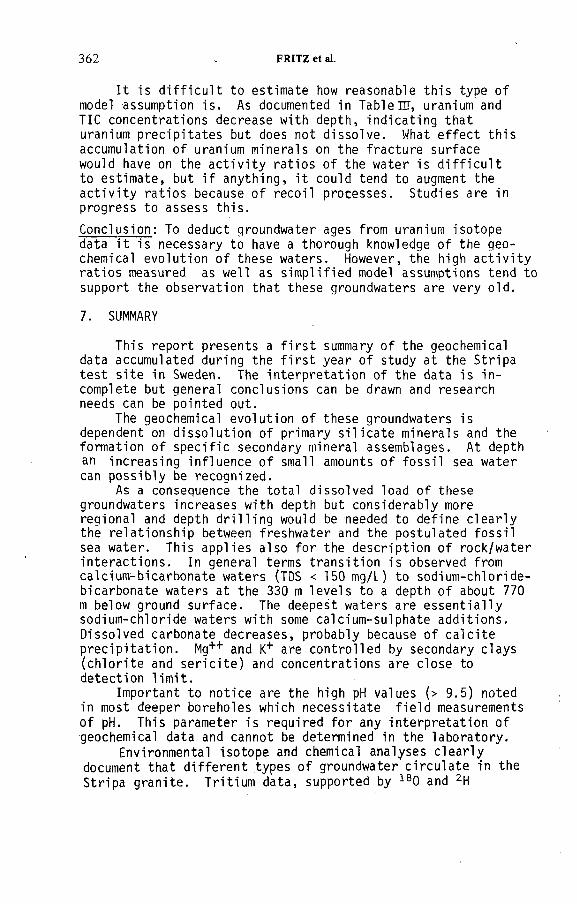
362 FRITZ et al.
I t is d if f icu lt to estimate how reasonable this type of model assumption is. As documented in Table Ш, uranium and TIC concentrations decrease with depth, indicating that uranium precipitates but does not dissolve. What effect this accumulation of uranium minerals on the fracture surface would have on the activity ratios of the water is d if f icu lt to estimate, but i f anything, i t could tend to augment the activity ratios because of recoil processes. Studies are in progress to assess this.
Conclusion: To deduct groundwater ages from uranium isotope data i t is necessary to have a thorough knowledge of the geochemical evolution of these waters. However, the high activity ratios measured as well as simplified model assumptions tend to support the observation that these groundwaters are very old.
7. SUMMARY
This report presents a f irs t summary of the geochemical data accumulated during the f irs t year of study at the Stripa test site in Sweden. The interpretation of the data is incomplete but general conclusions can be drawn and research needs can be pointed out.
The geochemical evolution of these groundwaters is dependent on dissolution of primary silicate minerals and the formation of specific secondary mineral assemblages. At depth an increasing influence of small amounts of fossil sea water can possibly be recognized.
As a consequence the total dissolved load of these groundwaters increases with depth but considerably more regional and depth drill ing would be needed to define clearly the relationship between freshwater and the postulated fossil sea water. This applies also for the description of rock/water interactions. In general terms transition is observed from calcium-bicarbonate waters (TDS < 150 mg/L) to sodium-chloride- bicarbonate waters at the 330 m levels to a depth of about 770 m below ground surface. The deepest waters are essentially sodium-chloride waters with some calcium-sulphate additions. Dissolved carbonate decreases, probably because of calcite precipitation. Mg++ and K+ are controlled by secondary clays (chlorite and sericite) and concentrations are close to detection lim it.
Important to notice are the high pH values (> 9.5) noted in most deeper boreholes which necessitate fie ld measurements of pH. This parameter is required for any interpretation of geochemical data and cannot be determined in the laboratory.
Environmental isotope and chemical analyses clearly document that different types of groundwater circulate in the Stripa granite. Tritium data, supported by 180 and 2H

IAEA-SM-243/6 363
analyses, confirm that at present no measurable amounts of modern surface waters enter the test excavations despite the enormous hydraulic sink generated by the long mining activ ities.
180 and 2H contents show that the discharging into mine level d r i l l holes recharged under cooler climatic conditions than exist today in the area. However, their a3C content indicate that this recharge occurred through vegetated soil.
Groundwater age determination done with 11+C and elements of the uranium decay series strongly indicate that groundwater discharging 330 to 460 m below ground surface is older than about 25 000 years. Some discrepancy exists, however, with respect to the deepest samples. 14C would indicate that these waters are younger whereas 4He contents, argon isotope ratios, and uranium and radon isotope data suggest that the deep waters are older than those at the 330 m levels. Contamination of the 14C samples cannot be excluded and, therefore, a final interpretation will depend on better conventional or accelerator ^C data.
I t is evident that although attempts to date these groundwaters met some success our overall ab il ity to attach an age to a given watermass in crystalline rocks is s t i l l limited. Much more information about the geochemical evolution of groundwater in these rocks is needed before any of the techni- ques--including those not employed in Stripa, e.g. 36Cl--can be used for absolute age dating. However through regional, hydrogeologic studies i t should be possible to obtain at least relative ages--and in this study we are confident that future sampling from additional d r i l l holes will lead to a much better definition of water ages in this granite.
No problems were encountered, however, with the application of stable isotope techniques. Such analyses were essential in defining the individual flow system and future work aims at an integration of these data with information from fracture hydrogeolgic studies. This should result in an actual definition of flow paths--which would be an essential piece of information in any repository study.
8. ACKNOWLEDGEMENTS
The progress made in the geochemical program of the Stripa project could not have been achieved without the help of the staff of the Lawrence Berkeley Laboratory (LBL), University of California, U.S.A.; Department of Earth Sciences, University of Waterloo, Canada; the International Atomic Energy Agency, Section for Isotope Hydrology, Vienna, Austria; and Karnbranslesâkerhet (KBS) and Sveriges Geologiska Undersükning (SGU), both of Stockholm, Sweden, as well as the various laboratories providing analyses. The assistance of Staillbergsbologen personnel, particularly P-А. Halén and 0.

364 FRITZ et al.
Hagstrtim, is also gratefully acknowledged. The sampling program at Stripa was carried out with the particular assistance of T. Doe (LBL), C. Forster and 0. Ouinn (University of Waterloo), and К-E. Almén, P. Hammargren, K. Hansson, and L. Ekman, ail of SGU. The manuscript has greatly benefited from discussions with J. Turner (CSIRO, Australia).
This work was supported by funds from contract #W-7405- ENG-48 to the Lawrence Berkeley Laboratory under Purchase Order 478 3902 and through WRI contract 803-12 as well as funds from the National Research Council of Canada given to P. Fritz (grant #A7954).
REFERENCES
[1] OLKIEWICZ, A., HANSSON, K., ALMEN, К. E. and GIDLUND, G., Geologisk och hydrogeologiske grund documentation av Stripa fërsttksstation, К.В.S. Tech. Rep. 63, Stockholm (1978).
[2] FRITZ, P., BARKER, J. F., and GALE, J. E., Geochemistry and Isotope Hydrology of groundwaters in the Stripa granite, Univ. of California, Lawreece Berkeley Laboratories, Berkeley, Rep. LBL-8285, in press.
[3] PLUMMER, C. N., JONES, B. F., and TRUESDELL, A. H.,WATEQF - A Fortran IV version of WATEQ, a computerprogramme for calculating chemical equilibrium of natural waters, U.S.G.S. Water Resource Investigations 76-13 (1976).
[4] JACKS, G., Chemistry of some groundwaters in igneousrocks, Nordic Hydrology 4 4 (1973) 207.
[5] LAHERMO, P., On the hydrology of the coastal region ofsoutheastern Finland, Geol. Surv. of Finland, Bull. 252 (1971).
[6] FLEXSER, S., Description of thin sections from borehole N1 in the timescale room, Univ. of California, Lawrence Berkeley Laboratories, unpublished manuscript (1978).
[7] CRAIG, H., Isotopic variations in meteoric waters, Sci., 133 (1961) 1702.
[8] DANSGAARD, W., Stable isotopes in precipitation, Tellus 16 (1964) 436.
[9] MOSER, H. and STICHLER, W., Environmental isotopes in ice and snow, In Handbook on Environmental Isotope Geochemistry. Eds. P. Fritz and J. C. Fontes. Elsevier Pub. Co. Amsterdam (1979), in press.
IAEA-SM-243/6 365
[10] REARDON, E. J. and FRITZ, P., Computer modelling ofGroundwater 13C and 14C isotope compositions, J. Hydro1. 36 (1978) 201.
[11] FONTES, J. C. and GARNIER, J. М., Determination of the in it ia l 14C activity of the total dissolved carbon A Review of the existinq models and a new approach, Wat.R p ç n i i r r p ^ D p c ( I Q / Q i
[12] CHERRY, J. A.'.’ dESAULNÍeR, D. E., FRIND, E. 0 ., FRITZ,P., GAEVERT, D. H., GILLHAM, R. W. and LELIEVRE, B. , Hydrogeologic properties and pore water origin and age: clayey t i l l and clay in South Central Canada, In Proc. Workshop on "low flow, low permeability measurements in largely impermeable rocks. 0ECD,NEA, Paris, (1979) in press.
[13] MAZOR, E., Paleotemperatures and other hydrologicalparameters deduced from noble gases dissolved in groundwaters; Jordon Rift Valley, Israel. Geochim. Cosmochim. Acta 36 (1972) 1321.
[14] MAZOR, E., Geothermal tracing with atmospheric andradiogenic noble gases, Geothermics, _5 (1 976) 21.
[15] ANDREWS, J. N. and LEE, D. J . , Inert gases in Bunter Sandstone groundwaters as indicators of age and paleo- climatic trends, J. Hydrol. 41(1979) 233-252.
[16] MARINE, W. I . , Geochemistry of groundwater at the Savannah River Plant, Report to ERDA by DuPont De Nemours and Co., No. DP 1356, Aiken, South Carolina, (1976).
[17] ANDREWS, J. N. and WOOD, D. F., Mechanisms of radon release in rock matrices and entry into groundwater,Inst. Min. Metall., Transact. Sect. B, 81_ 792 (1972)В 198.
[18] OSMOND, K. and COWART, J. B., The theory and uses ofnatural uranium isotopic variations in hydrology, Atom. Energy Rev. 1_4 (1976) 589.
[19] KIGOSHI, K., Alpha recoil thorium-234: dissolution intowater and the uranium-234/uranium-238 disequilibrium in nature, Science 173 (1971) 47.
[20] KRONFELD, J . , GRADSZTAJN, E., MULLER, H. W., RADIN, J . ,YANIV, A., ZACH, R., Excess 234U: an aging effect inconfined waters, Earth Planet Sci. Lett. 27 (1975) 342.
[21] KRONFELD, J. and ADAMS, A. S., Hydrologie Investigations of the groundwaters of central Texas using U-234/U-238 disequilibrium, J. of Hydroloqy, Vol. 22 1/2 (1974) 77.
[22] BARR, G. E.; LAMBERT, S. J. and CARTER, J. A., Uranium isotope disequilibrium in groundwaters of southeastern New Mexico and implications regarding age dating of waters, Proc. Symp. Isot. Hydro!., I.A.E.A., Neuherberg, June 1978, Symp. 228-28, 2 (1979) 645.
366 FRITZ et al.
DISCUSSION
J. S. SCOTT: You noted in your paper that mining had been carried out at
Stripa over a period of 400 years and that a significant groundwater sink had been
created by mining operations. However, you do not appear to take into consider
ation the possible influence of chemicals used during this long period of mining on
the chemistry of the waters which you have analysed.
P. FRITZ: The problem has occurred to us and we have just completed a
sampling programme in the old mine area. However, we believe there is no
problem at most deep sampling points because there the hydraulic gradients are
so high that mine water could not infiltrate and then discharge through the bore
holes.
G. V. EVANS: In the United Kingdom we have seen that there is a similarity
between groundwater and precipitation. This therefore suggests that the surface
waters you measured for 180 and D were not recent run-off. Can you please
explain this?
P. FRITZ: The surface run-off analysed must, to a large extent, represent
shallow bog and lake discharge and not normal groundwater since surface
evaporation has affected these waters. Shallow groundwater does not normally
show this evaporation effect. We give these surface water analyses primarily
because ponds and small lakes are so close to the mine area that minor leakage
from them into the excavation sites might have been possible. The results support
our view that at best very minor amounts of surface water do actually reach the
test area.
G. V. EVANS: Tritium is a somewhat coarse indicator of the presence of
modern water as its measurement is only 2—3 orders of magnitude below present
levels. Consequently, its presence in older waters is identified only to within the
measurement sensitivity. The waters from the 330 m level may contain such
waters and the 14C age of 25 000 years may be due to contamination by a modem
component. It follows therefore that many samples should be processed and
measured in different batches to reduce the random error component in the mean
values. Could you indicate what was the measurement sensitivity of the tritium
measurements and how many samples were measured? In other words, how sure
are you that no modern surface waters penetrate the mine levels?
P. FRITZ: I agree with your comment. We are at present looking for
techniques which would allow us to state conclusively whether any surface water
enters the test site. At present we cannot rule out an influx of less than 5%
surface water.

IAEA-SM-243/37
LABORATORY STUDIES OF RADIONUCLIDE
TRANSPORT IN GEOLOGIC MEDIA*
B.R. ERDAL, B.P. BAYHURST, B.M. CROWE,
W.R. DANIELS, D.C. HOFFMAN, F.O. LAWRENCE,
J.R. SMYTH, J.L. THOMPSON, K. WOLFSBERG
Los Alamos Scientific Laboratory,
Los Alamos, New Mexico,
United States of America
Abstract
LABORATORY STUDIES OF RADIONUCLIDE TRANSPORT IN GEOLOGIC MEDIA.
A systematic study of some of the parameters that may affect sorption of radionuclides
in geologic media is reported. All studies were made on three media, a quartz monzonite, an
argillite, and several lithologie varieties of tuff. The nuclides studied were 85Sr, 9smTc, 137Cs,
141Ce, 1S2Eu, 237,239p u , and 241 Am. The parameters studied were time, temperature,
exchange capacity, available surface area, particle size, element concentration, groundwater com
position, and of course, mineralogay. Sorption tends to increase somewhat with time. Particle
size and available surface area are important for granitic-type materials. The dependence of the
amount of sorption on temperature depends on the system studied. Sorption of technetium (VII)
and uranium (VI) is generally low except when fine sieve fractions are used. A proper method
for making batch measurements was developed, in which the solid and aqueous phases are assayed
for radioactivity. Detailed studies of the behaviour of plutonium and americium in aqueous solu
tions at pH « 8 were made.
1. INTRODUCTION
The acquisition of the scientific and technical knowledge needed to assess the risks due to movement of radionuclides dissolved in and transported by groundwaters is one of the major needs for any successful nuclear waste isolation program. There are many interrelated factors which may influence the transport of radionuclides by groundwater. These include the chemical properties of the groundwater, the groundwater flow rate, the mineralogy along the flow path, the exchange capacity of the rock, the available surface area, the temperature, and the kinetics of the partition reactions. The effects of some of these variables on the sorption and transport properties are being systematically investigated [1-5] at the Los Alamos Scientific Laboratory. Currently, all studies have been performed on three media specific to the Nevada Test Site (NTS). These are a quartz
Work performed under the auspices of the US Department of Energy.
367
368 ERDAL et al.
monzonite porphyry (Climax Stock), an argillite (Eleana Formation), and several lithologie varities of rhyolitic tuff (Paint Brush and Crater Flat from western Jackass Flats).
2. EXPERIMENTAL
A. Geologic Materials
The Climax stock "granite" was obtained from the mine dump area of the Pile Driver-Hard Hat tunnel complex at the NTS. The samples were pulverized and graded with sieves, and the 106-150 ym, 250-355 ym, and 500-850 ym fractions were selected for study. Pétrographie analyses using thin-sections of these fractions indicated [ 3] that both are quartz monzonites having roughly equal amounts of plagioclase and K-feldspar. They contain 24-40% quartz, 48-66% feldspars, 5-10% biotite and chlorite, and 1-2% sphene and apatite. The grain size of the rock is considerably larger than the fragment size of the grain mounts,which resulted in some mineralogical fractionation during size sorting. The quartz was enriched in the smaller grain sizes relative to feldspar. In addition, the opaque phases (magnetite, ilmenite) appeared to be concentrated (5-8%) in the smallest size fraction and to have reacted in some cases to form agglutinates of grains. Secondary clay-rich alteration bands were observed in the feldspars. Many accessory minerals have also been identified [ 6].
The Eleana argillite was obtained from drill hole UE17e in the upper part of Unit J of the Eleana Formation at the NTS.The hole is within the Syncline Ridge structural block. The samples studied were from depths of 365 m and 548 m. The samples were pulverized and graded with sieves, and the 106-150 ym and 355-500 ym fractions were selected for study. Pétrographie analyses using thin-sections of these fractions indicated [ 4] that they contain 25-35% detrital quartz with minor amounts (<4%) of other detrital phases (mostly feldspars) in a ground- mass of hematite (5-9%) and clay minerals. X-ray analyses indicated that the principal clay is montmorillonite with minor amounts of kaolinite. Several other minerals have also been identified [7,8]. All size fractions appeared to have a bimodal distribution of quartz grain sizes in the various fragments.Modal analyses did not indicate any significant mineralogical fractionation with size-sorting. This is consistent with the grain size of individual minerals being much smaller than the smallest fragment.
Tuff occurs in large volumes in many areas in the Great Basin of the western United States. Tuff is the general name applied to pyroclastic rocks composed of particles fragmented
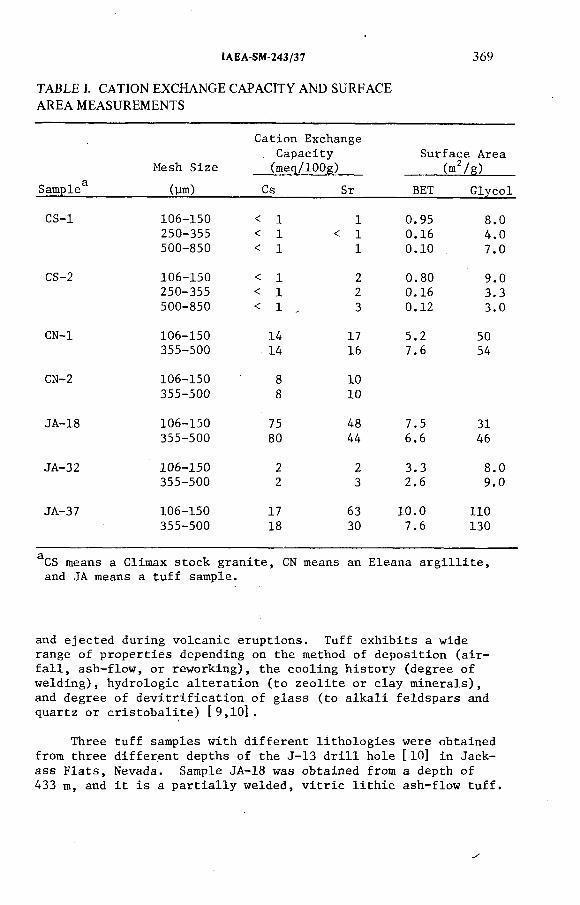
IAEA-SM-243/37 369
TABLE J. CATION EXCHANGE CAPACITY AND SURFACE
AREA MEASUREMENTS
Sample3Mesh Size
(ym)
Cation Exchange Capacity (meq/100g)
Surface Area(m2/g)
Cs Sr BET Glycol
CS-1 106-150 < 1 1 0.95 8.0250-355 < 1 < 1 0.16 4.0500-850 < 1 1 0.10 7.0
CS-2 106-150 < 1 2 0.80 9.0250-355 < 1 2 0.16 3.3500-850 < 1 „ 3 0.12 3.0
CN-1 106-150 14 17 5.2 50355-500 14 16 7.6 54
CN-2 106-150 8 10355-500 8 10
JA-18 106-150 75 48 7.5 31355-500 80 44 6.6 46
JA-32 106-150 2 2 3.3 8.0355-500 2 3 2.6 9.0
JA-37 106-150 17 63 10.0 110355-500 18 30 7.6 130
aCS means a Climax stock granite, CN means an Eleana argillite, and JA means a tuff sample.
and ejected during volcanic eruptions. Tuff exhibits a wide range of properties depending on the method of deposition (air- fall, ash-flow, or reworking), the cooling history (degree of welding), hydrologie alteration (to zeolite or clay minerals), and degree of devitrification of glass (to alkali feldspars and quartz or cristobalite) [9,10].
Three tuff samples with different lithologies were obtained from three different depths of the J-13 drill hole [ 10] in Jackass Flats, Nevada. Sample JA-18 was obtained from a depth of 433 m, and it is a partially welded, vitric lithic ash-flow tuff.

370 ERDAL et al.
Sample JA-32 came from a depth of 772 m,' and it is a partially welded (approaching densely welded), devitrified, ash-flow tuff.It is mineralogically similar to a granite. Sample JA-37 was obtained from a depth of 1066 m, and it is a zeolitized ash- flow tuff with complete alteration of the glass fragments. The tuff samples were pulverized and graded with sieves, and the 106-150 ym and 255-500 ym fractions were selected for study.
The cesium and strontium cation exchange capacities [ ll] and measured surface areas of these materials are given in Table I.The surface areas were measured by the gas adsorption' (BET) method [ 12] and th'e equilibrium ethylene glycol method [ 12-15] . Generally, very little differences due to particle size were observed. Low exchange capacities and surface areas seem to be typical of granitic or granite-like rocks. High cation exchange capacities are associated with fresh glass and zeolites. High surface areas are associated with clays and zeolites. The reason the surface areas measured by the ethylene glycol method are higher than those obtained by the BET method is probably that the BET method does not include the internal surface areas of the clays.
B. Groundwaters
When these studies were begun no natural groundwater representative of the Climax stock system was available. Therefore, a "synthetic" water was used. The composition of this water was taken from the report of Feth et al. [l6j. This composition is the mean value from selected perennial springs from granodiorite in the Sierra Nevada.
The water used for the Eleana argillite studies was made up in the laboratory to simulate the composition of a natural groundwater from hole UEl6d at the NTS [ 4]. This water is not strictly an Eleana water since virtually all of the production from hole UE16d was from the Tippipah limestone formation overlying the Eleana. Only a small amount of production was from the uppermost quartzites within the Eleana argillite in this hole. This water is therefore representative of waters that would enter the Eleana from above.
The water used for the tuff studies was a natural groundwater from the same hole where the geologic materials were obtained. This hole is now a water well.
Rock pretreated water was used in all the sorption measurements. This was prepared by contacting batches of the "synthetic" or natural water with pulverized material that had not been sieved. The contact time was at least two weeks with a solution
v
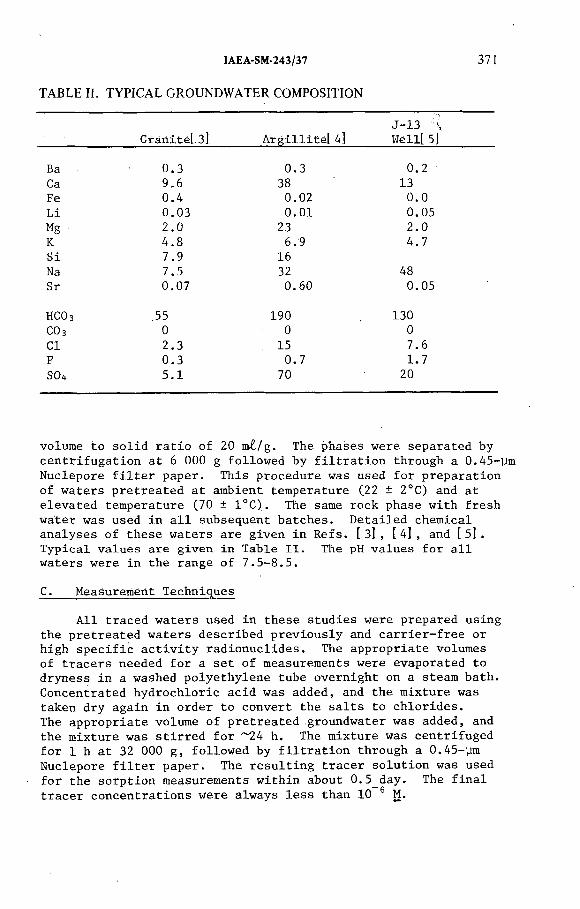
IAEA-SM-243/37 371
TABLE II. TYPICAL GROUNDWATER COMPOSITION
Gráriité[:3l Argillité[ 4]J-13 4 Wéll[ 5]
Ba 0.3 0.3 0.2Ca 9.6 38 13Fe 0.4 0.02 0.0Li 0.03 0.01 0.05Mg , 2.0 23 2.0К 4.8 6.9 4.7Si 7.9 16Na 7.5 32 48Sr 0.07 0.60 0.05
НСОз .55 190 130C03 0 0 0Cl 2.3 , 15 7.6F 0.3 0.7 1.7SO it 5.1 70 20
volume to solid ratio of 20 m¿/g. The phases were separated by centrifugation at 6 000 g followed by filtration through a 0.45-ym Nuclepore filter paper. This procedure was used for preparation of waters pretreated at ambient temperature (22 ± 2°C) and at elevated temperature (70 ± 1°C). The same rock phase with fresh water was used in all subsequent batches. Detailed chemical analyses of these waters are given in Refs. [ 3], t 4], and f 5]. Typical values are given in Table II. The pH values for all waters were in the range of 7.5-8.5.
C. Measurement Techniques
All traced waters used in these studies were prepared using the pretreated waters described previously and carrier-free or high specific activity radionuclides. The appropriate volumes of tracers needed for a set of measurements were evaporated to dryness in a washed polyethylene tube overnight on a steam bath. Concentrated hydrochloric acid was added, and the mixture was taken dry again in order to convert the salts to chlorides.The appropriate volume of pretreated groundwater was added, and the mixture was stirred for ~24 h. The mixture was centrifuged for 1 h at 32 000 g, followed by filtration through a 0.45-ym Nuclepore filter paper. The resulting tracer solution was used for the sorption measurements within about 0.5_day. The final tracer concentrations were always less than 10 6 M.

372 ERDAL et al.
Batch sorption experiments were performed at ambient temperature and 70°C. One-gram quantities of the crushed rock were shaken with 20 m£ untraced non-pretreated water for a period of about two weeks. The phases were then separated by centrifuging at 32 000 g for 1 h. The weight of the wash solution remaining with the solid phase was obtained by weighing the tube and solid before and after the pretreatment. A 20-m£ volume of the tagged pretreated water was then added to the tube, the solid sample was dispersed with vigorous shaking, and the mixture was agitated gently for a given time. Typically, 1, 2, 4, and 8 week contact times were used. At the end of the shaking period, the aqueous phase was separated from the solids by 4 centrifugings, each in a new polyethylene centrifuge tube for 1 h at 32 000 g.
The same sorption procedure was also performed using a tube that did not have a solid phase present. This "control" sample was used to indicate if any of the radionuclides were likely to be removed by the container. In all cases, the cesium remained completely in solution. However, this was not the case for most other nuclides studied. It was shown that the amount of sorption on the container varied, depending on whether or not solid material was present, since elements appear to absorb on any available surface. Therefore, the presence of a solid phase would tend to reduce the fraction of the activity adsorbed on the container. This effect is especially large when crushed rock solid phases are used since they have a surface area appreciably larger than that of the container.
In order to determine the amount of activity remaining with the solid phase, whether due to sorption, precipitation, centrifugation of a colloid with the solid, or by some other mechanism, a fraction ( 25%) of the solid was removed for radioactivity assay. The solid phase was well mixed prior to removal of the fraction. The fraction of the solid removed was determined from the activity of 137Cs in the solid aliquot, in the solution, and in the initial solution. This method is reasonable since cesium did not absorb on the container walls. A check was made by weighing the tube before and after removing the sample. In the plutonium and americium studies the entire solid phase was assayed for radioactivity.
Desorption measurements were also made using the radioactively tagged solids from the sorption experiments and fresh rock- equilibrated water (15 m i) . The same experimental method was used.
Several different sets of measurements were made. The isotopes 85Sr, 137Cs, 133Ba, 1‘tlCe, and 152Eu were run as a mixture, as were 95mTc(VII) and 13 Cs. The 237U(VI) was run by
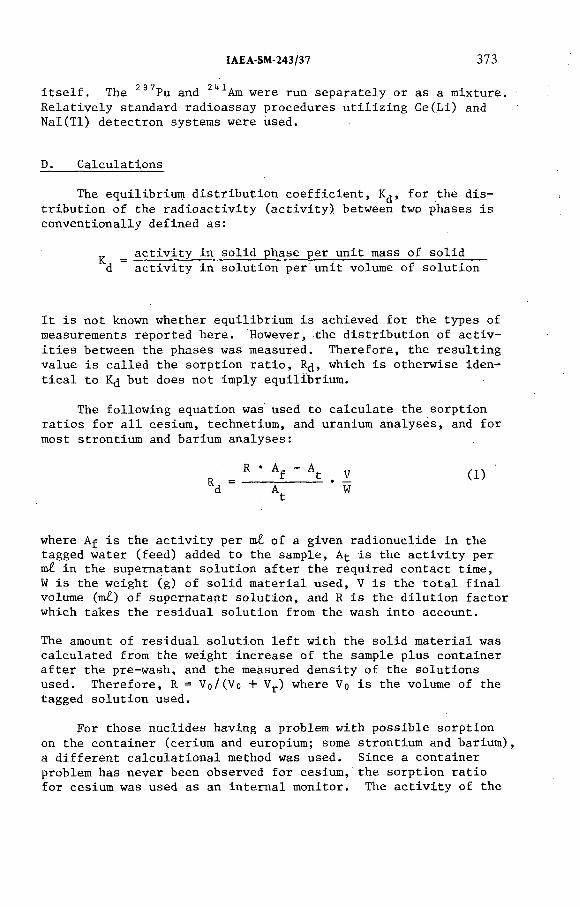
IAEA-SM-243/37 373
itself. The 237Pu and 241Am were run separately or as a mixture. Relatively standard radioassay procedures utilizing Ge(Li) and Nal(Tl) detectron systems were used.
D. Calculations
The equilibrium distribution coefficient, K^, for the distribution of the radioactivity (activity) between two phases is conventionally defined as:
_ activity in solid phase per unit mass of solid d activity in solution per unit volume of solution
It is not known whether equilibrium is achieved for the types of measurements reported here. However, the distribution of activities between the phases was measured. Therefore, the resulting value is called the sorption ratio, R¿, which is otherwise identical to K¿ but does not imply equilibrium.
The following equation was used to calculate the sorption ratios for all cesium, technetium, and uranium analyses, and for most strontium and barium analyses:
_ R • A f - A t v (1)Rd -------Tt W
where Af is the activity per mi of a given radionuclide in the tagged water (feed) added to the sample, A^ is the activity per m£ in the supernatant solution after the required contact time,W is the weight (g) of solid material used, V is the total final volume (m¿) of supernatant solution, and R is the dilution factor which takes the residual solution from the wash into account.
The amount of residual solution left with the solid material was calculated from the weight increase of the sample plus container after the pre-wash, and the measured density of the solutions used. Therefore, R = Vo/(Vo + Vr) where Vo is the volume of the tagged solution used.
For those nuclides having a problem with possible sorption on the container (cerium and europium; some strontium and barium), a different calculaiional method was used. Since a container problem has never been observed for cesium, the sorption ratio for cesium was used as an internal monitor. The activity of the
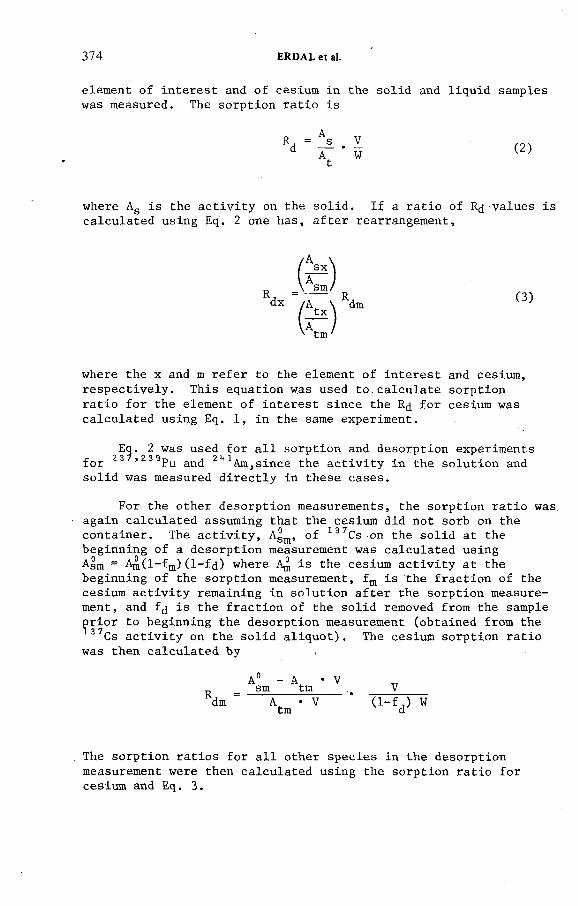
374 ERDAL et al.
element of interest and of cesium in the solid and liquid samples was measured. The sorption ratio is
where A s is the activity on the solid. If a ratio of Rj values is calculated using Eq. 2 one has, after rearrangement,
dx ^ Rdm (3)
where the x and m refer to the element of interest and cesium, respectively. This equation w4as used to.calculate sorption ratio for the element of interest since the R¿ for cesium was calculated using Eq. 1, in the same experiment.
Ecj. 2 was used for all sorption and desorption experiments for 23 ,гз9Ри and 241Am,since the activity in the solution and solid was measured directly in these cases.
For the other desorption measurements, the sorption ratio was again calculated assuming that the cesium did not sorb on the container. The activity, Agm , of 137Cs on the solid at the beginning of a desorption measurement was calculated using A sm = A¿(l-fm ) (l-f<i) where is the cesium activity at the beginning of the sorption measurement, fm is the fraction of the cesium activity remaining in solution after the sorption measurement, and fjj is the fraction of the solid removed from the sample prior to beginning the desorption measurement (obtained from the 37Cs activity on the solid aliquot). The cesium sorption ratio
was then calculated by
A 0 - A • V .._ sm tm Vкdm A • V (1-f ,) Wtm d
The sorption ratios for all other species in the desorption measurement were then calculated using the sorption ratio for cesium and Eq. 3.
IAEA-SM-243/37
TABLE III. REPRESENTATIVE SORPTION RATIOS (ml/g)
375
Granite ArgilliteElement 22°C 70°C 22°C 70°C
Sr 16 38 135 32220 39 126 268
Т с (VII) ~ 30 ~ 10 47 3~ 100 ~ 100 . 17
Cs 320 795 1 990 1 580550 1 370 3 610 2 680
Ba 164 718 3 920 13 200170 750 5 240 31 300
C e (III) 240 41 41 900 10 8001 410 1 050 86 400 17 400
Eu(III) 550 71 36 000 11 4001 500 1 160 . 89 200 42 700
U(VI) 4 3015 39
Pu 1 500 4 200£ 2 100b5 700^ 2 000°Am ' 3 800 75 000 6 500
1 000
aThe second value listed for each element is that obtained from the desorption measurements.
^Results obtained by not filtering the final solution; filtering gives values at least a factor of 4 higher.
3. RESULTS AND CONCLUSIONS
Several general conclusions can be made concerning the relationship of the sorption ratios to the parameters investigated.As expected, there is significant change in the sorption ratios for any of the elements studied with the type of material (see Tables III and IV). The scatter in the sorption ratios is sometimes larger than the estimated experimental uncertainties, assuming that one could expect a constant or monotonie behavior with time. This indicates that strictly identical samples or conditions were not always attained.
The sorption ratios tend to increase somewhat with time.This could be due to alteration of the surface mineralogy even at the rather low temperatures involved in these measurements.

TABLE IV. REPRESENTATIVE SORPTION RATIOS FOR TUFF a
376 ERDAL et al.
ElementVitricb Devitrified^ Zeolitized^*
22°C 70°C 22°C 70°C 22°C 70°C
SrC 13 000 20 000 55 106 300 1 200Csc 6 000 19 000 150 103 740 2 100Ba 4 800 50 000 440c 1 100c 850c 5 000°
30 000 110 000C e (III) 40 43 80 80
180 320 400 600Eu(III) 30 43 90 190 6 000 4 200
150 270 800 1 800 13 000 14 000U(VI) 4 2 4
15 8 8Pu 140 ~ 110 ~ 280Am 190 220 120 110 600 910
aThe second value listed for each element is that obtained from the desorption measurements.
bVitric tuff (JA-18); devitrified tuff (JA-32); zeolitized tuff (JA-37).
cAverage of all the sorption and desorption measurements since all values were within the estimated uncertainties.
According to Helgeson [ 17] , the kinetics of the hydrolysis reactions of silicates is controlled by diffusion of the hydrolysis products from the silicate mineral through a surface layer of intermediate reaction products into the bulk solution. The rate of diffusion is given by the parabolic rate law. The data for granite and argillite appear to be controlled by this diffusion mechanism. The amount of change in the sorption ratio with time is a function of the sorbing element. However, all values in Tables III and IV are simple averages for all contact times.
Diffusion into the solid is also a reasonable explanation for the observation (Tables III and IV) that it is frequently more difficult to desorb a radionuclide than it was to get it onto the solid. This is particularly true for the lanthanides and actinides.
As expected from the mineralogy, surface areas, and cation exchange capacities of the two different granite and argillite
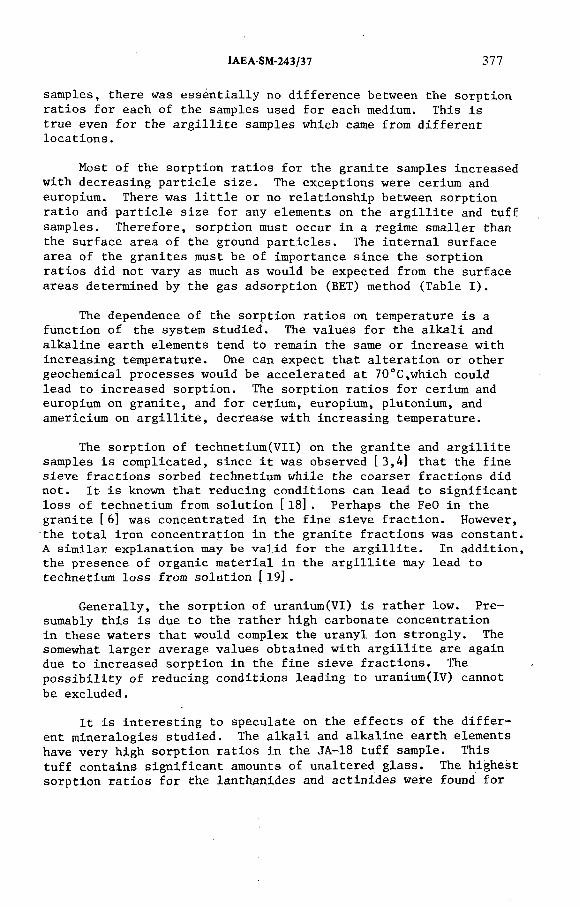
IAEA-SM-243/37 377
samples, there was essentially no difference between the sorption ratios for each of the samples used for each medium. This is true even for the argillite samples which came from different locations.
Most of the sorption ratios for the granite samples increased with decreasing particle size. The exceptions were cerium and europium. There was little or no relationship between sorption ratio and particle size for any elements on the argillite and tuff samples. Therefore, sorption must occur in a regime smaller than the surface area of the ground particles. The internal surface area of the granites must be of importance since the sorption ratios did not vary as much as would be expected from the surface areas determined by the gas adsorption (BET) method (Table I) .
The dependence of the sorption ratios on temperature is a function of the system studied. The values for the alkali and alkaline earth elements tend to remain the same or increase with increasing temperature. One can expect that alteration or other geochemical processes would be accelerated at 70°C,which could lead to increased sorption. The sorption ratios for cerium and europium on granite, and for cerium, europium, plutonium, and americium on argillite, decrease with increasing temperature.
The sorption of technetium(VII) on the granite and argillite samples is complicated, since it was observed [3,4] that the fine sieve fractions sorbed technetium while the coarser fractions did not. It is known that reducing conditions can lead to significant loss of technetium from solution [ 18] . Perhaps the FeO in the granite [ 6] was concentrated in the fine sieve fraction. However, the total iron concentration in the granite fractions was constant A similar explanation may be valid for the argillite. In addition the presence of organic material in the argillite may lead to technetium loss from solution [ 19] .
Generally, the sorption of uranium(VI) is rather low. Presumably this is due to the rather high carbonate concentration in these waters that would complex the uranyl ion strongly. The somewhat larger average values obtained with argillite are again due to increased sorption in the fine sieve fractions. The possibility of reducing conditions leading to uranium(IV) cannot be excluded.
It is interesting to speculate on the effects of the different mineralogies studied. The alkali and alkaline earth elements have very high sorption ratios in the JA-18 tuff sample. This tuff contains significant amounts of unaltered glass. The highest sorption ratios for the lanthanides and actinides were found for
378 ERDAL et al.
the argillite and the zeolitized tuff (JA-32) samples. This indicates that clays and zeolites may have some preference for these elements.
The individual mineral components that were responsible for the sorption of uranium(VI) and americium were identified by a microautoradiographic technique [ 2]. In the granite, most of the sorbed actinides were contained in the secondary clay-rich alteration bands in the feldspars. The argillite samples had preferential sorption on the clay matrix, with small amounts sorbed onto the detrital quartz and secondary calcite. In the tuff specimens, most of these actinides were localized on the secondary zeolite minerals.
It is important to emphasize that the measured sorption ratios for plutonium and americium include effects other than sorption. There may well be differences in the behavior of plutonium or americium even in supposedly identical solutions at pH ** 8 to 8.5, e.g. in the degree of polymerization and radiocolloid formation, and hydrolysis resulting in variations in species (including charge) and particle size. Grebenshchikova and Davydov [ 20] reported that the charge on colloidal Pu(IV) species may be either positive (at low pH values) or negative (at high) and that the isoelectric pH, or point of zero charge, is in the pH region 8.0 to 8.5. Polzer and Miner [21] presented a plot of effective charge (due to hydrolysis) of the americium species vs. pH for a 0.1 M LiClOi» solution. Between pH 8.0 and 8.5 the average effective positive charge per atom of americium varied from ^ 1.3 to essentially zero. Therefore, large variations in the behavior of both plutonium and americium could be expected in this pH range.
Detailed studies of the behavior of plutonium and americium in aqueous solutions at pH и 8 with respect to concentration, container sorption, centrifugation, and filtration were also made.A factor of ^L07 variation in the plutonium concentration (**10 6 M to «10 13 M) had little effect on the sorption ratios for argillite and tuff. There was no container (polypropylene) sorption when solid was present. This is consistent with earlier observations that sorption is highly dependent on available surface area. Filtering a solution after contact helps remove any trace of remaining solid, which would otherwise have a large effect for high sorption values since there is very little plutonium or americium activity in the final solution. On the other hand, filtering may well remove noncentrifugable, but filterable species that should in reality be considered as nonsorbed and therefore transportable in groundwater. The results from filtering some solutions twice were not conclusive but did suggest that little or no sorption takes place on the polycarbonate
IAEA-SM-243/37 379
filter membrane. Sorption ratios for argillite based on the specific activity of solutions which were centrifuged (32 000 g) and then filtered are much higher than those for solutions which were only centrifuged. Sorption ratios in the first case tended to decrease with increasing temperature, but for filtered solutions the calculated ratios tended to increase with increasing temperature. This effect is probably related to the size of the particles which form at the different temperatures and which behave differently whèn centrifuged or filtered. Less activity is removed by centrifuging solutions contacted at 70°C but more activity is removed by the filter with these same solutions.
Centrifuging the final solutions would appear to establish a lower limit to the sorption ratio since crushed rock particles and particulates remaining in solution would tend to lower the calculated sorption ratio. Filtering the solutions would appear to provide a more accurate sorption ratio by removing rock particles and at least defining the particle size for a "solution." However, for large numbers of samples there is a practical limit to how fine a filter can be used. A useful definition of a "solution" may be one with no particles larger than 0.05 ym.
ACKNOWLEDGEMENTS
The following Los Alamos Scientific Laboratory personnel are acknowledged for the efforts mentioned: R. D. Aguilar, S, Maestas,and P. Q. Oliver (technical assistance), P. A. Elder and М. E. Lark (sample counting and gamma-spectral analyses), and L. M. Wagoner (typing of drafts and final manuscript).
This work was supported in part by the Waste Isolation Safety Assessment Program being conducted by the Office of Nuclear Waste Isolation which is managed by Battelle Memorial Institute under contract with the Department of Energy (DOE), and by the Nevada Nuclear Waste Storage Investigations project and the Radionuclide Migration project, both managed by the Nevada Operations Office of the DOE.
REFERENCES
[ l] WOLFSBERG, K . , Sorption-Desorption Studies of Nevada Test Site Alluvium and Leaching Studies of Nuclear Test Debris, Los Alamos Sceintific Laboratory report LA-7216-MS (1978).
[2] THOMPSON, J. L., WOLFSBERG, K . , Applicability of Microautoradiography to Sorption Studies, Los Alamos Scientific Laboratory report LA-7609-MS (1979).

380 ERDÂL et al.
[3] ERDAL, B. R., AGUILAR, R. D., BAYHURST, B. P., DANIELS, W. R. , DUFFY, C. J., LAWRENCE, F. 0., MAESTAS, S., OLIVER, P. Q., WOLFSBERG, K ., Sorption-Desorption Studies on Granite, Los Alamos Scientific Laboratory report LA-7456-MS (1979).
[4] ERDAL, B. R., AGUILAR, R. D . , BAYHURST, B. P., OLIVER, P. Q. , WOLFSBERG, K . , Sorption-Desorption Studies on Argillite, Los Alamos Scientific Laboratory report LA-7455-MS (1979).
[5] WOLFSBERG, K . , BAYHURST, B. P., CROWE, B. M . , DANIELS, W. R.,ERDAL, B. R., LAWRENCE, F. 0., NORRIS, A. E., SMYTH, J. R.,Sorption-Desorption Studies of Tuff, Los Alamos Scientific Laboratory report LA-7480-MS (1979).
[6] MALDONADO, F. , Summary of the Geology and Physical Properties of the Climax Stock, Nevada Test Site, U. S. Geological Survey open-file report 77-356 (.1977).
[7] H0DS0N, J. N.. HOOVER, D. L. , Geology and Lithologie Log forDrill Hole UE17a, Nevada Test Site, U. S. Geological Surveyreport USGS-1543-1 (.1978).
[8] LIN, W . , Measuring the Permeability of Eleana Argillite from Area 17, Nevada Test Site, Using the Transient Method,Lawrence Livermore Laboratory report UCRL-52604 (1978).
[9] ROSS, C. S., SMITH, R. L. , Ash-Flow Tuffs: Their Origin,Geologic Relations, and Identification," U. S. Geological Survey professional paper 366 (1961).
[10] HEIKEN, G. H., BEVIER, M. L., Petrology of Tuff Units from the J-13 Drill Site, Jackass Flats, Nevada, Los Alamos Scientific Laboratory report LA-7563-MS (1979).
[ 11] WOLFSBERG, K. , Sorption-Desorption Studies of Nevada Test Site Alluvium and Leaching Studies of Nuclear Test Debris,Los Alamos Scientific Laboratory report LA-7216-MS (1978).
[12] BRUNAUR, S.., EMMETT, P. H. , TELLER, R. , Adsorption of gases in multimolecular layers, J. Am. Chem. Soc. 60 (1938)309.
[ 13] DYAL, R. S., HENDRICKS, S. B., Total' surface of clays in polar liquids as a characteristic index, Soil Sci. 6£ (1950)421.
[ 14] BOWER, C. A . , GEORTZEN, J. 0., Surface area of soils and claysby an equilibrium ethylene glycol method, Soil Sci. 87. (1959)289.
[ 15] MCNEAL, B. L . , Effect of exchangeable cations on glycol retention by clay minerals, Soil Sci. 97_ (1964)96.
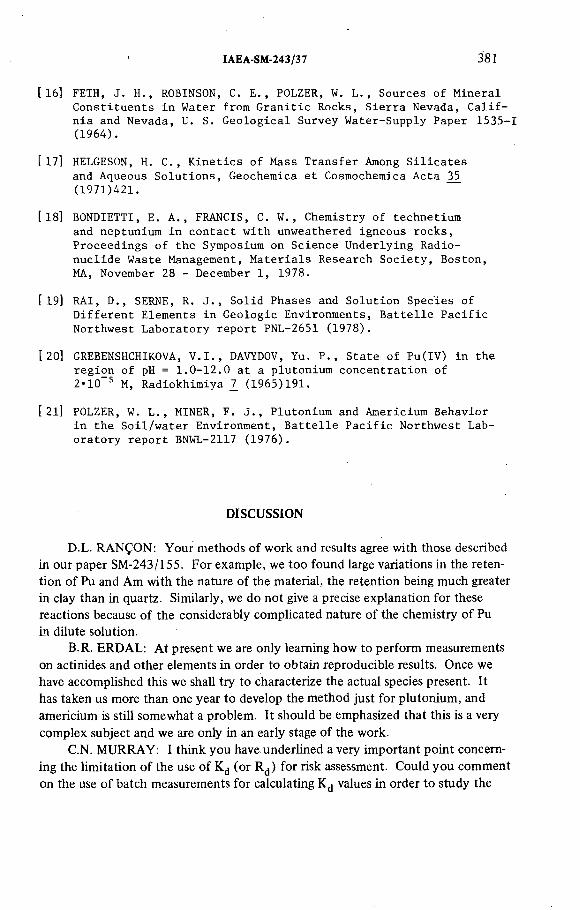
IAEA-SM-243/37 381
[16] FETH, J. H., ROBINSON, C. E., POLZER, W. L . , Sources of Mineral Constituents in Water from Granitic Rocks, Sierra Nevada, Calif- nia and Nevada, U. S. Geological Survey Water-Supply Paper 1535-1 (1964).
[ 17] HELGESON, H. C., Kinetics of Mass Transfer Among Silicates and Aqueous Solutions, Geochemica et Cosmochemica Acta 35 (1971)421.
[ 18] BONDIETTI, E. A., FRANCIS, C. W . , Chemistry of technetium and neptunium in contact with unweathered igneous rocks, Proceedings of the Symposium on Science Underlying Radionuclide Waste Management, Materials Research Society, Boston,MA, November 28 - December 1, 1978.
[ 19] RAI, D., SERNE, R. J., Solid Phases and Solution Species ofDifferent Elements in Geologic Environments, Battelle Pacific Northwest Laboratory report PNL-2651 (1978).
[20] GREBENSHCHIKOVA, V.I., DAVYDOV, Yu. P., State of Pu(IV) in the region of pH = 1.0-12.0 at a plutonium concentration of 2*10 5 M, Radiokhimiya 1_ (1965)191.
[ 21] POLZER, W. L . , MINER, F. J., Plutonium and Americium Behavior in the Soil/water Environment, Battelle Pacific Northwest Laboratory report BNWL-2117 (1976).
DISCUSSION
D.L. RANÇON: Your methods of work and results agree with those described
in our paper SM-243/155. For example, we too found large variations in the reten
tion of Pu and Am with the nature of the material, the retention being much greater
in clay than in quartz. Similarly, we do not give a precise explanation for these
reactions because of the considerably complicated nature of the chemistry of Pu
in dilute solution.
B.R. ERDAL: At present we are only learning how to perform measurements
on actinides and other elements in order to obtain reproducible results. Once we
have accomplished this we shall try to characterize the actual species present. It
has taken us more than one year to develop the method just for plutonium, and
americium is still somewhat a problem. It should be emphasized that this is a very
complex subject and we are only in an early stage of the work.
C.N. MURRAY : I think you have underlined a very important point concern
ing the limitation of the use of Kd (or Rd) for risk assessment. Could you comment
on the use of batch measurements for calculating Kd values in order to study the

382 ERDAL et al.
migration of actinides in different types of geological media? The fact that pluto
nium can exist simultaneously in solution (also under environmental conditions)
in several oxidation states means that the use of a single Kd value may be of very
limited use in attempts to explain its solid-liquid phase behaviour. Probably some
time-dependent value, related to thermodynamic of Eh/pH parameters, would be
more realistic; research efforts are needed in this direction.
B.R. ERDAL: It is extremely important for understanding the migration of
all elements in geologic media, and not for just the actinides, that large-scale labo
ratory and in situ measurements should be made and the migration of elements in
natural geologic systems be investigated. At the same time, we must also increase
our knowledge of the fundamental physical chemistry of these elements and of
their behaviour under a variety of natural and laboratory conditions using different
experimental approaches. Then we could have sufficient knowledge to describe
the interactions between the radionuclide and the geo-media.

SAFETY ASSESSMENT AND REGULATORY ASPECTS
(Sessions IX and X)
Chairmen
Session IX
F.S. FEATES
United Kingdom
Session X
E. m a l a Sek
Czechoslovakia
IAEA-SM-243/43
Invited Paper
PREDICTION OF LONG-TERM
GEOLOGIC AND CLIMATIC CHANGES
THAT MIGHT AFFECT THE
ISOLATION OF RADIOACTIVE WASTE
Rhodes W. F AIRBRIDGE
Department of Geological Sciences,
Columbia University,
New York,
United States of America
Abstract
PREDICTION OF LONG-TERM GEOLOGIC AND CLIMATIC CHANGES THAT MIGHT
AFFECT THE ISOLATION OF RADIOACTIVE WASTE.
Relative safety of radioactive waste storage is seen partly as a function of the stability of
the Earth’s crust. Because of plate tectonic motions no part of the Earth’s crust is totally
stable, and regional categories of relative stability need to be established. No systematic
programme for the preparation of nation-wide neotectonic maps yet exists in any of the major
western countries. Tectonic motions of the Earth’s crust are from time to time subject to
accelerations. This crustal activity is expressed variously as sluggish movements of plates, or
sudden failure along fracture zones (earthquakes), or as volcanic eruptions; a considerable
interactional effort is being applied to the measurement and possible prediction of these
accelerations. Investigations are also being directed into questions involving superficial sediments
and soil: slope stability, geochemical factors, and so on. In this paper, attention is drawn to the
ultimate causes of crustal stresses and to the possibility of using long-term geological records as
a basis for assisting their prediction in time. While very great progress has been made in the
prediction of sites of crustal instability hazards, little consideration has as yet been devoted to
the timing of long-term cyclic events.
1. INTRODUCTION
The relative safety of radioactive waste storage will always be an actuarial
estimation. Cost-benefit factors are involved. A totally stable region of the
Earth’s crust is a geological impossibility. Because of plate tectonics, both con
tinental and oceanic crusts are in constant motion.
The Planet Earth must be recognized as a member of the dynamic complexity
of the Universe, all parts of which are in orbital motion and develop interacting
gravitational fields. The Earth’s crust is therefore subject to exogenetic stresses
(derived from the sun, moon and planets), which tend to be cyclic in nature and
385

386 F AIRBRIDGE
therefore more or less predictable. They range in scale from the semidiurnal
tidal stress up to the 200—250 million-year galactic cycle, to which probably are
linked the great ice ages. Endogenetic stresses, on the other hand, while partly
linked to the external sources, are mainly related to secular heat flow from the
Earth’s interior. The episodic nature of geological revolutions, however, as well
as physical theory, suggest that the convective heat transport in the mantle is
subject to ‘runaway’ accelerations. Thus cyclic events of both internal and
external origin may be predicted for the Earth’s crust.
The Earth’s atmosphere is also subject to cyclic exogenetic stresses that are
theoretically predictable, although no intensive systematic attempt at establishing
those cycles bas yet been made. An intensive collaborative research is needed.
Inasmuch as there is a demonstrated energy transfer from the atmosphere to both
the hydrosphere and the lithosphere, an understanding of climatic cycles is
considered by this writer to be essential to any serious study of earth motions,
although not yet attempted. Geologists tend to overrate endogenetic energy
sources, although the exogenetic thermal energy flux is greater by three orders of
magnitude.
The Earth’s crust is comparable in its behaviour to that of sea-ice. As an
elasto-brittle layer it floats over a medium of much lower strength. Sea-ice is
subject to the frictional stress set up by wind along its upper surface and by water
currents along its undersurface. Furthermore, sea-ice is subject to the daily rise
and fall of the tide, together with an inertial torque that decreases from the
tropics to the poles.
In contrast to sea-ice, the Earth’s crust (especially the continental part) is of
great antiquity and inherits inhomogeneities, anomalous features and partially
‘healed’ fractures that may from time to time be reactivated. Studies of those
particular features are being made by many organizations, including, for example,
the Neotectonics Commission of INQUA (International Union for Quaternary
Research), of which this writer is President. To an outsider, it might appear that
we have a vast amount of information; this is true, and in fact the vastness of the
data base is one of the major problems. Systematic numerical reductions have not
yet been achieved, but could be obtained if a massive attack on the problem were
made. This means that, as yet, we cannot present simple, clear syntheses. (But
see Appendix.)
The first step has been to define an integrated sequence of earth processes,
fed by the two source-regions with their complex of energetic categories:
(A) EXOGENETIC ENERGY SOURCES — feeding climatic, magnetic
' and crustal systems;
(B) ENDOGENETIC ENERGY SOURCES - feeding crustal, seismic,
volcanic and geoidal systems.

IAEA-SM-243/43 387
All these systems are interconnected by feedback mechanisms because there are
no closed systems on earth. They are, furthermore, continuously modified by
secular change. There are the two great systems arranged in spherical layers
around the planet where long-term change is observed;
(a) Lithospheric Systems (mainly crust-mantle evolution, plate tectonics
and sea-floor spreading); and
(b) Atmospheric ¡Ну drospheric Systems (mainly organic evolution, evolving
from a primordial anoxic atmosphere, through a high carbon dioxide
one thence to an oxygen-rich one).
Environmental stability is therefore liable to be upset by secular changes
when they reach threshold levels. In human terms those crescendos may reach
catastrophic dimensions. These crises may be made worse by cyclic coincidences,
and by man-made accelerations. The potential anthropogenic disturbances are
seen by this writer to be most serious in the following areas: (1) hydrologie (dam construction, lake drainage, and other mass loading transfers); (2) oceanographic (current diversions and catastrophic air temperature changes due to
future contemplated dam works of major proportions, or to major sea-level canals,
massive thermal and/or radioactive nuclide pollution); (3) climatic (environ
mental change by (1) and (2) above, as well as by various forms of pollution,
thermal and chemical.)
The hazards of catastrophic crustal stress may be studied in two ways: regional
and temporal. First, in terms of a regional sense, in space; a great deal has now
been achieved in terms of regional geotectonics, global seismicity and other
geophysical characteristics. In short, the most susceptible areas are relatively
well mapped. Nevertheless, no general neotectonic mapping programme appears
to be in hand in any of the leading western nations, although excellent neotectonic
maps are available for eastern Europe. Secondly, in the temporal sense, serious
difficulties exist which make prediction of crustal hazards extremely complex.
In the short term much progress has been made, and in this paper some suggestions
for long-term prediction are offered.
2. GEODYNAMIC CHRONOLOGY AS A BASIS FOR HAZARD PREDICTION
There is an inherent problem with earthquake and seismic prediction in
general in that the data base is severely curtailed by the length of both instrumen
tal and historical records. With the aid of Chinese data the outer limit is little
over 2000 years. Inasmuch as the recurrence cyclicity for some seismic activity
may be extremely sporadic, there is often no statistical basis for future projection.
388 FAIRBRIDGE
2.1. Use of proxies
Another area of natural hazard is climatology, a scientific discipline with
problems similar to those of seismology. The writer has been concerned with the
solar-climate-geodynamic correlation for some years [ 1 ], and at the present time
serves as President of the Neotectonics Commission of INQUA, a group that has
become increasingly aware of these interdisciplinary problems.
In paleoclimatology, an extensive science has grown up utilizing a ‘proxy’
methodology of considerable sophistication. For example, the identification of a
former ice age climate in the Sahara Desert that existed 450 million years ago was
established by several proxies [2]: paleontological, sedimentological, geomorpholo-
gical and paleomagnetic.
2.2. Seismic proxy?
The question may now be asked: what sort of proxies can be proposed for
extending the record of crustal activity into prehistory? The standard procedure
required in environmental impact statements involves the identification of all
lineaments, faults and major joint systems. Specifically the ‘capable’ faults must
be identified, as evidence of possibly future seismic risk, the time-constraints being
based upon stratigraphie or geomorphic evidence of past motions. The chrono-
metric precision, however, is usually of a very low order, and the ‘dates’ of former
seismicity are at best approximations and quite unsuitable for prediction on a
year-to-year, decadal or even century scale.
A preliminary feasibility study [3] considers the loose correlation between
seismicity and volcanism as a starting point ([4], p. 297) and then, over a historical
period of 475 years, compares the periodicity of major historical earthquakes,
volcanic events, sunspots and climate. We have used the decadal peaks of the
Zurich sunspot numbers, and extended them back to AD 1500 with the use of
Schove auroral transfers [5]. We are assuming these values to be a general
indicator of solar-planetary stress. (See Figs 1 and 2.)
2.3. Solar-planetary stress
The correlation between minor seismicity and earthtides over a short period
is now well established, so that it is a reasonable extrapolation to postulate solar-
planetary stress as a trigger for major seismicity. Already demonstrated is a
1950—1963 series of earthquakes that shows a correlation at highest sunspot
levels [6], but skewed to show a 2—3 year delay. Even on a day-to-day basis at
sunspot levels over 150 there is an appreciably higher probability of earthquakes
than when spots are fewer than 50. Both the 11- and 22-year solar cycles were

IAEA-SM-243/43 389
1ЛO ’
IDPJО
<лLÜ
FIG.l. Relationships between earth’s rotation, wobble, earthquakes and volcanicity, since
the year A.D. 1800 (from Fairbridge, Rampino and Self, in preparation).
found in the long-term records of Azores earthquakes [7] and proposed a plate-
tectonic coupling. This concept now requires exploration through a longer time
range.
In the above-mentioned study a single climatic record was used as a simple
test of atmospheric interaction; as long ago as 1914 Koppen [8] proposed a
correlation between air temperatures, sunspots and volcanicity. The Greenland
oxygen-18 isotopic study of ice cores [9] was used inasmuch as it is continuous
and discloses a 360-180 year cycle, as well as shorter cyclic fluctuations. The
latter include 90-45-22-11 year components of solar origin as well as the 18.6-year
lunar nodal cycle, and perhaps also the so-called Gleissberg cycle of about
80 years; this is a periodicity of peak solar flares and aurora, which in point of fact
generally range at intervals of 50—90 years [10].
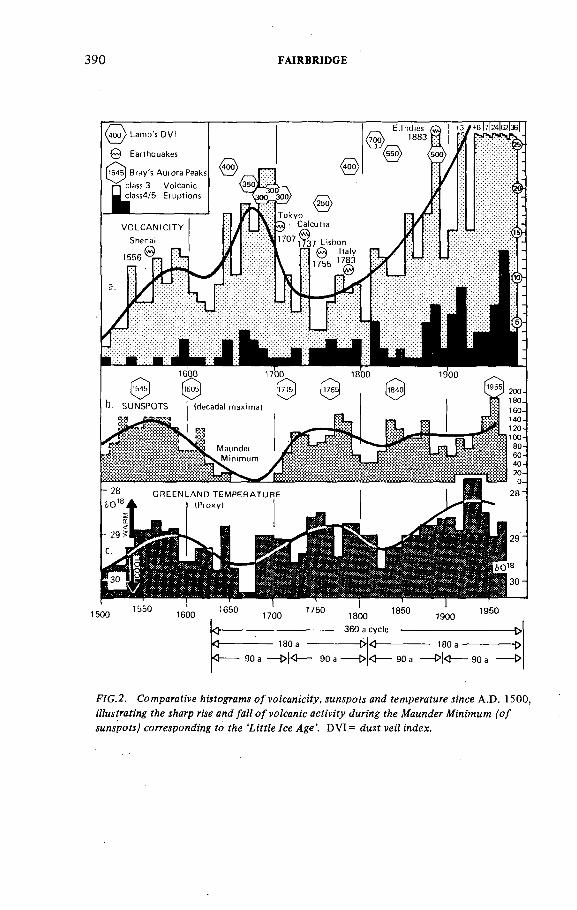
390 FAIRBRIDGE
1500 15501600 1650
17001750
1800360 a cycle
18501900
1950
180 г
90 a 90 a ■
FIG.2. Comparative histograms of volcanicity, sunspots and temperature since A.D. 1500, illustrating the sharp rise and fall o f volcanic activity during the Maunder Minimum (of
sunspots) corresponding to the ‘Little Ice Age’. DVI= dust veil index.

IAEA-SM-243/43 391
An important new discovery [3] is that during both the historical period and
the reasonably well-dated Holocene, on a decadal or longer basis, the climatic
pattern in relation to volcanism is the opposite to that recognized for 105-year
time intervals [11]. There is, in fact, no evidence that the major glacial periods are
in any way triggered by volcanic ash veils [ 12]. The effective atmospheric
residence time of the ash veil does not seem to exceed 5 years, so that an inten
sive and very protracted sequence of explosive events would be needed to trigger
glaciation. Quite the contrary, the largest eruptions of the last 100000 years
have all occurred well after the initiation of the cool cycle; in fact, the evidence
suggests that the geodynamic crustal stress was triggered by the same planetary
configurations (Milankovich cycles) that control the glacial cycles. In 1883 the
Krakatau eruption came close to 1885, the terminal year of the last 360-year
cycle, and preceded the long warming trend of the early 20th century. The 1815
Tambora eruption (that caused the ‘Year Without a Summer’ in 1816) came in the
middle of a long cooling trend that began after the sunspot peak of 1788, and was,
after 3—4 years, followed by the beginning of a major warm cycle. The Santorini
(Thera) eruption of about 3465 BP,1 approximately simultaneously with a giant
caldera eruption in the Aleutians, was followed by a warm cycle of about 200 years.
The Mt. Mazama eruption of about 7440 BP was followed almost immediately by
2000 years of the ‘Atlantic’ or ‘Climatic Optimum’ of the Holocene. The colossal
eruption that created Lake Toba (Sumatra) c. 75000 BP, probably the largest
single event during the Pleistocene, came about 25 000 years after the last cool
cycle began. In short, major eruptions do not trigger glacial events.
The 360-year period is well-established in Western European climate, and the
180-year harmonic is traceable in the geological record back to the Jurassic and
early Phanerozoic [13, 14]. Fourier analyses of 300 million-year-old Permian
glacial varves from Brazil (personal communication from Prof. Rocha-Campos,
Sâo Paulo) disclose the 11 —22 year solar cycle and the familiar lunar cycles, which
proves that the lunar orbital radius was not then much different from today’s.
In planetary activity, the 180-year (the ‘King-Hele Cycle’) is an approximation
of the 8th harmonic of the 22.25 solar magnetic period (‘Hale Cycle’). José [15]
saw a 178—180 year interval as a resonance effect of planetary motions, while
Cohen and Lintz [16] believed a beat frequency of 11 and 9.8 years developed to
generate a 197—181 year cycle. Considering the 018 fluctuations of the Greenland
ice cores, which seem to range from 25-55 years, Broecker [17] believes they are
generated by a combination of the power spectra of 80 and 100 years. As is well
recognized the so-called 11-year sunspot period is a highly variable one on a cycle-
to-cycle basis, but this has been attributed to turbulent magnetohydrodynamics.
In the longer terms the periodicity becomes more and more regular.
2.4. Eruptions precede warm cycles
1 Before Present (Present = 1950).
392 FAIRBRIDGE
Of critical importance for the long-term periods has been the discovery of a
45-year cycle in beach ridge dynamics in the Hudson Bay area, that has been
traced back 187 cycles to 8300 years BP. Comparable but less complete beach
series are found in Ungava Bay, Cape Krusenstem and other Arctic areas. Sub
tropical examples disclose shorter periodicities. Analysis of the long Hudson Bay
data base, currently in progress, shows not only the 180-360-year peaks, but
higher harmonics, notably 1080 years (360 X 3) and 1440 years (360 X 4). What
makes the 1080-years period particularly interesting is that it is recognized as a
component of the planetary arc-tilt cycle. Stacey [19] says: ‘The actual tilt
varies by ± 4'30" from the mean angle of 23°10'00" over a period of 8640 ano
malistic years or 24 times the intervals of 360 anomalistic years” (the solar
eclipse cycle). It must therefore play an important role in the spectrum of the
Earth’s stress determinism.
Another interesting aspect of these long-term planetary periods is an oceano
graphic correlation. Dr. Kazuhiro Tairo (of the Hokkaido University, Japan),
in a personal communication, has identified major fluctuations in the Kuro Shio
temperature (Japanese equivalent of the Gulf Stream), that have periods of
1080 and 1440 years. These are found to match remarkable temperature fluctu
ations off the California coast [20].
Another important component is Stacey’s ‘Zero-check Cycle’ of all-planetary
conjunction (1668 years), with an almost complete phase every 556 years. This
556-years period equals the precession of the lunar perigee and thus the earth’s
maximum perigee spingtides; it equals 50 X 11.1-year sunspot cycles.
F.J. Wood [21 ] observed that when the Sun, Earth and Moon are in syzygy
(alignment) and this coincides with perigee (Wood’s ‘proxigean’ phase) the moon
is drawn closer to the earth, leading to higher and more extended spring tides.
In areas such as the Canadian Arctic or Iceland, the sea-ice can then catastropically
break up when the proxigean events events come in summertime [22]. The last
major incidence of the all-planet cycle was AD 1433, and the next will be AD 1989.
To complicate matters, however, the second harmonic of the all-planet
conjunction period (1112 years) is ‘uncomfortably’ close to the arc-tilt fluctuation
of 1080 years. In the geological record of the Holocene we cannot discriminate
to that level of precision on a single sample. Further work is urgently needed.
Inasmuch as Jupiter is the principal tide-raising planet in the Solar System,
it is not altogether surprising that the principal conjunctions of Jupiter seem to
match numbers of our long-term terrestrial cycles. K.D. Wood [22] proposed a
simplistic tidal hypothesis for solar activity, but it ignored the magneto-
hydrodynamic nature of solar turbulence and also the inertial behaviour of tides.
The 11-year cycle is thus sometimes delayed and sometimes advanced [23].
As noted by King-Hele [24], 178 years correspond to 16 ‘sidereal years’ of the
sun (moving around the barycentre of the solar system), and likewise to 15 ‘sidereal
2.5. Beach-ridge cycles
IAEA-SM-243/43 393
years’ of Jupiter; at these intervals the sun is gravitation ally displaced from the
barycentre by more than 1 solar diameter [15]. Although the tide-raising force of
the planets on the sun is 10s times less than that of the sun on the earth, the solar photo
sphere is vastly more susceptible to the resonance effect.
Of importance in this connection is the so-called ‘Sporer Effect’, whereby
the solar equatorial zone rotates faster than the polar areas, due to tidal drag of
the planets [25]. Recent historical research by Eddy [26] has shown that there was
a very rapid increase of solar equatorial acceleration immediately prior to the
‘Maunder Minimum’, the most recent period of anomalously low sunspots
(c. 1645—1710) which corresponded to the last important ‘Little Ice Age’ or
neoglacial event. Inasmuch as a renewed episode of accelerating solar equatorial
rotation is currently observed today, it seems to be a warning that another cold
spell is to be expected.
A key observation in the Rampino, Self and Fairbridge paper [3] is that the
Maunder Minimum corresponds to a very remarkable rise in global volcanicity.
For several decades following it, there was a four- to eight-fold drop in volcanic
activity. The seismic data in the 18th century are less easy to discern, but appear
to go the same way. We may therefore predict not only a cold spell for the next
few decades, but a highly dynamic one in terms of earthquakes and volcanicity.
2.6. Spin-rate
The Earth’s spin-rate is significantly variable [27] and correlates with
seismicity [28], to which we may add also volcanicity. The spin-rate is of course
in a direct inverse relationship to ‘length of day’.(LOD). Spin-rate varies seasonally,
due to the atmospheric circulation [29], but there are gravitational torque factors,
besides atmospheric agencies. A 365-day periodicity in seismicity culminates in
June, and June is the month when the earth’s motion within the galaxy is at its
maximum [30]. Kropotkin [31] and Machado [7] cite other cosmic possibilities.
A lower peak occurs in January, the southern mid-summer, with low points in
spring and autumn [27]. Spin-rate thus reflects the various atmospheric energetics.
Important, after the annual change, is the so-called ‘quasi-biennial cycle’ (of the
lunar orbital period) or ‘Southern Oscillation’ which affects both air pressure and
mean sea level [32], and which is not always 2 years, but works up month-by-month,
gradually, to about 3 years. Further periodicities occur at harmonic intervals,
notably c. 5, 9, 11, 15, 18, 22, 33 years, particularly well-known in tree-ring
and varve series [33, 34, 35]. Spin-rate is in phase in sunspot cycles, notably the
22-year period. Besides seasonal and other ‘steady-state’ atmospheric cycles,
there are longer-term climatic shifts affecting the LOD [36].
Besides simply the atmospheric wind friction effect, there is evidently also
a solar wind (magnetic) input. Thus, after the great solar storm of August 1972,
there was an immediate spin-rate response [37].
394 FAIRBRIDGE
Besides spin-rate response there is also the spin axis migration which completes
a full cycle in 22.25 years, the solar magnetic cycle [25]. Key years of minimum
departure from the geographic pole were 1950 and 1972. There is furthermore
a secular shift, involving the earth’s pole of inertia involving 0.0022" annually
directed to 77°W [38], oddly enough, the meridian of Washington, D.C. Apparently
it involves a drift of the entire Uthosphere over the mantle, that in the polar area is
eastward at 10—12 cm/a, but westward in equatorial regions [39], as predicted
long ago by Wegener. Proverbio and Poma [40] have found astronomical confirm
ation of an equatorial latitude drift to the west at a rate that accounts for the
spin deceleration. According to Munk and Revelle [41 ] the late Holocene shift is
related to the ice build-up on Greenland, which would also lead (since about
3000 BP) to a secular decrease in spin rate. Bostrom [42] proposed to link the
pole shift to displacement of the earth’s principal axes of inertia due to plate
tectonic motions, but the plate motion accounts for only 10% of the observed
value [43]. There is also a fluctuation in long-term spin-rate variation, called by
Spencer Jones the ‘aleatory B’ term (aleatory means ‘of indeterminate cause’).
In AD 1700, after the Maunder Minimum, it was low but it rose to a high around
1800, sinking to another low shortly before 1900, and then rising again, i.e. a
roughly 200-year cycle.
Interactions between the earth’s spin-rate and various geodynamic processes
have not been extensively explored. Inasmuch as the rotation direction is from
west to east, lunar torque tends to trigger a westerly acceleration in plate tectonic
activity in middle to equatorial latitudes. An increase in the strength of zonal
winds will retard the spin-rate [36], the easterlies being most effective since they
are closer to the equator. Lamb [11] and Sirén [33] find an approximately
200-year cycle in temperature and westerly air flow in Western Europe, which is
compatible with Spencer Jones’ ‘aleatory B’ term; that is to say, a warming
century in mid-latitudes will be marked by slowing spin-rate. This effect is in the
same sense to that expected on the 100000-year cycle, whereby ice buildup near
the poles should increase the spin-rate, but in this case related to the moment of
inertia.
Summarizing the recent solar and planetary geodynamic behaviour in relation
to spin-rate: since AD 1820 every short-term spin acceleration has matched an
outburst of solar flares and solar wind pressure; increased zonal wind circulation;
rise of sea level; rise of seismic energy; rise of volcanicity; rise of volcanic dust;
and rise of mean global temperature; (notwithstanding short-term cooling after
major eruptions).
2.7. Sea-level behaviour
Mean sea level, when analysed over decadal intervals or longer, often shows a
distinct cyclicity. Mosetti (personal communication) mentions the 5.6, 8.8 and

IAEA-SM-243/43 395
11-year periods, besides the 45-year cycle announced earlier [44]. There is fre
quently à marked response to mean air temperature trends in the higher latitudes.
Although the writer has formerly classified such trends as glacio-eustatic [32], it
now appears that he was probably wrong in this assumption for less than century-
long trends. The shorter fluctuations, commonly on the scale of 2—50 years,
appear to relate to climatic parameters, not to atmospheric pressure by the
“inverted barometer” effect, but to wind and swell direction [45]; sea-water
temperature is unimportant in low latitudes, but quite significant in cooler
situations. Oceanic tidal action, for its part, plays a well-known role in triggering
earth tides [46] and extended loading due to glacio-eustasy has a recognized
hydro-isostatic effect [47]; a correlation has been proposed with tectonic
triggering [48].
As mentioned above, there is a feedback from sea level to spin-rate [41];
an 11 cm rise in MSL would increase the LOD by 0.8 milliseconds [49] and thus
retard spin-rate. The short-term spin-rate variables of the last two centuries,
however, have been an order of magnitude larger.
In long-term mean sea level reductions for Europe, Mosetti [44] recognized
a 45-year cycle, and the writer has extended the data base to Asia and North
America, discovering therein a west drift, the rate being 4° of latitude per year.
This ‘tidal’ anomaly has an amplitude of only a few cm, but a 4°/a west drift
would bring about a full cycle (360°) every 90 years with its antipodal pulse
every 45 years, which is the overriding climatic cycle of the last 8000 years. It
would be interesting if this phenomenon was related to planetary spin through the
‘Markowitz Wobble’ (c 40/a) that Rochester [50] hints could reflect coremantle
inertial coupling.
2.8. Geomagnetic field
An important geodynamic variable that has not been mentioned so far in this
discussion may well play a key role in the controversial solar-planetary-climate-
tectonic linkage (see Siscoe, [51]). This is the solar magnetic wind/geomagnetic
field interaction. The latter varies from about 80 to 95% of the solar-induced
field, both being of extremely variable intensity. Of particular significance to
the present discussion is that the terrestrial magnetic activity varies with the solar
cycle, especially with the 22-year solar magnetic period [52]; it was noted that the
second half of each of the even-numbered Zurich cycles was more active than the
first half and that this was opposite in sense for each odd-numbered cycle. High
peaks were thus observed in 1887, 1912, 1933, 1954. Barta (53) had earlier
established a 40-50-year period, apparently corresponding to the 45-year morpho-
climatic cycle (18), which is traced back 8300 years. The higher harmonics at
80—90 years and 180 years were identified already by Willett [54]. Chiu [55]
correlates high-latitude atmospheric pressure field anomalies with the magnetic
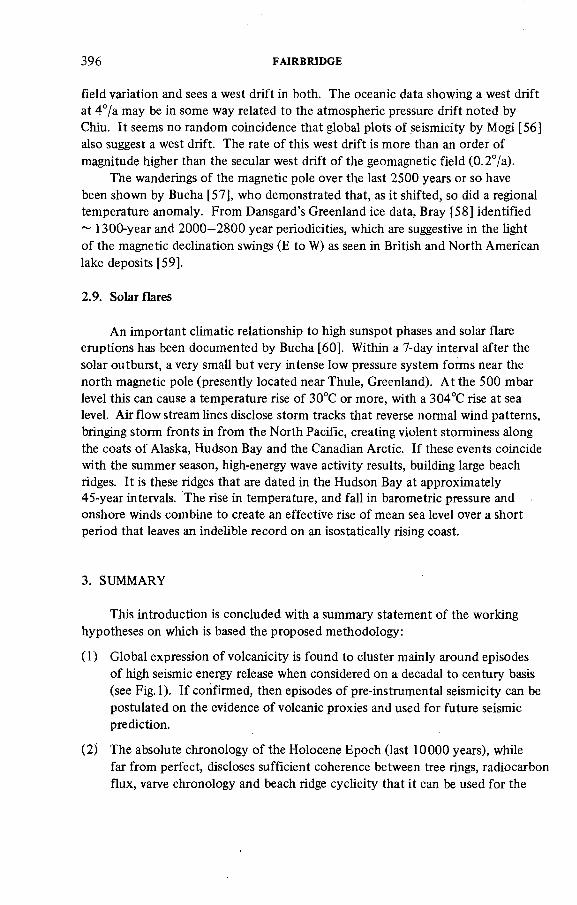
396 FAIRBRIDGE
field variation and sees a west drift in both. The oceanic data showing a west drift
at 4°/a may be in some way related to the atmospheric pressure drift noted by
Chiu. It seems no random coincidence that global plots of seismicity by Mogi [56]
also suggest a west drift. The rate of this west drift is more than an order of
magnitude higher than the secular west drift of the geomagnetic field (0 .2 7 a).
The wanderings of the magnetic pole over the last 2500 years or so have
been shown by Bucha [57], who demonstrated that, as it shifted, so did a regional
temperature anomaly. From Dansgard’s Greenland ice data, Bray [58] identified
~ 1300-year and 2000—2800 year periodicities, which are suggestive in the light
of the magnetic declination swings (E to W) as seen in British and North American
lake deposits [59].
2.9. Solar flares
An important climatic relationship to high sunspot phases and solar flare
eruptions has been documented by Bucha [60]. Within a 7-day interval after the
solar outburst, a very small but very intense low pressure system forms near the
north magnetic pole (presently located near Thule, Greenland). At the 500 mbar
level this can cause a temperature rise of 30°C or more, with a 304°C rise at sea
level. Air flow stream lines disclose storm tracks that reverse normal wind patterns,
bringing storm fronts in from the North Pacific, creating violent storminess along
the coats of Alaska, Hudson Bay and the Canadian Arctic. If these events coincide
with the summer season, high-energy wave activity results, building large beach
ridges. It is these ridges that are dated in the Hudson Bay at approximately
45-year intervals. The rise in temperature, and fall in barometric pressure and
onshore winds combine to create an effective rise of mean sea level over a short
period that leaves an indelible record on an isostatically rising coast.
3. SUMMARY
This introduction is concluded with a summary statement of the working
hypotheses on which is based the proposed methodology:
(1) Global expression of volcanicity is found to cluster mainly around episodes
of high seismic energy release when considered on a decadal to century basis
(see Fig.l). If confirmed, then episodes of pre-instrumental seismicity can be
postulated on the evidence of volcanic proxies and used for future seismic
prediction.
(2) The absolute chronology of the Holocene Epoch (last 10000 years), while
far from perfect, discloses sufficient coherence between tree rings, radiocarbon
flux, varve chronology and beach ridge cyclicity that it can be used for the
IAEA-SM-243/43 397
establishment of a 10 000-year record of volcanicity ages. For a first approxi
mation this interval should be a useful base for prediction of future episodic
geodynamic activity. Some of the events are established with the confidence
of year-to-year precision (tree rings, varves), but much more work is needed
to tie in the events bracketed only by radio-carbon dating.
(3) Geodynamic events in general (neotectonic accelerations, volcanic explosions,
geomagnetic anomalies, solar wind interactions, abrupt climatic events,
oceanographic changes and geodetic fluctuations) all seem to be linked by
complex cyclic tendencies. These cycles in some cases are linked directly
to the lunar gravitational tides (earth, air and water), notably the quasibiennial
and 18.6-year nodal periods. Others are tentatively linked to solar and
planetary effects, but for the present study the actual mechanisms are
irrelevant. If correlation is shown to be probable, then prediction of future
activity probabilities can be expanded from the 10000-year data base, guided
by the known periodicities of celestial mechanics.
(4) It should be emphasized that in seismic risk appraisal the local structure and
regional field evidence must always take a paramount position. It is not
claimed here for one moment that a general stress potential prediction will be
anything more than an actuarial factor.
Appendix
LAWS, PRINCIPLES AND AXIOMS
OF FUNDAMENTAL PROCESSES
OF THE PLANET EARTH
The Earth is a planet that, within rather rigid constraints, spins in an irregular orbit around the Sun. This trajectory constantly changes and the Earth is thus subject to the variable gravitational fields developed by the Sun and planets, and not least by its own satellite, the Moon. The Sun itself Is the source of variable emissions, as may be seen within the 11-year sunspot cycle, as well as over longer Intervals, probably up to the 200- 250 million year cycle of the galaxy.
None of the Earth systems are closed and no part of the Earth Is 'stable 1 . This is because all of the Earth's energy systems are interconnected, or reinforced by powerful feedback mechanisms. Feedback also provides vital constraints to the potential departures from Its dynamic equilibrium, (see Fig. 3 .)

EXOGENETIС
ENERGY (PLANETARY, SOLAR, COSMIC 'radiative, gravity)
PLATE TECTONICS
& SEA-FLOOR
SPREADINGtENDOGENETIC
ENERGY
(mainly heat flow & gravitative)
*EVOLUTION
(SPECIATION,EXTINCTION)
(N.B. Rate increases with:(a) magnetic
decay(b) climatic
cooling(c) fall of
sea level
GEO ID (SPIN AXIS + ROTATION RATE)
FIG.3. Global energy flow pattern, showing principal (clockwise) continuity of flow from exogenetic sources, and the pulsed injection from below of endogenetic energy. Storage (sedimentary, etc.) has been omitted. Finer lines depict feedback.
398 F
AIR
BR
IDG
E
IAEA-SM-243/43 399
In order to better understand the framework of terrestrial processes, a series of four basic 'Earth Laws' are presented, each being conditional on or followed by certain 'Principles.' In turn, a wide-ranging cadre of 'Axioms' designate a third order of rules that may eventually help guide our understanding. The first and second order framework is tentatively sketched out.
First Earth Law: Finite Existence
The Planet Earth, defined in terms of material, guanti ty (mass) and space, has a finite existence over a fixed interval of time. It came into being at one specific point in time and is predictably continuing its existence to another and remote future point in time. The Planet Earth's period of existence is paralleled by that of each of the other planets of the Solar System.
Conditions and Corollaries:
(a) Principle of Solar Dependency. Linked to the evolution of the Sun, which is considered to be a non-variable star, the finite history of the Earth began at a given time, A.6 billion years BP, and its existence will be terminatedwith the Sun's burn-up phase.
(b) Principle of Finite Energy Sources. For the planet Earth the only available energy sources are finite in spacetime. Sources are both endogenetiс (mainly endothermie chemical heat, and mechanical energy), and exogenetic (mainly radiative and gravitative). The extraterrestrial energy is largely solar, but also to a small extent itis lunar, planetary and galactic. It is noted that the effective exogenetic thermal energy sources are more than three orders of magnitude greater than the endogenetic ones. [Some authors use "endogenous" and "exogenous" in synonymous senses.j
Second Earth Law: Physical Evolution
The Planet Earth is evolving progressively, characterized by secular changes within each of its three basic parameters (material, quantity, space) over specified intervals of time.
Conditions and Corollaries:
(a) Pri nciple of Superposition. As the planet ages, it accumulates strata that are progressively superimposed on earlier

400 F AIRBRIDGE
components, or igneous injections that cross-cut earlier rocks. Scales of both relative and absolute time can thus be determined. It may be noted that, although constantly refined during the last two centuries, no fundamental correction has ever had to be made to the stratigraphie time scale.
(b) Principle of Limited Destruction. Whereas the Second Law ofThermodynamics tEntropy) requires ultimate disorder within the Universe, within the finite history of the Planet Earth there is only limited destruction, so that through time its ordered components progressively become more numerous and more complex. (Preston CLOUD, 1978: Geol. Rundschau, pointsout the human utilization of mineral or fossi1-stores fuel always leads to higher entropy; this is in contrast to exogenetlc sources with reference to terrestrial systems.)
(c) Principle of Allometric Growth. Just as with organic growth forms, physical growth forms tend to follow allometric or regular systems, achieving greater complexity through time,to reach a maximum when totally occupying the space available,
td) Principle of Gravitational Ordering. The Planet Earth, since Its initiation, has evolved a concentric ordering (core, mantle, crust) mainly by gravitational segregation. Nevertheless, the spheres are internally unstable, probably convective in part, and parts of the outer sphere (crust) have been subject to recycling in the upper mantle. Today the continental crust contains nuclei of the earliest (low density) segregations with progressive subsequent additions; the oceanic crust (of higher density) represents a constantly recycled upper mantle (with continental dilution), and no part of it is known to be over 200 million years old.
Third Earth Law: Organic Evolution
The primitive atmosphere-hydrosphere-1ithosphere of the Planet Earth, has given rise to self-reproducing molecules and organic evolution which is leading, through time, to ever- increasing complexity. The lifetime of the individual reflects the Second Law of Thermodynamics, but the lifetime of the species(and higher taxa) tend towards negative entropy, but only withinthe finite lifetime of the chain.
Conditions and Corollaries:
(a) Principle of Spéciation. Complex organisms having cell nuclethat provide the capacity of self-reproduction lead throughtime to the creation of new but closely related species.

IAEA-SM-243/43 401
(Ь) Principle of Extinction. From time to time, species, families,orders or classes may become extinct, but following the Second Law, principle (b), requiring limited destruction, the total number of taxa progressively increases through time.
Cc) Principle of Population and Nourishment. The number of individuals within a species rises to the limits of space and nutrients, within a given period of time; following that point, competitors vie increasingly for space and nutrients. Thus, within any ecologic system, the ratio of the number of Individuals to the number of competing species tends to decrease with time.
(d) Pr[ nciple of Biologic Continuity. At no time in evolutionary history Csince c. 3.5 billion years BP) has there ever been a complete extinction of the entire biota followed by a re- institution of all or any taxonomic groups. Inasmuch as life originated within a reducing anoxic environment, followed by the biologic generation of the present, oxygen-rich environment, no new autotrophic life development Is possible except under laboratory conditions.
Fourth Earth Law: Dynamic Equi1ibrium
Physiographic entities of the Planet Earth (oceans, continents, mountains, volcanoes, rivers ... ), tend to grow within the limits of available space and energy, at that stage establishing a compensatory condition of dynamic equilibrium, to which they will tend to return following any disruptive events (a phenomenon originally conceived under the term: 'Uniformitarianism1 ).
Conditions and Corollaries:
(a) Principle of Energy Storage. Many terrestrial processes involve the short or long-term storage of energy, so that the budget of an ideal global steady-state system cannot be balanced without allowance for certain withdrawals of energy. In this 'leaky system' , energy storage may be, for example, in the form of heat sinks, where energy is retained for hundred or even thousand year periods in the ocean; or, heat may be converted by plants to cellulose and thence by sedimentary dlagenetic processes into petroleum, where the energy can remain stored for hundreds of million years.Atomic energy Is largely conserved In mineral form from the time of primordial planetary formation.
402 FAIRBRIDGE
Cb) Principle of Feedback. Positive or negative feedback processes tend variously to accelerate or stabilize natural phenomena. Almost every expression of global energy process is related to all others by feedback, so that no system operates in isolation. Any interference at any stage, natural or man-made, will affect the whole system.
Cc) Principle of Thresholds. Energy and matter conserved in anysystem of storage tends to build up to a threshold, following which a plateau or overflow state is achieved. The plateau condition involves a temporary equilibrium or quiescent state, but the overflow cond i t ion may initiate a catastrophic acceleration. Examples of the latter include short term phenomena such as the breakage of ice dams, erosion of coastal barriers and inundation of lagoons, and the stick-slip acceleration of earthquake stress; longer- term examples include such things as post-glacial eustatic rise (10 000 year rise of world sea-level by over 100m), and-biorhexistasy due to plate-tectonic spreading-rate changes on a million-year time scale.
Cd) Principle of Cyclicity. Inasmuch as the galaxy, the Sun and the planets of the Solar System are rotating in variable but more or less predictable orbits, radiative and gravitational energy from these extraterrestrial motions affect the Earth's dynamic equilibrium in complex series of cycles. These cycles range in scale from the diurnal to the galactic (200-250 million years), and offer the most reliable basis for prediction of both 11tho- spheric and atmospheric perturbations. Certain biospheric phenomena are also predictable from planetary and solar cycles, e.g. influenza pandemics coincide precisely with the 11-year sunspot cycle.
REFERENCES
(1) FAIRBRIDGE, R.W., "Eustatic changes in sea level", Physics
and Chemistry of The Earth V o l . 1*» Pergamon Press, London (1961)
99-185.
(2) FAIRBRIDGE, R.W., Geol. Soc. Amer. Bull., 82 (1971)
269- 274.
(3) RAMPIN0, M.R., SELF, S., 6 FAIRBRIDGE, R.W., Can Rapid Climate
Change Trigger Volcanic Eruptions? (in press).
FAIRBRIDGE, R.W., RAMPIN0, R.R. 6 SELF, S.: Solar-planetary-
climate Stress, Earthquakes and Volcanism (in press).
IAEA-SM-243/43 403
(4) POLLACK, J.B., et al., Jour. Geophys. Res. 8j_ (1976)IO7 I-IO8 3.
(5) SCHOVE, D.J., in FAIRBRIDGE, R.W., The Encyclopedia of A t mospheric Sciences and Astrogeology, Reinhold, New York
(reprint by Academic - D.H.R.), 1200-p.
(6) SIMPSON, J.F., Earth Planet. Sc:. Letters, 3.5 (1968)
417-425.
(7) MACHADO, F., G e o l . Rundschau, 6 4 : 1 (197^) 7^-8^.
(8) KOPPEN, W., Z. M e t e o r o l o g , 3 1 0 9 1 4 ) 305'328.
(9) JOHNSEN, S.J. et al., Nature, 227. (1970) 482-4830.
(10) GLEISSBERG,. W . , Jour. Brit. Astrom. Assoc. 75 (1965) 227-231.
(11) LAMB, H. H., Phi 1 . Trans. Roy. Soc. London A 266 (1970) 425.
(12) POLLACK, J.B., TOON, O.B., 6 SAGAN, C., World Met.0rg. 421
(1975) 279-285.
(13) ANDERSON Я.У., 6 KIRKLAND, D.W. Bull. Am. Assoc. Petr. Geol.
M (I960) 37-52.
0 4 ) LAMB, H.H.,The Climate: Present, Past and Future, 2 vols., Metheun,
London, (1972- 75).
(15) ' JOSE, P.D.jAstron. Jour. 70 (1965) 193-200.
(1 6 ) COHEN, T.J. 6 LINTZ, P.R., Nature 250 (1974) 398-400.
(17) BR0ECKER, W. S., Science J89. (1975) 460-463-
(18) FAIRBRIDGE, R.W. 6 HI LLAI RE-MARCEL, С., Nature 268_, (1977) 413-416.
H ILLAIRE-MARCEL, C. & FAIRBRIDGE, R.W..Geology 8 (1978) 117-122.
( 1 STACEY, С.M v A n n . N. Y. Acad. Sci . JI05. 7 (1963) 421-460.
(20) PISIAS, N.G., Quat. Res. (1978) 366-384.
(21) WOOD, F . J ., The Strategic Role of Perigean Spring Tides: In
Nautical History and North American Coastal Flooding,
1б35“197б, U.S. Dept. Commerce (N.O.A.A.), Washington (1978)
538 p.
(22) PETTERSSON. 0.,Svenska Hyd r o g r . - B i o l . Komm. Skriften 5.
(1914)
WOOD, K.D. Nature 240 (1972) 91"93-
(23) MEEUS, J.} Icarus 26^ (1975) 257"267-
(24) KING-HELE, D.G., Nature 209. (1966) 285.

404 FAIRBRIDGE
(25) DAUVILLIER, A., Bull. Soc. Roy. Sc¡ . Liege 39 9"10 (1970)
¿(86-507.
(26) EDDY, J .A., Scient i fie American 236 (1977) 80-92.
(27) Chal 1 ¡ñor, R.A., Science ]]1_ (1971 ) 1022-1025-
(28) ANDERSON, D.L., Science 186 (1974) 49-50.
ANDERSON, D.L., Science W (1975) 1077-1079-
(29) LAHBECK, K. & CAZENAVE, A., Roy. Astron. Soc. Geosphys. 32_
(1973) 79-93.
(30) MORGAN, W.J., STONER, J-0. 6 DICKE, R.H., Jour. Geophys
Res. 66 11 (1961) 3831-3843-
(31) KROPOTKIN, P.N., Geotectonics 2_ (1970) 80-88.
(32) FAIRBRIDGE, R.W. £ KREBS, O.A. JR., Geophys Jour 6 (1962)
532-545.
(33) SIREN, G . ( Comm. Inst. Forest. Fenniae (Helsingfors) 54.2, (1961) 66p.
(34) SIREN, G. & HARI, P.,Rept. Kevo Subarctic Res. Station (Finland) 8. 155-157.
(35) SCH0VE, D.J., P a l . Pal. Pal. 25.(1978) 209-233-
(36) LAMBECK, K. 6 CAZANAVE, A., Geophys. J. Roy. Astron. Soc. 46_
(1976) 555-573-
(37) GRIBBIN, J. & PLAGEMANN, S., Nature 243. (1973) 26-27-
(38) YUMI, S. & WAK0, Y., "Secular motion of the pole", Earth
quake Displacement Fields and The Rotation of The Earth
(MANSINHA, L -, SMYLIE, D.E..BECK, A.E. Eds), Springer-
Verlag, New York, (1970) 82-8 7.
(39) SOLER, T. & MUELLER, I. I., Bull. Geodes ique 52^ 1 (1978).
(40) PROVERBIO, E. 6 POMA, A., "Astronomical evidence of change In
the rate of the earth's rotation and continental motion", Growth
Rhythms and the History of the Earth's Rotation (ROSENBERG, G.D.,
G.D., RUNKORN, S . K . ,E d s ) , Wiley-lnterscience, London, (1976)
385-395.
(41) MUNK, W . S REVELLE, R., Amer. J. Sci. 250 (1952) 829-833-
(42) B0STR0M, R.C.,Nature 2¿4 (1971) 536-538.
(43) LIU, H.S., et al., J. Geophys. Res. 79. (1974) 4379-4382.
(44) M0SETTI, F., Boll. Geofísica Teórica e A p p l . (Trieste) 5.18
1 2 7 - 1 3 8 .

IAEA-SM-243/43 405
(45) WUNSCH, C., Rev. Geophys. & Space Sci. _10 (1972) 1-1*9.
(46) MELCHIOR, P., Tectonophysics Ц3_ ("The Upper Mantle") (1972)
361-372.
(47) FARRELL, W.E. 6 CLARK, J., Geophys. J. Roy. Astron. Soc. 46 (1976)
647-667.
(48) KAITERA, P.,Ann. Acad. Sci. Fenniae 90 Al I I (¡966) 191-200.
(49) VAN DEN DUNGEN, F.H. et a l ., Bull. Acad. Roy. Belg. 38 (1952)
607.
(50) ROCHESTER, M.G. "The earth's rotation", (Second GEOP Research
Conference on the Rotation of the Earth and Polar Motion, Columbus,
1973) 769-780.
(51) SISCOE, G.L.,Nature 276 (1978) 348-352.
(52) CHERNOFSKY, E.J.,J. Geophys. Res. 7 1 (1966) 965-974.
(53) BARTA, G.,Acta Geol. (Budapest) 4 (1956) 15-42.
(54) WILLETT, H.C., Jour. Meteorol 6 (1949) 34-50.
(55) CHIU, Y.T., Nature 250 (1975) 642-643.
(56) M0GI, K., Tectonophysics 22 (1974) 265-282.
(57) BUCHA, V. "Effect o f changes in the earth's magnetic field on
weather, climate, and glaciations", Quaternary Glaciations in
the Northern Hemisphere (EASTERBR00K, D.J. 6 SIBRAVA, V. Eds.)
Project 73-1-24: IUGS-UNESC0-IGCP, Bellingham, Prague,
(1976) I6 I-I88.
(58) BRAY, F.R., Science 1_7i (1971) 1242-1243.
(59) CREER, K.M., GROSS, D.L. 6 LINEBACK, J.A., Geol. Soc. Am.
Bull. 87 (1976) 531-540.
(60) BUCHA, V.,Studia Geophys et Geodet 2 1 (1977) 350-360
(suppl. 416).

IAEA-SM-243/161
A RISK ANALYSIS METHODOLOGY
FOR DEEP UNDERGROUND
RADIOACTIVE WASTE REPOSITORIES
AND RELATED EXPERIMENTAL RESEARCH
F. GIRARDI, A. AVOGADRO, G. BERTOZZI,
M. D’ALESSANDRO, F. LANZA, C.N. MURRAY
Commission of the European Communities,
Joint Research Centre,
Ispra Establishment,
Ispra, Italy
Abstract
A RISK ANALYSIS METHODOLOGY FOR DEEP UNDERGROUND RADIOACTIVE WASTE REPOSITORIES AND RELATED EXPERIMENTAL RESEARCH.
The paper describes a methodology of risk analysis for the geologic disposal of radioactive waste which is currently being developed at the Ispra Joint Research Centre of the CEC. It is based on the following steps: ( 1) identification of the barriers able to prevent, decrease or delay the,radioactivity flow towards the biosphere; (2) modelling of the barrier system so that either a probabilistic or a deterministic description of each barrier can be drawn; (3) data collection and model execution to assess containment failure probabilities, and corresponding doses to population; (4) sensitivity analysis, to identify the parameters of major importance. The following barrier factors are considered: ( 1) segregation afforded by the geological formation itself - a probabilistic approach is used; (2) physical and chemical stability of the wastes - this takes account of the leachability and physical integrity of the materials, whilst experimental work performed at the JRC-Ispra provides information for better definition of the leaching model; (3) sorption phenomena during isotope transport by water through'porous underground media — the modelling of this barrier relies upon mathematical treatment of these phenomena. The chemical behaviour of actinide elements is being experimentally investigated in the institute; (4) environmental mobility and biological availability of isotopes — this barrier is treated through the definition of an environmental model. Dose rates to man are thus calculated, and probability values can be associated with them. The methodology also evaluates critical parameters and problem areas which require experimental study, thus helping in the organization and planning of R & D activities on radioactive waste disposal.
1. INTRODUCTION
Different kinds of radioactive wastes from fuel reprocessing plants and fuel
fabrication plants contain long-lived nuclides (fission products and transuranium
isotopes) which remain potentially hazardous for extremely long time periods.
Schemes for management of these wastes involve their conversion to insoluble
407
408 GIRARDI et al.
forms, with subsequent storage in deep geological formations. However, no
geologic formation can be proved to be entirely safe over long time periods.
The problem of expressing in quantitative terms the long-term risk has been
treated in different ways by many authors. A first approach consists of the use
of different types of risk ‘indexes’, which are a measure of the waste potential
to contaminate air and water to the maximum permissible concentrations [1—3].
Other indexes have been proposed to measure the waste radiotoxicity on the basis
of comparison to different uranium minerals [4,5]. All these indexes allow a
good comparison of the relative toxicities of different radioactive wastes, and
their time-dependences; however, they do not represent a measure of the risk,
in the sense of a risk analysis, since they do not take into consideration the
probability and event-sequence of a possible radionuclide release. Furthermore,
they do not consider the differences between soluble and insoluble compounds,
mechanisms for distribution, concentration, fixation or dispersion of radionuclides
in the environment, uptake capabilities of organisms, concentration in the food
chains, etc. A first attempt in this direction was carried out by Gera and Jacobs
[6], who suggested the use of a ‘Potential Hazard Index’; this takes into account
the probability for each isotope to leave the disposal site and reach man; the
probabilistic term, however, could not be quantified by the authors. A different
approach to the risk assessment was proposed by Cohen [7]; he used the average
226 Ra concentration in the earth crust as a reference level to measure the long
term risk of disposed waste.
A more sophisticated approach, derived from nuclear plant safety analysis,
consists of developing models able to furnish information both on possible failures
in geological containment and on their long-term consequences on man and bio
sphere. An intitial example of this approach is the methodology proposed by
Battelle Northwest Laboratories in 1974 [8,9]; examples of radioactivity release
probability assessment and of dose calculation to populations were given. It was
shown that Fault Tree Analysis (FTA) can be used to assess geological failure
probabilities. The most probable event sequences as identified by FTA are then
investigated by considering the different physico-chemical processes capable of
transferring the radioactivity to the human environment.
Methods are being refined in the framework of the WISAP program [10]
with the aim of demonstrating the applicability of the methodology to specific
sites. Particular emphasis is given to ‘Repository Simulation Analysis’ [11],
which has replaced Fault Tree Analysis. The AMRAW model of EPA comprises
a Fault Tree model and environmental and economic analysis [12]. At Sandia
Labs a methodology has been developed and applied to a conceptual reference
site, with the ultimate purpose of analysing the behaviour of potential real sites
[13]. In western Europe, risk assessment studies have produced publications
which describe several approaches to risk assessment. Among them the following
may be mentioned:

IAEA-SM-243/161 409
the UK ‘barrier approach’ developed at the NRPB [ 14] ;
the Dutch site-specific ‘worst case analysis’ [15];
the Federal German ‘Fault Tree Analysis’ applied for different time phases [16];
the Swedish ‘Consequence Analysis’, performed in the framework of the
KBS project [17];
the French approach, which emphasizes the greater importance of sorption
processes in encasing rocks and soils rather than the segregation offered by
the geological formation, which is considered uncertain [18,19];
the essentially probabilistic treatment proposed by Austrian authors [20].
2. METHODOLOGY
At the start of our activity in 1973 we chose the barrier concept to assess
the long-term risk, based on the analysis of all the processes capable of causing
radioactivity release from the repository and of transporting it through a set
of barriers to the biosphere and man; both probabilistic and deterministic
approaches were used, depending on the nature of the process. In fact, we
thought that this kind of analysis should take into consideration probabilities
and event sequences of radioactivity release, as well as the physical state and
chemical properties of stored wastes, and mechanisms for migration, fixation
and dispersion of radionuclides underground and in the biosphere, and their
behaviour along food chains.
Our methodology, which was illustrated in its various steps in successive
reports [21—23 ], is based on the following procedure:
( 1 ) identification of barriers able to prevent, decrease or delay the radioactivity
flow towards the biosphere;
(2) modelling of the barriers in such a way that either a probabilistic or a
deterministic description of the behaviour against radioactivity escape can
be given;
(3) data collection and model application, to assess containment failure
probabilities and radioactivity doses to man;
(4) sensitivity analysis, to obtain information on the relative importance of the
various parameters.
The barrier system that was defined is the following:
(1) segregation afforded by the geological formation;

410 GIRARDI et al.
(2) stability of the conditioned wastes against any physical degradation and
chemical attack;
(3) geochemical retention of released radioelements during transport by
groundwater;
(4) environmental mobility and biological availability of the radioelements in
the biosphere.
Each barrier was analysed on the basis of the information available in the
Literature; a set of experimental studies was then undertaken to furnish better
information on process mechanisms and input data for the models. As soon as
a better understanding is gained in any area of the model, the corresponding
section is updated to take into account the latest information.
In our approach, risk evaluation of geologic disposal is developed in three
successive steps:
(1) development of a generalized model, to be used as a guideline;
(2) validation of the modelling concepts, by testing the generalized model
on specific experimental sites;
(3) development of site-specific models, which are derived from the generalized
one, taking into account the special characteristics and modelling require
ments of a selected disposal site. Application of such specific models to
well identified sites can help in obtaining the necessary licensing from
national authorities.
The activity of the Joint Research Centre is relatively independent of
national initiatives on step 1, while a close co-operation with national Institutes
is required in step 2. The role of the JRC in step 3 will be limited to furnishing
the required support to national Institutes.
3. MODELLING OF THE GEOLOGICAL BARRIER
The questions to be answered are essentially two:
How can the barrier fail ?
What is the probability of failure ?
It appears that the suitability of a geological formation for the long-term
segregation of waste (provided that the repository’s presence will not lead to a
change in the initial lithological conditions) can be quantified in probabilistic
terms describing all the possible ways by which radioactive materials can escape

IAEA-SM-243/161 411
from the geological formation, and assigning a probability figure to each release
mode. For this purpose, the Fault Tree Analysis (FTA) methodology has been
used.
The overall spectrum of possible events which could lead to geological
segregation failure was divided into three different groups, according to their
suitability for probabilistic treatment:
(1) Natural processes, e.g. faulting, glacial, climate effects, volcanic activity,
etc. Such processes, which are independent-of the repository’s existence,
cannot be considered strictly random, since their occurrence is linked to
local evolving geological conditions. However, they can be traced back to
random events when the area and the time span in which they are expected
to occur are limited enough so that they can be characterized by steady
geological conditions (e.g. steady strain state).
(2) Human actions. The consequences of human intervention are not only
difficult to place within the boundaries of random events, but also to predict
by any other method. However, the possible interactions between future
mankind and the lithosphere appear so important in respect of repository
safety evaluation that they cannot be neglected.
(3) Changes of initial geological and/or lithological conditions which are caused
by the presence of a repository, e.g. thermal and radiation effects, mechanical
stresses arising from repository construction, chemical interactions between
waste and host rock, etc.
It is known with certainty, that these phenomena will occur once the reposi
tory and the waste emplacement have been realized. Thus it is not possible to treat this kind of phenomena in probabilistic terms and they are therefore
omitted in the Fault Tree model.
These factors require careful investigation through experimental studies, and they
will constitute a separate section of the safety assessment. On the basis of the
results of such experimental work, a suitable repository’s conceptual design should
be decided upon.
The fault tree treatment needs to be computer-assisted: a special code has
been developed at the JRC-Ispra for this purpose. As an output, it gives information
about the overall probability of the top event, the probability of each minimal set
of primary events which could cause the top event, the probability of each minimal
set of primary events which could cause the top event, the relative weight of each
minimal set, and the relative weight of the primary events. Probability histograms
can also be handled by the code.
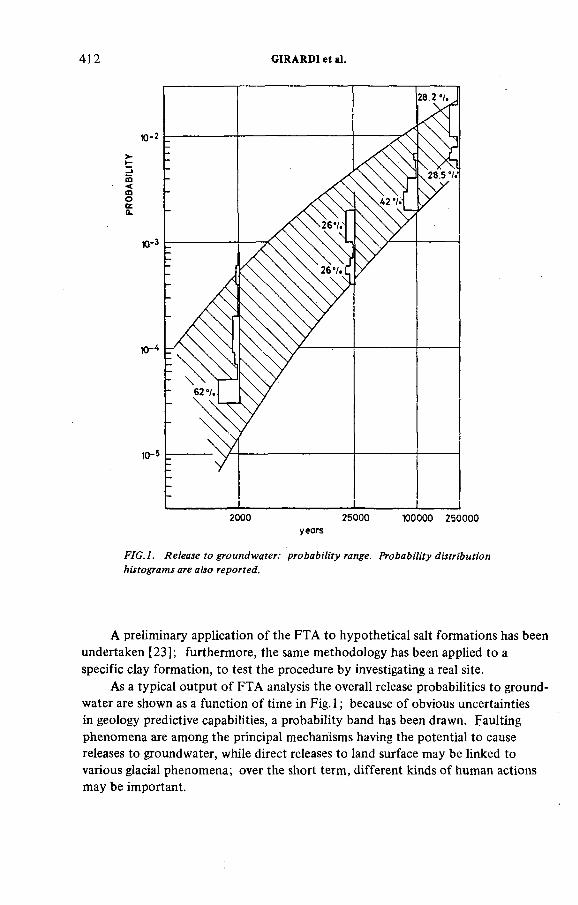
412 GIRARDI et al.
years
FIG.L Release to groundwater: probability range. Probability distribution
histograms are also reported.
A preliminary application of the FTA to hypothetical salt formations has been
undertaken [23]; furthermore, the same methodology has been applied to a
specific clay formation, to test the procedure by investigating a real site.
As a typical output of FTA analysis the overall release probabilities to ground
water are shown as a function of time in Fig.l ; because of obvious uncertainties
in geology predictive capabilities, a probability band has been drawn. Faulting
phenomena are among the principal mechanisms having the potential to cause
releases to groundwater, while direct releases to land surface may be linked to
various glacial phenomena; over the short term, different kinds of human actions
may be important.
IAEA-SM-243/161 413
However, it must be noted that the usefulness of the FTA does not only
consist in furnishing mere release probabilities, but especially in indicating what
are the important events not sufficiently understood, and which are the major
areas of uncertainty. Specific studies could thus be initiated, which finally would
allow a repetition of the analysis, resulting in a narrower band of uncertainty.
As an example we can cite the results of a sensitivity analysis carried out
on the preliminary conclusions of the study. Since tectonic phenomena appear
to be the most likely to jeopardize the geological segregation, some parameters
governing their probability have been identified and carefully examined. It was
concluded that a better evaluation of the age of the faults, rather than their
geometrical features, would permit a narrowing of the probability band, and
thus the overall results of the analysis would become more significant.
4. STABILITY OF CONDITIONED WASTES
This barrier takes account of the leachability and physical integrity of the
conditioned materials, and consequent availability of radionuclides for transport
by water. In our model, this barrier is treated in deterministic terms, by defining
for each material a relationship expressing the radioactivity release rate, dA¿/dt
as a function of some measurable parameters:
dAi- ^- = f( l ,a t,C i>t,Q t ) (1)
where:
1 is the leaching rate of the material,
at is the specific surface of the material at time t,
Cj t is the concentration of isotope i at time t,
Qt is the overall quantity of waste at time t.
The function f may have different forms, depending upon the properties
and behaviour of the material undergoing leaching.
In the case of vitrified HAW the radionuclide release rate depends on the
integrity of the structure, which governs the total surface exposed to the leaching;
this latter can be influenced by thermal shocks and radiation damage.
Very few data exist on the effect of thermal shock; some tests performed
at Battelle Northwest Laboratories [24] show that a dependence on the cooling
rate exists and that a surface increase up to 20 times is possible; no experimental
studies on this point have however been performed in our laboratories.

414 GIRARDI et al.
10 оо
оо
о о0
о
оо о о
_|_______ I_______ I_______ I_______ I_______ I_______ I_______ I_______ I_______ I5000 10000
Time (h)
FIG.2. Uranium concentration in the surface ¡ayer of a borosilicate glass as a
function o f leaching time.
The effect of radiation and particularly of a-radiation has been extensively
studied in many laboratories; tests using glass loaded with а-emitters have been
performed up to an equivalent storage time of 50 000 years, with no visible
effects.
In our laboratory, an equivalent storage time of ~ 150 000 years has been
reached, through a simulation based on the effect of fission fragments: no effect
was detected on physical integrity; even the leaching coefficient remained
constant.
As far as the leaching process is concerned, we have assumed that, following
a postulated failure of the geological containment, flowing water comes in contact
with the glass, so that the leaching products are continuously removed, and the
composition of the water is determined only by the chemical composition of the
surrounding rocks. Previously, it was frequently affirmed, on the basis of short
tests, that different cations are leached out with different rates; however, experi
mental studies performed in our laboratories have shown that the surface gel layer,
which is formed during the water attack process, tends to concentrate the less
leachable ions; Fig.2 shows the relative increase in concentration of uranium
in the gel layer.
A surface gel flaking process leads to a successive formation of colloidal
solutions. Such an effect was previously described by Scheffler [25], who
demonstrated that most plutonium is leached in a colloidal form. For these
reasons, in our studies we have considered that the most appropriate model to
describe the glass leaching is that of homogeneous dissolution, and that the best
leaching coefficients are those determined by long-term weight loss measurements.
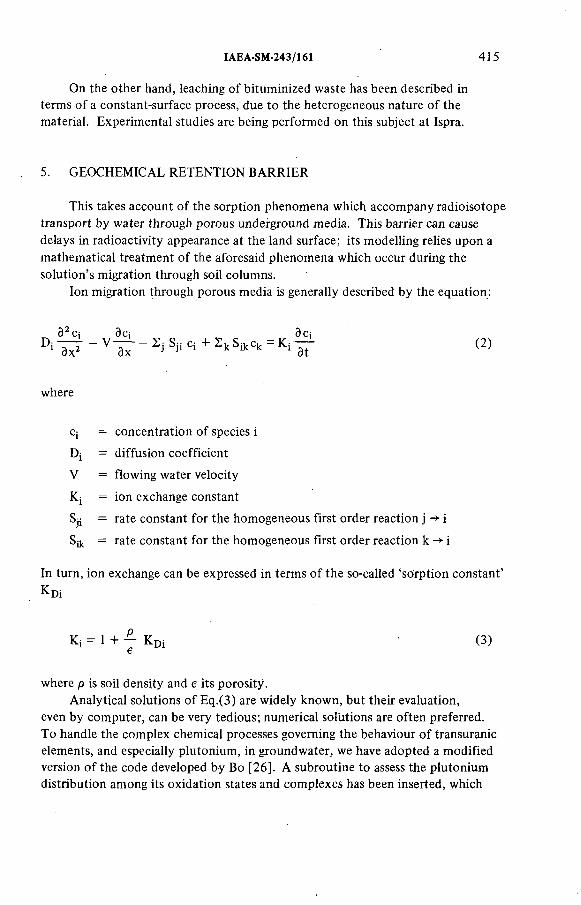
IAEA-SM-243/161 415
On the other hand, leaching of bituminized waste has been described in
terms of a constant-surface process, due to the heterogeneous nature of the
material. Experimental studies are being performed on this subject at Ispra.
5. GEOCHEMICAL RETENTION BARRIER
This takes account of the sorption phenomena which accompany radioisotope
transport by water through porous underground media. This barrier can cause
delays in radioactivity appearance at the land surface; its modelling relies upon a
mathematical treatment of the aforesaid phenomena which occur during the
solution’s migration through soil columns.
Ion migration through porous media is generally described by the equation:
c¡ = concentration of species i
D¡ = diffusion coefficient
V = flowing water velocity
Kj = ion exchange constant
Sjj = rate constant for the homogeneous first order reaction j -*■ i
Sjjj = rate constant for the homogeneous first order reaction к ->• i
In turn, ion exchange can be expressed in terms of the so-called ‘sorption constant’
where p is soil density and e its porosity.
Analytical solutions of Eq.(3) are widely known, but their evaluation,
even by computer, can be very tedious; numerical solutions are often preferred.
To handle the complex chemical processes governing the behaviour of transuranic
elements, and especially plutonium, in groundwater, we have adopted a modified
version of the code developed by Bo [26]. A subroutine to assess the plutonium
distribution among its oxidation states and complexes has been inserted, which
(2)
where
= 1 + J KDi (3)
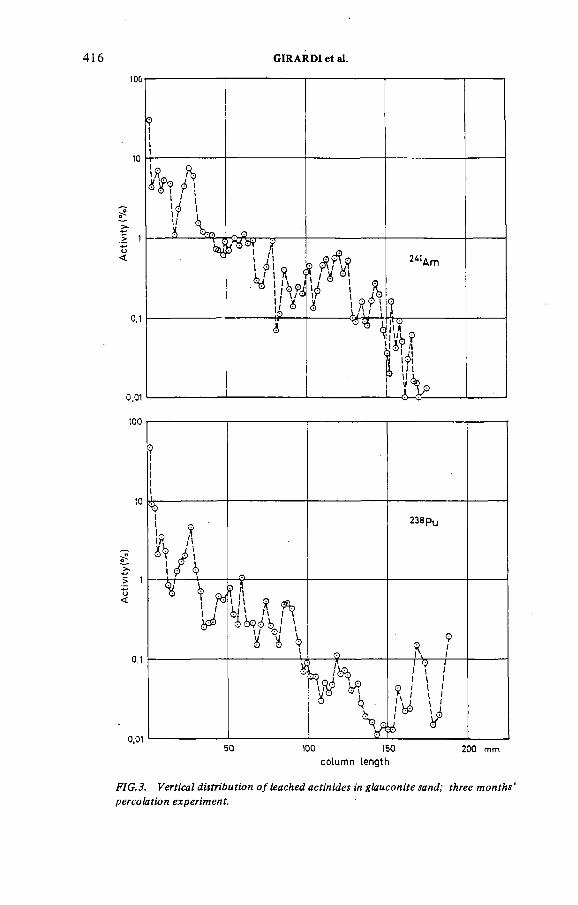
416 GIRARDI et al.
column length
FIG.3. Vertical distribution o f leached actinides in glauconite sand; three months’
percolation experiment.

IAEA-SM-243/161 417
takes into account the physico-chemical properties of the aqueous medium, such
as Eh, pH, presence of complexing anions, etc.
It must be stressed, however, that most of the data presently utilized are
only rough estimates based on sparse experimental evidence. An example of this
is the problem of plutonium chemical forms in aqueous media [27]. Complex
stability, redox reactions, precipitation and filtration processes, and colloid ageing
are all phenomena not yet understood in quantitative terms. A better understand
ing of all these points is clearly needed to allow reliable quantitative modelling
of the sorption barrier. For these reasons, this barrier has not been considered in
our model.
Experimental studies to investigate the physico-chemical behaviour of
transuranic elements leached from glass under conditions similar to those of
natural groundwaters are being developed in our laboratories: ultrafiltration,
ion exchange and solvent extraction techniques are being tested to help us under
stand oxidation behaviour and the complex formation of actinide elements. The
expected conditions for glass leaching and actinide transport have been carefully
simulated; borosilicate glasses containing 238Pu,241 Am and 237Np have been
utilized. The set-up adopted for migration studies in soil columns consists of a
water pathway flowing over the glass and then through different soil samples.
At the end of the experiment, which often lasts a few months, the columns are
sliced into thin sections and the actinide distribution profile is drawn.
Figure 3 shows an example of the activity profile obtained with 238Pu
leached from borosilicate glass over a three-month period and percolated through
a column of a typical subsoil overlying a clay formation. On the basis of the
reported distribution coefficient and assuming a reversible ion-exchange mecha
nism, the activity should have been confined to the first few millimetres of the
column. However, a continuous small activity output was found. The column
profile shows that the long-term interaction between the leachate and the column
cannot be described by a simple ion-exchange mechanism.
The physico-chemical nature of the migrating species is being studied; the
formation of neutral or anionic complexes might explain the existence of mobile
chemical forms of transuranic nuclides.
6. ENVIRONMENTAL MODELLING
In long-term risk assessment studies, the definition of the environmental
scenario requires a set of assumptions, which are largely arbitrary, particularly
for generalized models. For that reason, detailed modelling refinements are of
little practical value, when the parameters required for their use are not available
with the necessary accuracy. We have therefore developed rather simple environ
mental models, where the radioactivity concentration in each compartment is
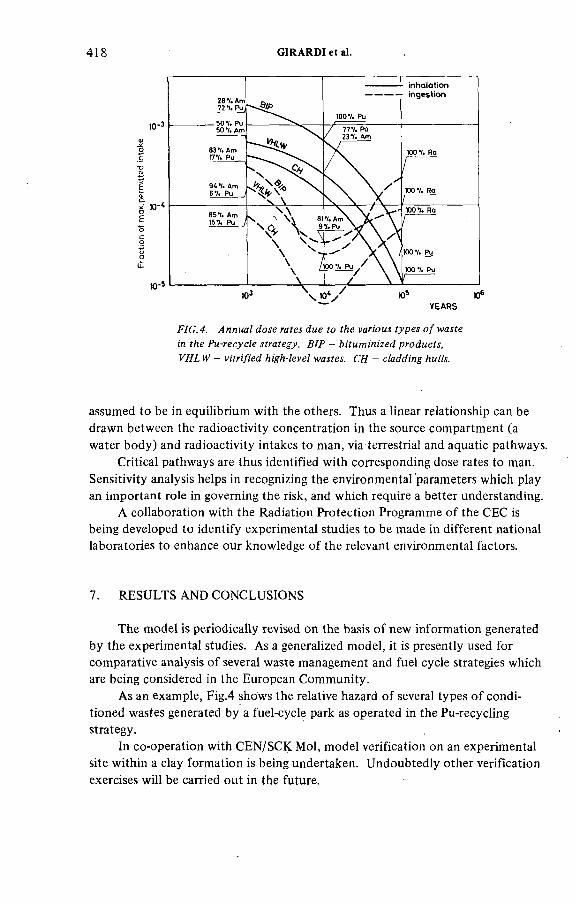
418 GIRARDI et al.
та-30>ж0'с■О<U1
£О Соо о üZ
ю-5
FIG.4. Annual dose rates due to the various types of waste
in the Pu-recycle strategy. BIP - bituminized products,
VHL W — vitrified high-level wastes. CH - cladding hulls.
assumed to be in equilibrium with the others. Thus a linear relationship can be
drawn between the radioactivity concentration in the source compartment (a
water body) and radioactivity intakes to man, via terrestrial and aquatic pathways.
Critical pathways are thus identified with corresponding dose rates to man.
Sensitivity analysis helps in recognizing the environmental parameters which play
an important role in governing the risk, and which require a better understanding.
A collaboration with the Radiation Protection Programme of the CEC is
being developed to identify experimental studies to be made in different national
laboratories to enhance our knowledge of the relevant environmental factors.
7. RESULTS AND CONCLUSIONS
The model is periodically revised on the basis of new information generated
by the experimental studies. As a generalized model, it is presently used for
comparative analysis of several waste management and fuel cycle strategies which
are being considered in the European Community.
As an example, Fig.4 shows the relative hazard of several types of condi
tioned wastes generated by a fuel-cycle park as operated in the Pu-recycling
strategy.
In co-operation with CEN/SCK Mol, model verification on an experimental
site within a clay formation is being undertaken. Undoubtedly other verification
exercises will be carried out in the future.
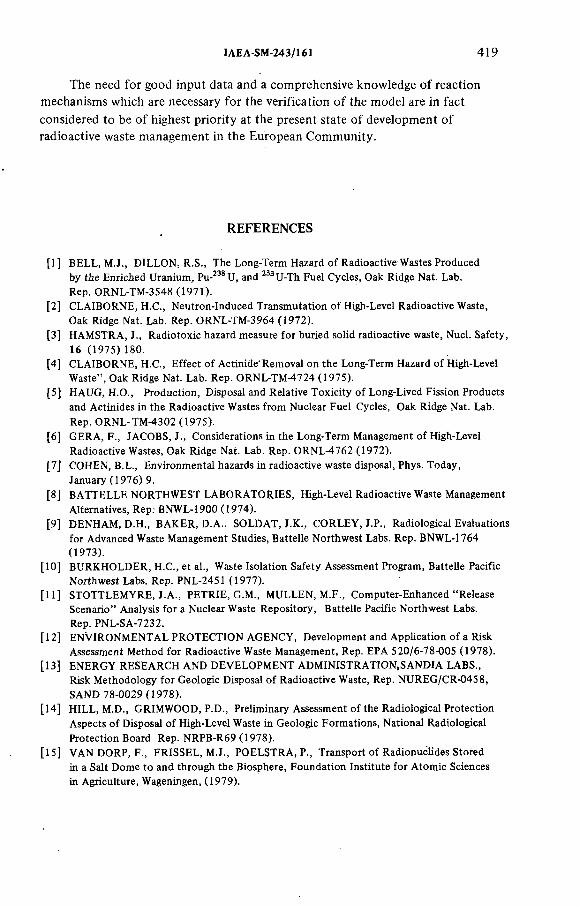
IAEA-SM-243/161 419
The need for good input data and a comprehensive knowledge of reaction
mechanisms which are necessary for the verification of the model are in fact
considered to be of highest priority at the present state of development of
radioactive waste management in the European Community.
REFERENCES
[1] BELL, M.J., DILLON, R.S., The Long-Term Hazard of Radioactive Wastes Produced by the Enriched Uranium, Pu-238U, and 233 U-Th Fuel Cycles, Oak Ridge Nat. Lab.Rep. ORNL-TM-3548 (1971).
[2] CLAIBORNE, H.C., Neutron-Induced Transmutation of High-Level Radioactive Waste,Oak Ridge Nat. Lab. Rep. ORNL-TM-3964 (1972).
[3] HAMSTRA, J., Radiotoxic hazard measure for buried solid radioactive waste, Nucl. Safety, 16 (1975) 180.
[4] CLAIBORNE, H.C., Effect of Actinide'Removal on the Long-Term Hazard of High-Level Waste” , Oak Ridge Nat. Lab. Rep. ORNL-TM-4724 (1975).
[5] HAUG, H.O., Production, Disposal and Relative Toxicity of Long-Lived Fission Products and Actinides in the Radioactive Wastes from Nuclear Fuel Cycles, Oak Ridge Nat. Lab. Rep. ORNL-TM-4302 (1975).
[6] GERA, F., JACOBS, J ., Considerations in the Long-Term Management of High-Level Radioactive Wastes, Oak Ridge Nat. Lab. Rep. ORNL-4762 (1972).
[7] COHEN, B.L., Environmental hazards in radioactive waste disposal, Phys. Today,January (1976) 9.
[8] BATTELLE NORTHWEST LABORATORIES, High-Level Radioactive Waste Management Alternatives, Rep: BNWL-1900 (1974).
[9] DENHAM, D.H., BAKER, D.A., SOLDAT, J.K ., CORLEY, J.P., Radiological Evaluations for Advanced Waste Management Studies, Battelle Northwest Labs. Rep. BNWL-1764(1973).
[10] BURKHOLDER, H.C., et al., Waste Isolation Safety Assessment Program, Battelle Pacific Northwest Labs. Rep. PNL-2451 (1977).
[11] STOTTLEMYRE, J.A ., PETRIE, G.М., MULLEN, M.F., Computer-Enhanced “ Release Scenario” Analysis for a Nuclear Waste Repository, Battelle Pacific Northwest Labs.Rep. PNL-SA-7232.
[12] ENVIRONMENTAL PROTECTION AGENCY, Development and Application of a Risk Assessment Method for Radioactive Waste Management, Rep. EPA 520/6-78-005 (1978).
[13] ENERGY RESEARCH AND DEVELOPMENT ADMINISTRATION,SANDIA LABS.,Risk Methodology for Geologic Disposal of Radioactive Waste, Rep. NUREG/CR-0458, SAND 78-0029 (1978).
[14] HILL, M.D., GRIMWOOD, P.D., Preliminary Assessment of the Radiological Protection Aspects of Disposal of High-Level Waste in Geologic Formations, National Radiological Protection Board Rep. NRPB-R69 (1978).
[15] VAN DORP, F., FRISSEL, M.J., POELSTRA, P., Transport of Radionuclides Stored in a Salt Dome to and through the Biosphere, Foundation Institute for Atomic Sciences in Agriculture, Wageningen, (1979).
420 GIRARDI et al.
[16] PROSKE, R., “ Previous results of risk analysis of repositories for radioactive wastes in geologic salt formations in the Federal Republic of Germany” , in Risk Analysis and Geologic Modelling in Relation to the Disposal of Radioactive Wastes into Geological Formations, Proc. Workshop organised jointly by the OECD Nuclear Energy Agency and the Commissionof the European Communities, Ispra establishment (1977).
[17] KÀRNBRÀNSLESXKERHET, Handling of Spent Nuclear Fuel and Final Storage of Vitrified High Level Reprocessing Waste, KBS Rep. (1978).
[18] DE MARSILY, G., LEDOUX, E., BARBREAU, A., MARGAT, J., Nuclear waste disposal: can the geologist guarantee isolation? , Science, 197(1977) 519.
[19] BARBREAU, A., et al., Etude du Confinement de dechets radioactifs dans une formation geologique, Report LHM/RC/75/46.
[20] KREJSA, P., “ Status and programme of the Austrian activities for final disposal of radioactive wastes in geological formations” , Risk Analysis and Geologic Modelling in Relation to the Disposal of Radioactive Wastes into Geological Formations, Proc. Workshop organized jointly by the OECD Nuclear Energy Agency and the Commission of the European Communities, Ispra Establishment (1977).
[21] GIRARDI, F., BERTOZZI, G., Long-Term Alpha-Hazard of High Activity Waste from Nuclear Fuel Reprocessing, Commission of the European Communities Rep.EUR-5214(1974).
[22] GIRARDI, F „ BERTOZZI, G., D’ALESSANDRO, М., Long-Term Risk Assessment of Radioactive Waste Disposal in Geological Formations, Commission of the European Communities Rep. EUR-5902 (1978).
[23] BERTOZZI, G., D’ALESSANDRO, М., GIRARDI, F., VANOSSI, М., Safety Assessment of Radioactive Waste Disposal into Geological Formations; a Preliminary Application of Fault Tree Analysis to Salt Deposits, Commission of the European CommunitiesRep. EUR-5901 (1978).
[24] ROSS, W.A., Thermal Fracture Behaviour of Glass in Simulated Glass Canisters, Battelle-Northwest Quarterly Progress Report 1893 (1975).
[25] SCHEFFLER, K., RIEGE, U., Investigations on the Long-Term Radiation Stability of Borosilicate Glasses against Alpha Emitters, Kemforschungszentrum Karlsruhe Rep. KFK 2422(1977).
[26] BO, P., Column, Numerical Solutions of Migration Equations Involving Various Physico- Chemical Processes, Danish Atomic Energy Commission Rep. (1978).
[27] SALTELLI, A., AVOGADRO, A., BERTOZZI, G., “ Assessment of plutonium chemical forms in groundwater” , Workshop on the Migration of Long-Lived Radionuclides in the Geosphere, organized jointly by the OECD Nuclear Energy Agency and the Commission of the European Communities, Brussels (1979).
DISCUSSION
K. KÜHN: Have you done a sensitivity analysis for the parameters which
go into your fault tree analysis? If so, would you please specify which parameters
are the most important for your model and for a repository in general?
G. BERTOZZI: Our code for the fault tree treatment comprises a section
which shows the relative weights of the different events; this is a kind of sensitivity
IAEA-SM-243/161 421
analysis. Our general conclusion was that leach rates and specific surfaces of
conditioned materials, and also the chemical and sorption properties of the leached
radioisotopes, were the most important parameters.
K. KÜHN: In my opinion emphasis should be placed on the geologic
formation as the main protective barrier and on processes which can release •
radioisotopes from the repository.
H.A. PIRK: Risk analyses are usually applied to existing and operating
man-made systems where sufficient and sound reliability data on subsystems
and components are available. In the case of a geological repository for nuclear
waste such data are not available and their absence introduces a wide range of
uncertainty and speculation into the risk calculation. Do you think that this
speculative aspect could be harmful to the aim of gaining public acceptance of
safe geological repositories?
G. BERTOZZI: On the contrary, there is every reason to believe that
sufficient data are available on geological processes; these can be presented in
probabilistic terms,thus giving us a means of considering long periods of time
in a reasonable manner. This is, after all, one of the major areas of uncertainty
in assessing the feasibility and safety of high-level waste disposal. The use of
purely deterministic models provides only a partial solution to the problem.
Moreover, a combination of probabilistic and deterministic approaches makes
possible a sensitivity analysis which can show more clearly the relevance of
uncertainties in parameters. Although geological probabilities involve large
variations, these in fact may not be any greater in magnitude than the uncertainty
in deterministic model parameters which, as generally agreed, is found even in
the simplest processes.
H. KRAUSE: In the paper you point out that medium-level waste presents
a bigger potential hazard than high-level waste. Could you please explain why
this is so? Is this due to the higher leach rate, the larger surface of the waste,
different modes of disposal or some other factors?
G. BERTOZZI: In our model we have assumed that plutonium-bearing
medium-level waste will be bituminized. Since bituminized products seem to
have higher leach rates than vitrified products and since plutonium inhalation
constitutes a fairly critical pathway, it is felt that these types of waste could be
more dangerous than vitrified high-level wastes.
W. BECHTHOLD: I understand your model is being used at present for
comparison purposes. Do you think that it can be used in future to demonstrate
the safety of a repository, especially in view of the difficulty of estimating the
probability of failures or occurrences causing these failures?
G. BERTOZZI: Our model is being applied at present to a specific site
in a clay formation. The probabilistic section has already been completed, while
the deterministic one will be developed in the next few months. Other applica
tions to specific sites will certainly be made.

422 GIRARDI et al.
J. HAMSTRA: Could you please explain how your probabilistic approach
to safety assessment would be more convincing to public opinion than a more
conservative, worst-case assessment approach?
G. BERTOZZI: I don’t think a probabilistic approach can be more convincing
than any other method,but it is the best way of dealing with certain barriers.
However, there are barriers which have to be treated with deterministic models.
Both types of approach are necessary.
IAEA-SM-243/3S
THE WASTE ISOLATION
SAFETY ASSESSMENT PROGRAMME
A. BRANDSTETTER, M.A. HARWELL
Battelle Pacific Northwest Laboratory,
Richland, Washington,
United States of America
Abstract
THE WASTE ISOLATION SAFETY ASSESSMENT PROGRAMME.Associated with commercial nuclear power production in the USA is the generation of
potentially hazardous radioactive wastes. The Department of Energy (DOE), through the National Waste Terminal Storage (NWTS) Programme, is seeking to develop nuclear waste isolation systems in geologic formations that will preclude contact with the biosphere of waste radionuclides in concentrations which are sufficient to cause deleterious impact on humans or their environments. Comprehensive analyses of specific isolation systems are needed to assess the expectations of meeting that objective. The Waste Isolation Safety Assessment Programme (WISAP) has been established at the Pacific Northwest Laboratory (operated by Battelle Memorial Institute) for developing the capability o f making those analyses. Among the analyses required for isolation system evaluation is the detailed assessment of the post-closure performance of nuclear waste repositories in geologic formations. This assessment is essential, since it is concerned with aspects of the nuclear power programme which previously have not been addressed. Specifically, the nature of the isolation systems (e.g. involving breach scenarios and transport through the geosphere), and the time-scales necessary for isolation, dictate the development, demonstration and application of novel assessment capabilities. The assessment methodology needs to be thorough, flexible, objective, and scientifically defensible. Further, the data utilized must be accurate, documented, reproducible, and based on sound scientific principles.
1. INTRODUCTION
The objectives of the Waste Iso la tio n Safety Assessment Program (WISAP) are to: 1) develop the c ap a b ilit ie s neededto assess the post-closure safety of geologic repos ito ries , 2 ) obtain s c ie n t if ic a l ly defensible generic and site- spec ific data necessary for safety assessments, 3) provide, as needed, studies to further support these data and analyses, 4) demonstrate the assessment c a p a b ilit ie s by performing analyses of reference s ite s , 5) apply the assessment methodology to ass is t the National Waste Terminal Storage Program in s ite se lec tion , and 6) perform repository s ite analyses responsive to the time schedule and to the level of soph is tica tion required to meet the licensing needs of the National Waste Terminal Storage Program.
423
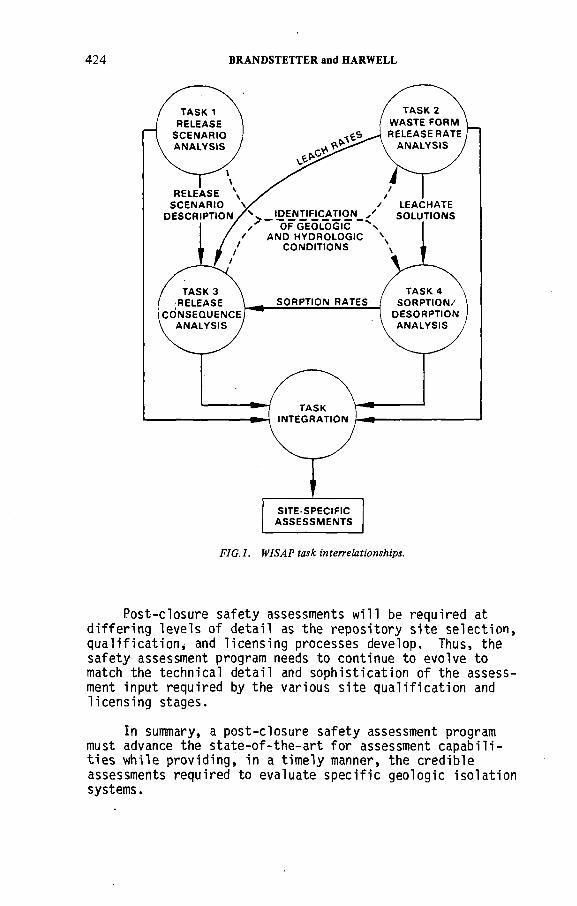
424 BRANDSTETTER and HARWELL
Post-closure safety assessments w ill be required at d iffe r in g levels of de ta il as the repository s ite se lec tion , q u a lif ic a t io n ¿ and licensing processes develop. Thus, the safety assessment program needs to continue to evolve to match the technical de ta il and soph is tica tion of the assessment input required by the various s ite q u a lif ic a t io n and licensing stages.
In summary, a post-closure safety assessment program must advance the state-of-the-art fo r assessment c a p a b ilit ie s while provid ing, in a timely manner, the credible assessments required to evaluate spec ific geologic iso la tio n systems.
IAEA-SM-243/35 425
There are two basic components of repository postclosure safety assessments:
• id e n t if ic a t io n and analyses of breach scenarios and the pattern of events and processes causing each breach;
• id e n t if ic a t io n and analyses of the environmental consequences of radionuclide transport and in te ractions subsequent to a repository breach.
The current scope of the Waste Iso la tio n Safety Assessment Program is lim ited to long-term, post-closure analyses. I t excludes the consideration of processes tha t are induced by the presence of the wastes tha t may a ffect the repository in te g r ity , and i t excludes the consideration of nuclear waste iso la tio n other than geologic iso la tio n repos ito ries . The near-field/near-term aspects of geologic repositories are being considered by ONWI/DOE under separate programs. They w ill be integrated with the WISAP methodology fo r the actual s ite-spec ific repository safety analyses.
The Waste Iso la t io n Safety Assessment Program is divided in to a management task and four technical tasks (Figure 1). These tasks are designed to be integrated
to produce the needed assessment methodology and s ite analyses. These tasks, invo lv ing the P ac ific Northwest Laboratory and subcontractors are described below.
2. RELEASE SCENARIO ANALYSIS
Task 1, Release Scenario Analysis, u t i l iz e s geoscient i s t teams and mathematical models to id en tify and pred ict the events and processes which could p o te n tia lly a ffect the repository in te g r ity . This includes the analysis of the in te ractions and sequences of phenomena which could resu lt in a loss o f containment by the repository . Based upon the pa r t ic u la r nature of a release sequence of phenomena, the condition of the geology surrounding the repository at the time of the breach w ill be determined as i n i t i a l conditions for the consequence analysis.
Thus, the functions of Task 1 are to:
• specify possib le release scenarios;
• id e n tify the sequence of events and processes which could lead to such scenarios;

426 BRANDSTETTER and HARWELL
• describe the state of the surrounding geology as i n i t i a l conditions fo r consequence analyses.
The purpose of th is task is to analyze nuclear waste repository release scenarios. Task 1 considers geologic events and processes, man-caused events and processes, and the impact of these on the in te g r ity of the repository. Events such as earthquakes, fa u lt in g and human in trus ion , and processes such as erosion, u p l i f t and d iap irism could alone or in concert s ig n if ic a n t ly a lte r the geology surrounding the repository , leading to a loss of repository in te g r ity . The output from th is task w ill estab lish the conditions of the geology and hydrology surrounding the repository at the time of an id e n t if ie d breach. Thus,Task 1 w ill provide the major geologic boundary conditions for input into the consequence analysis models of Task 3.
Development of the release scenario ana ly tica l capab i l i t y is being performed in a two-stage approach. This year, an ad hoc team of geoscientists is generating release scenarios for reference s ites as inputs from Task 1 to Task 3. Concurrently, release scenario models are being developed so tha t in subsequent years the models can be - u t i l iz e d to ass is t in the generation of release scenarios. These two approaches are in tim ate ly in te rre la ted , so that the information and data developed from the e ffo r t of the geoscientists are being used to aid in the conceptualization of the d iffe r in g geologic parameters incorporated in the developing models. Conversely, the expert team e ffo rts are u t i l i z in g the intermediate stages of the models being developed to a id , insofar as possib le , in focusing the scenario generation.
This task has e ssen tia lly completed the i n i t i a l , generic phase of work. This phase involved:
• survey of possib ly applicab le methodologies and selection of the release scenario methodology to be used fo r s ite scenario analyses;
• pub lica tion of a scenario analysis methodology report;
• id e n t if ic a t io n of p o te n tia lly d isrup tive events and processes;
• completion of i n i t i a l consultant e ffo rts to characte r ize and quantify the id en tif ie d p o te n tia lly d isruptive phenomena;
IAEA-SM-243/3S
• receipt of a l l 1978 consultant reports and in i t ia t io n of synthesis of these fo r the scenario methodology development.
Completion of th is i n i t i a l , generic phase allows the t r a n s ition of Task 1 e ffo rts to the development of geologic- spec ific and s ite-spec ific release scenario methodology.
S pe c if ic a lly , the generic phase has provided the baseline from which actual release scenarios for reference s ite i n i t i a l analyses are being generated th is year. Also, the development and tes ting of the generic computer program during the i n i t i a l phase of Task 1 formed the basis for the development of geo log ic-specific , second-generation models. Thus, while sophisticated scenario models w ill not be a v a ilable for s ite app lica tions th is year, prerequ is ite steps have been completed which w ill simultaneously allow ad hoc team u t i l iz a t io n of WISAP technology for s ite scenario
analyses and continuation of release scenario model development. • i
The thrust of Task 1 th is year is to provide geoscientist-generated scenario inputs to Task 3 fo r re fe rence s ite i n i t i a l assessments, and to continue development
of scenario models which w ill be u t i l iz e d next year for s ite assessments.
3. WASTE FORM RELEASE RATE ANALYSIS
Task 2, Waste Form Release Rate Analysis, is in v e s t igating leaching rates and processes of radionuclide release from nuclear waste forms, providing essentia l source terms for radionuclide movement. These rates are of major importance to breach consequences because slower leach rates add time delays prior to the hydrologie transport of the rad io nuclide inventory. Such delays can be important factors in containment, espec ia lly for radionuclides of rapid or in te r mediate decay rates. Leach rates are dependent upon the charac te ris tics of the waste forms and the extant physicochemical conditions w ith in the repository at the time of breach. The functions of Task 2 are to:
• simulate actual repository physico-chemical conditions during the leach rate measurement;
• perform leaching measurements on the antic ipated waste forms, geomedia, and groundwaters of spec ific s ites for u t i l iz a t io n by Task 3 analyses;
428 BRANDSTETTER and HARWELL
• provide actual leachate so lu tions for Task 4 measurements;
• investigate the fundamental physico-chemical phenomena governing waste form leaching under repository conditions for the development of a model for pred iction of long-term waste form behavior;
• develop mathematical re la tionsh ip s of waste leaching fo r incorporation in to the Task 3 radionuclide transport models.
The purpose of th is task is to measure and understand radionuclide release rates for waste forms antic ipated fo r geologic is o la t io n . A t,the present time, these waste forms include spent fu e l, high-level waste (HLW) glass and, for transuranics (TRU), concrete, bitumen, urea-formaldehyde and polymers. Present ca lcu la tions are based on the assumptions tha t the waste is a l l released at once or tha t there is a constant release rate fo r a l l elements. Leaching processes are of major importance to breach consequence analyses because slower leach rates delay the transport of
radionuclides from a breached repository to the biosphere.In add ition , the lim ited amount of information on leach rates that is ava ilab le ignores the spec ific e ffects of the can iste rs , b a c k f i l l , geology, and hydrology. Mechanism studies are needed to va lida te the use of short-term tests for long-term safety ana lysis . Without data d ire c tly re lated to geologic repository cond itions, the modeling e ffo r t w ill c learly have lim ited v a lid ity , as model resu lts may not re fle c t important barriers to m igration. F in a lly , the acqu is ition of these data is important in estab lish ing the confidence of the public and the s c ie n t if ic community. Throughout the evaluations leading to the licensing app lica t io n , the best ava ilab le analysis and data acqu is ition approaches must be used.
The a c t iv it ie s necessary for the acqu is ition of data include the preparation and characterization of waste form samples, the measurement of leach rates of selected rad io nuclides using leaching solutions and physical parameters which span the range antic ipated for waste repos ito ries , the development of a data base from leach measurements, mechanistic/modeling studies for use by Task 3, and the preparation of leachate from actual waste forms for use by Task 4.
A number of leaching experiments fo llow ing Internatio na l Atomic Energy Agency (IAEA) procedures have been per
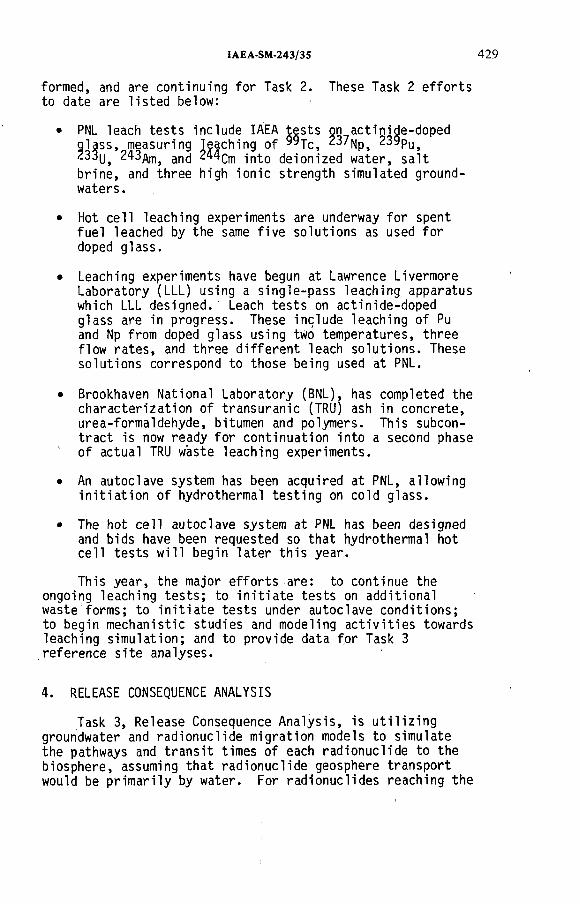
IAEA-SM-243/3S
formed, and are continuing for Task 2. These Task 2 e ffo rts to date are lis te d below:
• PNL leach tests include IAEA tests on actinide-doped g lass, measuring leaching of ^^Tc, ^37Np, 239pu>233us 243/\nij ancj 244cm -jnt 0 deionized water, s a lt
b rine , and three high ion ic strength simulated groundwaters.
• Hot ce ll leaching experiments are underway for spent fue l leached by the same five solutions as used for doped g lass.
• Leaching experiments have begun at Lawrence Livermore Laboratory (LLL) using a single-pass leaching apparatus which LLL designed. Leach tests on actinide-doped glass are in progress. These include leaching of Pu and Np from doped glass using two temperatures, three flow ra tes , and three d iffe re n t leach so lu tions . These solutions correspond to those being used at PNL.
• Brookhaven National Laboratory (BNL), has completed thecharacteriza tion of transuranic (TRU) ash in concrete,urea-formaldehyde, bitumen and polymers. This subcontrac t is now ready for continuation in to a second phase of actual TRU waste leaching experiments.
• An autoclave system has been acquired at PNL, allow ingin it ia t io n of hydrothermal tes ting on cold g lass.
• The hot ce ll autoclave system at PNL has been designed and bids have been requested so tha t hydrothermal hot ce ll tests w ill begin la te r th is year.
This year, the major e ffo rts are: to continue theongoing leaching tes ts ; to in i t ia t e tests on add itiona l waste forms; to in i t ia t e tests under autoclave cond itions; to begin mechanistic studies and modeling a c t iv it ie s towards leaching sim ulation; and to provide data for Task 3 reference s ite analyses.
4. RELEASE CONSEQUENCE ANALYSIS
Task 3, Release Consequence Analysis, is u t i l i z in g groundwater and radionuclide m igration models to simulate the pathways and tra n s it times of each radionuclide to the biosphere, assuming tha t radionuclide geosphere transport would be p rim arily by water. For radionuclides reaching the
430 BRANDSTETTER and HARWELL
surface, rad io log ica l dose models are used to compute exposures to humans and th e ir environment. Thus, the functions of Task 3 are to:
• provide simulations of water movement through the geosphere from the repository proxim ity;
• provide simulations of the transport of radionuclides through the geosphere, driven by the water flow;
• provide source terms for the rad io log ica l dose models;
• pred ict antic ipated rad io log ica l dose levels fo r humans and the ir environment based on the geosphere simulatio ns .
The purpose of th is task is to provide the c apab ility fo r analysis of rad io log ica l consequences of a repository breach. This includes analysis of the transport of rad io nuclides from the repository proxim ity to the biosphere
and computation of the ind iv idua l and population doses resu ltan t from the biosphere entry.
I t is assumed that the movement of radionuclides through the geosphere would be p rim arily by water transport. Thus, the geosphere transport aspect of th is task has two components: 1) the id e n t if ic a t io n , through sim ulation ,of the po tentia l water pathways and tra n s it times, and 2 ) the jux tapos ition ing of the actual radionuclide movement onto th is hydrologie regime, taking in to consideration fa c tors a ffec ting chain decay and transport. Added onto the output of these geosphere models are rad io log ica l dose models, so tha t three model sets are involved in th is task. A dd itio na lly , w ith in each model grouping are models of d i f fe r ing levels of complexity, so tha t the degree of model soph is tica tion can be attuned to the adequacy of the data base for each p a rticu la r ana lys is , and to the purpose of the analysis (e .g . , prelim inary planning, s ite se lection , licensing of spec ific s i te ) . Thus, Task 3 currently provides a f le x ib le c ap ab ility for consequence analysis.
This year, a major objective of th is task is to u t i l iz e these extant models to perform reference s ite i n i t i a l analyses for several d iffe r in g geologies, including domed s a lt , bedded s a lt , and basalt s ite s . This e ffo r t w ill enhance the model development e ffo r t . The objectives are to increase the e ffic ie ncy , d e fe n s ib ility , and c r e d ib il ity of the models so tha t la te r , more complete s ite-spec ific analyses can be performed to the depth required for the licensing process.
IAEA-SM-243/35
F in a lly , Task 3 is a focal point for data base c o lla t io n , both from w ith in and from outside WISAP.
Task 3 e ffo rts to date have brought that task to the po in t where actual s ite-spec ific analyses can now be made.A synopsis of the Task 3 status includes:
• The data base system has been established on a f le x ib le data re tr ieva l system. Generic data have been compiled for tes t case model runs and v e r if ic a tio n . Site- spec ific data for a bedded s a lt s ite have been added to the system.
• The hydrologie models selected for WISAP use (VTT, 3-d F .E ., PATHS) have been implemented; s e n s it iv ity analyses have been performed, and tes t cases have been run for v e r if ic a t io n .
• The radionuclide transport models selected for WISAP use (GETOUT, MMT) have been implemented, s e n s it iv ity analyses have.been performed, and tes t cases have been run for v e r if ic a t io n .
• Previously developed rad io log ica l dose models have been converted to the Uni vac 1100/44 computer system and are f u l ly operationa l.
• A tes t case of the release consequence analysis methodology has been completed to exercise the Task 3 models and th e ir in terfaces. Results indicate Task 3 models can now be u t i l iz e d for i n i t i a l assessments o f site- spec ific cases, subject to a v a ila b i l i ty of the necessary data and release scenarios.
5. SORPTION/DESORPTION ANALYSIS
Task 4, Sorption/Desorption Analysis, is investiga ting radionuclide sorption processes. I f radionuclides are actua lly released in to a transporting groundwater, these may be sorbed by the geomedia which they contact. Irrevers ib le sorption would act to remove the radionuclide from the water. Reversible sorption would act in a manner s im ila r to waste form leaching, by providing time delays to the migration of radionuclides. Geomedia of s u ff ic ie n t sorptive capab ility could provide iso la tio n of the waste from the biosphere by extending tra n s it times to very long periods of time. As with leaching, sorption/desorption by geomedia is dependent upon the spec ific radionuclide involved and the
432 BRANDSTETTER and HARWELL
physico-chemical charac te ris tics of the geomedia and transporting so lu tions . The functions of Task 4 are to:
• investigate the fundamental phenomena governing sorption/desorption of radionuclides by geomedia;
• provide measured values of sorption d is tr ib u tio n s fo r spec ific nuclides and media;
• develop pred ictive equations for sorption d is tr ib u tio n extrapolations for non-measured s itu a tio n s .
Task 4 currently includes work at PNL and at ten subcontractors to generate the sorption/desorption data necessary for consequence analyses. For the past two years, these e ffo rts have focused on the fo llow ing:
• Various experimental methods are being evaluated to measure the d is tr ib u tio n coe ffic ie n t (Kd) of rad io nuclides onto geologic media. This work is currently approximately h a lf completed, with the goal of id e n t ify ing a standard method by the end of 1981.
• .Kd data were generated for a wide range of rocks and m inerals contacting a wide range of groundwaters. Thus fa r , th is includes groundwater and s a lt brine solutions with Pu, Am, Np, I , Cs, Sr, Tc, Eu, Ru, and U. The emphasis is s h if t in g from a generic data bank to more geologic-specific and s ite-spec ific work on potentia l areas for repos ito ries . Such s h if t in emphasis is dependent upon PNL receiving geologic samples from the spec ific s ites under consideration.
• Kd values were evaluated s ta t is t ic a l ly as functions of rock, groundwater, and nuclide charac te r is tic s . This work w ill be a continuing e ffo r t as more data become ava ilab le fo r ana lysis . Prelim inary predictor equations for Kd's as functions of geologic and hydrologie conditions have been developed under a subcontract with Adaptronics, Inc.
• Basic thermodynamic data were tabulated and incorporated in to computer codes. The thermodynamic codes are used to evaluate the concentrations and species d is t r i bution that are expected at equ ilib r ium . These codes ' w ill be used, in conjunction with l ite ra tu re on natural reactors and ex is ting radionuclide disposal f a c i l i t ie s , for v a lid a tin g short-time span experimental studies with respect to long-time span m igration of rad io nuclides through the geosphere.
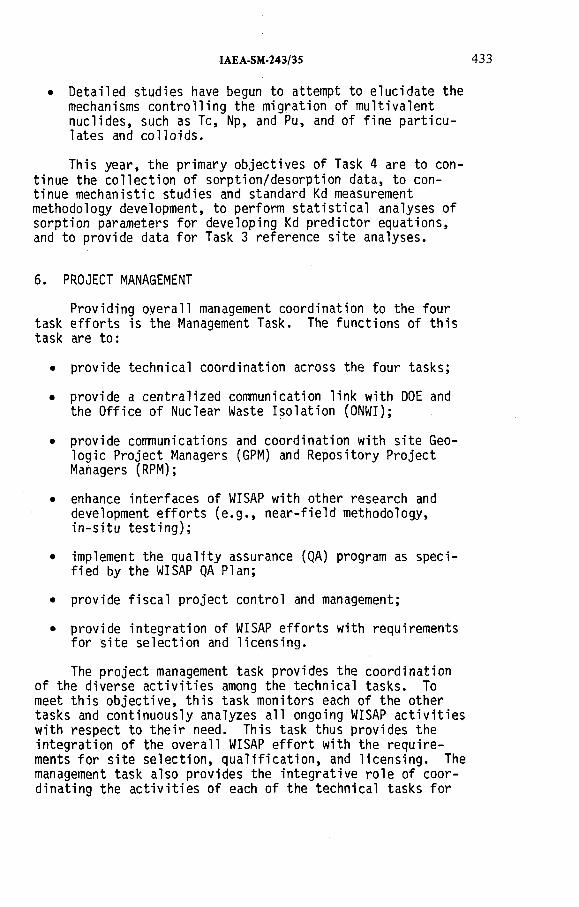
IAEA-SM-243/35
• Detailed studies have begun to attempt to e luc idate the mechanisms con tro lling the m igration of m u ltiva len t nuclides, such as Tc, Np, and Pu, and of f ine p a r t ic u lates and c o llo id s .
This year, the primary objectives of Task 4 are to con
tinue the co llec tion of sorption/desorption data, to continue mechanistic studies and standard Kd measurement methodology development, to perform s ta t is t ic a l analyses of sorption parameters for developing Kd predictor equations, and to provide data fo r Task 3 reference s ite analyses.
6 . PROJECT MANAGEMENT
Providing overall management coordination to the four task e ffo rts is the Management Task. The functions of th is task are to:
• provide technical coordination across the four tasks;
• provide a centra lized communication link with DOE and the O ffice of Nuclear Waste Iso la tio n (ONWI);
• provide cormiunications and coordination with s ite Geolog ic Project Managers (GPM) and Repository Project Managers (RPM);
• enhance interfaces of WISAP with other research and development e ffo rts (e .g . , near-fie ld methodology, in-si tu te s t in g );
• implement the q u a lity assurance (QA) program as specif ied by the WISAP QA Plan;
• provide f is c a l pro ject control and management;
• provide in tegra tion of WISAP e ffo rts with requirements for s ite selection and licens ing .
The pro ject management task provides the coordination of the diverse a c t iv it ie s among the technical tasks. To meet th is ob jective , th is task monitors each of the other tasks and continuously analyzes a ll ongoing WISAP a c t iv it ie s with respect to th e ir need. This task thus provides the in tegration of the overall WISAP e ffo r t with the requirements fo r s ite se lec tion , q u a lif ic a t io n , and licens ing . The management task also provides the in tegra tive ro le of coord ina ting the a c t iv it ie s of each of the technical tasks for

434 BRANDSTETTER and HARWELL
the reference s ite i n i t i a l assessment, including analyzing the task outputs and issuing the analyses reports.
This task is also performing systems analyses of WISAP methodology to guide fu ture WISAP work and interfaces with other aspects of the National Waste Terminal Storage Program. These systems analyses are being performed to ident i f y the important parameters and functions of the safety assessment system. Since the assessments which WISAP w ill provide for s ite q u a lif ic a t io n w ill vary in the degree of soph is tica tion required, the management task w ill coordinate
the WISAP e ffo rts and plans vis-a-vis the licensing process, as that process becomes c la r if ie d .
ACKNOWLEDGEMENT
WISAP is sponsored by the O ffice of Nuclear Waste Iso la t io n , which is managed by B a tte lle Memorial In s t itu te under contract EY-76-C-06-1830 with the U.S. Department of Energy. More deta iled information on WISAP, including a l i s t of pub lica tions , can be obtained by contacting the authors at B a tte lle , P ac ific Northwest Laboratory, P.O.Box 999, Richland, Washington, 99352, USA.
DISCUSSION
H.O. BÔHM: Have you already obtained any results on the leach rate of
spent fuel in salt brine and if so, how do they compare with those relating to glass?
A comparison between the release rates for glass blocks and spent fuel must take
into account the totally different specific surfaces of glass blocks and of spent fuel
within the thin fuel pins. Could you indicate the estimated or measured specific
surfaces of spent fuel used in your calculations?
A. BRANDSTETTER: Three years’ data on leaching for HLW glass and spent
fuel, including leaching in salt brine, are being evaluated. For some radionuclides
unit release rates (g/cm2 - day) as between spent fuel and glass are comparable.
However, under comparable conditions, actual release will be greater for spent
fuel owing to its greater surface area. Particle size distributions have been measured
to determine the surface area for spent fuel.
E.R. MERZ: Do the leach rates for irradiated fuel you mentioned during the
presentation apply to intact fuel pins or to unclad highly irradiated U02 pellets?
The leach rates seem to be very low.
A. BRANDSTETTER: The experiments were performed on unclad spent fuel
fragments.

IAEA-SM-243/3S 435
K. KÜHN: In your summary presentation of Task 1, Release Scenario Analysis,
you showed an impressive number of potential failures and release mechanisms.
I am quite sure that this list will be expanded if you go into more detail. Are you
using the ‘defence-in-depth’ philosophy here, too, or have you set some parameters
or thresholds which enable you to disregard certain failures or releases?
A. BRANDSTETTER: The list of potentially disruptive events shown here is
only a checklist. Many of the listed phenomena are not relevant or are insignificant
for specific sites or geologies. Only the significant phenomena need to be analysed
in detail for specific site assessments.

IAEA-SM-243/17
THE “PROJECT-SAFETY-STUDIES ENTSORGUNG”
IN THE FEDERAL REPUBLIC OF GERMANY
H.W. LEVI
Hahn-Meitner-Institut für Kernforschung Berlin GmbH,
Berlin
Abstract
THE “ PROJECT SAFETY-STUDIES ENTSORGUNG” IN THE FEDERAL REPUBLIC OF GERMANY.
The “ Project Safety-Studies Entsorgung” (PSE) was initiated by the Federal Ministry of Research and Technology. Work on its first phase started in October 1977, and is projected to be completed in 1981. ( “ Entsorgung” means back-end of the fuel cycle.) The purpose o f PSE is to analyse important safety aspects of the FRG’s Nuclear Entsorgung Centre (NEC) in considerable depth. It is a research project rather than part of the licensing procedure. PSE is not a form of risk analysis though it employs much of the methodology of risk analyses. Other than reactor safety studies, it deals with installations still in the design phase. The present purpose of PSE is to collect reliability and performance data, to adapt or to develop models and computer programs concerning radionuclide release mechanisms and release consequences and eventually to test them out with suitable subsystems of the NEC. Much of the PSE effort is devoted to the geologic subsystem, the waste repository.Being essentially a natural rather than an engineered system, its safety analysis presents problems considerably different to those associated with safety analyses of technical systems, such as High-Level Liquid Waste tank storage. Two points are considered important peculiarities of waste repository safety analyses: (1) employment o f a deterministic rather than o f a probabilistic approach; (2) definition o f a significant period o f the waste repository hazard to serve as a guideline for a time limitation of the analysis. These are discussed in the paper and the PSE policy is explained.
1. INTRODUCTION
In the FRG the word “entsorgung” has been created to characterize a
back-end-of-the-fuel-cycle concept which emphasizes one aspect above all
others: the need to take care of the radioactive material generated in nuclear
power plants and to guarantee its long-term isolation from man. Although there
has been much public debate as to how this need can be best met, there is a
broad consensus among experts that closure of the fuel cycle will be the
appropriate principle. It will not only properly satisfy ;the requirements of ent-
entsorgung, it will also permit optimum utilization of nuclear fuel resources
in light-water reactors and it will help keep open the option of using high-
converting and breeding systems which both require closed fuel cycles. The
principle of an integrated Nuclear Entsorgung Centre, which is an essential part
437
438 LEVI
of the FRG concept, will add significantly to the safety and to the security
of entsorgung via fuel cycle closure. Integration means co-location of fuel
element storage, reprocessing, refabrication of mixed oxide fuel, waste treat
ment, and final disposal of the waste in a rock salt dome.
The Federal German Government has decided in favour of this concept
and has, together with the State Government of Lower Saxony, tentatively
selected Gorleben as the site of the Nuclear Entsorgung Centre. The licensing
process for this enterprise will be a very complex and time-consuming one, and
it will probably be highly political.
Apart from this licensing process the “Project Safety-Studies Entsorgung”
(PSE) has been initiated by the Federal Minister of Research and Technology.
This is a research project which is designed to be independent of individuals
and institutions involved in the licensing process. Its goal is an investigation of
major safety aspects of entsorgung according to the standards of scientific
research. The results are aimed to help those who design the NEC as well as
those who license it and to help the Minister of Research and Technology to
make decisions, e.g. in planning further R&D activities.
PSE is not intended to be a safety analysis of the same type as the US
reactor safety study published as WASH-1400 [ 1 ]. PSE will not calculate risks
in terms of frequencies of events multiplied by consequences to man or property
associated with entsorgung. The reasons are that PSE, unlike the reactor safety
study, deals with facilities in the design phase rather than in operation and that
its subject is not exclusively technical, but includes a geologic system. PSE
will however take advantage to the greatest possible extent of techniques
developed in the course of reactor safety studies. These include probabilistic
techniques wherever they are considered appropriate.
In general PSE is not committed to providing a single type of results. As
a research-type project, it is relatively free to set and modify its goals in agree
ment with the Minister of Research and Technology to meet various interests
and requirements in connection with the NEC. It is obvious that such a research
project can potentially be of great benefit in the clarification of safety problems
which may become issues in the licensing process as well as in the public debate.
2. SCOPE AND STRUCTURE OF PSE
The subject of PSE is the Nuclear Entsorgung Centre (NEC). At present PSE
covers transport and storage of spent fuel, treatment and final disposal of
reprocessing waste and, to a limited extent, the safety of reprocessing.
Work on PSE started at the end of 1977. The initial phase of definition
was completed after half a year of work, though a complex project like this
requires some kind of redefinition almost continuously. PSE is scheduled to
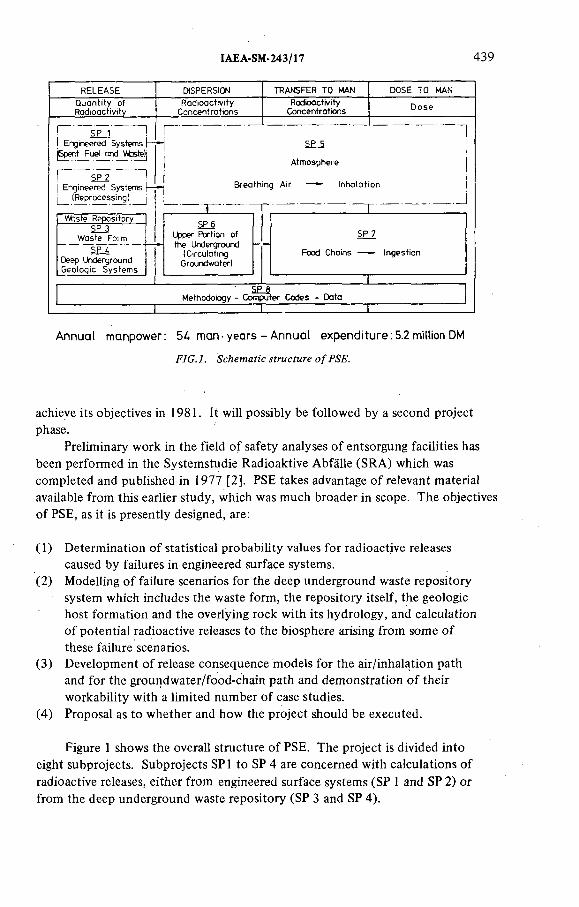
IAEA-SM-243/17 439
RELEASE DISPERSION TRANSFER TO MAN DOSE TO MANQ u a n tity of R ad ioac tiv ity
R a d io a c tiv ityC oncentra tions
R adioactivityConcentra tions D o s e
Vtaste Repository£P3
W aste Form
SEáDeep Underground G eologic S ys tem s
I Engineered Systems |— H [(Spent Fuel and W ste lj
I SP_2 !j Engineered Systems |— - ] j (Reprocessing)
SEJt j
Atm osphere j
B re a th in g A ir — I nhal at i on |
Upper Fbrtion of the Underground
{C ircu lating Groundwater)
SP 7
Food Chains Ingestion
SP 8Methodology - Computer Codes - Data
Annual manpower: 54 man-years - Annual expenditure: 5.2 million DM
FIG.l. Schematic structure of PSE.
achieve its objectives in 1981. It will possibly be followed by a second project
phase.
Preliminary work in the field of safety analyses of entsorgung facilities has
been performed in the Systemstudie Radioaktive Abfálle (SRA) which was
completed and published in 1977 [2]. PSE takes advantage of relevant material
available from this earlier study, which was much broader in scope. The objectives
of PSE, as it is presently designed, are:
( 1 ) Determination of statistical probability values for radioactive releases
caused by failures in engineered surface systems.
(2) Modelling of failure scenarios for the deep underground waste repository
system which includes the waste form, the repository itself, the geologic
host formation and the overlying rock with its hydrology, and calculation
of potential radioactive releases to the biosphere arising from some of
these failure scenarios.
(3) Development of release consequence models for the air/inhalation path
and for the groundwater/food-chain path and demonstration of their
workability with a limited number of case studies.
(4) Proposal as to whether and how the project should be executed.
Figure 1 shows the overall structure of PSE. The project is divided into
eight subprojects. Subprojects SP1 to SP 4 are concerned with calculations of
radioactive releases, either from engineered surface systems (SP 1 and SP 2) or
from the deep underground waste repository (SP 3 and SP 4).

440 LEVI
Engineered surface systems currently covered by PSR activities are: spent
fuel element transport; spent fuel element storage; liquid HLW storage; HLW
solidification (PAMELA II); aqueous MLW storage; MLW solidification
(MAVA, Karlsruhe); and krypton storage in SP 1. Other waste treatment
facilities such as engineered storage of vitrified waste and conditioning of
а-waste are not sufficiently advanced in design to be analysed. In SP 2 the
safety of reprocessing is approached by analysing typical and significant failure
events, such as criticality, solvent fires and chemical explosions, which may
happen similarly in various facilities of a reprocessing plant. They are analysed
in terms of the course of events and in terms of their occurrence. Radioactive
releases from these surface facilities may be gaseous, entering the atmosphere,
and, via fallout, the circulating groundwater in the area immediately below
ground level. Less likely, it may be liquid leakage to the underground directly
entering circulating groundwater. As underground disposal of radioactive waste
is the general topic of this symposium, SP 1 and SP 2 will not be dealt with
further in this paper.
SP 3 and SP 4 cover the deep underground waste repositories, with SP 3
devoted to waste form analysis and SP 4 to failure scenario analysis for the
system repository /host formation/overlying rock. Values of potential radio
activity releases caused by these failure scenarios provide a first set of PSE
results, relevant as a preliminary safety evidence and as a tool to trace weaknesses
of the design.
SP 5 and SP 6 are the subprojects to analyse dispersion of radioactivity
after it has been accidentally released from NEC facilities. SP 5 deals with
dispersion and inhalation or precipitation of radioactivity released to the
atmosphere. This is of significance for safety analyses of surface facilities
rather than for those of underground waste repositories and will not be treated
further in this paper. SP 6 covers the whole area of radionuclide transport with
moving groundwater. Thereby radioactive material may enter drinking water
wells or surface bodies of water and from there it will find access to human
beings. Radionuclide concentrations which may occur in water will provide a
second set of PSE results which by comparison with maximum permissible
concentrations can assist in the making of a preliminary safety assessment.
The last section of the study considers transfer of radioactivity from
sources within the biosphere (drinking water well, surface water etc.) to human
beings. As far as radioactive releases from a waste repository are concerned,
there are two relevant paths:
Drinking water -*■ Man
Groundwater
or
Surface water
Irrigation water -► Soil -*■ Food chains -*■ Man
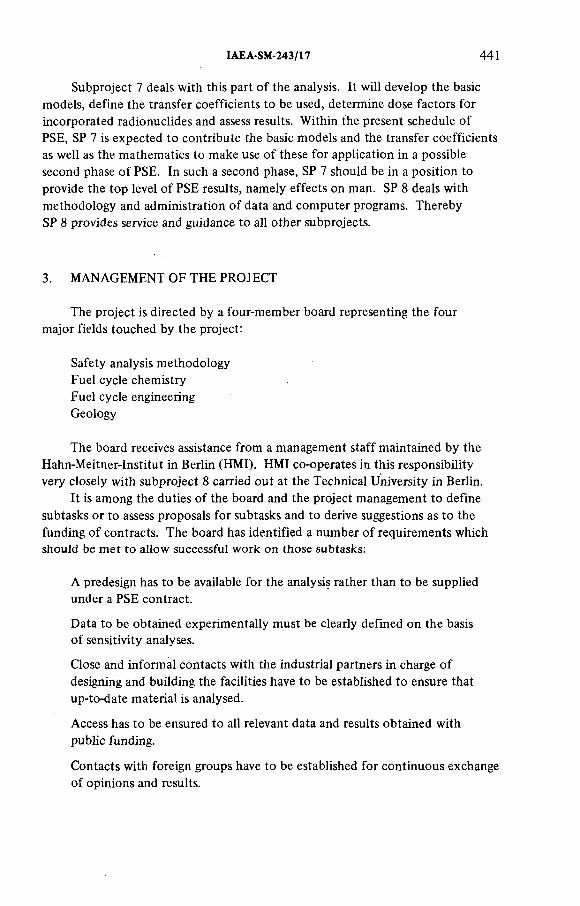
IAEA-SM-243/17 441
Subproject 7 deals with this part of the analysis. It will develop the basic
models, define the transfer coefficients to be used, determine dose factors for
incorporated radionuclides and assess results. Within the present schedule of
PSE, SP 7 is expected to contribute the basic models and the transfer coefficients
as well as the mathematics to make use of these for application in a possible
second phase of PSE. In such a second phase, SP 7 should be in a position to
provide the top level of PSE results, namely effects on man. SP 8 deals with
methodology and administration of data and computer programs. Thereby
SP 8 provides service and guidance to all other subprojects.
3. MANAGEMENT OF THE PROJECT
The project is directed by a four-member board representing the four
major fields touched by the project:
Safety analysis methodology
Fuel cycle chemistry
Fuel cycle engineering
Geology
The board receives assistance from a management staff maintained by the
Hahn-Meitner-Institut in Berlin (HMI). HMI co-operates in this responsibility
very closely with subproject 8 carried out at the Technical University in Berlin.
It is among the duties of the board and the project management to define
subtasks or to assess proposals for subtasks and to derive suggestions as to the
funding of contracts. The board has identified a number of requirements which
should be met to allow successful work on those subtasks:
A predesign has to be available for the analysis rather than to be supplied
under a PSE contract.
Data to be obtained experimentally must be clearly defined on the basis
of sensitivity analyses.
Close and informal contacts with the industrial partners in charge of
designing and building the facilities have to be established to ensure that
up-to-date material is analysed.
Access has to be ensured to all relevant data and results obtained with
public funding.
Contacts with foreign groups have to be established for continuous exchange
of opinions and results.
442 LEVI
The Board takes advice from a project committee where all subproject
heads as well as their deputies and a number of consultants have a seat and
which meets twice a year.
At the time of writing 22 contracts to carry out subtasks of PSE have
been funded and five have been recommended for funding by the project
board. The working groups belong to the following institutions:
Bundesanstalt für Geowissenschaften und Rohstoffe, Hannover
Bundesanstalt für Materialprüfung, Berlin
Bundesgesundheitsamt, Berlin
Domier System GmbH, Friedrichshafen
Freie Universitât Berlin
Gesellschaft für Strahlen- und Umweltforschung mbH,
Neuherberg und Braunschweig
Hahn-Meitner-Institut für Kemforschung Berlin GmbH
Kemforschungsanlage Jülich GmbH
Kemforschungszentrum Karlsruhe GmbH
NUKEM GmbH, Wolfgang bei Hanau
Technische Universitât Berlin
Technische Universitât Clausthal-Zellerfeld
Transnuklear, Wolfgang bei Hanau
Universitât Kiel.
The average annual manpower used in the project is 54 man • years and the
average annual cost is 5.2 million DM.
4. FAILURE SCENARIO ANALYSIS OF THE WASTE REPOSITORY
The probabilistic technique for safety analyses was developed for engineered
systems and has been applied to the safety of nuclear power plants. The first
example was the US study under the supervision of N. Rasmussen [1 ]. Despite
much criticism, this study is a remarkable innovation, even though further refine
ments of the methodology as well as of the analysis itself are certainly desirable.
The basic methodology developed in this study is well suited to contribute
significantly to a more rational assessment of risks. Therefore it has been
IAEA-SM-243/17 443
seriously considered in PSE whether the probabilistic approach would be
appropriate for the safety analysis of a geologic waste repository also.
The degree of confidence which a probabilistic safety analysis commands
depends primarily on the quality of the statistical data fed into the analysis.
Failure events having significant consequences are rare. Their frequencies cannot
therefore be predicted as such by statistical techniques. To cause those events,
a complex technical system has to fail. Failures of a complex technical system,
however, are caused by failures of less complex subsystems and again by even
simpler subsystems. Climbing down this ladder, finally one arrives at very simple
basic components widely used in a great variety of technical facilities. If
empirical data on the performance of a sufficiently great number of these
components are available, an expectation value for the frequency of their
failure can be derived with a fairly high degree of confidence. Combination of
those predicted failure frequencies by means of a suitable logic, such as a fault
tree, leads to expectation values for the failure frequency of the complex
system, also with a fair degree of confidence.
This technique of descending from a complex system to very simple and
conventional system components whose performance is well-known is usually
not applicable for geologic systems. It is, of course, possible to estimate failure
frequencies of those complex systems either based on relatively few events or
on plausibility considerations. Those estimates will, however, have a poor
degree of confidence and it is questionable if they are of much benefit for a
safety analysis in the nuclear field.
It has therefore been decided to use in the present phase of PSE a deter
ministic rather than a probabilistic approach. This means that failure scenarios
are to be identified by means of the release tree technique and that their
consequences in terms of radioactivity release into circulating groundwater
have to be calculated.This approach to modelling failure scenarios and assuming that they will
occur leads to the question whether the consequences of these failure scenarios
are tolerable or not. This is a very conservative approach, chosen as a first
stage of iteration. In a second stage of iteration, an attempt will probably have
to be made to find a more realistic probability than just one for the probability
of failure scenarios with consequences beyond the level of tolerance.
However, even the simple scenario treatment must not be confused with
a worst case approach. In none of the scenarios to be analysed is failure of all
barriers assumed, as it would be in a worst case analysis. It is rather intended
to analyse what effect, given a certain failure scenario, the remaining barriers
will have. In this context it is important to note that barriers may be partly
permeable, but still cause considerable delay of certain processes.
The release tree is a logic sequence of barrier penetrations or passings of
open barriers according to the well-known cause-consequence analysis. It starts
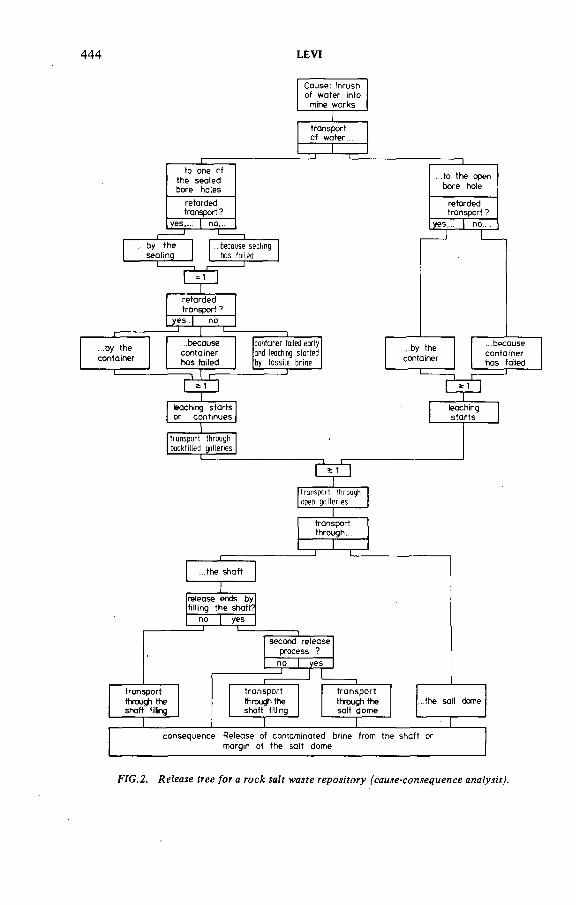
444 LEVI
FIG.2. Release tree for a rock salt waste repository (cause-consequence analysis).
IAEA-SM-243/17 445
with a cause, e.g. water entering into a waste repository, and ends with a
consequence, e.g. contaminated brine leaving the salt formation.
A release tree for the repository in the operational phase is shown in Fig.2.
Each scenario between the top and the bottom is a sequence of individual
release processes which have to be evaluated by means of appropriate physical
and chemical models to obtain the dynamics of these processes. This procedure
can be connected to the fault tree technique by making each release event or
process the top event of a fault tree.
If we follow the release tree in Fig.2 we find that water that has entered
into the repository may either find its way to the waste container immediately,
because the boreholes are still open or the sealings are no longer intact, or it
may have to work its way as a brine through the intact sealing. In the latter
case the process of dissolving the sealing material by resaturation of the brine
has to be modelled. Similarly, container corrosion, leaching of the glass by the
brine and the route of the brine through a backfilled gallery may have to be
described. As this release tree is concerned with the operational phase of the
repository, the shaft is assumed to be still open. An important task in evaluating
this tree is therefore the description of an emergency backfill of the shaft and
of the effects this may have on the movement of contaminated brine through
the shaft.
The model of glass leaching may serve as an example how to treat the
individual processes of the release tree [3]. The leaching model is based on an
empirical approach where much of the physics of the process is packed into
coefficients and exponents obtained by fitting experimental leach curves.
There are two limiting cases of leaching kinetics, corrosion of the waste
form and diffusion of radioactive species from the waste form, representing
upper and lower limits of the fraction leached within a given time period. The
corresponding types of equation are (F = fractional release)
F , = Clt (1)
and
F2 = c2 y/T (2)
(Geometrical changes of the samples upon leaching have not been taken into
account.)
These are oversimplifications very likely indicating upper and lower limits
of radioactivity release. Essentially the complex process will be composed of
both corrosion and diffusion. This may be described by an empirical equation,
such as
F4 = c4tx (1 > x > 0 . 5 ) (3)
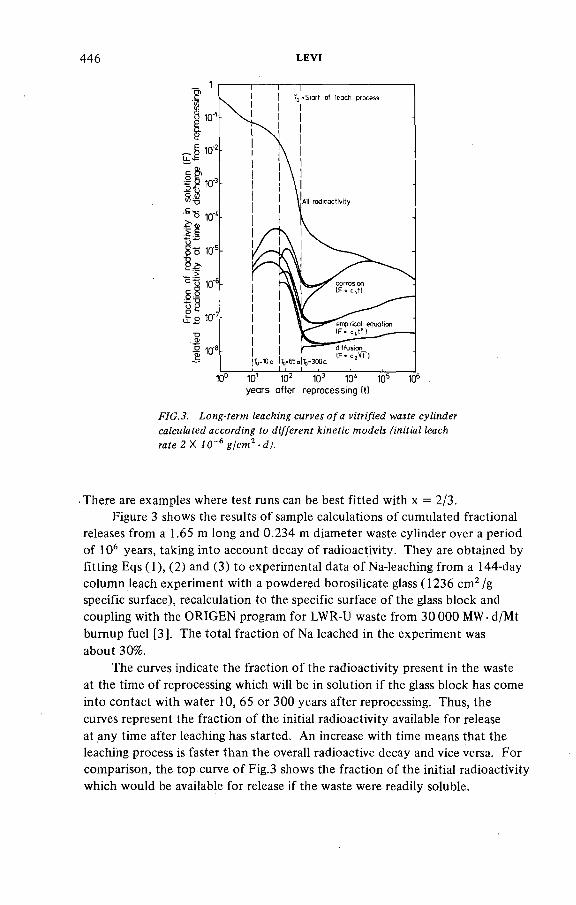
446 LEVI
FIG.3. Long-term leaching curves of a vitrified waste cylinder calculated according to different kinetic models (initial leach rate 2 X 10~6 g/cm2 • d).
■ There are examples where test runs can be best fitted with x = 2/3.
Figure 3 shows the results of sample calculations of cumulated fractional
releases from a 1.65 m long and 0.234 m diameter waste cylinder over a period
of 106 years, taking into account decay of radioactivity. They are obtained by
fitting Eqs (1), (2) and (3) to experimental data of Na-leaching from a 144-day
column leach experiment with a powdered borosilicate glass (1236 cm2/g
specific surface), recalculation to the specific surface of the glass block and
coupling with the ORIGEN program for LWR-U waste from 30 000 MW • d/Mt
bumup fuel [3]. The total fraction of Na leached in the experiment was
about 30%.
The curves indicate the fraction of the radioactivity present in the waste
at the time of reprocessing which will be in solution if the glass block has come
into contact with water 10, 65 or 300 years after reprocessing. Thus, the
curves represent the fraction of the initial radioactivity available for release
at any time after leaching has started. An increase with time means that the
leaching process is faster than the overall radioactive decay and vice versa. For
comparison, the top curve of Fig.3 shows the fraction of the initial radioactivity
which would be available for release if the waste were readily soluble.
IAEA-SM-243/17 447
Modelling of other processes involved in failure scenarios is in a less
advanced state. A few phenomena should be mentioned which will be regarded
as prominent elements in these models. Movement of dissolved radionuclides
in an open gallery or in an open shaft will be controlled mainly by convection
in the brine because of the existence of heat sources or even because of the geothermal gradient. In backfilled galleries or shafts radionuclide migration
will be controlled by dispersion or diffusion.
Besides the movement of a liquid within and out of the repository, two
other major fields will have to be modelled: stability of rock salt formation in
its geologic position and stability of mine workings. Phenomena to be considered
in context with the stability of the salt formation are largely of geologic nature,
e.g. long-lasting rock movements, long-lasting salt leaching, seismic and tectonic
as well as erosion processes. The mine stability model is primarily a mechanical
one. The most important aspect is the heat generated by the waste. This heat
causes thermal stresses which may lead to cracks providing a path for moving
brine. This is most likely where the salt has inhomogeneities which are parti
cularly susceptible to mechanical damage. On the other hand, heat will create
creep processes possibly having desirable effects, such as early closing of open
space in the mine and relaxation of thermal stresses.
5. MIGRATION OF RADIONUCLIDES AFTER LEAVING THE
SALT FORMATION
Basically, there are three paths radioactivity may take after leaving the
salt formation to reach the surface:
(1) via a shaft directly into circulating groundwater in the upper portion of
the underground
(2) via caprock through overlying rock into circulating groundwater
(3) via salt dome flanks through deep underground rock surrounding the
salt dome way up into circulating groundwater.
Accordingly, three regions are to be analysed by PSE in terms of
hydrology, rock hydraulics and sorption chemistry: Deep underground rock
(SP 4), rock overlying the caprock (SP 4) and the upper portion of the under
ground up to the unsaturated zone of soil (SP 6). The types of data required
for these three regions are similar.
A program system offered by INTERA (formerly SWIFT program) has
been purchased. This program is believed to describe very well the entire
process of radionuclide migration with moving groundwater. It is run by SP 8
and it is presently being used for sensitivity studies and for first approximative
calculations based on still quite imperfect hydrogeologic data.
448 LEVI
The inputs required by the INTERA program are the topology of the
region, precipitation pattern and temperature gradients, to yield the driving
forces of groundwater movement. With the porosity and permeability of the
rock the program arrives at the actual water movement, and with dispersion
coefficients at the local concentrations of radionuclides if no radioactive decay
and chemical interaction should take place. Further input data needed are
sorption coefficients of relevant radioactive species for geologic material from
the prospective site of the NEC and the decay constants of the radionuclides
involved. The final output of the INTERA program will be concentrations of
radionuclides, including members of certain radionuclide chains in relevant
bodies of water as a function of locus and time.
Work is in progress on deep underground rock and on the upper portion
of the underground. All laboratory equipment is now operating. Soil samples
have been collected at the site, deep underground rock samples stem from
earlier drillings in the surroundings of the site. Data being obtained are related
to porosity, dispersion and sorption. It is not considered easy to make sure
that these data are fully relevant for the radionuclide migration to be evaluated.
Among activities to be initiated soon is a field investigation of dispersion
of radionuclide migrating with groundwater in the soil. Also, a programme
covering the water movement above the salt dome will be started, taking advan
tage of the hydrogeologic drilling programme which has commenced at the
Gorleben site.
6. TIME SPAN OF THE WASTE REPOSITORY SAFETY
ANALYSIS
The radioactivity in the waste repository will practically never become
zero. This is a point highly stressed in the nuclear controversy and therefore
tendencies may be noted to carry on waste repository safety analyses over
extremely long time periods up to millions of years. This is unreasonable
because the radioactive inventory of the repository will cease to be a significant
hazard long before the radioactivity has completely decayed. It is also unreason
able because a safety analysis including assumptions on human behaviour,
climate, etc., covering periods in the order 10s or even 106 years, has to deal
with so many uncertainties that it can hardly be considered rational scientific
work. It is therefore important to determine for what time span the analysis
is to be conducted. This time span will be called the significant period of the
waste repository hazard.
To define a level of significance for the geologic waste repository hazard
a reference is required. Usually the hazard of naturally occurring uranium in
equilibrium with its daughters is used as such a reference. This choice implies

IAEA-SM-243/17 449
FIG.4. Range of ingestion hazard index of high-level wastes and range of reference ingestion hazard index of natural occurring uranium.
the reasonable assumption that an artificial hazard equal to that of naturally
occurring uranium is not considered significant because the natural uranium
hazard is inevitable and mankind has been living with it all the time.
• Such a comparison of hazards, however, is meaningful only if the chemistry
of the radionuclides causing thé hazards and the barriers protecting man from the
hazards are similar. ■ This is true for a geologic waste repository as compared to
a uranium deposit. The locations are similar, that of waste is even likely to be
more favourable, and the radionuclides involved behave' similarly.
Figure 4 shows long-term ingestion hazard indices of HLW from various
fuel cycles and of unreprocessed LWR fuel versus time. It also shows a hori
zontal band indicating the ingestion hazard index of naturally occurring uranium
according to various levels of reference. Reference level means the quantity of
natural uranium whose ingestion hazard index is compared to that of the waste
from 1 Mt of heavy metal reprocessed. The region of intersection between the
ingestion hazard index band for HLW from reprocessing and the horizontal
uranium band indicates the range of the significant period of the HLW hazard
for all relevant fuel cycles, being of the order of 103 to 104 years. The most
relevant period where PSE will concentrate its efforts is that up to 1000 years [5].
450 LEVI
The author has taken advantage of the input of many participants in PSE.
He is particularly grateful to his colleagues in the project board and on the
management staff, Prof. G. Memmert (Technische Universitât Berlin),
Dr. H.-J. Wingender (Nukem GmbH), Prof. H. Venzlaff (Bundesanstalt für
Geowissenschaften und Rohstoffe), Dr. K.-E. Maass und E. Ewest (Hahn-Meitner-
Institut für Kemforschung Berlin GmbH). The author thanks the Bundes-
minister of Research and Technology and his staff for their interest in the
project. Furthermore, the co-operation of the prospective operators of the
NEC, DWK and PTB is highly appreciated.
ACKNOWLEDGEMENTS
REFERENCES
[1 ] R A S M U S S E N , N ., R e a c to r S a fe ty S tu d y , W A S H -1 4 0 0 (1 9 7 5 ) .[2 ] S y s te m s tu d ie R a d io a k tiv e A b fa lle in d e r B u n d e s re p u b lik D e u ts c h la n d , K W A 1 2 1 4
(B u n d e s m in is te r iu m f ü r F o r s c h u n g u n d T e c h n o lo g ie ) ( 1 9 7 6 /1 9 7 7 ) .
[3 ] E W E S T , E ., f o r th c o m in g .
[4 ] S T O R C K , R ., p e rs o n a l c o m m u n ic a t io n .
[5 ] L E V I, H .W ., E W E S T , E ., Z u r F ra g e e in e r z e i t l ic h e n B e g re n z u n g d e r S tô r fa l la n a ly s e d e s
g e o lo g is c h e n E n d la g e rs , P S E 7 9 /1 (1 9 7 9 ) .
DISCUSSION
G.E. COURTOIS: In Fig.3 you show a leaching rate of 2 ■ 1СГ6 g/cm2 • day.
Was this value obtained with distilled water or brine?
H.W. LEVI: It was obtained with distilled water. Brine leaching rates are
different but not necessarily higher.
P.A. WITHERSPOON: An important factor in safety analysis is the rate
at which aqueous solutions can move through the geologic formations. As a
hydrogeologist I do not yet know how to determine this rate with regard to
fractured crystalline rock. This is a serious uncertainty in your overall analysis.
I have been told by the salt experts that the permeability of salt formations is
so low that they may be considered impermeable. This may or may not be true;
it has not been proven in the field and therefore provides another level of
uncertainty.
If we assume for the moment that all man-made openings can be effectively
sealed so that the transport pathway is only through the geologic formations,
how can you carry out a safety analysis with this kind of uncertainty?

IAEA-SM-243/17 451
H.W. LEVI: There is no doubt that the risk from waste repositories is
greatest as long as man-made openings exist in the salt formation. After the
repository has been properly sealed, it is considered extremely improbable that
liquids will leave or enter the repository. This is one reason why salt has been
chosen for waste repositories in the Federal Republic of Germany. Nevertheless,
for the safety analysis it is assumed that contaminated brine does leave the sealed
repository and therefore its passage through surrounding and/or overlying rock
is modelled. In the course of this modelling work we also encounter the
difficulty of providing a quantitative description of groundwater flow through
fractured crystalline rock.
M.D. HILL: Have you considered any other methods of defining the time
period to be considered in safety analyses? Hazard indices are subject to the
criticism that they are concerned only with radiotoxicity. Actual radiation
doses depend principally on the rate of transport of radionuclides through the
environment. Hence hazard indices do not provide an adequate basis for
defining a time period.
H.W. LEVI: Comparison of hazard indices is certainly no substitute for
a safety assessment. However, as a first approximation such comparisons are
reasonable if the hazard indices are used with care. Using with care means
comparing only hazard indices associated with radionuclides whose transport
and metabolism behaviour is similar. This is the case with natural uranium
daughters, mainly radium, and long-term waste actinides, especially americium
and plutonium. Thus, hazard indices provide an adequate basis for estimating
a time period which may then be subject to revision in the light of the
completed safety assessment.


IAEA-SM-243/169
SAFETY ASSESSMENT FOR DEEP UNDERGROUND DISPOSAL VAULT - PATHWAYS ANALYSIS
R.B. LYON, E.L.J. ROSINGER
Whiteshell Nuclear Research Establishment,
Atomic Energy of Canada Limited,
Pinawa, Manitoba, Canada .
Abstract
S A F E T Y A S S E S S M E N T F O R D E E P .U N D E R G R O U N D D IS P O S A L V A U L T - P A T H W A Y S A N A L Y S IS . . . - . ,
T h e c o n c e p t v e r if ic a t io n p h a se o f t h e C an a d ia n p ro g ra m m e f o r th e d is p o sa l o f n u c le a r fu e l
w a s te e n c o m p a s se s a p e r io d o f a b o u t th r e e y e a rs b e fo re t h e s t a r t o f s i te s e le c t io n . D u r in g th is
t im e , t h e m e th o d o lo g y f o r E n v i ro n m e n ta l a n d S a fe ty A ss e ss m e n t s tu d ie s is b .eing d e v e lo p e d b y fo c u s in g o n a m o d e l s ite . P a th w a y s a n a ly s is is a n im p o r ta n t c o m p o n e n t o f th e s e s tu d ie s . I t . in v o lv e s th e p re d ic t io n o f t h e r a te a t w h ic h ra d io n u c l id e s m ig h t b e re le a se d f r o m a. d isp o sa l v a u lt a n d tra v e l th ro u g h th e g e o s p h e re a n d b io s p h e re to re a c h m a n . T h e p a th w a y s a n a ly s is s tu d ie s c o v e r th r e e m a jo r to p ic s : g e o s p h e re p a th w a y s a n a ly s is , b io s p h e re p a th w a y s a n a ly s is a n d
p o te n t ia l ly -d is ru p t iv e - p h e n o m e n a an a ly s is . G e o s p h e re p a th w a y s a n a ly s is in c lu d e s a t o t a l s y s te m s
a n a ly s is , u s in g th e c o m p u te r p ro g ra m G A R D 2 , v a u lt a n a ly s is , w h ic h c o n s id e rs c o n ta in e r fa ilu re
a n d w a s te le a c h in g , h y d ro g e o lo g ic a l m o d e ll in g a n d g e o c h e m ic a l m o d e ll in g . B io s p h e re p a th w a y s
a n a ly s is in c o r p o r a te s a c o m p a r tm e n ta l m o d e ll in g a p p ro a c h u s in g th e c o m p u te r p ro g ra m R A M M ,
a n d a f o o d c h a in a n a ly s is u s in g th e com puter p ro g ra m F O O D JI. P o te n t ia l ly - d is r u p t iv e -
p h e n o m e n a a n a ly s is in v o lv e s t h e e s t im a tip n o f t h é p r o b a b i l i ty a n d c o n s e q u e n c e s o f e v e n ts s u c h
as e a r th q u a k e s w h ic h m ig h t r e d u c e th e e f fe c tiv e n e s s o f t h e b a r r ie r s p re v e n tin g th e re le a se o f
ra d io n u c l id e s . T h e c u r r e n t s tag e o f d e v e lo p m e n t o f th e r e q u ir e d ,m e th o d o lo g y a n d d a ta is
d iscu ssed in e a c h o f t h e t h r e e a re a s a n d p re l im in a ry re s u l ts a re p re s e n te d .
1. INTRODUCTION
The "concept verification'' phase of the Canadian program for the disposal of nuclear fuel waste [1,2] encompasses a period of about three years before the start of site selection. During this period, an extensive rèsearch and development program will be directed towards establishing the feasibility-of the concept, and towards development of methodology and data- which will be required for site selection.
Since potential sites will not be selected until after the concept verification phase, we are focusing our studies by assessing the impact of the proposed nuclear waste disposal facility on a "model" site. The modei site has characteristics which are representative of the type of site which might actually
453

454 LYON and ROSINGER
be chosen. Data are derived from.reali locations wherever measurements and information are available.
The facility to be located at the site will consist of a vault, 500 to 1000 m deep in a plutonic igneous formation, and its associated surface facilities [1]. There will be access shafts and a grid of rooms for emplacing the fuel waste containers.
Pathways analysis is only part of the total assessment required within the scope of Environmental and Safety Assessment. Other aspects outside the scope of this paper include, for example, social and economic assessment, occupational safety and safeguards and security. Pathways analysis involves the prediction of the rate at which radionuclides might escape from a disposal vault and travel through the geosphere and biosphere to reach man. Our approach is to define and analyse the most probable scenario, and to estimate the effects of possible variations in its defining parameters. In addition, we consider the probability and consequences of potentially disruptive phenomena or events which might changé the scenario. The areas of study are conveniently divided into the major topics: geosphere pathways analysis, biospherepathways analysis and potentially disruptive events.
2. GEOSPHERE PATHWAYS ANALYSIS '
Geosphere pathways analysis involves the estimation of the rate at which radionuclides might escape the disposal vault and reach the biosphere. Geosphere systems analysis provides an overall estimate of this rate, while vault systems analysis, hydrogeological modelling and geochemical modelling provide detailed estimates of the key parameters.
2.1 Geosphere Systems Analysis
The GARD2 computer program [3] has been developed to provide the total systems analysis of the movement of radionuclides from the disposal vault and through the geosphere. Within the vault, the important aspects are container failure, waste dissolution, the movement of water and the chemical interactions with the vault contents. Through the geological formation, the. major aspects are water movement and chemical interactions with the geologic materials.
The system, analysed by GARD2, is defined by the following model :
a. There is no release of radionuclides into the geological formation until the waste containers are breached. This initial delay is required as input to GARD2 and is called the "container integrity time".
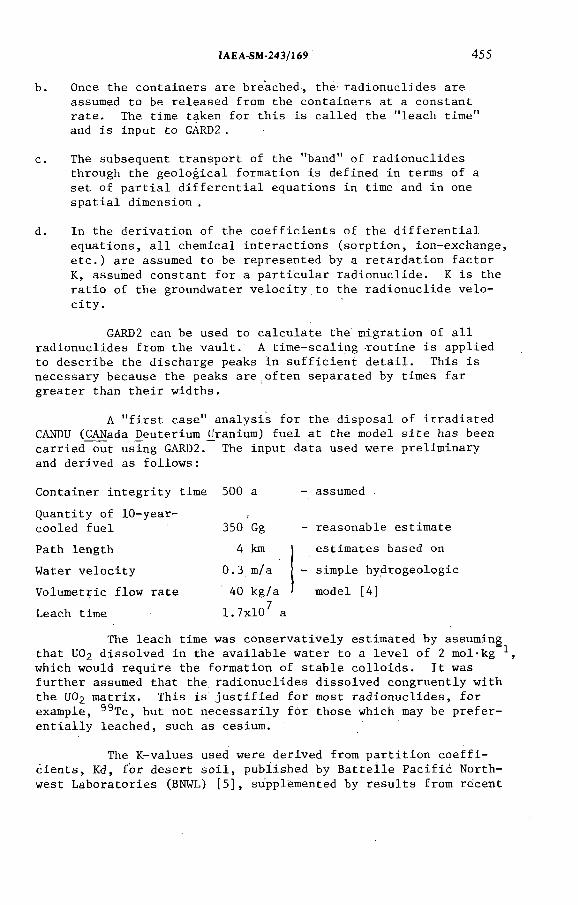
IAEA-SM-243/169 455
b. Once the containers are breached, the4 radionuclides are assumed to be released from the containers at a constant rate. The time taken for this is called the "leach time" and is input to GÀRD2 .
c. The subsequent transport of the "band” of radionuclides through the geological formation is defined in terms of a set of partial differential equations in time and in one spatial dimension .
d. In the derivation of the coefficients of the differential equations, all chemical interactions (sorption, ion-exchange etc.) are assumed to be represented by a retardation factor K, assumed constant for a particular radionuclide. К is the ratio of the groundwater velocity.to the radionuclide velocity.
GARD2 can be used to calculate the' migration of all radionuclides from the vault. A time-scaling routine is applied to describe the discharge peaks in sufficient detail. This is necessary because the peaks are,often separated by times far greater than their widths.
A "first case" analysis for the disposal of irradiated CANDU (CANada Deuterium Uranium) fuel at the model site has been carried out using GARD2. The input data used were preliminary and derived as follows :
Container integrity time 500 a - assumedQuantity of 10-year- ,cooled fuel 350 Gg - reasonable estimatePath length 4 kmWater velocity 0.3 m/aVolumetric flow rate 40 kg/aLeach time 1.7x10^ a
estimates based on - simple hydrogeologic
model [4]
The leach time was conservatively estimated by assuming that U02 dissolved in the available water to a level of 2 mol-kg which would require the formation of stable colloids. It was further assumed that the radionuclides dissolved congruently with the UO2 matrix. This is justified for most radionuclides, for example, ^9Tc, but not necessarily for those which may be preferentially leached, such as cesium.
The К-values used were derived from partition coefficients, Kd, for desert soil, published by Batteile Pacific Northwest Laboratories (BNWL) [5], supplemented by results from recent
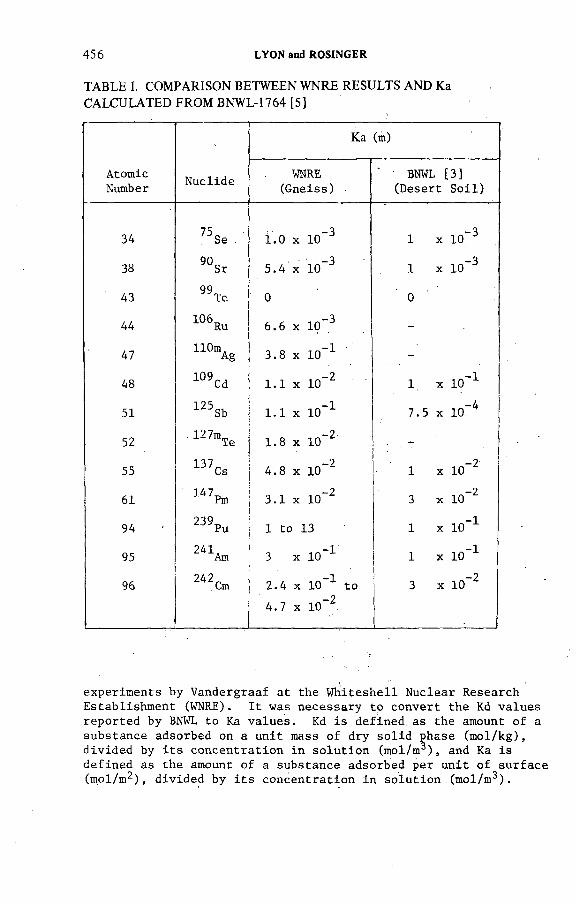
456 LYON and ROSINGER
TABLE I. COMPARISON BETWEEN WNRE RESULTS AND Ка
CALCULATED FROM BNWL-1764 [5]
Ka (m)
AtomicNumber Nuclide WNRE
(Gneiss)' BNWL [3] (Desert Soil)
34 75Se . 1.0 X 10⁻³ 1 x 10~3
38 90Sr 5.4 X 10⁻³ 1 x 10'3
43 99Tc 0 0
44 106BRu 6.6 X 19~3 -
47 110mAg 3.8 X io_1 -
48 l09Cd 1.1 X io-2 1 x 10"1
51 125Sb 1.1 X 10_1 7.5 x 10⁻⁴
52 l27mTe 1.8 X 10~2' -
55 137Cs 4.8 X 10 ~2 1 -2x 10
61 U 7 Pm 3.1 X 10 “2 3 -2x 10
94 239Pu 1 to 13 1 x 10⁻¹
95 241Am 3 X 10_1 1 x 10⁻¹
96 242Cm 2.44.7
XX
10_1
1 0 ~ 2
to 3 x 10~2
■
experiments by Vandergraaf at the Whiteshell Nuclear Research Establishment (WNRE). It was necessary to convert the Kd values reported by BNWL to Ka values. Kd is defined, as the amount of a substance adsorbed on a unit mass of dry solid phase (mol/kg), divided by its concentration in solution (mol/m3), and Ka is defined as the amount of a substance adsorbed per unit of surface (mol/m2), divided by its concentration in solution (mol/m^).

IAEA-SM-243/169 457
FIG.l. Radionuclide discharge rate at the boundary of the geologic formation.
The WNRE experimental values and some Ka values derived from reference 5 are presented in Table I.
The results of the "first case" analysis are shown in Figure 1, where the discharge rate at the boundary of the geologic formation is plotted against time. Only 99Tc and 129i are predicted to arrive■at the boundary of the geologic formation in

458 LYON and ROSINGER
less than a million years because these are the only two radionuclides which are assumed to travel with the velocity of the groundwater.
2.2 Vault Systems Analysis
We have recently begun a systems analysis of the processes occurring within the vault .in order to provide better estimates of container integrity time and the waste leach time.The processes within the vault are interdependent, and this fact must be taken into account when developing models and inter-' preting the results of laboratory experiments. For example, leaching experiments are usually carried out in the presence of excess distilled or tap water, whereas in the vault the water supply will be limited and its composition will be determined by the constituents present. These constituents include the backfill material, container corrosion products and perhaps material remaining from the blasting process. In addition, chemicals may be added to the backfill to condition the incoming water, for example, to ensure a reducing environment. The vault systems analysis will be a time-dependent study, through the reflooding period, the temperature transient and the changing chemical environment, and is being supported by an extensive experimental program.
2.3 Hydrogeological Modelling
The present method [4] used to estimate the key hydro- geological parameters for the "first case" analysis is based on the use of the Darcy equation for a cubic arrangement of water- conducting joints. •
For future hydrogeolgical model development, we are considering three scales - regional, site and local, defined as follows :
Regional: Large enough to include all parts of the flow systemthat are influenced by, or that influence, the disposal operation •
Site: To include the vault, shafts, boreholes and the regionover which the water table is perturbed by the presence of the vault . •
Local: A relatively small volume containing one container or afew containers with-associated rock and backfill.
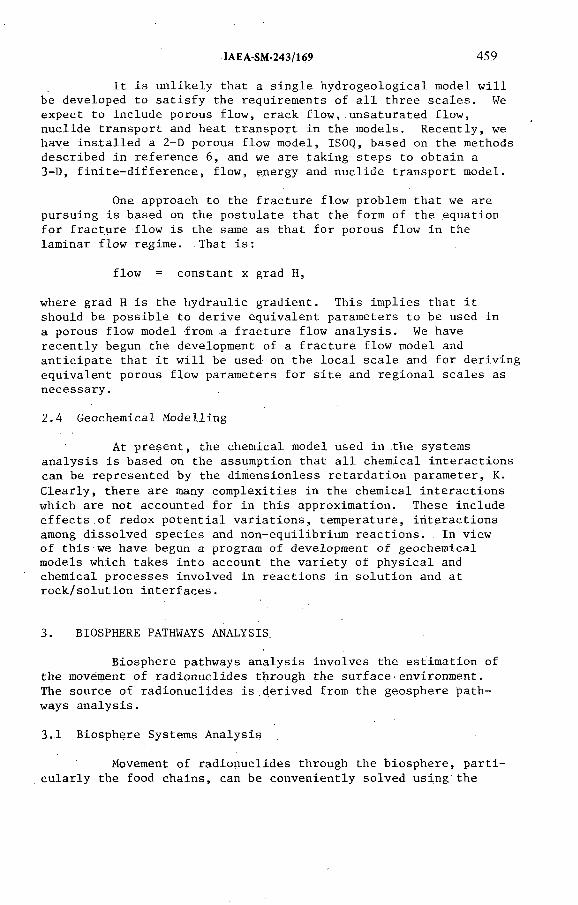
IAEA-SM-243/169 459
It is unlikely that a single hydrogeological model will be developed to satisfy the requirements of all three scales. We expect to include porous flow, crack flow, unsaturated flow, nuclide transport and heat transport in the models. Recently, we have installed a 2-D porous flow model, ISOQ, based on the methods described in reference 6, and we are taking steps to obtain a 3-D, finite-difference, flow, energy and nuclide transport model.
One approach to the fracture flow problem that we are pursuing is based on the postulate that the form of the equation for fracture flow is the same as that for porous flow in the laminar flow regime. That is:
flow = constant x grad H,
where grad H is the hydraulic gradient. This implies that it should be possible to derive equivalent parameters to be used in a porous flow model from a fracture flow analysis. We have recently begun the development of a fracture flow model and anticipate that it will be used on the local scale and for deriving equivalent porous flow parameters for site and regional scales as necessary.
2.4 Geochemical Modelling
At present, the chemical model used in the systems analysis is based on the assumption that all chemical interactions can be represented by the dimensionless retardation parameter, K. Clearly, there are many complexities in the chemical interactions which are not accounted for in this approximation. These include effects of redox potential variations, temperature, interactions among dissolved species and non-equilibrium reactions. In view of this we have begun a program of development of geochemical models which takes into account the variety of physical and chemical processes involved in reactions in solution and at rock/solution interfaces.
3. BIOSPHERE PATHWAYS ANALYSIS.
Biosphere pathways analysis involves the estimation of the movement of radionuclides through the surface•environment.The source of radionuclides is derived from the geosphere pathways analysis.
3.1 Biosphere Systems Analysis
Movement of radionuclides through the biosphere, particularly the food chains, can be conveniently solved using the
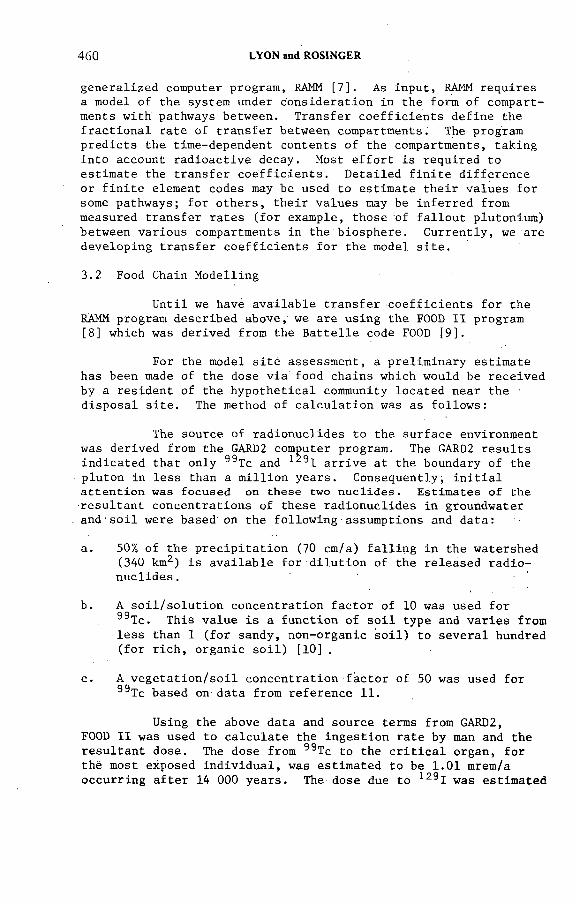
460 LYON and ROSINGER
generalized computer program, RAMM [7]. As input, RAMM requires a model of the system under consideration in the form of compartments with pathways between. Transfer coefficients define the fractional rate of transfer between compartments. The program predicts the time-dependent contents of the compartments, taking into account radioactive decay. Most effort is required to estimate the transfer coefficients. Detailed finite difference or finite element codes may be used to estimate their values for some pathways; for others, their values may be inferred from measured transfer rates (for example, those of fallout plutonium) between various compartments in the biosphere. Currently, we are developing transfer coefficients for the model site.
3.2 Food Chain Modelling
Until we have available transfer coefficients for the RAMM program described above, we are using the FOOD II program[8] which was derived from the Battelle code FOOD [9].
For the model sité assessment, a preliminary estimate has been made of the dose via food chains which would be received by a resident of the hypothetical community located near the disposal site. The method of calculation was as follows:
The source of radionuclides to the surface environment was derived from the GARD2 computer program. The GARD2 results indicated that only 9^Tc and arrive at the boundary of thepluton in less than a million years. Consequently; initial attention was focused on these two nuclides. Estimates of the resultant concentrations of these radionuclides in groundwater and soil were based on the following assumptions and data:
a. 50% of the precipitation (70 cm/a) falling in the watershed (340 km2) is available for dilution of the released radionuclides .
b. A soil/solution concentration factor of 10 was used for ®9Tc. This value is a function of soil type and varies from less than 1 (for sandy, non-organic soil) to several hundred (for rich, organic soil) [10] .
c. A vegetation/soil concentration factor of 50 was used for 99Tc based on data from reference 11.
Using the above data and source terms from GARD2,FOOD II was used to calculate the ingestion rate by man and theresultant dose. The dose from 99Tc to the critical organ, for the most exposed individual, was estimated to be 1.01 mrem/a occurring after 14 000 years. The dose due to 129i was estimated
IAEA-SM-243/169 461
to be similar to that due to 39Tc. However, the effect of dilution of radioactive iodine with stable iodine in the environment, which would reduce the dose in proportion to the dilution, has not yet been taken into account. In addition, these results assumed no retardation, which is probably a conservative assumption. Research programs are presently underway to investigate methods for technetium and iodine fixation.
4. POTENTIALLY DISRUPTIVE PHENOMENA
4.1 Man-Caused
The probability and consequence of intrusion by man are somewhat difficult to predict because of man's versatility and continuing scientific development. However, it is logical to expect that, if future generations are as capable scientifically as the present one, they will understand enough about radioactive material to detect it during accidental intrusion (drilling) or to be able to handle it during deliberate intrusion. The vault does not present an attractive target for sabotage because of its depth in solid rock.
4.2 Natural
Natural phenomena we have considered so far are: faulting due to earthquakes, meteorite impact, volcanoes, glaciation and erosion. For most of these phenomena, we have indications that the probability that they would significantly reduce the effectiveness of the geologic barrier is extremely low. For example, we have estimated that, based on historical fault formation, the frequency of new fault formation in an area such as proposed for a disposal vault is 1.5x10 9/a, the frequency of a meteorite impact which would breach the vault is 4.5x10 ^/a, and the frequency of a meteorite impact which could cause intensive fracturing to the vault depth is 1.8x10 12/a.
4.3 Crack Growth
Important characteristics of the geological formation which affect the pathways analysis are the crack parameters - frequency, orientation, length, width and interconnectivity. All of these parameters could change with time due to the stresses caused by the creation of the underground vault and by the heat from the waste.
The degree to which crack growth might occur is being investigated at WNRE [12] in laboratory experiments using statistical methods and linear elastic fracture mechanics theory. The

462 LYON and ROSINGER
first phase of short-term testing using granite beams at room temperature has been completed, and the results indicate that significant cracking should not occur in the first 1000 years if the propagating stress does not exceed about 60% of the rock strength. A series of long-term tests will be conducted at higher temperatures and in an aqueous environment.
5. CONCLUSIONS
Although a great deal of research and development remains to be done, a foundation has been laid for the methodology by which assessments can be carried out to evaluate the acceptability of the disposal project to the satisfaction of the scientific community, the regulatory and environmental agencies, and the general public.-
REFERENCES
[1] BOULTON, J. (Ed.), Management of Radioactive Fuel Wastes:The Canadian Disposal Program, Atomic Energy of Canada Limited Report, AECL-6314 (1978).
12] HATCHER, S.R., MAYMAN, S..A. , TOMLINSON, М., Development of Deep Underground Disposal for Canadian Nuclear Fuel Wastes, These Proceedings, SM-243/167.
[3] ROSINGER, E.L.J., TREMAINE, K.K.P., GARD, A Computer Program for the Geochemical Assessment of Radionuclide Disposal, Atomic Energy of Canada Limited Report AECL-6318 C1978).
[4] Acres Consulting Services Ltd., and Associates, Radioactive Waste Repository Study, Part II, Atomic Energy of Canada Limited Report AECL-6188-2 (1978).
[5] DENHAM, D.H., BAKER, D.A., SOLDAT, J.K., CORLEY, J.P., Radiological Evaluations for Advanced Waste Management Studies, Battelle Pacific Northwest Laboratories Report BNWL-1764 (1973).
[6] PINDER, G.F., FRIND, E.O., Application of Galerkin's procedure to aquifer analyses, Water Resources Research 8(1972) 108.
[7] LYON, R.B., RAMM, A System of Computer Programs for Radionuclide Pathway Analysis-Calculations, Atomic Energy of Canada Limited Report AECL-5527 (1976).
[8] ZACH, R., FOOD II: An Interactive Code for CalculatingConcentrations of Radionuclides in Food Products, AtomicEnergy of Canada Limited Report AECL-6305 (1978).
[9] BAKER, D.A., HOENES, G.R., SOLDAT, J.K., FOOD: An Interactive Code to Calculate Internal Radiation Doses from Contaminated Food Products, USERDA, Battelle Pacific Northwest Laboratories Report BNWL-SA-5523 (1976).

IAEA-SM-243/169 463
[10] LANDA, E.R., THORRIG, L.H., GAST, R.G., Effects of selective dissolution, electrolytes, aeration and sterilization on technetium-99 sorption by soil, J. Environmental Quality 6 (1977) 181.
[11] TILL, J.E., HOFFMAN, F.O., DUNNING, D.E., Assessment of 99Tc Releases to the Atmosphere - A Plea for Applied Research,Oak Ridge National Laboratory Report ORNL-TM-6260 (1978).
[12] WILKINS, B.J.S., A Study of Slow Crack Growth in Granite and its Application to Nuclear Waste Disposal in Hard Rock, Atomic Energy of Canada Report AECL-6423 (1979).
DISCUSSION
W. BECHTHOLD: From the presentation of Mr. Brandstetter’s paper
(IAEA-SM-243/35) we learned how difficult it is to work with Kd values. Do you
think that the Ka values which you introduced in your analysis are more useful?
R.B. LYON: The Ka values are more appropriate for studies on migration
in crystalline rock since they relate to the absorption per unit surface area. Some
of our Ka values were derived from Kd values by means of the surface-to-mass ratio.
A. BRANDSTETTER: May I make a comment here? Error limits of the
measured Kd values have to be included in the safety analyses in order to assess the
effect of Kd uncertainties on the results of the safety analyses. There is no
fundamental difference between Kd and Ka values. Both are necessary in order to
compute radionuclide retention; which one is used depends on whether porous
media or fracture flow is being analysed.
G. STOTT: If it is assumed that the radionuclides are released or leached in
a very short time, say one year, instead of the stated time of 1.7 X 10⁷ years, how
does this affect the results of the pathway analysis?
R.B. LYON: This would make the consequences greater. However, I believe
that the rate of migration of radionuclides from the disposal vault is limited by the
rate at which they can be carried away in the water available. The presentation of
“worst conceivable” cases does not, in my opinion, help in improving the perception
by the general population of the significance of the problem.


DISPOSAL OF HIGH-LEVEL WASTE OR
SPENT FUEL IN CRYSTALLINE ROCK
Factors influencing calculated radiation doses,
L: DEVELL, R. BERGMAN, Ulla BERGSTROM,
N. KJELLBERT, C. STENQUIST ,
Studsvik Energiteknik AB,
Nykôping
B. GRUNDFELT
Kemakta Konsult AB,
Stockholm, Sweden
Abstract
DISPOSAL OF HIGH-LEVEL WASTE OR SPENT FUEL IN CRYSTALLINE ROCK: FACTORS INFLUENCING CALCULATED RADIATÍON.DOSES.
Radiation doses to individuals in the future, living in the vicinity of а-repository for HLW or spent fuel in crystalline rock, have been estimated. The same has been done for the collective doses. Within the Swedish Nuclear Fuel Safety project (KBS), the subsequent reviews and more recent work, a substantial number of scenarios have been treated in order to calculate the consequences of the release of radionuclides to the environment. The paper gives a quantitative discussion of the way in which different factors will influence radiation doses. The factors considered include canister degradation time, leach rate, groundwater transport time, geochemical retention, dilution effects and exposure pathways in the biosphere.
IAEA-SM-243/55
I. INTRODUCTION i
As part of the KBS project the authors of the present paper have analyzed the radiological consequences arising from the disposal of HLW or spent fuel in crystalline rock. The technical concepts themselves will not be treated in any detail here. Descriptions can be found elsewhere /1, 2/. Just for clarification it has* to be mentioned that vitrified HLW with a fission product concentration of 9 % encapsulated in 10 cm lead and 6 mm titanium in addition to the inner steel canning was proposed to be stored at a depth of 500 m i n high-quality crystalline rock. The canisters are embedded in a-low permeable bentonite-quartz mixture. For disposal of spent fuel, encapsulation in 20 cm thick copper canisters was proposed. The canisters are filled up with lead in order to get a long-term stable package. The main results of the consequence analysis have already been given' in the KBS reportsII, 2/ and associated technical reports /3-6/.
The purpose of this paper is to present for this conference an outline of the analysis, give some additional results and discuss the
465
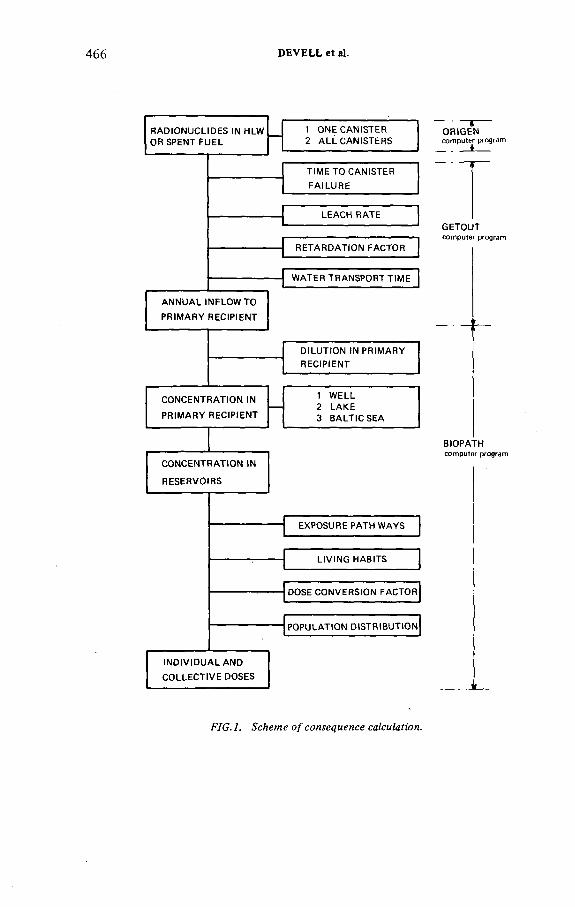
466 DEVELL et al.
' íORIGENcom p u te r p rogram
GETOUTcom p u te r p rogram
BIOPATHcom pute r p rogram
FIG.l. Scheme of consequence calculation.
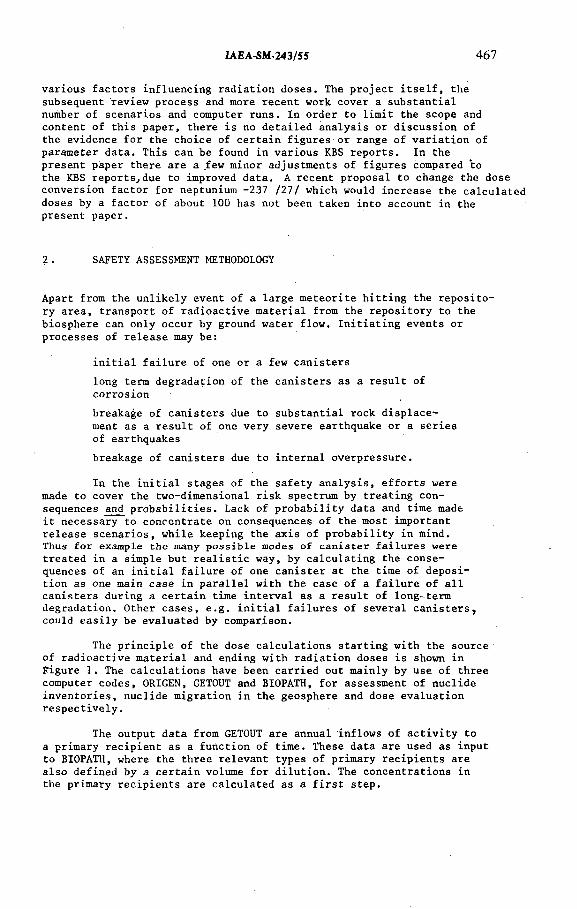
IAEA-SM-243/55 467
various factors influencing radiation doses. The project itself, the subsequent review process and more recent work cover a substantial number of scenarios and computer runs. In order to limit the scope and content of this paper, there is no detailed analysis or discussion of the evidence for the choice of certain figures or range of variation of parameter data. This can be found in various KBS reports. In the present paper there are a few minor adjustments of figures compared to the KBS reports,due to improved data. A recent proposal to change the dose conversion factor for neptunium -237 /27/ which would increase the calculated doses by a factor of about 100 has not been taken into account in the present paper.
2 . SAFETY ASSESSMENT METHODOLOGY
Apart from the unlikely event of a large meteorite hitting the repository area, transport of radioactive material from the repository to the biosphere can only occur by ground water flow. Initiating events or processes of release may be:
initial failure of one or a few canisterslong term degradation of the canisters as a result ofcorrosionbreakage of canisters due to substantial rock displacement as a result of one very severe earthquake or a seriesof earthquakesbreakage of canisters due to internal overpressure.
In the initial stages of the safety analysis, efforts were made to cover the two-dimensional risk spectrum by treating consequences and probabilities. Lack of probability data and time made it necessary to concentrate on consequences of the most important release scenarios, while keeping the axis of probability in mind.Thus for example the many possible modes of canister failures were treated in a simple but realistic way, by calculating the consequences of an initial failure of one canister at the time of deposition as one main case in parallel with the case of a failure of all canisters during a certain time interval as a result of long-term degradation. Other cases, e.g. initial failures of several canisters, could easily be evaluated by comparison.
The principle of the dose calculations starting with the source of radioactive material and ending with radiation doses is shown in figure 1. The calculations have been carried out mainly by use of three computer codes, ORIGEN, GETOUT and BIOPATH, for assessment of nuclide inventories, nuclide migration in the geosphere and dose evaluation respectively.
The output data from GETOUT are annual inflows of activity to a primary recipient as a function of time. These data are used as input to BIOPATH, where the three relevant types of primary recipients are also defined by a certain volume for dilution. The concentrations in the primary recipients are calculated as a first step.

468 DEVELL et al.
TABLE I. RETARDATION FACTORS
ElementOxidizingenvironment
Reducing environment with conservative concentration values and short contact time
Best estimate for reducing environment, and slow groundwater transport
Set ,a Set 1) Set сNi - ' - 6 100Sr 51 . 120 1 500Zr ' 8 000 4 800 61 000Tc 1 1 950I 1 1 1Cs 800 1 200 4 000Ce 80 000 19 000 200 000Nd 25 000 3 800 200 000Eu 50 000 30 000 200 000Ra 670 1 200 48 000Th 5 100 1 900 . 46 000Pa 37 37 , 11 400U 41 1 900 23 000Np 260 1 900 23 000Pu 1 100 2 800 5 700Am 80 000 19 000 610 000Cm AO 000 -9 500 305 000
GETOUT, which has been developed at PNL 111, is an one-dimen- sional model for calculating nuclide migration.by ground water in a homogeneous medium. The model .takes into account hydraulic convection and dispersion as well as .chain decay and geochemical retardation for the various nuclides. GETOUT is based on analytical solutions of a set of first-order differential equations:
32N. 3N. 3N. • •D - V - K. -r-i - K.X.N. + К. Л . N. = 0 (1)_2 3Z ■ i 3t . i i i l-l l-l l-l
où
where2D = dispersion coefficient (m Is)
V = ground water velocity (m/s)= retardation factor^for nuclide i
X. = decay constant (s )Z = distance of migration (m)t = time (s)N. = discharge rate of nuclide i.at Z and t (moles/s).
The leach rate is assumed to be constant. If the dispersion can be neglected, is independent of specific values of V and Z.
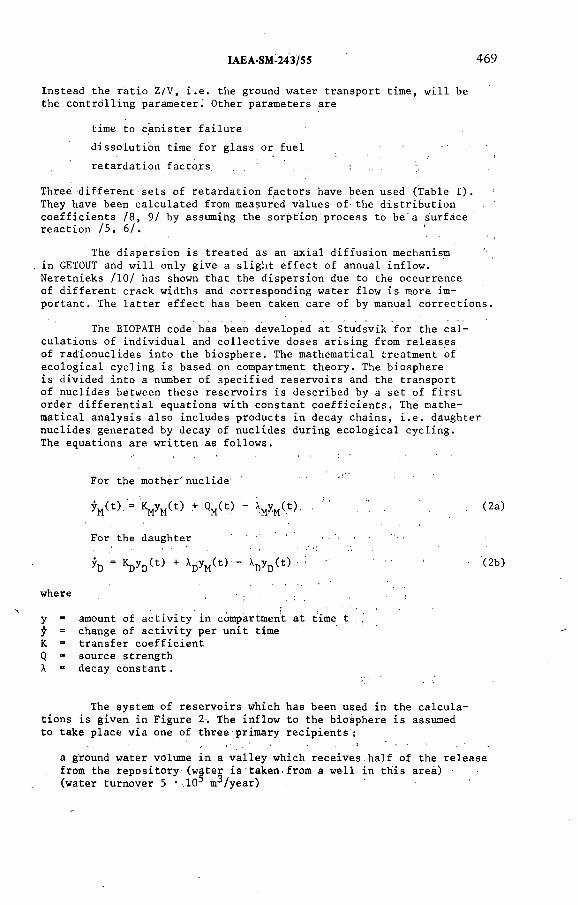
IAEA-SM 243/5 5 469
Instead the ratio Z/V, i.e. the ground water transport time, will be the controlling parameter^ Other parameters are
time to canister failure dissolution time for glass or fuel retardation factors. :
Three different sets of retardation factors have been used (Table I).They have been calculated from measured values of- the distribution coefficients /8, 9/ by assuming the sorption process to be a surface reaction /5, 6/.
The dispersion is treated as an axial diffusion mechanism in GETOUT and will only give a slight effect of annual inflow.Neretnieks /10/ has shown that the dispersion due to the occurrence of different crack widths and corresponding water flow is more important. The latter effect has been taken care of by manual corrections.
The BIOPATH code has been developed at Studsvik for the calculations of individual and collective doses arising from releases of radionuclides into the biosphere. The mathematical treatment of ecological cycling is based on compartment theory. The biosphere is divided into a number of specified reservoirs and the transport of nuclides between these reservoirs is described by a set of first order differential equations with constant coefficients. The mathematical analysis also includes products in decay chains, i.e. daughternuclides generated by decay of nuclides during ecological cycling.The equations are written as follows.
For the mother' nuclide'
V c) = iCMyM(t) + QM (t) - XM*M(t>- ■ (2a)
For the daughter
yD = KDyD(t) + XDyM (t)" XDyD(t) : " ' ' (2b)
where
y = amount of activity in compartment at time tÿ = change of activity per unit time К “ transfer coefficient Q = source strength X “ decay constant.
The system of reservoirs which has been used in the calculations is given in Figure 2-, The inflow to the biosphere is assumed to take place via one of three primary recipients :
a ground water volume in a valley which receives half of the release from the repository (water is taken.from a well in this area) - (water turnover 5 • 10^ m^/year)
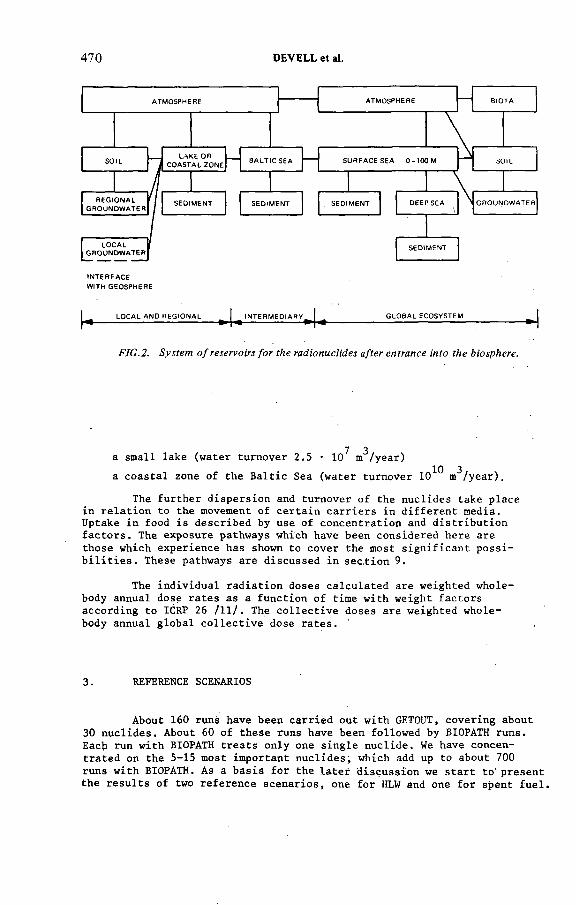
470 DEVELL et al.
INTERFACE WITH GEOSPHERE
LOCAL AND REGIONAL INTERM ED IARY I GLOBAL ECOSYSTEM
FIG.2. System of reservoirs for the radionuclides after entrance into the biosphere.
1 3a small lake (water turnover 2.5-10 m /year)10 3a coastal zone of the Baltic Sea (water turnover 10 m /year).
The further dispersion and turnover of the nuclides take place in relation to the movement of certain carriers in different media. Uptake in food is described by use of concentration and distribution factors. The exposure pathways which have been considered here are those which experience has shown to cover the most significant possibilities. These pathways are discussed in section 9.
The individual radiation doses calculated are weighted whole- body annual dose rates as a function of time with weight factors according to ICRP 26 /11/. The collective doses are weighted whole- body annual global collective dose rates.
3. REFERENCE SCENARIOS
About 160 runs have been carried out with GETOUT, covering about 30 nuclides. About 60 of these runs have been followed by BIOPATH runs. Each run with BIOPATH treats only one single nuclide. We have concentrated on the 5-15 most important nuclides which add up to about 700 runs with BIOPATH. As a basis for the later discussion we start to'present the results of two reference scenarios, one for HLW and one for spent fuel.
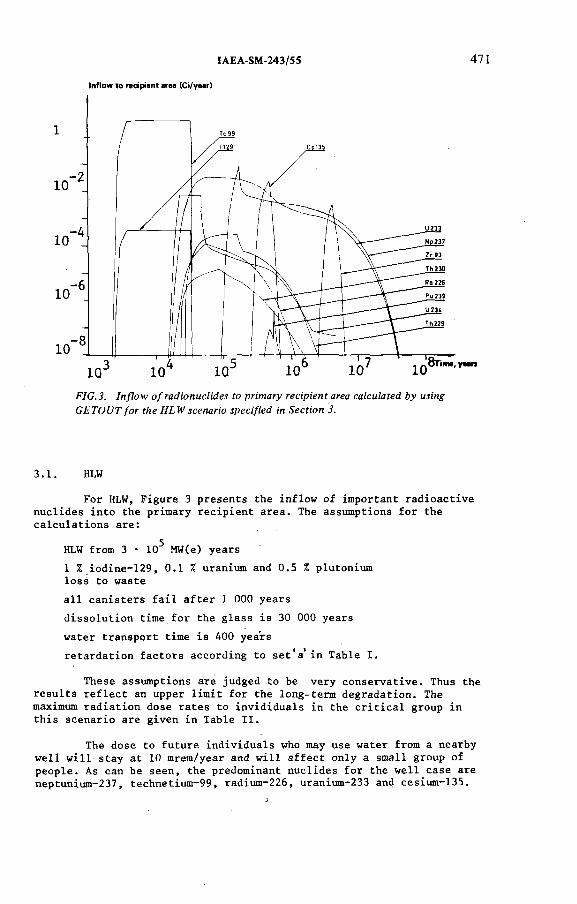
IAEA-SM-243/55 471
In flo w to redprant area (Ci/yaar)
FIG.3. Inflow of radionuclides to primary recipient area calculated by using GETOUTfor the H L W scenario specified in Section 3.
3.1. HLW
For HLW, Figure 3 presents the inflow of important radioactivenuclides into the primary recipient area. The assumptions for thecalculations are:
HLW from 3 • 10^ MW(e) years1 % iodine-129, 0.1 % uranium and 0.5 % plutonium loss to wasteall canisters fail after 1 000 years dissolution time for the glass is 30 000 yearswater transport time is 400 years retardation factors according to set'a’ in Table I.
These assumptions are judged to be very conservative. Thus the results reflect an upper limit for the long-term degradation. The maximum radiation dose rates to invididuals in the critical group in this scenario are given in Table II.
The dose to future individuals who may use water from a nearby well will stay at 10 mrem/year and will affect only a small group of people. As can be seen, the predominant nuclides for the well case are neptunium-237, technetium-99, radium-226, uranium-233 and cesium-135.

472 DEVELL et al.
TABLE II. MAXIMUM INDIVIDUAL DOSE RATES IN THE CRITICAL GROUP
CALCULATED BY BIOPATH FOR THE HLW SCENARIO SPECIFIED IN
SECTION 3
Nuclide Maximum inflow to recipient
Maximum dose rate (rem/year)
Time Activity Well Lake . .Baltic(years) (Ci/year)
Zr-93 4 • io6 3 • io-3 2 • lO"7 2 • io"7 2 • 10~9Tc-99 6 . 103 5 • 10° 2 • ID'3 9 • 10~5 7 • io-71-129 6 • io3 -41 • 10 7 • 10-5 3 • io-6 2 • ID'8Cs-135 4 • 105 -22 - 1 0 4 • 10-4 3 • io~4 1 • 10-6Ra-226 5 io4 1 • io~4 6 • 10-4 4 • io~4 \ ; 1 • 10-6Th-229 9 • io4 3 * 10-4. 6 • io-4 6 • io-4 2 • io"6Th-230 5 • 104 1 . io-5 2 • 10-6 3 • io“7 г • io-9U-233 .5 . 104 -23 - 1 0 2 • 10-3 9 • 10~5 7 • io-7U-234 ’ 3 • 104 -37-10. 3 • 10-4 2 • io"5 2 • io-7Np-237 2 • 105 -29 * 10 9 • io"3 4 • io-4 3 • 10-6Pu-239 6 . 105 5 •' 10”7 4 • 10-8 4 • 10-8 ■ 7 . 10-12
Maximum total dose rate 1 • 10-2 1 • io-3 5 . 10-6
Time to maximum total dose rate 200 000 years
The use of water from the lake will limit the maximum individual doserate to 1 mrem/year in the reference scenario If the inflow goesto the Baltic the doses will be considerably lower.
3.2. Spent fuel
For spent fuel Figure 4 presents the inflow of important nuclides tothe primary recipient area. The assumptions for the calculations are:
spent fuel from 3 • 10^ MW(e) years .all canisters fail after 100 000 years dissolution time for fuel matrix is 500 000 -yearswater transport time is 3 000 years retardation factors according to set'c'in Table I.
These assumptions are considered to be conservative; The maximum radiation doses to individuals- are given in Table III. The maximum dose rate inthe well1 alternative appears after about 70 million years at” a-"
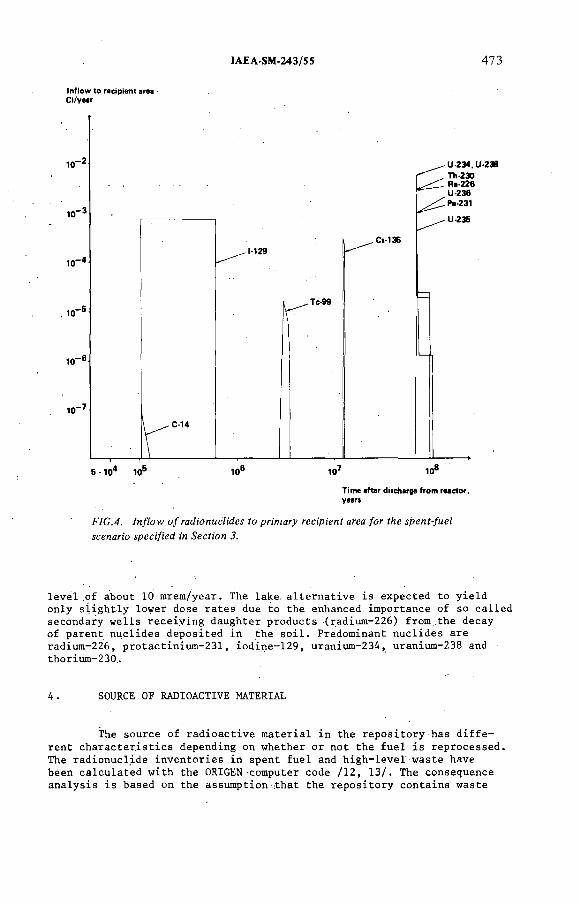
IAEA-SM-243/55 473
In flo w to recipient area Ci/year
Time after discharge from reactor, years
FIG.4. Inflow of radionuclides to primary recipient area for the spent-fuel scenario specified in Section 3.
level of about 10 mrem/year. The lake, alternative is expected to yield only slightly lower dose rates due to the enhanced importance of so called secondary wells receiving daughter products (radium-226) from .the decay of parent nuclides deposited in the soil. Predominant nuclides are radium-226, protactinium-231, iodine-129, uranium-234, uranium-238 and thorium-230..
A. SOURCE OF RADIOACTIVE MATERIAL
The source of radioactive material in the repository has different characteristics depending on whether or not the fuel is reprocessed The radionuclide inventories in spent fuel and high-level-waste have been calculated with the ORIGEN-computer code /12, 13/. The consequence analysis is based on the assumption that the repository contains waste

474 DEVELL et al.
TABLE III. MAXIMUM INDIVIDUAL DOSE RATES IN THE CRITICAL GROUP
FOR THE SPENT-FUEL SCENARIO SPECIFIED IN SECTION 3
NuclideMaximum inflow to ecipient
Time Activityyears) (Ci/year)
Maximum dose rate (rem/year)
Well Lake Baltic
С-14 h-1 h-1 О Ln
3 • 10"8 5Оi-*!IОг—1 2 • 10-10 3 . 10-12
Tc-99 3 • 106 2 • io-5 8 io“9 3 » 10-10 2 « 10-121-129 1 • lo5 8 • io~4 4 10-4 2 • io~5 1 10-7Cs-135 1 • 107 3 • io"4 7 10"6 5 • 10-6 2 10-8Ra-226 7 • 10 3 • 10-3 1 10-2 5 • io~3 3 io"5Th-229 7 • 10 1 • 10~U - - -Th-230 7 • 107 3 • 10-3 2 10-4 5 • 10"5 2 10-7Pa-231 7 • 10 1 • 10-3 5 io-4 5 • 10-4 1 io”7U-233 7 • 10 4 • 10-12 - - -U-234 7 • 107 6 • 10-3 3 io-4 2 10-5 1 10-7U-235 7 • 10 5 • io~4 3 io-5 2 • 10-6 1 io"8U-236 7 • 10 1 • 10-3 6 10-5 3 10-6 2 10-8U-238 7 • 107 6 • io-3 3 10~4 2 • io~5 1 io”7Np-237 7 • 107 3 • 10-12 3 10-13 2 I—* о
1 1— 1 10-16
Maximum total dose 1 10-2 5 10 3 3 io-5
Time to maximum total dose 70 million years
or fuel from thirty years of operation of thirteen LWRs, equivalent to about 3 • 10^ MW (e)a. The conservative assumption is made that all the reactors are PWRs with a discharge burnup of 33 000 MWd/t uranium. The ORIGEN results have been compared with results based on discharge inventories from pin-cell calculations performed with the CASMO computer code /14, 15/. A comparison of calculated peak concentrations in spent PWR fuel is presented in Table IV. Additional calculations with BEGAFIP, a computer code similar to ORIGEN, give results in good agreement with results from CASMO /14, 15/. The CASMO and BEGAFIP codes have been developed at Studsvik.
The inventories of the potentially most hazardous radionuclides in spent fuel and vitrified high-level waste are given in Figures 5 and 6. More precise data as wll as discussions may be found in /13-15/. Reprocessing is assumed to remove 100 % of the tritium and noble gases, 99.9 % of the uranium, 99.5 % of the plutonium, 99 % of the halogens, including iodine-129, and about 90 % of the carbon-14 contained in the uranium dioxide matrix.

IAEA-SM-243/55 475
TABLE IV. COMPARISON OF SPENT-FUEL INVENTORIES OBTAINED FROM
DIFFERENT COMPUTER PROGRAMS FOR SOME IMPORTANT NUCLIDES
Nuclide Maximum PWR inventory Ci/t uraniumORIGEN CASMO
Sr-90 76 000 75 000Tc-99 14 141-129 0.038 0.030Cs-135 0.25 0.31Cs-137 110 000 110 000Ra-226 1.1 1.1Th-229 0.85 1.1Np-237 1.1 1-5Pu-239 320 400Pu-240 490 520Am-241 3 300 4 700Am-243 21 ' 19
Burnup 33 000 MWy/t uranium. Total inventory 10 000 t
Metallic parts from the spent fuel assemblies have to be disposed of according to the spent fuel disposal concept, but these represent a minor problem and will not be discussed here. An assessment of inventories in assembly construction materials is given in /16/.
No recycling of plutonium, uranium or other actinides was considered in the KBS safety assessment. However, additional inventory calculations for a simplified plutonium recycling scheme have been made /15/. Neither this, nor the more complicated GESMO uranium and plutonium recycling scheme at equilibrium /17/, display any drastic changes of the inventories of nuclides in Figures 5 and 6, apart from plutonium-240 and americium-243 with its daughter plutonium-239. As we shall see later, these nuclides are very strongly geochemically retarded in granite.
5. . TIME TO CANISTER DEGRADATION
As a reference case for safety evaluation the titanium/lead canning of the glass cylinders was assumed to withstand 1 000 years in the repository without loss of integrity. One single canister was assumed to have initial failures. The canning is a second effective

476 DEVELL et al.
1 10 102 103 104 10* 10® 107
Time after discharge from reactor, years '
FIG.5. Radioactive elements in spent fuel from PWR with a burnup of 33 000 MW-d/t U, power density '34.4 MW/t U and 3.1% uranium-235 enrichment.
barrier during this period of time when total activity is lowered by three orders of magnitude. The retardation in clay and cracks is a third barrier. Radiolytic effects will also be reduced by the shielding offered by the lead. 100 and 500 years for penetration of canisters have also been considered but do not influence dose results. The extremely unlikely case with a combination of a disruptive displacement due to an earthquake and enhanced water flow is treated in section 10.
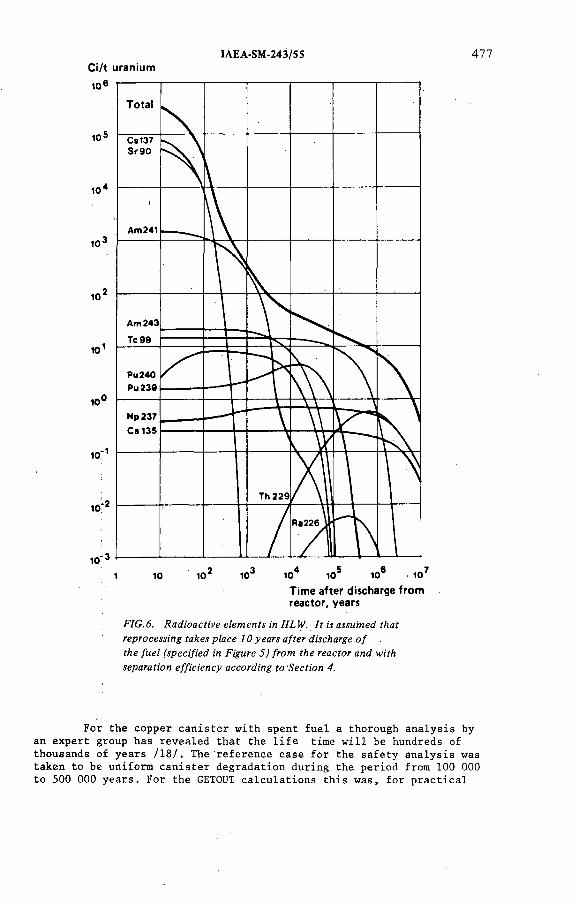
Ci/t uraniumIAEA-SM-243/55 477
Time after discharge from reactor, years
FIG.6. Radioactive elements in HLW. It is assumed that reprocessing takes place 10 years after discharge оf the fuel (specified in Figure 5) from the reactor and with separation efficiency according to Section 4.
For the copper canister with spent fuel a thorough analysis by an expert group has revealed that the life time will be hundreds of thousands of years /18/. The reference case for the safety analysis was taken to be uniform canister degradation during the period from 100 000 to 500 000 years. For the GETOUT calculations this was, for. practical

478 DEVELL et al.
Leach rate (tU /a )
в
V A
' Y\
\\
\
1 1 1 >J t
у '/
x 'i i i i
5 5 ■ 105 1 • 106
Time(years after dischargeof fuel from reactor)
FIG. 7. Leach rate for radioactive elements from the fuel as a function of time. Curve A: Reference case for the safety analysis with uniform canister degradation during the period from 100 ООО to 500 ООО years and a dissolution time of 500 ООО years for the fuel. Curve B: Main case for the calculations with instantaneous canister degradation after 100 ООО years and a dissolution time of 500 ООО years for the fuel.
M axim um in d iv id u a l dose rate
103 104 105 106T im e to p en e tra tion ( years)
FIG. 8. Maximum dose rates for different times to copper canister degradation. The crosses show the total dose rate. Radium-226 is the dominant nuclide.

IAEA-SM-243/S5 479
Maximumindividual dose rate
Dissolution time (years)
FIG.9. Maximum dose rates for different dissolution times, for the glass cylinders. The crosses show total dose rate and the nuclides are those which are predominant.
reasons, transferred to the assumptions of instantaneous degradation of all canisters after 100 000 years and a dissolution time of 500 000 years for the fuel. The leach rate of radioactive materials fixed in the uranium dioxide matrix in the reference case is thus thought to follow curve A in Figure 7. For straightforward calculations with GETOUT curve В was actually used. If the canister life is assumed to be Gaussian around 3 • 10^ years with a probability of 0.7 7, for degradation before 100 000 years, the leach rate of matrix-fixed material will not increase compared to calculations.
Figure 8 shows the maximum individual dose rates for different times to copper canister degradation. The dependence is very flat. It has to be observed that parameter data used are more conservative than in the reference scenario. The results in Figures 8-12 all apply to the well case with the lowest dilution and thus the highest doses of the inflow alternatives.
6. LEACH RATES
In the reference scenario the leach rate for vitrified waste was chosen as 2 ■ 10-7 g/cm^ • d,based on laboratory experiments /19, 20/
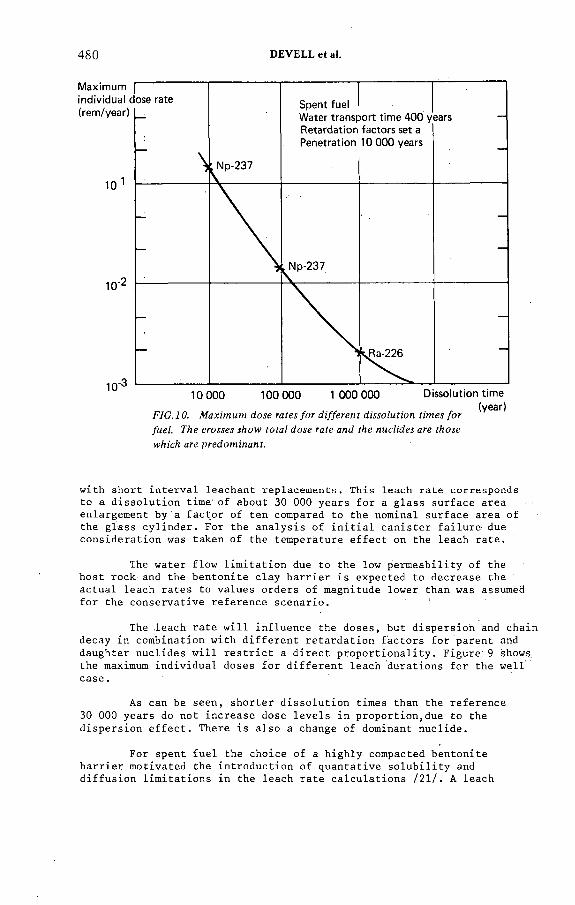
480 DEVELL et al.
fuel. The crosses show total dose rate and the nuclides are those which are predominant.
with short interval leachant replacements. This leach rate corresponds to a dissolution time' of about 30 000 years for a glass surface area enlargement by a factor of ten compared to the nominal surface area of the glass cylinder. For the analysis of initial canister failure due consideration was taken of the temperature effect on the leach rate.
The water flow limitation due to the low permeability of the host rock- and the bentonite clay barrier is expected to decrease the ' actual leach rates to values orders of magnitude lower than was assumed for the conservative reference scenario.
The .leach rate will influence the doses, but dispersion and chain decay in combination with different retardation factors for parent and daughter nuclides will restrict a direct proportionality. Figure' 9 shows, the maximum individual doses for different leach durations for the well case.
As can be seen, shorter dissolution times than the reference 30 000 years do not increase dose levels in proportion,due to the dispersion effect. There is also a change of dominant nuclide.
For spent fuel the choice of a highly compacted bentonite barrier motivated the introduction of quantative solubility and diffusion limitations in the leach rate calculations /21/. A leach

IAEA-SM-243/55 481
Maximumindividual dose rate
10 100 1000 10000
Groundwater transport time (years)
FIG.11. Maximum individual dose rates for different water
transport times in the HL W scenario. The crosses show total dose
rate and the nuclides are those which are predominant.
d u r a t i o n o f 1 . 8 m i l l i o n y e a r s w a s o b t a i n e d f o r t h e d i s s o l u t i o n o f a s p e n t f u e l c a n i s t e r w i t h r e a l i s t i c b u t s o m e w h a t c o n s e r v a t i v e a s s u m p t io n s f o r ' t h e g r o u n d w a t e r f l o w n e a r t h e c a n i s t e r . P e s s i m i s t i c a s s u m p t io n s y i e l d e d 500 000 y e a r s , w h i c h was c h o s e n f o r t h e r e f e r e n c e s c e n a r i o . L a b o r a t o r y e x p e r i m e n t s / 2 2 / b a s e d o n l e a c h t e s t s w i t h p r a c t i c a l l y u n l i m i t e d v o lu m e s o f w a t e r i n d i c a t e a m in im u m d i s s o l u t i o n t im e o f 5 0 0 0 0 y e a r s f o r s u c h c o n d i t i o n s , n o t p r e v a i l i n g i n t h e r e p o s i t o r y . F i g u r e 1 0 s h o w s t h e d e p e n d e n c e o f d o s e o n d i s s o l u t i o n t i m e . I t m u s t b e n o t e d t h a t t h e d a t a f o r t h e o t h e r i m p o r t a n t p a r a m e t e r s a r e c h o s e n c o n s e r v a t i v e l y ( s e e F i g 1 0 ) . E v e n s o , t h e e x t r e m e s a r e n o t a l a r m i n g .
7. WATER TRANSPORT TIME AND RETARDATION FACTORS
A m o n g t h e p a r a m e t e r s e n t e r i n g t h e m i g r a t i o n c a l c u l a t i o n s t h e g r o u n d w a t e r t r a n s p o r t t im e a n d t h e r e t a r d a t i o n f a c t o r s a r e o f k e y im p o r t a n c e . A s t h e s e t w o p a r a m e t e r s g o v e r n t h e n u c l i d e t r a n s p o r t t im e s t h e y a l s o g o v e r n t h e e x t e n t t o w h ic h t h e n u c l i d e s d e c a y b e f o r e a p p e a r i n g i n t h e r e c i p i e n t .
T h e r e t a r d a t i o n f a c t o r s a r e i n t h e c a l c u l a t i o n s a s s u m e d t o b e t h e r e s u l t o f i o n - e x c h a n g e a n d a d s o r p t i o n p r o c e s s e s , i . e . r e v e r s i b l e

482 DEVELL et al.
Maximumindividual dose rate
10 100 1000 10000Groundwater transport time \ years)
FIG.12. Maximum individual dose rates for different water
transport times in the spent-fuel scenario. The crosses show
total dose rate and the nuclides are those which are predominant.
For set ‘a ’Plutonium-242 and Cesium-135 are the most dominant
nuclides if groundwater transport time is 100 years.
r e a c t i o n s . I n f a c t m a n y o f t h e e le m e n t s a r e i m m o b i l i z e d b y p r e c i p i t a t i o n a n d s u b s e q u e n t m i n e r a l i z a t i o n . T h e c a l c u l a t i o n s a r e t h u s c o n s e r v a t i v e i n t h i s r e s p e c t . O n t h e o t h e r h a n d c o m p le x in g a g e n t s i n t h e w a t e r m a y i n f l u e n c e t h e t r a n s p o r t p r o c e s s . T h e p o s s i b l e e f f e c t h a s h o w e v e r b e e n e v a l u a t e d a n d f o u n d t o b e o f m in o r i m p o r t a n c e / 2 / .
T h e w a t e r t r a n s p o r t t im e f r o m t h e s e a l e d r e p o s i t o r y t o a p r i m a r y r e c i p i e n t i s d e p e n d e n t o n r o c k p r o p e r t i e s a n d t h e h y d r a u l i c g r a d i e n t .I t h a s b e e n s h o w n t h a t t h e t h e r m a l c o n v e c t i o n i s o f m in o r im p o r t a n c e / 2 3 / . F ro m v a r i o u s c a l c u l a t i o n s / 2 4 / a r a n g e o f t r a n s p o r t t im e s f r o m h u n d r e d s o f y e a r s t o t e n s o f t h o u s a n d s o f y e a r s i s e x p e c t e d f o r a r o c k f o r m a t i o n c o n s id e r e d f o r d i s p o s a l . A g e d e t e r m i n a t i o n s b y t h e c a r b o n - 1 4 m e t h o d i n d i c a t e t h a t a b o u t 1 0 0 0 0 y e a r s i s t y p i c a l . 4 0 0 y e a r s w a s f i r s t s e l e c t e d a s a c o n s e r v a t i v e v a l u e f o r a r e f e r e n c e t r a n s p o r t t im e f o r t h e w h o le r e p o s i t o r y . T h i s w a s e x t e n d e d t o 3 0 0 0 y e a r s f o r t h e s e c o n d p a r t o f t h e KBS s t u d y , w h e n a d d i t i o n a l i n f o r m a t i o n w a s a v a i l a b l e . T h e e f f e c t o f d i f f e r e n t w a t e r t r a n s p o r t t im e s o n i n d i v i d u a l d o s e s h a s b e e n e v a l u a t e d . F o r H LW , r u n s f o r 1 0 , 4 0 , 1 0 0 ,4 0 0 , 2 • 1 0 ^ a n d 1 0 ^ y e a r s h a v e b e e n c a r r i e d o u t i n c o m b in a t i o n w i t h t h e s e t ' a * r e t a r d a t i o n f a c t o r s . T h e d o s e r a t e s f o r t h e w e l l a l t e r n a t i v e a r e g i v e n i n F i g u r e 1 1 .

IAEA-SM-243/55 483
A s e x p e c t e d , d o s e r a t e s a r e i n c r e a s i n g w i t h s h o r t e r w a t e r t r a n s p o r t t i m e s . T h e r e a r e a l s o c h a n g e s o f d o m in a n t n u c l i d e s . I t h a s t o b e o b s e r v e d t h a t o n l y 6 0 0 0 y e a r s a p p l y f o r t h e l e a c h d u r a t i o n .B y u s i n g t h e r e f e r e n c e 3 0 0 0 0 y e a r s , ' t h e d o s e s w i l l b e l o w e r .
F ro m a d i s c u s s i o n i n / 2 / i t i s e v i d e n t t h a t t h e g e n e r a l w a t e r t r a n s p o r t t im e f r o m t h e m a in b o d y o f c a n i s t e r s d is p o s e d i n h i g h q u a l i t y r o c k ( p e r m e a b i l i t y 1 0 ” 7 - 5 m / s a t 5 0 0 m , p o r o s i t y 0 . 0 0 1 a n d a g r a d i e n t o f 0 . 0 0 3 ) w i l l b e o f t h e o r d e r o f t h o u s a n d s o f y e a r s . W a t e r f r o m s i n g l e c a n i s t e r s m a y h o w e v e r e x p e r i e n c e s h o r t e r t r a n s p o r t t i m e s , b u t t h i s m e a n s a c o n s i d e r a b l e d e c r e a s e i n s o u r c e s t r e n g t h a n d t h u s i n d o s e s . A c o m b i n a t i o n o f e v e n 1 0 0 c a n i s t e r s w i t h t h e e x t r e m e 1 0 - y e a r t r a n s p o r t t im e y i e l d s a d o s e r a t e o f 0 . 0 0 7 r e m / a , w h i c h i s l o w e r t h a n t h a t o f t h e r e f e r e n c e s c e n a r i o .
F o r s p e n t f u e l w a t e r t r a n s p o r t t im e s o f 1 0 0 - 3 0 0 0 y e a r s h a v e b e e n s t u d i e d f o r t h e s e t ' a { ‘ b ’ a n d ‘ c ’ r e t a r d a t i o n f a c t o r s . T h e r e s u l t s a r e g i v e n i n F i g u r e 1 2 . I t i s i n t e r e s t i n g t o n o t e t h a t t h e d o s e r a t e s a r e a lm o s t i n d e p e n d e n t o n w a t e r t r a n s p o r t t im e w i t h i n t h e r a n g e s t u d i e d .
T h e r e t a r d a t i o n f a c t o r s d e p e n d o n t h e r e d o x p o t e n t i a l , c o n t a c t t i m e , f i s s u r e p r o p e r t i e s e t c . A b e s t estimate f o r t h e r e l e v a n t c o n d i t i o n s i s s e t ‘ c ’ o f T a b le I . T h e e f f e c t o f c h a n g in g t o s e t ‘ a ' o r b ' c a n b e s e e n i n F i g u r e 1 2 .
8 . D IL U T IO N IN P R IM A R Y R E C IP IE N T S AND B IO S P H E R E TR ANSPO RT
T h r e e m a in c a s e s o f i n f l o w t o t h e b i o s p h e r e h a v e b e e n s t u d i e d . T h e y r e p r e s e n t t h r e e d i f f e r e n t a n d p o s s i b l e e x a m p le s o f p r i m a r y r e c i p i e n t s a s f o l l o w s . T h e f u r t h e r d i s p e r s i o n a n d t r a n s p o r t i n t h e b i o s p h e r e h a v e b e e n t o u c h e d u p o n i n s e c t i o n 2 , w h ic h a l s o c o n t a i n s r e s u l t s f o r t h e d i f f e r e n t i n f l o w a l t e r n a t i v e s .
T h e i n f l o w o f r a d i o n u c l i d e s i s d i v i d e d e q u a l l y b e t w e e n a v a l l e y a n d a n e a r b y l a k e . H a l f o f t h e i n f l o w w a s t h u s a s s u m e d t o b e d i l u t e d i n t h e p e r c o l a t e d r a i n w a t e r ( 5 • 1 0 ^ m ^ / y e a r ) f r o m a 2 k m 2 a r e a .
T h e i n f l o w i s d i v i d e d e q u a l l y b e t w e e n a n e a r b y l a k e a n d i t s d o w n s t r e a m l a k é s y s t e m . T h e w a t e r t u r n o v e r o f t h e s y s t e m w a s a s s u m e d t o b e 2 . 5 • 1 0 ^ m 3 / y e a r .
T h e i n f l o w o c c u r s i n t o a c o a s t a l z o n e o f t h e B a l t i c S e a w i t h a w a t e r t u r n o v e r o f 1 0 Ю m 3 / y e a r .
9 . EXPOSURE PATHW AYS AND DOSE C A L C U L A T IO N S
T h i r t e e n e x p o s u r e p a t h w a y s l i s t e d i n T a b le V h a v e b e e n s e l e c t e d f o r t h e d o s e c a l c u l a t i o n s . E x p e r i e n c e s h o w s t h a t t h e s e
W e l l
L a k e
B a l t i c S e a
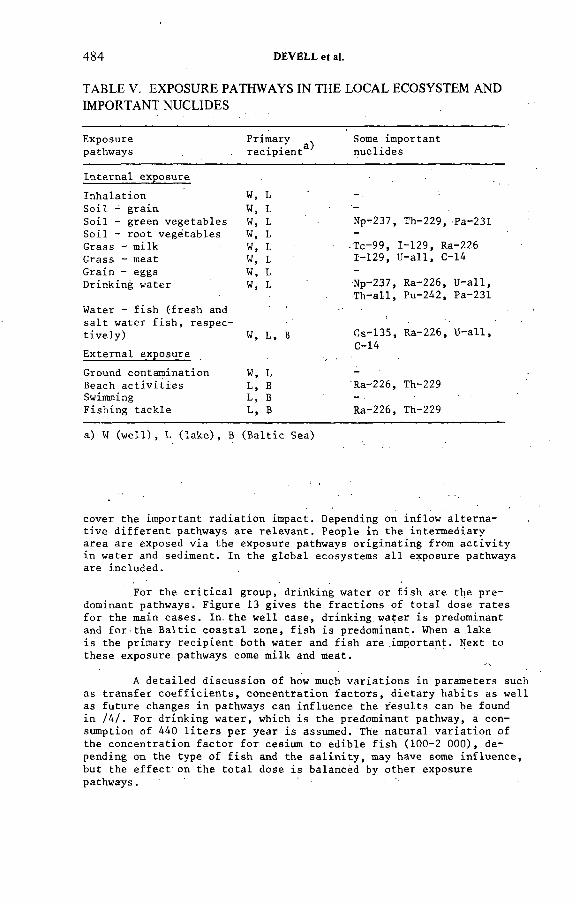
484 DEVELL et al.
TABLE V. EXPOSURE PATHWAYS IN THE LOCAL ECOSYSTEM AND
IMPORTANT NUCLIDES
E x p o s u r e P r im a r y . r e c i p i e n t
S om e i m p o r t a n tp a t h w a y s n u c l i d e s
I n t e r n a l e x p o s u r e
I n h a l a t i o n W , LS o i l - g r a i n W , LS o i l - g r e e n v e g e t a b l e s W , L N p - 2 3 7 , T h - 2 2 9 , P a - 2 3 1S o i l - r o o t v e g e t a b l e s W , L -G r a s s - m i l k W , L ■ T c - 9 9 , 1 - 1 2 9 , R a - 2 2 6G r a s s - m e a t W , L 1 - 1 2 9 , U - a l l , C - 1 4G r a i n - e g g s W , L -D r i n k i n g w a t e r W , L N p - 2 3 7 , R a - 2 2 6 , U - a l l ,
T h - a l l , P u - 2 4 2 , P a - 2 3 1W a t e r - f i s h ( f r e s h a n ds a l t w a t e r f i s h , r e s p e c t i v e l y ) W , L, В C s - 1 3 5 , R a - 2 2 6 , U - a l l ,
C - 1 4E x t e r n a l e x p o s u r e
G r o u n d c o n t a m i n a t i o n W , L -B e a c h a c t i v i t i e s L, В R a - 2 2 6 , T h - 2 2 9S w im m in g L, ВF i s h i n g t a c k l e L, В R a - 2 2 6 , T h - 2 2 9
a) W (well), L (lake), В (Baltic Sea)
c o v e r t h e i m p o r t a n t r a d i a t i o n i m p a c t . D e p e n d in g o n i n f l o w a l t e r n a t i v e d i f f e r e n t p a t h w a y s a r e r e l e v a n t . P e o p le i n t h e i n t e r m e d i a r y a r e a a r e e x p o s e d v i a t h e e x p o s u r e p a t h w a y s o r i g i n a t i n g f r o m a c t i v i t y i n w a t e r a n d s e d i m e n t . I n t h e g l o b a l e c o s y s t e m s a l l e x p o s u r e p a t h w a y s a r e i n c l u d e d .
F o r t h e c r i t i c a l g r o u p , d r i n k i n g w a t e r o r f i s h a r e t h e p r e d o m in a n t p a t h w a y s . F i g u r e 1 3 g i v e s t h e f r a c t i o n s o f t o t a l d o s e r a t e s f o r t h e m a in c a s e s . I n . t h e w e l l c a s e , d r i n k i n g , w a t e r i s p r e d o m i n a n t a n d f o r . t h e B a l t i c c o a s t a l z o n e , f i s h i s p r e d o m i n a n t . W h e n a l a k e i s t h e p r i m a r y r e c i p i e n t b o t h w a t e r a n d f i s h a r e . i m p o r t a n t . N e x t t o t h e s e e x p o s u r e p a t h w a y s c o m e m i l k a n d m e a t .
A d e t a i l e d d i s c u s s i o n o f h o w m u c h v a r i a t i o n s i n p a r a m e t e r s s u c h a s t r a n s f e r c o e f f i c i e n t s , c o n c e n t r a t i o n f a c t o r s , d i e t a r y h a b i t s a s w e l l a s f u t u r e c h a n g e s i n p a t h w a y s c a n i n f l u e n c e t h e r e s u l t s c a n b e f o u n d i n / 4 / . F o r d r i n k i n g w a t e r , w h ic h i s t h e p r e d o m i n a n t p a t h w a y , a c o n s u m p t io n o f 4 4 0 l i t e r s p e r y e a r i s a s s u m e d . T h e n a t u r a l v a r i a t i o n o f t h e c o n c e n t r a t i o n f a c t o r f o r c e s iu m t o e d i b l e f i s h ( 1 0 0 - 2 0 0 0 ) , d e p e n d in g o n t h e t y p e o f f i s h a n d t h e s a l i n i t y , m a y h a v e so m e i n f l u e n c e , b u t t h e e f f e c t o n t h e t o t a l d o s e i s b a la n c e d b y o t h e r e x p o s u r e p a t h w a y s .

IAEA-SM-243/5S 485
WELL
O T H E R S
HLW
W E L L
FIG. 13. Predominant exposure pathways in the reference scenarios specified
in Section 3.
F u t u r e c h a n g e s o f l a n d s c a p e s u c h a s t h e d r y i n g - u p o f a n e a r b y l a k e o r p a r t s o f t h e B a l t i c S e a m a y g i v e r i s e t o s p e c i a l e x p o s u r e p a t h w a y s , o w in g t o t h e f a c t t h a t t h e s e d im e n t s m a y b e u s e d i n a g r i c u l t u r e . T h e c o n s e q u e n c e s h a v e b e e n a n a ly s e d q u a l i t a t i v e l y . N o i n c r e a s e o f d o s e r a t e s w i l l o c c u r f o r a l a k e d r y i n g - u p b e c a u s e t h e u p t a k e v i a a g r i c u l t u r a l p r o d u c t s g r o w n o n t h e s e d im e n t d o e s n o t r e s u l t i n s u c h - h i g h d o s e s a s f i s h c o n s u m p t io n f r o m t h e l a k e . A d r y i n g - u p o f t h e B a l t i c . m a y i n c r e a s e t h e i n d i v i d u a l d o s e f o r t h i s i n f l o w a l t e r n a t i v e b y a f a c t o r o f t e n , d u e t o e x p o s u r e f r o m c e s iu m - 1 3 5 i n a g r i c u l t u r a l p r o d u c t s . T h e t o t a l i n d i v i d u a l d o s e w i l l s t i l l b e m u c h l o w e r t h a n f o r t h e w e l l a n d l a k e a l t e r n a t i v e s . T h e t o t a l c o l l e c t i v e d o s e r a t e s i n t h i s c a s e m a y r i s e b y a f a c t o r o f t w o .

486 DEVELL et al.
TABLE VI. DOSE CONVERSION FACTORS FOR INTAKE WITH FOOD AND
WATER OR THROUGH INHALATION OF 1 Ci OF IMPORTANT NUCLIDES
N u c l i d e
W e ig h t e d w h o le - b o d y c o m m itm e n t ( r e m / C i )
d o s e
I n t a k e b y f o o d a n d w a t e r I n h a l a t i o n
C - 1 4 9 . 91 0 6 6 . 6
S r - 9 0 , 1 . 5 1 0 2 2 . 3Z r - 9 3 1 . 7 1 0 2 1 . 8T c - 9 9 5 . 5 1 0 5 3 . 61 - 1 2 9 3 . 4 1 0 3 1 . 9C s - 1 3 5 7 . 3 1 0 4 . 5 . 7C s - 1 3 7 5 . 5 ' 1 0 6 3 . 8R a - 2 2 6 2 . 8 1 0 6 3 . 8T h - 2 2 9 1 . 8 1 0 r 4 . 9T h - 2 3 0 3 . 4 1 0 5 9 . 0P a - 2 3 1 6 . 6 io5 2 . 4U - 2 3 3 1 . 1 1 0 5 2 . 7U - 2 3 4 1 . 1
1 0 5 2 . 7U - 2 3 5 1 . 1 1 0 5 - 2 . 7U - 2 3 6 1 . 1 i o J 2 . 7U - 2 3 8 1 . 1 105 2 . 7N p - 2 3 7 2 . 0 1 0 5 5 . 0P u - 2 3 9 1 . 6 1 0 5 9 . 5P u - 2 4 0 1 . 6 1 0 5 9 . 5P u - 2 4 2 1 . 6 10
1 0 5
9 . 5A m -2 4 1 2 . 2 4 . 1A m -2 4 3 2 . 2 1 0 5 4 . 1
10ft1 0 4 102105 1 0 1 0 4 1 0 ft 1010o1°
10ft106 106 106 106 108 108 108 108 10g 10g 108
A n e x t e n d e d u s e o f m a r in e o r g a n is m s o t h e r t h a n f i s h , s u c h a s k r i l l a n d m a c r o a lg a e , w i l l n o t i n c r e a s e t h e t o t a l g l o b a l c o l l e c t i v e d o s e r a t e s s i g n i f i c a n t l y . A r e p la c e m e n t o f 1 0 k g o f f i s h m e a t b y1 0 k g o f k r i l l o r a l g a e w i l l r a i s e t h e c o l l e c t i v e d o s e r a t e s 1 0 % d u e t o t h e c o n t r i b u t i o n f r o m p l u t o n i u m - 2 4 2 .
A l l d o s e s g i v e n i n t h e r e p o r t a r e w e ig h t e d w h o le b o d y d o s e s w i t h w e i g h t f a c t o r s a c c o r d i n g t o IC R P 2 6 / 1 1 / . T h e d o s e c o n v e r s i o n f a c t o r s u s e d a r e g i v e n i n T a b le V I .
1 0 . U N L IK E L Y E VE N TS
U n l i k e l y e v e n t s w h ic h m a y a f f e c t t h e r e p o s i t o r y i n c l u d e d i s p la c e m e n t s d u e t o e a r t h q u a k e s a n d g l a c i a t i o n , f u t u r e d r i l l i n g t h r o u g h t h e r e p o s i t o r y a n d m e t e o r i t e im p a c t . V o l c a n i c a c t i v i t y i s n o t r e l e v a n t f o r t h e F e n n o s c a n d ia n r o c k f o r m a t i o n . C r i t i c a l i t y w i t h i n t h e s p e n t f u e l r e p o s i t o r y h a s b e e n t h e s u b j e c t o f a s p e c i a l s t u d y a n d t h e e v e n t w a s f o u n d v e r y r e m o t e / 2 5 / . A b r e a k a g e o f t h e c o p p e r c a n i s t e r s d u e t o i n t e r n a l o v e r p r e s s u r e a s a r e s u l t o f h e l i u m p r o d u c t i o n i s n o t e x p e c t e d t o p c c u r f o r a t l e a s t m i l l i o n s o f y e a r s .
IAEA-SM-243/5S 487
. . . 2T h e p r o b a b i l i t y o f a m e t e o r i t e h i t t i n g a g i v e n a r e a o f 1 kma n d c r e a t i n g a c r a t e r w i t h a d i a m e t e r o f a b o u t 1 km i s o f t h e o r d e r o f 10~ -L2 _ 1 0 - 1 3 p e r y e a r , a c c o r d i n g t o H a r tm a n / 2 6 / .
T h e g e o l o g i c a l s t a b i l i t y o f t h e F e n n o s c a n d ia n r o c k f o r m a t i o n a n d t h e f r e q u e n c i e s o f e a r t h q u a k e s a n d d i s p la c e m e n t s h a v e b e e n a n a ly s e d i n m u c h d e t a i l w i t h i n t h e KBS p r o j e c t a n d s e v e r a l t e c h n i c a l r e p o r t s h a v e b e e n i s s u e d . A s u m m a ry c a n b e f o u n d i n / 2 / . T h e m o s t p r o m i s i n g w a y t o a n a l y s e t h e p r o b a b i l i t y o f d i s p la c e m e n t s i s b y s t u d y i n g t h e f r e q u e n c y o f d i s p la c e m e n t s i n b a r e r o c k w a l l s . I t h a s b e e n e s t i m a t e d u n d e r c e r t a i n a s s u m p t io n s f o r o n e f o r m a t i o n t h a t o n e c a n i s t e r i n e v e r y 2 8 m i l l i o n y e a r s w o u ld b e h i t b y a f r a c t u r e m o v e m e n ts i n e x c e s s o f 3 cm / 2 / . F o r t h e t im e b e in g i t c a n n o t b e e x c lu d e d t h a t s u c h m o v e m e n t w i l l i m p a i r c a n i s t e r i n t e g r i t y a n d a l s o i n c r e a s e t h e p e r m e a b i l i t y l o c a l l y .
F o r t h e H LW , t h e l e a c h d u r a t i o n o f t h e g l a s s a f t e r s u c h a n e v e n t i s e x p e c t e d t o r e m a in a t t h e 3 0 0 0 0 y e a r l e v e l . F o r u r a n iu m d i o x i d e a m in im u m d i s s o l u t i o n t im e o f 5 0 0 0 0 y e a r s , b a s e d o n l e a c h t e s t s w i t h p r a c t i c a l l y u n l i m i t e d v o lu m e s o f w a t e r , s e e m s a r e a s o n a b l y c o n s e r v a t i v e a s s u m p t i o n . 1 0 % o f t h e i o d i n e - 1 2 9 i n v e n t o r y i s h o w e v e r a s s u m e d t o b e r e l e a s e d w i t h i n 1 0 0 0 y e a r s .
I f i t i s f u r t h e r a s s u m e d t h a t 1 0 c a n i s t e r s h a v e l o s t t h e i r i n t e g r i t y a n d t h e w a t e r t r a n s p o r t t im e i s l o w e r e d t o 1 0 0 y e a r s , a m a x im u m i n d i v i d u a l d o s e r a t e o f a b o u t 0 . 0 0 6 m r e m / y e a r i s o b t a i n e d f r o m i o d i n e - 1 2 9 1 0 0 y e a r s a f t e r s u c h a n e v e n t , a n d a b o u t 0 . 2 m r e m / y e a r f r o m r a d iu m - 2 2 6 a f t e r 2 0 0 0 0 0 y e a r s p l u s 0 . 2 m r e m / y e a r f r o m p l u t o n i u m - 2 3 9 T h e s e r e s u l t s a r e b a s e d o n r e t e n t i o n f a c t o r s a s o f s e t ' b ’. T h e v a l u e f o r p l u t o n i u m - 2 3 9 i s a l s o a d j u s t e d f o r e a r l y i n f l o w d u e t o f i s s u r e w i d t h d i s t r i b u t i o n . O t h e r w i s e p lu t o n i u m - 2 3 9 w o u ld b e n e g l i g i b l e .
I n c o n c l u s i o n , a s a r e s u l t o f t h e u n l i k e l y e v e n t t r e a t e d , t h e r i s k f o r i n d i v i d u a l s i s i n s i g n i f i c a n t c o m p a r e d t o o t h e r r i s k s . T h e c o l l e c t i v e d o s e r a t e s w i l l h o t i n c r e a s e s i g n i f i c a n t l y d u e t o t h e r o c k d i s p l a c e m e n t s e v e n t .
1 1 . C O L L E C T IV E DOSES
T h e g l o b a l c o l l e c t i v e d o s e r a t e a n d t h e i n t e g r a l o v e r a c e r t a i n t im e a r e t h e p r o p e r m e a s u r e s f o r t h e c a l c u l a t i o n o f u p p e r l i m i t s f o r t h e t o t a l h e a l t h im p a c t o v e r t h e t im e p e r i o d c h o s e n .
T h e g l o b a l c o l l e c t i v e d o s e r a t e s , f r o m r e p o s i t o r i e s o f t h e t y p e e n v i s a g e d i n KBS i s e x p e c t e d t o b e lo w i n t h e f u t u r e . F o r a w id e r a n g e o f c o n d i t i o n s t h e m a x im u m a n n u a l d o s e r a t e w i l l s t a y w i t h i n 1 0 - 1 0 0 m a n r e m / y e a r , w h i c h m e a n s a b o u t 0 . 0 2 - 0 . 2 m a n r e m /M W ( e ) a i n t e g r a t e d o v e r t h e m a x im u m 5 0 0 y e a r s i n t h e f u t u r e . T h i s i s w e l l b e lo w t h e p r o p o s e d 1 m a n r e m /M W ( e ) a l i m i t f o r t h e w h o le f u e l c y c l e .
F o r s p e n t f u e l , r a d iu m - 2 2 6 a n d i o d i n e - 1 2 9 a r e t h e p r e d o m i n a n t n u c l i d e s . T a b le V I I s h o w s t h e m a x im u m c o l l e c t i v e d o s e r a t e s f o r t h e m a in c a s e s . A s c a n b e s e e n f r o m t h e t a b l e , t h e t o t a l c o l l e c t i v e d o s e r a t e s a r e n o t p a r t i c u l a r l y d e p e n d e n t o n t h e t y p e o f p r i m a r y r e c i p i e n t .T h i s i s d u e t o t h e d o m in a n t c o n t r i b u t i o n f r o m r a d iu m - 2 2 6 a n d i o d i n e - 1 2 9 ,

488 DEVELL et al.
TABLE VII. MAXIMUM COLLECTIVE DOSE RATES FROM DISPOSAL OF
HLW AND SPENT FUEL
S c e n a r io s a n d M a x im u m c o l l e c t i v e d o s e r a t e s ( m a n ï e m / y e a r )p r e d o m in a n t R e c i p i e n t sn u c l i d e s I n l a n d
W e l l o rC o a s t a l z o n e o f
l a k e t h e B a l t i c S e a
HLWR e f e r e n c e s c e n a r i o T c - 9 9 4 7C s - 1 3 5 4 4T h - 2 2 9 2 -N p - 2 3 7 1 1
S p e n t f u e l R e f e r e n c e s c e n a r i o 1 - 1 2 9 17 17R a - 2 2 6 15 3P a - 2 3 1 1 ..4 0 . 0 2
a )P e s s i m i s t i c c a s e R a - 2 2 6 6 5 9T h - 2 2 9 1 8 0 . 61 - 1 2 9 17 1 7P a - 2 3 1 9 0 . 1P u - 2 4 2 17 0 . 0 2
a ) W a t e r t r a n s p o r t t im e 4 0 0 y e a r s a n d r e t a r d a t i o n f a c t o r s a s o f s e t 'b * .
w h ic h a r e e a s i l y m i g r a t i n g n u c l i d e s . F o r so m e o t h e r n u c l i d e s t h e d o s e w i l l b e s e v e r a l o r d e r s o f m a g n i t u d e l o w e r i f t h e B a l t i c i s t h e p r i m a r y r e c i p i e n t . T h i s i s d u e t o t h e f a c t t h a t t h e s e n u c l i d e s w i l l s t a y i n t h e r e g i o n a l a r e a w h e n d i s p e r s e d t o g r o u n d o r s u r f a c e w a t e r .
1 2 . C O N C LU D IN G REMARKS
T h e f a c t o r s i n f l u e n c i n g f u t u r e i n d i v i d u a l d o s e r a t e s a r i s i n g f r o m a r e p o s i t o r y i n c r y s t a l l i n e r o c k a n d c o n t a i n i n g HLW o r s p e n t f u e l c o r r e s p o n d in g t o 3 • 1 0 ^ M W (e )a h a v e b e e n a n a ly s e d i n so m e d e t a i l . T h i s i s i n c o m p l i a n c e w i t h t h e IC R P i n d i v i d u a l d o s e l i m i t a t i o n c o n c e p t . D o s e r a t e s o f 1 0 m r e m / y e a r o r m u c h l o w e r a r e e x p e c t e d i n t h e m o s t e x p o s e d c r i t i c a l g r o u p v e r y f a r i n t h e f u t u r e . E v e n e x t r e m e v a l u e s o f p a r a m e t e r d a t a d o n o t y i e l d a l a r m i n g d o s e r a t e s .
T h e t o t a l c o l l e c t i v e d o s e s a r i s i n g d u e t o r e l e a s e s f r o m t h e r e p o s i t o r y h a v e a l s o b e e n e v a l u a t e d a n d f o u n d n o t v e r y d e p e n d e n t o n c o n d i t i o n s . F o r s p e n t f u e l i o d i n e - 1 2 9 a n d r a d iu m - 2 2 6 w i l l g o v e r n t h e m a x im u m d o s e r a t e , w h ic h w i l l b e i n t h e o r d e r o f 1 0 - 1 0 0 m a n r e m / y e a r . F o r HLW, d o s e r a t e s a r e e v e n l o w e r . T h e r e w i l l b e n o r i s k o f r e c e i v i n g h i g h i n d i v i d u a l d o s e r a t e i n t h e f u t u r e o n a r e g i o n a l o r g l o b a l s c a l e a s a r e s u l t o f m a n y p o t e n t i a l l y i n t e r f e r i n g r e p o s i t o r i e s o f t h a t t y p e w h i c h w e r e s u b j e c t t o t h e a n a l y s i s .
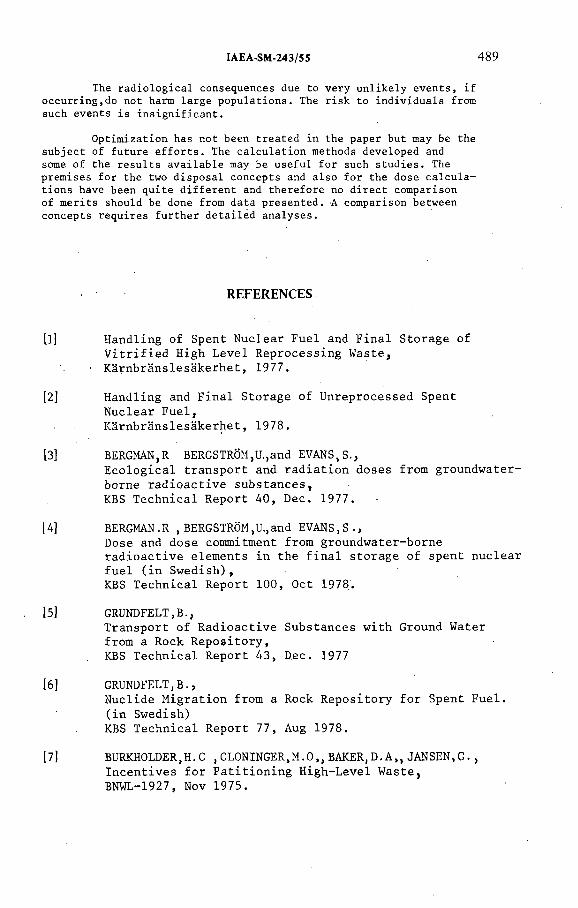
IAEA-SM-243/5 5 489
T h e r a d i o l o g i c a l c o n s e q u e n c e s d u e t o v e r y u n l i k e l y e v e n t s , i f o c c u r r i n g , d o n o t h a r m l a r g e p o p u l a t i o n s . T h e r i s k t o i n d i v i d u a l s f r o m s u c h e v e n t s i s i n s i g n i f i c a n t .
O p t i m i z a t i o n h a s n o t b e e n t r e a t e d i n t h e p a p e r b u t m a y b e t h e s u b j e c t o f f u t u r e e f f o r t s . T h e c a l c u l a t i o n m e th o d s d e v e lo p e d a n d so m e o f t h e r e s u l t s a v a i l a b l e m a y b e u s e f u l f o r s u c h s t u d i e s . T h e p r e m is e s f o r t h e t w o d i s p o s a l c o n c e p t s a n d a l s o f o r t h e d o s e c a l c u l a t i o n s h a v e b e e n q u i t e d i f f e r e n t a n d t h e r e f o r e n o d i r e c t c o m p a r is o n o f m e r i t s s h o u ld b e d o n e f r o m d a t a p r e s e n t e d . A c o m p a r is o n b e t w e e n c o n c e p t s r e q u i r e s f u r t h e r d e t a i l e d a n a l y s e s .
REFERENCES
[1] Handling of Spent Nuclear Fuel and Final Storage of Vitrified High Level Reprocessing Waste,
• Karnbranslesakerhet, 1977.
[2] Handling and Final Storage of Unreprocessed SpentNuclear Fuel,Karnbranslesakerhet, 1978.
[3] BERGMAN,R BERGSTROM,U,,and EVANS, S.,Ecological transport and radiation doses from groundwater- borne radioactive substances,KBS Technical Report 40, Dec. 1977.
14] BERGMAN.R , BERGSTROM,U., and EVANS,S.,Dose and dose commitment from groundwater-borne radioactive elements in the final storage of spent nuclear fuel (in Swedish),KBS Technical Report 100, Oct 1978.
[5] GRUNDFELT,В.,Transport of Radioactive Substances with Ground Water from a Rock Repository,KBS Technical Report 43, Dec. 1977
[6] GRUNDFELT,B.,Nuclide Migration from a Rock Repository for Spent Fuel, (in Swedish)KBS Technical Report 77, Aug 1978.
[7] BURKHOLDER,H.С ,CLONINGER.M.0,, BAKER,D.A,, JANSEN,G .,Incentives for Patitioning High-Level Waste,BNWL-1927, Nov 1975.
[8]
[91
[10]
[11]
112]
И З ]
НА]
115]
[16]
490
[17]
ALLARD,В , KIPATSI,H,, RYDBERG,J- >Sorption of Longlived Radionuclides in Clay and Rock (in Swedish),KBS Technical Report 55, Oct 1977.
A L L A R D , В j K I P A T S I j H , T O R S T E N F E L T , В.,
Sorption of Longlived Radionuclides in Clay and Rock,Part 2 (in Swedish),KBS Technical Report 98, April 1978.-
N E R E T N I E K S ,I.,
Retardation of Escaping Nuclides from a Final Depository, KBS Technical Report 30, Sept 1977.
Recommendations of the International Commission on Radiological Protection,ICRP publication 26, 1977.
B E L L ,M . J .jORIGEN - the ORNL Isotope Generation and Depletion Code, ORNL-4628, May 1973.
K J E L L B E R T , N . A .
Radionuclide Inventories in Spent Fuel and High-Level Waste from a PWR Calculated with ORIGEN (in Swedish),KBS Technical Report 01, April 1977.
EKBERG.K , KJELLBERT,N. A. and 0LSS0N.G.,Decay Heat Studies for KBS. Part 1, Literature Review. Part 2, Calculations, (in Swedish),KBS Technical Report 07, April 1977.
K J E L L B E R T , N. A.,
Radionuclide Inventories in Spent LWR Fuel and in High-Level Waste from Recycling of Plutonium in PWRs (in Swedish),KBS Technical Report 111, Aug 1978.
K J E L L B E R T , N. A. ,
Neutron-induced Activity in Fuel Element Construction Materials (in Swedish),KBS Technical Report 105, March 1978.
Final Generic Environmental Statement on the Use of Recycle Plutonium in Mixed Oxide Fuel in Light Water Reactors, Vol 2,NUREG-0002, Aug 1976.
DEVELL et al.

IAEA-SM-243/55 491
Copper as an encapsulation material for unreprocessed nuclear waste - evaluation from the viewpoint of corrosion. Final Report; The Swedish Corrosion Research Institute and its reference group,KBS Technical Report 90, March 1978.
LAUDE,F.,Le verre comme premiere barrière pour le stockage à long terme de déchets de haute activité,Risk Analysis and Geologic Modelling in Relation to the Disposal of Radioactive Wastes into Geological Formations; Proceedings of a workshop organized jointly by OECD-NEA and CEC at the JRC, Ispra, May 23-27 1977.
BLOMQVIST, G . ,Leaching of French, English and Canadian glass containing high-level waste (in Swedish),KBS Technical Report 08, May 1977.
NERETNIEKS,I. ,Transport of Oxidants and Radionuclides through a Clay Barrier,KBS Technical Report 79, Febr 1978.
EKLUND, U-B , FORSYTH,R. jLeaching of Irradiated U02~fuel (in Swedish),KBS Technical Report 70, Febr 1978.
HAGGBLOM,H. jCalculations of Nuclide Migration in Rock and Porous Media Penetrated by Water,KBS Technical Report 52, Sept 1977.
STOKES,J jTHUNVIKjR . jTheoretical Studies of Ground Water Movements (in Swedish),KBS Technical Report, May 1978.
BEHRENZ.P , HANNERZ, K.,Criticality in a Spent Fuel Repository in wet crystalline rock, KBS Technical Report 108, June 1978.
HARTMANN, W.K.,Terrestrial and Lunar Flux of Large Meteorites in the Last Two Billion Years,Icarus k , 157-65 (1965).
ADAMS,N. , HUNTj B.W , REISSLAND, J. A.,Annual limits of intake of radionuclides for workers ,NRPB-R82, Oct 1978 .
492 DEVELL et al.
DISCUSSION
G.E. COURTOIS: You use a one-dimensionál GETOUT modelwhich is
derived from the Battelle Institute model. But at present Battelle Institute is
using a three-dimensional model (MMT). Have you used a three-dimensional
model? If you have, does this appreciably change the doses reaching the
biosphere? . - .
L. DEVELL: In dealing with nuclide migration.for purposes of the safety
analysis we used the one-dimensional model GETOUT for reasons connected
with our time schedule. However, there are two- and three-dimensional models
available for the analysis of water movement, and work is under way to develop
more advanced models for predicting nuclide migration. These models will be
useful tools for more detailed analysis. I do not think the models themselves;,
will change dose rates very much. The parameter data are also important.
G.E. COURTOIS: Apparently you have not considered inhalation hazards
although these would seem to be considerable at the CEC (see paper
IAEA-SM-243/161 ).
L. DEVELL: We have indeed taken inhalation into account as one of the
exposure pathways but have not found it to be significant.
W. BECHTHOLD: It appeared from your presentation that the dose to
man would be very low even under very severe conditions. Some time ago,
however, six out of seven Swedish experts recommended that radioactive wastes
should not be disposed of in Swedish bedrock. What was the reason for this
negative recommendation?
L. DEVELL: The geological experts had been asked by the Nuclear
Inspectorate to report on whether there was sufficient proof for the existence
of a rock formation with properties which fulfilled the requirements óf the
safety analysis. The majority were'not quite satisfied on this particular point.
There were no objections to the safety analysis. Mr. Nilsson from KBS would,
I am sure, like to explain this matter in detail. .
L.B. NILSSON: The question which the consultants to the Swedish Nuclear
Inspectorate had to answer was whether it had been shown that there was in
Sweden a rock formation with the required properties which was big enough ■
to accommodate a certain amount of waste. The majority of the consultants’
group gave a negative reply. The Inspectorate, which had to make a
recommendation to the Government, based its judgement on more extensive ,
material than just the statement of the majority of the consultants’, group.
The majority of the Inspectorate’s board came to the conclusion that the reports
from KBS were in accordance with the requirements of the Swedish “Stipulation
Law”. On 21 June the Government, on the recommendation of the Inspectorate,
took its decision. This means the Government considered that it had been shown
that high-level waste could be handled and finally disposed of in a safe way in
Swedish bedrock.
IAEA-SM-243/S5 493
C.N. MURRAY: Have you taken into account the fact that inorganic
chemical forms of actinides in groundwaters (for example, Pu (VI) under high
carbonate concentrations) other than those proposed (for example, Pu (VI))
might be much more capable of crossing the human intestinal tract (barrier) than
other plutonium forms?
If your calculations were undertaken for these species of more mobile
character, how would your listing of radionuclides of importance for exposure
be affected?
L. DEVELL: There are some recent research results showing that the
uptake of neptunium by blood from the gastro-intestinal tract may be higher
than was thought earlier. I do not know of any new figures for plutonium. To
the best of my knowledge, both neptunium and plutonium will however be
retained in the rock owing to the high retardation factors.
W.R. BURTON: Would you agree that the source of 226Ra is not the fission
process but decay of uranium? In the case of vitrified waste in the United King
dom, we have calculated that the 226Ra content of the repository is similar to that
of the granite in the region of the repository.
L. DEVELL: The source of 226Ra dealt with in the paper is the decay of
uranium and thorium in the high-level waste and spent fuel. In drinking water,
for example, I agree that natural concentrations due to the uranium content of
granite could be higher than those arising from the waste.


IAEA-SM-243/100
SITE DATA AVAILABILITY AND SAFETY ASSESSMENT METHOD DEVELOPMENT FOR UNDERGROUND WASTE REPOSITORIES
V. HERRNBERGER
Swiss Federal Institute for Reactor Research,
Würenlingen
J.F. SCHNEIDER, J. GASSMANN
Motor-Columbus Consulting Engineers Inc.,
Baden, Switzerland
Abstract
SITE DATA AVAILABILITY AND SAFETY ASSESSMENT METHOD DEVELOPMENT FOR UNDERGROUND WASTE REPOSITORIES.
The status of the safety assessment method under development for underground solid waste disposal systems is briefly described. Examples of a systematic identification and a preliminary, still qualitative, analysis of the disruptive phenomena are given. To classify the • importance of processes and data, which determine the maximum individual dose, a sensitivity analysis is performed for the case of a slow leaching process of high-level waste disposal in the molasse formation of the Swiss alps by water on the basis of the scarcely available site and sorption data. The importance of the leaching process, convective transport and dilution process is demonstrated for simple decay chains during nuclide migration.' Radioactive elements, which determine the maximum individual dose, are Tc, I, C, Ni, Sm, Sn, Np, Cm, U, Pu. Further development and research are recommended in the fields of mathematical modelling and in obtaining nuclide sorption data.
1. INTRODUCTION AND DESCRIPTION OF THE SAFETY ASSESSMENT
METHOD
Risk analysis is an important factor in the design of a waste disposal system.
The results of the analysis are applied in two different phases:
to prepare criteria to evaluate alternatives for the selection of sites, host rocks,
and major design features;
to demonstrate that there are no inadmissible risks from a waste repository.
Risks are commonly expressed as the product of the anticipated frequency
of accidental release and the radiological consequences to individuals and
populations. The calculation of risks from a waste disposal system is often
difficult because much essential data needed for the quantification of disruptive
495
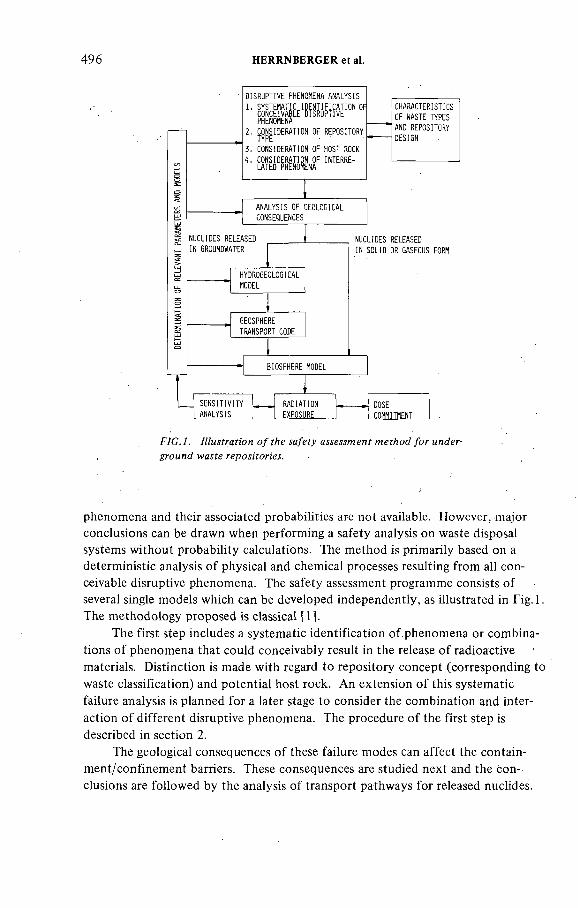
496 HERRNBERGER et al.
FIG .l. Illustration of the safety assessment method for under
ground waste repositories.
phenomena and their associated probabilities are not available. However, major
conclusions can be drawn when performing a safety analysis on waste disposal
systems without probability calculations. The method is primarily based on a
deterministic analysis of physical and chemical processes resulting from all con
ceivable disruptive phenomena. The safety assessment programme consists of
several single models which can be developed independently, as illustrated in Fig. 1.
The methodology proposed is classical [1].
The first step includes a systematic identification of phenomena or combina
tions of phenomena that could conceivably result in the release of radioactive
materials. Distinction is made with regard to repository concept (corresponding to
waste classification) and potential host rock. An extension of this systematic
failure analysis is planned for a later stage to consider the combination and inter
action of different disruptive phenomena. The procedure of the first step is
described in section 2.
The geological consequences of these failure modes can affect the contain
ment/confinement barriers. These consequences are studied next and the con-,
elusions are followed by the analysis of transport pathways for released nuclides.

IAEA-SM-243/100 497
It can.be expected that the nuclide migration of dissolved nuclides in water
will be the most critical question, and whether solid and gaseous transport is
possible too.
The development of a hydrogeological model and a geosphere transport
code are necessary to calculate the nuclide migration in the geologic layers. A
description of these models and a presentation of preliminary results from a
sensitivity analysis for the case of waste dissolution by water is given in section 3.
The biosphere model describes the environmental behaviour of radionuclides
as the consequence of the different release scenarios and calculates radiation doses.
Furthermore, relevant parameters and models will be evaluated in a
sensitivity analysis by varying the input parameters. Those items such as input
data and models of the safety assessment method which need improvement
will be identified for further theoretical and experimental investigation.
Finally, the results from the biosphere model will be compared with the
dose commitment. The waste disposal system, i.e. the natural and artificial barriers
can be modified until the radiation exposure lies within the specified limits.
2. SYSTEMATICS OF POTENTIAL DISRUPTIVE PHENOMENA FOR
UNDERGROUND NUCLEAR SOLID WASTE REPOSITORIES
Since in the Swiss project for radioactive waste disposal in geological
formations the repository concept, site and host rock are still in evaluation, a
systematic identification and analysis of the disruptive phenomena was chosen
for each repository type and potential host rock. The question is as to how far
a site-independent risk analysis can be performed at the present time and which
method should be chosen. In the Swiss concept, repositories of type В are fore
seen for medium-active waste with deposit time of up to 103 years situated in
rock caverns at a maximum depth of 600 m below ground level or behind rock
cliffs, respectively. Repositories of type С will be used for high-level nuclear waste
and situated in boreholes 600 m to 2500 m below ground level. Predictions of
potential natural disruptive phenomena for over 104 years would be desirable,
but only predictions up to 104 years are meaningful, as indicated in Table I.
The Swiss concept is discussed in Ref.[ 10].
From the entire catalogue of disruptive phenomena, only natural ones were
selected to be presented in Table I. Every phenomenon was evaluated according
to the relevant type of disposal system. A dash signifies no influence of the
phenomena on the repository concept. P means recognition as being a problem
which has to be further, analysed for this type of disposal system. R means
dependence in the disposal site, G stands for dependence on the type of host rock.

498 HERRNBERGER et al.
TABLE I. POTENTIAL NATURAL DISRUPTIVE PHENOMENA FOR
UNDERGROUND WASTE REPOSITORIES
Disposal system type
В (< 1 0 3 J) С « 1 0 4 J) C O 1 0 4 J)
Natural processes
( 1 ) Climatic changes - P P
(2) Sea level uprising - - P
(3) Aquifer flux variations P P P
(4) Weathering, leaching G G P
(5) Erosion, karst R G P
(6) Diagenesis/metamorphism - - P
(7) Growth of glaciers R R P
(8) Tectonic forces R - P
(9) Magmatic intrusions - - P
(10) Diapyrism (evaporites) - G P
(11) Volcanic extrusions
Natural events
R P
(1) Earthquakes P P P
(2) Fault ruptures P P P
(3) Landslides P - -
(4) Volcanic eruptions - G P
(5) Meteorite impacts P P P
(6) Flooding R
P: Recognized as being a problem R: Dependent on repository site G: Dependent on type of host rock —: No impact on this repository concept
For explanation of repository concepts see text.
For Table II, the example of strong earthquakes as a high potential dis
ruptive phenomenon was selected to show the impact on different repository
concepts and host rocks. The geological consequences of the single event are

IAEA-SM-243/100 499
TABLE II. POTENTIAL DISRUPTIVE PHENOMENA: STRONG
EARTHQUAKES’ IMPACT ON DIFFERENT REPOSITORY CONCEPTS AND
HOST ROCKS
Anhydrite
В (< 1 0 3 a): Formation of new fault ruptures
New water circulation paths
Self-healing through gypsum
Exposure to open air possible on extreme topography
С (<104 a): Formation of new fault ruptures
Formation o f new water circulation paths probably hindered by pressure of overlaying rock formations
Viscoplastic behaviour of anhydrite probable
Claystones, marls
В (< 1 0 э a): Formation o f thin fractures
Increase of permeability possible
C (< 1 0 4 a): Viscoplastic behaviour of clay
New water circulation paths unlikely
Intrusive rocks
В (< 1 0 3 a): Formation of new fault ruptures and new water circulation paths
С (< 1 0 4 a): Formation o f new fracture systems:Subsequent partial closure through pressure of rock formations possible
Host rock above water table, covered by impervious formation
В (< 1 0 3 a): Formation of thin fractures in the impervious layer possible
Penetration of water into host rock possible
estimated and described here. This analysis should be performed for all dis
ruptive phenomena, natural as well as man-caused.
Then, interrelated disruptive phenomena (e.g. aquifer flux variation and
strong erosion, or meteorite impact and flooding) will be considered.

500 HERRNBERGER et al.
TABLE III. REFERENCE PATHWAYS IN THE MOLASSE FORMATIONS
R e p o s i to r y
ty p e С С В
T im e o f le a c h
in c id e n t (a ) 10 0 100 1 0 0
L e a c h t im e (a ) 3 0 0 0 0 3 0 0 0 0 12
P a th w a y “S a n d 1 ” “L im e ” “S a n d 2 ”
L a y e r M arl s e q u e n c e H R
S a n d
s to n e
M arl M arl
H R
L im e
s to n e
M arl
H R
S a n d - M arl
s to n e
L a y e r
th ic k n e s s (m ) 2 0 0 5 0 0 4 0 0 2 0 0 2 X 1 0 4 2 0 0 2 0 0 2 0 0
W ate r
v e lo c i ty ( m / d ) 0 .0 0 1 5 0 .0 0 0 2 0 .0 0 1 5 0 .0 0 1 5 1 .0 0 .0 0 1 5 0 .0 0 0 2 0 .0 0 1 5
D if f u s io n /d is p e rs io n
( c m 2/m in ) 0 .0 0 0 6 0 .0 0 0 6 3 0 0 0 .0 0 0 6
G ro u n d w a te r
s tre a m ( m 3/a ) 2 .5 X 1 0 6
M ID ( m r e m /a )
a b o u t y e a r
1.5
(11 0 0 0 )
4 .4
( 2 5 0 0 )
S 1 0 " 8
( 1 0 7)
H R = H o s t ro c k f o r re p o s i to ry
3. A PRELIMINARY SENSITIVITY ANALYSIS- BACKGROUND AND
DESCRIPTION
3.1. General
Available data on potential repository sites, necessary as input for safety
assessment, are rather lacking. The safety assessment method itself, particularly the
hydrogeological model and the geosphere transport code, is still under
development.
IAEA-SM-243/100 501
A matter of primary interest is the maximum individual dose rate (MID)
received at any time during the existence of the repository by any member of
the population concerned. A preliminary sensitivity analysis of MID was
performed for repositories of type С in the molasse formations of the Swiss Alps.
A rather simplified version of the method of Fig. 1 was used.
3.2. Reference geological formations
The assumed potential pathways of the radionuclides from the repositories
to the groundwater stream of the biosphere, listed in Ref.[2] for the molasse of
the Swiss Alps, are indicated in Table III. The layer sequences and thicknesses
remained unchanged for the analysis. The host rock for all configurations is marl.
The pathway in the limestone is along the layer and is not identical with the
layer thickness.
3.3. Nuclide inventories
100 m3 vitrified HAW was assumed for type C, corresponding to 40 GW(e)-a
integrated electrical power until the year 2000. The nuclide composition was
chosen from Ref.[3]. Activity from Cs, Sr, Co and short-lived activation products
was assumed as 3 X 10⁴ Ci for the MAW at year 2000 solidified in concrete and
bitumen [4].
3.4. Disruptive phenomenon analysis
The analysis (Fig. 1 ) was restricted to the important case of deep water
intrusion mto the repository, damaged canister casing, leaching of radioactive
elements from the waste matrix and their dispersal by water movement in and
through the different formations up to surface groundwater streams. This type
of disruptive phenomenon is a natural process of type 4 from Table I, and its
analysis is purely deterministic.
3.5. Geological consequences
These are disregarded as the geology is not altered by this process.
3.6. Hydrogeological model
Table III was taken from Ref.[2]. Three cases were distinguished:
Repository type C, with burial of waste in marl in a depth of 1100 m over
laid by 200 m marl, 500 m sandstone and 400 m marl. Ascending groundwater
from below is assumed to pass vertically through the deposit, reaching the surface.

502 HERRNBERGER et al.
Repository type C, using the same assumptions as above with the exception
that vertically descending waters passing through the deposit are reaching the
biosphere 20 km away via an inclined limestone lying 200 m below the deposit.
Repository type B, situated in marl 600 m below surface, overlaid by
200 m marl, 200 m sandstone and a final 200 m of marl. Water is assumed to
pass through the deposit from below, ascending vertically to the surface.
The model is supposed not to be influenced by the waste heat or by sealing
failures of the repository. The repository is assumed to be filled and sealed in
the year 2000.
3.7. Geosphere transport model
This uses as the source of radio nuclides the leaching process which begins
when the canister is damaged (e.g. by corrosion) and the matrix is free for water
access. This is termed the time o f leach incident. The leaching is approximated
by a linear dissolution process, characterized by a ‘leach time’ of complete dis
solution of the matrix in the water flow [5]. To be conservative, the leach time
for the concrete matrix was used also for the bitumen matrix of the MAW. The
dispersal of radionuclides in and through the geological formation to the ground
water streams at the surface is influenced by the processes of convection, dis
persion/diffusion, sorption, radioactive decay and dilution; computerized models
based on GETOUT [3] for homogeneous soil columns and multiple decay chains
and HETRAT [6] for heterogeneous columns and single chains were applied. The
GETOUT-type calculations were restricted to single decay chains because some
problems are still experienced with the handling of higher chains. The geometry
of the calculations had to be simplified to one-dimensional slabs for both codes.
Due to the low water velocities, pure diffusion was considered in the marl and
sandy layer. Dispersion was limited to the limestone layer (Table III).
To describe the sorption of radioactive elements, the retention factors of
about 30 radioactive elements in the HAW for sand, marl and limestone are
necessary. Except for the well-known western desert soil set [3] and a bentonite/
quartz mixture [7], the available data for marl and lime were scarce.
Therefore, the first set was used for sandstone and the second for marl.
For limestone, only six elements were found with measured retention. To be
pessimistic, the lowest values were taken (Table IV). For unknown retention,
no retention was assumed. The total discharge rate from the repository is
attenuated by the above-mentioned processes, before entering into and being
diluted by the groundwater streams or reservoirs of the biosphere. In most of
the safety assessment studies [1,3,5], the dilution of the contaminant deep
water is one of the crucial points, leading to low doses for man. For the standard
case, a minimum value of a typical groundwater stream in glacial sediments was
chosen (Table III).
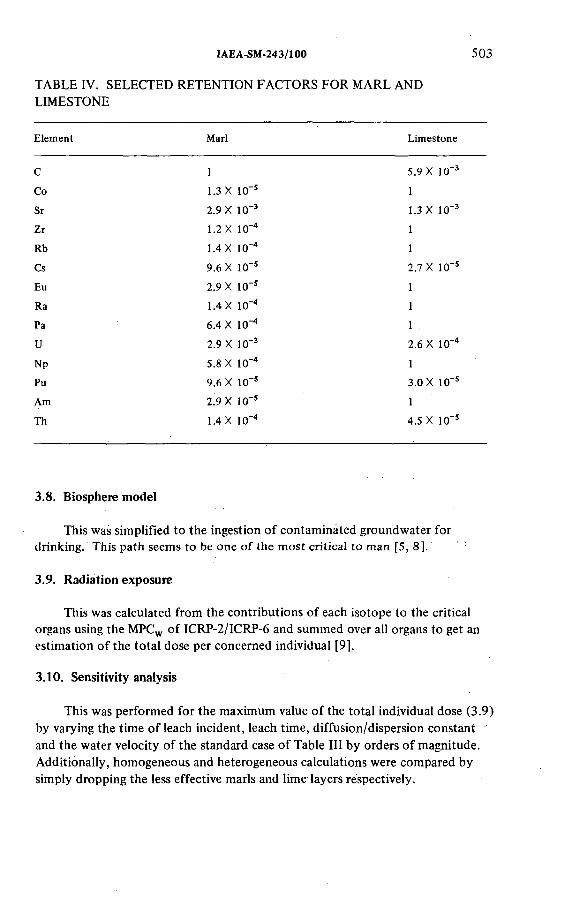
IAEA-SM-243/100 503
TABLE IV. SELECTED RETENTION FACTORS FOR MARL AND
LIMESTONE
Element Marl Limestone
С 1 5.9 X 10 '3
Co 1.3 X 1СГ5 1
Sr 2.9 X 1(T3 1.3 X 1СГ3
Zr 1.2 X 10'4 1
Rb 1.4 X 1(T4 1
Cs 9.6 X 10~5 2.7 X 1 0 '5
Eu 2.9 X 10~s 1
Ra 1.4 X 1(T4 1
Pa 6.4 X КГ4 1
U 2.9 X 1(T3 2.6 X К Г4
Np 5.8 X КГ4 1
Pu 9.6 X 10 '5 3.0 X 10 's
Am 2.9 X 1 0 's 1
Th 1.4 X 1(T4 4.5 X 1 0 '5
3.8. Biosphere model
This was simplified to the ingestion of contamináted groundwater for
drinking. This path seems to be one of the most critical to man [5, 8].' 1
3.9. Radiation exposure
This was calculated from the contributions of each isotope to the critical
organs using the MPCW of ICRP-2/ICRP-6 and summed over all organs to get an
estimation of the total dose per concerned individual [9].
3.10. Sensitivity analysis
This was performed for the maximum value of the total individual dose (3.9)
by varying the time of leach incident, leach time, diffusion/dispersion constant
and the water velocity of the standard case of Table III by orders of magnitude.
Additionally, homogeneous and heterogeneous calculations were compared by
simply dropping the less effective marls and lime layers respectively.

504 HERRNBERGER et al.
TI (a )
FIG.2. Dependence o f Maximum Individual Dose (MID) upon Time of
Leach Incident (TIj.
4. MAIN RESULTS AND CONCLUSIONS FROM THE SENSITIVITY
ANALYSIS
4.1. General
The importance of processes and their relevant data which influence the
dispersal of radioactive elements was classified. Conclusions for further
methodological development and experimental investigations were drawn. It is
clear that they are only valid for the investigated molasse formations.
4.2. In the standard case
The maximum individual dose, MID, was found to be 1.5, 4.4 and 10~8mrem/a
for the pathways SAND 1, LIME and SAND 2, respectively (Table III). The very
low dose from the MAW comes from a supposed contamination by 135Cs. The.
dilution may be lower by a factor of 107 in this case, for which a sensitivity
analysis is of little interest.
4.3. The time of leach incident < - <
This has no important effect on MID: a factor of 2 for LIME (Fig.2). There
fore, one may conclude for the analysis of single disruptive phenomena, that
the time of occurrence is less important, particularly if they have a similar
character of a slow process.
4.4. Diffusion/dispersion
The variation of diffusion/dispersion constants by a factor of up to 100 has
no effect on MID. The migration seems to be pure convection for leach times
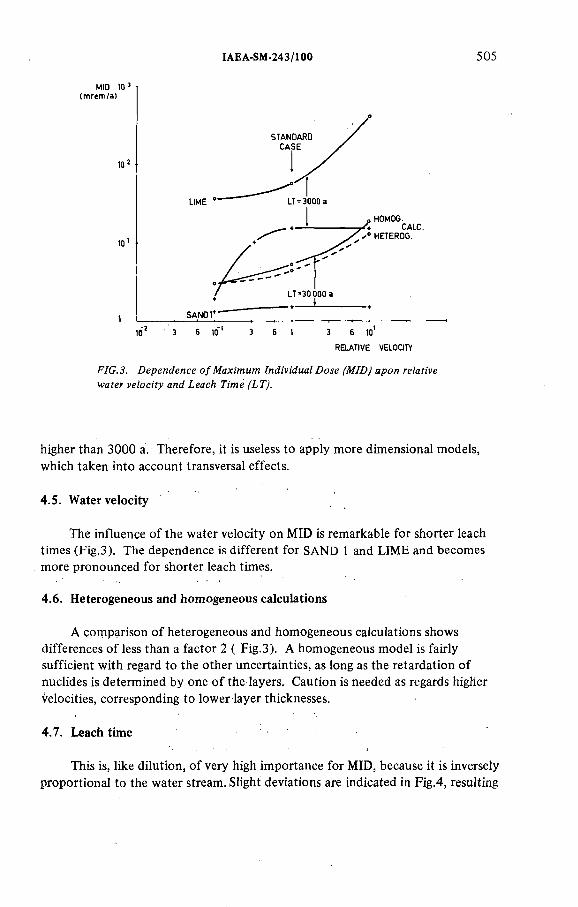
IAEA-SM-243/100 505
RELATIVE VELOCITY
FIG.3. Dependence of Maximum Individual Dose (MID) apon relative
water velocity and Leach Timé (LT).
higher than 3000 a. Therefore, it is useless to apply more dimensional models,
which taken into account transversal effects.
4.5. Water velocity
The influence of the water velocity on MID is remarkable for shorter leach
times (Fig.3). The dependence is different for SAND 1 and LIME and becomes
more pronounced for shorter leach times.
4.6. Heterogeneous and homogeneous calculations
A comparison of heterogeneous and homogeneous calculations shows
differences of less than a factor 2 ( Fig.3). A homogeneous model is fairly
sufficient with regard to the other uncertainties, as long as the retardation of
nuclides is determined by one of the layers. Caution is needed as regards higher
velocities, corresponding to lower layer thicknesses.
4.7. Leach time
This is, like dilution, of very high importance for MID, because it is inversely
proportional to the water stream. Slight deviations are indicated in Fig.4, resulting
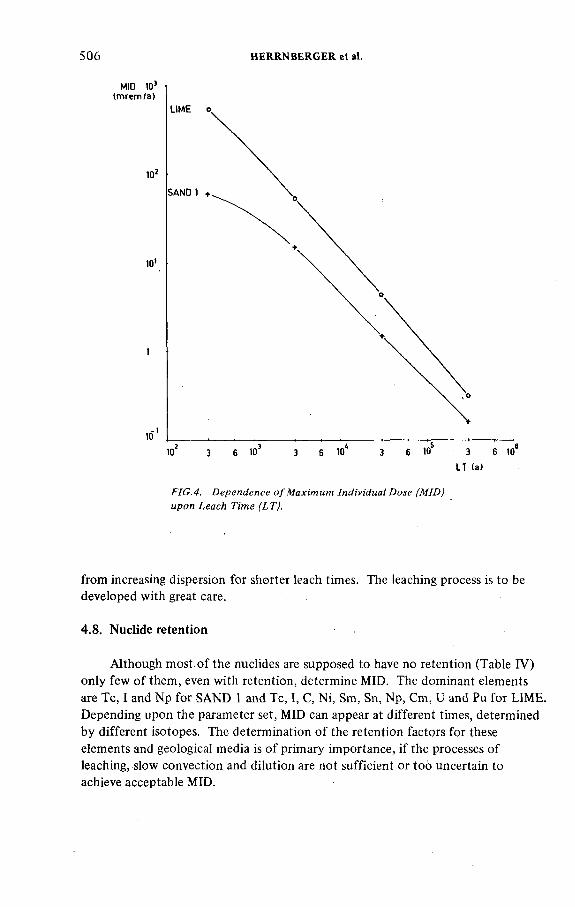
506 HERRN BERGER et al.
FIG.4. Dependence of Maximum Individual Dose (MID)
upon Leach Time (LT).
from increasing dispersion for shorter leach times. The leaching process is to be
developed with great care.
4.8. Nuclide retention
Although most of the nuclides are supposed to have no retention (Table IV)
only few of them, even with retention, determine MID. The dominant elements
are Тс, I and Np for SAND 1 and Тс, I, C, Ni, Sm, Sn, Np, Cm, U and Pu for LIME.
Depending upon the parameter set, MID can appear at different times, determined
by different isotopes. The determination of the retention factors for these
elements and geological media is of primary importance, if the processes of
leaching, slow convection and dilution are not sufficient or too uncertain to
achieve acceptable MID.

IAEA-SM-243/100 507
4.9. Restriction
The preliminary sensitivity analysis is limited to actinide chain decay in
the repository only. Therefore, important contributions to MID may come from
Ra and Th [3, 6, 9] and have to be taken into account in a next step. Additionally,
all other critical pathways and to and through the biosphere have to be included.
4.10. Summary
Crucial prqcesses for the determination of MID are:the leaching of waste,
the convective transport of nuclides in and through the geosphere and the dilution
of contaminant by the groundwater streams. The importance of detailed know
ledge and good mathematical models for deep water and groundwater hydrology
is evident, particularly in view of those nuclides which have not sufficient
retention, as for example Tc and I.
ACKNOWLEDGEMENTS
We should like to thank all those persons who have helped our investigations
by various discussions, particularly the National Co-operative for the Storage
of Radioactive Waste (NAGRA).
REFERENCES
[1 ] BURKHOLDER, H.C., et al., Safety Assessment and Geosphere Transport Methodology for the Geologic Isolation of Nuclear Waste Materials (Proc. Workshop, Ispra, Italy, 1977).
[2] TRIPET, J.-P., Nuklidtransportberechnung. Zusammenstellung hydrogeologischer Grundlagen, Motor-Columbus Consulting Engineers Inc., Baden, Switzerland (1979).
[3] BURKHOLDER, H.C., et al., Incentives for Partitioning High-Level Waste, Battelle Northwest Labs. Rep. BNWL-1927, Richland, USA (1975).
[4] Konzept für die nukleare Entsorgung in der Schweiz, NAGRA/VSE (1978).[5] KARNBRANSLESAKERHET, Handling of Spent Nuclear Fuel and Final Storage of
Vitrified High-Level Reprocessing Waste, Part IV, Safety Analysis, KBS-Report, Sweden (1978).
[6] HADERMANN, J., “Radionuclide Transport through Heterogeneous Media” (Proc. Workshop, Brussels, 1979) (to be published).
[7] ALLARD, B., et al., “Sorption av langlivade radionuklider i lera och berg” , Karnbranslesakerhet Rep. KBS-TR-55 (1977).
[ [8] HILL, M.D., et al., Preliminary Assessment of the Radiological Protection Aspects of Disposal of High-Level Waste in Geologic Formations, National Radiation Protection Board Rep. NRPB-R-69, Harwell (1978).
508 HERRNBERGER et al.
[9] “Ziele für den Schütz von Personen vor ionisierender Strahlung im Bereich von Kern- anlagen”, Richtlinien für Kernanlágen, R-l 1. Kommission für die Sicherheit von Atom- aniagen, Würenlingenl978).
[10] ISSLER, H., et al., these Proceedings, SM-243/160.
DISCUSSION
C. MYTTENAERE: Some of the assumptions made in your work would
seem to be open to question and criticism. I think too much simplification is
dangerous. I should like to underline, for example, the danger of reducing
transport in the biosphere to the intake of contaminated water.
V. HERRNBERGER: I quite agree that simplifications were made, and I
have specified them. That is why the analysis was termed preliminary and why
it has to be supplemented by taking fuller account not only of transport in
the biosphere but also of actinide chains. Besides, there is no point in using
overly refined methods for the biosphere while the migration of radionuclides
in the geosphere and the consequences of the disruptive events for the system of
barriers around the repository remain uncertain and difficult to determine
accurately.

IAEA-SM-243/2S
APPLICATION OF THE RESULTS OF RADIOLOGICAL ASSESSMENTS OF HIGH-LEVEL WASTE DISPOSAL
M.D. HILL, G.A.M. WEBB
National Radiological Protection Board,
Harwell, Oxon.,
United Kingdom
Abstract
APPLICATION OF THE RESULTS OF RADIOLOGICAL ASSESSMENTS OF HIGH-LEVEL WASTE DISPOSAL.
The results of radiological assessments of high-level waste disposal consist of estimates of the probabilities o f occurrence o f events leading to a release of radionuclides to the biosphere and calculated doses to individuals and populations. In this paper it is proposed that these results should be used to derive expected values of the dose to the most exposed individual and the collective dose commitment. These values provide a means o f assessing the risks associated with waste disposal since they combine predicted doses and the probability that these doses will be received. The expected value of the dose to the most exposed individual should be calculated using simple pessimistic assumptions and compared with a criterion for individual risk. The expected value of the collective dose commitment is required for optimization and comparison o f disposal options. It should be calculated using realistic assumptions and parameter values. In order to avoid large uncertainties it will be necessary to. truncate the integration in time. The way in which the results of radiological assessments will be applied has implications for the research required to evaluate disposal options. For example, the introduction o f a criterion for individual risk will lead to greater emphasis on the estimation o f probability and the range o f uncertainty in parameter values. The use of a truncation time in calculating collective dose commitment will result in more attention being paid to potential releases of radionuclides at relatively short times after disposal.
1. Introduction
Several preliminary studies of the radiological protection aspects of disposal of hi^i-level waste have now been carried out (1, 2, 3)» and work towards a comprehensive evaluation of the various disposal options is now underway in many countries. It is therefore an appropriate time to review the rationale used in these studies and to examine its relationship to the requirements of radiological protection.
509

510 HILL and WEBB
The most recent recommendations .of the International Commission on Radiological Protection (iCEP) (1+) may be briefly summarised as follows:
practices should not he adopted unless they are justified;
all doses should be kept as low as is reasonably achievable (ie protection should be optimised);
doses to individuals should not exceed the limits recommended by ICEP.
Calculation of doses1 to individuals and their comparison with the limits recommended by ICRP is therefore only one part of the overall evaluation. For the purposes of optimisation and comparison of disposal options it is necessary to calculate collective dose commitments to populations, since these provide a measure of radiological detriment. To date, the potential collective dose commitments from high-level waste disposal have not been used in any formal examination of the justification for a nuclear power programme. Indeed,, it seems unlikely to the authors that the radiological protection aspects of waste disposal would be an important element in such a justification when weighed against the many other considerations involved. There is of course no question of justifying waste disposal per se; generation of electricity by nuclear fission inevitably involves production of high- level waste and this will eventually have to be disposed of, either as spent fuel elements or after reprocessing. Radiological protection considerations are among the important inputs to evaluating the optimum disposal option even though other factors will enter into the final decision.
In this paper we discuss the application of the results of radiological assessments; we also examine the implication of the ways in which the results will be used for the methods and assumptions used in the calculations. Ve do not deal with the detailed methodology of calculations.
2. Results of Radiological Assessments
Assessments of the potential radiological consequences of high-level waste disposal have three major components. In the first the events and sequences of events and processes
(i)
(Ü )
(iii)
1 Throughout this paper the term “dose” is used for the effective dose equivalent.

IAEA-SM-243/25 511
which could lead to a release of radioactivity into the biosphere are identified. (This is sometimes known as failure mode analysis). The second component consists of the estimation of the probabilities of occurrence of these events and processes. Thirdly,the radiological consequences of a release of radioactivity are evaluated by using mathematical models to calculate the rates of release of radionuclides from the waste, their rates of transport through the environment and the eventual doses to man.
In general the probability of occurrence of any given failure mode-1 varies with time after disposal. In addition the consequences of a release by a particular failure mechanism depend on the time at which the release occurs. The results of a comprehensive assessment should therefore comprise the predicted doses to man arising from each failure mode as a function both of the time at which the release occurs and of the time after release, together with an estimate of the probability that the release will occur, also as a function of time. The derivation and analysis of such a complex series of results clearly poses considerable difficulties; some possible simplifications will be suggested in subsequent sections.
3 . Doses to Individuals
It is generally agreed that a waste disposal method is unlikely to be accepted now if it entails risks to individuals in future generations which are greater than those which are currently considered to be acceptable. The risk associated with disposal of high-level waste has two components: the risk that a release of radionuclides will occur and the risk that the subsequent radiation doses will give rise to deleterious effects. Simple comparison of predicted maximum individual doses with a reference level (for example the current dose limits, natural background or doses from other sources) does not form an adequate criterion since it takes no account of the probability that the doses will be received. Such comparisons will inevitably lead to a conclusion that any disposal method is unacceptable because there is always a finite probability, however low, that an individual will receive a dose above the chosen limit. An appropriate criterion for acceptability must include both components of the risk to individuals.
A criterion for risk to individuals may Ъе formulated mathematically as follows:
H (t) < H for all tev4 ' — о

512 HILL and WEBB
where H (t) = the expected dose rate to the mostev exposed individual at time t.
H = the maximum acceptable expected dose0 rate
H (t) is the sum of the dose rates expected from all the ev4 ' ■failure modes which may occur before time t. •
n t
Hev( t ) = Z / dt1i = 1 0
1 1where P.(t ) = probability per unit time at time, t thatevent i will, lead to a release of radionuclides
-jH.(t,t ) = dose rate to the most exposed individual at
time t due to the release by event i at time t1.
The definition of Hev does not imply that all the events and processes which may lead to a release of radionuclides to the biosphere are independent of each other. However it does assume that all possible release mechanisms can be reduced to a finite number (n) of discrete failure modes whose probabilities of occurrence as functions of time can be estimated.
In order to achieve the objective that the risk.to an individual should not exceed the level corresponding to H0, dose rates to the most exposed persons should be calculated using simple, pessimistic assumptions . Estimates should be made of the range of uncertainty in the parameters used, rather' tháh carrying out excessively detailed calculations. It should also be noted that the definition of Hev as maximum expected individual dose rate is inherently conservative. The individual at greatest risk from one event may be at less than the maximum risk from another event, that is Hj_ and H^ _ -| could represent dose rates to different individuals. However for the purpose of comparison with a risk criterion it is assumed that the maximum dose rates at any particular time from all events are received by the same individual.
The form of risk criterion proposed above could be modified, if required, to take account of the variation of the acceptability of a risk with the magnitude of the consequences
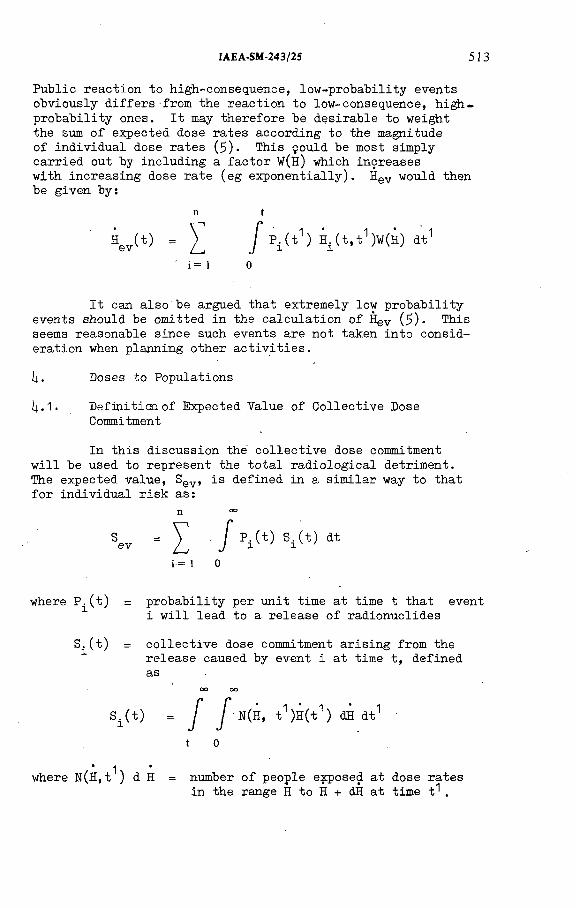
IAEA-SM-243/25 513
Public reaction to high-consequence, low-probability events obviously differs from the reaction to low-consequence, high- probability ones. It may therefore bè desirable to weight the sum of expected dose rates according to the magnitude of individual dose rates (5). This çould be most simply carried out by including a factor W(H) which increases with increasing dose rate (eg exponentially). Hev would then be given by:
n t
Hev(t) = £ J p.(t1) H.(t,t1)w(H) dt1■ i= 1 0
It can also be argued that extremely low probability events should be omitted in the calculation of HeV (5). This seems reasonable since such events are not taken into consideration when planning other activities.
i|. Doses to Populations
Ц.1. Definition of Expected Value of Collective DoseCommitment
In this discussion the collective dose commitment will be used to represent the total radiological detriment. The expected value, Sgv, is defined in a similar way to that for individual risk as:
11 —
Sev = X / Pi ( t ) S i< t ) “
i= 1 0
where P.(t) = probability per unit time at time t that eventi will lead to a release of radionuclides
S.(t) = collective dose commitment arising from therelease caused by event i at time t, defined as
OO OO
s^t) = I I 'N(H, t1)H(t1) (ffl dt1 ■
• 1 •where N(H,t ) d H = number of people eyposed at dose rates
in the range H to H + <ffl at time t .
514 HILL and WEBB
As defined above, the expected collective dose commitment includes all possible events and the resulting doses over all time after disposal. If the collective dose commitment is to provide a firm basis for optimisation and comparison of disposal options it must be evaluated using realistic values of parameters. Oversimplification and the use of conservative parameter values will nullify the usefulness of S^.
The uncertainties in calculating potential doses clearly increase with increasing time after disposal. Por example, it is not possible to make realistic assumptions about factors such as population size and dietary habits over geologic timescales. The major contribution to the collective dose commitment from a release of activity is likely to arise from the doses due to long-lived radionuclides. These doses will be received over very long time periods, when realistic predictions are extremely difficult. Efforts to quantify the uncertainties in the calculations are likely to lead to a range of values for the collective dose commitment which is too broad to be useful as a basis for optimisation or comparison of disposal methods.
The assumption of constant values for parameters whose time variation is unknown may lead to inconsistencies in the calculation of the collective dose commitment from different disposal options or release events. For example, the total collective dose commitment often consists of two main components: the dose commitment to the local population close to the release point and the dose commitment to the world population following global dispersion of radionuclides. The assumption of a constant size of local population is much more questionable than that of a constant world population. The difference in reliability between the two assumptions must be recognised in utilising the calculated collective dose commitments.
In view of the difficulties identified in deriving realistic estimates of doses over long time periods it is clear that the simple definition of expected collective dose commitment needs to be modified by truncation of the time integral. This can either be carried out explicitly by the selection of an arbitrary cut-off time or implicitly such as by the use of discounting techniques in assessing the cost of future radiological detriment. These two options are discussed in subsequent sections.
¡ 4 . 2 . Discounting the Cost pf Future Radiological Detriment
Detailed discussion of the evaluation of the financial cost of radiological detriment is beyond the scope of this
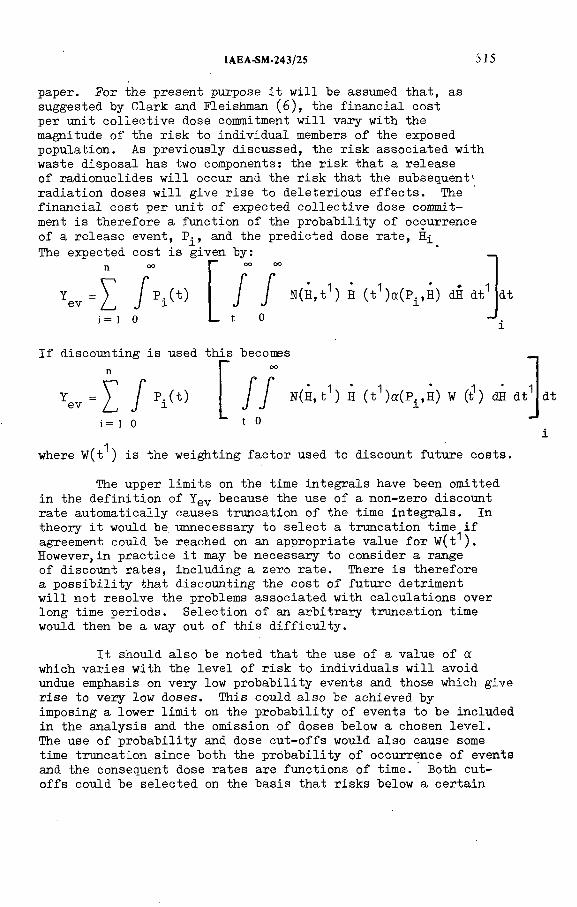
IAEA-SM-243/2S 515
paper. Por the present purpose it will be assumed that, as suggested by Clark and Fleishman (6), the financial cost per unit collective dose commitment will vary with the magnitude of the risk to individual members of the exposed population. As previously discussed, the risk associated with waste disposal has two components: the risk that a release of radionuclides will occur and the risk that the subsequent' radiation doses will give rise to deleterious effects. The financial cost per unit of expected collective dose commitment is therefore a function of the probability of occurrence of a release event, P^, and the predicted dose rate, H-¡_The expected cost is given by: ’
ev ■ I h(t)
i = 1 0
I I N(H,t1) H (t1)a(Pi,H) <ffl dt1L t о
dt
If discounting is used this becomes
evi= 1 0
n
= 1 / ^(t) / / N(H,t1) H (t1)a(Pi,H) V (t1) dH dt1 dt
where W(t ) is the weighting factor used to discount future costs.
The upper limits on the time integrals have been omitted in the definition of Yev because the use of a non-zero discount rate automatically causes truncation of the time integrals. In theory it would be unnecessary to select a truncation time if agreement could be reached on an appropriate value for W(t^). However,in practice it may be necessary to consider a range of discount rates, including a zero rate. There is therefore a possibility that discounting the cost of future detriment will not resolve the problems associated with calculations over long time periods. Selection of an arbitrary truncation time would then be a way out of this difficulty.
It should also be noted that the use of a value of a which varies with the level of risk to individuals will avoid undue emphasis on very low probability events and those which give rise to vezy low doses. This could also be achieved by imposing a lower limit on the probability of events to be included in the analysis and the omission of doses below a chosen level.The use of probability and dose cut-offs would also cause some time truncation since both the probability of occurrence of events and the consequent dose rates are functions of time. Both cutoffs could be selected on the basis that risks below a certain
516 HILL and WEBB
level are not considered by individuals in deciding whether to proceed with a given course of action (7).
h.3. Time Truncation
If a truncation time T is selected and no discounting is used the expected value of the collective dose commitment becomes:
S = ev ( t )
i= 1 0
J OO
J J s ( H,t1) H(t1) d H dt1
t 0
dt
—'l
To explain how this would apply in practice,the release of one radionuclide due to a random event will be considered as an example, P^, the probability of occurrence of the event i:s constant. Por a single radionuclide the collective dose commitment, Si(t), arising from a release at time t, can be expressed in terms of S^, the collective dose commitment from a release at time zero since both are proportional to the total of activity released.
Thus
where 'X is the radioactive decay constant of the radionuclide
S ^ t ). A t
Hence ev- / P. S1 dt1 о
P. S1 1 о 1 - e ■ \ t
5. Implications of the Proposed Assessment Rationale
5.1. Assessment Methodology
Prom the discussion of the applications of the results it can be seen that radiological assessments should be carried out in two stages. In the first stage expected doses to individuals are calculated using simple models and conservative assumptions. The results of this part of the assessment are used as a basis for judging the acceptability of the disposal method by comparison with a criterion for risk to individuals.
IAEA-SM-243/2S 517
In the second stage of the assessment the expected value of the collective dose commitment is calculated using realistic assumptions and parameter values and more complex mathematical models. The results of this stage are used in optimisation of disposal practices.
The two stages of the assessment need not be completely separate. For some failure modes it may be possible to use the same models and assumptions for calculating both individual doses and collective dose commitments. The results of the first stage of the assessment can be used to simplify the second stage. For example if simple calculations show that doses resulting from a release will begin to be received at a time longer than the chosen truncation time the collective dose commitment from the release need not be calculated.
5.2. Sensitivity Analysis
Analysis of the sensitivity of the results of assessments to the assumptions made and the values of the parameters used is essential to identify areas where further research is required and to quantify residual uncertainties. Sensitivity analysis can also be used to establish preliminary design criteria, for example to specify the mean life of waste canisters or the leach resistance of waste. The analysis should be performed on the overall results of the assessment, rather than on the separate contributions to. individual risk or expected collective dose commitment. This will ensure that research effort is not directed towards resolving uncertainties which have a minor effect on the overall results. There is little value in attempting to refine estimates of the individual doses or collective dose commitment arising from failure modes which have such a small probability of occurrence that their contribution to total individual risk and expected value of the collective dose commitment is insignificant.
6. Conclusions
The results of radiological assessments of high-level waste disposal consist of estimates of the probabilities of occurrence of events leading to a release of radionuclides to the biosphere and calculated doses to individuals and populations. We propose in this paper that these results should be used to derive expected values of the dose to the most exposed individual and the collective dose commitment. These values provide a means of assessing the risks associated with waste disposal since they combine predicted doses and the probability that these doses will be received.
518 HILL and WEBB
The expected value of the dose to the most exposed individual should be calculated using simple pessimistic assumptions and compared, with a criterion for individual risk. This criterion should be based on scientific arguments but is a political decision which may need to be the subject of public discussion. The expected value of the collective dose commitment is required for optimisation and comparison of disposal options. It should be calculated using realistic assumptions and parameter values. In order to avoid large uncertainties it will be necessary to truncate the integration in time. This can be achieved implicitly by discounting the cost of future detriment or explicitly by selection of an arbitrary cut-off time. Choice of an appropriate discount rate or truncation time requires value, judgements which cannot be made on the basis of scientific arguments alone.
The application of the results of radiological assessments has important implications for the research required i;o evaluate the disposal option, both in terms of the data needed and the complexity of models to be developed. The introduction of a criterion for individual risk will lead to emphasis on estimation of probability and uncertainty ranges, rather than the determination of precise values of major parameters. The use of a truncation time in calculating collective dose commitment will lead to more attention being paid to potential releases of radionuclides at relatively short times after disposal. Detailed modelling of processes which only influence doses at very long times will not be required, nor will it be necessary to obtain the data needed for these very long term predictions. Sensitivity analysis should be used at an early stage in the assessment procedure to indicate areas where uncertainties must be resolved or quantified.
REFERENCES
[1] KAMBRANSLESAKERHET, Handling of Spent Nuclear Fueland Final Storage of Vitrified High-Level ReprocessingWaste, Stockholm (1978).
[2] KAHNBRMSLESAEEBHET. Handling and Final Storage ofUnreprocessed Spent Nuclear Fuel, Stockholm (1978)-
[З. HILL, M. D. and GRIMWOOD, P. D., Preliminary Assessmentof the Radiological Protection Aspects of Disposal of High-Level Waste in Geologic Formations. National Radiological Protection Boardj OTÍPB-R69 (1978).
IAEA-SM-243/2S 519
[i+] INTERNATIONAL COMMISSION ON RADIOLOGICAL PROTECTION,Recommendations of the International Commission on Radiological Protection, ICRP Publication 26, Pergamon Press (1977)-
[5>] COHEN, J. (Rd.) Suggested Nuclear Waste ManagementRadiological Performance Objectives, Lawrence Livermore Laboratory UCID - 17880 (1978).
[6] CLARK, M. J . and FLEISHMAN, A. B. , “The cost of
collective dose equivalent”, Application of the Dose Limitation
System for Radiation Protection (Proc. Seminar Vienna, 1979),
IAEA, Vienna (1979) 143.
[7] WEBB, G. A. M. and MCLEAN, A. S. , Insignificant Levels of Dose : A Practical Suggestion for Decision Making. National Radiological Protection Boardj NRPB-R62 (1977).
DISCUSSION
H.W. LEVI: One of the merits of this paper is that it makes clear where the
limits of waste isolation safety analysis lie. Weighing consequences by
probabilities, as has been demonstrated in the United States reactor safety study
WASH-1400, would be the desirable approach for waste isolation as well.
However, the likelihood of events and processes occurring mainly in geological
systems can never be evaluated with the same precision because the systems
themselves are less well defined. This means that we shall, to a large extent, have
to be satisfied with merely a deterministic and conservative evaluation of the
consequences of reasonable failure sequences. We should clearly face the fact that
there will never be a WASH-1400 in the case of waste isolation.
G.A.M. WEBB: While I recognize the problem in assigning probabilities,
I feel we must try to pursue this path. I think there is a difference in that in waste
disposal we are looking primarily at the more probable events and we should try
to establish a solidly based assessment of the probability as a function of time.
C.A. HEATH: I think the observation that there appears to be greater
concern over low-probability, high-consequence events than over lower-consequence
events of somewhat higher probability contradicts the suggestion that there might
be a cut-off time for assessing events in the future. I would say that there appears
to be a great public emphasis on not posing higher risks to future generations
than to the present generation and this would not be taken into account with a
cut-off time.

520 HILL and WEBB
We have noted the greater concern over low-probability, high-consequence
events in the USA and some have proposed a weighting factor to account for this
(e.g. the suggestion of Mr. Webb). One of the proposals was that the calculated
consequence should be raised to some power in assessing relative risk. I wonder
if Mr. Webb is yet able to propose a specific value for such a possible weighting
factor.
G.A.M. WEBB: So far we have not suggested a set of numerical values for
this factor. In Section 3 of the paper we recognize the need to restrict the risk
to individuals and do not suggest a cut-off time for this purpose. However, in the
calculation of collective dose commitments for use in optimization and choice
of disposal method, the increasing uncertainty as to the future means that the
results for the distant future should have less bearing on our present decisions
concerning resource allocation — where to spend money and how much to spend —
than results for nearer times, on which we can place more reliance. One way of
formalizing this approach would be to apply a time cut-off.
W. BECHTHOLD: Your main criterion is that the expected dose rate is
always lower than the acceptable dose rate. I would like to ask what is acceptable?
Do you have any suggestions? I think we have to establish acceptable dose limits
quite soon. If this is done after the expected dose rates are computed, these
acceptable dose limits may not be fully convincing.
G.A.M. WEBB: In the paper we are presenting suggestions for methodology:
we have not quantified the ideas yet. However, you could say that for events
with a probability of one, an acceptable value for the expected dose might be
the same as the ICRP dose limit. It would be possible, though, to offer reasonable
arguments for acceptable expected values both lower and higher than this.
GENERAL DISCUSSIONON SESSION IX
B. ALLARD: Dr. Devell, describing the safety analysis for the Swedish KBS
project (paper IAEA-SM-243/55), referred to different retardation factors for
the actinides U, Np and Pu as well as for Tc under different conditions, especially
with respect to the redox potential of the groundwater. This is an aspect of
utmost importance which may require some clarification and comment. Under
oxidizing conditions U and Pu may be expected to exist in the hexavalent state,
Np in the pentavalent state and Tc in the heptavalent state (as anionic TCO4).
The actinides and Tc in these valence states would be fairly soluble in water (owing
to formation of strong hydroxy and carbonate complexes in the case of U and Pu).
As a result, U, Np, Pu and Tc would be very mobile in the groundwater/rock system
under oxidizing conditions.
In the lower valence (tri-or tetravalent) states, however, these elements would
be strongly hydrolysed and immobilized, the retardation factors being several
orders of magnitude higher than those for the high-valence-state species. Ground
waters in igneous rocks at great depth are reducing agents because of the presence
of divalent iron in the rock and in the water. Typical redox potentials may be in
the —100 to —200 mV range. On the basis of experimental measurements and
theoretical calculations it was postulated in the Swedish KBS study that the
elements U, Np, Pu and Tc would exist in the strongly sorbed tetravalent state
under these conditions, as is illustrated by the equilibrium curves in the E-pH
diagram (Fig.A). (A similar diagram for Tc is given in: Allard, B., Kipatsi, H.,
Torstenfelt, B., Radiochem. Radioanal. Lett. 37 (1979) 223.)
The conclusion is that the predominant valence states in the deep ground
waters in igneous rocks would be U(IV), Np(IV), Pu(IV) (or Pu(III)) and Tc(IV).
Supporting in situ data for U as well as experimental laboratory data for U, Np
and Tc are available from studies at Chalmers (Sweden), Oak Ridge (USA) and
Cadarache (France). Thus, the conditions in these waters would be favourable
for a waste repository where slow radionuclide migration is required.
J. PRADEL: There is only vague reference in the papers to the risk of
intrusion into repositories and to the associated risk of exposure by inhalation.
Should these possibilities be taken into account? Mr. Lyon’s point (paper
SM-243/169) is that if people intrude upon a repository, they will realize it and
will protect themselves. I don’t think we can be so sure of that. At present we
ha.ve the experience of men who handle pitchblende during civil engineering
work without realizing it immediately. We are also told that “this is improbable”.
I believe further that if this risk is not taken into account we may be led to
selecting sites which are perfectly satisfactory from the standpoint of migration
521
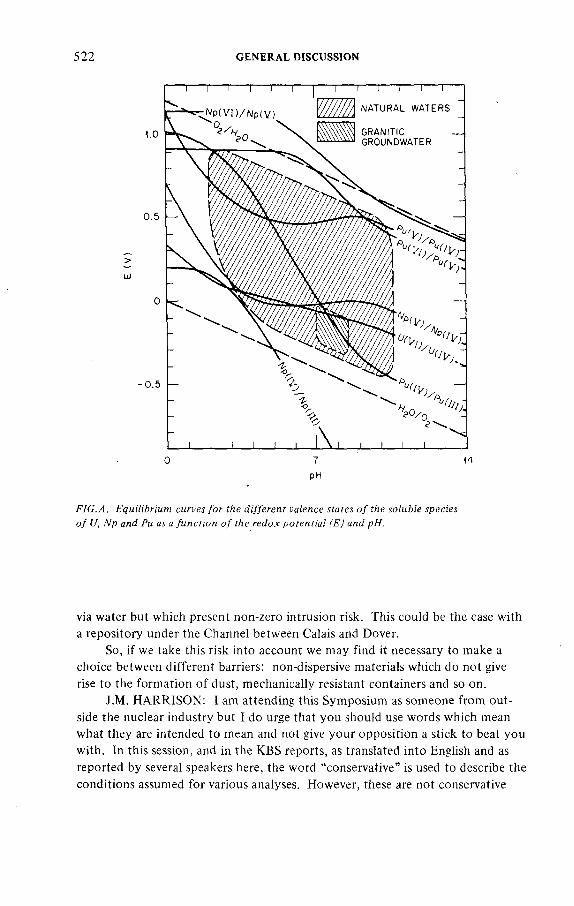
522 GENERAL DISCUSSION
0 7 4 4
PH
FIG.A. Equilibrium curves for the different valence states of the soluble species
of U, Np and Pu as a function of the redox potential (E) and pH.
via water but which present non-zero intrusion risk. This could be the case with
a repository under the Channel between Calais and Dover.
So, if we take this risk into account we may find it necessary to make a
choice between different barriers: non-dispersive materials which do not give
rise to the formation of dust, mechanically resistant containers and so on.
J.M. HARRISON: I am attending this Symposium as someone from out
side the nuclear industry but I do urge that you should use words which mean
what they are intended to mean and not give your opposition a stick to beat you
with. In this session, and in the KBS reports, as translated into English and as
reported by several speakers here, the word “conservative” is used to describe the
conditions assumed for various analyses. However, these are not conservative
GENERAL DISCUSSION 523
and, judging by the discussions, they are not even realistic but at best rather
pessimistic. If I were a strong anti-nuclear protester, I would point out that
scientists are notoriously conservative so that their conservative assumptions are
likely to be very optimistic and the true conditions will certainly be much worse.
I suggest you ought to be very careful in the choice of words, especially in
English because it is so widely used in scientific communication.


IAEA-SM-243/114
ТЕХНИКО-ЭКОНОМИЧЕСКОЕ СРАВНЕНИЕ МЕТОДОВ ПЕРЕРАБОТКИ И ЗАХОРОНЕНИЯ ЖИДКИХ РАДИОАКТИВНЫХ ОТХОДОВ НА АТОМНЫХ ЭЛЕКТРОСТАНЦИЯХ СССР
А.Н. КОНДРАТЬЕВ, М.В! СТРАХОВ, Н.А. РАКОВ,М. И. ЗАВАДСКИЙ
Государственный комитет по использованию атомной энергии СССР,Москва,Союз Советских Социалистических Республик
Abstract- Аннотация :
TECHNICAL AND ECONOMIC COMPARISON OF METHODS FOR THE TREATMENT AND DISPOSAL OF LIQUID RADIOACTIVE WASTES AT NUCLEAR POWER STATIONS IN THE U S S R .
The paper compares two methods for containment of liquid wastes from nuclear power stations, both of which are being studied in the USSR: (1) underground disposal in deep aquifers which can be relied upon to remain isolated from higher and lower aquifers by confining strata; and (2) solidification by bituminization. Flow charts of the waste processing system and the layout of equipment are presented and the reliability of these methods in the context of nuclear power stations with high-power RBMK-1000 channel-type reactors is discussed. An analysis is made of technical and economic criteria and of these waste disposal techniques from the point of view of radiological safety. On the basis of this analysis a method is chosen for introduction on an industrial scale.
Т Е Х Н И К О -Э К О Н О М И Ч Е С К О Е С Р А В Н Е Н И Е М Е Т О Д О В П Е Р Е Р А Б О Т К И И З А Х О Р О Н Е Н И Я Ж И Д К И Х Р А Д И О А К Т И В Н Ы Х О Т Х О Д О В Н А А Т О М Н Ы Х Э Л Е К Т Р О С Т А Н Ц И Я Х СССР.
В работе сравниваю тся два м етода л о ка л иза ц ии ж и д к и х о тхо д ов А Э С , по о б о и м из к о т о р ы х в СССР о сущ е ствл яю тся исследования: под зем ное захоронение в гл уб о ко р а сп о л о ж е н н ы е во д о н о сны е го р и зо н ты зем л и , надеж но изол ированны е во д о упо р а м и от вы ш е- и ниж е л е ж а щ их го р и зо н то в , и отверж дение м ето д о м б и тум и р о ва н и я . Н аряд у с т е х н о л о ги ч е ски м и схем ам и пе р е р аб о тки о тх о д о в , к о м п о н о в к о й о б ор уд ова н и я , во пр о са м и надеж ности прим енительно к у с л о в и я м АЭС с р е а кто р о м типа Р Б М К -1 0 0 0 дается анализ т е х н и к о -э к о н о м и ч е с к и х показателей и надеж ности рассматрива е м ы х м етод ов л о ка л иза ц ии ж и д к и х о тхо д о в с т о ч к и зрения обеспечения радиационной безопасно сти и на основе э то го анализа делается вы б о р метода л о ка л иза ц ии о тхо д о в д л я пр о м ы ш л е н н о го внедрения.
525

Реге
нера
ты
Рис. 1. Схема образования жидких отходов на АЭС.
526 КО
НДРА
ТЬЕВ
и
др.
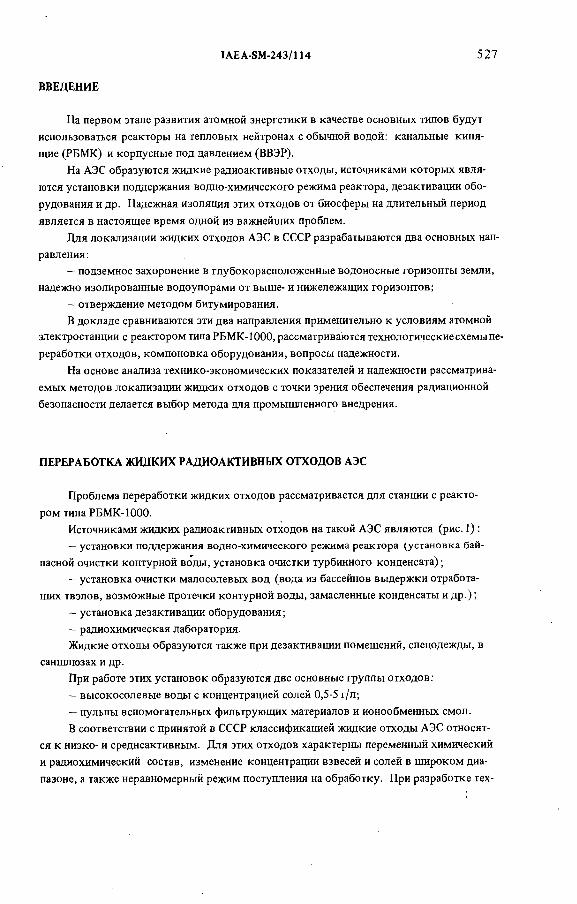
IAEA-SM-243/114 527
ВВЕДЕНИЕ
На первом этапе развития атомной энергетики в качестве основных типов будут использоваться реакторы на тепловых нейтронах с обычной водой: канальные кипящие (РБМК) и корпусные под давлением (ВВЭР).
На АЭС образуются жидкие радиоактивные отходы, источниками которых являются установки поддержания водно-химического режима реактора, дезактивации оборудования и др. Надежная изоляция этих отходов от биосферы на длительный период
является в настоящее время одной из важнейших проблем.Для локализации жидких отходов АЭС в СССР разрабатываются два основных нап
равления:— подземное захоронение в глубокорасположенные водоносные горизонты земли,
надежно изолированные водоупорами от выше- и нижележащих горизонтов;— отверждение методом битумирования.В докладе сравниваются эти два направления применительно к условиям атомной
электростанции с реактором типа РБМК-1000, рассматриваются технологические схемы переработки отходов, компоновка оборудования, вопросы надежности.
На основе анализа технико-экономических показателей и надежности рассматриваемых методов локализации жидких отходов с точки зрения обеспечения радиационной безопасности делается выбор метода для промышленного внедрения.
ПЕРЕРАБОТКА ЖИДКИХ РАДИОАКТИВНЫХ ОТХОДОВ АЭС
Проблема переработки жидких отходов рассматривается для станции с реакто
ром типа РБМК-1000.Источниками жидких радиоактивных отходов на такой АЭС являются (рис. 1) :— установки поддержания водно-химического режима реактора (установка бай
пасной очистки контурной воды, установка очистки турбинного конденсата) ;— установка очистки малосолевых вод (вода из бассейнов выдержки отработа-
ших твэлов, возможные протечки контурной воды, замасленные конденсаты и др.) ;— установка дезактивации оборудования;— радиохимическая лаборатория.Жидкие отходы образуются также при дезактивации помещений, спецодежды, в
саншпюзах и др.При работе этих установок образуются две основные группы отходов:— высокосолевые воды с концентрацией солей 0,5-5 г/л;— пульпы вспомогательных фильтрующих материалов и ионообменных смол.В соответствии с принятой в СССР классификацией жидкие отходы АЭС относят
ся к низко- и среднеактивным. Для этих отходов характерны переменный химический и радиохимический состав, изменение концентрации взвесей и солей в широком диапазоне, а также неравномерный режим поступления на обработку. При разработке тех-

М ал осол евы е воды З ам асл ен ны й ко н д е н с а т
Воды в зр ы хл ен и я I О р га н и зо в а н н ы е п р о те ч ки
В оды бассейнов в ы д е р ж к и тв эло в
/ Ь и ту м н а я ХП о д зе м н о е О тв ер ж д е н и е [ масса \ Х р а н е н и е в
зах о р о н е н и е (б и тум и р о в ан и е ) * 1на х р а н е н и е / е м к о с т я х
Рис. 2. Принципиальная схема переработки жидких радиоактивных отходов АЭС.
528 КО
НД
РАТЬ
ЕВ
и др.
IAEA-SM-243/114 529
нологии очистки отходов первой группы, как правило, учитывается принцип максимальной зацикловки очищенной воды (повторное использование в реакторной установке), что диктует необходимость глубокой очистки сбросов от взвесей, солей и радиоизотопов.
Переработку высокосолевых радиоактивных вод можно осуществлять по многоступенчатой схеме, включающей сбор и усреднение отходов в емкостях, гидроокисное осаждение, дистилляцию в многокорпусной выпарной установке, окончательную очистку конденсата от радиоизотопов, органических, взвешанных и ионных примесей на активированном угле и ионообменных смолах, что обеспечивает их остаточное содержание ниже допустимых концентраций.
Основная часть очищенного конденсата может возвращаться на реакторную установку, а некоторое количество сбрасываться в водоем как дебаланс, образуемый из-за невозможности использования очищенной воды в саншпюзах и спецпрачечной.
В результате многоступенчатой упарки высокосолевых вод будут получаться кубовые остатки, содержащие практически все радиоизотопы и соли (концентрация
500-800г/л).Производительность выпарной установки с учетом пикового поступления высоко
солевых вод составляет до 15 т/ч на один блок с реактором типа РБМК-1000.Кубовый остаток после выпарки, а также пульпы ионообменных смол и вспомо
гательного фильтрующего материала могут направляться на временное хранение в емкости хранилища.
В связи с тем, что хранение жидких концентратов в емкостях имеет ряд существенных недостатков (возможность разгерметизации емкостей и утечки отходов, большой расход нержавеющей стали, необходимость замены емкостей при выходе их из строя и др.), этот метод рассматривается как временный, промежуточный этап в комплексе мер по локализации жидких отходов АЭС.
Проведенные в СССР исследования и отработка различных методов переработки и захоронения отходов низкого и среднего уровня активности на опытных установках позволили наметить следующие основные направления локализации этих отходов, получаемых на АЭС (рис. 2) :
— при наличии в районе размещения станции благоприятных геолого-гидрогеоло- гических условий жидкие отходы могут направляться на подземное захоронение в глубокорасположенные водоносные горизонты земной коры;
— при отсутствии благоприятных условий для подземного захоронения жидкие отходы могут перерабатываться методом выпарки и ионного обмена, а полученные концентраты и пульпы ионообменных смол и вспомогательных фильтрующих материалов могут отверждаться методом битумирования.
ПОД ЗЕМНОЕ ЗАХОРОНЕНИЕ
Сущность метода подземного захоронения жидких отходов заключается в контролируемой и регулируемой закачке отходов в глубокорасположенные водоносные гори
530 КОНДРАТЬЕВ и др.
зонты земной коры, надежно изолированные водоупорами от других горизонтов и от дневной поверхности. Закачку жидких отходов предполагается осуществлять через систему нагнетательных скважин. Жидкие отходы, нагнетаемые в подземный горизонт (пласт-коллектор) через скважины, вытесняют пластовую воду из порового пространства пород, замещают ее и распространяются в пласте-коллекторе радиально от скважин.
Породы пласта-коллектора являются многокомпонентными минеральными сорбентами по отношению к радиоизотопам. За счет сорбции будет происходить частичная очистка жидкой фазы и накопление радиоизотопов в ограниченном объеме пласта-кол- лектора.
В результате закачки образуется подземное хранилище жидких радиоактивных отходов. Сбросы в таком хранилище могут перемещаться только совместно с пластовыми водами, скорость движения которых должна быть незначительной (доли или единицы метров в го д ).
При оценке безопасности метода подземного захоронения принимаются во внимание данные геолого-разведочных работ и результаты изучения взаимодействия закачиваемых отходов с породами пласта и пластовой жидкостью, оценки и прогнозирование поведения закачиваемых отходов, миграции радиоизотопов, изменение температуры пласта и др.
На основе этих данных оценивается время нахождения отходов в подземном хранилище. Геолого-гидрогеологические условия района для организации подземного захоронения отходов выбираются с таким расчетом, чтобы время нахождения отходов в таком хранилище было достаточно для снижения активности до безопасного уровня за счет естественного распада радиоизотопов.
В целях создания условий совместимости закачиваемых жидких отходов с пластовой водой и исключения кольматации скважин и призабойной зоны проводится предварительная подготовка отходов к захоронению: корректировка pH, удаление взвесей, а в отдельных случаях стабилизация химическим путем компонентов, способных образовывать осадки при взаимодействии с пластовыми водами.
Повышение температуры в пласте при захоронении отходов АЭС составит несколько градусов над фоновой температурой пласта, что не приведет к ’’тепловому загрязнению” .
В этом варианте локализации отходов ионообменные смолы и вспомогательный фильтрующий материал могут отделяться из пульп методом фильтрации и захораниваться после затаривания в бидоны как твердые отходы или могут храниться в виде пульпы в специальных емкостях. Требуется выполнить дополнительные исследовательские работы с целью разработки технологии перевода радиоизотопов, сорбированных на смолах и вспомогательном фильтрующем материале, в раствор, который можно также направить на подземное захоронение. Решение этой проблемы позволит все радиоизотопы, содержащиеся в жидких отходах АЭС, надежно захоронить в геологическую формацию данным методом.
Длительная эксплуатация полигона подземного захоронения жидких отходов в НИИАР подтвердила надежность и безопасность данного метода.
IAEA-SM-243/114 531
Аппаратурно-технологическая схема локализации жидких отходов методом подземного захоронения состоит из узлов приема и усреднения отходов, корректировки pH, отделения взвесей, стабилизации раствора, закачки отходов через нагнетательные скважины в подземный горизонт.
Компоновка оборудования этих узлов выполняется аналогично установкам переработки среднеактивных отходов осадительным и ионообменным методами.
Для контроля за поведением радиоизотопов в подземном хранилище на территории полигона подземного захоронения предусматривается серия наблюдательных скважин.
БИТУМИРОВАНИЕ РАДИОАКТИВНЫ Х ОТХОДОВ
В СССР разработан и испытан на опытных установках процесс битумирования пульп и концентратов радиоактивных отходов после выпарки. При включении в битум до 50% солей образующийся битумный компаунд обладает хорошей водоустойчивостью, низкой выщелачиваемостью радиоизотопов и не претерпевает структурных изменений при длительном хранении (активность до 1 Ки/л).
На Центральной станции радиационной безопасности была успешно испытана установка двухстадийного битумирования производительностью 200л/ч: на первой стадии жидкие отходы высушиваются в электрообогреваемых вальцовых сушилках до влажных солей, которые на второй стадии замешиваются с битумом в шнековом смесителе.
Разработана также документация роторного битуматора со стираемой пленкой производительностью 180 и 500 л/ч по испаряемой воде, в котором испарение воды происходит из тонкой пленки смеси жидких отходов и битума, стекающих вниз по обогреваемой цилиндрической стенке, а окончательное перемешивание битума с солями — в нижней части. Аппарат снабжен валом со скребками и якорной мешалкой.
Ведутся работы по изысканию новых материалов для замены или улучшения свойств битумных препаратов.
Один из вариантов аппаратурно-технологической схемы переработки жидких отходов АЭС методом выпарки и включения солей в битум приведен на рис.З. Жидкие отходы после усреднения в емкости (А-1) и корректировки pH (А-2) подаются на дистилляцию в многокорпусную выпарную установку (А-3). Полученный кубовый остаток совместно с пульпами ионообменных смол и вспомогательных фильтрующих материалов, которые обезвоживаются на фильтре (А-5), поступают в битуматор роторного типа со стираемой пленкой (А-6). Битумный компаунд с включенными солями и радиоизотопами расфасовывается в стальные бочки объемом 200л, которые после застывания битума передаются в хранилище.
Полученная при упарке и битумировании парогазовая фаза конденсируется; не- конденсирующиеся газы после очистки на фильтрах удаляются в атмосферу через вентиляционную трубу. Конденсат после очистки возвращается в реакторную установку на повторное использование.
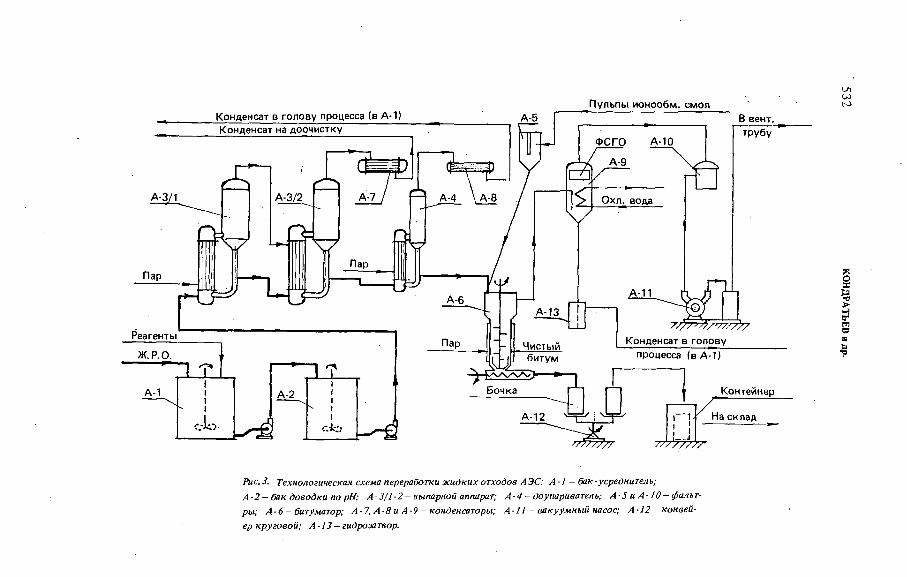
Пульпы ионообм. смол
Рис.З. Технологическая схема переработки жидких отходов АЭС: А-1 — бак-усреднитель;А -2 - бак доводки по pH; А -3 /1-2-выпарной аппарат; А -4 - доупариватель; А -5 и А -10 - фильтры; А -6 - битуматор; А-7, А -8 и А-9 - конденсаторы; А -11 - вакуумный насос; A -1 2 -конвей- ер круговой; А -13 —гидрозатвор.
532 КОНДРАТЬЕВ
и др.
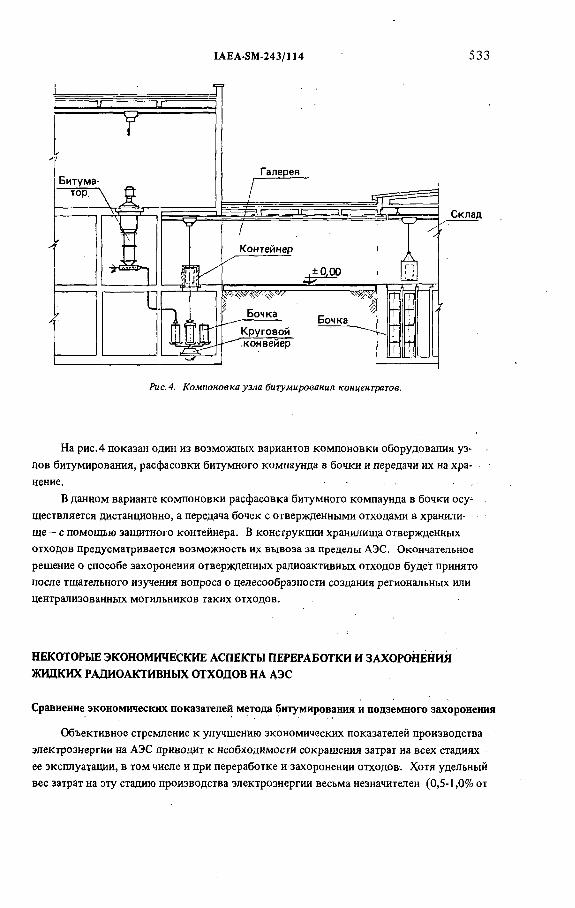
IAEA-SM-243/114 533
На рис. 4 показан один из возможных вариантов компоновки оборудования узлов битумирования, расфасовки битумного компаунда в бочки и передачи их на хранение.
В данном варианте компоновки расфасовка битумного компаунда в бочки осуществляется дистанционно, а передача бочек с отвержденными отходами в хранилище — с помощью защитного контейнера. В конструкции хранилища отвержденных отходов предусматривается возможность их вывоза за пределы АЭС. Окончательное решение о способе захоронения отвержденных радиоактивных отходов будет принято после тщательного изучения вопроса о целесообразности создания региональных или централизованных могильников таких отходов.
НЕКОТОРЫЕ ЭКОНОМИЧЕСКИЕ АСПЕКТЫ ПЕРЕРАБОТКИ И ЗАХОРОНЕНИЯ ЖИДКИХ РАДИОАКТИВНЫХ ОТХОДОВ НА АЭС
Сравнение экономических показателей метода битумирования и подземного захоронения
Объективное стремление к улучшению экономических показателей производства электроэнергии на АЭС приводит к необходимости сокращения затрат на всех стадиях ее эксплуатации, в том числе и при переработке и захоронении отходов. Хотя удельный вес затрат на эту стадию производства электроэнергии весьма незначителен (0,5-1,0% от
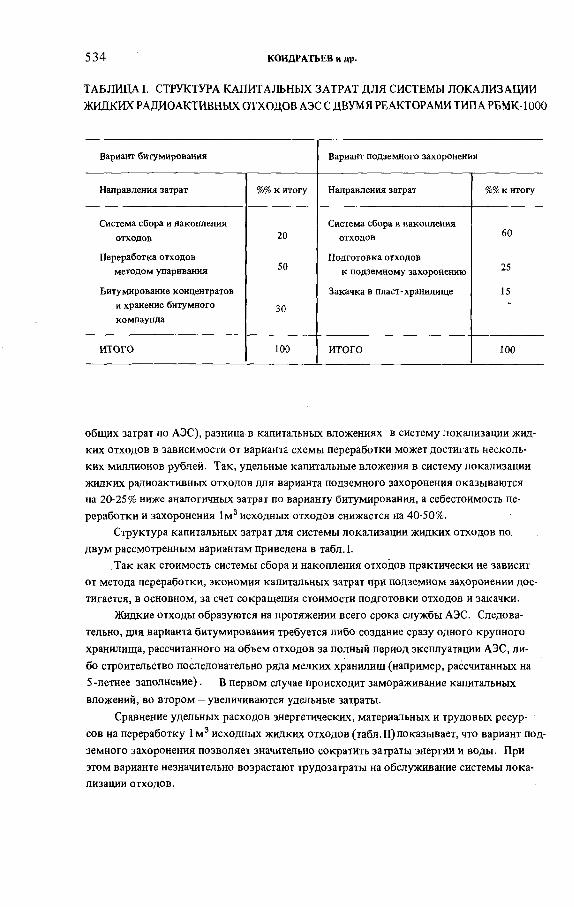
534 КОНДРАТЬЕВ и др.
ТАБЛИЦА I. СТРУКТУРА КАПИТАЛЬНЫХ ЗАТРАТ ДЛЯ СИСТЕМЫ ЛОКАЛИЗАЦИИ ЖИДКИХ РАДИОАКТИВНЫХ ОТХОДОВ АЭС С ДВУМЯ РЕАКТОРАМИ ТИПА РБМК-1000
Вариант битумирования Вариант подземного захоронения
Направления затрат %% к итогу Направления затрат %% к итогу
Система сбора и накопления отходов 20
Система сбора и накопления отходов 60
Переработка отходов методом упаривания 50
Подготовка отходовк подземному захоронению 25
Битумирование концентратов и хранение битумного компаунда
30
Закачка в пласт-хранилище 15
ИТОГО 100 ИТОГО 100
общих затрат по АЭС), разница в капитальных вложениях в систему локализации жидких отходов в зависимости от варианта схемы переработки может достигать нескольких миллионов рублей. Так, удельные капитальные вложения в систему локализации жидких радиоактивных отходов для варианта подземного захоронения оказываются на 20-25% ниже аналогичных затрат по варианту битумирования, а себестоимость переработки и захоронения 1м3 исходных отходов снижается на 40-50%.
Структура капитальных затрат для системы локализации жидких отходов по. двум рассмотренным вариантам приведена в табл.1.
Так как стоимость системы сбора и накопления отходов практически не зависит от метода переработки, экономия капитальных затрат при подземном захоронении достигается, в основном, за счет сокращения стоимости подготовки отходов и закачки.
Жидкие отходы образуются на протяжении всего срока службы АЭС. Следовательно, для варианта битумирования требуется либо создание сразу одного крупного хранилища, рассчитанного на объем отходов за полный период эксплуатации АЭС, либо строительство последовательно ряда мелких хранилищ (например, рассчитанных на 5-летнее заполнение) . В первом случае происходит замораживание капитальных вложений, во втором — увеличиваются удельные затраты.
Сравнение удельных расходов энергетических, материальных и трудовых ресурсов на переработку 1 м э исходных жидких отходов (табл. II)показывает, что вариант подземного захоронения позволяет значительно сократить затраты энергии и воды. При этом варианте незначительно возрастают трудозатраты на обслуживание системы локализации отходов.

IAEA-SM-243/114 535
ТАБЛИЦА II. УДЕЛЬНЫЕ РАСХОДЫ РЕСУРСОВ НА ПЕРЕРАБОТКУ И ЗАХОРОНЕНИЕ1 м 3 ИСХОДНЫХ ОТХОДОВ
Н аим енование ресурсов Б и тум и р ова н и е П о д зем ное захоронение
Б и т у м 7 к г -
Э ле ктр о эн е ргия 45 к В т ч 2 кВ т -ч
Вода дл я охлаж дения 6 0 м 3 0,04 м 3
Теплоэнергия 0,6 Г к а л Незначительны
Труд о за тр а ты на о б служ ивание 0,8 человеко -часов 0,95 человеко-часа
Обоснование предельно допустимого расстояния АЭС до пласта-хранилища
Ограниченность мест для размещения АЭС, удобных с точки зрения наиболее весовых экономических факторов (наличие источника воды, близость потребителя электроэнергии, освоенность площ адки), отодвигает на второй план вопрос о наличии вблизи АЭС подходящего для захоронения отходов подземного пласта. Тем не менее весьма важно знать, при каком удалении пласта-хранилища от АЭС еще экономически целесообразен метод подземного захоронения по сравнению с методом битумирования жидких радиоактивных отходов.
В результате экономических оценок определены следующие границы конкурентоспособности метода подземного захоронения:
— зона безусловной эффективностиподземного захоронения - до 25 км '
— зона равноэффективности подземногоза х о р о н е н и я и б и т у м и р о в а н и я — 25-30 КМ
— зона неэффективности подземногозахоронения — свыше 30 км
ВЫВОДЫ
Достоинство метода подземного захоронения жидких радиоактивных отходов состоит в том, что он, в отличие от многих других освоенных к настоящему времени в промышленном масштабе способов переработки отходов АЭС, обеспечивает ’’вечное” захоронение жидких отходов. Безопасность данного метода обусловлена специфическими особенностями геологической формации:
— малыми скоростями движения пластовых вод ;— наличием водоупоров, надежно изолирующих пласт-коллектор от других
горизонтов и от дневной поверхности, что исключает гидравлическую связь между ними;
536 КОНДРАТЬЕВ и др.
— сорбцией радиоизотопов на породах пласта-коллектора.Указанные особенности геологической формации обеспечивают условия для пол
ного обезвреживания жидких радиоактивных отходов до безопасного уровня активности за счет естественного распада радиоизотопов.
Кроме повышения надежности, метод подземного захоронения дает возможность экономичнее достигнуть лучших технико-экономических показателей по сравнению с битумированием: капитальные затраты снижаются на 20-25%, а себестоимость переработки—на 40-50%.
К недостаткам этого метода следует отнести необходимость сохранения на поверхности земли в районе АЭС хранилищ пульп ионообменных смол и вспомогательных фильтрующих материалов. Этот недостаток может быть устранен разработкой технологии перевода радиоизотопов с этих материалов в раствор, который можно направить на подземное захоронение.
Метод битумирования, хотя и не позволяет уменьшить объем конечных отходов по сравнению с хранением концентратов в емкостях, но повышает надежность захоронения в могильниках простой конструкции, так как битумный компаунд при включении в него до 50% солей характеризуется хорошей водоустойчивостью, низкой выще- лачиваемостью радиоизотопов и не претерпевает структурных изменений при длительном хранении отвержденных отходов с активностью до 1 Ки/л.
Этот метод создает благоприятные условия для удаления отвержденных отходов за пределы АЭС, если это будет признано целесообразным в будущем. Необходимость выполнения этой операции может возникнуть в случае прекращения эксплуатации конкретной АЭС. В обоих случаях на организацию перевозки отвержденных отходов потребуются дополнительные затраты средств, что вызовет еще большее ухудшение тех- .
нико-экономических показателей метода битумирования по сравнению с методом п о д земного захоронения.
Одним из недостатков метода битумирования является пожароопасность, что вызывает необходимость предусматривать специальные средства тушения пожара.
В целях исключения этого недостатка ведутся работы по изысканию новых материалов для замены или улучшения свойств битума.
Сравнение обоих методов по технико-экономическим показателям и надежности мер, обеспечивающих радиационную безопасность в районе АЭС при нормальных условиях и при возникновении аварийной ситуации на установке переработки или в хранилище отходов, позволяет отдать предпочтение методу подземного захоронения, как более надежному и экономичному.
Поэтому при выборе площадок для новых АЭС, наряду с другими условиями, должна рассматриваться возможность организации подземного захоронения жидких отходов.
Если АЭС намечается разместить в районе, где на указанных выше предельных расстояниях отсутствуют благоприятные геолого-гидрологические условия для подземного захоронения, жидкие отходы следует отверждать методом битумирования, который более экономичен и надежен, чем хранение жидких концентратов в емкостях.

IAEA-SM-243/114 537
ЛИТЕРАТУРА
[ IJ СЕДОВ, B .M ., КОЛЫЧЕВ, Б .С ., КОНСТАНТИНОВИЧ, А .А ., КУЛИЧЕНКО, В .В .,
НИКИПЕЛОВ, Б .В ., НИКИФОРОВ, А .С ., М АРТЫ НОВ,Ю .П., О ЗИ РА Н Е Р ,С .Н ., Д О Л Г О В ,В .В .,
ШАЦИЛЛО, В .Г ., "Р азработка м етодов отверж дения и захоронения радиоакти вн ы х отходов
топли вн ого ц и к л а”, Nuclear Power and its Fuel Cycle, v. 4 (Pioc. Symp. Vienna, 1977) IAEA, V ienna (1977) 625.
[ 2] СПИЦЫН, В .И ., ПИМЕНОВ, M .K ., БАЛУКОВА, В .Д ., ЛЕОНТИЧУК, А .С ., К ОКОРИН, И .Н .,
ЮДИН, Ф .П ., РАКОВ, Н .А ., "О сновны е предп осы лки и п ракти ка использования глубоки х
водоносны х горизонтов д л я захоронения ж ид ких радиоакти вн ы х отхо д о в” , Nuclear Power
and its Fuel Cycle, v. 4 (Proc. Symp. Vienna, 1977) IAEA, Vienna (1977) 481.
[ 3] БАРАНОВ, M .H ., ДЕМ ЬЯНОВИЧ, M .A ., М ЕТАЛЬНИКОВ, C .B ., МИТРЮШИН, A .B .,ТОЛКАЧЕВ, Г .И ., "П о д го то в к а и удаление ж ид ких радиоакти вн ы х отходов н и зк ого уровн я активности в п одзем н ое хранилищ е” , Труды Б ельги й ско-н и д ерлан д ско-сов етского сим пози
ум а, Б ельгия , 23 с ен тя б р я -1 о к тя б р я 1976 г . , R-2572, 1976.
DISCUSSION
К. KÜHN: What types of geologic formation (or aquifers) are you using in
the Soviet Union for the injection of liquid wastes from nuclear power plants?
What types are considered to be necessary for confining the injection horizon?
M.V. STRAKHOV: For the injection of liquid radioactive wastes it is advisable
to select porous water-bearing formations (mineralogically they should consist
mainly of aluminosilicates) with a negligible rate of formation water movement
(fractions of a metre or a few metres per year). These should be almost completely
isolated from the surface and other horizons by clay beds impervious to water.
Above the disposal formation there should be a buffer horizon, also isolated by
impervious layers.
K. KÜHN: You stated that the injected radioactive wastes will decay “to
a safe level for radioactive waste”. Could you please give a definition of that
safe level?
M.V. STRAKHOV: By safe level we mean the radionuclide content in the
water as specified by the radiation protection standards (Standards NRB-76
applying in the USSR).
P.A. WITHERSPOON: I assume you are storing radioactive waste in sand
stone aquifers which range in depth from 200 to 1000 m. Is this correct?
M.V. STRAKHOV: The formations chosen for the underground disposal
of liquid radioactive wastes from nuclear power plants are at depths of 350—1500 m.
P.A. WITHERSPOON: In the USA, in connection with the storage of natural
gas in aquifers over the past 25 years, we have found that pumping tests with
observation wells in the storage aquifer and also in the overlying cap rock are very
useful in determining the suitability of the total system. Do you use such testing
methods?

538 КОНДРАТЬЕВ и др.
M.V. STRAKHOV: For the purpose of observing the behaviour of radio
nuclides in the underground horizon we use a number of wells exposing the
disposal formation and all other water-bearing horizons.
P.A. WITHERSPOON: During the radioactive liquid waste storage operations,
what observations are you making in the disposal aquifer and in the overlying cap
rock layers?
M.V. STRAKHOV: The main principle followed in organizing observation
of underground repositories is to monitor the distribution of radionuclides in
the disposal formation and the state of all the overlying horizons.
R.H. BECK: Do the aquifers used as repositories contain saline (fossil)
water or fresh water? What are the volumes of liquid waste injected?
M.V. STRAKHOV: As underground repositories we use water-bearing
formations containing highly mineralized water which is not used for economic
purposes. The formation for the disposal of liquid radioactive wastes from nuclear
power plants is selected on the assumption that it can accommodate the waste
produced during the entire operational life of a power plant. Its effective volume
within the calculated boundaries is determined as the daily output of waste multi
plied by the number of days of operation of the power plant.

IAEA-SM-243/154
DESIGN AND SAFETY EVALUATION OF A DANISH HIGH-LEVEL WASTE DISPOSAL FACILITY IN SELECTED SALT DOMES
F. HASTED
ELKRAFT,
Lyngby
S. MEHLSEN
ELS AM,
Fredericia,
Denmark
Abstract
DESIGN AND SAFETY EVALUATION OF A DANISH HIGH-LEVEL WASTE DISPOSAL FACILITY IN SELECTED SALT DOMES.
In a two-year project a few Danish salt domes will be selected after investigations and evaluation to ascertain whether these salt domes are suitable for final disposal of high-level radioactive waste. The paper describes the investigations comprising geophysical measurements, deep test drillings into the salt, hydrogeological test drillings into the surrounding formations and material testing, to be made so as to establish a data base for the design and safety documentation of a high-level waste disposal facility. The paper further describes how a preferred facility based on a deep-hole layout has been selected for the project. This solution takes into account the fact that test drilling can only give information about the vertical volume of the dome. At the same time this is a preferable layout when the uplift of the salt plays a major role in the escape scenario for the radioactive isotopes in the repository.
1. INTRODUCTION
No nuclear power plant is operating or under construction in Denmark at
present. In accordance with the law of May 1976 on the safety and environmental
impact of nuclear plants, approval to construct and operate a nuclear power plant
is granted by the Minister for the Environment upon receipt of an application.
Only a small part of this law is, however, in force today. In the summer of 1976
the government decided to postpone the enforcement of the law mainly in order
to secure a better understanding of questions concerning the safe disposal of
radioactive waste from future nuclear plants in Denmark.
The two major utility groups Elkraft and Elsam then agreed to carry out a
preliminary evaluation of the needs for and the feasibility of a geological repository
539
540 HASTED and MEHLSEN
for high-level radioactive waste in Denmark. See Ref. [1 ]. The efforts were concen
trated on repositories in rock salt present underground in Denmark, partly because
salt offers a number of special advantages for the disposal of high-level waste,
partly because similar foreign repositories are planned to be constructed and put
into operation over the next ten years.
The investigations have confirmed that it is possible to build a repository in
a suitable salt dome and that it is highly probable that a suitable salt dome can be
found among the Danish domes.
In discussions between the government and the utilities it was agreed to
proceed to a phase-2 project in which a few salt domes will be investigated by
means of geophysical measurements and test drillings. The work will be carried
far enough to make possible the provision of the documentation necessary for
safe waste disposal. A high-ranking review group has been set up which will report
directly to the government. It has further been agreed between the two parties
that this phase-2 project will be finished by the end of 1980 after a working period
of approximately two years.
It is important to note that the preparation of an actual application for a
construction permit for a repository requires a further phase-3 project. However,
this work may not be started until after the year 2000, when the first nuclear
power plants in Denmark will have been in operation for about ten years.
As an introduction to the drilling programmes, seismic investigations on
five salt domes started at the beginning of May and will be finished by late
August 1979, including the interpretation of the measurements. Deep drillings
in the salt are planned to be made with one drilling rig over a working period from
mid-October 1979 to mid-June 1980. During the same period hydrogeological
tests will proceed in the surroundings of the selected salt domes.
Final layout and safety evaluation based on data from the field measurements
will be carried out over a period from mid-July until mid-November 1980. This
leaves about one month for the authorities to comment on the results of the
phase-2 project, in order to hand the report and the comments to the government
at the end of December 1980.
2. DESIGN PHILOSOPHY
The objective of the phase-2 project has been phrased in a simple way: to find
а-few salt domes which are suitable for the disposal of high-level waste. At the
present time there are, however, some difficulties in choosing ways and means to
a proper solution. These difficulties may be found in the following two areas.
First, no such facility has been licensed in any country to date. No safety
analysis report has ever been approved-by any licensing authority. It is difficult
and very costly especially for a small country to be in a position where one cannot

IAEA-SM-243/154 541
refer to some regulatory guidelines which have been worked out in a country with
a major nuclear programme.
The second area where difficulties are met is in the choice of methods and
tools for the investigation of the properties of the salt domes. For countries with
a major nuclear programme it is a reasonable solution to plan a repository as a
mining facility with shafts and galleries. Furthermore, the need for disposal of
waste is in existence today. Together, these point to the obvious procedure where
a shaft is sunk and some galleries made from where the rock salt can be
sampled at the very place planned for the disposal. However, this makes no sense
for a small country with only a minor need for disposal volume in the distant
future, perhaps forty years from now.
As a straightforward solution to the above-mentioned difficulties it has been
decided to plan the phase-2 project around the development of a deep-hole disposal
facility. The geological field measurements will comprise 216 mm Ф test drillings
in the rock salt to a depth of approximately 3000 m. Information from measure
ments on the borehole logging, together with the results from electromagnetic
scanning of the surroundings of the hole will be utilized to the maximum, when
the disposal facility, apart from the diameter of the hole, is similar to the test hole
itself.
The safety analysis will be based primarily on the analysis of a ‘design basis
accident’, where the uplift of the.salt dome brings the inventory of radioactivity
in the facility to the top of the dome. From here the radioactive isotopes migrate
into sediments with groundwater capping the salt dome. Presumably this escape
scenario is the only one which is based on some real physical mechanisms.
It is worth mentioning that this approach towards the phase-2 project offers
some possibility to utilize the heavy investment in this working period during
the interim period until an actual facility will be needed. This is because the test
hole could be provided with a casing and left open for further investigation of some
of the properties of the salt and dome like creep, uplift, corrosion, etc. In this way
the available design and safety basis for a facility to be constructed some time after
the year 2000 will be quite impressive.
3. FIELD MEASUREMENTS FOR SELECTED SALT DOMES
The present phase of the project aims at selecting at least two salt domes
as potential sites for a repository. There are about 24 salt domes and pillows in
Denmark in the North of Jutland. Some of these have previously been explored
■mainly in connection with oil, salt, and potash prospecting and also in connection
with their suitability for storage of compressed air and natural gas.
Based on previous investigations and the geological knowledge of the area,
the following domes have been chosen for further investigation: Vejrum, Parup,
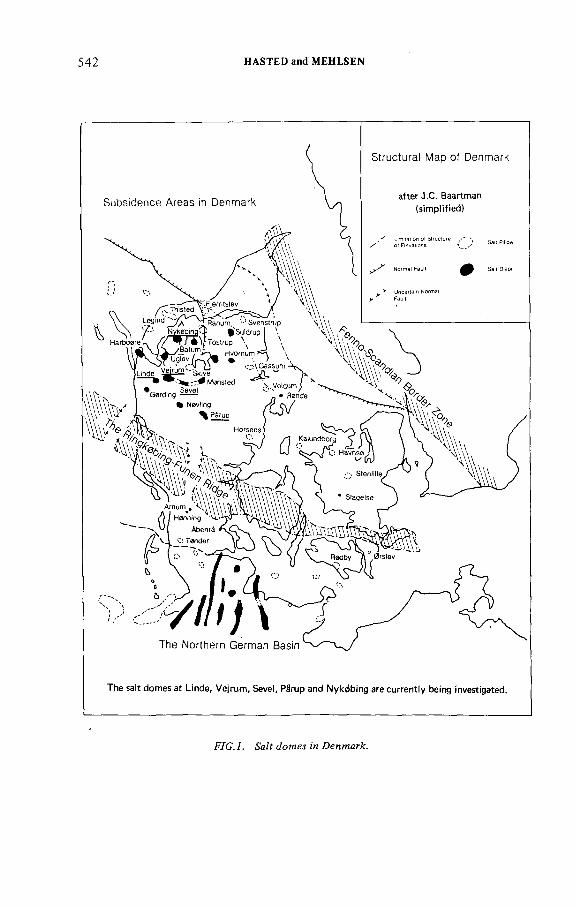
542 HASTED and MEHLSEN
FIG.l. Salt domes in Denmark,

IAEA-SM-243/154 543
Sevel, Nykÿbing and Linde (Fig.l). These domes have been chosen with due
regard to their size, elevation, purity of salt, hydrogeology of the layers above the
salt, etc. Of these only the dome at Vejrum has previously been drilled [2].
Information about the domes is scanty.
The following field measurements are planned and will be carried out during
the next few months.
1. Geophysical measurements
At present reflection and refraction seismic investigations from the surface are
in progress. It is expected that these will yield reasonably good information
about the boundaries of the salt dome. In addition to the surface seismic studies,
borehole seismic studies would also be conducted at a later stage.
One of the criteria in selecting a salt dome is the purity of salt. Salt domes
in Northern Germany are known to contain potassium and magnesium salts such
as camallite as well as brine and gas inclusions. The presence of unsuitable
minerals, etc., may present difficulties in the design and operation of a repository.
Carnaliite, for example, has a low melting point (265°C), and releases crystal water
at 110°C. It is very soluble and its strength is greatly reduced with temperature.
Repositories in salt domes with large amounts of carnallite are to be avoided — or
designed specifically to combat the problem. It is not easy to locate these
deleterious minerals, etc. by drilling alone — particularly when one wants to avoid
piercing a salt dome more than is absolutely -necessary. This is particularly so in
salt domes where the folded layers are steeply inclined, as vertical drilling alone
does not in that case yield enough information.
Geophysical measurements in a drilled hole are therefore a key to obtaining
as much information from a drilled hole as possible. These methods are, however,
in their infancy, and due to competition between the oil prospecting companies
the development of new methods and their performance is enshrouded with
secrecy. It is hoped that the present meeting will spur the development and use
of these methods. In particular the following two methods appear to be promising
and it is our intention to use them if we can.
(i) Electromagnetic methods
Different salt types, rocks, and minerals have different electrical properties.
By sending high-frequency electromagnetic pulses and measuring their reflection [3]
and transmission, boundaries of different minerals in salt deposits can be ascertained.
Thin moist layers (less than 1 cm thick) of clay can be.detected at distances as far
away as 500 m. Layers thicker than 1 cm have been detected at distances 2 km
away. Carnallite in Germany has always been associated with clay and this method
would help detect it. Full details of the method are, however, not yet available
to us.

544 HASTED and MEHLSEN
Presence of minerals of different densities can be ascertained by lowering a
gravimeter in a borehole. Very sensitive gravimeters capable of detecting anomalies
several metres away from the borehole have recently been developed and are the
property of one or two oil companies. Their performance is not published. Very
sensitive gravimeters are not yet commercially available.
(ii) Gravimetric methods
2. Deep drilling
Vertical drilling down to a depth of 3000 m is envisaged in at least two salt
domes. Cores would be tested for structural strength at different temperatures,
chemical analysis, brine and gas content and age determination. The usual logging
(sonic, gamma, etc.) would be performed. To obtain maximum information on
the inclined layers in a salt dome it may be that deviated drilling perpendicular
to the inclined layers will also be carried out. We are considering leaving the holes
open to enable refined geophysical measurements to be carried out at a later stage,
as well as for in situ stress and creep measurements. These measurements would
have great value for the schemes based on disposal in very deep holes.
3. Hydrogeological investigations
These investigations would be carried out by drilling holes in the strata
overlying the dome. Geophysical logging would be used to obtain a good picture
of the hydrogeological properties of thé overlying strata. In addition to the usual
hydrogeological tests for obtaining information about groundwater hydrology,
chemical tests for determining the ion-exchange properties of the soil will be
performed. It is hoped that with a careful analysis of salt content in the soil
and groundwater, as well as by age determination, the rate of dissolution of the
salt dome can also be ascertained. From discussions with colleagues working on
similar problems in other countries it has been our experience that not enough
attention is given to the selection of a dome by geophysical measurements and
drillings. Both the FRG and the USA appear to work more on the philosophy
that the characteristics of the salt — just like the suitability of the dome — can
first be ascertained only after building a shaft and mining galleries. This is a very '
expensive procedure and much expense can be saved and errors avoided if the
selection can be based largely on the results of accurate and refined geophysical
measurements. International co-operation to develop these methods would be
profitable.

IAEA-SM-243/154 545
In the repository layout we assume the spent fuel elements to be reprocessed
and the waste to be vitrified. Further it is anticipated that the spent fuel elements
and the waste canisters will be stored in pools, so that at least 30 years will elapse
from unloading of fuel elements to final emplacement of the waste canisters.
The capacity of the repository will correspond to the amount of high-level waste
resulting from six light-water reactors, each of 1000 MW(e), running over a period
of 25 years and loaded equivalent to 7000 full-load hours per year.
* The problems which are encountered in disposing Of high-level waste in salt
formations and especially in salt domes are related to the size of the thermal load
to which the dome is exposed. In our design we have achieved a low thermal load
of the repository, first through the long period of storage, secondly by choosing
a waste canister with a relatively low content of radioactive waste like the one
used in the Swedish KBS-study. Finally, the size of the Danish salt domes together
with the small amounts of waste allow the dispersal of waste in the domes to such
an extent as to obtain a specific thermal load as low as 5 W/m2. Due to these
measures the maximum temperatures will only exceed 60°C in a small amount of
the salt just around the canister (diameter 400 mm, length 1500 mm), which is
remarkably low compared with German and American layouts, where maximum
temperatures of 200—250°C are encountered.
For the phase-1 project a repository layout based on known mining technology
was chosen. The repository comprises a number of shafts connecting the surface
to a system of galleries. These are situated at a depth of 200—250 m below the
cap rock of the salt dome, and a corresponding minimum distance to the flanks of
the dome is sought. The disposal holes for the waste canisters are drilled vertically
through the floor of the galleries, each hole 50 m deep and 50 m away from the
next.
After emplacement of the canisters the holes are backfilled with crushed salt
and sealed. When the repository is finally shut down, the galleries are backfilled
with crushed salt. The shafts are sealed with a mixture of bentonite and sand, but
a watertight plug of asphalt and concrete is placed between the shafts and the
galleries in order to ensure safety from penetration of water.
The temperature distribution around the canisters in the salt has been
calculated. The highest temperatures are reached 2—3 years after emplacement.
The temperature rise half a metre from the centre of the disposal holes is about
40°C. The geothermal temperature at the depth in question is about 20°C, and
so the temperatures are around 60°C. Consequently only small amounts of salt
are exposed to a higher temperature than 60°C.
The maximum temperature rise in the gallenes is about 13°C, and several
years will elapse before this temperature level is reached. Stress calculations of
the gallery profile show that it might be necessary to reinforce the galleries near
3. LAYOUT OF A HIGH-LEVEL WASTE REPOSITORY

546 HASTED and MEHLSEN
Depth in ш
—0-
0 . 0
- 2 3 0
400-500-
700-
1000-
-Cement plug
-Asphalt plug
-Bentonite plug
- Cement plug
3000 -*■
500m 500m 500m
Vitrifiedradioactivewaste
Disposal in mine
a)
Jf-900 m
100 m
= i l T 100 m
= ¿ JV''Shaft
FIG.2. Deep borehole disposal proposal.
IAEA-SM-243/154 547
the position of the disposal holes, if the repository is kept open until the maximum
temperatures occur.
This shaft-gallery was the preferred layout in our phase-1 work, because it
is based on a known mining technology and can be built with commercially
available equipment. Further, it offers the possibility of a detailed examination
of the disposal holes before emplacement of the canisters. On the other hand it
is sure to be a rather expensive layout for the small amount of waste in question.
That is why other more non-traditional layouts have been studied.
The necessary effective length of the disposal holes is about 8000 m, corre
sponding to 5400 canisters each of 1.5 m length. In the preferred layout this is
achieved by 200 holes each with an effective length of 40 m. An alternative
proposal is based on a shaft-gallery layout comprising 27 disposal holes of 300 m
length. Here the total length of the galleries is considerably reduced compared
to the preferred layout. See Fig.2a.
Two alternative proposals comprise four disposal holes each of 2000 m length,
but without shafts and galleries. See Fig.2b. The holes are either drilled from
the surface as separate holes or drilled by deviation technique from the bottom
of a bigger lined hole drilled a proper distance down in the salt dome.
During phase-2 of our waste disposal project we shall put emphasis on
studying the layout comprising separate disposal holes each of 2000—3000 m
length, since there are a number of advantages in this type of layout. Our field
investigation programme contains one deep drilling in three or four different salt
domes. These drillings can be considered part of the final repository in a deep
hole layout. So one is able to examine the actual disposal holes immediately,
thereby having the best possibilities of finding evidence of the suitability of the
salt domes as a host for a repository. This layout also allows the placement of
single disposal holes so far apart that no interaction (thermal or otherwise) will
take place between the holes. The layout is well adapted to a batchwise disposal
mode, the batches corresponding to 5—10 years’ high-level waste production.
The canisters will be placed far deeper below the surface than in a shaft-gallery
design, thus reducing the possibility of salt dome uplift bringing the canisters to
the top of the dome and also reducing the probability of ‘human intrusion’ into
the sealed repository. Finally, it is believed that this type of layout will be
economically attractive.
It may be mentioned that a study has been started of the advantages of
encapsulating the canisters in thick-walled steel-cylinders (wall-thickness up to
25 cm) before final emplacement. Combined with the low maximum temperatures
encountered in our layouts it seems possible in this way to create a barrier which
for maybe several thousand years can isolate the waste from the biosphere. The
expected long lifetime of a thick mild steel container in a salt dome is due to the
fact that this barrier itself involves lower maximum temperatures in the salt and
very low radiolysis because of the very much reduced radiation level. Hereby the
548 HASTED and MEHLSEN
migration of brine and formation of oxygen is reduced, causing very slow corrosion
even of a material such as mild steel.
4. SAFETY EVALUATION
During the first phase of our waste disposal investigations the long-term
safety appraisal of the repository has been provisional in nature and based upon
a number of conservative assumptions due to lack of more specific data. Such
evaluations are, however, useful as descriptions of the framework within which
more realistic assumptions may be made. These evaluations also provide convincing
evidence that engineering measures such as low heat loads and long-lasting canning
for protection against irradiation and leaching will reduce the importance of the
purity of the salt and the properties of the overlying strata.
Potential release mechanisms were found either to result from inherent
continuous processes such as possible movement of brine inclusions, diapirism
of the salt dome, etc. or from sudden disruptive events such as earthquakes, drilling
in the salt and similar processes which may result in fracture zones extending from
the surrounding layers into the salt interior. The following three release scenarios
were considered to represent or give a worst-case estimate of the release potential
from the different possible mechanisms:
(1) brine migration in connection with the heat production in the waste;
(2) movements of the salt interior, transporting waste to the top of the salt dome;
(3) flooding of the deposit from overlying groundwater-bearing strata.
Brine inclusions are often found in salt deposits, especially in bedded salt.
Experiments [4, 5, 6] indicate that under certain circumstances such inclusions
can migrate through salt up a temperature gradient if the inclusions are single
phase fluids and down a temperature gradient if the inclusions also contain a free-
gas phase.
The interpretation of these experiments on massive salt layers is somewhat
uncertain, but nevertheless the models have been used to get an estimate of the
importance of these phenomena. Assuming that the salt contains 0.5% brine
inclusions, that the amount of brine attracted by the waste dissolves a quantity
of glass corresponding to the solubility of Si02 and that the direction of brine
movement thereafter is reversed due to gas production, then the amount of radio
active material reaching the underside of the caprock will be as shown in Table I.
The dominating isotope carried by the brine is 239Pu, the maximum amount being
3.8 X lO”6 Ci/a.
The second scenario involved the slow upward movement of the salt which
seems to take place in most salt domes. The upward movements in Danish salt

IAEA-SM-243/154 549
TABLE I. RELEASE OF RADIOACTIVE MATERIALS FROM THE
REPOSITORY IN CASE OF DIFFERENT POTENTIAL SCENARIOS
Half-lifeyears
Brine migration: year 75 000 — 100 0 0 0 Ci/a
Dome upheaval: year 200 000 - 230 000 Ci/a
Flooding: year 3000 - 4000 Ci/a
Cs-135 3 X 1Ó6 .5.9 X 10' 7 2.2 X 10~2 0.06
Tc-99 210 000 2.4 X 10’ s 0.6 3.5
Am-241 433 - - 0.88
Am-243 7 650 1.1 X 10' 7 3.6
Pu-240 6 760 • 1.5 X 10' 6 - 1.7
Pu-239 24 400 3.8 X 10~6 . 5.4 X 10~3 0.75
Np-237 2.1 X 10⁶ 1.7 X 10' 6 6.4 X 10~2 0.15
Ra-225 7 300 4.1 X 10' 7 ' 3.6 X 10*2 -
Ra-226 1 600 9.7 X 10~9 5.4 X 10"4 -
U-233 162 000 4.4 X 10' 7 2.4 X 10' 2 - -
domes have been suggested to be 0.1-1 mm/a. If the waste cylinders move
together with the salt and the layout of the repository is taken into account it
will take the waste at least 200 000 years to reach the cap rock. The dominating
isotopes will be 237Np, 229Th, and 226Ra in quantities of 0.064, 0.036, and
5.4 X 10⁻⁴ Ci/а, respectively, or appreciably more than in the previous case.
See Table I.
Flooding o f the repository in the sense that water from the surrounding
layers penetrates into the closed salt dome due to a sudden disruptive event is
perhaps more difficult to visualize. On the other hand it is also difficult to
visualize that events such as earthquakes, collapse along fracture zones, dissolution
of unobserved carnallite layers, etc. could have other consequences than water ''
penetrating all thè way to the repository. In our case it seems reasonable to
assume that-the water in the repository is in hydrostatic equilibrium with the
water-bearing layers penetrating the salt. Although some kind of a diffusion
process would be the more natural dispersal mechanism to expect it has been
assumed that the salt solution will be squeezed out of the fracture due to creep
as suggested in Ref. [7].
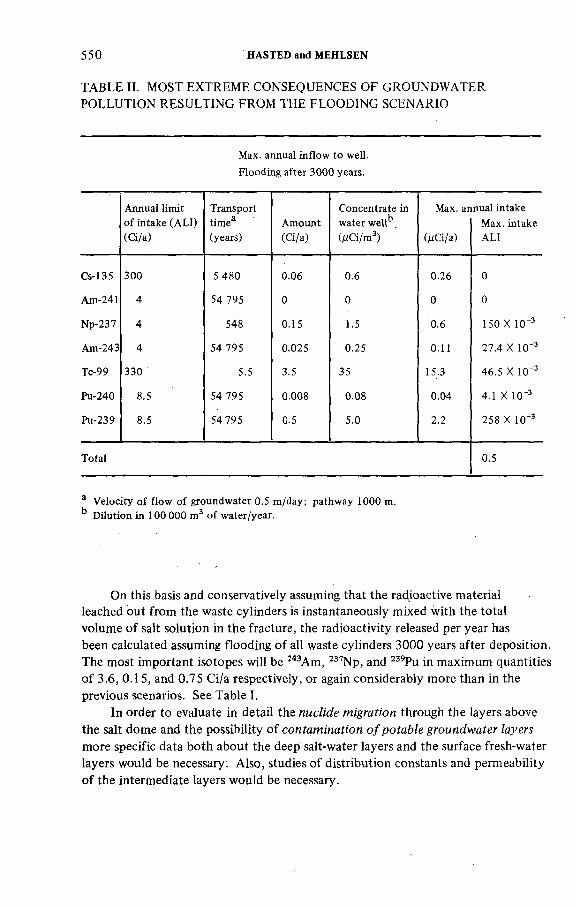
550 HASTED and MEHLSEN
TABLE II. MOST EXTREME CONSEQUENCES OF GROUNDWATER
POLLUTION RESULTING FROM THE FLOODING SCENARIO
Max. annual inflow to well. Flooding after 3000 years.
Annual limit Transport Concentrate in Max. annual intakeof intake (ALI) timea Amount water well^ Max. intake(Ci/a) (years) (Ci/a) (¿íCi/m3) (цС'1/а) ALI
Cs-135 300 5 480 0.06 0.6 0.26 0
Am-241 4 54 795 0 0 0 0
Np-237 4 548 0.15 1.5 0.6 150 X 10“3
Am-243 4 54 795 0.025 0.25 0.11 27.4 X 10' 3
Tc-99 330 5.5 3.5 35 15.3 46.5 X 10' 3
Pu-240 8.5 54 795 0.008 0.08 0.04 4.1 X 10' 3
Pu-239 8.5 54 795 0.5 5.0 2.2 258 X 10“3
Total 0.5
a Velocity of flow of groundwater 0.5 m/day; pathway 1000 m. k Dilution in 100 000 m3 of water/year.
On this basis and conservatively assuming that the radioactive material
leached out from the waste cylinders is instantaneously mixed with the total
volume of salt solution in the fracture, the radioactivity released per year has
been calculated assuming flooding of all waste cylinders 3000 years after deposition.
The most important isotopes will be 243Am, 237Np, and 239Pu in maximum quantities
of 3.6, 0.15, and 0.75 Ci/а respectively, or again considerably more than in the
previous scenarios. See Table I.
In order to evaluate in detail the nuclide migration through the layers above
the salt dome and the possibility of contamination o f potable groundwater layers
more specific data both about the deep salt-water layers and the surface fresh-water
layers would be necessary. Also, studies of distribution constants and permeability
of the intermediate layers would be necessary.
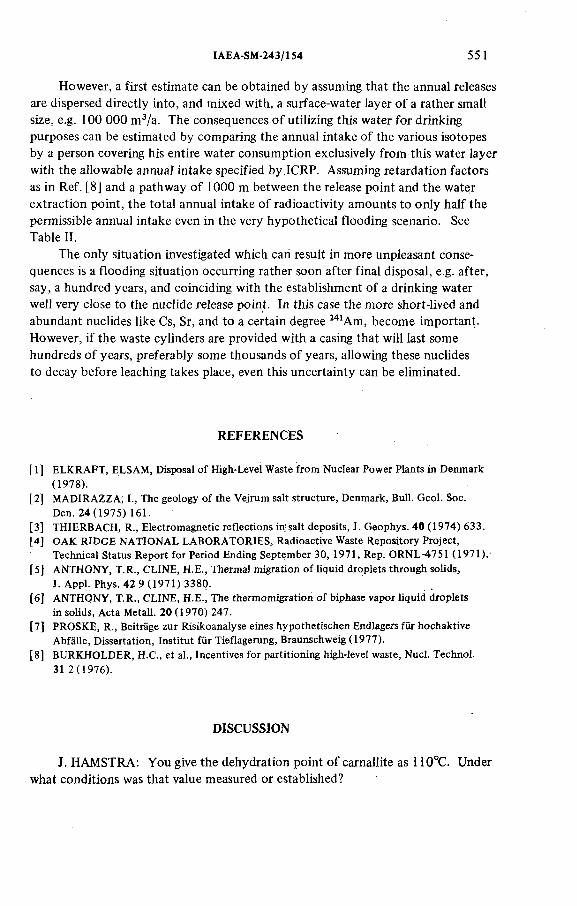
IAEA-SM-243/154 551
However, a first estimate can be obtained by assuming that the annual releases
are dispersed directly into, and mixed with, a surface-water layer of a rather small
size, e.g. 100 000 m3/a. The consequences of utilizing this water for drinking
purposes can be estimated by comparing the annual intake of the various isotopes
by a person covering his entire water consumption exclusively from this water layer
with the allowable annual intake specified by.ICRP. Assuming retardation factors
as in Ref. [8] and a pathway of 1000 m between the release point and the water
extraction point, the total annual intake of radioactivity amounts to only half the
permissible annual intake even in the very hypothetical flooding scenario. See
Table II.
The only situation investigated which can result in more unpleasant conse
quences is a flooding situation occurring rather soon after final disposal, e.g. after,
say, a hundred years, and coinciding with the establishment of a drinking water
well very close to the nuclide release point. In this case the more short-lived and
abundant nuclides like Cs, Sr, and to a certain degree 241Am, become important.
However, if the waste cylinders are provided with a casing that will last some
hundreds of years, preferably some thousands of years, allowing these nuclides
to decay before leaching takes place, even this uncertainty can be eliminated.
REFERENCES
[ 1 ] ELKRAFT, ELSAM, Disposal of High-Level Waste from Nuclear Power Plants in Denmark (1978).
[2] MADIRAZZA, I., The geology of the Vejrum salt structure, Denmark, Bull. Geol. Soc.Den. 24(1975) 161.
[3] THIERBACH, R., Electromagnetic reflections in;salt deposits, J. Geophys. 40 (1974) 633.[4] OAK RIDGE NATIONAL LABORATORIES, Radioactive Waste Repository Project,
Technical Status Report for Period Ending September 30, 1971, Rep. ORNL-4751 (1971).-[5] ANTHONY, T.R., CLINE, H.E., Thermal migration of liquid droplets through solids,
J. Appl. Phys. 42 9 (1971) 3380.[6] ANTHONY, T.R., CLINE, H.E., The thermomigration of biphase vapor liquid droplets
in solids, Acta Metall. 20 (1970) 247.[7] PROSKE, R., Beitrage zur Risikoanalyse eines hypo the tischen Endlagers für hochaktive
Abfâlle, Dissertation, Institut für Tieflagerung, Braunschweig (1977).[8] BURKHOLDER, H.C., et al., Incentives for partitioning high-level waste, Nucl. Technol.
31 2(1976).
DISCUSSION
J. HAMSTRA: You give the dehydration point of carnallite as 110°C. Under
what conditions was that value measured or established?

552 HASTED and MEHLSEN
S. MEHLSEN: The 110°C figure was an assumption for the phase-1 work.
We are looking forward to obtaining a better figure from the German programme
some time during our phase-2 work.
. J. HAMSTRA: I would like to make some critical comments on your
conservative approach to the flooding scenario. First of all, let me stress that it '
is desirable to remain realistic in making assumptions in connection with a worst-
case approach to any hazard assessment. For example, you àssume that the high-
level waste disposed of in boreholes will come into contact with the water flooding
the mine. All boreholes may be sealed off redundantly as soon as they are filled
with canisters. Did you really take into account the 100 m plug length you provide
in your concept above the high-level waste in each borehole? That length of
pathway can be penetrated only by diffusion.
If you assume creep to be the driving force in moving brine out of the flooded
mine, you should also allow for that creep to react on the fracture which provided
the passageway, and for the fracture, if in rócksalt, to be closed by creep.
If the fracture is through a porous anhydrite bank, did you also take into'
account the fact that during transport over distances of more than hundreds of
metres the brine will be cooled and become oversaturated, resulting in deposition
of rock salt? This will close the passageway.
S. MEHLSEN: I fully agree that we must remain realistic in establishing
release scenarios.
As for the consequences of a flooding situation, the calculations were made
for a facility with a mine/gallery configuration of about 200-300 m below the
cap rock. Presumably, they cannot be utilized in connection with a deep-hole
facility. . .
In calculating the release of dissolved radioactivity via the fracture, we did
not take into account the effect of oversaturation of the water. ,
R.H. BECK: Have you investigated the technical feasibility of drilling large-
diameter (say 500 mm) storage holes through 2000 m of solid salt down to a depth
of 3000 m, and if so, what are your views on the subject?
S. MEHLSEN: No, we have not. This is planned in connection with the
design work to be carried out during the next year. We plan to draw on the
experience of oil and natural gas exploration in deciding on deep-hole diameters. .
We also intend to study the creep properties of salt in deep test holes.
553
G E N E R A L D IS C U S S IO N
ON SESSION X
J.M. HARRISON: The President of the International Council of Scientific
Unions (ICSU) has asked me to inform you that the Council has established a
review committee that may be of interest to all of you here. Following a suggestion
made by the US National Academy of Sciences, ICSU has formed a review team
consisting of internationally known scientists to review the programme of research
into ways of disposing safely of high-level nuclear wastes. This facet of the nuclear
programme is considered to be of general concern throughout the world and is
one that lends itself to such a review.
Why ICSU? It was felt that an independent appraisal of what is being done
by an international non-governmental scientific organization might be more
acceptable to the uncommitted world scientific community than statements from
the agencies which are assisting in the development of nuclear power. Since ICSU
is the major non-governmental scientific organization, with membership of
academics from all parts of the world and with membership of 18 scientific unions
covering all disciplines, it is the logical agency to support such a review.
The review is to focus mainly on the programmes sponsored by the inter
national agencies to ensure that all facets of research needed on the problems of
disposal are adequately covered by research programmes under way or currently
planned. Three particular aspects are to be investigated — terrestrial disposal,
marine disposal, and pathway analyses from disposal site to man. So far, the
three leaders of these working groups have been selected and a steering or planning
committee has been established that consists of the three Chairmen of working
groups and five members appointed by the President of ICSU.
Official contacts have been made with senior members of IAEA in Vienna,
NEA/OECD in Paris and CMEA in Moscow. All have assured ICSU of their
co-operation and, indeed, their encouragement for the initiative. The ICSU review
will clearly be looking for gaps in the programmes and it is significant that the
agencies welcome such an appraisal. The Council hopes that such a review will
result in the recognition by the world’s scientific community that the programme
proposed and being undertaken is as complete as it can be.
Members of the review committee are: J.M. Harrison (Canada), Chairman;
W.S. Fyfe (Canada), Chairman of working group on terrestrial disposal;
Charles Hollister (USA), Chairman of working group on marine disposal; and
F. Morley (UK), Chairman of working group on pathway analyses. H. Lacombe
(France); F.B. Straub (Hungary); Takeo Watanabe (Japan); V.V. Yemelyanov
(USSR).
H. NIINI: The Underground Disposal of Wastes Commission of the Inter
national Association of Engineering Geology (IAEG) would also like to inform
554 GENERAL DISCUSSION
you about its work in this area. As Dr. Morfeldt, the chairman of the Commission,
had to leave, he asked me to perform this task. The Commission was established
partly on the initiative and with the financial support of UNESCO. Its work,
was started in 1976, at a meeting in connection with the Geological Congress in
Australia. The Commission consists of 14 experts nominated by the Executive
Committee or the President of the IAEG. The purposes of the Commission work
are strictly related to engineering geology. A report concerning the authorities
involved and the specific regulations at present ¡applied in the various member
countries is in preparation.
The Commission has three sub-commissions to deal with different types of
waste: (1) solid waste, (2) liquid waste and (3) nuclear waste. The chairman of
the nuclear waste group is Professor Paul Witherspoon from the United States.
At present he is drawing up a report on the results of a questionnaire submitted
to the members on the most urgent items. The commission had a meeting here in
connection with this symposium and the status (of the commission’s work and
future plans were discussed.
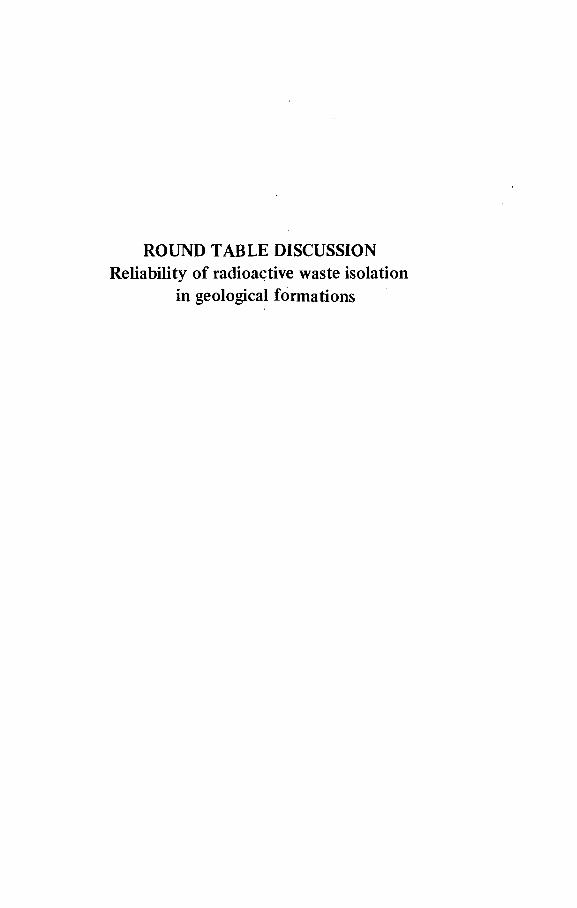
R O U N D T A B L E D IS C U S S IO N
R e lia b il ity o f rad ioac tive w aste is o la tio n
in geo log ica l fo rm a tio n s

Round Table
Chairman
C.A. HEATHUnited States of America

R O U N D T A B L E D IS C U S S IO N
The re lia b ility o f rad io ac tive waste iso la tio n in geo log ic fo rm a t io n s
Chairman:
C.A. HEATH (United States of America)
Participants:
A. BARBREAU (France)
S.R. HATCHER (Canada)
K. KUHN (Federal Republic of Germany)
A. LARSSON (Sweden)
V.I. SPITSYN (Union of Soviet Socialist Republics)
G.A.M. WEBB (United Kingdom)
C.A. HEATH (Chairman): The main subject areas scheduled to be covered
in this Round Table discussion are listed in the programme as follows:
(1) Available options for underground disposal: current developments and
possible new initiatives. .
(2) Technical.and scientific.aspects of waste disposal in geologic formations,
including radiological considerations.
(3) Political and social issues relevant to underground disposal.
(4) Correlation of waste type and disposal options, multibarrier concepts for
improving the reliability of waste isolation.
(5) Review of geological evidence demonstrating the isolation capability of
specific geological environments.
Rather than take up each of these subjects separately, we shall ask the
individual membérs of the Panel to summarize their views on the state of waste
disposal technology. It can be expected that in so doing they will touch on most
of the points included in the list. Where appropriate, questions which have been
submitted in writing will also be introduced into the discussion and panel members
will be asked to try and answer them.
From the papers that have been presented during the past week it is clear
that there are a number of matters which need to be discussed and which we,
as members of the scientific and technical community, will have to be concerned
with right now and in the years ahead. The first of these is the manner of
557
558 ROUND TABLE DISCUSSION
selecting sites which could serve as geological repositories. There has been
discussion about establishing formalized criteria providing site selection factors;
it has been suggested that these could perhaps be combined with weighting
factors and applied in some mathematical sense. I believe that much more work
is needed in this area. It is necessary to determine not only what these factors
might be but also to decide whether they could ever be used effectively — in
other words, whether or not decisions could be based on mathematical calculations
performed by technical people. The second issue is the continuing responsibility
of the technical community to ensure that all the scientific issues are dealt with
adequately. I think that in this connection it would perhaps be advisable to seek
wider participation of other scientific disciplines since we are dealing with a
problem which is of fundamental importance for human society as a whole.
A third consideration is the change in emphasis that seems to be taking
place in our technical studies, which are focusing less exclusively on salt deposits
than was the case at the IAEA Symposium in 19671. What are the reasons for
this shift? Is it because more information is available about salt and its alternatives
or does it merely reflect the wider diversity of countries and scientists participating
in the programme and the greater number of candidate geological environments
that might be available?
A fourth issue is the significance of the multiple-barrier concept. How
effective will engineered barriers be; how much emphasis should be placed on
them? Is there really a change in approach, with greater emphasis being placed
on using additional barriers than relying primarily on the geology itself?
Lastly, there is the question of defining the requirements for the isolation
of various types of radioactive wastes, a matter which is likely to gain importance
in the years to come. For example, should the isolation requirements for the
disposal of spent fuel be different from those for high-level reprocessing waste?
Should the requirements be different for transuranic-contaminated wastes and .
low-level wastes?
I now call upon the members of the Panel to give their views on these issues.
K. KÜHN : I should like to comment first on the main reasons for our
considering geologic formations to be suitable sites for radioactive waste disposal.
Geologic formations are to be found everywhere and many of them have been
stable for very long periods of time and can be expected to remain stable long
enough to meet the requirements of radioactive waste disposal. There are also
geologic formations which are well isolated from moving groundwater. The main
objective in radioactive waste disposal is to isolate the waste from the biocycle
long enough for the radioactivity to decay to concentrations which pose no greater
risk to man than present or future risks due to other causes.
1 Symposium on Disposal of Radioactive Wastes into the Ground, Vienna, 29 May — 2 June 1967.
ROUND TABLE DISCUSSION 559
Since the only medium which can transport radioisotopes from an underground
repository back into the biocycle is moving groundwater, it was only natural,
when the experts began to consider radioactive waste disposal into geologic
formations, that they concentrated on those formations which contained, or
had in the neighbourhood, no moving groundwater. Consequently, in the early
and mid fifties when the National Academy of Sciences in the USA published
a report on waste disposal, the main emphasis was placed on salt formations.
A number of countries are working on this problem, among them, the USA, the
Netherlands, Denmark, the Federal Republic of Germany, the Soviet Union,
Poland and the German Democratic Republic. This work is well advanced and
some countries plan to go ahead with the construction of repositories in salt.
France, Canada and the United Kingdom are considering the use of salt deposits
as a back-up solution.
As more and more countries began to study the possibilities of radioactive waste
disposal into geologic formations during the early and mid seventies, other
types of formation were also selected for investigation. Various authors at this
Symposium have dealt with a wide variety of hard rocks, including intrusive
crystalline rocks — mainly granite — effusive rocks and metamorphic rocks,
especially gneisses. These types of formation are receiving attention in the USA,
Canada, Japan, Sweden, Finland, the Soviet Union, Switzerland, the United
Kingdom and France. Sedimentary rocks, mainly clays and shales, and also
anhydrites, are being investigated as well. There are several reasons for conducting
studies over such a wide range, one of the most important being the need of
many countries to investigate a variety of sites in their own territory in order to
see what types of formation are available and which kinds could be used. There
are political problems, too, so that the question of radioactive waste disposal
has so far remained a strictly national matter. (We all know what difficulties we
encounter at home so that it is premature to think in terms of international
repositories at this stage.)
Another point in this connection is that countries which have reprocessing
plants either in operation or in the construction or planning stage are considering
the possibility of shipping back the solidified radioactive wastes to those countries
whose spent fuel elements they reprocess. A further political consideration is
associated with the stand taken by the authorities in many countries that no
nuclear power plants will be licensed until a solution has been found regarding
radioactive waste disposal. There is also the general problem of public acceptance.
Difficulties of convincing the public have resulted in more and more formations
being selected for investigation, as nobody wants to exclude any option for
waste disposal. Lastly, in view of the question of public acceptance and related
problems, many countries have begun to examine the geologic formations which
lie beneath their national nuclear laboratories.
In conclusion, I would like to make three suggestions on the subject of
underground disposal of radioactive wastes. First, international co-operation in
560 ROUND TABLE DISCUSSION
this field should be increased. This should not be too difficult as no secrets are
involved and no big profits are to be made. Some work is already being done
under bilateral agreements and also under international programmes sponsored
by the Commission of the European Communities and the Nuclear Energy Agency
of OECD as well as the IAEA.
Secondly, we have to undertake the non-scientific task of convincing our
politicians and our public that solutions to the radioactive waste disposal
problem are available or will be available in the near future.
Thirdly, we should go ahead with the construction of a repository somewhere
and thus demonstrate that we have the necessary methods, technology and
science. I think a breakthrough would be achieved if any one country could
build the first underground repository, even if it were only a demonstration
facility, because this would convince the politicians and the man in the street
that great progress has indeed been made.
A. BARBREAU: I shall make a few comments prompted by papers presented
at this Symposium and the discussions to which they gave rise. First of all,
since the main problem is that of long-lived emitters, our approach to radioactive
waste disposal in future should not be limited to the consideration of fission
products and long-lived emitters incorporated in glass. We should also pay
attention to other types of waste which can in some cases contain appreciable
quantities of alpha-emitters and present problems quite comparable, from the
standpoint of long-term safety, to those of glasses.
A second point concerns the size of the radioactive waste repositories,
especially when the waste involves a high thermal load. We tend to think in terms
of deep systems extending over several square kilometres. This obviously involves
relatively large empty volumes and considerable perturbation of the geological
medium — hence the difficulties of finding geological formations which are
homogeneous on such a scale. We should beware of oversimplifications based on •
repositories which are relatively small in area.
The third point I wish to make refers to the containment period which
has to be considered. At present we hear of figures like 10 000, 100 000 and
even several million years. In my opinion, we really cannot approach the question
from the point of view of laying down absolute values. The problem can be
solved only by making an overall risk analysis. The important consideration is
that of damage to the environment and it is this factor that should be evaluated
on the basis of some plausible hypotheses. Besides, beyond a certain period of
time which is no longer significant on the human scale, extrapolations from our
present state of knowledge are generally not justified.
There are several consequences of this. In the first place, the disposal
cannot be considered to be reversible after a few decades. So when the repository
is abandoned, its long-term safety should be ensured by the intrinsic characteristics
of the disposal, in terms either of containment by engineered or geological
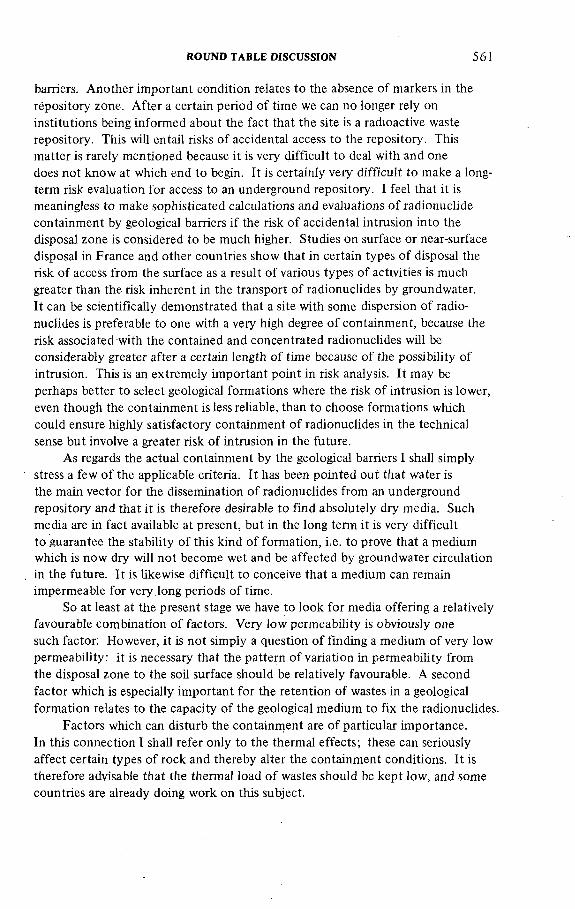
ROUND TABLE DISCUSSION 561
barriers. Another important condition relates to the absence of markers in the
repository zone. After a certain period of time we can no longer rely on
institutions being informed about the fact that the site is a radioactive waste
repository. This will entail risks of accidental access to the repository. This
matter is rarely mentioned because it is very difficult to deal with and one
does not know at which end to begin. It is certainly very difficult to make a long
term risk evaluation for access to an underground repository. I feel that it is
meaningless to make sophisticated calculations and evaluations of radionuclide
containment by geological barriers if the risk of accidental intrusion into the
disposal zone is considered to be much higher. Studies on surface or near-surface
disposal in France and other countries show that in certain types of disposal the
risk of access from the surface as a result of various types of activities is much
greater than the risk inherent in the transport of radionuclides by groundwater.
It can be scientifically demonstrated that a site with some dispersion of radio
nuclides is preferable to one with a very high degree of containment, because the
risk associated with the contained and concentrated radionuclides will be
considerably greater after a certain length of time because of the possibility of
intrusion. This is an extremely important point in risk analysis. It may be
perhaps better to select geological formations where the risk of intrusion is lower,
even though the containment is less reliable, than to choose formations which
could ensure highly satisfactory containment- of radionuclides in the technical
sense but involve a greater risk of intrusion in the future.
As regards the actual containment by the geological barriers I shall simply
stress a few of the applicable criteria. It has been pointed out that water is
the main vector for the dissemination of radionuclides from an underground
repository and that it is therefore desirable to find absolutely dry media. Such
media are in fact available at present, but in the long term it is very difficult
to guarantee the stability of this kind of formation, i.e. to prove that a medium
which is now dry will not become wet and be affected by groundwater circulation
in the future. It is likewise difficult to conceive that a medium can remain
impermeable for very , long periods of time.
So at least at the present stage we have to look for media offering a relatively
favourable combination of factors. Very low permeability is obviously one
such factor; However, it is not simply a question of finding a medium of very low
permeability: it is necessary that the pattern of variation in permeability from
the disposal zone to the soil surface should be relatively favourable. A second
factor which is especially important for the retention of wastes in a geological
formation relates to the capacity of the geological medium to fix the radionuclides.
Factors which can disturb the containment are of particular importance.
In this connection I shall refer only to the thermal effects; these can seriously
affect certain types of rock and thereby alter the containment conditions. It is
therefore advisable that the thermal load of wastes should be kept low, and some
countries are already doing work on this subject.
562 ROUND TABLE DISCUSSION
A number of geologic formations of different types have been considered.
In the strictly technical sense, none of them has all the advantages. For example,
crystalline rocks are easy to work from the mining point of view and are not of
great economic interest, but their fissures create problems. Salt rocks have
roused a good deal of interest, because of their thermal properties and very low
permeability. Unfortunately, they are a raw material and it is very difficult to
make long-term estimates as to possible future uses of salt formations. Clay rocks
have very important ion-exchange properties but their disadvantage is that they
make mining operations difficult and often occur in a hydrogeological context
which is not very favourable. Some countries are also interested in submarine
sediments. These, too, offer certain advantages.
I should like to say in conclusion that, as a geologist, I am still fully convinced
that we shall be able to find geological formations with favourable characteristics
for the containment of radioactive waste over the period of time needed to ensure
that no unacceptable risk is posed to the environment. A more difficult problem
is the evaluation of long-term risks of accidental intrusion into the repositories.
The necessary in situ studies should be undertaken immediately in order to verify
that the geological formations which have been considered satisfy the criteria
for the containment of radioactive waste. Some countries have already embarked
upon these studies. We can reasonably expect that in the next few years we
shall have the initial specific data necessary for confirming the feasibility of
constructing radioactive waste repositories in geological formations under
appropriately safe conditions.
V.I. SPITSYN: I would like to make the following points in connection
with underground disposal of radioactive waste. First, because of the danger
not only of diffusion into groundwater but also of dissemination by birds,
animals and winds, liquid radioactive waste, even of the low-level type, must not
be disposed of in open trenches or basins. Secondly, the disposal of liquid and
solidified wastes must be investigated under very different conditions. Thirdly,
the physico-chemical, thermal and mechanical properties of sojid geological
formations need to be studied under conditions of high irradiation and elevated
temperatures. Fourthly, geologists will have to make recommendations about
geological formations at depths of 100 m or more where groundwater does not
penetrate. If there are cracks in the formations, they must be filled before
disposal activities are initiated. Fifthly, every deep repository for radioactive
waste, regardless of the method of disposal, must be subject to permanent
chemical and radiological surveillance. Lastly, since the canisters constitute a
very important barrier against the loss of radioactive waste, the interaction
between the canister material and the geological formations must be studied at
high temperatures and under irradiation conditions.
G.A.M. WEBB: Since I am a member of the panel which is supposed to
deal with aspects of radiological protection, I should like to say something about

ROUND TABLE DISCUSSION 563
the basic philosophy of radiation protection and indirectly to answer some of
the questions that have been raised, for example, on matters such as the criteria for
assessing the worth of a repository design and comparisons with natural radiation.
Perhaps I should mention that I shall be expressing the more conventional views
of the International Commission on Radiation Protection (ICRP).
The concern in waste disposal should be to protect man from radiation,
and this comes under the general objective of protecting man from sources of
all types of radiation, including wastes of the nuclear power industry. The basic
principles of the ICRP (as restated only two years ago) which apply to all these sources
are that individual doses should not exceed certain limits and that the main
purpose of radiation protection is to ensure that doses are as low as reasonably
achievable, taking economic and social factors into account. That last phrase
means that in deciding on the level of protection it is quite correct to take into
account the costs of achieving a certain level of protection.
At this stage, the first step in evaluating geological disposal of high-level
or other waste should be the assessment of the cost of the various options.
Secondly, we should assess for each option the costs associated with the detriment
from radiation doses — i.e. the collective dose and the monetary value to be
assigned to it. When I speak of options I am not necessarily referring to fundamental
choices, say, between salt and hard rock but to different depths of disposal in
the same media or different thicknesses of canisters or materials. We should
choose the option which minimizes the total cost — i.e. the sum of the monetary
cost and the radiation detriment. Having done that, we should estimate the
maximum individual doses and ensure that they do not exceed the limits.
This procedure will indicate the best solution to the problem in terms of
radiation protection. If it then turns out that there is an essentially political
decision to do more than is necessary on radiation protection grounds, it will
at least be clear that the additional money spent is not for radiation protection
purposes but for other purposes, which may be quite legitimate.
I would like to make a comment on the demonstration repository proposed
by Dr. Kiihn. There would have to be two aspects to such a demonstration.
One would be the demonstration of our technological capability for putting the
waste where we want it. The other part would be trying to convince the public,
the regulatory authorities and other scientists that the proposed disposal system
is acceptably safe. The only way this can be doné is by predictive modelling,
i.e. assessment of consequences on the basis of satisfactory models and a good
data base. The research conducted in connection with this programme, if it is to
be relevant, should be in either of those two areas.
In conclusion, I should like to say a few words on comparisons with natural
radiation. This is a useful approach but it must be used with care. I do not
think (nor does ICRP, as far as I am aware) that we can say that doses are
acceptable because they happen to be ‘X ’% of natural background; it may cost

564 ROUND TABLE DISCUSSION
practically nothing to reduce these doses to 0.5 X % or 0.1 X %. The principle of
“as low as reasonably achievable” clearly means that if it does not cost anything
the doses should be reduced.
However, what I think we could legitimately do is to assess the doses after
the optimization process I have described and then make a comparison with
natural radiation. If the doses are small in comparison with radiation levels or
variations in radiation levels, we have further support — of a quite different
kind — for the proposition that such doses will not cause very drastic effects
now or in the future.
We have been asked to comment on the relative toxicities of radioactive
wastes and pitchplende ores. There is no fundamental truth, in my opinion,
to the statement that “natural things are not harmful”. Earthquakes, flood and
hurricanes are natural but we protect ourselves against them. Sunlight is natural
radiation but too much sunshine causes skin cancer. Conversely, we would not
conclude, if we were dealing with a chemical with no natural analogue and
therefore with no zero background levels, that none of it should ever be released,
regardless of the risks or the benefits associated with it. So, while such comparisons
are useful and provide supporting evidence, they should not. be relied upon as
fundamental arguments.
A. LARSSON : More and more it is becoming a universal requirement that
countries using nuclear power will have to take care of the radioactive waste
produced by their nuclear reactors. It is therefore only natural that they should
consider how radioactive waste could be disposed of within their own territories.
In this connection a number of different disposal options are being investigated,
each with its advantages and disadvantages.' In the case of disposal in hard rock,
for instance, it is difficult to find a perfect geological site — i.e. one which has
no cracks or no groundwater. This was realized by the KBS people in Sweden
when they proposed using the so-called multibarrier concept which was inspired
to some extent by the Swedish “Stipulation Law” which requires demonstration
of a completely safe disposal method. Relying on a system comprising several
barriers which are independent of one another to the greatest possible degree,
the KBS people thought that they would be able to provide such a demonstration.
The introduction of this concept also facilitated evaluation of the proposed
project by the safety authorities. Lack of agreement among specialists, in
particular geologists, makes it difficult to decide that any single barrier is entirely
reliable. The multibarrier concept, however, provided a basis for convincing
the authorities that the project as a whole could be endowed with properties
that would make it completely safe within the terms of the Stipulation Law.
The multibarrier concept also has a number of inherent merits not covered
in the Swedish Stipulation Law. For example, we must of necessity rely on a
number of safety barriers in the case of catastrophic events because a single
barrier may not be effective enough. Besides, I think the general public and the
ROUND TABLE DISCUSSION 565
political bodies will find it easier to understand the safety aspects when several
such barriers are provided. With reference to a particular site, the introduction
of more than one barrier permits some kind of optimization, taking into
consideration, for instance, the type of material to be disposed of: spent fuel,
high-, low- or intermediate-level waste, etc. Lastly, although the multibarrier
concept seems to be most suitable for disposal in hard rock, it could also be of
advantage for other disposal concepts.
S.R. HATCHER: Our common objectives in waste disposal are safety and
responsibility to future generations. Operational safety is a traditional objective
in nuclear power generation and clearly accounts for our excellent safety record
to date. The objective of long-term responsibility is more recent and we are
perhaps pioneers in this regard. Our society does not traditionally handle toxic
materials with so much concern for future generations.
However, in Western countries we find ourselves in a dilemma: the public
and the politicians are not yet convinced that radioactive waste can be handled
safely. Their concern sometimes takes the form of opposition to site selection
and in some cases even to research. And we ask ourselves “Why? ” and “What
can we do about it? ” I should like to makea few points in this connection.
First of all, radioactive materials with half-lives and toxicities comparable
to those of nuclear waste have existed on earth since the beginning of time;
man has been exposed to substantial levels of natural radiation since he first
walked the earth. Yet, by and large, the public is unaware of these two facts and
does not understand radiation. So it is easily frightened by critics who use waste
disposal as an issue in an attempt to stop the use of nuclear power. Obviously, we
in the scientific community have done a poor job in communicating the facts
to the public.
Secondly, if we distinguish between storage and disposal, then I don’t think
there is any doubt that we can store materials safely and for many decades.
So the technical need for permanent disposal is not urgent. In fact, many
countries do not intend to practise industrial-scale disposal until after the turn
of the century. But to fulfil our responsibility, we must develop the technology
and demonstrate its safety so that it can be used when there is a political decision
to do so.
This brings us to the third point: What constitutes a demonstration? We
can develop waste treatment methods in our laboratories, we can drill rocks, we
can build deep underground repositories and we can fill them with waste. That
will be a demonstration of technology. But it will not demonstrate long-term safety.
The geologist cannot completely guarantee that the repository will remain dry
under all conditions, the engineer cannot guarantee to prevent water reaching
the waste under all conditions and the chemist cannot guarantee that in contact
with water the waste will have absolute zero solubility.
Safety therefore relies on defence in depth — the multibarrier approach.
The demonstration of safety must be analytical; it must be based on an integrated
566 ROUND TABLE DISCUSSION
systems analysis of the effectiveness of the series of barriers for preventing harm
to man and the environment. Defence in depth refers to the availability of
several lines of defence — it does not mean that we must be able to rely on each
one of them to do the entire job. While we agree that several treatment methods
and several types of geology and several repository designs will probably be
adequate, we do need a quantitative indication of safety, derived from a model
as theoretically rigorous as we can make it and using reliable physical, chemical,
engineering and geological data. Most of this work will be done in research
laboratories, but an essential requirement is geological data and samples, and
these must come from research drilling. So we come back to where we started
from, because we face public acceptance problems in getting permission to drill.
I am convinced that the only way we are going to get that permission and
support is to inform the public and the politicians of the facts, and inform them
in a way they can understand — not by giving them thick volumes of technical
jargon which they cannot translate into everyday terms. Scientists and engineers
must be prepared to talk to them openly and honestly, in non-technical terms.
To do this they must have informative material which contains the basic facts
and puts them in a perspective to which the public can relate. This process will
take a long time. But since many of us don’t intend to practise large-scale
disposal in this century, we have the necessary time to inform the public effectively.
Wherever possible we should set aside site selection activities and concentrate
on the research necessary to complete the conceptual safety analysis, together
with the social and economic impact analyses. The latter are very important
because no matter how small the risk, if the public perceives that the benefit of '
the waste disposal is zero, then we don’t have a very favourable risk/benefit ratio.
With an informed public and with this sort of assessment I think we have a
much better chance in selecting sites.
In conclusion, I would observe that:
(1) It is premature to set quantitative criteria for siting; instead we should rely
on a total systems analysis for safety;
(2) The main research efforts should be directed towards refining methods for
safety assessment and providing sound data for the assessment;
(3) It is essential to make public information much more effective. I am sure
that the large majority of the public will understand the facts and give their
support if we communicate effectively. If we don’t, it will be very difficult
to do research or, later on, to obtain a site.
C.A. HEATH (Chairman): The members of the Panel have been asked to
comment on the subject of quantitative success criteria for underground disposal
in terms of the length of time during which isolation should be required and in
terms of the relative toxicity of the waste until it reaches a level comparable
with that of naturally-occurring ore bodies. It has also been suggested that a
comparison should be made between the safety of nuclear waste repositories
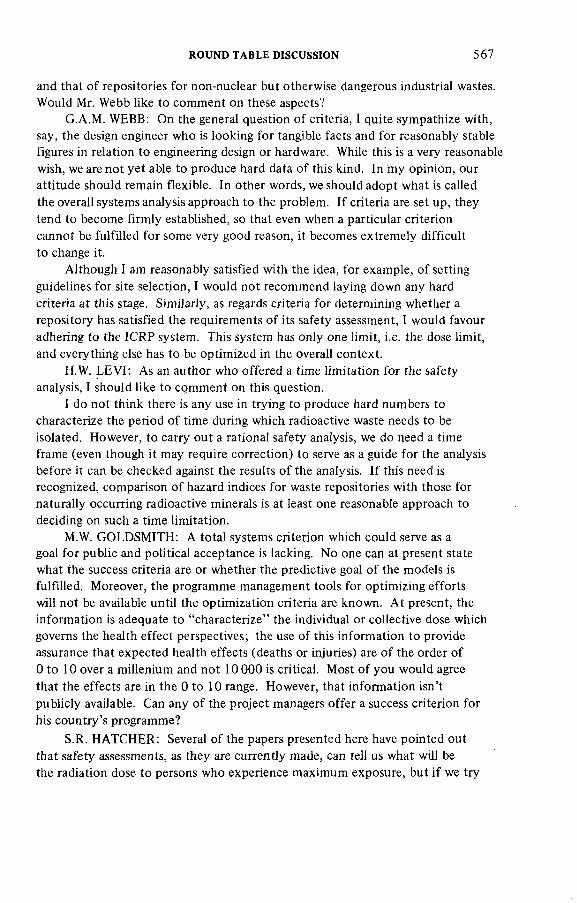
ROUND TABLE DISCUSSION 567
and that of repositories for non-nuclear but otherwise dangerous industrial wastes.
Would Mr. Webb like to comment on these aspects?
G.A.M. WEBB: On the general question of criteria, I quite sympathize with,
say, the design engineer who is looking for tangible facts and for reasonably stable
figures in relation to engineering design or hardware. While this is a very reasonable
wish, we are not yet able to produce hard data of this kind. In my opinion, our
attitude should remain flexible. In other words, we should adopt what is called
the overall systems analysis approach to the problem. If criteria are set up, they
tend to become firmly established, so that even when a particular criterion
cannot be fulfilled for some very good reason, it becomes extremely difficult
to change it.
Although I am reasonably satisfied with the idea, for example, of setting
guidelines for site selection, I would not recommend laying down any hard
criteria at this stage. Similarly, as regards criteria for determining whether a
repository has satisfied the requirements of its safety assessment, I would favour
adhering to the ICRP system. This system has only one limit, i.e. the dose limit,
and everything else has to be optimized in the overall context.
H.W. LEVI: As an author who offered a time limitation for the safety
analysis, I should like to comment on this question.
I do not think there is any use in trying to produce hard numbers to
characterize the period of time during which radioactive waste needs to be
isolated. However, to carry out a rational safety analysis, we do need a time
frame (even though it may require correction) to serve as a guide for the analysis
before it can be checked against the results of the analysis. If this need is
recognized, comparison of hazard indices for waste repositories with those for
naturally occurring radioactive minerals is at least one reasonable approach to
deciding on such a time limitation.
M.W. GOLDSMITH: A total systems criterion which could serve as a
goal for public and political acceptance is lacking. No one can at present state
what the success criteria are or whether the predictive goal of the models is
fulfilled. Moreover, the programme management tools for optimizing efforts
will not be available until the optimization criteria are known. At present, the
information is adequate to “characterize” the individual or collective dose which
governs the health effect perspectives; the use of this information to provide
assurance that expected health effects (deaths or injuries) are of the order of
0 to 10 over a millenium and not 10 000 is critical. Most of you would agree
that the effects are in the 0 to 10 range. However, that information isn’t
publicly available. Can any of the project managers offer a success criterion for
his country’s programme?
S.R. HATCHER: Several of the papers presented here have pointed out
that safety assessments, as they are currently made, can tell us what will be
the radiation dose to persons who experience maximum exposure, but if we try
568 ROUND TABLE DISCUSSION
to project into the future on the basis of what the population distribution is
going to be around a particular site, we encounter great difficulties in arriving
at the number of deaths or injuries to be expected.
C.A. HEATH (Chairman): I think that it is important not to become
hypnotized by specific numbers. Many of the safety analyses which have been
carried out, including some published in the USA, do indeed give figures for
estimated health effects, but as technical people we have to recognize just what
the value of those numbers is. To begin with, the predictions of health effects
as a function of dose vary among reputable and qualified scientists by two orders
of magnitude. Besides, in these analyses they have to make a number of
assumptions. The goal of programme managers is to use these methods as tools;
they do not claim that the figures they work with represent absolute values
which can precisely define the level of risk. The figures are valid only in a
relative sense.
H. PIRK: During this symposium different repository concepts have been
discussed by authors from various countries. The approaches taken in these
concepts are surprisingly varied. One approach relies upon sophisticated and
expensive multiple barriers while another places very little emphasis on man-made
barriers, depending entirely on the barrier potential of geological formations.
Would the members of the Panel like to comment on this?
A. BARBREAU: The safety of underground repositories should be based
mainly on the concept of full risk analysis of the entire sequence of events likely
to lead to the release of radionuclides into the environment. This being the
case, we obviously have to depend on a number of barriers, including the form
of the conditioned waste which can be expected to slow down the release of
radionuclides. The first barrier which is taken into account is, generally speaking,
the form of waste as conditioned for disposal. I must refer here to the varying
views among the different experts on the stability provided by the primary
conditioned waste products, in the case of incorporation into glass the values
quoted range from a few hundred to several million years. Satisfactory knowledge
of the stability of the primary barriers is essential, for without it'no serious risk
analysis can be carried out.
As for engineered barriers, some countries, such as Sweden and France, at
present base their safety assessments on the principle of multiple barriers.
In certain types of rock, for example crystalline rocks, it will certainly be
useful to provide additional barriers for reinforcement (e.g. barriers having
ion-exchange capacities) around the canisters to be deposited.
Another problem with such barriers has to do with their long-term behaviour.
We obviously have no experience on this subject as far as engineered barriers
are concerned. Studies and experiments on this subject are already under way
or are being planned in some countries. A fair number of these studies will
have to be completed before these barrier concepts can be used realistically
in safety analyses.

ROUND TABLE DISCUSSION 569
In the case of geological barriers, I think it will certainly be possible to
make risk evaluations by taking some ranges of values within certain limits.
The essential problem now is not so much the modelling of radionuclide
transport, concerning which a number of workable mathematical tools are ■
available, as the accuracy with which the physical pàrameters of the geologic
medium can be measured, especially at great depths. We need to develop
techniqués for such measurements so that mathematical models can make use
of these parameters in a really significant manner.
K. KUHN: Following the publication of the Swedish KBS report, everyone
is now trying to include additional geochemical barriers in his disposal concept.
In my opinion, however,' it is essential in addition to emphasize the protective
potential of the geological formation itself. We should consider not only
additional man-made barriers but also the geological formation itself either as a
retardation element or as a barrier providing isolation from circulating ground
water. Unless we do this we shall be facing a problem of our own making.
A. LARSSON: It must be borne in mind that the multibarrier concept
does not mean that all barriers should be made as strong as technically possible.
In a real project we would try to optimize the different barriers, eliminating
those which are not necessary. Considerable reliance can be placed on the
geological formations themselves. I agree with Mr. Kühn that otherwise we
could find ourselves in à very difficult situation. All the same, we should
confine to carry out research and development work on the potential of the
barrier concept, not all aspects of which have yet been explored.
L.B. NILSSON: As the KBS reports have been referred to repeatedly, I
would like to reiterate that they were prepared to meed the requirements of a
certain law and lay no claim whatever to offering the solution. They merely
present one possible solution. Our work to date constitutes more or less a
feasibility study which is important in that it can be used as the basis for
efforts to reach a'technically more optimizéd solution and a better understanding
of the mechanisms governing safety.
C.A. HEATH (Chairman): In the USA it is considered that the KBS studies,
in spite of the constraints under which they were performed, contain interesting
ideas and concepts which warrant closer study. We must be able to present a
solution which, in the eyes of the public, is perfectly safe. The concept of
mutually independent multiple barriers could indeed provide such an assurance.
It has to be realized that there are uncertainties in the material sciences, in
geochemistry and in geology and that perhaps the approaches are not so divergent
after all, since we are all talking about more than one barrier. The fact that
we solidify wastes prior to placement in geological formations illustrates this
very well.
H.A. PIRK: The applicability and usefulness of risk analysis for geological
repositories is widely questioned, many arguing that risk analysis can only be
570 ROUND TABLE DISCUSSION
made for existing and operating facilities. A lot of sound information on the
reliability of subsystems and components is required for the purpose but such
information cannot be extrapolated into the geological future. Does the Panel
think that the data required to make the risk analysis useful can be obtained?
V.I. SPITSYN: In my opinion, efforts should be made by geologists to find
formations which are suitable for the disposal of waste. How can we reach conclusions
about the stability of a repository in the earth’s crust over millions of years?
Let me give you one example. Lying beneath Moscow, at a depth of 300 metres,
there are sands impregnated with bitter water of the ancient Devonian sea.
These formations, which have existed for 300 million years, are overlain by a
50 m thick stratum of clay. But the Muscovites have never had to drink bitter
water rather than sweet water. This example shows that geologists can find
formations which have remained stable for millions and millions of years.
Similar conditions can also be encountered in crystalline rocks.
G.A.M. WEBB: If such assurances can be reliably given by the geologists,
the work of risk analysis will be simplified a good deal. The problem lies in
determining the probabilities that these assurances will still hold in the future.
Mr. Pirk’s question raises a point which hasn’t been discussed yet — namely,
the distinction between the operational phase of a repository and the phase
after it has been closed down. The techniques of fault-tree analysis can, I think,
reasonably be applied to an operating installation in the same way as to normal
engineering installations: the accident consequences will probably be relatively
rapid and can therefore be assessed. However, once the repository is sealed,
the conventional techniques don’t really apply and this is where we can consider
what has been called the multibarrier concept.However, the analysis of this system will have to rely not so much on
detailed engineering analysis, as on more robust predictions — probably based
on collective opinion as well as on hard fact — of the types and likelihood of
certain events which might occur. And these will then have to be folded into
an overall predictive assessment.
C H A IR M E N O F S E S S IO N S
VOL. I
Session I A. BARBREAU France
Session II I.S. ZHELUDEV . IAEA
Session III N.S. SUNDER RAJAN India
Session IV K. KÜHN Federal Republic of Germany
Session V P.A. WITHERSPOON United States of America
VOL. II
Session VI
Session VII
Session VIII
Session IX
Session X
Round Table
H. STIGZELIUS
L.B. NILSSON
V.I. SPITSYN
F.S. FEATES
,E. MALÁSEK
C.A. HEATH
Finland
Sweden
Union of Soviet Socialist Republics
United Kingdom
Czechoslovakia
United States of America
S E C R E T A R IA T O F T H E S Y M P O S IU M
Scientific D.K. RICHTER
Secretaries:
F. GERA(
Administrative Edith PILLER
Secretary:
Editor:
Records
Officer:
R. PENISTON-BIRD
S.K. DATTA
Division of Nuclear Safety and
Environmental Protection, IAEA
OECD Nuclear Energy Agency
Division of External Relations,
IAEA
Division of Publications, IAEA
Division of Languages, IAEA
571


ARGENTINA
Friz, С.
Paganini, С.Е.
AUSTRALIA
Alsop, R.J.L.
Knight, M.J.
Merritt, J.C.
Shirvington, P.I.
AUSTRIA
Komurka, M.
Oszuszky, F.J.P.
Rudan, P.
Saringer, G.
L IS T O F P A R T IC IP A N T S
Comisión Nacional de Energía Atómica, Av. del Libertador 8250,Buenos Aires - 1429
Comisión Nacional de Energía Atómica, Av. del Libertador 8250,Buenos Aires — 1429
Austronic Engineering Laboratories Pty Ltd, 24 Lexton Road,Box НШ, Vic. 3128
University of New South Wales,School of Applied Geology,P.O. Box 1,Kensington, New South Wales
Austronic Engineering Laboratories Pty Ltd, 24 Lexton Road,Box Hill, Vic. 3128
Australian Atomic Energy Commission,P.O. Box 41, Coogee 2034,New South Wales
Ôsterreichische Studiengesellschaft für Atomenergie GmbH, Lenaugasse 10, A-108 2 Vienna
Ôsterreichische Verbundgesellschaft,Am Hof 6A, A-1010 Vienna
Ôsterreichische Elektrizitatswirtschafts-Aktiengesellschaft, Am Hof 6A, A-1010 Vienna
Bundesministerium für Gesundheit und Umweltschutz, Stubenring 1, A-1010 Vienna
573

574 LIST OF PARTICIPANTS
BELGIUM
Bonne, A.A.
Cole-Baker, J.
Gilly, L.
Heremans, R.H.
Lambotte, J.M.
Manfroy, P.L.H.
Stephenson, D.
Van den Damme, R.A.
Vanhaelewyn, R.
BRAZIL
Rozental, J.J.
BULGARIA
Stefanov, G.I.
CANADA
CEN/SCK,Boeretang 200, B-2400 Mol
D’Appolonia Consulting Engineers, Inc., Boulevard du Sauvérain, В-1170 Brussels
Société de Traction et d’Electricité, S.A., Rue de la Science 31, B-1040 Brussels
CEN/SCK,Boeretang 200, B-2400 Mol
Ministère de la Santé publique,Institut d’hygiène et d’épidémiologie,Rue Juliette Wytsman 14, B-1040 Brussels .
CEN/SCK,Boeretang 200, B-2400 Mol
D’Appolonia Consulting Engineers, Inc., 2530 Alamo SE, Suite 103,Albuquerque, New Mexico, USA
Intercom, S.A.,Place du Trône 1, B-1000 Brussels
C E N /S C K ,
Boeietang 200, B-2400 Mol
Comissao Nacional de Energía Nuclear, Rua General Severiano 90-Botafogo, 22230-Rio de Janeiro, Guanabara
Institute of Nuclear Research and Nuclear Energy, Sofia
Barnes, R.W. Ontario Hydro,700 University Avenue, Toronto, M8V-1P8
LIST OF PARTICIPANTS 575
CANADA (cont.)
Barraud, C.J.
Charlwood, R.G.
Davison, C.
Dixon, D.F.
Fritz, P.
Hatcher, S.R.
Howieson, J.
Lyon, R.B.
Poliscuk, V.E.
Scott, J.S.
CZECHOSLOVAKIA
Nuclear Programmes Division,Federal Activities Branch,Environmental Protection Service, Department of Fisheries and Environment, Place Vincent Massey,Ottawa, Ontario K1A 1C8
Klohn Leonoff Consultants Ltd,10180 SheUbridge Way,Richmond, British Columbia V6X 2W7
Environment Canada,Hydrology Research,562 Booth Street,Ottawa, Ontario K1A 0E7
Atomic Energy of Canada Ltd,Chalk River Nuclear Laboratories,Chalk River, Ontario KOJ 1 JO
Department of Earth Sciences,University of Waterloo,Waterloo, Ontario N2L 3G1
Whiteshell Nuclear Research Establishment, Pinawa, Manitoba ROE 1LO
Department of Energy, Mines and Resources, 580 Booth Street,Ottawa, Ontario K1A 0E4
Whiteshell Nuclear Research Establishment, Pinawa, Manitoba ROE 1 LO
Atomic Energy Control Board,270 Albert Street,P.O.Box 1046,Ottawa, Ontario KIP 5S9
Geological Survey of Canada,Department of Energy, Mines and Resources, 580 Booth Street,Ottawa, Ontario K1A 0E4
Hladkÿ, E. Nuclear Power Plants Research Institute, Jaslovské Bohunice
576 LIST OF PARTICIPANTS
Kortus, J.
Maláíek, E.
Marek, J.
Seda, J.
CZECHOSLOVAKIA (cont.)
Chemoprojekt,Stepánská 15, Prague 2
Czechoslovak Atomic Energy Commission,Slezská 9, Prague 2
Ceské energetické závody,Odbor jademé energetiky,Jungmannova,111 48 Prague 1
Faculty of Nuclear Science and Physical Engineering, Brehová7,115 19 Prague 1
DENMARK
Andersen, L.J.
Brodersen, K.
Emmersen, P.K.G.
Hannibal, L.
Hasted, F.
H jgaard, K.E.
Jacobsen, F.L.
Geological Survey of Denmark,Thoravej 31,DK-2400 Copenhagen NV
Ris0 National Laboratory,DK-4000 Roskilde
Ministry of the Environment,National Agency of Environmental Protection, Strandgade 29,DK-1401 Copenhagen К
The National Health Service of Denmark,State Institute of Radiation Hygiene, Frederikssundsvej 378,DK-2700 Bronshoj
ELKRAFT A.m.b.A.,Parallelvej 19,DK-2800 Lyngby
ELSAM,DK-7000 Fredericia
Geological Survey of Denmark,Thoravej 31,DK-2400 Copenhagen NV
Jensen,H. Inspectorate of Nuclear Installations, P.O. Box 217,DK-4000 Roskilde
LIST OF PARTICIPANTS 577
Joshi, A.V.
Laier, T.
Laureen, N.
Lund-Jensen, G.
Marcus, F.R.
Mehlsen, S.
Mortensen, L.
Skytte Jensen, B.
FINLAND
Aittola, J.-P.
Almark, B.J.K.
Aschan, R.
Bars, L.B.
DENMARK (cont.)
ELSAM,DK-7000 Fredericia
Geological Survey of Denmark,Thoravej 31,DK-2400 Copenhagen
ELKRAFT A.m.b.A.,Parallelvej 19,DK-2800 Lyngby
ELSAM,DK-7000 Fredericia
Nordic Liaison Committee for Atomic Energy, с/o Risÿ National Laboratory,DK-4000 Roskilde
ELSAM,DK-7000 Fredericia
Ministry of the Environment,National Agency of Environmental Protection, Strandgade 29,.DK-1401 Copenhagen К
Risф National Laboratory,DK-4000 Roskilde
Technical Research Centre of Finland, Reactor Laboratory,Otakaari 3 A,SF-02150 Espoo 15
Imatran Voima Oy,P.O. Box 138,SF-00101 Helsinki 10
Helsinki Metropolitan Area Council, Sahkottajankatu 21 B,SF-00520 Helsinki 52
Technical Research Centre of Finland, Reactor Laboratory,Otakaari 3 A,SF-02150 Espoo 15
578 LIST OF PARTICIPANTS
Gardemeister, R.A.
FINLAND (cont.)
Imatran Voima Oy, P.O. Box 138, SF-00101 Helsinki 10
Halme, J.A. Imatran Voima Oy, P.O. Box 138, SF-00101 Helsinki 10
Hârkônen, H.T. Technical Research Centre of Finland, Reactor Laboratory,Otakaari 3 A,SF-02150 Espoo 15
Heinonen, J.U. Technical Research Centre of Finland, Reactor Laboratory,Otakaari 3 A,SF-02150 Espoo 15
Heinonen, O.J. Department of Radiochemistry, University of Helsinki, Unioninkatu 35,SF-00170 Helsinki 17
Heiskanen, K.A.
Hiekkanen, R.P.T.
Technical Research Centre of Finland, Reactor Laboratory,Otakaari 3 A,SF-02150 Espoo 15
Imatran Voima Oy,P.O.Box 138,SF-00101 Helsinki 10
Hiismàki, P. Technical Research Centre of Finland, Reactor Laboratory,Otakaari 3 A,SF-02150 Espoo 15
Holopainen, A.-P.
Holttinen, Leena-Marjatta
Technical Research Centre of Finland, Geotechnical Laboratory,Otakaari 3 A,SF-02150 Espoo 15
Department of Radiochemistry, University of Helsinki,Unioninkatu 35,SF-00170 Helsinki 17
LIST OF PARTICIPANTS- 579
Ikonen, K.
Шикка, E.I.
Immonen, S.I.
Jafs, D.
Jakobsson, K.O.
Jauho, P.
Kaikkonen, H.T.
Kallonen, I.
Karjala, J.
Kauranne, L.K.
Kohtala, Maija-Liisa
FINLAND (cont.)
Technical Research Centre of Finland, Nuclear Engineering Laboratory, P.O.Box 169,SF-00181 Helsinki 18
Institute of Radiation Protection, P.O.Box 268,SF-00101 Helsinki 10
Ministry of Trade and Industry, Energy Department, Rautatielàisenkatu 6,SF-00520 Helsinki 52
Oy Finnatom Ab,Ruoholahdenkatu 4,SF-00180 Helsinki 18
Institute of Radiation Protection, P.O.Box 268,SF-00101 Helsinki 10
Technical Research Centre of Finland, Vuorimiehentie 5,SF-02150 Espoo 15
Technical Research Centre of Finland, Nuclear Engineering Laboratory,P.O. Box 169,SF-00181 Helsinki 18
Imatran Voima Oy,P.O.Box 138,SF-00101 Helsinki 10
TVO Power Company,Kutojantie 63,SF-02630 Espoo 63
Geological Survey of Finland,SF-02150 Espoo
Department of Radiochemistry, University of Helsinki,Unioninkatu 35,SF-00170 Helsinki 17
580 LIST OF PARTICIPANTS
Korpela, K.
Kortelainen, P.I.
Koskinen, M.D.
Kuusi, E.J.
Kuuskoski, M.V.
Laasonen, P.
Lax, Marianne
Lehtinen, P.V.
Lumiaho, K.
Màkipentti, I.M.O.
Manninen, M.J.A.
Miettinen, J.K.
FINLAND (cont.)
Geological Survey of Finland, SF-021 SO Espoo
Helsinki Energy Board,P.O.Box 469,SF-00101 Helsinki 10
Energiatalondellinen Yndistys, P.O.Box 27,SF-00131 Helsinki 23
Oy Finnatom Ab, Ruoholahdenkatu 4,SF-00180 Helsinki 18
Imatran Voima Oy,P.O.Box 138,SF-00101 Helsinki 10
University of Technology, Otakaari 3 A,SF-02150 Espoo 15
Department of Radiochemistry, University of Helsinki, Unioninkatu 35,SF-00170 Helsinki 17
Imatran Voima Oy,P.O.Box 138,SF-00101 Helsinki 10
Geological Survey of Finland, SF-02150 Espoo 15
Ministry of Trade and Industry, Energy Department, Rautatielàisenkatu 6,SF-00520 Helsinki 52
Ministry of Trade and Industry, Energy Department, Rautatielàisenkatu 6,SF-00520 Helsinki 52
Department of Radiochemistry, University of Helsinki, Unioninkatu 35,SF-00170 Helsinki 17
LIST OF PARTICIPANTS
Mikkola, I.
Mikkonen, A. A.
Muurinen, A.
Niini, H.
Niininen, H.P.
Nikula, Anneli
Numminen, Т.К.
Nykyri, M.
Ojala, О.
Paakkola, O.P.
Palmên, В.
FINLAND (cont.)
TVO Power Company,Kutojantie 8,SF-02630 Espoo 63
Suomen Malmi Oy,Finnexploration,Otakaari 11,SF-02150 Espoo 15
Technical Research Centre of Finland, Reactor Laboratory,Otakaari 3 A,SF-02150 Espoo 15
Geological Survey of Finland,SF-02150 Espoo 15
Imatran Voima Oy,P.O.Box 138,SF-00101 Helsinki 10
Department of Radiochemistry, University of Helsinki,Unioninkatu 35,SF-00170 Helsinki 17
Imatran Voima Oy,P.O.Box 138,SF-00101 Helsinki 10
Technical Research Centre of Finland, Reactor Laboratory,Otakaari 3 A,SF-02150 Espoo 15
Ministry of Internal Affairs,Department of Environmental Protection, Hallituskatu 4 E,SF-00170 Helsinki 17
Institute of Radiation Protection,P.O.Box 268,SF-00101 Helsinki 10
Ministry of Trade and Industry,Energy Department,Rautatielâisenkatu 6,SF-00520 Helsinki 52

582 LIST OF PARTICIPANTS
Peltonen, E.
Puttonen, J.A.
Râmô, E.G.
Rastas, A.J.
Regnell, B.A.O.
Riikonen, H.O.
Rónnqvist, P.-E.
Routti, J.T,
Ruokola, E.
Ruotsalainen, S.
Ryhànen, V.H.
FINLAND (cont.)
Technical Research Centre of Finland, Reactor Laboratory,Otakaari 3 A,SF-02150 Espoo 15
Technical Research Centre of Finland, Nuclear Engineering Laboratory, P.O.Box 169,SF-00181 Helsinki 18
Technical Research Centre of Finland, Reactor Laboratory,Otakaari 3 A,SF-02150 Espoo 15
TV О Power Company,Kutojantie 8,SF-02630 Espoo 63
Imatran Voima Oy,P.O.Box 138,SF-00101 Helsinki 10
Helsinki Energy Board,P.O.Box 469,SF-00101 Helsinki 10
Imatran Voima Oy,P.O.Box 138,SF-00101 Helsinki 10
Helsinki University of Technology, Department of Technical Physics, Otakaari 3 A,SF-02150 Espoo 15
Technical Research Centre of Finland, Reactor Laboratory,Otakaari 3 A,SF-02150 Espoo 15
TVO Power Company,Kutojantie 8,SF-2630 Espoo 63
TVO Power Company,Kutojantie 8,SF-2630 Espoo 63
LIST OF PARTICIPANTS 583
FINLAND (cont.)
Saari, K.H.O.
Salmi, M.
Salo, J.P.
Savolainen, l.T.H.
Silvennoinen, P.O.
Skyttâ, P.H.
Snellman, Margit
Stigzelius, H.-
Suonio, K.
Taijanne, R.A.
Tiainen, O.J.A.
Technical Research Centre of Finland, Geotechnical Laboratory,Atakaari 3 A,SF-02150 Espoo 15
Geological Survey of Finland,SF-02150 Espoo 15
Technical Research Centre of Finland, Nuclear Engineering Laboratory, P.O.Box 169,SF-00181 Helsinki 18
Technical Research Centre of Finland, Nuclear Engineering Laboratory, P.O.Box 169,SF-00181 Helsinki 18
Technical Research Centre of Finland, Nuclear Engineering Laboratory, P.O.Box 169,SF-00181 Helsinki 18
Imatran Voima Oy,P.O.Box 138,SF-00101 Helsinki 10
Technical Research Centre of Finland, Reactor Laboratory,Otakaari 3 A,SF-02150 Espoo 15
Geological Survey of Finland,SF-02150 Espoo 15
Ministry for Internal Affairs,Council of Environmental Protection, Hakaniemenkatu 2,SF-00530 Helsinki 53
Lappeenranta University of Technology, P.O.Box 57,SF-53101 Lappeenranta 10
Helsinki Energy Board,P.O.Box 469,SF-00101 Helsinki 10
584 LIST OF PARTICIPANTS
Tusa, E.H.
Tuura, L.A.
Váhamaa, Т.К.
Vàisànen, S.T.J.
Valkiainen, M.
Vapaavuori, O.
Vàyrynen, H.T.
Vilkamo, O.H.T.
Vilkamo, S.A.M.
Vira, J.E.
FINLAND (cont.)
Vuori, S.I.V.
Imatran Voima Oy,P.O.Box 138,SF-00101 Helsinki 10
Helsinki Energy Board,P.O.Box 469,SF-00101 Helsinki 10
Institute of Radiation Protection, P.O.Box 268,SF-00101 Helsinki 10
Institute of Radiation Protection, P.O.Box 268,SF-00101 Helsinki 10
Technical Research Centre of Finland, Reactor Laboratory,Otakaari 3 A,SF-02150 Espoo 15
TVO Power Company,Kutojantie 8,SF-02630 Espoo 63
Imatran Voima Oy,P.O.Box 138,SF-00101 Helsinki 10
Institute of Radiation Protection, P.O.Box 268,SF-00101 Helsinki 10
Technical Research Centre of Finland, Nuclear Engineering Laboratory, P.O.Box 169,SF-00181 Helsinki 18
Technical Research Centre of Finland, Nuclear Engineering Laboratory, P.O.Box 169,SF-00181 Helsinki 18
Technical Research Centre of Finland, Nuclear Engineering Laboratory, P.O.Box 169,SF-00181 Helsinki 18

LIST OF PARTICIPANTS 585
FINLAND (cont.)
Vuorinen, A.P.U.
Wilska, S.J.
FRANCE
Arod, J.
Barbreau, A.
Bardet, G.
Bastien Thiry, H.
Beunardeau, M.
Boulanger, A.
Brûlé, J.-L.
Cherel, G.H.
Institute of Radiation Protection, P.O.Box 268,SF-00101 Helsinki 10
Lappeenranta University of Technology, P.O.Box 57,SF-53101 Lappeenranta
CEA, Centre d’études nucléaires de Cadarache, SCA/SETEM,B.P. 1,F-13115 Saint-Paul-lez-Durance
CEA, Centre d’études nucléaires de Fontenay-aux-Roses, B.P. 6,F-92260 Fontenay-aux-Roses
PEC Engineering, Infratome,62, rue Jeanne d’Arc,F-75013 Paris
Cogéma,La Boursidière — Bâtiments G.H.I.,Route Nationale 186,F-92357 Le Plessis-Robinson Cedex
Electricité de France, «Service de la production thermique,Département Exploitation,Division Environnement/Sécurité,3, rue de Messine,F-75008 Paris
Geostock,Tour Aurore,Cedex 5,F-92080 Paris-La Défense
PEC Engineering, Infratome,62, rue Jeanne d’Arc,F-75013 Paris
Société générale pour les techniques nouvelles,B.P. 30,F-78184 Saint-Quentin Cedex
586 LIST OF PARTICIPANTS
Cohen, P.
Courtois, G.E.
Cousin, Odile
Cretey, J.
Fonné, С.
Goblet, P.
Guizerix, J:
Hagemann, R.
Juignet, Nicole
Lasseur, C.G.
FRANCE (cont.)
Commissariat à l’énergie atomique,29—33 rue de la Fédération,F-75752 Paris Cedex 15
CEN/FAR,Division de chimie,B.P. 6,F-92260 Fontenay-aux-Roses
CEN/FAR,IPSN/CSDR,B.P. 6,F-92260 Fontenay-aux-Roses
Service central de sûreté des installations nucléaires, Ministère de l’Industrie,99, rue de Grenelle,F-75700 Paris
Direction générale d’Electricité de France,Etudes économiques générales,2, rue Louis Murât,F-75008 Paris
Ecole des Mines de Paris,Centre d’information géologique,35, rue Saint Honoré,F-77305 Fontainebleau
CEN/Grenoble,Service d’applications des radioéléments et
des rayonnements,B.P. 85, Centre de Tri,F-38041 Grenoble Cedex
CEN/Saclay,Département de recherche et analyse,B.P. 2,F-91190 Gif-sur-Yvette
CEN/Saclay,DEMT/SMTS/TTMF,B.P. 2,F-91190 Gif-sur-Yvette
S.T.M.I.,26, rue du Château des Rentiers,F-75013 Paris

LIST OF PARTICIPANTS 587
FRANCE (cont.)
Laude, F.L.H.
Lavie, J.-M.
Ledoux, G.E.
Mouney, H.
Peaudecerf, P.F.
Pierias, R.
Pouteaux, M.
Pradel, J.
Rançon, D.
Rochon, J.
Sarcia, A.J.
CEA, Centre de Marcoule,B.P. 170,F-30200 Bagnols-sur-Cèze
Commissariat à l’énergie atomique,29—33, rue de la Fédération,F-75015 Paris
Ecole des Mines de Paris,Centre d’information géologique,35, rue Saint Honoré,F-77305 Fontainebleau
Electricité de France,1, avenue du Général de Gaulle,F-92140 Clamart Cedex
Bureau de recherches géologiques et minières, Département Hydrogéologie,Avenue de Concyr,B.P. 6009,F-45018 Orléans Cedex
Société générale pour les techniques nouvelles, B.P. 30,F-78184 Saint-Quentin-Yvelines Cedex
PEC Engineering, Infratome,30, rue Timbaud,F-92320 Châtülon/Bagneux
CEN/FAR,Service technique d’études de protection,B.P. 6,F-92260 Fontenay-aux-Roses
CEN/Cadarache,DSN/SRS/SESTR,B.P. 1,F-13115 Saint-Paul-lez-Durance
Bureau de recherches géologiques et minières, Département Minéralogie, Géochimie, Analyses, B.P. 6009,F-45018 Orléans Cedex
Commissariat à l’énergie atomique,29—33, rue de la Fédération,F-75015 Paris

588 LIST OF PARTICIPANTS
Slizewicz, P.J. Service central de sûreté des installations nucléaires,13, rue de Bourgogne,F-75007 Paris
Van Kote, F.A. CEN/FAR,B.P. 6,F-92260 Fontenay-aux-Roses
FRANCE (cont.)
GERMAN DEMOCRATIC REPUBLIC
Runge, K. Staatliches Amt für Atomsicherheit und Strahlenschutz,Waldowallee 117,DDR-1157 Berlin
GERMANY, FEDERAL REPUBLIC OF
Albrecht, H. Bundesanstalt für Geowissenschaften und Rohstoffe, Postfach 510153,D-3000 Hannover 51
Bechthold, W. Kernforschungszentrum Karlsruhe GmbH, Postfach 3640,D-7500 Karlsruhe
Beisswenger, H.F. Technischer Überwachungsverein Baden e.V., Postfach 2420,D-6800 Mannheim 1
Bôhm, H.O. Kernforschungszentrum Karlsruhe GmbH, Postfach 3640,D-7500 Karlsruhe
Bonka, H. Lehrstuhl für Reaktortechnik, Templergraben 55,D-5100 Aachen
Borsch, P. Kerforschungsanalage Jülich, Postfach 1913,D-5170 Jülich
Bretschneider, J.R. Institut für Strahlenhygiene des Bundesgesundheitsamtes, Ingolstâdter Landstrafie 1,D-8044 Neuherberg

LIST OF PARTICIPANTS 589
Brewitz, H.W.
GERMANY,
Delisle, G.
Dürr, K.
Eichmeyer, H.
Fleisch, E.R.F.
Gies, H.
Hoehlein, G.
Hofrichter, E.
Hunsche, E.
Jacobi, A.
FEDERAL REPUBLIC OF (cont.)
Gesellschaft fur Strahlen- und Umweltforschung mbH München,
Institut für Tieflagerung,Berliner Strafie 2,D-3392 Clausthal-Zellerfeld
Bundesanstalt für Geowissenschaften und Rohstoffe, Postfach 510153,D-3000 Hannover 51
Gesellschaft für Strahlen- und Umweltforschung mbH München,
Institut für Tieflagerung,Berliner Strafie 2,D-3392 Clausthal-Zellerfeld
Technische Universitát Berlin,Institut für Bergbauwissenschaften,Strafie des 17. Juni 135,D-1000 Berlin 12
Bergamt Goslar,Postfach 1240,D-3380 Goslar
Gesellschaft für Strahlen- und Umweltforschung mbH München,
Institut für Tieflagerung,Theodor-Heuss-Strafie 4,D-3300 Braunschweig
Kemforschungszentrum Karlsruhe GmbH,Postfach 3640,D-7500 Karlsruhe
Niedersâchsisches Landesamt für Bodenforschung, Postfach 510153,D-3000 Hannover 51
Bundesanstalt für Geowissenschaften und Rohstoffe, Postfach 510153,D-3000 Hannover 51
Salzgitter Maschinen und Anlagen AG, Windmiihlenbergstrafie 20—22,D-3320 Salzgitter 51
590 LIST OF PARTICIPANTS
GERMANY,
Klarr, K.
Kopietz, J.
Korthaus, E.
Koster, R.
Kraeraer, R.
Krause, H.
Kühn, К.
Kunze, J.
Levi, H.W.
Maass, K.-E.
FEDERAL REPUBLIC OF (cont.)
Gesellschaft für Strahlen- und Umweltforschung mbH München,
Institut für Tieflagerung,Berliner Strafie 2,D-3392 Clausthal-Zellerfeld
Bundesanstalt für Geowissenschaften und Rohstoffe, Postfach 510153,D-3000 Hannover 51
Kernforschungszentrum Karlsruhe GmbH,Postfach 3640,D-7500 Karlsruhe
Kernforschungszentrum Karlsruhe GmbH,Postfach 3640,D-7500 Karlsruhe
Kemforschungszentrum Karlsruhe GmbH,Postfach 3640,D-7500 Karlsruhe
Kernforschungszentrum Karlsruhe GmbH,Postfach 3640,D-7500 Karlsruhe
Gesellschaft für Strahlen- und Umweltforschung mbH München,
Institut für Tieflagerung,Berliner Strafie 2,D-3392 Clausthal-Zellerfeld
Gesellschaft für Strahlen- und Umweltforschung mbH München,
Institut für Tieflagerung,Theodor-Heuss-Strafie 4,D-3300 Braunschweig
Hahn-Meitner-Institut für Kernforschung Berlin GmbH, Glienicker Strafie 100,D-1000 Berlin 39
Hahn-Meitner-Institut für Kernforschung Berlin GmbH, Glienicker Strafie 100,D-1000 Berlin 39

LIST OF PARTICIPANTS 591
Maichrowitz, K.
GERMANY, FEDERAL REPUBLIC OF (cont.)
Konsortium Planung Endlager, с/o Deilmann-Haniel GmbH, Haustenbecke 1,D-4600 Dortmund-Kurl
Memmert, G. Institut für Kemtechnik, Marchstrafie 18,D-1000 Berlin 10
Merton, A. Gesellschaft für Reaktorsicherheit GmbH, Glockengasse 2,D-5000 Kôln 1
Merz, E.R. Kernforschungsanlage Jülich GmbH, Postfach 1913,D-5170 Jülich
Moser, H. Gesellschaft für Strahlen- und Umweltforschung mbH, Institut für Radiohydrometrie,Ingolstâdter Landstrafie 1,D-8042 Neuherberg
Oesterle, F.-P. Physikalisch-Technische Bundesanstalt,Bundesallee 100,D-3300 Braunschweig
Bundesministerium für Forschung und Technologie, Postfach 200706,D-5300 Bonn 2
Gesellschaft für Strahlen- und Umweltforschung mbH, Ingolstâdter Landstrafie 1,D-8042 Neuherberg
Technischer Überwachungsverein Baden e.V.,Postfach 2420,D-6800 Mannheim
NUKEM,Postfach 110080,D-6450 Hanau
Pitz, W. Saarberg-Interplant Gesellschaft für Rohstoff-,Energie- und Ingenieurtechnik mbH,
Postfach 73,D-6600 Saarbriicken
Olüg, R.
Perzl, F.
Philippi, G.
Pirk, H.A.

592 LIST OF PARTICIPANTS
GERMANY, FEDERAL REPUBLIC OF (cont.)
Randl, R.P. Bundesministerium für Forschung und Technologie, Postfach 200706,D-5300 Bonn 2
Rôthemeyer, H.A.W. Phy sikalisch-T echnische Bundesanstalt, Bundesallee 100,D-3300 Braunschweig
Salz, W. Gesellschaft fur Reaktorsicherheit mbH, Glockengasse 2,D-5000 Koln 1
Schifferstein, K. Gesellschaft für Reaktorsicherheit mbH, Glockengasse 2,D-5000 Kôln 1
Schneider, H.F. Niedersâchsisches Sozialministerium, H.-W.-Kopf-Platz 2,D-3000 Hannover
Schubert, J.W.A. Oberbergamt Clausthal-Zellerfeld, Postfach 220,D-3392 Clausthal-Zellerfeld
Schwarzer, K. Kemforschungsanlage Jülich GmbH, Postfach 1913,D-5170 Jülich
Smailos, K. Kernforschungszentrum Karlsruhe GmbH, Postfach 3640,D-7500 Karlsruhe
Stippler, R. Gesellschaft für Strahlen- und Umweltforschung mbH München,
Institut für Tieflagerung,Schachtanlage Asse,D-3346 Remlingen, Kreis Wolfenbüttel
Storck, R. Institut für Kerntechnik, Marchstrafie 18,D-1000 Berlin 10
Sukowski, H. Technische Universitât Berlin, Institut für Bergbauwissenschaften, Strafie des 17. Juni 135,D-1000 Berlin 12
LIST OF PARTICIPANTS 593
Tamberg, Т.Н.
GERMANY, FEDERAL REPUBLIC OF (cont.)
Bundesanstalt für Materialprüfung, Under den Eichen 87,D-1000 Berlin 45
Thomas, W.
Tietze, K.
Uerpmann, E.P.
Wallner, M.
Gesellschaft für Reaktorsicherheit mbH, Reaktorgelande,D-8046 Garching
Bundesanstalt für Geowissenschaften und Rohstoffe, Postfach 510153,D-3000 Hannover 51
Gesellschaft für Strahlen- und Umweltforschung mbH München,
Institut für Tieflagerung,Theodor-Heuss-Strafie 4,D-3300 Braunschweig
Bundesanstalt für Geowissenschaften und Rohstoffe,. Postfach 510153,D-3000 Hannover 51
Wamecke, E.H.
Wiesner, L.A.E.
Physikalisch-Technische Bundesanstalt, > ■ ■ Bundesallee 100,D-3300 Braunschweig
Wissenschaftlich-Technische Beratung and Planung, Postfach 1128,D-5068 Odenthal
Winske, P.
Wolff, H.
Rheinisch Westfalische Technische Hochschule Aachen, Institut für Elektrische Anlagen und Energiewirtschaft, Schinkelstrafie 6,D-5100 Aachen
Technische Universitàt Berlin,Institut fiir Bergbauwissenschaften,Strafie des 17. Juni 135,D-1000 Berlin 12
INDIA
Sunder Rajan, N.S. Bhabha Atomic Research Centre, Trombay, Bombay 400 085
594 LIST OF PARTICIPANTS
IRAN
Afrasiabian, A. Atomic Energy Organization of Iran,P.O. Box 12-1198,Teheran
ITALY
Bocola, W. CNEN,Casella Postale 2400, 1-00100 Rome
Bruzzo, F. NIRA,Piazza Carignano 2, Genoa
Cassano, G.
Pellei, A.
CNEN - Centro Studi Nucleari della Trisaia, Policoro (Matera)
Ente Nazionale Idrocarburi,Piazza Mattei 1,Rome
Zoccatelli, C.G. Agip Nucleare S.p.A., Corso di Porta Romana 68,1-20211 Milan
JAPAN
Araki, K.
Inoue, Y.
Sase, J.
Shimoura, K.
Japan Atomic Energy Research Institute, 1 — 13 Shimbashi, 1-chôme,Minato-ku,Tokyo 105
Kyoto University,Sakyo-ku,Kyoto 606
Mitsubishi Metal Corporation,No. 5 -2 , Ohtemachi, i-chome, Chiyoda-ku,Tokyo 100
Research Reactor Institute,Kyoto University,Kumatori-cho, Sennan-gun,Osaka 590-04
LIST OF PARTICIPANTS 595
Watanabe, T.
Yamamoto, M.
NETHERLANDS
Baas, J.
Hagedoorn, P.
Hamstra, J.
Harsveldt, H.M.
Kevenaar, J.W.A.M.
Van den Broek, W.M.G.T.
NORWAY
Bonnevie-Svendsen, M.
Huseby, S.
JAPAN (cont.)
Japan Atomic Industrial Forum,1 — 13, 1-chôme, Shimbashi, Minato-ku, Tokyo
Radioactive Waste Management Centre, Mori Bldg. No. 15,2-8-10 Toranomon, Minato-ku,Tokyo 105
Ministry of Health and Environmental Protection, P.O.Box 439,2260 AK Leidschendam
Ministry of Economic Affairs,Bezuidenhoutseweg 30,Den Haag
Netherlands Energy Research Foundation, Westerduinweg 3,1755 LE Petten N.H.
Geological Survey of the Netherlands,Postbus 157,2000 AD Haarlem
Netherlands :Energy Research Foundation, Westerduinweg 3,1755 LE Petten N.H.
Delft University of Technology,Department of Mining Engineering, Mynbouwstraat 120,.2600 GA Delft
Institutt forlAtomenergi, P.O.Box 40;N-2007 Kjeller
Geological Survey of Norway, Drammensveien 230,Oslo 2 >
596 LIST OF PARTICIPANTS
Nielsen, P.O.
Wethe, P.I.
NORWAY (cont.)
PAKISTAN
Aziz, A.
POLAND
Kunstmann, A. S.
Tykal, A.
Tymochowicz, S.
Urbaficzyk, K.M.
Wierzchoñ, J.K.
Scandpower A/S, P.O.Box 3,N-2007 Kjeller
Institutt for Atomeneigi, P.O.Box 40,N-2007 Kjeller
Pakistan Institute of Nuclear Science and Technology (Pinstech),
Health Physics Division,P.O. Nilore,Rawalpindi
CHEMKOP, -Research and Development Centre for Mining
of Chemical Raw Materials, ul. Lawendowa 4,31-261 Cracow
Institute of Nuclear Research,05-400 Swierk/Otwock
Institute of Nuclear Research,05-400 Swierk/Otwock
CHEMKOP,Research and Development Centre for Mining
of Chemical Raw Materials, ul. Lawendowa 4,31-261 Cracow
CHEMKOP,Research and Development Centre for Mining
of Chemical Raw Materials, ul. Lawendowa 4,31-261 Cracow
LIST OF PARTICIPANTS 597
PORTUGAL
Da Conceiçâo Severo, A.J.
SOUTH AFRICA
Comer, B.
Knowles, A.G.
Rohm, H.F.
Van Der Westhuizen, H.J.
Direcçao geral de energía, Av. da República 45—5,1100 Lisbon
Atomic Energy Board,Private Bag X256,Pretoria 0001
Anglo American Corporation, 44 Main St.,Johannesburg
Electricity Supply Commission, P.O.Box 1091,Johannesburg
Atomic Energy Board,Private Bag X256,Pretoria 0001
SPAIN
Diaz Diaz, J.
Martinez-Martinez, A.
INITEC-ENERGIA, Padilla 17,Madrid-6
Junta de Energía Nuclear, Avenida Complutense, 22, Madrid-3
SWEDEN
Ahlstrom, P.-E. Swedish State Power Board,S-152 87 Vâllingby
Allard, B. Department of Nuclear Chemistry,Chalmers University of Technology, S-412 96 Gôteborg
Andersson, K. Department of Nuclear Chemistry, Chalmers University of Technology, S-412 96 Gôteborg

598 LIST OF PARTICIPANTS
Bergstrom, A.C.I.
Boge, R.
Devell, L.C.E.
Ekbom, L.B.
Eriksson, K.
Eriksson, K.G.
Forsmark, C.-O.
Gidlund, K.G.
Grundfelt, H.B.
Hannerz, A.K.
Huit, A.E.
Hultberg, B.
SWEDEN (cont.)
Swedish Nuclear Fuel Supply Co.,Box 5864,S-102 48 Stockholm
National Institute of Radiation Protection, Box 60204,S-104 01 Stockholm 60
Studsvik Energiteknik AB,S-611 82 Nykoping
Swedish Corrosion Institute,Box 5607,S-114 86 Stockholm
V.B.B.,Box 5038,S-102 41 Stockholm
Geological Department,Chalmers University of Technology,S-412 96 Gôteborg
V.B.B.,Box 5038,S-102 41 Stockholm
Geological Survey of Sweden,Box 670,S-753 22 Uppsala
KEMAKTA Konsult AB,Linnégatan 52,S-l 14 54 Stockholm
AB ASEA-ATOM,Box 53,S-721 04 Vàsteras 1
Swedish Nuclear Fuel Supply Co.,Box 5864,S-102 48 Stockholm
Geological Survey of Sweden,Box 670,S-753 22 Uppsala

LIST OF PARTICIPANTS 599
Jacobsson, A.
Kautsky, G.
Klockars, C.-E.
Larsson, A.
Linder, P.J.
Lofveberg, S.
Magnusson, K.-A.
Morefeldt, C.-O.
Neretnieks, I.
Nilsson, L.B.
Norell, O.
Norrby, S.
SWEDEN (cont.)
Division of Soil Mechanics,University of Luleâ,S-951 87 Luleâ
Geological Survey of Sweden,Box 670,S-751 28 Uppsala
Geological Survey of Sweden,Box 670,S-751 28 Uppsala
Swedish Nuclear Power Inspectorate,Box 27 106,S-102 52 Stockholm
Studsvik Energiteknik AB,S-611 82 Nykôping
National Council for Radioactive Waste, Box 5864,S-l 02 48 Stockholm
Geological Survey of Sweden,Box 670,S-753 22 Uppsala
Hagconsult AB,Banérgatan 37,S-l 15 22 Stockholm
Royal Institute of Technology,Fack,S-l 00 44 Stockholm
Swedish Nuclear Fuel Supply Co., •Box 5864,S-l02 48 Stockholm
National Council for Radioactive Waste, Box 5864,S-102 48 Stockholm
National Institute of Radiation Protection, Fack,S-l 04 01 Stockholm 60

6 0 0 LIST OF PARTICIPANTS
Papp, T.
Pusch, R.
Rydberg, J.
Rydell, N.
Scherman, S.
Stenquist, C.W.
Stephansson, O.J.
Stokes, J.
Thoregren, U.
Torstenfelt, B.
Wilhelmsson, H.
SWITZERLAND
Beck, R.H.
SWEDEN (cont.)
Swedish Nuclear Fuel Supply Co.,Box 5864,S-102 48 Stockholm
Division of Soil Mechanics,University of Luleâ,S-951 57 Luleâ
Department of Nuclear Chemistry, Chalmers University of Technology, S-412 96 Gôteborg
.National Council for Radioactive Waste, Box 5864,S-102 48 Stockholm
Swedish Geological Survey,Box 670,S-753 22 Uppsala
Studsvik Energiteknik AB,S-611 82 Nykôping
Department of Rock Mechanics, University of Luleâ,S-951 87 Luleâ
Royal Institute of Technology, Valhallavâgen 128,S-114 41 Stockholm
Geological Survey of Sweden,Box 670,S-753 22 Uppsala
Department of Nuclear Chemistry, Chalmers University of Technology, S-412 96 Gôteborg
Swedish Nuclear Power Inspectorate, Box 27 106,S-102 52 Stockholm
Nationale Genossenschaft für die Lagerung radioaktiver Abfalle,
Parkstrafie 23,CH-5401 Baden

LIST OF PARTICIPANTS
SWITZERLAND (cont.)
Bum, H.R.
Flury, H.
Gassmann, J.
Hermberger, V.
Hoop, F.
Issler, H.
Jacobi, A.G.
Kiener, E.
Krüger, H.-T.
Liithi, H.-R.
Niederer, U.
Niggli, C.
Electrowatt Engineering Services Ltd., Bellerivestrafie 36,CH-8022 Zurich
Eidgenôssisches Institut für Reaktorforschung, CH-5303 Würenlingen
Motor-Columbus Ingénieurs Conseils, Parkstrafce 27,CH-5401 Baden
Eidgenôssisches Institut für Reaktorforschung, CH-5303 Würenlingen
Electrowatt Engineering Services Ltd., Bellerivestrafie 36,CH-8022 Zürich
Nationale Genossenschaft für die Lagerung radioaktiver Abfâlle,
Parkstrafie 23,CH-5401 Baden
Electrowatt Engineering Services Ltd., Bellerivestrafie 36,CH-8022 Zürich •
Office Fédéral de l’Energie,C.P. 2649,CH-3001 Berne
Emch & Berger Berne Ltd.,Gartenstrafie 1,CH-3001 Berne
Eidgenôssisches Amt für Energiewirtschaft, Postfach,CH-3001 Berne
Eidgenôssisches Amt für Energiewirtschaft, Abteilung für die Sicherheit der Kernanlagen, CH-5303 Würenlingen
Bundesamt für Umweltschutz, Schwarztorstrafie 53,CH-3003 Berne

6 0 2 LIST OF PARTICIPANTS
Schneider, G.
SWITZERLAND (cont.)
Universal Engineering Corporation, Malzgasse 32,CH-4010 Basel
Schuster, P. Basler & Hofmann Ingenieure und Planer AG, Forchstrafie 395,CH-8029 Zürich
Thury, M. Nationale Genossenschaft fur die Lagerung radioaktiver Abfflle,
Parkstrafie 23,CH-5401 Baden
THAILAND
Yamkate, P. Office of Atomic Energy for Peace,Vibhavadi Rangsit Road,Bangkhen, Bangkok-9
UNION OF SOVIET SOCIALIST REPUBLICS
Baloukova, Valentina State Committee on the Utilization of Atomic Energy, Staromonetny 26, .Moscow
Krylova, Nina State Committee on the Utilization of Atomic Energy, Staromonetny 26,Moscow
Pimenov, M.K. State Committee on the Utilization of Atomic Energy, Staromonetny 26,Moscow
Spitsyn, V.I. Institute of Physical Chemistry of the USSR Academy of Sciences,
Leninskij Prospekt 31,Moscow
Strakhov, M.V. State Committee on the Utilization of Atomic Energy, Staromonetny 26,Moscow

LIST OF PARTICIPANTS 603
Beale, H.
Brereton, N.R.
Burton, W.R.
Chapman, N.A.
Clifton, J.J.
Davies, J.W.
Driscoll, J.A.
Evans, G.V.
Feates, F.S.
Finnigan, J.C.
Fitzpatrick, J.
Gray, D.A.
UNITED KINGDOM
Atomic Energy Research Establishment,Harwell, Didcot, Oxon 0X11 ORA
Department of the Environment,2 Marsham Street,London SW1P 3EB
British Nuclear Fuels Ltd.,Risley, Warrington WA3 6AS
Institute of Geological Sciences,Harwell, Didcot, Oxon 0X11 ORA
United Kingdom Atomic Energy Authority Safety and Reliability Directorate,
Wigshaw Lane,Culcheth, Warrington WA3 6AT
Risley Nuclear Power Development Establishment, Risley, Warrington WA3 6AT
Health and Safety Executive,Nuclear Installations Inspectorate,Silkhouse Court,Tithebam St.,Liverpool
Atomic Energy Research Establishment,Harwell, Didcot, Oxon 0X11 ORA
Department of the Environment,Becket House,1 Lambeth Palace Road,London SE1 7ER
Welsh Office,Summit House,Windsor Place,Cardiff
Electrowatt Engineering Services Ltd.,20, Harcourt House,19 Cavendish Square,London W1M0EX
Institute of .Geological Sciences,Exhibition Road,London SW7 2DE
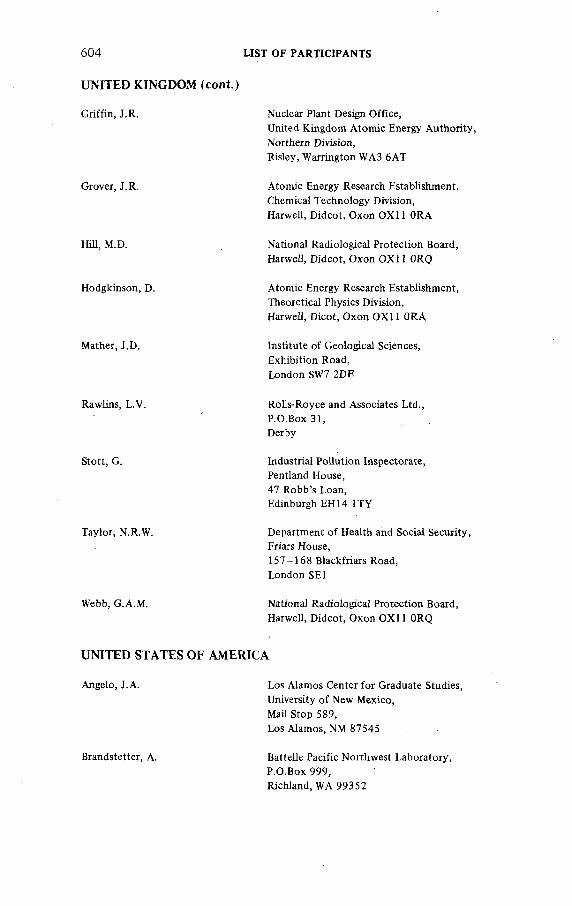
604 LIST OF PARTICIPANTS
UNITED KINGDOM (cont.)
Griffin, J.R.
Grover, J.R.
Hill, M.D.
Hodgkinson, D.
Mather, J.D.
Rawlins, L.V.
Stott, G.
Taylor, N. R.W.
Webb, G.A.M.
Nuclear Plant Design Office,United Kingdom Atomic Energy Authority, Northern Division,Risley, Warrington WA3 6AT
Atomic Energy Research Establishment, Chemical Technology Division,Harwell, Didcot, Oxon 0X11 ORA
National Radiological Protection Board, Harwell, Didcot, Oxon 0X11 ORQ
Atomic Energy Research Establishment, Theoretical Physics Division,Harwell, Dicot, Oxon 0X11 ORA
Institute of Geological Sciences,Exhibition Road,London SW7 2DE
Rolls-Royce and Associates Ltd.,P.O.Box 31,Derby
Industrial Pollution Inspectorate,Pentland House,47 Robb’s Loan,Edinburgh EH 14 1TY
Department of Health and Social Security, Friars House,157-168 Blackfriars Road,London SE1
National Radiological Protection Board, Harwell, Didcot, Oxon 0X11 ORQ
UNITED STATES OF AMERICA
Angelo, J.A. Los Alamos Center for Graduate Studies, University of New Mexico,Mail Stop 589,Los Alamos, NM 87545
Brandstetter, A. Battelle Pacific Northwest Laboratory, P.O.Box 999,Richland, WA 99352

UST OF PARTICIPANTS
Cleveland, J.
U N IT E D S T A T E S O F A M E R IC A (co n t.)
Daemen, J.J.K.
Davis, J.J.
Deju, R.A.
Dole, L.R.
Erdal, B.R.
Ewoldsen, H.
Fairbridge, R.W.
Goldsmith, M.W.
Heath, C.A.
Hill, L.R.
Hollister, C.D.
Hood, M.
US Geological Survey,M.S. 412, P.O.Box 25046,Denver Federal Center,Lakewood, CO 80225
Department of Mining and Geological Engineering, University of Arizona,Tucson, AZ 85721
US Nuclear Regulatory Commission,Washington, DC 20555
Rockwell Hanford Operations,P.O.Box 800,Richland, WA 99352
Oak Ridge National Laboratory,P.O.Box X,Oak Ridge, TN 37830
Los Alamos Scientific Laboratory,Los Alamos, NM 87545
Woodward Clyde Consultants,3 Embarcadero CNIR # 700,San Francisco, CA
Columbia University,Schermerhorn Hall 604,New York, NY 10027
Energy Research Group,400-1 Totten Pond Rd.,Waltham, MA 02154
US Department of Energy,Washington, DC 20545
Sandia Laboratories,Nuclear Waste Technology,Albuquerque, NM 87185
Woods Hole Oceanographic Institution,Woods Hole, MA 02543
Lawrence Berkeley Laboratory,Earth Sciences Division,University of California,Berkeley, CA 94720

606 LIST OF PARTICIPANTS
U N IT E D ST A T ES O F A M E R IC A (con t.)
Kehnemuyi, M. Battelle Memorial Institute,Office of Nuclear Waste Isolation, 505 King Avenue,Columbus, OH 43201
MacGregor, I. US Department of Energy, Mail Stop J-309, Washington, DC 20545
Robertson, I.B. US Geological Survey, Office of Radiohydrology, M.S. 410, National Center, Reston, VA 22092
Rochlin, G. Institute of Governmental Studies, IGS-109 Moses Hall,University of California,Berkeley, С A 94720
Stewart, D.B. US Geological Survey, 959 National Center, Reston, VA 22092
Warren, J.L. Los Alamos Scientific Laboratory, P.O.Box 1663,Los Alamos, NM 87545
Weeren, H. Oak Ridge National Laboratory, P.O.Box X,Oak Ridge, TN 37830
Witherspoon, P.A. Lawrence Berkeley Laboratory, Earth Sciences Division, University of California, Berkeley, С A 94720
YUGOSLAVIA
Ljubicic, A. Institute “Rudjer Boskovic”,P.O.Box 1016,YU-41001 Zagreb
Roller, Zvjezdana Institute “Rudjer Boskovic”, P.O.Box 1016,YU-41001 Zagreb
LIST OF PARTICIPANTS 607
Kondi-Tamba
Z A IR E
Centre Régional d’Etudes Nucléaires de Kinshasa,B.P. 868, :Kinshasa XI ;
ORGANIZATIONS
COMMISSION OF THE EUROPEAN COMMUNITIES (CEC)
Avogadro, A.
Bertozzi, G.
D’Alessandro, M.
Gritti, R.
Haijtink, B.
Masure, P.
Murray, C.N.
Myttenaere, C.
Venet, P.
CCR Ispra,1-21020 Ispra (Varese), Italy
CCR Ispra,1-21020 Ispra (Varese), Italy
CCR Ispra,1-21020 Ispra (Varese), Italy
CCR Ispra,1-21020 Ispra (Varese), Italy
200, rue de la Loi, В-1049 Brussels, Belgium
200, rue de la Loi, В-1049 Brussels, Belgium
CCR Ispra,1-21020 Ispra (Varese), Italy
200, rue de la Loi, В-1049 Brussels, Belgium ,
200, rue de la Loi, В-1049 Brussels, Belgium
FORATOM (The European Atomic Forum)
Luoto, U. с/o EKONO,P.O. Box 21;SF-00131 Helsinki 13, Finland

608 LIST OF PARTICIPANTS
INTERNATIONAL COUNCIL OF SCIENTIFIC UNIONS (ICSU)
Harrison, J.M. 1 . 51, boulevard de Montmorency,F-75016 Paris,.France •
WORLD ENERGY CONFERENCE (WEC)
Hultin, S.O. EKONO,P.O. Box 27,SF-00131 Helsinki 13, Finland
AUTHOR INDEXRoman numerals are volume numbers.
Italic numerals refer to the first page of a paper by the author concerned. Upright numerals denote comments and questions in discussions.
Literature references are not indexed.
Abe, К.: II 23
Afrasiabian, A.: II 13,22
Ahlbom, К.: I 443
Ahlstrom, P.-E.: I 502,514,516
Allard, В.: II 553
Amano, H.: II 23
Andersen, L.J.: I 177, 265, 286,
454, 465 ’
Anderson, D.R.: I 131
Andrews, J.N.: II 341
Angelo, J.A.: I 323; II 11,22,188
Araki.K.: I 169; II 25,38,39
Arod, J.: I 190; II 339
Avogadro, A.: II 407
Azis, A.: I 169, 454
Balu, К.: I 49
Balukova, Valentina: I 179, 191,
287; II 220
Banba, T.: II 23
Barbreau,A.: I 387; II 560,568
Barraud, C.J.G.: I 191,295
Barker, J.F.: II 341
Barsova, L.I.: I 325
Batch, J.M.: I 19
Batsche, H.: I 345
Bayhurst, P.B.: II 367
Beale, H.: I 467; II 137
Bechtold, W.: II 421,463,492,520
Beck, R.H.: I 63, 93, 240; II 538,
552'
Bergman, R.: II 465
Bergstrom, A.: I 487
Bergstrom, Ulla: II 465
Bertozzi, G.: II 407, 420, 421, 422
Birk, A.J.: I 218
Blomquist, R.: II 121
Bôhm, H.O.: I 30,47; II 434
Bonne, A.A.: II 41, 57
Bonnet, М.: I 387
Bonniaud, R.: IIÍ5 9
Boulanger, A.-M.-L.: I 384
Bourke.P.J.: II 137
Brandstetter, A.: I 411; II 423,
434,435,463
Brewitz, W.: II 89, 101, 102
Burton, W.R.: I 208,467, 502;
II 134, 493
Carlsson, H.: II 105
Cederstrom, М.: I 193
Chapman, N.A.: II 209, 219, 220
Charlwood, R.G.: I 40,475,439,
440, 477
Cohen, P.: I 168; II 268
Corliss, B.H.: I 131
Courtois, G.E.: I 77; II 38, 251,
339,450,492
Cowart, J.B.: II 341
Crowe, B.M.: II 567
Daemen, J.J.K.: I 40,48,168;
II 134,200
d’Alessandro, М.: II 407
Daniels, W.R.: II 58, 367
Davies, J.W.: I 467
Davison, С.: I 295,453; 1157,119
609
6 1 0 AUTHOR INDEX
Degerman, О.: I 193
Dejonghe,P.: II 41
Deju, R.A.: II 75, 87,88
Della Loggia, E.: I 115
Devell, L.: II 465, 492,493
Dixon, D.F.: I 265,514
Dlouhÿ, Z.: I 209
Donath, P.: II 175
Ekbom, L.B.: I 503, 514, 516
Erdal, B.R.: II 367, 381, 382
Eriksson, K.G.: I 103, 218; II 87
Evans, G.V.: I 369; II 366
Fairbridge, Rhodes W.: II 385
Falke, W.: I 115
Feates, F.S.: I 47,48,440
Fritz, P.: I 369, 516; II 341, 366
Gale, J.E.: II 341
Gassmann, J.: II 495
Geffroy, G.: II 159
Gelin, R.: I 193
Gera, F.: I 208,454; II 57,237
Gidlund, G.: I 443
Gies, H.: I 343
Gilly, L.: II 73
Girardi, F.: II 407
Goblet, P.: I 387
Goldsmith, M.W.: II 11,567
Goldstein, S.: II 159
Gourmel, J.P.: II 271
Gray, D.A.: I 440,455; II 83
Greenwood, P.В.: I 455
Griffin, J.R.: I 467, 477; II 72
Grim, R.E.: I 501; II 251
Groth, T.: II 121
Grundfelt, В.: II 465
Hagemann, R.: II 223, 238
Haijtink, В.: I 115
Hamstra, J.: I 295, 309, 323, 384,
411,440; II 119, 188,189,
208,219,422,552,553
Hannerz, К.: I 503, 515; II 120
Hàrkônen, H.: II 149
Harrison, J.M.: II 522,553
Harsveldt, H.M.: I 177; II 11
Harwell, M.A.: II 423
Hasted, F.: II 539
Hatcher, S.R.: I 79, 90,91; II 565,
567
Heath, C.A.: I 79,29,30,78,295;
II 519, 557, 566, 568, 569
Henrikson, K.S.: I 503
Heremans, R.: II 41, 57, 58, 59
Herrnberger, V.: II 495, 508
Hill, L.R.: I 269, 286, 287; II 220
Hill, M.D.: II 451, 509
Hodgkinson, D.P.: II 137
Hoffmann, D.С.: II 367
Hollister, C.D.: I 131
Holzer, H.: II 3
Hood, М.: II 105, 119, 120
Howieson, J.: I 168,265 Ikonen, К.: II 149
Inoue, Y.: I 410,411,441
Issler, H.: I 93, 103
Jacobi, A.G.: I 309,477
Jacobsson, A.: I 487
Jauho, P.: I J, 18
Jonasson,P.: II 121
Jones, B.F.: I 335
Juignet, N.: II 159
Kabakchi, S.A.: I 325
Kashiwagi, T.: II 23
Kay, R.L.F.: II 341
Kedrovsky, O.L.: I 31,153
Kehnemuyi, М.: I 289, 295,296
Kevenaar, J.W .A.M.: II 759,200
Kjellbert, N.: II 465
Klarr, К.: I 345, 369, 370
Klockars, C.E.: I 443
Kobayashi, К.: II 23
Komurka, М.: I 310
Kondrat’ev, A.N.: I 141; II 525
Korthaus,E.: II 175, 188
Kortus, J.: I 209, 218,219
AUTHOR INDEX 611
Kôster, R.: I 176,218,219,304,
371, 383, 384; II 208
Kraemer, R.: I M l, 371
Krause, H.: I 30,48,77,91,176,
207,239,286,502; II 421
Kroebel, R.: I 371
Krylova, Nina: I 91,747; II 201,
208
Kryukov, 1.1.: I 141; II 201
Kühn, К.: I 29,65,77,78,90,207,
309,439,514; II 83,420,421,
435,537,558,569
Kulichenko, V.V.: I 141; II 201
Kunstmann, A.S.: I 311
Lanza, F.: II 407
Larsson, A.: II 564,569
taszkiewicz, J.: I 311
Lawrence, F.O.: II 367
Laude, F.L.H.: I 440,477; II 38,
119,159
Lebedeva, I.E.: I 325
Ledoux, E.: I 387, 410,411
Lee, D.J.: II 367
Leonov, E.A.: I 31
Levi, H.W.: I 76; II «7 ,450 ,451 ,
519,567
Lôschhom, U.: II 89
Lyon, R.B.: II 453, 463
Magnusson, K.A.: I 443
Malásek, E.: I 209
Manfroy, P.: II 41, 59, 73, 74
Marek, J.: I 209
Margat, J.: I 387
Marsily, G.de: I 387
Masure, Ph.: I 775
Mather, J.D.: I 455, 464, 465
Matthews, S.C.: I 289
Mayence, М.: II 59
Mayman, S.A.: I 79
MehJsen, S.: II 539, 552
Merz, E.R.: II 434
Mittempherger, М.: I 105
Murray, C.N.: II 269,314,381,
407, 493
Myttenaere, С.: II 268, 339, 508
Naudet, R.: II 223
Nelson, P.H.: II 105
Neretnieks, L: II 315, 339
Niini, H.: II 479, 553
Nilsson, L.B.: II 492, 569
Noro, H.: II 149, 569
Osmond, J.K.: II 341
Oszuszky,F.: II 5,11,12
Paramoshkin, V.I.: I 141
Payne, B.R.: II 341
Peaudecerf, P.F.: I 387; II 102
Peltonen, E.: I 63
Pimenov, M.K.: I 40,153, 168, 169,
177,384
Pirk,H.: I 63; II 421, 568, 569
Ploumen, P.: II 175
Poliscuk, V.E.: II 12
Potter, R.W.,11: I 335
Pradel, J.: II 521
Prij, J . : II 189
Pusch, R.: I 487, 501,502; II 57,
74
Put, М.: II 59
Rakov, N.A.: I 163; II 525
Ramani, M.P.S.: I 49
Ramo,E.G.: I 239,516
Rançon, D.L.: 1247,265,501;
II 277, 314, 381
Randl, R.P.: I 65
Rauert, W.: I 345
Robertson, J.B.: I 239; II 57,
253, 268, 269
Rochlin, G.: I 18,48,77,309;
II 39,73
Rochon, J.: II 277,314
Roedder, E.: I 335; II 58
Romadin, N.M.: I 31
Rosinger, E.L.J.: II 453
R6themeyer,H.:I 65, 297, 308,
309,310,384; II 57,73
6 1 2 AUTHOR INDEX
Rudan, P.: II 3
Rybal’chenko,A.I.: I 153
Rydell, N.: I 193, 207, 208
Saari, K.H.O.: I 218
Sato, К.: II 23
Scherman, S.: I 443
Schifferstein, К.: II 12
Schneider, J.F.: II 495
Scott, J.S.: I 413, 441; II 366
Seliga, М.: I 209
Shirvington, P.J.: II 239, 251
Shishits, I.Yu.: I 31
Silvennoinen, P.: I 3
Slizewicz, P.J.: II 87,238,251
Smyth, J.R.: II 367
Sousselier, Y.: I 387
Spitsyn, V.I.: I 179, 286,325;
II 562,570
Stenquist, С.: II 465
Stephansson, О.: I 464; II 121,
133,134, 135
Stewart, D.B.: I 335, 344,384;
II 134
Stott, G.: I 18,90,218,297,453;
II 463
Strakhov, M.V.: I 141; II 525, 537,
538
Strickmann, G.: II 175
Stumpfl, E.: II 3
Sunder Rajan, N.S.: I 49
Tarandi, T.: II 121
Tashiro, S.: II 23
Thegerstrom, С.: I 193
Thomas, K.T.: I 49
Thompson, J.L.; II 367
Thoregren, U.: I 443, 453, 454
Tietze, К.: I 208
Tomlinson, М.: I 79
Urbaftczyk, K.M.: I 311, 323
Vanhaelewyn, R.: II 59
Van Koete, F.A.: I 168,239;
II 268
Venet, P.: I 115
Warren, J.L.: I 221, 239, 240
Webb, G.A.M.: I 39; II 509, 519,
520, 562, 567, 570
Weber, F.: II 3,223
Weeren, H.O.: I 168,171, 176, 177
Wierzchoñ, J. К.: I 308,311, 383
Winske, P.: II 175
Witherspoon, P.A.: I 40,168,453;
II 101, 102, 133, 251, 341,
450,537, 538
Wolfsberg, К.: II 367
Yudin, F.P.: I 153
Zavadskij, M.I.: II 525
Zünd, H.: I 93
Zyazyulya, I.I.: I 325

TRANSLITERATION INDEXThroughout the volume, the INIS transliteration rules
have been used as laid down in IAEA-INIS-10
Балукова В.Д. Balukova, V.D.:
Барсова Л.И. Barsova, L.I.:
Завадский М.И. Zavadskij, М.I.:
Зязюля И.И. Zyazyulya, 1.1.:
Кабакчи С. А. Kabakchi, S.A.:
Кедровский О. Л. Kedrovskij, O.L.:
Кондратьев А.Н. Kondrat’ev, A.N.:
Крылова Н.В. Krylova, N.V.:
Крюков И. И. Kryukov, 1.1.:
Куличенко В.В. Kulichenko, V.V.:
Лебедева И.Е. Lebedeva, I.E.:
Леонов Е.А. Leonov, E.A.:
Парамошкин В.И. Paramoshkin, V.I.:
Пименов М.К. Pimenov, M.K.:
Раков Н.А. Rakov, N.A.:
Ромадин Н.М. Romadin, N.M.:
Рыбальченко А.И. Rybal’chenko, A.I
Спицын В. И. Spitsyn, V.I.:
Страхов М.В. Strakhov, M.V.:
Шишиц И.Ю. Shishits, I.Yu.:
Юдин Ф.П. Yudin, F .P.:


H O W T O O R D E R I A E A P U B L I C A T I O N S
■ An exclusive sales agent for IAEA publications, to whom all ordersand inquiries should be addressed, has been appointed in the following country:
UNITED STATES OF AMERICA UNIPUB, 345 Park Avenue South, New York, NV 10010
■ In the following countries IAEA publications may be purchased from the sales agents or booksellers listed or through your major local booksellers. Payment can be made in local currency or with UNESCO coupons.
ARGENTINA
AUSTRALIABELGIUM
CZECHOSLOVAKIA
FRANCE
HUNGARY
INDIA
ISRAEL
ITALY
JAPANNETHERLANDS
PAKISTANPOLAND
ROMANIA SOUTH AFRICA
SPAIN
SWEDEN
UNITED KINGDOM
U.S.S.R.YUGOSLAVIA
Comisión Nacional de Energía Atómica, Avenida de! Libertador 8250, RA-1429 Buenos AiresHunter Publications, 58 A Gipps Street, Collingwood, Victoria 3066Service Courrier UNESCO, 202, Avenue du Roi, B-1060 BrusselsS.N.T.L., Spálená 51, CS-113 02 Prague 1Alfa, Publishers, Hurbanovo námestie 6, CS-893 31 BratislavaOffice International de Documentation et Librairie, 48, rue Gay-Lussac,F-75240 Paris Cedex 05Kultura, Hungarian Foreign Trading Company P.O. Box 149, H-1389 Budapest 62Oxford Book and Stationery Co., 17, Park Street, Calcutta-700 016 Oxford Book and Stationery Co., Scindia House, New Delhi-110 001 Heiliger and Co., Ltd., Scientific and Medical Books, 3, Nathan Strauss Street, Jerusalem 94227Librería Scientifica, Dott. Lucio de Biasio "aeiou",Via Meravigli 16, 1-20123 MilanMaruzen Company, Ltd., P.O. Box 5050, 100-31 Tokyo International Martinus Nijhoff B.V., Booksellers, Lange Voorhout 9-11, P.O. Box 269, NL-2501 The HagueMirza Book Agency, 65, Shahrah Quaid-e-Azam, P.O. Box 729, Lahore 3 Ars Polona-Ruch, Céntrala Handlu Zagranicznego,Krakowskie Przedmiescie 7, PL-00-068 Warsaw llexim, P.O. Box 136-137, BucarestVan Schaik's Bookstore (Pty) Ltd., Libri Building, Church Street,P.O. Box 724, Pretoria 0001Diaz de Santos, Lagasca 95, Madrid-6Diaz de Santos, Balmes 417, Barcelona-6AB C.E. Fritzes Kungl. Hovbokhandel, Fredsgatan 2, P.O. Box 16356, S-103 27 StockholmHer Majesty's Stationery Office, Agency Section PDIB, P.O.Box 569, London SE1 9NHMezhdunarodnaya Kniga, Smolenskaya-Sennaya 32-34, Moscow G-200 Jugoslovenska Knjiga, Terazije 27, P.O. Box 36, YU-11001 Belgrade
Orders from countries where sales agents have not yet been appointed and requests for information should be addressed directly to:
Division of Publications International Atomic Energy Agency Wagramerstrasse 5, P.O. Box 100, A-1400 Vienna, Austria

00О)СТ)оÔ00


IN T E R N A T IO N A L S U B J E C T G R O U P : I lA T O M IC E N E R G Y A G E N C Y N uc le a r S a fe ty a nd E n v iro n m e n ta l P ro te c tio n /W a s te M a na g e m en tV IE N N A , 1 9 8 0 P R IC E : A u s tr ia n S c h illin g s 8 8 0 ,—
Related Documents