Behavioral/Systems/Cognitive Uncovering the Neural Signature of Lapsing Attention: Electrophysiological Signals Predict Errors up to 20 s before They Occur Redmond G. O’Connell, 1,2 Paul M. Dockree, 1 Ian H. Robertson, 1 Mark A. Bellgrove, 2 John J. Foxe, 3,4 and Simon P. Kelly 3,4,5 1 School of Psychology and Trinity College Institute of Neuroscience, Trinity College Dublin, Dublin 2, Ireland, 2 School of Psychology and Queensland Brain Institute, University of Queensland, Brisbane, Queensland 4067, Australia, 3 The Cognitive Neurophysiology Laboratory, Nathan S. Kline Institute for Psychiatric Research, New York, New York 10962, 4 Program in Cognitive Neuroscience, Department of Psychology, City College of the City University of New York, New York, New York 10031, and 5 Center for Neurobiology and Behavior, Columbia University, New York, New York 10032 The extent to which changes in brain activity can foreshadow human error is uncertain yet has important theoretical and practical implications. The present study examined the temporal dynamics of electrocortical signals preceding a lapse of sustained attention. Twenty-one participants performed a continuous temporal expectancy task, which involved continuously monitoring a stream of regu- larly alternating patterned stimuli to detect a rarely occurring target stimulus whose duration was 40% longer. The stimulus stream flickered at a rate of 25 Hz to elicit a steady-state visual-evoked potential (SSVEP), which served as a continuous measure of basic visual processing. Increasing activity in the band (8 –14 Hz) was found beginning 20 s before a missed target. This was followed by decreases in the amplitude of two event-related components over a short pretarget time frame: the frontal P3 (3– 4 s) and contingent-negative variation (during the target interval). In contrast, SSVEP amplitude before hits and misses was closely matched, suggesting that the efficacy of ongoing basic visual processing was unaffected. Our results show that the specific neural signatures of attentional lapses are registered in the EEG up to 20 s before an error. Introduction The human capacity to sustain attention to behaviorally relevant stimuli is strongly challenged during highly routine task scenarios in which demands are low and external attention-grabbing events are few. Performance errors arising from transient inattention in real life can have catastrophic consequences, and an increased frequency of lapses characterizes a number of clinical syndromes, but our knowledge of their neural underpinnings remains limited. The majority of EEG and functional magnetic resonance im- aging (fMRI) studies have adopted block-design approaches that average across extended periods of behavior or event-related ap- proaches that focus on the downstream consequences of atten- tional failures on transient target processing. The intertrial period before a target, when continuous attentional control is critical, has received far less investigation. Recently, Eichele et al. (2008) conducted a single-trial analysis of fMRI data and identified sev- eral patterns of hemodynamic activity that appeared to predict errors 6 s before they occurred with linear trends emerging up to 30 s beforehand. It remains to be seen whether such signatures are detectable in more direct measures of cortical activity. EEG pro- vides a high-temporal-resolution measure of postsynaptic corti- cal activity and represents an ideal technique for tracing the tem- poral evolution of maladaptive brain states. However, only a handful of studies to date have explored electrophysiological changes before a performance error, and their analyses have been limited to periods of just 1 or 2 s (Ridderinkhof et al., 2003; Allain et al., 2004; Hajcak et al., 2005). Adopting analysis strategies that can trace internally driven EEG changes over a broader timescale may prove fundamental to our understanding of the spatiotem- poral evolution of attentional control. Here, we report a comprehensive and systematic analysis of the psychophysiological precursors of lapses of sustained atten- tion, defined here by the failure to detect a readily perceivable target stimulus, presented at fixation, during a novel continuous temporal monitoring task. First, we wished to establish how far back in time a lapse is foreshadowed in the EEG. To accurately gauge the timing of these error-predictive changes, EEG data were analyzed on three distinct timescales relative to the target: posttarget processing (1 s), immediate pretarget processing (4 s) and long-term pretarget processing (30 s). Second, we sought to establish whether lapsing attention produces effects at all stages of stimulus processing, including “bottom-up” sensory processing or bears only on endogenous, higher-order processes. To provide a continuous measure of basic visual processing, task stimuli were presented at a 25-Hz flicker, thus eliciting a steady- state visual-evoked potential (SSVEP). By comparing SSVEP am- Received Dec. 16, 2008; revised April 17, 2009; accepted May 5, 2009. We thank Shani Shalgi for her assistance during data collection and the initial stages of analysis. Correspondence should be addressed to Dr. Redmond O’Connell, Trinity College Institute of Neuroscience, Lloyd Building, Trinity College Dublin, Dublin 2, Ireland. E-mail: [email protected]. DOI:10.1523/JNEUROSCI.5967-08.2009 Copyright © 2009 Society for Neuroscience 0270-6474/09/298604-08$15.00/0 8604 • The Journal of Neuroscience, July 1, 2009 • 29(26):8604 – 8611

Welcome message from author
This document is posted to help you gain knowledge. Please leave a comment to let me know what you think about it! Share it to your friends and learn new things together.
Transcript

Behavioral/Systems/Cognitive
Uncovering the Neural Signature of Lapsing Attention:Electrophysiological Signals Predict Errors up to 20 s beforeThey Occur
Redmond G. O’Connell,1,2 Paul M. Dockree,1 Ian H. Robertson,1 Mark A. Bellgrove,2 John J. Foxe,3,4 andSimon P. Kelly3,4,5
1School of Psychology and Trinity College Institute of Neuroscience, Trinity College Dublin, Dublin 2, Ireland, 2School of Psychology and Queensland BrainInstitute, University of Queensland, Brisbane, Queensland 4067, Australia, 3The Cognitive Neurophysiology Laboratory, Nathan S. Kline Institute forPsychiatric Research, New York, New York 10962, 4Program in Cognitive Neuroscience, Department of Psychology, City College of the City University ofNew York, New York, New York 10031, and 5Center for Neurobiology and Behavior, Columbia University, New York, New York 10032
The extent to which changes in brain activity can foreshadow human error is uncertain yet has important theoretical and practicalimplications. The present study examined the temporal dynamics of electrocortical signals preceding a lapse of sustained attention.Twenty-one participants performed a continuous temporal expectancy task, which involved continuously monitoring a stream of regu-larly alternating patterned stimuli to detect a rarely occurring target stimulus whose duration was 40% longer. The stimulus streamflickered at a rate of 25 Hz to elicit a steady-state visual-evoked potential (SSVEP), which served as a continuous measure of basic visualprocessing. Increasing activity in the � band (8 –14 Hz) was found beginning �20 s before a missed target. This was followed by decreasesin the amplitude of two event-related components over a short pretarget time frame: the frontal P3 (3– 4 s) and contingent-negativevariation (during the target interval). In contrast, SSVEP amplitude before hits and misses was closely matched, suggesting that theefficacy of ongoing basic visual processing was unaffected. Our results show that the specific neural signatures of attentional lapses areregistered in the EEG up to 20 s before an error.
IntroductionThe human capacity to sustain attention to behaviorally relevantstimuli is strongly challenged during highly routine task scenariosin which demands are low and external attention-grabbing eventsare few. Performance errors arising from transient inattention inreal life can have catastrophic consequences, and an increasedfrequency of lapses characterizes a number of clinical syndromes,but our knowledge of their neural underpinnings remainslimited.
The majority of EEG and functional magnetic resonance im-aging (fMRI) studies have adopted block-design approaches thataverage across extended periods of behavior or event-related ap-proaches that focus on the downstream consequences of atten-tional failures on transient target processing. The intertrial periodbefore a target, when continuous attentional control is critical,has received far less investigation. Recently, Eichele et al. (2008)conducted a single-trial analysis of fMRI data and identified sev-eral patterns of hemodynamic activity that appeared to predicterrors 6 s before they occurred with linear trends emerging up to30 s beforehand. It remains to be seen whether such signatures are
detectable in more direct measures of cortical activity. EEG pro-vides a high-temporal-resolution measure of postsynaptic corti-cal activity and represents an ideal technique for tracing the tem-poral evolution of maladaptive brain states. However, only ahandful of studies to date have explored electrophysiologicalchanges before a performance error, and their analyses have beenlimited to periods of just 1 or 2 s (Ridderinkhof et al., 2003; Allainet al., 2004; Hajcak et al., 2005). Adopting analysis strategies thatcan trace internally driven EEG changes over a broader timescalemay prove fundamental to our understanding of the spatiotem-poral evolution of attentional control.
Here, we report a comprehensive and systematic analysis ofthe psychophysiological precursors of lapses of sustained atten-tion, defined here by the failure to detect a readily perceivabletarget stimulus, presented at fixation, during a novel continuoustemporal monitoring task. First, we wished to establish how farback in time a lapse is foreshadowed in the EEG. To accuratelygauge the timing of these error-predictive changes, EEG datawere analyzed on three distinct timescales relative to the target:posttarget processing (�1 s), immediate pretarget processing(�4 s) and long-term pretarget processing (�30 s). Second, wesought to establish whether lapsing attention produces effects atall stages of stimulus processing, including “bottom-up” sensoryprocessing or bears only on endogenous, higher-order processes.To provide a continuous measure of basic visual processing, taskstimuli were presented at a 25-Hz flicker, thus eliciting a steady-state visual-evoked potential (SSVEP). By comparing SSVEP am-
Received Dec. 16, 2008; revised April 17, 2009; accepted May 5, 2009.We thank Shani Shalgi for her assistance during data collection and the initial stages of analysis.Correspondence should be addressed to Dr. Redmond O’Connell, Trinity College Institute of Neuroscience, Lloyd
Building, Trinity College Dublin, Dublin 2, Ireland. E-mail: [email protected]:10.1523/JNEUROSCI.5967-08.2009
Copyright © 2009 Society for Neuroscience 0270-6474/09/298604-08$15.00/0
8604 • The Journal of Neuroscience, July 1, 2009 • 29(26):8604 – 8611

plitude as well as early visual components of the transient event-related potentials (ERP) (Muller and Hillyard, 2000) within the30 s preceding a hit/miss, we were able to assess the long-termeffects of attentional lapses on bottom-up stimulus-evoked pro-cesses. Late higher-order transient ERP components and ongoingEEG rhythms were analyzed to explore the effects of lapsing at-tention on endogenous processes.
Materials and MethodsParticipantsTwenty-nine participants volunteered for this experiment. One partici-pant was excluded because that person was unable to consistently iden-tify targets during practice, while seven were excluded because they madean insufficient number of hits or misses across all blocks (�20 afterartifact removal) to generate reliable ERP averages, leaving a final sampleof 21 participants (7 female, 3 left handed). All participants reportednormal or corrected-to-normal vision and no current psychiatric diag-nosis or history of head injury. All participants gave written informedconsent, and all procedures were approved by the ethical review boards ofthe School of Psychology, Trinity College Dublin. Ethical guidelines werein accordance with the Declaration of Helsinki. Ages ranged from 19 to31 years (mean, 25.67; SD, 2.53).
Continuous temporal expectancy taskIn the continuous temporal expectancy task (CTET) (Fig. 1), a centrallypresented patterned stimulus underwent a change at regular intervals,resulting in a continuous stream of “frames.” The key requirement of thetask was to monitor the temporal duration of each stimulus frame and toidentify the minority of “target” frames with a duration that was 40%longer than the standard. The CTET was designed such that the temporal
judgments that were required were unchalleng-ing when performed in isolation but demand-ing when participants were asked to continu-ously perform these judgments over anextended period. It was predicted that this taskscenario would lead to more frequent lapsesthan the more common stimulus classificationtasks that are used in attention research, thusfacilitating EEG analysis. The pattern stimulusconsisted of a single 8 cm 2 large square dividedinto a 10 � 10 grid of identical square tiles (0.8mm 2), each one diagonally split into black andwhite halves. The tile orientation shifted by 90°in a random direction (clockwise or counter-clockwise) on each frame change yielding fourdistinct patterns. To reduce eye movement,participants were instructed to fixate on a whitecross that was continuously presented at thecenter of the large square. All stimuli were pre-sented on a gray background.
Standard (nontarget) stimuli were presentedfor 800 ms, and target stimuli were presentedfor 1120 ms. Stimuli were pseudo-randomlypresented such that there were between 7 and15 (average of 11) standard trials or 5.6 –12 s(average 8.8 s) between each target presenta-tion. To generate an SSVEP, the stimulusstream flickered on and off at a constant rate of25 Hz. The SSVEP represents synchronous neu-ronal activity in early visual areas elicited byrepetitive visual stimulation (Muller and Hill-yard, 2000). Here, the SSVEP provided us with acontinuous measure of basic visual stimulusprocessing. Participants were required to pressa response key as quickly as possible when theydetected a frame of longer duration (target).Each block consisted of 225 trials (frames) witha total duration of �3 min and 5 s. The numberof targets varied between 18 and 22 per block.
All participants completed 10 blocks of the task and were given a restbreak in between each block.
To verify that the target/standard comparison was well above individ-ual detection thresholds, all participants were required to exhibit 100%accuracy during an initial practice session. The practice session consistedof two separate practice blocks. In the first block, three targets wererandomly interspersed among 25 standard stimuli. At this early stage, thestimuli were presented without the 25 Hz flicker to facilitate target iden-tification. In the second practice block, an identical number of stimuliwere presented, this time with the 25 Hz flicker. Participants were re-quired to identify all target stimuli before advancing to the experimentaltrials. If participants missed one or more target stimuli, the practice wasperformed again. If the participant still failed to identify all the targets, theywere excluded from the experiment. Only one participant was excluded onthis basis, and they reported difficulty focusing on stimuli because of drycontact lenses. The duration of the target frame was made shorter (1060 ms)for one participant whose initial accuracy over the 10 blocks was close toceiling (�20 errors in total). Hence, one participant performed the tasktwice, but only the data from the second attempt were analyzed.
Data analysisContinuous EEG was acquired through the ActiveTwo Biosemi electrodesystem from 128 scalp electrodes, digitized at 512 Hz. Vertical eye move-ments were recorded with two vertical electrooculogram (EOG) elec-trodes placed below the left and right eye, while electrodes at the outercanthus of each eye recorded horizontal movements. Data were analyzedin Matlab R2007a. Data were re-referenced off-line to the nasion andlow-pass filtered up to 40 Hz. All electrode channels were subjected to anartifact criterion of �90 mV to reject trials with excessive EOG or othernoise transients. To exclude errors that may have arisen from blinking
Figure 1. CTET. Participants monitored a continuous stream of patterned stimuli centrally presented and flickering at a rate of25 Hz. Standard stimuli were presented for 800 ms, and participants were required to monitor for the occurrence of target stimulidefined by their longer duration (1120 ms) relative to other stimuli. Target detection was indicated by a speeded button press. Allparticipants were practiced to a criterion level of performance.
O’Connell et al. • Error-Predicting Electrophysiology J. Neurosci., July 1, 2009 • 29(26):8604 – 8611 • 8605

rather than true failures of attention, a 4 s win-dow before each target trial was scanned, andany trial that included an artifact (�90 mV)that was evident across eight or more channelswas excluded from all analyses. In all analyses oftransient ERP, baseline and component inter-vals of a multiple of 40 ms were used, encapsu-lating an integer number of SSVEP cycles, toprotect against contamination by residual SS-VEP power remaining after notch-filtering.
The analysis proceeded in three stages: exam-ining immediate target-related processing,short-term epochs preceding targets (4 s), andlong-term epochs preceding targets (30 s). In allstages, we examined activity in a specific timeinterval relative to target trials (onset of longer-duration frame), comparing correctly detectedtrials (hits) to undetected trials (misses). Forparticipants whose sweep count for hits versusmisses was not matched, we randomly selectedtrials for inclusion from the overrepresentedcondition. It was also important to rule out thepossibility that any differences between the twoconditions could be attributed to a difference inthe length of the average intertarget interval(ITI) associated with each condition. For exam-ple, previous work has demonstrated that theamplitude of the P3 component increases withITI (Polich, 1990). Analysis of our own data infact indicated that miss trials were associatedwith shorter ITI than hit trials (8.8 s vs 9.17 s;t(20) � 3.46; p � 0.01). To control for this, ran-dom selection of trials in the overrepresentedcondition was carried out for each ITI sepa-rately, with the result that ITI of each length were equally represented inboth conditions.
Immediate target processing. We examined the discrete event-relatedactivity elicited by the detection of a target by deriving ERP for an epochencapsulating the target interval (800 –1120 ms) and beyond. A notchfilter centered on 25 Hz was applied to eliminate the SSVEP activity intransient ERP. Stimulus-locked data were segmented into epochs of�100 ms before to 1800 ms after target frame onset and averaged sepa-rately for correctly detected targets and missed targets. Artifact rejectionwas based on a much broader preceding time frame starting from �3200,so that trials that were missed on account of preceding blinks or eyemovement, as opposed to lapsing attention, were excluded. Target ep-ochs were baseline corrected relative to the interval 560 – 640 ms, i.e., an80 ms window centered on contingent negative variation (CNV) onset.The single subject for whom target frame duration was shorter was excludedfrom this analysis.
ERP component structure was confirmed by visual inspection ofgrand-average waveforms and associated scalp maps. The width of thelatency window used to measure component amplitudes was based onthe duration and spatial extent of each component. The target intervalelicited the following components (Fig. 2): a strong negative shift overcentral scalp sites with onset �600 ms and peaking at 1000 ms (CNV)and a late positive wave with frontocentral (1200 ms; frontal target P3)and parietal maxima (1400 ms; parietal target P3).
We measured the CNV from a cluster of six electrodes centered on central(Cz) within the interval of 900–1100 ms (i.e., up until onset of the firstposttarget standard frame). The late positive wave was measured around itsdominant peak in the interval of 1300–1450 ms at both frontal and parietalsites. We tested for latency differences in the frontal target P3 by computingthe onset and peak latency as follows: for each subject, we located the positivepeak by finding the maximum within a window of 1120–1620 (or 0–500 msrelative to the transition from the target frame to the following standard). Wethen located the preceding “trough” as the minimum within a window ex-tending from the beginning of the target interval (800 ms) to the positivepeak just located. We defined the onset as that time point lying between the
trough and peak at which the potential rose above the trough level by 20% ofthe peak-trough difference.
Short-term pretarget processing. In the next step of our analysis, the goalwas to look for divergences in electrophysiological markers within a rel-atively discrete time frame of 4 s. This window was selected to isolateactivity that would be uncontaminated by the occurrence of other pre-ceding target trials since the minimum intertarget interval was 5.6 s. Forthis time frame, we examined both the broadband transient ERP andspectral measures.
For the broadband ERP analysis, stimulus-locked data were seg-mented into epochs of �3200 ms before to 800 ms after target stimulusonset (i.e., until the beginning of the target interval). A notch filter of 25Hz (width, 2 Hz) was applied to eliminate the SSVEP activity. Amplitudemeasures for the ERP components elicited by each of the four precedingstandard frames and the target frame itself were acquired using separatebaselines of �80 to 0 before the onset of each stimulus. Note that becausea target frame cannot be identified as such until the 800 ms time point, weregarded it as the fifth pretarget standard frame here.
To select latency windows for the measurement of ERP components, agrand-average standard frame ERP was generated by averaging across thefive frames preceding the target interval and without distinguishing be-tween hits and misses (Fig. 3A). Standard frames elicited three principalERP components: first, the early visual P1, maximal over occipital re-gions and peaking �120 ms after stimulus onset. Second, a frontal pos-itivity, peaking at �300 –350 ms. Finally, as in the target–interval wave-form, we observed a CNV component with onset �600 ms and lastinguntil the following transient response. To reduce the likelihood that dif-ferences between detection conditions could be contaminated by activitydifferences at the prestimulus baseline, ERP component amplitudes werecalculated by subtracting the amplitude at component onset from thepeak amplitude (Table 1; Fig. 3A). Amplitude measures for each compo-nent were entered into a 2 � 5 ANOVA with two levels of detection (hitand miss) and five levels of trial (standard �4, standard �3, standard �2,standard �1, and target).
To measure effects on activity within discrete spectral bands, we usedthe Fast-Fourier transform to compute the amplitude spectrum across a
Figure 2. Immediate target processing. Grand average ERP waveforms and scalp topographies focused on the target detectioninterval and averaged separately for hits and misses. Scalp topographies show potential distribution for hits. Although thewaveforms were time-locked to the onset of the target frame (time point 0), a target frame cannot be identified until its durationpasses that of a standard frame (800 –1120 ms, referred to as the target interval and highlighted by dashed vertical lines). Thetarget interval elicited a central negativity between 600 and 1100 ms (CNV, bottom-left) and a late positive wave with fronto-central (1200 ms, frontal target P3; top) and parietal maxima (1400 ms, Parietal Target P3; bottom-right). Each of these compo-nents was reduced on miss trials.
8606 • J. Neurosci., July 1, 2009 • 29(26):8604 – 8611 O’Connell et al. • Error-Predicting Electrophysiology

4 s epoch extending from �3200 to �800 ms relative to target frameonset. Three dominant peaks were observed in grand average spectracollapsed across conditions: a relatively narrow spectral peak was identi-fied within the theta band mainly over frontal sites; this was measured byintegrating amplitude across the band 5–6.5 Hz. Alpha was measured in thebroader standard band of 8–14 Hz, whereas SSVEP amplitude was measuredat the discrete frequency of 25 Hz. Spectral amplitude measures were ac-quired individually from clusters of six electrodes centered on frontal (Fz),Cz, parietal (Pz), and occipital (Oz) scalp sites and entered into a 2 � 4ANOVA with two levels of detection and four levels of region (frontal, cen-tral, parietal, and occipital). A separate ANOVA was carried out for each ofthe three bands.
Long-term pretarget processing. The next step in our analysis was de-signed to explore the longer-term temporal dynamics of the electrophys-iological markers identified in the previous step and their relationship toperformance on an upcoming target. On the basis of the findings ofEichele et al. (2008), we examined a 30 s long pretarget epoch. For the P3,we extracted an amplitude measure from each of 40 consecutive frames
ending on the target frame (starting 39 frames,or 31.2 s before target frame onset). P3 ampli-tude was computed as the integrated amplitudein the interval 280 – 400 ms minus that in theonset period from 80 to 160 ms relative to theonset of each frame (as in analysis step 2). Be-cause of the rarity of 30 s periods of data that arefree of blinks or other artifacts, we rejected atarget trial only if an artifact was detected in thepreceding 4 s using a 90 �V criterion as before.For all preceding frames, artifact rejection wascarried out on a frame-by-frame basis. Becauseartifacts were distributed evenly across frames,this did not result in appreciably lower sweepcounts for earlier frames than frames closer tothe target. The average sweep count was in therange 42– 49 for all frames. A smoothed series of19 P3 amplitude measures, derived by averag-ing across windows of four frames in steps of 2,were entered into a 2 � 19 ANOVA with thefactors of detection (hit vs miss) and time.
For the spectral measures of � and SSVEP, 2 ssegments of data were extracted to provide rea-sonable frequency resolution. Starting with anepoch defined by the interval �1200 to 800 msrelative to target frame onset, we derived spec-tral measures at parietal and occipital sites for �(8 –14 Hz) and SSVEP (25 Hz), respectively. Wethen proceeded in steps of two frames (1.6 s)back to 30 s before the target, resulting in 20time points. To match the temporal smoothingapplied to the P3, each pair of consecutive timebins was averaged, and a 2 � 19 ANOVA wascarried out for each spectral measure, againwith factors of detection and time. For the mea-sures that showed an effect of detection in theshort-term pretarget time frame, it was of inter-est to characterize the timing of the effect.Paired t tests were carried out for each of the 19bins to determine the time bin at which eachmeasure ceased to dissociate hits from misses.Given the exploratory nature of this step of theanalysis, the more permissive cutoff of p � 0.1was used to identify the time bins for whichhit/miss divergences were strongest.
ResultsBehavioral dataParticipants completed 10 blocks of theCTET during which they were presentedwith an average of 200 target trials (range,
188 –207). Over the 21 participants included in the analysis, 64%(SD, 15; range, 37– 85) of target stimuli were correctly identifiedwith an average reaction time of 626 ms (SD, 87; range, 510 –922).The rate of false alarms was very low with an average of just 0.6%(SD, 0.6; range, 0 –3), indicating that all participants were per-forming the task well above chance levels. We also examinedperformance accuracy as a function of time-on-task. Althoughperformance did decline with time within block duration,F(10,200) � 13.5, p � 0.001, there was no significant main effect oftime-on-task across the 10 testing blocks, F(9,198) � 1.3, p � 0.2(see supplemental Fig. 1, available at www.jneurosci.org as sup-plemental material).
Immediate target processingSince target stimuli are identical to standards, except for theirincreased duration, a target stimulus cannot be identified until its
Figure 3. Short-term pretarget epoch. A, Grand-average ERP waveform for the five frames immediately preceding the targetinterval (TI) and collapsed across outcome. This waveform was used as the basis for defining component measurement intervalsfor the short- and long-term pretarget analysis. B, C, Grand-average ERP waveforms and associated scalp topographies within theepoch of �4000 ms pre-TI averaged separately according to subsequent target identification performance (hit, miss). Eachstimulus change elicited a clear P1 response over visual areas (B), but its amplitude did not discriminate the two detectionconditions, suggesting that basic visual processing was equated. In addition, each standard stimulus change elicited a strong P3component over frontocentral scalp (C) that was increased before a hit relative to a miss.
Table 1. Latency intervals and electrode sites used for the measurement of ERP in the short-term pretargetepoch
Component Onset interval (ms) Peak interval (ms) Electrodes
P1 �20 to 60 95–135 Nine electrodes surrounding OzStandard P3 80 –160 280 – 400 Six electrodes surrounding FzCNV 560 – 640 760 – 840 Six electrodes surrounding Cz
O’Connell et al. • Error-Predicting Electrophysiology J. Neurosci., July 1, 2009 • 29(26):8604 – 8611 • 8607
duration has exceeded that of a standard.Therefore, in our analyses of the electro-physiological data, we made the distinc-tion between “target onset,” which is thetime point at which the target frame begins(0 ms) and “target interval” (800 –1120ms), which is the window of time duringwhich target identification is possible. Allof the following analysis steps adhere tothis convention whereby the zero timepoint corresponds to target frame onset.
Previous work has demonstrated thatthe amplitude of the CNV tends to in-crease with time, becoming more negativeas an imperative stimulus approaches,consistent with a build-up of anticipatoryactivity (Macar and Vidal, 2004). On tar-get trials in the CTET, we found that CNVamplitude continued to grow into the tar-get interval (�800 ms) (Fig. 2) but to amuch greater extent before a hit trial thana miss, t(19) � 2.87, p � 0.01.
The late positive wave was measuredaround its dominant peak in the interval of1300 –1450 ms at both frontal and parietalsites. A 2 � 2 ANOVA with factors of re-gion (frontal, parietal) and detection (hit,miss) revealed a main effect of detection,F(1,19) � 8.3, p � 0.05, and a detection byregion interaction, F(1,19) � 18.3, p �0.001. Comparing hits and misses at eachregion revealed a significant differenceonly at parietal sites ( p � 0.01). Although target–P3 amplitudedid not distinguish hits from misses at frontal sites in the timeframe of its largest peak, a clear onset latency difference was evi-dent at frontal sites (Fig. 2). We tested this by measuring the onsetlatency of the positive-going component at the frontal cluster ofelectrodes for hits and misses. The onset for hits (1057 � 92 ms)was significantly earlier than the onset for misses (1154 � 150 ms;t(19) � 4.24; p � 0.001). It is also noted that the frontal target P3onset was estimated to occur before the subsequent patternchange. Given the earliest reported onsets of purely stimulus-driven frontal scalp activity (Foxe and Simpson, 2002), it is clearthat this positive deflection is not driven exogenously by the pat-tern shift itself in either condition. In fact, the peak latency of thefrontal target P3 is �300 – 400 ms after the point at which the nextstandard stimulus would have been expected to occur.
Short-term pretarget epochDivergences in electrophysiological markers were examined within atime-frame of 4 s before the onset of the target interval (Fig. 3).
Early sensory processingThe P1 was measured from a cluster of nine occipital electrodessurrounding occipital. No main effects were found (all p � 0.4).
Standard P3For the standard P3, there was a significant main effect of detec-tion, F(1,20) � 8.1, p � 0.01, driven by larger amplitudes beforecorrect target detections, but there was no main effect of trial( p � 0.6) and no trial by detection interaction ( p � 0.6). Giventhe clear similarities between the scalp topographies and peaklatencies, it is likely that the frontal target P3 (highlighted in
analysis step 1) and standard P3 arise from the same endogenousprocesses that monitor the temporal structure of the task.
CNVThere were no significant main effects of time or detection for CNVamplitude (all p � 0.3).
EEG amplitude spectrumThe continuous EEG amplitude spectrum was also calculated forthe 4 s pretarget epoch (Fig. 4).
Theta (5– 6.5 Hz). There was no main effect of detection,F(1,20) � 1.3, p � 0.25, but there was a main effect of region, F(3,60)
� 4.1, p � 0.01, and a detection by region interaction F(3,60) �3.1, p � 0.05. Post hoc t tests at each region indicated that thetaamplitude did not reliably distinguish between hits and misses atany of the four scalp regions (all p � 0.1).
Alpha (8 –14 Hz). There was a main effect of region, F(3,60) �17, p � 0.001, a marginal main effect of detection, F(1,20) � 3.8,p � 0.06, and a significant detection by region interaction, F(3,60)
� 4.9 p � 0.01. Post hoc t tests at each region indicated signifi-cantly increased � amplitude before a miss relative to a hit, overparietal ( p � 0.05) and occipital sites ( p � 0.05), but not overcentral ( p � 0.1) or frontal ( p � 0.2) sites. To investigatewhether the �-band effect had arisen from alterations instimulus-evoked processing (e.g., visual-evoked components tothe frame onset having power in the � band or differential �suppression in response to stimuli), we also examined the timecourse of � activity within the stimulus frames in the 4 s window.To this end, we derived temporal spectral evolution waveformsby filtering each 4 s epoch in the band 8 –14 Hz, rectifying thefiltered signals, smoothing with a 100 ms sliding window, andaveraging across trials for each condition (Kelly et al. 2006; Thut
Figure 4. A, The continuous EEG amplitude spectrum calculated over occipital scalp sites for the 4 s period preceding a target.Amplitude differences before hits and misses are highlighted for � (8 –14 Hz) and SSVEP (25 Hz). Relative to misses, hits wereassociated with reduced � before a target, but there were no differences in SSVEP amplitude, again suggesting that basic visualprocessing of the stimuli was matched across the two detection conditions. B, Grand-average temporal spectral evolution of �activity calculated for the five standard frames immediately preceding the target interval. The hit vs miss differential was evidentacross the entire epoch, and no systematic differences time-locked to stimulus onset were apparent. C, Scalp topographies fordistribution of SSVEP and � activity as measured in the 4 s spectrum. The “SSVEP” and “alpha” topographies map spectralamplitude preceding hits. The “alpha pre-miss increase” topography was generated using a normalized measure [miss � hit]/[miss � hit]. The increase in � power before a miss was most prominent over right inferior parietal scalp sites and was clearlydistinct from the central occipital SSVEP topography associated with basic visual processing.
8608 • J. Neurosci., July 1, 2009 • 29(26):8604 – 8611 O’Connell et al. • Error-Predicting Electrophysiology

et al. 2006). Figure 4B shows the � time course in the epoch of0 – 800 ms averaged across the five pretarget stimulus frames. Nosystematic differences time-locked to stimulus onset between hitsand misses were apparent.
To examine the topography of the pre-error increase in �amplitude, we took a normalized measure of the difference, sub-tracting � before hits from � before misses and dividing by thesum of these conditions. Figure 4C shows the scalp distribution ofthis measure and, for comparison, the topographies of SSVEPamplitude and � amplitude for the hit condition. The increase in� power before a miss was most prominent over right inferiorparietal scalp sites.
SSVEP (25 Hz). There was a significant main effect of region,F(3,60) � 21.7 p � 0.001, reflecting stronger SSVEP amplitudeover occipital regions, but there was no main effect of response( p � 0.7) and no detection by region interaction ( p � 0.3). Atthe site of its overall maximum (cluster around occipital), SSVEPamplitude was 1.857 �V for hits and 1.858 �V for misses, indi-cating that basic sensory processing was closely matched.
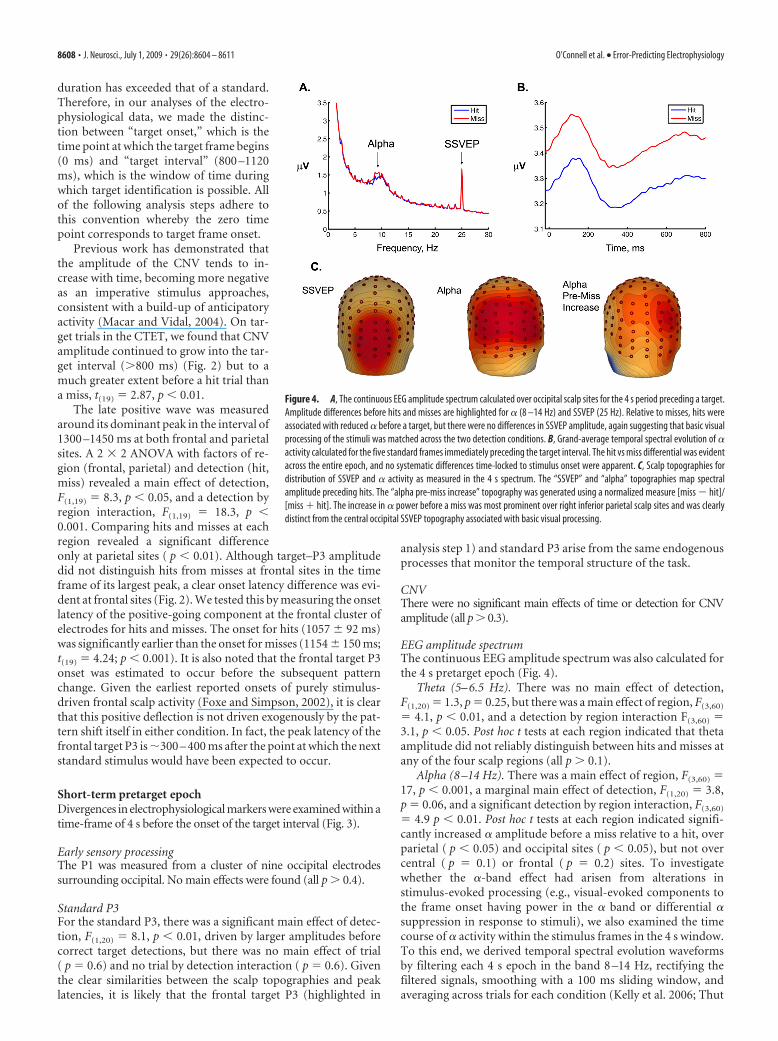
Long-term pretarget epochThe electrocortical markers that predicted successful target de-tection in the short-term epoch were then entered into a furtheranalysis examining a 30 s period before the target interval (Fig. 5).On the basis of the results of analysis step 2, the standard P3 andparietal � amplitude were selected for further analysis. Althoughno differences were observed during the 4 s epoch, SSVEP ampli-tude was also selected for the analysis to account for any changesin visual cortical excitability preceding hits and misses.
Standard P3For the standard P3, there was a strong trend toward an effect ofdetection, F(1,20) � 4.12, p � 0.056, but no main effect of time,F(18,360) � 0.8, p � 0.6, and no detection by time interaction ( p �0.4). To highlight the pretarget time point at which P3 amplitudeceased to distinguish between a subsequent hit or miss, a series ofpaired-samples t tests were conducted for each 4 s time bin. Dif-ferences appeared reliable only for the first three time bins(equivalent to 3– 4 s) immediately before target frame onset (allp � 0.1).
Posterior alpha (8 –14 Hz)There were significant main effects of detection, F(1,20) � 5.53,p � 0.05, and of time, F(18,360) � 2.7, p � 0.001, and a detection bytime interaction, F(18,360) � 2.2, p � 0.01. Linear contrasts indi-cated that the interaction was driven by an increase in � over timebefore a miss ( p � 0.05), whereas � amplitude remained stablebefore a hit ( p � 0.9). Again, a series of paired-samples t testswere used as a means of exploring the time course of the � effect.Significant differences were evident for the last 14 of 19 totalpretarget time points tested, i.e., the �20 s immediately preced-ing a target in which � amplitude was significantly larger before amiss (all p � 0.1).
SSVEP (25 Hz)There were no significant effects of trial or detection on SSVEPamplitude over the 30 s epoch (all p � 0.1). Time-bin compari-sons also failed to identify any consistent divergences between thetwo detection conditions (hit, miss).
Figure 5. Long-term pretarget epoch. Standard P3,�, and SSVEP measures calculated over the 30 s period preceding target onset and averaged separately for hits and misses. No significant differences werefoundforSSVEPamplitude,butpredictivedifferenceswereapparentforboth�andfrontalP3overthe30sepoch.Individualtime-bincomparisonsthatreachedsignificancearemarkedingray(lightgraydenotesp�0.1;darkgraydenotes p�0.05).ForfrontalP3amplitude,thestrongestdifferenceswereapparent3– 4sbeforetargetonset.�-Banddivergencesweresignificantupto20sbeforeanattentional lapse.
O’Connell et al. • Error-Predicting Electrophysiology J. Neurosci., July 1, 2009 • 29(26):8604 – 8611 • 8609

DiscussionThe present study provides the first evidence that a lapse of sustainedattention can be foreshadowed in electrophysiological signals up to20 s before the occurrence of that lapse. Our data reveal specificmaladaptive trends on multiple time-scales with slow drifts in�-band amplitude (20 s pretarget) followed by disruption of task-related time-monitoring mechanisms indexed by the P3 (3–4 s pre-target) and CNV (during target processing). These results indicatethat relatively subtle behavioral changes can be anticipated ahead oftime by monitoring changes in the EEG. The temporal trends iden-tified here accord well with those of Eichele et al. (2008) and empha-size the important complimentary contributions of fMRI and EEG.
Sustained attention has been defined as the ability to maintain amindful goal-directed focus in contexts whose repetitive, nonarous-ing qualities provide little external stimulation (Robertson and Ga-ravan, 2004). Lapses of sustained attention are most likely to occur inhighly routine and mundane task scenarios when we become proneto temporary goal neglect. The CTET paradigm was designed to testthis ability by demanding the continuous deployment of attentionalresources to the time domain. The ability to monitor time intervals isessential in guiding many everyday activities, and our subjective per-ception of the duration of stimuli is sharpened when attention isactively oriented to time (Nobre et al., 2007). This situation requiresattention to be maintained more continuously over successive trialsand thus places greater demands on top-down control resourcesthan stimulus identification tasks such as the go/no-go, stop-signal,or flanker tasks in which classification can be concluded within thefirst few hundred milliseconds of presentation. An equally impor-tant aspect of this paradigm is that, aside from duration, the percep-tual features of target and standard stimuli are identical. This by-passes the sometimes problematic issue of target salienceautomatically engaging attention and obviating the endogenousprocesses under investigation (Robertson and Garavan, 2004). Fi-nally, that there was a strong decline in performance across just 3min of task performance, but no broader decline over blocks indi-cates that the CTET is a useful paradigm for tracing drifts in the levelof attentional control that are not related to changes in basal arousallevels.
�-Band activity provided the strongest electrophysiological pre-dictor of a lapse of attention. Over the 30 s epoch, two distinct trendsemerged: a maladaptive increase in activity, beginning �20 s beforea target and eventually leading to a behavioral lapse and an adaptiveperiod of stable � levels associated with successful target detection.These differences were equally evident in the 4 s, target-free epoch,making it unlikely that the data are confounded by targets occurringwithin that interval. It is noteworthy that misses would not be con-sciously processed on the CTET since they result from the failure todetect a target. As such, the CTET would not entail a restoration ofperformance monitoring following errors as has been found onother tasks [e.g., the flanker task of Eichele et al. (2008)] and maythus provide a better estimation of the natural time course of atten-tional lapses unperturbed by evaluative error processing.
Activity in the � frequency band is thought to reflect the state ofcortical excitability (Pfurtscheller, 2001). For example, studies thathave focused on event-related synchronization (increase) and de-synchronization (decrease) of � have pointed to antagonistic neuralmechanisms that actively suppress and enhance visual cortical excit-ability when attention is deployed in space and time (Kelly et al.,2006; Thut et al., 2006; Romei et al., 2008a). Although the sensitivityof � activity to subtle changes in visual excitability has been welldocumented (Romei et al., 2008a,b), the � effects observed here areunlikely to reflect changes in baseline visual activity since we ob-
served no changes in either SSVEP or P1 amplitude, including on thetarget trial itself. The absence of any such relationship in our data islikely to be a product of the particular paradigm used. In contrast toprevious � studies, most of which involved detection or discrimina-tion tasks performed close to threshold levels (Thut et al., 2006; vanDijk et al., 2008), the CTET entails monitoring a centrally presented,high-contrast stream of continuous visual input that is well abovedetection thresholds. Moreover, it was verified that the increasedduration of target frames was readily detectable at 100% accuracyduring short practice runs. Consequently, performance is much lessdependent on the active deployment of attention to the visual do-main or the fine-tuning of perceptual thresholds. This made it pos-sible to isolate “miss” trials that arose from a failure to sustain atten-tion to stimulus duration as opposed to a temporary fluctuation invisual baseline activity.
Given that well-established indices of bottom-up visual stimulusprocessing (P1 and SSVEP) are unaffected, it would seem that theperformance-predicting variance in � in our study is not the samemarker of early visual cortical excitability as inferred in previousstudies (Thut et al., 2006; Romei et al., 2008a,b; van Dijk et al., 2008).Numerous studies have demonstrated that early visual regions arenot the only generators of � activity. Source analysis and combinedEEG/fMRI studies have also mapped � activity in key nodes of theattentional control network, including the frontal and parietal cor-tices (Laufs et al., 2003, 2006; Moosmann et al., 2003; de Munck etal., 2007; Dockree et al., 2007). Although it is not possible to makestrong claims regarding potential cortical generators on the basis ofEEG topographies alone, the pre-miss � increase observed here wasmost strongly focused over right inferior parietal scalp and not overany of the regions that were associated with event-related stimulusprocessing. The right inferior parietal cortex has been heavily impli-cated in the top-down control of attention (Husain and Nachev,2007), and the gradual increase in � amplitude appears consistentwith the emergence of cortical idling or a resting state as controlledmonitoring processes go off-line (Pfurtscheller and Lopes da Silva,1999; Mantini et al., 2007). An alternative possibility is that this �trend arises from decreasing recruitment of specialized temporalprocessing regions. Transcranial magnetic stimulation and lesionstudies have indicated that the right inferior parietal cortex alsoforms a critical part of the dorsal “when” pathway, which underpinsour perception of time (Battelli et al., 2008; Van Rullen et al., 2008).The actual source of the present � trends may be best elucidated bycombining EEG with brain imaging methods that provide fine-grained spatial resolution (e.g., fMRI) to explore the interaction ofdistributed functional networks.
The absence of any differences in visual perceptual analysis oftask stimuli is consistent with previous reports that temporal expec-tation alone does not modulate the visual P1 component but specif-ically affects higher levels of stimulus processing relevant to goalmonitoring and response execution as indexed by components suchas the P3 and CNV (Miniussi et al., 1999; Doherty et al., 2005). Aninteresting avenue for future research may be to explore whethertop-down modulation of the SSVEP emerges when participants arerequired to monitor for a visual feature such as a change in thefrequency of the stimulus flicker.
The frontal P3 component differentiated hits from misses overboth the long and short pretarget epochs. The analysis of the targettrial for hits is revealing in that a component with the same temporaland topographical characteristics as the standard P3 was elicited dur-ing the additional target trial duration in the absence of any stimuluschangeover. Previous studies of rhythm perception have pointed to alink between increased P3 amplitudes and improved timing(Jongsma et al., 2007; Correa and Nobre, 2008). The fact that a fron-
8610 • J. Neurosci., July 1, 2009 • 29(26):8604 – 8611 O’Connell et al. • Error-Predicting Electrophysiology

tal P3 was elicited during the target interval in the absence of a stim-ulus change indicates that this component is not stimulus driven butrepresents an active endogenous mechanism that traces the tempo-ral structure of the task (Busse and Woldorff, 2003). Although am-plitude differences reached significance across the 30 s epoch, noclear trends were apparent in the P3 signal that could differentiatethe two detection conditions. The largest divergences occurred in the3–4 s immediately preceding target onset, suggesting a brief disen-gagement of this monitoring mechanism immediately before a be-havioral lapse.
The effect of an attentional lapse on the CNV appeared to be evenmore fleeting, with differences only apparent on the target trial itself.Previous research has demonstrated that the CNV represents theanticipatory deployment of attention before the presentation of anexpected imperative stimulus as well as the preparation of an associ-ated response (Miniussi et al., 1999; Brunia and van Boxtel, 2001). Inthe present study, the CNV grew in amplitude as the expected onsetof the next stimulus approached, peaking at �800 ms on standardframes but extending to 1100 ms on target trials. CNV amplitudewas significantly attenuated on miss trials, indicative of a momentaryreduction in target anticipation and consistent with the earlier dis-engagement of the P3 time-monitoring mechanism.
While top-down control gradually decays over the 20 s timescale,the shorter-term changes in the task-specific monitoring processesindexed by the standard P3 and CNV suggest that a critical thresholdmay need to be passed before task performance is actually compro-mised. This raises the interesting possibility that feedback on �-bandstates could be used as an early warning system to avert critical lapsesof attention.
In conclusion, the present study reports a novel approach to theanalysis of electrophysiological markers of lapsing attention thatopens many new avenues for investigation. Our results identify mal-adaptive neural patterns operating on at least two distinct timescales:longer-term drifts in � amplitude (up to 20 s) preceding short-termdisruption of performance-monitoring mechanisms before targetonset (3–4 s). The absence of any change in early sensory processingindicates that lapsing top-down attention impacts primarily onhigher-order endogenous mechanisms, at least in the present taskscenario in which performance does not rely heavily upon percep-tual acuity. Exploring prelapse activity may help to better character-ize the neuropsychological deficits in a range of clinical groups andcould contribute to the development of new rehabilitativetechniques.
ReferencesAllain S, Carbonnell L, Falkenstein M, Burle B, Vidal F (2004) The modu-
lation of the Ne-like wave on correct responses foreshadows errors. Neu-rosci Lett 372:161–166.
Battelli L, Walsh V, Pascual-Leone A, Cavanagh P (2008) The “when” parietalpathway explored by lesion studies. Curr Opin Neurobiol 18:120–126.
Brunia CH, van Boxtel GJ (2001) Wait and see. Int J Psychophysiol 43:59–75.Busse L, Woldorff MG (2003) The ERP omitted stimulus response to “no-
stim” events and its implications for fast-rate event-related fMRI designs.Neuroimage 18:856 – 864.
Correa A, Nobre AC (2008) Neural modulation by regularity and passage oftime. J Neurophysiol 100:1649 –1655.
de Munck JC, Goncalves SI, Huijboom L, Kuijer JP, Pouwels PJ, HeethaarRM, Lopes da Silva FH (2007) The hemodynamic response of the alpharhythm: an EEG/fMRI study. Neuroimage 15:1142–1151.
Dockree PM, Kelly SP, Foxe JJ, Reilly RB, Robertson IH (2007) Optimalsustained attention is linked to the spectral content of background EEGactivity: greater ongoing tonic alpha (approximately 10 Hz) power sup-ports successful phasic goal activation. Eur J Neurosci 25:900 –907.
Doherty JR, Rao A, Mesulam MM, Nobre AC (2005) Synergistic effect of
combined temporal and spatial expectations on visual attention. J Neu-rosci 25:8259 – 8266.
Eichele T, Debener S, Calhoun VD, Specht K, Engel AK, Hugdahl K, vonCramon DY, Ullsperger M (2008) Prediction of human errors by mal-adaptive changes in event-related brain networks. Proc Natl Acad SciU S A 105:6173– 6178.
Foxe JJ, Simpson GV (2002) Flow of activation from V1 to frontal cortex inhumans: a framework for defining “early” visual processing. Exp BrainRes 142:139 –150.
Hajcak G, Nieuwenhuis S, Ridderinkhof KR, Simons RF (2005) Error-preceding brain activity: robustness, temporal dynamics and boundaryconditions. Biol Psychol 70:67–78.
Husain M, Nachev P (2007) Space and the parietal cortex. Trends Cogn Sci11:30 –36.
Jongsma ML, Meeuwissen E, Vos PG, Maes R (2007) Rhythm perception:speeding up or slowing down affects different subcomponents of the ERPP3 complex. Biol Psychol 75:219 –228.
Kelly SP, Lalor EC, Reilly RB, Foxe JJ (2006) Increases in alpha oscillatorypower reflect an active retinotopic mechanism for distracter suppressionduring sustained visuospatial attention. J Neurophysiol 95:3844 –3851.
Laufs H, Kleinschmidt A, Beyerle A, Eger E, Salek-Haddadi A, Preibisch C,Krakow K (2003) EEG-correlated fMRI of human alpha activity. Neu-roimage 19:1463–1476.
Laufs H, Holt JL, Elfont R, Krams M, Paul JS, Krakow K, Kleinschmidt A(2006) Where the BOLD signal goes when alpha EEG leaves. Neuroimage31:1408 –1418.
Macar F, Vidal F (2004) Event-related potentials as indices of time process-ing: a review. J Psychophysiol 18:89 –104.
Mantini D, Perrucci MG, Del Gratta C, Romani GL, Corbetta M (2007)Electrophysiological signatures of resting state networks in the humanbrain. Proc Natl Acad Sci U S A 104:13170 –13175.
Miniussi C, Wilding EL, Coull JT, Nobre AC (1999) Orienting attention intime. Modulation of brain potentials. Brain 122:1507–1518.
Moosmann M, Ritter P, Krastel I, Brink A, Thees S, Blankenburg F, Taskin B,Obrig H, Villringer A (2003) Correlates of alpha rhythm in functionalmagnetic resonance imaging and near infrared spectroscopy. Neuroim-age 20:145–158.
Muller MM, Hillyard S (2000) Concurrent recording of steady-state andtransient event-related potentials as indices of visual-spatial selective at-tention. Clin Neurophysiol 111:1544 –1552.
Nobre A, Correa A, Coull J (2007) The hazards of time. Curr Opin Neuro-biol 17:465– 470.
Pfurtscheller G (2001) Functional brain imaging based on ERD/ERS. VisionRes 41:1257–1260.
Pfurtscheller G, Lopes da Silva FH (1999) Event-related EEG/MEG syn-chronization and desynchronization: basic principles. Clin Neurophysiol110:1842–1857.
Polich J (1990) Probability and interstimulus interval effects on the P300from auditory stimuli. Int J Psychophysiol 10:163–170.
Ridderinkhof KR, Nieuwenhuis S, Bashore TR (2003) Errors are foreshad-owed in brain potentials associated with action monitoring in cingulatecortex in humans. Neurosci Lett 348:1– 4.
Robertson IH, Garavan H (2004) Vigilant attention. In: The cognitive neuro-sciences, Ed 3 (Gazzaniga MS, ed), pp 631–640. Cambridge, MA: MIT.
Romei V, Rihs T, Brodbeck V, Thut G (2008a) Resting electroencephalo-gram alpha-power over posterior sites indexes basline visual cortex excit-ability. Neuroreport 19:203–208.
Romei V, Brodbeck V, Michel C, Amedi A, Pascual-Leone A, Thut G (2008b)Spontaneous fluctuations in posterior alpha-band EEG activity reflect vari-ability in excitability of human visual areas. Cereb Cortex 18:2010–2018.
Thut G, Nietzel A, Brandt SA, Pascual-Leone A (2006) �-Band electroen-cephalographic activity over occipital cortex indexes visuospatial atten-tion bias and predicts visual target detection. J Neurosci 26:9494 –9502.
van Dijk H, Schoffelen JM, Oostenveld R, Jensen O (2008) Prestimulus os-cillatory activity in the alpha band predicts visual discrimination ability.J Neurosci 28:1816 –1823.
VanRullen R, Pascual-Leone A, Battelli L (2008) The continuous Wagonwheel illusion and the “when” pathway of the right parietal lobe: a repet-itive transcranial magnetic stimulation study. PLoS ONE 3:e2911.
O’Connell et al. • Error-Predicting Electrophysiology J. Neurosci., July 1, 2009 • 29(26):8604 – 8611 • 8611
Related Documents