UNCLASSIFIED 1 Future Global Range Transport Aircraft MARTIN HEPPERLE German Aerospace Center Institute of Aerodynamics and Flow Technology Lilienthalplatz 7, D-38108 Braunschweig WOLFGANG HEINZE Technical University of Brunswick, Institute of Aircraft Design and Light Weight Structures Hermann-Blenk-Straße 35, D-38108 Braunschweig Abstract An increasing demand for air lift transport capacities is raised by humanitarian and military missions. For heavy load, long range missions the conventional aircraft configuration seems to be close to its limits. If transport aircraft grow larger than the ultra high capacity aircraft currently under development, alternative configurations seem to offer promising benefits in terms of performance and costs. The paper presents a comparison of two ultra high capacity long range transport aircraft: the first aircraft has been designed as a classical Wing-Fuselage-Tail configuration, whereas the second concept is an Integrated-Wing-Fuselage configuration. Global Range Transport Capacity During the last years, the demand for long range transport aircraft has increased. A huge number of older aircraft are reaching the end of their service life and will require major retrofits or have to be replaced by new aircraft. A future Global Range Transport Aircraft should be able to fly a long distance mission, deliver its heavy cargo and return to the home base. For the following study, it was tried to stretch the requirements to cover world wide missions, without the need for refueling at the destination. For humanitarian as well as military missions, a high payload capacity is desired. Also the cross section of the cargo compartment should be large enough to fit bulky, but not necessarily heavy equipment like containers with emergency hospitals, or helicopters. A rear ramp is required to allow for air drop of goods and equipment. Range and Payload Range Figure 1 presents a view of the earth surface divided into areas within a certain range. The center of the great circle range limits is arbitrarily taken to be located in Europe. The map shows, that one can achieve nearly world wide coverage for one-way transport tasks, with a range of at least 10’000 km (5400 nm). In order to include South America and Australia, the range should be extended to 15’000 km (8100 nm). If this range is to be covered without refueling, an extremely large range of 30’000 km would be required for a new aircraft design. The well known range equation for jet propelled airplanes (assuming constant altitude and angle of attack, varying cruise speed) (1) shows, that besides the first order parameter of thrust specific fuel consumption (TSFC), the fuel mass (m 0 -m 1 ) and aerodynamics (C L , C D ) contribute to the achievable range. ( ) 1 0 2 2 m m C C S g TSFC R D L − ⋅ ⋅ ⋅ ⋅ = ρ (1) For maximum range, the relation between C L and C D can be rewritten [1] and this equation becomes now

Welcome message from author
This document is posted to help you gain knowledge. Please leave a comment to let me know what you think about it! Share it to your friends and learn new things together.
Transcript

UNCLASSIFIED 1
Future Global Range Transport Aircraft
MARTIN HEPPERLE German Aerospace Center
Institute of Aerodynamics and Flow Technology Lilienthalplatz 7, D-38108 Braunschweig
WOLFGANG HEINZE
Technical University of Brunswick, Institute of Aircraft Design and Light Weight Structures
Hermann-Blenk-Straße 35, D-38108 Braunschweig
Abstract An increasing demand for air lift transport capacities is raised by humanitarian and military missions. For heavy load, long range missions the conventional aircraft configuration seems to be close to its limits. If transport aircraft grow larger than the ultra high capacity aircraft currently under development, alternative configurations seem to offer promising benefits in terms of performance and costs. The paper presents a comparison of two ultra high capacity long range transport aircraft: the first aircraft has been designed as a classical Wing-Fuselage-Tail configuration, whereas the second concept is an Integrated-Wing-Fuselage configuration.
Global Range Transport Capacity During the last years, the demand for long range transport aircraft has increased. A huge number of older aircraft are reaching the end of their service life and will require major retrofits or have to be replaced by new aircraft. A future Global Range Transport Aircraft should be able to fly a long distance mission, deliver its heavy cargo and return to the home base. For the following study, it was tried to stretch the requirements to cover world wide missions, without the need for refueling at the destination. For humanitarian as well as military missions, a high payload capacity is desired. Also the cross section of the cargo compartment should be large enough to fit bulky, but not necessarily heavy equipment like containers with emergency hospitals, or helicopters. A rear ramp is required to allow for air drop of goods and equipment.
Range and Payload Range
Figure 1 presents a view of the earth surface divided into areas within a certain range. The center of the great circle range limits is arbitrarily taken to be located in Europe. The map shows, that one can achieve nearly world wide coverage for one-way transport tasks, with a range of at least 10’000 km (5400 nm). In order to include South America and Australia, the range should be extended to 15’000 km (8100 nm). If this range is to be covered without refueling, an extremely large range of 30’000 km would be required for a new aircraft design. The well known range equation for jet propelled airplanes (assuming constant altitude and angle of attack, varying cruise speed) (1) shows, that besides the first order parameter of thrust specific fuel consumption (TSFC), the fuel mass (m0-m1) and aerodynamics (CL, CD) contribute to the achievable range.
( )1022 mm
CC
Sg
TSFCR
D
L −⋅⋅⋅⋅=
ρ (1)
For maximum range, the relation between CL and CD can be rewritten [1] and this equation becomes now

UNCLASSIFIED 2
( )100,3
12
3 mmCkS
gTSFC
RD
−⋅⋅⋅⋅⋅
=ρ (2)
which reflects more clearly the fact that the induced drag (k-factor) is of equal importance to range as the zero lift drag CD,0. The reference area S should be as small as possible, but must be large enough to fulfill takeoff and landing speed requirements.
Payload The requirements for payload can be very manifold. On the one hand there are relatively lightweight, but bulky loads, like helicopters or hospital equipment for medical missions. On the other hand a transport aircraft should be able to carry heavy equipment for military purposes or humanitarian missions (e.g. machinery) quickly over long distances. Today the largest heavy lift airplanes, like the Antonov An-255 or the envisioned Airbus A380F can carry a load of 100 metric tons over a distance of 10’000 to 12’000 km (figure 2). The An-255 can carry even 250 tons over a shorter distance of 5’000 km. The maximum ferry range (zero payload) of both airplanes is in the order of 15’000 to 16’000 km.
Design Mission Based on the range analysis and the size and mass of typical payloads, a mission of 20’000 km with a payload of 150 tons was defined for this study of a Global Range Transport Aircraft. This is an extremely demanding mission requirement, as can be seen by comparison with existing aircraft in figure 2. The data for the initially planned long range mission and another mission, having a reduced range are listed in table 1. For this mission, several cargo scenarios were considered. Table 2 lists the different payloads that were used to size the cargo compartment of all aircraft which were investigated in this study.
Configuration Layout Today most aircraft are of the classical configuration type: a main wing close to the center of gravity carries the main load. A smaller horizontal tailplane is added at the rear of the aircraft to provide longitudinal stability and control. The payload is carried in a fuselage, which connects the lifting surfaces, but does not contribute considerably to the overall lift. This configuration has been developed over almost 100 years and current aircraft are very close to the optimum which can be achieved with this configuration [2]. Alternate configurations like aircraft in canard configuration or flying wing aircraft have been studied [3, 4, 5, 6] but only very few made it into actual products. Only a small number of current aircraft are of a non conventional configuration. The largest of these is the B-2 bomber, which is a pure flying wing without vertical control surfaces. Here the configuration has probably been chosen less for performance reasons than for the enhanced stealth properties of the configuration. Nevertheless, this aircraft has a high range capability, which is also a result of its aerodynamically efficient shape. A flying wing aircraft offers several benefits for transport aircraft and this paper will present a comparison of two concurring Global Range Transport Aircraft. Both are designed to fly the same mission, but are of different configuration. The first aircraft was designed using the classical configuration, whereas the second configuration is of the flying wing type.
Tools used for Design and Analysis The design and analysis work for both configurations has mainly been performed with the computer program PrADO (Preliminary Aircraft Design and Optimization). This program models the iterative, multidisciplinary design process of an aircraft as follows:
• The user supplies the mission requirements in terms of data like range, payload mass and shape as well as the desired cruise conditions. Additionally the user defines the shape of the aircraft using general parameters like wing aspect ratio, wing area, and a parametrical description of the wing planform. For the fuselage a cross section shape is prescribed as well as a parametric representation of the external lines. The geometry model includes many important details like a structural layout definition, fuel tank arrangement and a fuel pickup scheme to take the variation of the center of

UNCLASSIFIED 3
gravity due to fuel consumption into account for trim calculations. Furthermore constraints like the allowed takeoff and landing distances, and other design rules are specified by the user.
• First, the fuselage is sized according to the prescribed payload volume. Based on the specified cross section profile, the length of the fuselage is adapted according to the payload.
• The size of the wing depends on the aerodynamic lift requirements, mainly during takeoff and landing as well as on the required fuel volume. The fuel volume is mostly determined by aerodynamic efficiency during cruise and, of course, the mission requirements.
• After the geometric sizing has been performed, the aerodynamic performance can be evaluated. The results is a data base with lift, drag and pitching moments values for the entire flight regime.
• The next step is the engine sizing (takeoff thrust, engine geometry and mass) and the calculation of a thrust and TSFC database based on a simple thermodynamic engine model.
• The first step to calculate accurate component and aircraft masses is the simulation of the prescribed mission. The results will be new estimates for fuel mass, flight path angles and range-time characteristics. Input are the aerodynamic and engine data from the preceding steps.
• The flight analysis is followed by the calculation of the empty aircraft mass. This program part is performing a structural dimensioning for the primary components (wing, fuselage) of the aircraft. The process includes definition of load cases, building up of a structural model (e.g. beam model for the wing), consideration of material properties and a fully stressed design of the different structure elements (e.g. skins, spars). The secondary masses – e.g. masses of hydraulic and fuel system, cabin and operational equipment – are be calculated by statistical equations or assume prescribed values (e.g. weight per seat).
• The results will then be used to estimate a new aircraft mass. • Starting with the initial data, the design is performed by iterating parameters like operating empty
and fuel mass, number of engines, takeoff thrust etc. until a converged solution is obtained. • When the design process has found a converged solution, fulfilling all constraints, the operating
costs can be calculated and the design procedure stops. The modules inside PrADO allow a selection of more or less complex methods. For example, a simple aerodynamics model (based on wetted surfaces and standard handbook formulas for induced drag and wave drag) can be selected for quick initial design work. When some refinement is desired, the next level of methods can be used, e.g. a higher order vortex lattice method for a more accurate determination of the induced drag. Finally, it is possible to transfer the aircraft geometry automatically to a CAD system for the automatic generation of surface and volume models, which can be used directly to create a mesh for the DLR Euler/Navier-Stokes Solver Tau. The results of this code can then be fed back into the aerodynamics database to improve the accuracy of the design. This is especially useful if the mission contains segments operating at high subsonic or even supersonic Mach numbers [9]. For the results presented here, no use was made of these high-fidelity methods as the cruise Mach number was relatively low.
Results Conventional Configuration
After specifying the mission requirements and an initial aircraft geometry, the configuration was refined using the design program. Figure 5 shows the resulting optimized aircraft. The size of the cross-section and the fuselage length are determinate by the payload volume requirements. On top, the fuselage has additional space for furnishing a cabin, which can be used for personal transport. The shoulder wing configuration allows a low level main deck for simple cargo loading and unloading. A compact landing gear with short struts is attached to the fuselage. The tailplanes are arranged in T-configuration. It is possible to load and unload through nose and tail doors, which reduces the turn-around time. The first runs of the design program with a target range of 20’000 km showed that the procedure was not able to produce a converged result. This behavior indicates the technical limits of a conventional configuration due the square-cubic-law. This law describes the fact that by a conventional aircraft the structure masses grow faster than the aerodynamic lift by increasing the aircraft size (e.g. wing area). To overcome this, the technology of the aircraft

UNCLASSIFIED 4
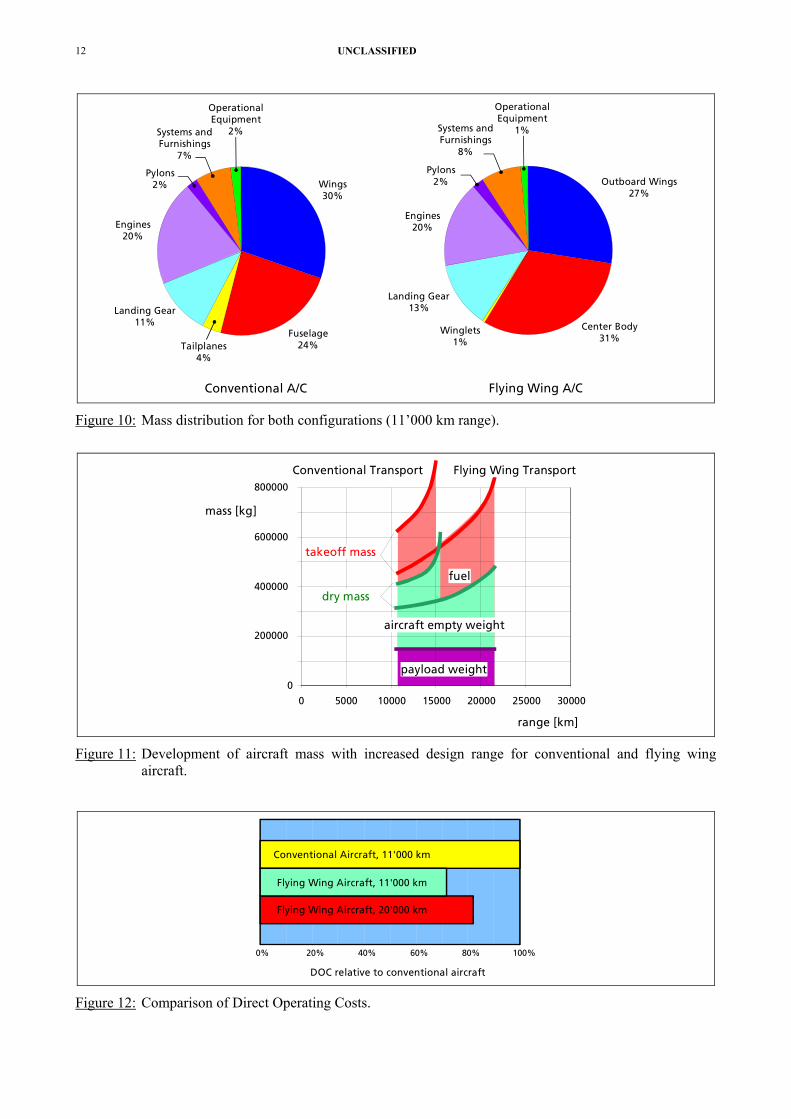
(aerodynamics, structural concept or materials, engine fuel consumption) has to be improved or the design requirements (range and payload) have to be reduced. After the range requirement was considerably reduced to 11’000 km while the payload was kept constant, the PrADO code produced converged results. To find the optimum configuration with minimum operating costs, a parameter study was carried out. For this reduced cruise range a parametric variation of wing area and aspect ratio was performed. Figure 3 shows the direct operating costs of each aircraft in € per ton payload per kilometer flown. The minimum in DOC occurs at a relatively low aspect ratio in the order of 7 and a wing area of 813 m2. Such a wing leads to a low structural weight and thus low aircraft price. The wing area tends to a minimum but is limited by the minimum area required to achieve an acceptable landing approach speed (prescribed to be less or equal to 77.2 m/s). The graph in figure 4 shows that an aircraft having higher aerodynamic efficiency und thus lower fuel consumption per kilometer must have a higher aspect ratio of about 9. Again, the minimum wing area is controlled by approach speed. Nevertheless, such a fuel efficient aircraft is more costly to manufacture and creates higher operating costs. Regarding an optimum overall design, the reduction of the depreciation due to lower empty aircraft mass is the dominated effect for very large aircraft and the way to overcome the square-cubic-effect. Later, a parametric range variation (figure 11) showed, that the conventional configuration can be stretched to reach a range of about 15’000 km. Due to the increased weight, the four engines are not sufficient, if a maximum static thrust of 450 kN per engine is assumed (based on current propulsion technology). For the long range mission 6 engines would have to be used.
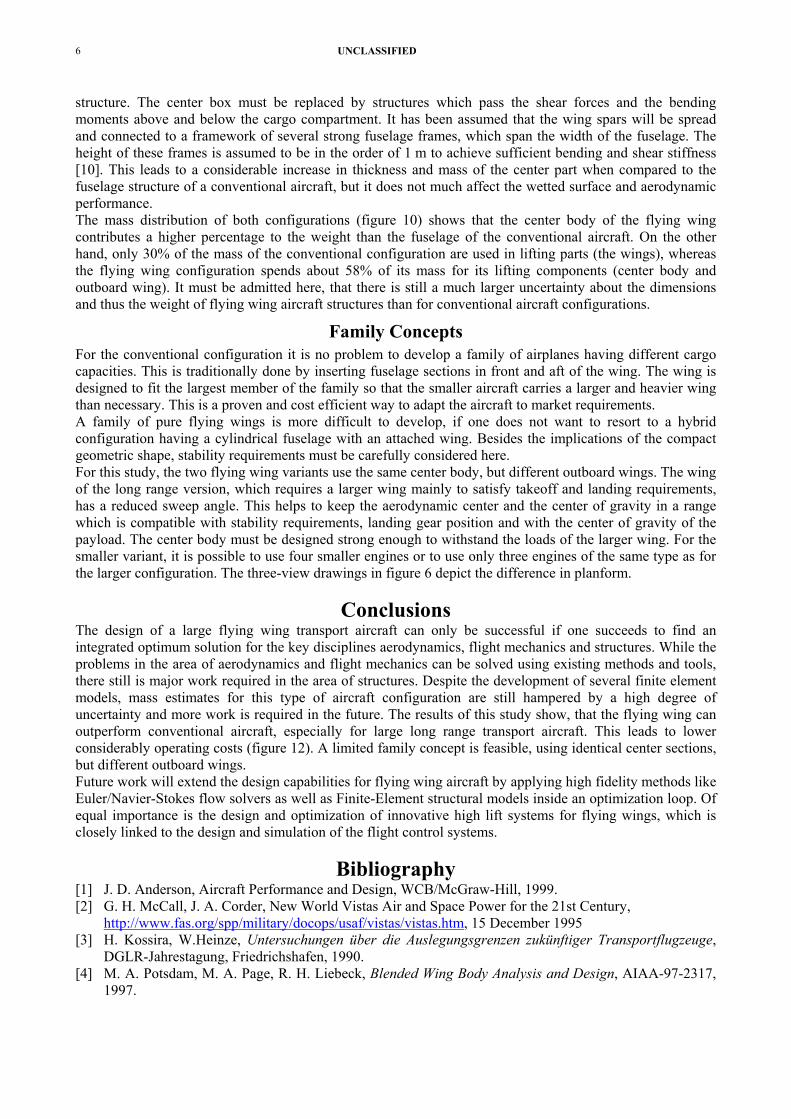
Flying Wing Configuration Two flying wing aircraft were designed for comparison with the conventional aircraft. Figure 6 shows the general arrangement of the two versions differing in range. A flying wing aircraft offers the possibility to alter the shape of the cargo compartment quite radically. These aircraft offer a wider, more rectangular planform for the cargo deck compared to the long cylindrical compartment of the conventional aircraft configuration. This shape makes it well suited for bulky loads which do not fit well into the standard cross section. As shown in figure 7, wide openings for fast loading and unloading can be created by integrating a loading ramp at the rear or by provision of a hinged nose part. It is easily possible to provide twice the access area compared to a conventional fuselage, which can reduce loading time and speeds up air drop operations considerably. Figure 8 shows various options for payload access through rear and forward doors. An additional benefit of this type of configuration is the reduction in wetted surface and the larger volume available for fuel due to the large absolute chord and thickness of the root airfoil section. Of course there are the typical drawbacks of non cylindrical cross sections, namely the difficulty to provide a stiff and lightweight structure for a pressurized fuselage and the transfer of wing and landing gear loads. Typically, the wing of a flying wing transport aircraft has a low aspect ratio because the root chord is stretched over the length of the cargo compartment. Thus a lower structural weight can be achieved for the outboard wing. If the total mass divided by the wingspan of the aircraft is not higher than that of the conventional aircraft, no aerodynamic disadvantage in terms of induced drag must be expected. The wetted surface is smaller than that of the conventional configuration where the non-lifting fuselage contributes considerably to the wetted surface (figure 9). Due to the large root chord, the relative thickness of the wing can be small (below 10%), which is helpful to stay well away from transonic drag rise. During the development of the flying wing configurations it became obvious that the requirements of load and balance can be fulfilled more easily with engines mounted in the rear. Additionally, the engines can be shielded by the body of the aircraft so that the noise levels and infra-red visibility on the ground can be reduced. Foreign object damage is also very unlikely, which makes this engine installation attractive for operation on unprepared or dirty airfields. As the engines are close to the centerline of the aircraft, engine out conditions are less severe and easier to control without requiring a massive increase of the vertical control surfaces. The engines mounted above the center body have some drawbacks, though: the high thrust line may cause pitch-down moments when power is varied rapidly. Maintenance and pre flight checks require either additional equipment or crew access to the upper surface of the airplane. As the engines are not distributed along the wingspan, they cannot reduce the loads on the wing and ingestion of ice shed from the upper center wing surface must be considered.

UNCLASSIFIED 5
Comparison Aerodynamics
The flying wing configuration shows a marked reduction in wetted surface when compared with the conventional configuration (3000 m2 versus 4400 m2, see figure 9a). One effect which contributes to this benefit stems from the fact that the wing attach to the full length of the fuselage, thus effectively excluding the side wall from the wetted surface. Additionally, the winglets have only a fraction of the horizontal and vertical tailplane surface area of the conventional configuration. Even if the winglets would have to be doubled in area, they still only have about 50% of the surface area of the conventional tailplanes. Comparing the relative distribution of the wetted surface (figure 9b) one can see, that the wings of the conventional configuration only have about 40% of the total surface. The remaining 60% of the surface are composed of mainly non-lifting components. On the flying wing aircraft, more than 90% of the wetted surface contribute to the total lift. The overall wetted surface of the flying wing is about 67% of the conventional aircraft. This means that the friction drag can be reduced by 34%, which may lead to an increase in L/D by approximately 50%, assuming equal aerodynamic efficiency. As the flying wing aircraft has a smaller wingspan and a lower aspect ratio, its efficiency is slightly reduced. But even under very conservative assumptions its L/D ratio may increase to at least 22 compared to 18 of the conventional aircraft. The low aspect ratio has no disadvantage in terms of induced drag, as this drag is defined by wing loading per span. Some disadvantage in friction drag is created by the increased wetted surface compared to a high aspect ratio wing. As a major portion of the operating costs of such a large aircraft is defined by the price of the aircraft itself and not by fuel consumption, a moderate loss in aerodynamic efficiency can be tolerated if the structural weight savings are large enough.
Takeoff and Landing Performance The long fuselage of the conventional transport aircraft limits the takeoff rotation to about 10°, compared to 15° possible with the flying wing. On the other hand, the lower sweep angle of the conventional aircraft and its higher aspect ratio leads to a higher lift gradient dCL/dα which compensates for this deficiency. The magnitude of the maximum lift coefficient for all three configurations is in the same order, if no high lift systems are deployed. Of course, high lift systems are taken into account for the calculation of the takeoff- and landing performance, and here the flying wing aircraft have a problem: on flying wing aircraft, high lift systems are always difficult to implement, especially if the sweep is moderate. This is because conventional high lift systems increase the airfoil camber and thus cause nose down pitching moments, which must be trimmed. Therefore the maximum lift capability of the flying wing has been assumed to be very conservative with a CL max of about 0.85 only. As can be seen from table 3, the resulting takeoff and landing speeds are not acceptable and must be reduced by introduction of an improved high lift system. A CL max of about 1.8 should be reached at least for the long range variant of the flying wing.
Stability and Control The conventional aircraft poses no problems for flight mechanics and control systems. On the flying wing configuration, one could even get rid of the vertical control surfaces by integrating split ailerons and air brakes into the control systems (as used in several Northrop and Horten designs, including the Northrop B-2). In this study a more conservative approach to stability and control has been taken by using winglets for yaw control. Pitch control can be achieved by deflecting a fuselage flap with support by flaperons. These will act also as roll control devices. As mentioned above, a more efficient high lift system is required, which must also be integrated into the flight control systems.
Structures The wing for the conventional configuration is of traditional design, with a center box carrying the loads through the fuselage. Therefore the diameter of the fuselage must be larger than required by the payload, which leads to the possibility to add an additional upper deck in front and behind the wing. This upper deck also contains the cockpit, so that a hinged nose can be used. Currently, there is no traditional structural design for flying wing aircraft. The very thick airfoil sections, together with the low aspect ratio of the wing, make it possible to build a relatively lightweight wing
UNCLASSIFIED 6
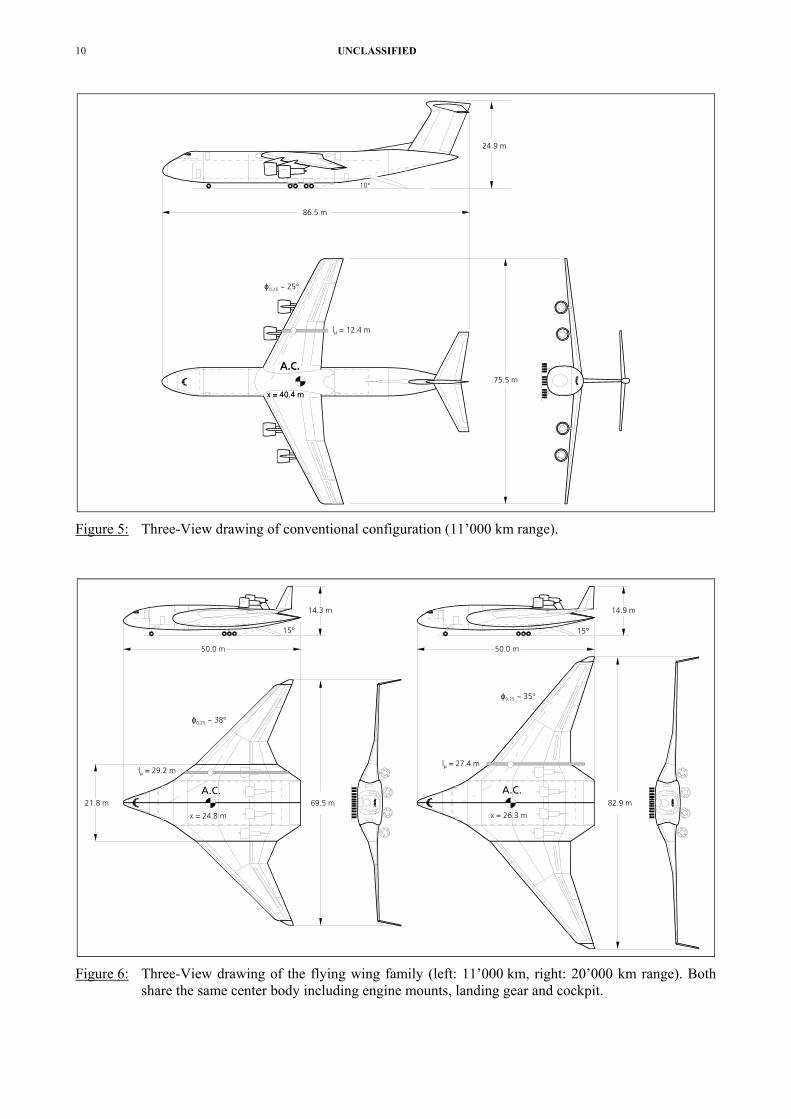
structure. The center box must be replaced by structures which pass the shear forces and the bending moments above and below the cargo compartment. It has been assumed that the wing spars will be spread and connected to a framework of several strong fuselage frames, which span the width of the fuselage. The height of these frames is assumed to be in the order of 1 m to achieve sufficient bending and shear stiffness [10]. This leads to a considerable increase in thickness and mass of the center part when compared to the fuselage structure of a conventional aircraft, but it does not much affect the wetted surface and aerodynamic performance. The mass distribution of both configurations (figure 10) shows that the center body of the flying wing contributes a higher percentage to the weight than the fuselage of the conventional aircraft. On the other hand, only 30% of the mass of the conventional configuration are used in lifting parts (the wings), whereas the flying wing configuration spends about 58% of its mass for its lifting components (center body and outboard wing). It must be admitted here, that there is still a much larger uncertainty about the dimensions and thus the weight of flying wing aircraft structures than for conventional aircraft configurations.
Family Concepts For the conventional configuration it is no problem to develop a family of airplanes having different cargo capacities. This is traditionally done by inserting fuselage sections in front and aft of the wing. The wing is designed to fit the largest member of the family so that the smaller aircraft carries a larger and heavier wing than necessary. This is a proven and cost efficient way to adapt the aircraft to market requirements. A family of pure flying wings is more difficult to develop, if one does not want to resort to a hybrid configuration having a cylindrical fuselage with an attached wing. Besides the implications of the compact geometric shape, stability requirements must be carefully considered here. For this study, the two flying wing variants use the same center body, but different outboard wings. The wing of the long range version, which requires a larger wing mainly to satisfy takeoff and landing requirements, has a reduced sweep angle. This helps to keep the aerodynamic center and the center of gravity in a range which is compatible with stability requirements, landing gear position and with the center of gravity of the payload. The center body must be designed strong enough to withstand the loads of the larger wing. For the smaller variant, it is possible to use four smaller engines or to use only three engines of the same type as for the larger configuration. The three-view drawings in figure 6 depict the difference in planform.
Conclusions The design of a large flying wing transport aircraft can only be successful if one succeeds to find an integrated optimum solution for the key disciplines aerodynamics, flight mechanics and structures. While the problems in the area of aerodynamics and flight mechanics can be solved using existing methods and tools, there still is major work required in the area of structures. Despite the development of several finite element models, mass estimates for this type of aircraft configuration are still hampered by a high degree of uncertainty and more work is required in the future. The results of this study show, that the flying wing can outperform conventional aircraft, especially for large long range transport aircraft. This leads to lower considerably operating costs (figure 12). A limited family concept is feasible, using identical center sections, but different outboard wings. Future work will extend the design capabilities for flying wing aircraft by applying high fidelity methods like Euler/Navier-Stokes flow solvers as well as Finite-Element structural models inside an optimization loop. Of equal importance is the design and optimization of innovative high lift systems for flying wings, which is closely linked to the design and simulation of the flight control systems.
Bibliography [1] J. D. Anderson, Aircraft Performance and Design, WCB/McGraw-Hill, 1999. [2] G. H. McCall, J. A. Corder, New World Vistas Air and Space Power for the 21st Century, http://www.fas.org/spp/military/docops/usaf/vistas/vistas.htm, 15 December 1995 [3] H. Kossira, W.Heinze, Untersuchungen über die Auslegungsgrenzen zukünftiger Transportflugzeuge,
DGLR-Jahrestagung, Friedrichshafen, 1990. [4] M. A. Potsdam, M. A. Page, R. H. Liebeck, Blended Wing Body Analysis and Design, AIAA-97-2317,
1997.

UNCLASSIFIED 7
[5] R. Martínez-Val, E. Schoep, Flying Wing versus Conventional Transport Airplane: the 300 Seat Case, ICAS 2000.
[6] A. L. Bolsunovsky et al., Investigations on possible Characteristics of FW Superhigh Seating Capacity Airplane, ICAS 2000.
[7] C. Österheld, W. Heinze, P. Horst, Influence of Aeroelastic Effects on Preliminary Aircraft Design, Proceedings of the ICAS-Congress, Harrogate, 2000
[8] W. Heinze, C. M. Österheld, P. Horst, Multidisziplinäres Flugzeugentwurfsverfahren PrADO - Programmentwurf und Anwendung im Rahmen von Flugzeug-Konzeptstudien, DGLR-Jahrestagung Hamburg, DGLR-Jahrbuch 2001.
[9] M. Hepperle, The Sonic Cruiser – A Concept Analysis, International Symposium “Aviation Technologies of the XXI Century, International Aviation Exhibition ILA, Berlin, May 2002.
[10] V. Mukhopadhyay, Structural Concepts Study of Non-circular Fuselage Configurations, SAE/AIAA World Aviation Congress, Los Angeles, October 1996.
[11] J. Borky et al., A Space Roadmap for the 21st Century Aerospace Force, http://www.fas.org/spp/military/docops/usaf/sab98r3.pdf, SAB-TR-98-01, November 1998
Symbols and Abbreviations
Symbol Description Units Symbol Description Units α angle of attack [°] R range [m] ρ density of air [kg/m³] S wing area [m²] b wingspan [-] CD drag coefficient [-] g gravity acceleration [m/s²] CD,0 drag coefficient at zero lift [-]
m0 take off mass [kg] CD,i induced drag coefficient [-] m1 landing mass [kg] CL lift coefficient [-]
mFuel fuel mass [kg] OEW operating empty weight [kg] k k-factor, [-] BPR bypass ratio [-] (1.0 for elliptical lift distribution) TSFC thrust spec. fuel consumption [1/h]
Tables
target range 20’000 km revised range 11’000 km cruise Mach number 0.80 - maximum payload 150’000 kg initial cruise altitude 8000 m final cruise altitude 12000 m
Table 1: Mission Requirements.
max. payload capacity 150’000 kg
6 helicopters UH-1D 6 x 5 tons example 1 total 30 tons 3 18 wheelers (40 tons capacity) 3 x 15 tons example 2 total 45 tons 18 ISO container 20 x 8 x 8 feet 18 x 5 tons example 3 total 90 tons 2 M1A1 tanks (70 tons each) 2 x 70 tons example 4 total 140 tons
Table 2: Payload scenarios taken into account.

UNCLASSIFIED 8
parameter conventional flying wing unit mission
range R 10’900 10’900 20’000 km payload mpayload 150’000 150’000 150’000 kg lift over drag L/Dcruise 18.5 19.7 22.3 -
dimensions overall length l 86.5 50.0 50.0 m overall span b 75.5 69.5 82.9 m overall height h 24.9 14.3 14.9 m payload volume 1’938 1’315 1’315 m3 max. fuel volume 533 926 1’172 m3 lifting area 813 1’354 1’554 m2 outboard wing area n.a. 800 1’000 m2 aspect ratio Λ 7.0 6.04 6.87 - sweep angle ϕ0.25 25 38 35 °
mass overall empty mOE 266’554 164’821 222’291 kg required fuel mfuel 218’715 152’904 330’456 kg max. takeoff mMTO 635’269 467’725 702’747 kg
engines bypass ratio BPR 9.5 9.5 9.5 - static thrust T0 385 215 333 kN
takeoff and landing performance takeoff lift coefficient CL max 2.53 0.86 0.86 - takeoff distance (FAR25) 2’533 4’377 5’636 m landing distance (FAR25) 1907 2’960 3’272 m landing approach speed 77.0 89.0 93.0 m/s lift slope dCL/dα 0.160 0.105 0.114 1/° max. rotation angle αmax 10 15 15 ° possible lift coefficient CL(αmax) 1.60 1.58 1.71 -
Table 3: Comparison of aircraft data.
Figures
Figure 1: World wide coverage for different ranges (great circle distances measured from Europe).

UNCLASSIFIED 9
Figure 2: Payload-Range diagram for various large transport airplanes.
Figure 3: Direct Operating Costs (relative to the baseline aircraft) over wing area and aspect ratio for the conventional aircraft.
Figure 4: Required fuel mass (in kg) over wing area and aspect ratio for the conventional aircraft.
UNCLASSIFIED 10
75.5 m
A.C.
x = 40.4 m
86.5 m
10°
24.9 m
lµ = 12.4 m
ϕ0.25 ~ 25°
A.C.
x = 40.4 m
Figure 5: Three-View drawing of conventional configuration (11’000 km range).
69.5 m 82.9 m
50.0 m 50.0 m
21.8 mA.C.
x = 24.8 m
A.C.
x = 26.3 m
lµ = 27.4 mlµ = 29.2 m
14.3 m 14.9 m
15° 15°
ϕ0.25 ~ 38°
ϕ0.25 ~ 35°
Figure 6: Three-View drawing of the flying wing family (left: 11’000 km, right: 20’000 km range). Both share the same center body including engine mounts, landing gear and cockpit.

UNCLASSIFIED 11
75.5 m
6.5 m
69.5 m
10.8 m
Figure 7: Access areas provided by front ramp on conventional configuration and rear ramp on flying wing aircraft.
10°
a)
b)
c)
d)
e)
Figure 8: Different solutions for loading and unloading: a) conventional aircraft with rear ramp and upwards tilting nose; b) flying wing with rear ramp only; c) raised cockpit area, tilting nose, rear ramp; d) sideways swiveling nose, rear ramp; e) raised cockpit area, clamshell doors, rear ramp.
0
500
1000
1500
2000
2500
Fuselage Wings Vert. Fin Tailplane
Flying Wing AircraftConventional Aircraft
Swet [m2]
a)
Fuselage46%
Wings40%
Vert. Fin 7%
Tailplane7%
Center Body39%
Wings58%
Winglets3%
Conventional A/C Flying Wing A/C
b)
Figure 9: Wetted surface of aircraft components for both configurations (11’000 km range).
UNCLASSIFIED 12
Systems andFurnishings
7%
Wings30%
Fuselage24%Tailplanes
4%
Landing Gear11%
Engines20%
Pylons2%
OperationalEquipment
2%
Outboard Wings27%
Center Body31%
Winglets1%
Landing Gear13%
Engines20%
Pylons2%
Systems andFurnishings
8%
OperationalEquipment
1%
Flying Wing A/CConventional A/C
Figure 10: Mass distribution for both configurations (11’000 km range).
0
200000
400000
600000
800000
0 5000 10000 15000 20000 25000 30000
fuel
aircraft empty weight
payload weight
mass [kg]
dry mass
takeoff mass
Flying Wing TransportConventional Transport
range [km]
Figure 11: Development of aircraft mass with increased design range for conventional and flying wing aircraft.
0% 20% 40% 60% 80% 100%
DOC relative to conventional aircraft
Conventional Aircraft, 11'000 km
Flying Wing Aircraft, 11'000 km
Flying Wing Aircraft, 20'000 km
Figure 12: Comparison of Direct Operating Costs.
UNCLASSIFIED 13
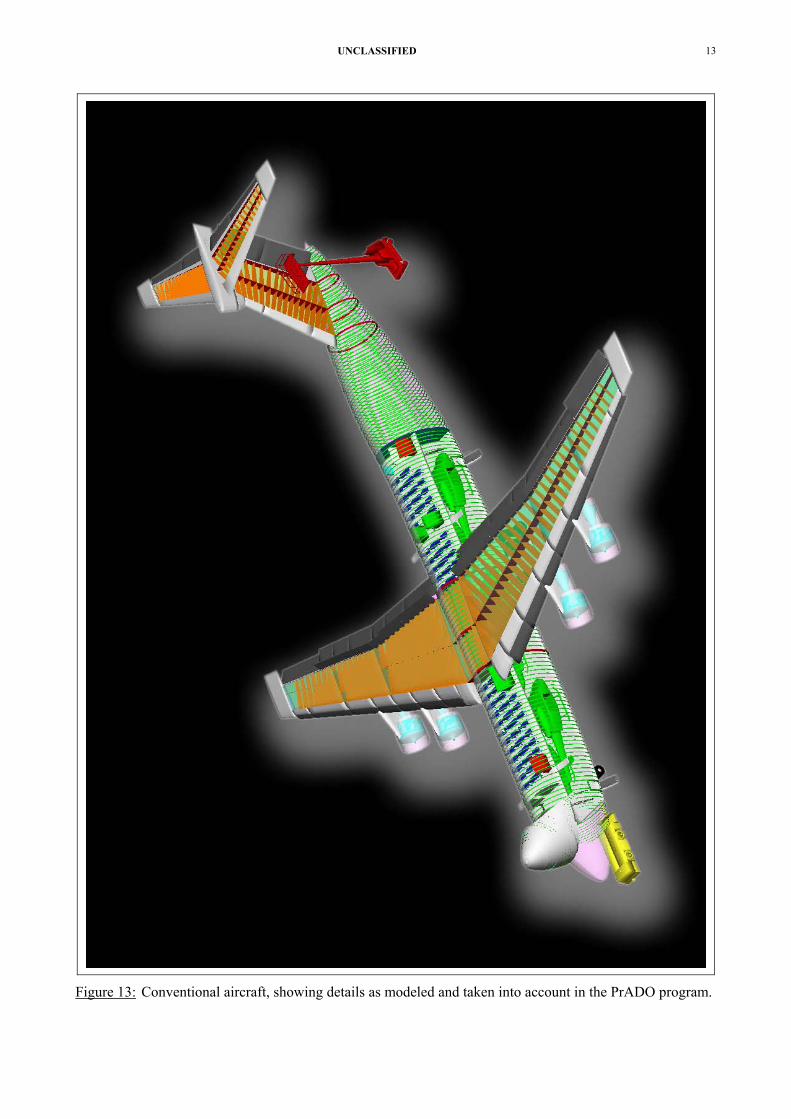
Figure 13: Conventional aircraft, showing details as modeled and taken into account in the PrADO program.

UNCLASSIFIED 14
Figure 14: Long Range flying wing aircraft, showing internal details.
Related Documents