AD-AO99 882 PEAT MARWICK MITCHELL AND CO SAN FRANCISCO CALIF F/G 1/2 LAMBERT-ST. LOUIS INTERNATIONAL AIRPORT DATA PACKAGE NUMBER 7. --ETC(U) AUG 80 DOT-FA77WA-3961 I UNCLASSIFIED NL

Welcome message from author
This document is posted to help you gain knowledge. Please leave a comment to let me know what you think about it! Share it to your friends and learn new things together.
Transcript

AD-AO99 882 PEAT MARWICK MITCHELL AND CO SAN FRANCISCO CALIF F/G 1/2LAMBERT-ST. LOUIS INTERNATIONAL AIRPORT DATA PACKAGE NUMBER 7. --ETC(U)AUG 80 DOT-FA77WA-3961
I UNCLASSIFIED NL

INTEBRNATIOCNAL
I AT~A PACKAGE 6I AIRPORT IMPROVEMENT
TASK FORCE DELAY STUDIES&
................
I. ... .. .. I...I~~. . . . .................*.... -
.. ..._ _ _ _ _ _ _. pr pa e for .... ....... .
I~~.... ............. ..~IUTO SAT ' .. DEA T ETO.ASO T TO
* ~ ~ ~ ~ ~ ~~ ... .. ........pbl..~ EDRL VATO A MNITATOj Distri~t10~.U....t... ............................
.. undercontracPeat, Marw.ck,.Mitche.l.&...
... ............... .. ..6. ... .0 8 ........ L k ...... ........e:

P.O. Box 8007San Francisco International Airport
F~ MarwickMitcheU &CoL San Francisco, California 94128
(415) 347-9521
August 26, 1980
Mr. Michael M. Scott, ATF-4Federal Aviation Administration800 Independence Avenue, S.W.Washington, D.C. 20591
Re: St. Louis Data Packages No. 6 and No. 7
Dear Mike:
Enclosed are twenty-five copies of Data Packages No. 6 andNo. 7 for Lambert-St. Louis International Airport. DataPackage No. 6 presents the improvement benefit descriptionsand summarizes the results of the delay analyses. All thesupporting data for Data Package No. 6 are presented inData Package No. 7.
The St. Louis Task Force should review both data packagesduring the meeting scheduled for August 28, 1980.
Sincerely,
Stephe;ff ickadayManager
SLMH/dbEnclosure r--c -.-
cc: Mr. J. R. Dupree (ALG-312) (w/o enclosure) NT[S U-.kjMr. M. J. Fischer (ACE-610) :J T T
Ax Hlibiitty Codes
AvZ> ! 'l C,/or
De al
i.- ".... ..

LAMBERTST. LOUIS INTERNATIONAL AIRPORT
DATA PACKAGE NO. 7
Airport Improvement Task Force
Delay Studies
Prepared by
I Peat, Marwick, Mitchell & Co.
I San Francisco, California
1 August 1980
ELY

ii
CONTENTS,'
Attachment A EXPERIMENTAL DESIGN,,'
Attachment B SUMMARY OF RESULTS OF ANNUAL DELAY MODELEXPERIMENTS"
Attachment C SUMMARY OF RESULTS OF AIRFIELD SIMULATIONMODEL EXPERIMENTS, r.
Attachment D ASSUMPTIONS,
1
SI

Attachment A
EXPERIMENTAL DESIGN
I9

Table A-1 A-iREVZSED DESCRIf"TION OF EXPERLMENTS
Lambert-St. Louis International AirportAirport Improvement Task Force Delay Stl:dies
Experiment Arrival Departurenumber Model ranways Weather Demand ATC tmrovements
1 ASMa 12R,12L 12R,12L 'FR 1979 Demand and Mix Presentb Baseline2 ASH 12R, 12L 12R, 12L 17R3 1979 Demand and Mix Present Baseline3 ASM 12R,12L 12R,.121 1F2 1979 Demand and Mix Present Baseline4 ASM 30R,30L 30R,301 '11R 1979 Demand and Mix Present gaseline5 ASM 30R,30L 30R,30L I7R9 1979 Demand and Mix Present Baseline
.A&S 30R,30L 30R,30L :F?2 1979 Demand and Mix Present Baseline7 ASM 30R,30L,24 30R.30L I3n3! 1979 Demand and Mix Present Baseline7a ASH 30R.30L.24 30R,30L VR 1979 Demand and Mix Present Baseline3 ASM 12R,12L 6,12R,121 '1FR 1979 Demand and Mix Present Baseline
ASx 12R,121L 6,12R,12L :FRI 1979 Demand and Mix Present Baseline
10 ASM 12R,ILZL 6,12R,12L ZFR2 .979 Oemand and Mix Present Baseline11 ASM 24 24 IFR2 1979 Demand and Mix Present Baseline12 ASH 12R,21,17 12R.12L VTR 1979 Demand and Mix Present Baseline13 ASM 12R,12L.17 129,12L 1I1 1979 Demand and Mix Present Baseline14 ASM 12R,12L 12,.12L 1FF 1979 Demand and Mix Present A/? Development
15 AS 1222L 12R,2L URI 1979 Demand and Mix Present A/F Development16 ASM 30R,30L 30R,301 '1FR 1979 Demand and Mix Present A/F Development17 ASM 30R,30L 30R,30L 1793 1979 Demand and Mix Present A/F Development19 ASM 30R,301,24 30R,30L 17R1 1979 Demand and .Ix Present A/F DevelopmentLsa ASM 30R. 30L, 24 30R,30L 'IF 1979 Demand and Mix Present A/F Development
19 ASM I2R,12L 6,12R.12 VrR 1979 Demand and Mix Present A/F Development20 ASM 12R,12L i,12R,12L 1RI 1979 Demand and Mix Present A/? Development21 ASM 12R,12L,17 12n,12L VFR 1979 Demand and Mix Present A/F Development22 ASM 12R,121,17 12R,12L 1RI 1979 Demand and Mix Present A/F Development23 ASM 30R, 30 30R.30L 1FR1 1979 Demand and Mix -resent LDA Approach
24 ASIA 30R,30L,1' 30R,30L 17R1 1979 Demand and Mix Present IDA Approach24a ASM 30R,301.24 30R, OL '179 1979 Demand and Mix Present LDA Approach25 ASM 12 2R,2. 6,12R,12L 1FRI 1979 Demand and Mix Present LDA Approach26 ASM 12R,12-L 12R,12L V7R 1985 Demand and Mix Present Baseline27 ASM 12R,12L 12R,12L 1FRI 1985 Demand and Mix Present 3aseline
28 ASM 12R,121 L2R,12L :7R2 1985 Demand and Mix Present Baseline29 ASM 30R,30t 30R,30L '7R 1985 Demand and Mix Present Baseline30 ASH 3CR,30L 3CRjCL :FRI 1985 Demand and Mix Present Baseline31 ASM 30R,0L 30R,30L ZFR2 1985 Demand and Mix Present Baseline32 ASM 3CR,30,24 30R,30L IFRI 1985 Demand and Mix Present Baseline
33 ASM 1R,12L 6,12R,121. 1RI 1985 Demand and Mix Present Baseline34 ASH 12R,12L,17 LR,12L 19RI 1985 Demand and Mix Present Baseline35 ASM .R,12L 19,12LL '17R 1)85 Demand and Mix Present A/F Development16 ASM 1.R,11 1 .R, .2. r. 1985 Demand and Mix ?resent A/r Develooment37 ASM 30R,30L 10R,30L "R 1985 Demand and Mix ?resent A/F Development
,a ASM 30R,30L 3R,30L IFRI 1985 Demand and Mix Present A/F Development2? ASM 30R,30L.2 32R,20L :?R1 1985 Demand and Mix Present A/F Development40 ASM .2,ZL 1R, 2L.6 :F.I 1985 Demand and Mix Present k./F Development4 S H 323R,0L 30R,30L :RI 1985 Demand and Mix ?resent IDA Approach42 ISM 0R,30L,24 2R.20L :Fn1 -985 zemand and Mix Present IDA Aoproach
44 ASM L2,9,1. : FRI 1985 Demand and Mix Present IDA Approach129. 12PZL :R,.-L 7"R :?85 Demand and Mix Present 7ermiral Z xansion
45 %&M GR.30L 20R,0L :vR1 1985 :ncrease ieavv lix ?resent A/F Development,6 ASM 3CR,30L,Z4 30R,0L IRI 1985 :ncrease Heavy Mix Present AiF Development47 ASM 30R,20L 3R,CL F9J 1.35 Increase Heavy Mix Present IDA Approach
46 ASH 32R,321. 30R.21. :791 1985 Decrease 3A Mix Present A,7 Development
4? ASM 22R.30L,24 309.301 :7RI 985 Decrease !A Mix 7resent A/F DevelopmentASH 32O9 .2CL 39R2CL 2=91 2985 Decrease DA Mix Present IDA Aproach
1 ASM .:R,-ZL 2RI:21. ",Tq 1990 Demand and O'ix 'resent %,F DevelormentRASH 22?. 2ZL' :792 1990 :emand and 'MI x resent AF Develooment
-4 ASH 2?, 321 29,301. "T: :990 Demand and Mix Present A/F Development- '99 029,221 229,201 D'91 1292 Demand and Mix 'resent A, ? Development
6 ASMH OR 229321 309,01. 792'. 1990 ze. nd and ' ix 7resent ',/F De.?eloment" A2,N 24.229.321 309,30 2791 13'0 Demand and lix 'resent A, 7: eveloomentAi 3 I3:. 22R,2rL 2CR,ICL,6 "1 "990 Demand and 'ix ?resent ;/F Develomet
-121 2/..L..-...., 3'91 .R90 remand and ' ix ?resent A/F :evelopment2?a :S:: :29,221.2' 12R. '.? . .'2 Demand and 'lix 'resent A.,F 3evelooment
15H 9.CM . 209.22 27'1 19c :emand .nd Ax Present IDA pproacn
I% %M :4,3C?,-L 10R,30L :FRI i?0?mn n x :resent :.-A ;cpr-,ac
i Z ASIM :ZR.!:'- :2L, Z/L, 6 : 91 '.991) :emand and i!x ?rtsent ':A Pcrcact

A-2
Table A-1 (Continued)
REVISED DESCRIPTIO'n 0r £ERZHErSLamert-St. Louis rternational AirportAirport Improvement Task Force Delay Studies
Experiment Arrival Departurenumber Model xuvavs Wumvs eather Demand ATC Improvements
63 ASH 12R,l2L 12R,12L VFR 1990 Demand and Mix Present Terminal .xpansion64 AM 12R,12L 12R,12r VFR 1990 Demand and Mix Present Relocate Midcoast Aviation64a ASH 128,12L,. 17 12R.121 VFR 1990 Demand and Mix Present Relocate Midcoast Aviation65 ASH 30R,30L 30R,301. 1'R1 1990 Increase Heavy Mix Present A,'T Development66 ASH 24,20R,30L 30R,30L R.1 1990 Increase Heavy -ix Present A/F Development
67 ASM 30R,JOL 30R,30L I173 1990 Increase Heavy Mix Present LDA Approach68 ASM 30R,30L 30R,30L I7I' 1990 Decrease GA Mix Present A/F Development69 ASM 24,30R.30L 30R,30L IFRI 1990 Decrease GA Mix Present A/F Development69a ASH 24 24 I7R2 1990 Decrease GA Hix Present baseline70 ASH 30R,30L 30R,30L rR.1 1990 Decrease GA Mix Present LOA Approach
71 ASH 12R,12L 12R,12L 'V7R 1990 Demand and Mix Future0
A/? Development72 ASM 128,121 12R,L2L 1FR1 1990 Demand and Mix Future A/F Development73 ASM 12R,12L 12R,12L IR2 1990 Demand and Mix Future A/F Development74 ASH 30R,30L 30R,30L V7R 1990 Demand and Mix ruture A/F Development75 ASM 30R,30L 30R,30L 17R1 1990 Demand and Mix Future A/F Development
76 ASH 30R.30L 30R,30L 1FR2 1990 Demand and Mix Future A/F Development77 ASH 30R,30L,24 30R,30L IRi 1990 Demand and Mix Future A/F Development78 ASM 12R,12L 12R,12L.6 I731 1990 Demand and Mix Future A/F Development79 AH 12R.12L,17 12R,121, 13R 1990 Demand and Mix Future A/r Development
a. Airfield Simulation model.b. 1979 ATC Separations for VFR and tFR are taken from FAA Document 78-8A.a. 1990 ATC Separations !or ,7FR and L-R are taken from FAA Document 78-GA.
II
"I

A-3
Table A-la
DESCRIPTION OF EXPERIMENTSLambert-St. Louis International Airport
Airport Improvement Task Force Delay Studies
Experimentnumber Model Demand Improvements ATC
81 ADMa 1979 Demand and Mix Baseline Presentb
81a ADM 1979 Demand and Mix Airfield Development Present82 ADM 1985 Demand and Mix Baseline Present83 ADM 1985 Demand and Mix Airfield Development Present84 ADM 1985 Demand and Mix LDA Approach Procedures Present
85 ADM 1985 Increase Heavy Mix A/F Development Present86 ADM 1985 Decreased GA Mix A/F Development Present87 ADM 1990 Demand and Mix Baseline Present88 ADM 1990 Demand and Mix Airfield Development Present89 ADM 1990 Demand and Mix LDA Approach Procedures Present
90 ADM 1990 Increase Heavy Mix Airfield Development Present91 ADM 1990 Decreased GA Mix Airfield Development Present92 ADM 1990 Demand and Mix Airfield Development Futurec
93 ADM 1990 Increase Heavy Mix Airfield Development Future94 ADM 1990 Decrease GA Mix Airfield Development Future
a. Annual Delay Model.b. 1979 ATC Separations for VFR and IFR are taken from FAA Document 78-8A.c. 1990 ATC Separations for VFR and IFR are taken from FAA Document 78-8A.
-- 7 !T-T7
| ,

1979 DEMAND 1985 DEMAND
1979 MIX 1985 MIX INCREASE HEAV4
Q 2zi Z z zu Le UJ Iw,
00
lA".D rr 4 0. W O 0z z> z z z•~u ,.. w It( ,,. O
C L A 4c luIL2 I
-c -|0 w 'J 0 -Ii l E
i a cm I
VFR I I 1 2 351 41 1 3A263512 1 IFRi1 2 27 36 41j IIj..........j
I"""1 I 1 130 381 -
1.,..,, =I I .i'-1 I l'30 FR 7A - 132A19A 1-1
4- 7 32 39 42
'7''IFI2.3 II . -
VFR j8 I I I T-i
I"1I.--------- I I III1 11-]
I -Ri i9 133 - 1 il ii
- - . - .
_____ ____ ____ __ jIFR2+3 1 - -£-
[ ::.:-'-'ll.,- ' ,. - .... . ...... - -- --.------
24 VFR--
IFRIj
IFR24+3 11 __1
__ _ _ __ _ _ IFRI 13 3IFR2+3
ANNUAL DELAY 4ALLI 4AL) 81 1 82 1 2841 1. 1 t I5
1 . BAMLINE INCLUDES PHYSICAL IMPROVEMENTS IN PLACE IN 1979 AND ADDITIONAL
2. SENSITIVITY ANALYSIS WITH DIFFERENT NOISE ABATEMENT SCENARIOS.
2. SEMBITIVITY ANALYSIS WITH DIFFERENT LEVELS OF G ENE RAL AVIATION REDUCTI

LAMBERT-ST. LOUIS INTERNATIONAL AIRPORT EXPERIMENTAL DESIGNAirport Improvement Task Force Delay Studies
Peat, Marwick, Mitchell & Co. August 1910
PRESENT ATC
ND 1990 DEMAND
WEAVY DECREASE GA 1990 MIX INCREASE HEAVY DECREASE GA 1990 mIX
z z z z z0 0 0 0 0z z z Z z z z z z z
<7 6 ... CU
4L 2 , U U-OXa x
x CL
O~~i 0 ~ NJ 0 Jo Jo.1 0 0.. 0j0 ~ ~ .. a 0 . j 0 . .
9L IL z IL Ij u
L1 cc 13 1 1 i i 1 I U1L -- - -z 0 U.
-m I-- -1
Jz~zztzz~zz1 4761 1~ - z1
- ~ 5 612]I
ST- --
1 1 H8 11111 72 II I 1 101j 11 19, 1' 1 1 192 1
It--Ag--izzz

AL DESIGN
FUTURE ATC
DEMAND 1990 DEMANDD'E HEAVY DECREASE GA 1990 MIX INCREASE HEAVY DECREASE GA
o0 0 0,, U . ..,,U)
CL I a. u.X2 U9L 4 w . a. a.
.. J <.. 0 L0 0 0 0 L w0 j 0 0w - w -j 0 -jm w t 4 w m 4 w
L
CL z > z I ZL 2 0
cc U) 4) t rUO L 4 LL 0c U. 4j LL. 0
1 1 1
L\
- -" • t , lii. --. " - ,"It- - -..
. . . ....
-
1 1 1
-r -
T f .27 AA1-

Attachmnent B
SUMMARY OF RESULTS OF ANNUAL DELAY MODEL EXPERIMENTS

B-I
Table B-1
SUMMARY OF ANMUAL DELAY MODEL EXPERIMENTSLambert-St. Louis International Airport
Annual AverageExperiment ATC delay aircraft delay
No. Demanda scenario Description (hours) (minutos)
81 1979b
1979 Baseline 4,722c 0.8
c
31n 1979 1979 Noise abatement 5,708 1.0SIA 1979 1979 Airfield development 4,746 0.382 1985 1979 Baseline 9,399 1.683 1985 1979 Airfield development ',522 1.3
1985 1979 Airfield developmentand new runway use 6,150 1.1
83n 1985 1979 Noise abatement 10,010 1.8
34 1985 1979 LDA approach 6,792 1.285 1985 1979 Increased heavy jets 8,464 1.536 1985 1979 25% reduction in
general aviation 5,604 1.01985 1979 50% reduction in
general aviation 4,100 0.81985 1979 75% reduction in
general aviation 3,208 0.7
37 1990 1979 Baseline 40,273 6.588 1990 1979 Airfield development 27,542 4.4
1990 1979 Airfield developmentand new runway use 12,234 2.0
98n 1990 1979 Noise abatement 35,5a6 5.799 1990 1979 LDA approach 25,267 4.190 1990 1979 Increased heavy jets 26,661 4.791 1990 1979 25% reduction in
general aviation 1.,309 2.91990 1979 50% reduction in
general aviation 13,007 2.31990 1979 75% reduction in
general aviation 11,247 2.2
92 1990 Future Airfield development 18,337 2.993 1990 Future Increased heavy jets 12,274 2.2?4 1990 Future 50% reduction in
general aviation 8,561 1.5
a. Annual demand: 1979 = 344,6001985 - 344,300 (unconstrained)
- 336,000 (increased heavy 3ets)- 322,750 (25% reduction in general aviation)- 301,500 (50% reduction .n general aviation)
- 280,250 (75% reduction in general aviation)1990 - 374,300 (unconstrained)
- 339,000 (increased heavy :ets)= 354,300 (Z5% reduction -n general aviation)- 334,300 (50% reduction in 3eneral aviation)= 314,300 :'5% educt-on n enerai aviation)
. nnual demand for 1979 assumes no Zzark Air 1:.nes 3trike. The actzual demandwas 336,379 "€It; :he Dzark ;ix Z"nes strike.Actual dela.ys ;n 179 may ze Iower :han :his ,al.e tecause :f the zarkAir L.nes str:ke.
i1I
-7--. i-:-

B-2
Table B-2
COMPARISON OF ANNUAL DELAY RESULTS FOR VARIOUSIMPROVEMENT OPTIONS
Average annual aircraft delays(minutes per aircraft)
Improvement options 1979 Post-1985 Post-1990
1979 airfield 0.8 1.6 6.5
Airfield development -- 1.3 4.4
LDA approacha 1.2 4.1a
New runway use 1.1 2.0
General aviation reductiona
25% -- 1.0 2.950% -- 0.8 2.375% -- 0.7 2.2
aIncrease heavy jets 1.5 4.7
aFuture ATC system -- 2.9
Future ATC system and increaseheavy jetsa 2.2
Future ATC system and 50% generalaviation reductiona 1.5
a. Includes airfield development.
Source: Peat, Marwick, Mitchell & Co.
'T I
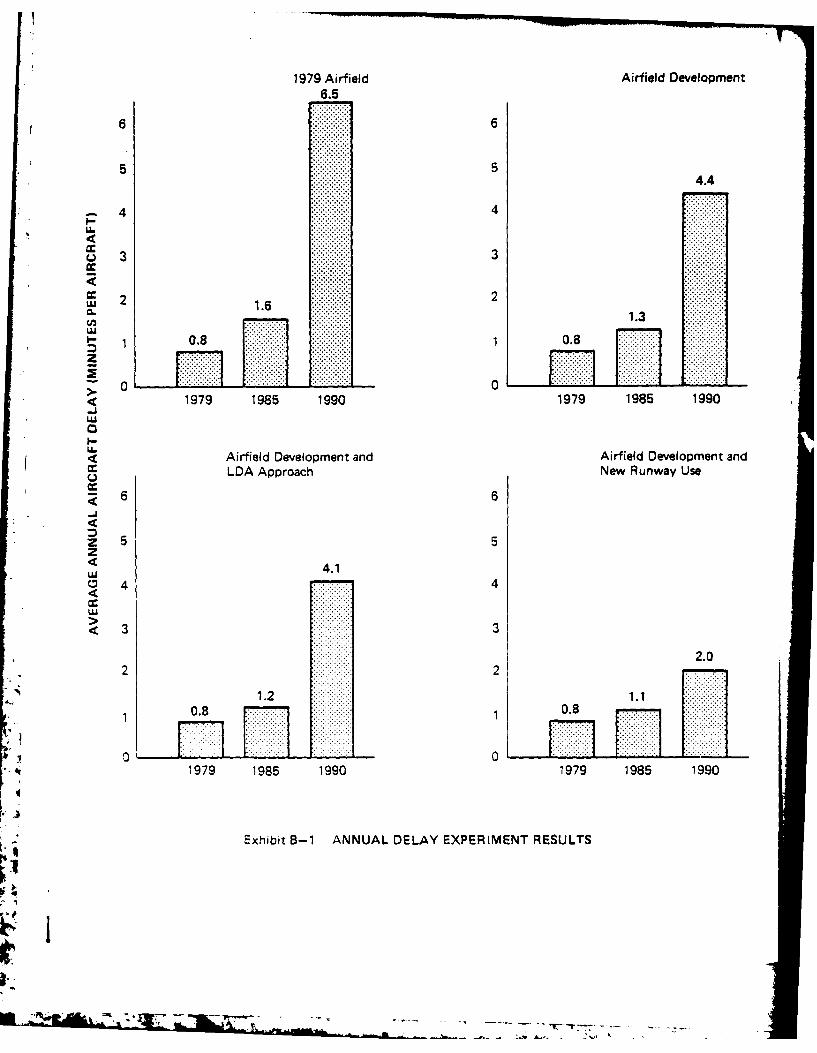
1979 Airfield Airfield Development6.5
6 6
554.4
4 ..... 4
Uj 2 1
1. 0.8z
41979 1985 1990 1979 1985 1990*LU
<Airfield Development adAirfield Development andLDA Approach New Runway Use
6 6
z 5 5z< 4.1LU
0 4 4
3 3
2.2 2
C..
0.8 .... .
_-k 1- ...... H.41979 1985 1990 1979 1985 1990
Exhibit 8-1 ANNUAL DELAY EXPERIMENT RESULTS

Attachment C
SUMMARY OF RESULTS OF AIRFIELD SIMULATION MODEL EXPERIMENTS
:1
I 1., .,
- II*1 II
- A S

Ii 1 1! 17~Q 9 Q1 ' 1
N ' - w N N - 1
00 0 N ID 0 e10 i'0 w 0 10a'-Dv 0 ,r
N ee0o aNQ e0 NN 00 a4N
o go IW NI
Dam a ml(1 m moc.goc wx 4
U 0 0 !- 00 0 U0 0 10 u,1
LI m w 01
0i
N .. N0 0 NO0 NO~ NN N~N O 0 N e4
41 N Nr N N rv 0N~N. NtN0r C)~ 0 0JCN0
-4 O ON N0 0 NON N~ N 0N t N N N
a ~ ' ~ N coo~ =00=N NNeN,r4 NtNoo N'tN
c 0
N0 CD 10 w a12,N
d. ~ ~ ~ ~ ~ ~ ~ ~ ~ ~ ~ ~ ~ a he.,(( OO O 0 0 ( ~tl Itl 'CN O C tI

'D N A- N 1 7 1
- 1 7 1 1 7 1:jI7 1 1 i
-I 1 C 7N0 L
- *1i 19 7 7
3 0 0N O N04~ U)~ ~ ~ CoN 0~ 'D
C l 1 ' r % n oNIa0U
f. OO Oc m O.. In.fl NNcOD --mo C
NN 19 1 1 . 1
0 1 Icv~ IT~~ V-r.~ V--~ V Vu r In v-
* 22W0
W .O a~e ~ ~ ~C~O-* O~' Ic
N -N
j I61j lo fIDf lo~I I IQ I

C-1
Lambert-St. Louis International Airport Experiments
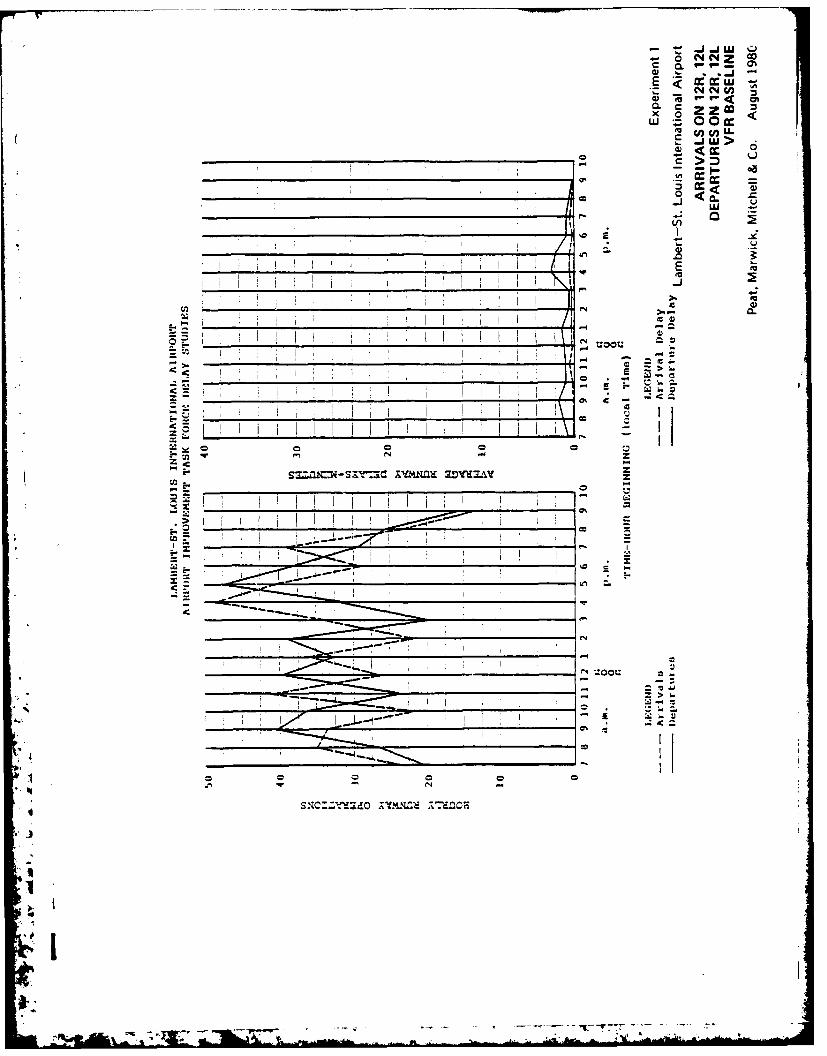
Experiment No. 1
Scenario:
This experiment is a baseline case using the existing airfieldlayout. Demand is at 1979 levels, and 1979 ATC Proceduresare in effect in VFR conditions for the following runwayconfiguration:
Arrival runways Departure runways
12R, 12L 12R, 12L
Length and Level of Detail of Simulation Run:
From 0700 to 2200 with 1-hour summaries.
Results:
The tabulation below shows selected results for the averagevalues and the peak-delay hour, 1600-1700 hours, over the15-hour simulation period.
Operation Performancetype measure Units Average Peak
Arrival Flow rate a/c per hr 30.9 49.0Arrival Air delay minute 0.3 0.5
Departure Flow rate a/c per hr 31.0 33.3Departure Runway delay minute 1.2 2.4
Ik
N N zJi CO
Z O 2!Z
E j -u
>N~rc~"'4 a
I-C*
0 0t:

c-3
Lambert-St. Louis International Airoort Experiments
Experiment No. 1 - Noise 1
Scenario:
This experiment is used to evaluate the effect of noise abate-ment procedures on aircraft delays. Demand is at 1979 levels,and 1979 ATC Procedures are in effect in VFR conditions forthe following runway configuration:
Arrival runways Departure runways
12R, 12L 12R, 12L
Length and Level of Detail of Simulation Run:
From 0700 to 2200 with 1-hour summaries.
Results:
The tabulation below shows selected results for the averagevalues and the peak-delay hour, 1700-1800 hours, over the15-hour simulation period.
Operation Performancetyemeasure Units Avrg Peak
Arrival Flow rate a/c per hr 30.9 49.0Arrival Air delay minute 0.3 0.4
Departure Flow rate a/c per hr 31.0 32.8Departure Runway delay minute 1.2 2.5
6.M.

N C4C) I~- o,-
C0 <Z.Z 00<0r
E F
LC a
_ _ _ _ _ _ _ _ _ _ _ _ _ _ _ _V Ag-

C-5
Lambert-St. Louis International Airport Experiments
Experiment No. 1 - Noise 2
Scenario:
This experiment is used to evaluate the effect of noise abate-ment procedures on aircraft delays. Demand is at 1979 levels,and 1979 ATC Procedures are in effect in VFR conditions forthe following runway configuration:
Arrival runways Departure runways
12R, 12L 12R, 12L
Length and Level of Detail of Simulation Run:
From 0700 to 2200 with 1-hour summaries.
Results:
The tabulation below shows selected results for the averagevalues and the peak-delay hour, 1700-1800 hours, over the15-hour simulation period.
Operation Performancetype measure Units Average Peak
Arrival Flow rate a/c per hr 30.9 40.0Arrival Air delay minute 0.3 0.5
Departure Flow rate a/c per hr 31.0 47.0Departure Runway delay minute 1.8 3.1
I
I.
MEE-*V- 77

N ..Y0 CO
CL '- o<)
C4
00 <
LU
ZOO=
I~~~ >__ _ _

C-7
Lambert-St. Louis International Airport Experiments
Experiment No. 1 - Noise 3
Scenario:
This experiment is used to evaluate the effect of noise abate-ment procedures on aircraft delays. Demand is at 1979 levels,and 1979 ATC Procedures are in effect in VFR conditions forthe following runway configuration:
Arrival runways Departure runways
12R, 12L 12R, 12L
Length and Level of Detail of Simulation Run:
From 0700 to 2200 with 1-hour summaries.
Results:
The tabulation below shows selected results for the averagevalues and the peak-delay hour, 1800-1900 hours, over the15-hour simulation period.
Operation Performancetype measure Units Average Peak
Arrival Flow rate a/c per hr 30.9 41.1Arrival Air delay minute 0.3 0.2
Departure Flow rate a/c per hr 31.0 29.0Departure Runway delay minute 6.4 17.1
. ' I
I

o 0 F4N c
CC
W 0 Z2
Z
IR 2
'.cc
- ~0C2N -U
0 0 - C

C-9
Lambert-St. Louis International Airport Experiments
Experiment No. 2
Scenario:
This experiment is a baseline case using the existing airfieldlayout. Demand is at 1979 levels, and 1979 ATC Proceduresare in effect in IFRl conditions for the following runwayconfiguration:
Arrival runways Departure runways
12R, 12L 12R, 12L
Length and Level of Detail of Simulation Run:
From 0700 to 2200 with 1-hour summaries.
Results:
The tabulation below shows selected results for the averagevalues and the peak-delay hour, 1800-1900 hours, over the15-hour simulation period.
Operation Performancetype measure Units Average Peak
Arrival Flow rate a/c per hr 27.3 29.7Arrival Air delay minute 16.7 41.9
Departure Flow rate a/c per hr 27.7 32.9Departure Runway delay minute 2.2 2.3
I.
i
1

NY J .- JW 0- -0 Y N Z co
w w
E .. iw
N 4_ _ _ _ _ _ _ _ _ _ _CL
Eu .z o
10 (AU) 0
00
-. .4
Z <
Z .c

C-l
Lambert-St. Louis International Airport Experiments
Experiment No. 3
Scenario:
This experiment is a baseline case using the existing airfieldlayout. Demand is at 1979 levels, and 1979 ATC Proceduresare in effect in IFR2 and IFR3 conditions for the followingrunway configuration:
Arrival runways Departure runways
12R, 12L 12R, 12L
Length and Level of Detail of Simulation Run:
From 0700 to 2200 with 1-hour summaries.
Results:
The tabulation below shows selected results for the averagevalues and the peak-delay hour, 1800-1900 hours, over the15-hour simulation period.
Operation Performancetype measure Units Average Peak
Arrival Flow rate a/c per hr 24.0 26.0Arrival Air delay minute 8.4 26.6
Departure Flow rate a/c per hr 25.3 30.6Departure Runway delay minute 6.8 12.9
Ik

v 20 NN z -4
E
C z z Cox 00
. *--,- 0 C
Ii -
<i = CC__
_______________________________ _______ >
.. N -
.9 b S t W fsL~kr,~f t~i~!*W
~ A-.!h 1..,XS.
E-2
> 6.
7 T

C-13
Lambert-St. Louis International Airport Experiments
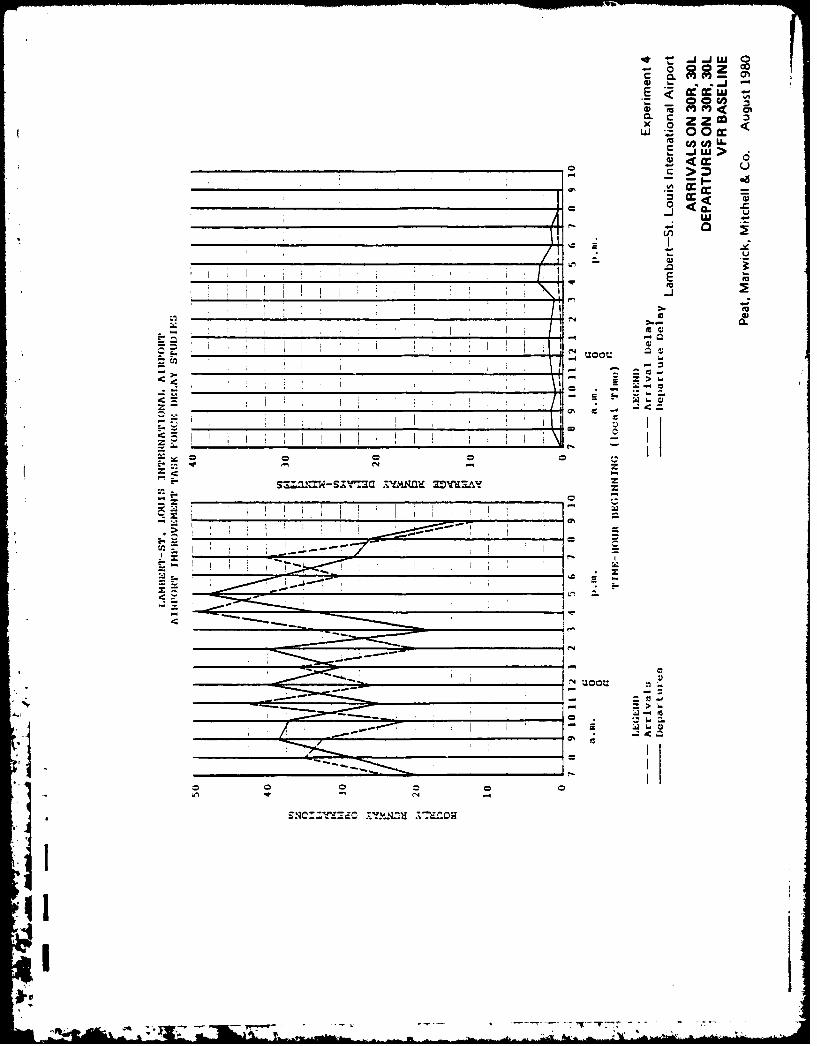
Experiment No. 4
Scenario:
This experiment is a baseline case using the existing airfieldlayout. Demand is at 1979 levels, and 1979 ATC Proceduresare in effect in VFR conditions for the following runwayconfiguration:
Arrival runways Departure runways
30R, 30L 30R, 30L
Length and Level of Detail of Simulation Run:
From 0700 to 2200 with 1-hour summaries.
Results:
The tabulation below shows selected results for the averagevalues and the peak-delay hour, 1700-1800 hours, over the15-hour simulation period.
Operation Performancetype measure Units Average Peak
Arrival Flow rate a/c per hr 30.9 49.0Arrival Air delay minute 0.3 0.6
Departure Flow rate a/c per hr 31.0 32.2Departure Runway delay minute 1.2 2.5
pi.
tI
60
0 ca4) li c
-- C u >
<- - =
-J>m
NC
E--
ez
'C4
AN
Ch f
it0
AL

C-15
Lambert-St. Louis International Airport Experiments
Experiment No. 4 - Noise 1
Scenario:
This experiment is used to evaluate the effect of noise abate-ment procedures on aircraft delays. Demand is at 1979 levels,and 1979 ATC Procedures are in effect in VFR conditions forthe following runway configuration:
Arrival runways Departure runways
30R, 30L 30R, 30L
Length and Level of Detail of Simulation Run:
From 0700 to 2200 with 1-hour summaries.
Results:
The tabulation below shows selected results for the averagevalues and the peak-delay hour, 1700-1800 hours, over the15-hour simulation period.
Operation Performancetype measure Units Average Peak
Arrival Flow rate a/c per hr 30.9 40.0Arrival Air delay minute 0.3 0.5
Departure Flow rate a/c per hr 31.0 49.0Departure . _way delay minute 1.3 2.3
i7*1
II

00 0
0 i
0LA
I -.4

C-17
Lambert-St. Louis International Airport Experiments
Experiment No. 4 - Noise 2
Scenario:
This experiment is used to evaluate the effect of noise abate-ment procedures on aircraft delays. Demand is at 1979 levels,and 1979 ATC Procedures are in effect in VFR conditions forthe following runway configuration:
Arrival runways Departure runways
30R, 30L 30R, 30L
Length and Level of Detail of Simulation Run:
From 0700 to 2200 with 1-hour summaries.
Results:
The tabulation below shows selected results for the averagevalues and the peak-delay hour, 1700-1800 hours, over the15-hour simulation period.
Operation Performancetype measure Units Average Peak
Arrival Flow rate a/c per hr 30.9 40.0Arrival Air delay minute 0.3 0.5
Departure Flow rate a/c per hr 31.0 47.3Departure Runway delay minute 1.7 3.2
I
.t
'I

o o 00 co
00z -i uj
0
0
E-E
J-

C-19
Lambert-St. Louis International Airport Experiments
Experiment No. 4 - Noise 3
Scenario:
This experiment is used to evaluate the effect of noise abate-ment procedures on aircraft delays. Demand is at 1979 levels,and 1979 ATC Procedures are in effect in VFR conditions forthe following runway configuration:
Arrival runways Departure runways
30R, 30L 30R, 30L
Length and Level of Detail of Simulation Run:
From 0700 to 2200 with 1-hour summaries.
Results:
The tabulation below shows selected results for the averagevalues and the peak-delay hour, 1700-1800 hours, over the15-hour simulation period.
Operation Performancetype measure Units Average Peak
Arrival Flow rate a/c per hr 30.9 40.0Arrival Air delay minute 0.3 0.5
Departure Flow rate a/c per hr 31.0 38.7Departure Runway delay minute 6.0 9.0

o0 00d
0) .0
4' 00 ~o
< CL
C4'
.... ...
- dc
C-21
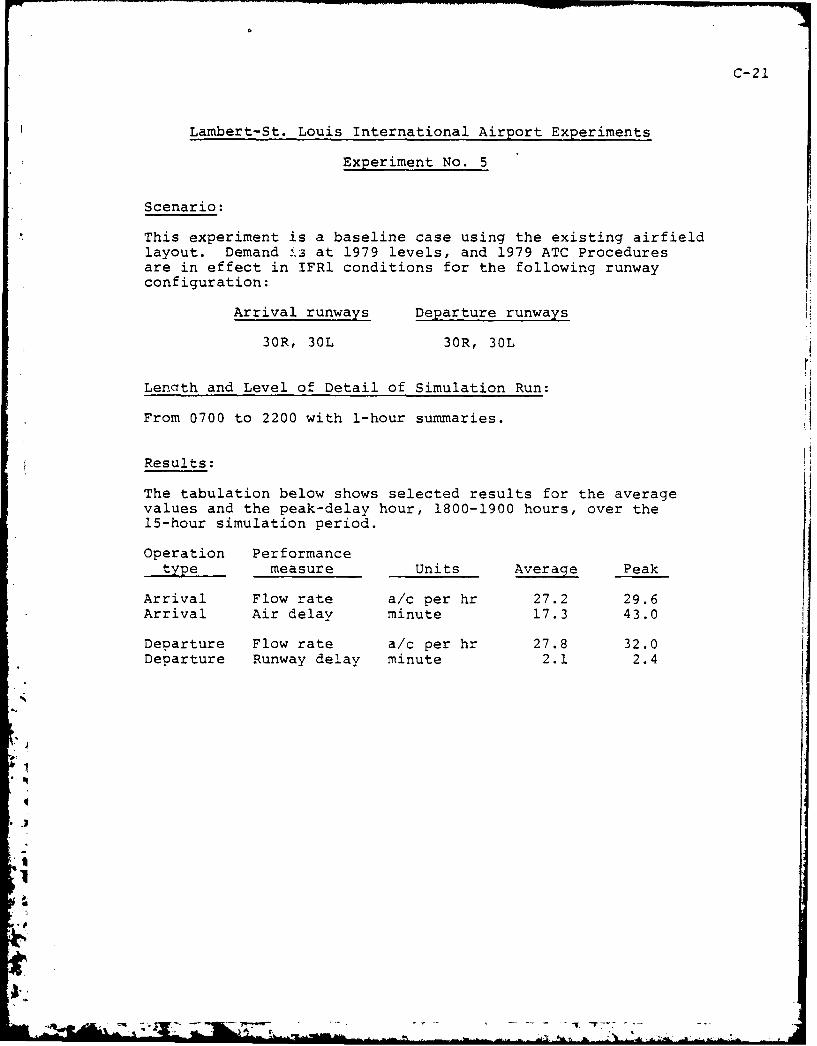
Lambert-St. Louis International Airport Experiments
Experiment No. 5
Scenario:
This experiment is a baseline case using the existing airfield
layout. Demand J.3 at 1979 levels, and 1979 ATC Proceduresare in effect in IFRI conditions for the following runwayconfiguration:
Arrival runways Departure runways
30R, 30L 30R, 30L
Lenath and Level of Detail of Simulation Run:
From 0700 to 2200 with 1-hour summaries.
Results:
The tabulation below shows selected results for the averagevalues and the peak-delay hour, 1800-1900 hours, over the15-hour simulation period.
Operation Performancetype measure Units Average Peak
Arrival Flow rate a/c per hr 27.2 29.6Arrival Air delay minute 17.3 43.0
Departure Flow rate a/c per hr 27.8 32.0Departure Runway delay minute 2.1 2.4
I-I

in n mJJ
0 z -
Scn U)
< =
- 06
Ln
t~oct: 0
or-~
ta - -
-4N
C-23
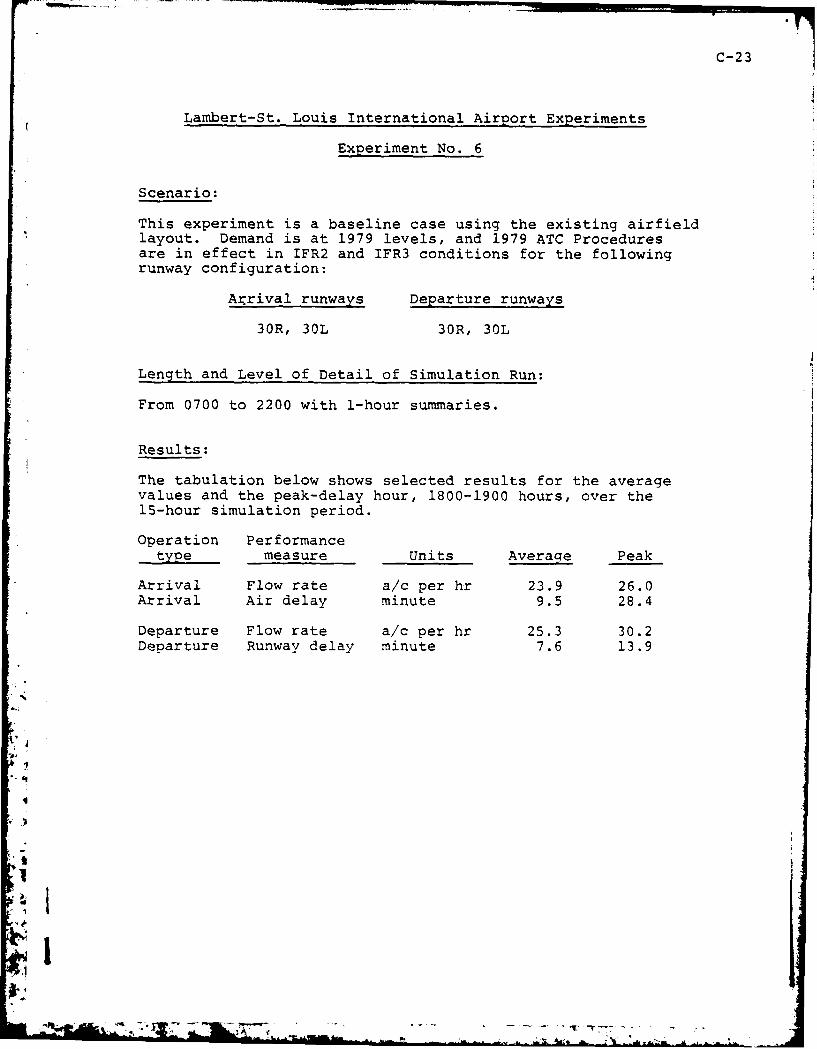
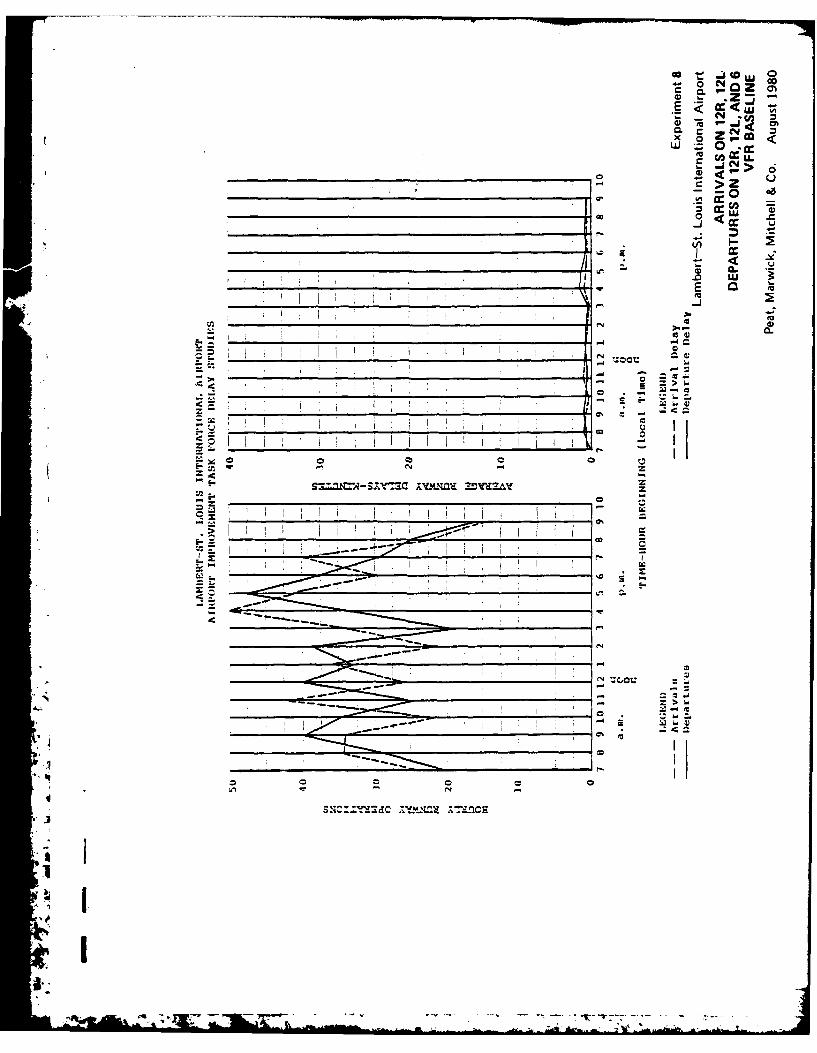
Lambert-St. Louis International Airport Experiments
Experiment No. 6
Scenario:
This experiment is a baseline case using the existing airfieldlayout. Demand is at 1979 levels, and 1979 ATC Proceduresare in effect in IFR2 and IFR3 conditions for the followingrunway configuration:
Agrival runways Departure runways
30R, 30L 30R, 30L
Length and Level of Detail of Simulation Run:
From 0700 to 2200 with 1-hour summaries.
Results:
The tabulation below shows selected results for the averagevalues and the peak-delay hour, 1800-1900 hours, over the15-hour simulation period.
Operation Performance_type measure Units Average Peak
Arrival Flow rate a/c per hr 23.9 26.0Arrival Air delay minute 9.5 28.4
Departure Flow rate a/c per hr 25.3 30.2Departure Runway delay minute 7.6 13.9
i.i

t1 - - Lj -CL M
w ZOOM<
= _
>
ir-j u
Z- e
- - -z
it4

C-25
Lambert-St. Louis International Airport Experiments
Experiment No. 7A
Scenario:
This experiment is a baseline case using the existing airfieldlayout. Demand is at 1979 levels, and 1979 ATC Proceduresare in effect in VFR conditions for the following runwayconfiguration:
Arrival runways Departu re runways
30R, 30L, 24 30R, 30L
Length and Level of Detail of Simulation Run:
From 0700 to 2200 with 1-hour summaries.
Results:
The tabulation below shows selected results for the averagevalues and the peak-delay hour, 1700-1800 hours, over the15-hour simulation period.
Operation Performancetyemeasure Units Average Peak
Arrival Flow rate a/c per hr 30.9 39.9Arrival Air delay minute 0.3 0.7
Departure Flow rate a/c per hr. 31.0 47.6Departure Runway delay minute 1.2 2.0

S< z -
x 0 c
-J CL
4ww
__ _ _ __ _ _ __ _ _

C-27
Lambert-St. Louis International Airport Experiments
Experiment No. 7
Scenario:
* This experiment is a baseline case using the existing airfieldlayout. Demand is at 1979 levels, and 1979 ATC Proceduresare in effect in IFRl conditions for the following runwayconfiguration:
Arrival runways Departure runways
30R, 30L, 24 30R, 30L
Length and Level of Detail of Simulation Run:
From 0700 to 2200 with 1-hour summaries.
Results:
The tabulation below shows selected results for the averagevalues and the peak-delay hour, 1700-1800 hours, over the15-hour simulation period.
Operation Performancetype measure Units Average Peak-
Arrival Flow rate a/c per hr 27.2 36.8Arrival Air delay minute 1.3 1.6
Departure Flow rate a/c per hr 27.8 39.6Departure Runway delay minute 2.6 5.0
RMN
J4I

- 0 Co2
< ZC4 C.. Cm
L a 1-
00
-~ CC~
_ _ _ _ _ _ _ _ _ _ _ _ _ _ _ _ _ _ _ CL~~@
<~ =
- E-
= .1
I I ->
6n 0
Auk. C

C-29
Lambert-St. Louis International Airport Experiments
Experiment No. 8
Scenario:
This experiment is a baseline case using the existing airfieldlayout. Demand is at 1979 levels, and 1979 ATC Proceduresare in effect in VFR conditions for the following runwayconfiguration:
Arrival runways Departu re runways
l2R, l2L 12R, l2L, 6
Length and Level of Detail of Simulation Run:
From 0700 to 2200 with 1-hour summaries.
Results:
The tabulation below shows selected results for the averagevalues and the peak-delay hour, 1600-1700 hours, over the15-hour simulation period.
Operation Performancetyemeasure Units Average Peak
Arrival Flow rate a/c 7ir hr 31.0 49.0Arrival Air delay minute 0.4 0.6
Departure Flow rate a/c per hr 31.0 33.9Departure Runway delay minute 0.6 1.3
E .- 7<- _
xtJ* 0 -W
- C>z
-0 0 0
CL
r 'C4
ei d3 j '
Da x
M
7;.. . ..

- C-3 2Lambert-St. Louis International Airport Experiments
Experiment No. 9
Scenario:
This experiment is a baseline case using the existing airfieldlayout. Demand is at 1979 levels, and 1979 ATC Proceduresare in effect in IFRi conditions for the following runwayconfiguration:
Arrival runways Departure runways
12R, 12L 12R, 12L, 6
Length and Level of Detail of Simulation Run: *
From 0700 to 2200 with 1-hour summaries.
Results:
The tabulation below shows selected results for the averagevalues and the peak-delay hour, 1800-1900 hours, over the15-hour simulation period.
Operation Performancetype measure Units Average Peak
Arrival Flow rate a/c per hr 27.3 29.4Arrival Air delay minute 16.7 41.8
Departure Flow rate a/c per hr 27.7 31.8Departure Runway delay minute 0.3 0.4
IZ

- z
0
0-
w -
6:0: 6
E 0
CA
-J
sxc~~f~l:dc; Y kmu MMN

C-33
Lambert-St. Louis International Airport Experiments
Experiment No. 10
Scenario:
This experiment is a baseline case using the existing airfieldlayout. Demand is at 1979 levels, and 1979 ATC Proceduresare in effect in IFR2 and IFR3 conditions for the followingrunway configuration:
Arrival runways Departure runways
12R, 12L 12R, 12L, 6
Length and Level of Detail of Simulation Run:
From 0700 to 2200 with 1-hour summaries.
Results:
The tabulation below shows selected results for the averagevalues and the peak-delay hour, 1800-1900 hours, over the15-hour simulation period.
Operation Performancetype measure Units Average Peak
Arrival Flow rate a/c per hr 24.0 29.0Arrival Air delay minute 3.8 8.1
Departure Flow rate a/c per hr 25.3 35.4Departure Runway delay minute 1.6 3.6
*J
I
I

- 40 N 0 LUc o. 00
!;-0 mi <~
-0 o
0 IiICC,
CC
____ ____ ____ ___ ____ ____ CL
I I I
jig
6A"77

C-35
Lambert-St. Louis International Airport Experiments
Experiment No. 11
Scenario:
This experiment is a baseline case usinq the existing airfieldlayout. Demand is at 1979 levels, and 1979 ATC Proceduresare in effect in IFR2 and IFR3 conditions for the followingrunway configuration:
-Arrival runways Departure runways
24 24
Length and Level of Detail of Simulation Run:
From 0700 to 2200 with 1-hour summaries.
Results:
The tabulation below shows selected results for the averagevalues and the peak-delay hour, 2000-2100 hours, over the15-hour simulation period.
Operation Performancetype measure Units Average Peak
Arrival Flow rate a/c per hr 23.9 26.1Arrival Air delay minute 19.3 55.2
Departure Flow rate a/c per hr 24.7 24.4Departure Runway delay minute 16.3 20.8
'.2
1
.... .1 , .:- .! - '

oo CoC
0; -4 o 03
0
CL LL U
00
-Oct
dCou ~
h
I -Zccu

C- 37
Lambert-St. Louis International Airport Experiments
Experiment No. 12
Scenario:
This experiment is a baseline case using the existing airfieldlayout. Demand is at 1979 levels, and 1979 ATC Proceduresare in effect in VFR conditions for the following runwayconfiguration:
Arrival runways Departure runways
12R, 12L 12R, 12LGA Operations on 17
Length and Level of Detail of Simulation Run:
From 0700 to 2200 with 1-hour summaries.
Results:
The tabulation below shows selected results for the averagevalues and the peak-delay hour, 1700-1800 hours, over the15-hour simulation period.
Operation Performancetyemeasure Units Average Peak
Arrival Flow rate a/c per hr 30.9 39.5Arrival Air delay minute 0.3 0.5
Departure Flow rate a/c per hr 31.0 47.2Departure Runway delay minute 1.3 2.4
-4--

N i N _1~jW 0- 0 N N 4Z I,' 0. Z
0
CC
LU 'L
E- ":at
-- zu
I C-4
lIN Oct:
'C>
'C-
C-39
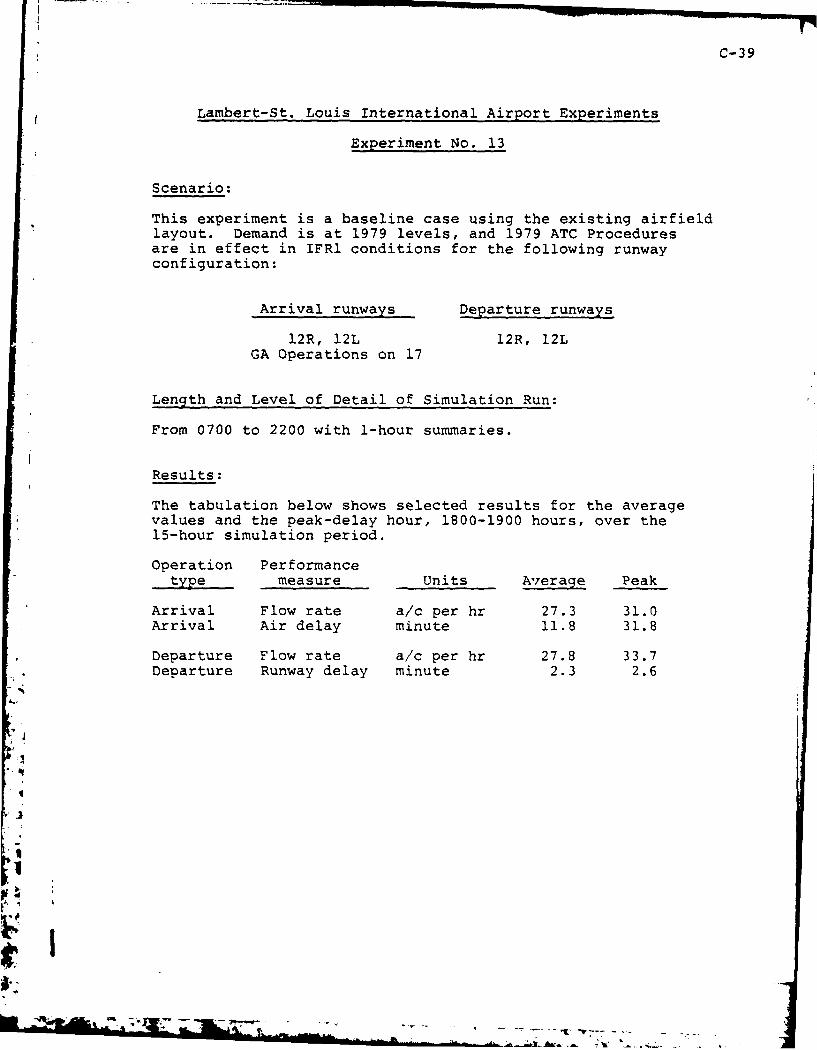
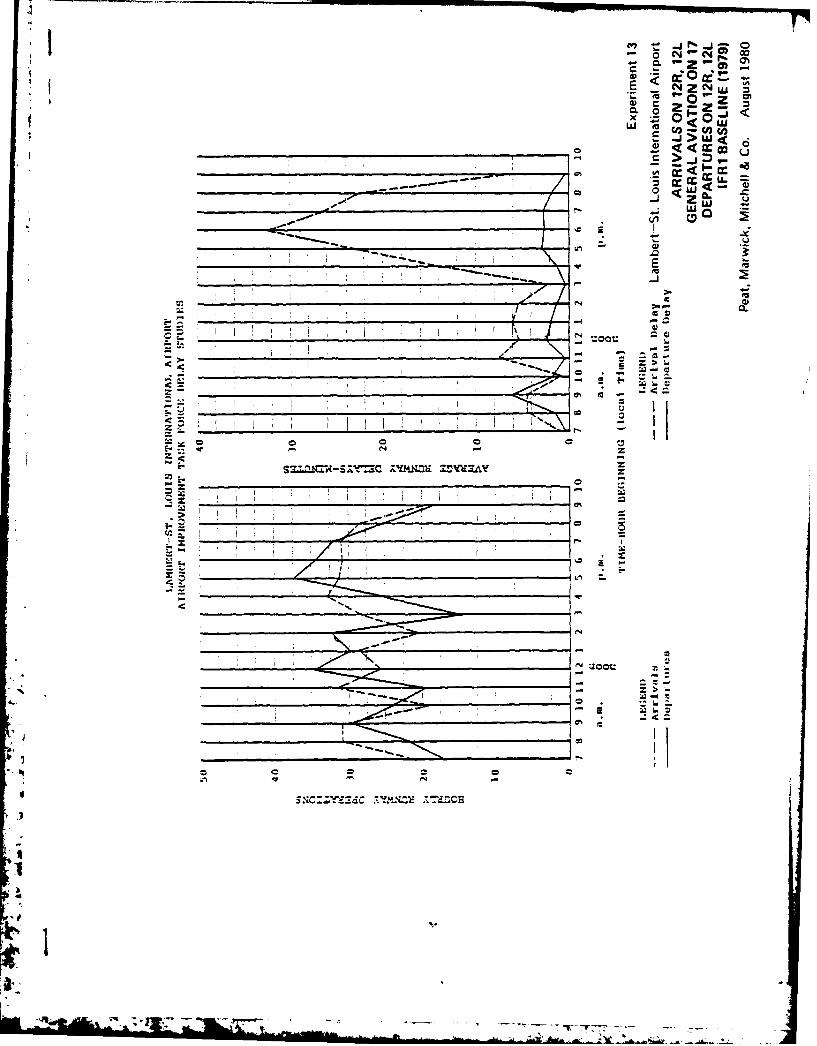
Lambert-St. Louis International Airport Experiments
Experiment No. 13
Scenario:
This experiment is a baseline case using the existing airfieldlayout. Demand is at 1979 levels, and 1979 ATC Proceduresare in effect in IFRI conditions for the following runwayconfiguration:
Arrival runways Departure runways
12R, 12L 12R, 12LGA Operations on 17
Length and Level of Detail of Simulation Run:
From 0700 to 2200 with 1-hour summaries.
Results:
The tabulation below shows selected results for the averagevalues and the peak-delay hour, 1800-1900 hours, over the15-hour simulation period.
Operation Performancetype measure Units Average Peak
Arrival Flow rate a/c per hr 27.3 31.0Arrival Air delay minute 11.8 31.8
Departure Flow rate a/c per hr 27.8 33.7Departure Runway delay minute 2.3 2.6
I
0m 0
xC 0~ o o
ca ca c
S EE
INN
N zo
m~~ -Aw
C-41
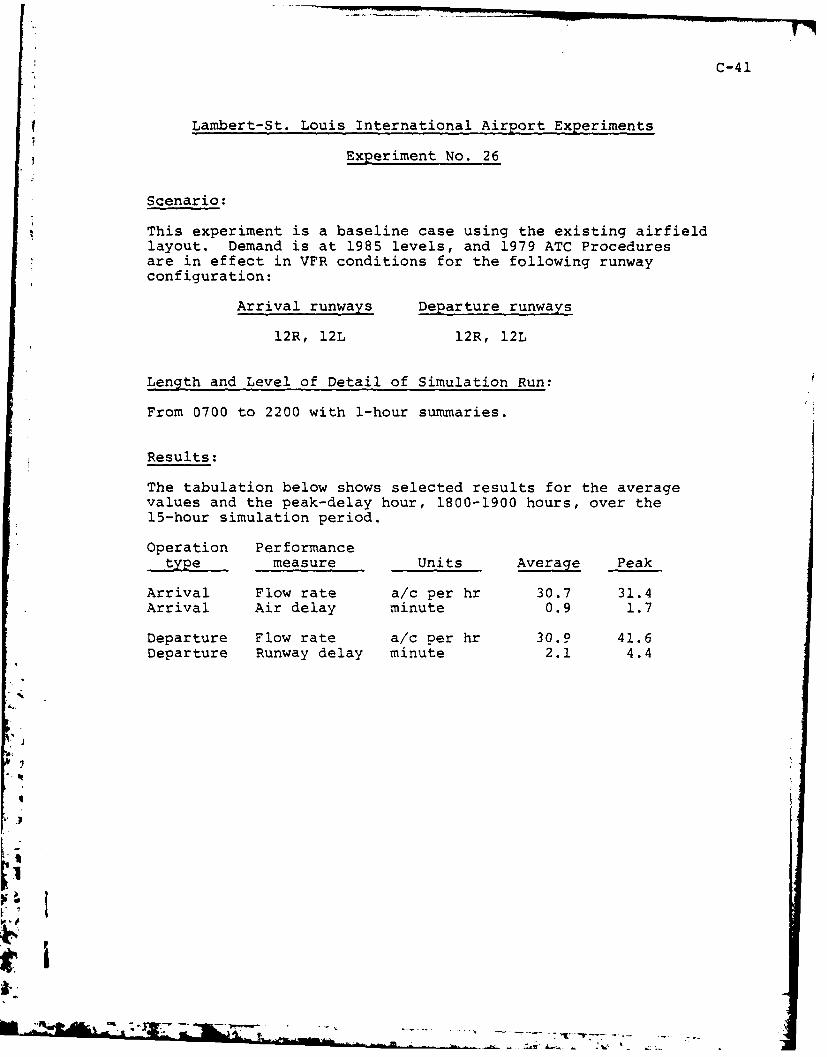
Lambert-St. Louis International Airport Experiments
Experiment No. 26
Scenario:
This experiment is a baseline case using the existing airfieldlayout. Demand is at 1985 levels, and 1979 ATC Proceduresare in effect in VFR conditions for the following runwayconfiguration:
Arrival runways Departure runways
12R, 12L 12R, 12L
Length and Level of Detail of Simulation Run:
From 0700 to 2200 with 1-hour summaries.
Results:
The tabulation below shows selected results for the averagevalues and the peak-delay hour, 1800-1900 hours, over the15-hour simulation period.
Operation Performancetyemeasure Units Average Peak
Arrival Flow rate a/c per hr 30.7 31.4Arrival Air delay minute 0.9 1.7
Departure Flow rate a/c per hr 30.9 41.6Departure Runway delay minute 2.1 4.4
11

CL C
____________________________________a ey A
o -i
I 'U) V-
CL.
NL
NU
4., -dc
J i __
==Ot

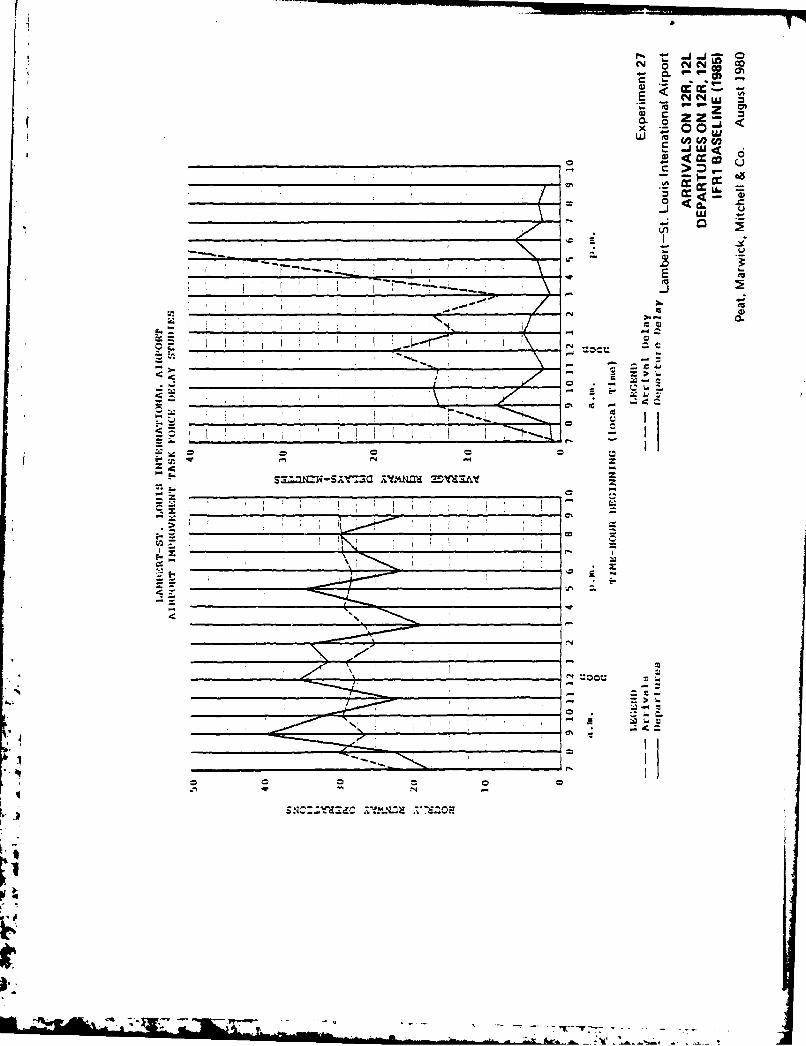
C-43
Lambert-St. Louis International Airport Experiments
Experiment No. 27
Scenario:
This experiment is a baseline case using the existing airfieldlayout. Demand is at 1985 levels, and 1979 ATC Proceduresare in effect in IFRl conditions for the following runwayconfiguration:
Arrival runways Departure runways
12R, 12L 12R, 12L
Length and Level of Detail of Simulation Run:
From 0700 to 2200 with 1-hour summaries.
Results:
The tabulation below shows selected results for the averagevalues and the peak-delay hour, 1800-1900 hours, over the15-hour simulation period.
Operation Performancetype measure Units Average Peak
Arrival Flow rate a/c per hr 27.7 28.2Arrival Air delay minute 25.7 54.8
Departure Flow rate a/c per hr 28.2 31.8Departure Runway delay minute 3.0 5.1
, -7 "- r:l- - , .
CCyN
-4 C 4
U.cc -
r4E
=Dot:
co.
-N

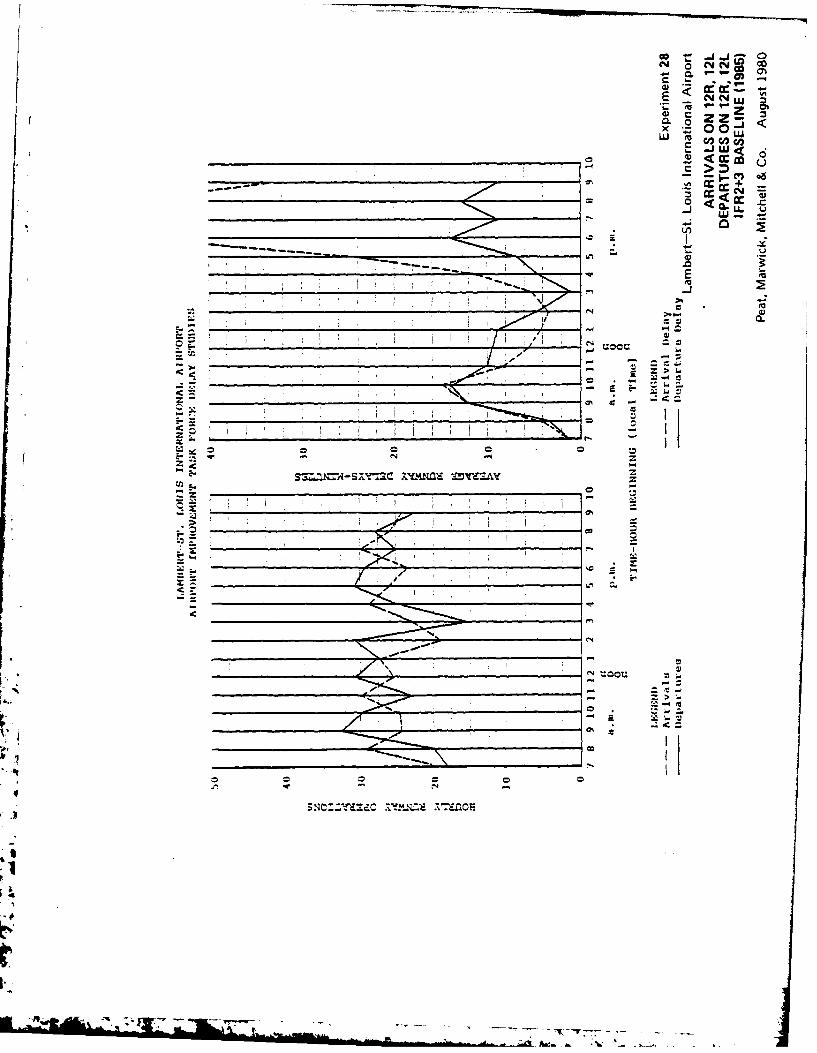
C-45
Lambert-St. Louis International Airport Experiments
Experiment No. 28
Scenario:
This experiment is a baseline case using the existing airfieldlayout. Demand is at 1985 levels, and 1979 ATC Proceduresare in effect in IFR2 and IFR3 conditions for the followingrunway configuration:
Arrival runways Departure runways
12R, 12L 12R, 12L
Length and Level of Detail of Simulation Run:
From 0700 to 2200 with 1-hour summaries.
Results:
The tabulation below shows selected results for the averagevalues and the peak-delay hour, 2000-2100 hours, over the15-hour simulation period.
Operation Performancetype measure Units Average Peak
Arrival Flow rate a/c per hr 25.2 25.5Arrival Air delay minute 18.8 49.8
Departure Flow rate a/c per hr 26.0 28.5Departure Runway delay minute 8.2 13.2
4..7
N C4 N 00 0
- - z
C -
< I=w to> .2
~m .adON In Fc wccC
cc~d_ _ _ _ _ _ _ _ _ _ _ _ _ _ _ _ _ _0
-L
14=
.M6.

C-4 7
Lambert-St. Louis International Airport Experiments
Experiment No. 29
Scenario:
This experiment is a baseline case using the existing airfieldlayout. Demand is at 1985 levels, and 1979 ATC Proceduresare in effect in VFR conditions for the following runwayconfiguration:
Arrival runways Departure runways
30R, 30L 30R, 30L
Length and Level of Detail of Simulation Run:
From 0700 to 2200 with 1-hour summaries.
Results:
The tabulation below shows selected results for the averagevalues and the peak-delay hour, 0900-1000 hours, over the15-hour simulation period.
Operation Performancetyemeasure Units Aeae Peak
Arrival Flow rate a/c per hr 30.7 37.0Arrival Air delay minute 0.9 1.4
Departure Flow rate a/c per hr 30.9 38.9Departure Runway delay minute 2.1 4.1

04J O0 00
CLC - .!Z AJ(
- E
w -U
0 < <
N -
i-- z
U22
N
z P'
'SC
3 -. - 0_Z0

C-4 9
Lambert-St. Louis International Airport Experiments
Experiment No. 30
Scenario:
This experiment is a baseline case using the existing airfieldlayout. Demand is at 1985 levels, and 1979 ATC Proceduresare in effect in IFRl conditions for the following runwayconfiguration:
Arrival runways Departure runways
30R, 30L 30R, 30L
Length and Level of Detail of Simulation Run:
From 0700 to 2200 with 1-hour summaries.
Results:
The tabulation below shows selected results for the averagevalues and the peak-delay hour, 1800-1900 hours, over the15-hour simulation period.
Operation Performanc.type measure Units Average Peak
Arrival Flow rate a/c per hr 27.8 27.5Arrival Air delay minute 25.1 51.7
Departure Flow rate a/c per hr 28.3 30.5Departure Runway delay minute 3.1 5.4
41
-.I
I

0v c w cCL n c o0
E 0.
- LULLwUnc
< 0> D
E-
AC =D'd7-A
IN
- -

C-51
Lambert-St. Louis International Airport Experiments
Experiment No. 31
Scenario:
This experiment is a baseline case using the existing airfieldlayout. Demand is at 1985 levels, and 1979 ATC Proceduresare in effect in IFR2 and IFR3 conditions for the followingrunway configuration:
Arrival runways Departure runways
30R, 30L 30R, 30L
Length and Level of Detail of Simulation Run:
From 0700 to 2200 with 1-hour summaries.
Results:
The tabulation below shows selected results for the averagevalues and the peak-delay hour, 1800-1900 hours, over the15-hour simulation period.
Operation Performance-yemeasure Units Average Peak
Arrival Flow rate a/c per hr 25.1 25.1Arrival Air delay minute 19.2 48.3
Departure Flow rate a/c per hr 25.9 27.9Departure Runway delay minute 8.8 13.7
a.* 17
4V

E ow
LU
-j J
N ~ X .
> c"2 +
CLU0L
* 0 0 0 0
SNbw 'Ia V ka :D -
774~L
=Oct
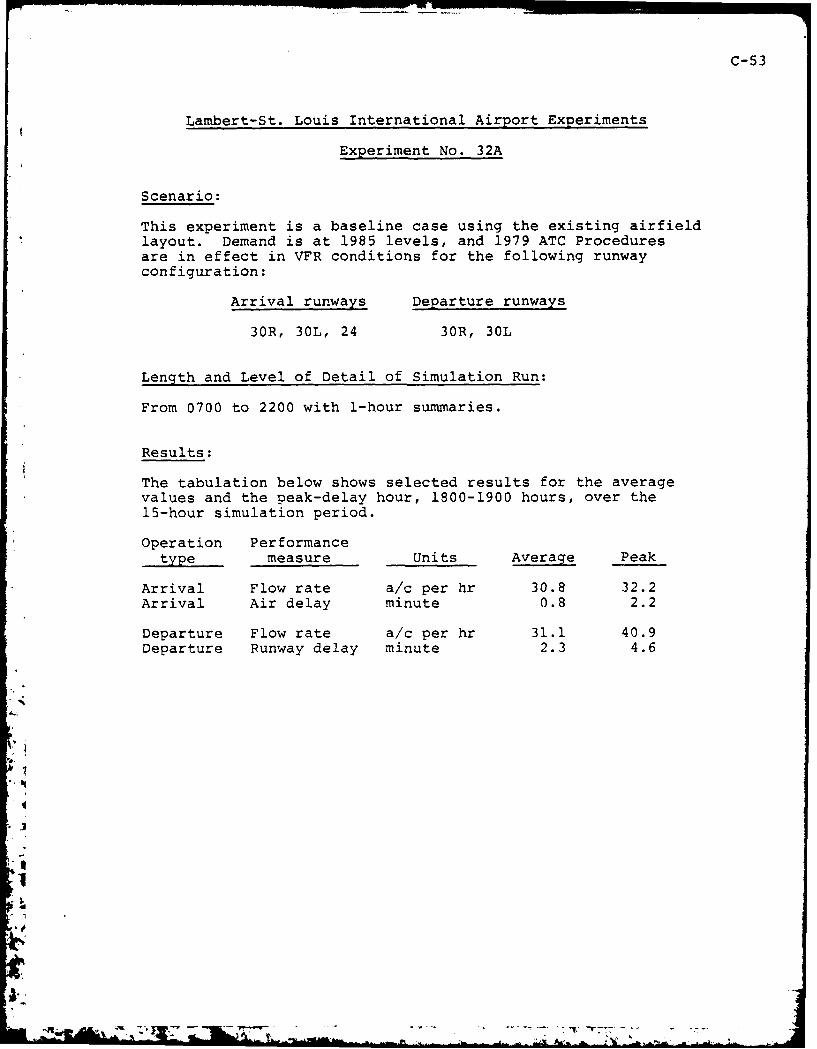
C-53
Lambert-St. Louis International Airport Experiments
Experiment No. 32A
Scenario:
This experiment is a baseline case using the existing airfieldlayout. Demand is at 1985 levels, and 1979 ATC Proceduresare in effect in VFR conditions for the following runwayconfiguration:
Arrival runways Departure runways
30R, 30L, 24 30R, 30L
Length and Level of Detail of Simulation Run:
From 0700 to 2200 with 1-hour summaries.
Results:
The tabulation below shows selected results for the averagevalues and the peak-delay hour, 1800-1900 hours, over the15-hour simulation period.
Operation Performancetype measure Units Average Peak
Arrival Flow rate a/c per hr 30.8 32.2Arrival Air delay minute 0.8 2.2
Departure Flow rate a/c per hr 31.1 40.9Departure Runway delay minute 2.3 4.6

CD
-z Z
0 U
0 > )
E--
E-~~~ ~ ~ =- .7LLMd=lzy
-- I -- 7
0*. r
-7-7

C-55
Lambert-St. Louis International Airport Experiments
Experiment No. 32
Scenario:
This experiment is a baseline case using the existing airfieldlayout. Demand is at 1985 levels, and 1979 ATC Proceduresare in effect in IFRI conditions for the following runwayconfiguration:
Arrival runways Departure runways
30R, 30L, 24 30R, 30L
Length and Level of Detail of Simulation Run:
From 0700 to 2200 with 1-hour summaries.
Results:
The tabulation below shows selected results for the averagevalues and the peak-delay hour, 1800-1900 hours, over the15-hour simulation period.
Operation Performancetype measure Units Average Peak
Arrival Flow rate a/c per hr 28.1 31.5Arrival Air delay minute 4.0 14,8
Departure Flow rate a/c per hr 28.7 37.5Departure Runway delay minute 5.0 11.8
,. .3
I'1
r-I-
Z cc
o z
14 u
= ~ 0LjIa U
Z~
ss.: A -s Zl,-.Z -iMU ZDE=A
>-
N ft

C-57
Lambert-St. Louis International Airport Experiments
Experiment No. 33
Scenario:
This experiment is a baseline case using the existing airfieldlayout. Demand is at 1985 levels, and 1979 ATC Proceduresare in effect in IFlRl conditions for the following runwayconfiguration:
Arrival runways Departure runways
12R, 12L 12R, 12L, 6
Length and Level of Detail of Simulation Run:
From 0700 to 2200 with 1-hour summaries.
Results:
The tabulation below shows selected results for the averagevalues and the peak-delay hour, 1900-2000 hours, over the15-hour simulation period.
Operation Performancetyemeasure Units Average Peak
Arrival Flow rate a/c per hr 27.8 28.5Arrival Air delay minute 25.7 59.4
Departure Flow rate a/c per hr 28.3 29.0Departure Runway delay minute 0.5 0.4

- .za -4Z
.2 .Zu-1I
0.
U4
CCA
dc
E6N
C-4
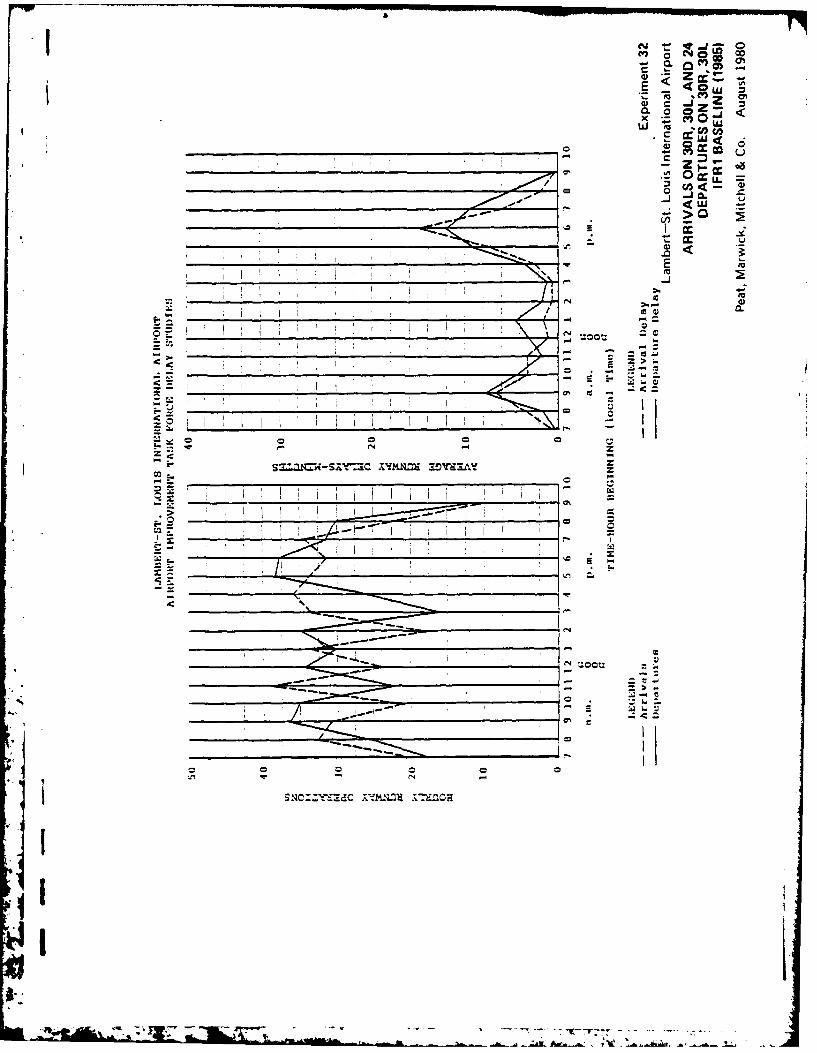
I .oo~r-
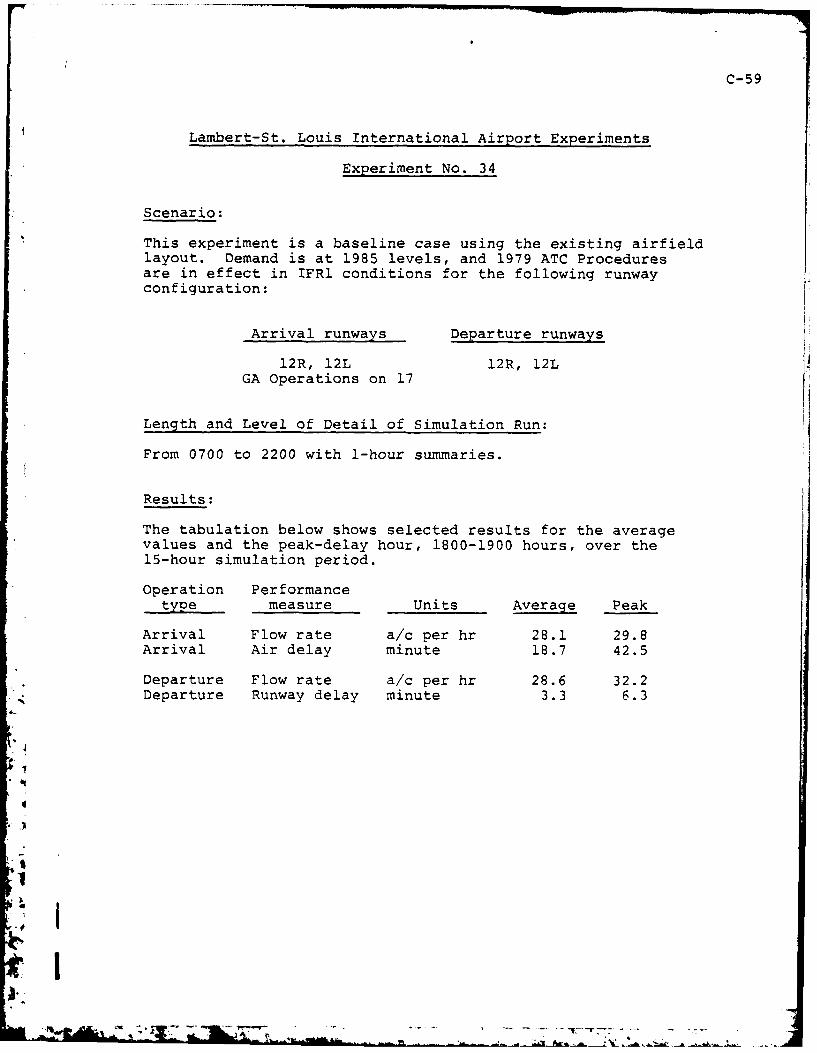
C-59
Lambert-St. Louis International Airport Experiments
Experiment No. 34
Scenario:
This experiment is a baseline case using the existing airfieldlayout. Demand is at 1985 levels, and 1979 ATC Proceduresare in effect in IFRl conditions for the following runwayconfiguration: I
Arrival runways Departure runways
12R, 12L 12R, 12LGA Operations on 17
Length and Level of Detail of Simulation Run:
From 0700 to 2200 with 1-hour summaries.
Results:
The tabulation below shows selected results for the averagevalues and the peak-delay hour, 1800-1900 hours, over the15-hour simulation period.
Operation Performancetyemeasure Units Average Peak
Arrival Flow rate a/c per hr 28.1 29.8Arrival Air delay minute 18.7 42.5
Departure Flow rate a/c per hr 28.6 32.2Departure Runway delay minute 3.3 6.3
'T--r77

< .0CI 00
OL 0 z - z -
: 0* O-LLJ < '
- LU<<A <
UU
- nE E
C-4J
LIM - zA.
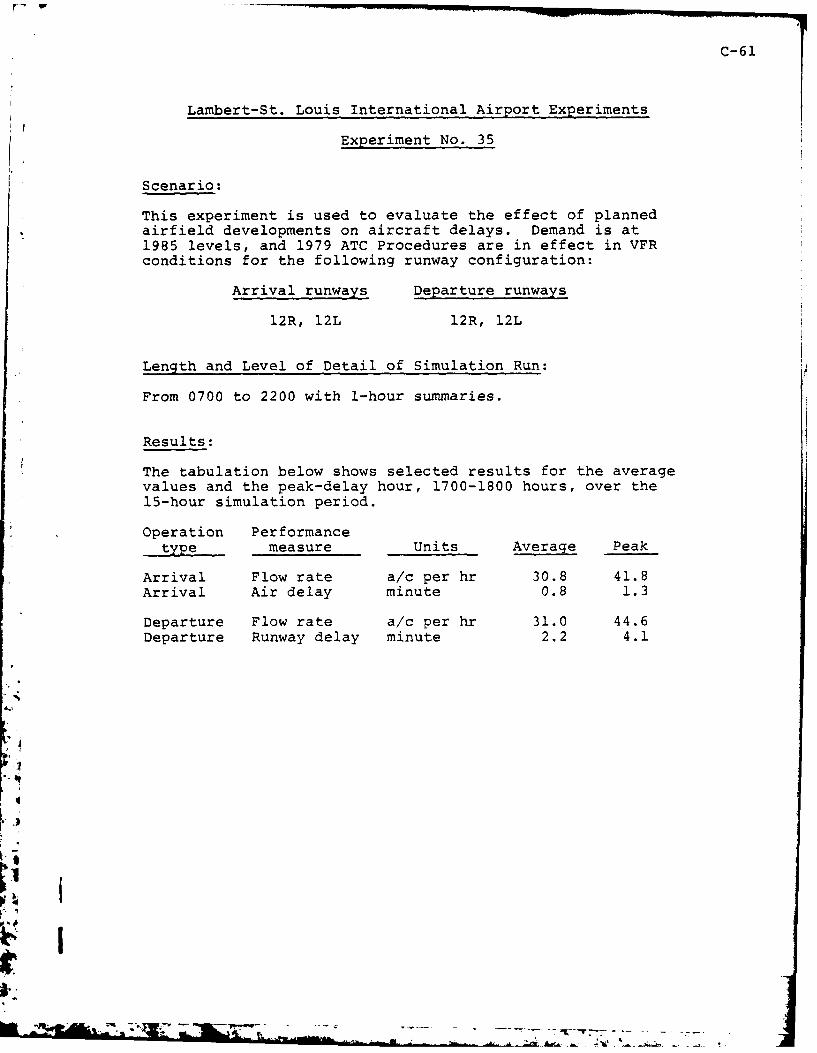
C-61
Lambert-St. Louis International Airport Experiments
Experiment No. 35
Scenario:
This experiment is used to evaluate the effect of plannedairfield developments on aircraft delays. Demand is at1985 levels, and 1979 ATC Procedures are in effect in VFRconditions for the following runway configuration:
Arrival runways Departure runways
12R, 12L 12R, 12L
Length and Level of Detail of Simulation Run:
From 0700 to 2200 with 1-hour summaries.
Results:
The tabulation below shows selected results for the averagevalues and the peak-delay hour, 1700-1800 hours, over the15-hour simulation period.
Operation Performancetype measure Units Average Peak
Arrival Flow rate a/c per hr 30.8 41.8Arrival Air delay minute 0.8 1.3
Departure Flow rate a/c per hr 31.0 44.6Departure Runway delay minute 2.2 4.1
:i

-1 0.'
CI - z zui <x 00 0____ ___ ____ ___ ____ ___ on ca CL
> aa
LA LU
* CCC
-m z-la z
~-s~'~c z'~z~dc
_____ ____ ____ ____ ____ ____ _ 0
2~I -bgj l a

C-62a
Lambert-St. Louis International Airport Experiments
Experiment No. 35G
Scenario:
This experiment is used as a baseline to evaluate the effectof proposed terminal expansion on aircraft delays. Demandis at 1985 levels, and 1979 ATC Procedures are in effect inVFR conditions for the following runway configuration:
Arrival runways Departure runways
12R, 12L 12R, 12L
Length and Level of Detail of Simulation Run:
From 0700 to 2200 with 1-hour summaries.
Results:
The tabulation below shows selected results for the averagevalues and the peak-delay hour, 1300-1900 hours, over the13-hour simulation period.
Operation Performancetype measure Units Average Peak
Arrival Flow rate a/c per 30.8 31.2Arrival Taxi-in delay minute 0.5 0.8
Departure Flow rate a/c per hr 30.8 42.4Departure Taxi-out delay minute 1.0 1.4
Number of aircraft delayed becauseof gate congestion: 7.
Average gate congestion delays incurredby these aircraft: 20.9 minutes.

q tCL
w E j
U'
cc_q.0 Z ~
<w0en -
V)
ui
~~:o~tL
- I I;NZ
C -n
- 40
z- =A KiK. -ya~
-T -r -

Lambert-St. Louis International Airport Experiments
Experiment No. 35A
Scenario:
This experiment is used to evaluate the effect of increasingthe proportion of heavy jets in the aircraft mix oi aircraftdelays. It was assumed in this experiment that the plannedairfield developments were in place. Demand is at 1985 levels,and 1979 ATC Procedures are in effect in VFR conditions forthe following runway configuration:
Arrival runways Departure runways
12R, 12L 12R, 12L
Length and Level of Detail of Simulation Run:
From 0700 to 2200 with 1-hour summaries.
Results:
The tabulation below shows selected results for the averagevalues and the peak-delay hour, 1800-1900 hours, over the15-hour simulation period.
Operation Performancetype measure Units Average Peak
Arrival Flow rate a/c per hr 30.1 29.0Arrival Air delay minute 0.9 1.3
Departure Flow rate a/c per hr 30.1 40.8Departure Runway delay minute 2.1 4.7

In 0 4 z c Ccv . T- I-L 40
2- >
_ _ _ _ _ _ _ _ _ _ _ _ _ _ _ _ 0 o0
-U - L..J a
< <LL~ Z
. a2. <~
E
.a.
0 -
am- -
It

I
Lambert-St. Louis International Airport Experiments
Experiment No. 35B
Scenario:
This experiment is used to evaluate the effect of decreasingthe proportion of general aviation aircraft in the mix onaircraft delays. It was assumed in this experiment that theplanned airfield developments were in place. Demand is at1985 levels, and 1979 ATC Procedures are in effect in VFRconditions for the following runway configuration:
Arrival runways Departure runways
12R, 12L 12R, 12L
Length and Level of Detail of Simulation Run:
From 0700 to 2200 with 1-hour summaries.
Results:
The tabulation below shows selected results for the averagevalues and the peak-delay hour, 1700-1800 hours, over the15-hour simulation period.
Operation Performancetype measure Units Average Peak
Arrival Flow rate a/c per hr 28.6 40.9Arrival Air delay minute 0.6 0.8
Departure Flow rate a/c Der hr 29.0 43.3Departure Runway delay minute 1.7 3.3
*1
- I
7;. i I . . . .......---.. .. ; , .,.. ..

En - - a
z z~ *-J
005.
-~ p .
LA . Y
-- j
Izot
- * >
AL' 6.Id

C-67
Lambert-St. Louis International Airport Experiments
Experiment No. 36
Scenario:
This experiment is used to evaluate the effect of plannedairfield developments on aircraft delays. Demand is at 1985levels, and 1979 ATC Procedures are in effect in IFRl condi-tions for the following runway configuration:
Arrival runways Departure runways
12R, 12L 12R, 12L
Length and Level of Detail of Simulation Run:
From 0700 to 2200 with 1-hour summaries.
Results:
The tabulation below shows selected results for the averagevalues and the peak-delay hour, 1900-2000 hours, over the15-hour simulation period.
Operation Performancetype measure Units Average Peak
Arrival Flow rate a/c per hr 28.0 29.0Arrival Air delay minute 25.8 59.3
Departure Flow rate a/c per hr 28.4 28.0Departure Runway delay minute 0.5 0.3
1

00LL 0 0
> 0.S - > -a
@17@
0~0
LU
I - U
-IL
E-4
CI ~ II I. _ __ _ _
C *.-7 .- 770

C-69
Lambert-St. Louis International Airport Experiments
Experiment No. 38
Scenario:
This experiment is used to evaluate the effect of plannedairfield developments on aircraft delays. Demand is at1985 levels, and 1979 ATC Procedures are in effect in IFRlconditions for the following runway configuration:
Arrival runways Departure runways
30R, 30L 30R, 30L
Length and Level of Detail of Simulation Run:
From 0700 to 2200 with 1-hour summaries.
Results:
The tabulation below shows selected results for the averagevalues and the peak-delay hour, 1900-2000 hours, over the15-hour simulation period.
Operation Performancetype measure Units Average Peak
Arrival Flow rate a/c per hr 27.9 28.5Arrival Air delay minute 26.1 60.2
Departure Flow rate a/c per hr 26.1 28.2Departure Runway delay minute 0.5 0.4

,0 ogz~
CL a
__ __ __ __ __ __ __ __ __ __ __ __._ 0 0
> -____ ___ ____ ___ ____ ___ ___ ____ ___ ____ ___ _ t
- 6,
I i
1%c
- .-. e4
NHI: I .5

I C-71
Lambert-St. Louis International Airport Experiments
Experiment No. 39A
Scenario:
This experiment is used to evaluate the effect of plannedairfield developments on aircraft delays. Demand is at1985 levels, and 1979 ATC Procedures are in effect in VFRconditions for the following runway configuration:
Arrival runways Departure runways
30R, 30L, 24 30R, 30L
Length and Level of Detail of Simulation Run:
From 0700 to 2200 with 1-hour summaries.
Results:
The tabulation below shows selected results for the averagevalues and the peak-delay hour, 1700-1800 hours, over the15-hour simulation period.
Operation Performancetype measure Units Average Peak
Arrival Flow rate a/c per hr 30.7 38.2Arrival Air delay minute 0.7 1.3
Departure Flow rate a/c per hr 30.9 47.3Departure Runway delay minute 2.5 5.4
4.6-
II
i ' ° +"" ,-" . .. ... .... ., ',1' ., , ' = ... ...

UJ 0 0
U'
z ><0.c0 u
=_ _ _ _ q.
-j____~~ In__ _ _ >4
A_

C-73
Lambert-St. Louis International Airport Experiments
Experiment No. 39
Scenario:
This experiment is used to evaluate the effect of plannedairfield developments on aircraft delays. Demand is at1985 levels, and 1979 ATC Procedures are in effect in IFRlconditions for the following runway configuration:
Arrival runways Departure runways
30R, 30L, 24 30R, 30L
Length and Level of Detail of Simulation Run:
From 0700 to 2200 with 1-hour summaries.
Results:
The tabulation below shows selected results for the averagevalues and the peak-delay hour, 0900-1000 hours, over the15-hour simulation period.
Operation Performancetype measure Units Average Peak
Arrival Flow rate a/c per hr 28.0 35.0Arrival Air delay minute 1.9 3.1
Departure Flow rate a/c per hr 28.5 38.0Departure Runway delay minute 2.0 3.4
J,

- wZ
a' -Z m > o<
- w -j
Z. >
_j U.
I' M- -.
.cr
> - ,
It I
Is
I.
*-.- ----

IC-75I
Lambert-St. Louis International Airport Experiments
Experiment No. 40
Scenario:
This experiment is used to evaluate the effect of plannedairfield developments on aircraft delays. Demand is at 1985levels, and 1979 ATC Procedures are in effect in IFRI condi-tions for the following runway configuration:
Arrival runways Departure runways
12R, 12L 12R, 12L, 6
Length and Level of Detail of Simulation Run:
From 0700 to 2200 with 1-hour summaries.
Results:
The tabulation below shows selected results for the averagevalues and the peak-delay hour, 1900-2000 hours, over the15-hour simulation period.
Operation Performancetype measure Units Average Peak
Arrival Flow rate a/c per hr 27.8 28.5Arrival Air delay minute 26.5 62.4
Departure Flow rate a/c per hr 28.3 27.3Departure Runway delay minute 0.3 0.2
4
-- ja•

0- .
E o-
0 0 >
U'
*c -
U.
C4

AA-A099 862 PEAT MARWICK MITCHELL AND CO SAN FRANCISCO CALIF F/AIG 2 1
LAMBERT-ST. LOUIS INTERNATIONAL AIRPORT DATA PACKAGE NUMBER 7. --ETC(U)AUG 80 DOT-FA77WA-3961
UNCLASSIFIED NLa IInIInIInIInIInInIIIIlfllflfIIIl..I.EEEEEEEEEEEEIEE///EEEEIr:

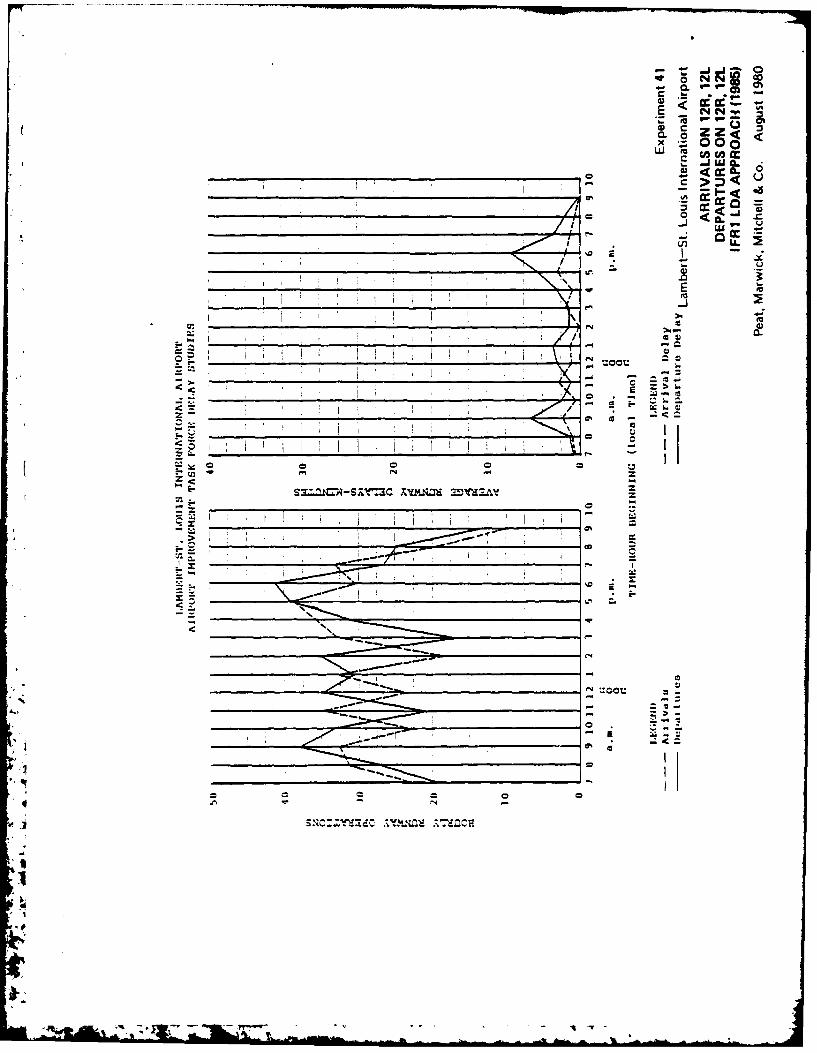
C-77'
Lambert-St. Louis International Airport Experiments
Experiment No. 41
Scenario:
This experiment is used to evaluate the effect of the proposedLDA approach on aircraft delays. It was assumed in thisexperiment that the planned airfield developments were inplace. Demand is at 1985 levels, and 1979 ATC Proceduresare in effect in IFRi conditions for the following runwayconfiguration:
Arrival runways Departure runways
30R, 30L 30R, 30L
Length and Level of Detail of Simulation Run:
From 0700 to 2200 with 1-hour summaries.
Results:
The tabulation below shows selected results for the averagevalues and the peak-delay hour, 1800-1900 hours, over the15-hour simulation period.
Operation Performance- yemeasure Units Average Peak
Arrival Flow rate a/c per hr 28.1 30.4Arrival Air delay minute 1.2 1.2
Departure Flow rate a/c per hr 28.5 41.1Departure Runway delay minute 2.8 7.2
- j
CC 1= -
0) _
x00wU w c
CC
V) L
M -)
LolmU
Cc
etU
-- OCT.:

C-79
Lambert-St. Louis International Airport Experiments
Experiment No. 42
Scenario:
This experiment is used to evaluate the effect of the proposedLDA approach on aircraft delays. It was assumed in this exper-iment that the planned airfield developments were in place.Demand is at 1985 levels, and 1979 ATC Procedures are in effectin IFRI conditions for the following runway configuration:
Arrival runways Departure runways
30R, 30L, 24 30R, 30L
Length and Level of Detail of Simulation Run:
From 0700 to 2200 with 1-hour summaries.
Results:
The tabulation below shows selected results for the averagevalues and the peak-delay hour, 1700-1800 hours, over the15-hour simulation period.
Operation Performancetype measure Units Average Peak
Arrival Flow rate a/c per hr 28.1 40.2Arrival Air delay minute 1.0 2.5
Departure Flow rate a/c per hr 28.5 41.4Departure Runway delay minute 2.3 3.9
j.
7V--

Z
< <
C) o
UJ wm
= U
AA.C
U0U
1
_____ ____ ____ ____ _ o Z
- -
C-81
Lambert-St. Louis International Airport Experiments
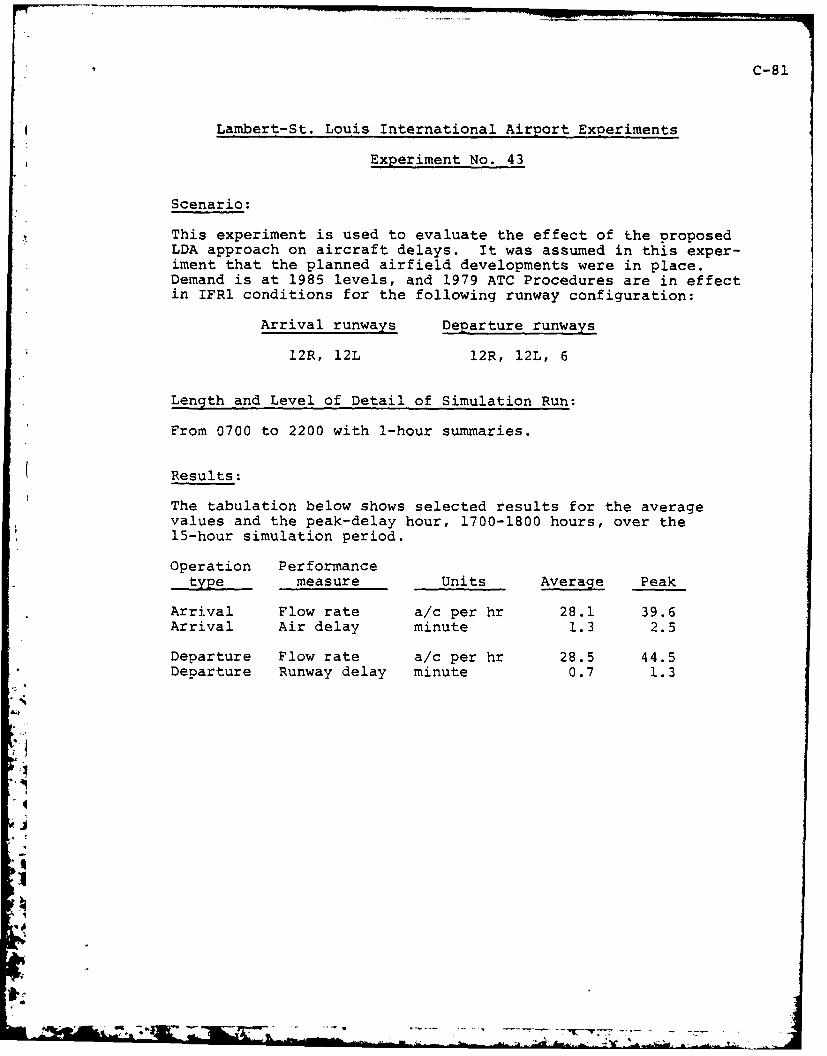
Experiment No. 43
Scenario:
This experiment is used to evaluate the effect of the proposedLDA approach on aircraft delays. It was assumed in this exper-iment that the planned airfield developments were in place.Demand is at 1985 levels, and 1979 ATC Procedures are in effectin IFRI conditions for the following runway configuration:
Arrival runways Departure runways
12R, 12L 12R, 12L, 6
Length and Level of Detail of Simulation Run:
From 0700 to 2200 with 1-hour summaries.
Results:
The tabulation below shows selected results for the averagevalues and the peak-delay hour, 1700-1800 hours, over the15-hour simulation period.
Operation Performancetype measure Units Average Peak
Arrival Flow rate a/c per hr 28.1 39.6Arrival Air delay minute 1.3 2.5
Departure Flow rate a/c per hr 28.5 44.5Departure Runway delay minute 0.7 1.3
J

c4. J Onm
CL o 2 z
rc 0I *CC
I'~~U I 'j2
- -.
____ ~ ~ ~ t -
f4 z
I -z
*n
_____>
* _ _ _ _ _ _ _ _ _A

C-83
Lambert-St. Louis International Airport Experiments
Experiment No. 44
Scenario:
This experiment is used to evaluate the effect of proposedterminal expansion on aircraft delays. Demand is at 1985levels, and 1979 ATC Procedures are in effect in VFR condi-tions for the following runway configuration:
Arrival runways Departure runways
12R, 12L 12R, 12L
Length and Level of Detail of Simulation Run:
From 0700 to 2200 with 1-hour summaries.
Results:
The tabulation below shows selected results for the averagevalues and the peak-delay hour, 1800-1900 hours, over the15-hour simulation period.
Operation Performancetype measure Units Average Peak
Arrival Flow rate a/c per hr 30.8 31.8Arrival Taxi-in delay minute 0.3 1.0
Departure Flow rate a/c per hr 30.8 41.6Departure Taxi-out delay minute 0.9 1.2
Number of aircraft delayed becauseof gate congestion: 0.
Average gate congestion delays incurredby these aircraft: 0.0 minute.
7Ii 'T---:"

x 0 0 U
La. z
-C z
U'
tuj=4
- a
1 I 1
2~ ~ I
T-- OF
C-85
Lamnbert-St. Louis International Airport Experiments
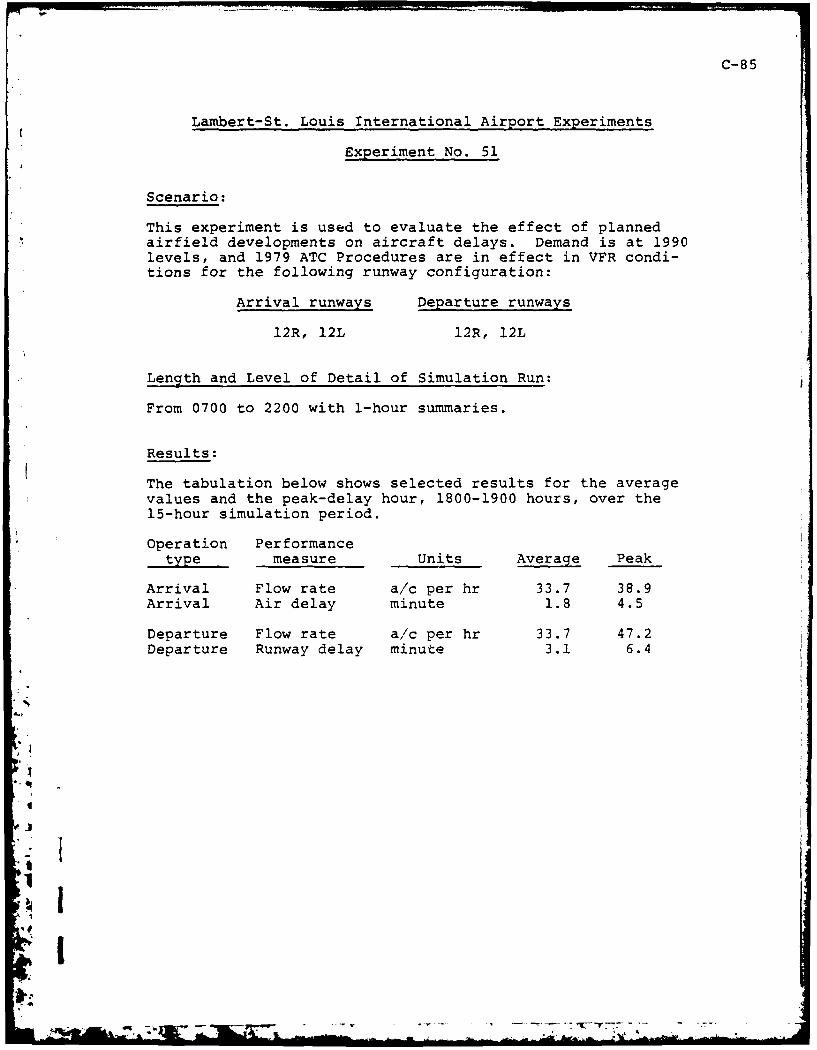
Experiment No. 51
Scenario:
This experiment is used to evaluate the effect of plannedairfield developments on aircraft delays. Demand is at 1990levels, and 1979 ATC Procedures are in effect in VFR condi-tions for the following runway configuration:
Arrival runways Departure runways
12R, 12L 12R, 12L
Length and Level of Detail of Simulation Run:
From 0700 to 2200 with 1-hour summaries.
Results:
The tabulation below shows selected results for the averagevalues and the peak-delay hour, 1800-1900 hours, over the15-hour simulation period.
Operation Performancetyemeasure Units Average Peak
Arrival Flow rate a/c per hr 33.7 38.9Arrival Air delay minute 1.8 4.5
Departure Flow rate a./c per hr 33.7 47.2Departure Runway delay minute 3.1 6.4
ILA

to - -C4 O
C4
x 00
> a6'A .. jW 6
. L.(_____ ____ ____ ____ ____ ____ ___- C 2 ~
LIMI
on~o
:30 00
411 'C -

C-8 7
Lambert-St. Louis International Airport Experiments
Experiment No. 51A
Scenario:
This experiment is used to evaluate the effect of an increasein the proportion of heavy jets in the aircraft mix onaircraft delays. It was assumed in this experiment thatthe planned airfield developments were in place. Demand isat 1990 levels, and 1979 ATC Procedures are in effect inVFR conditions for the following runway configuration:
Arrival runways Departure runways
12R, 12L 12R, 12L
Length and Level of Detail of Simulation Run:
From 0700 to 2200 with 1-hour summaries.
Results:
The tabulation below shows selected results for the averagevalues and the peak-delay hour, 1800-1900 hours, over the15-hour simulation period,
Operation Performancetype measure Units Average Peak
Arrival Flow rate a/c per hr 30.4 35.7Arrival Air delav minute 2.0 4.7
Departure Flow rate a/c per hr 30.6 41.5Departure Runway delay minute 3.1 6.3

C- Cr- o > n
-~ >
1ZW
W ~ W
U
cc
>4 0
f-4-
3-1-
C-89
Lambert-St. Louis International Airport Experiments
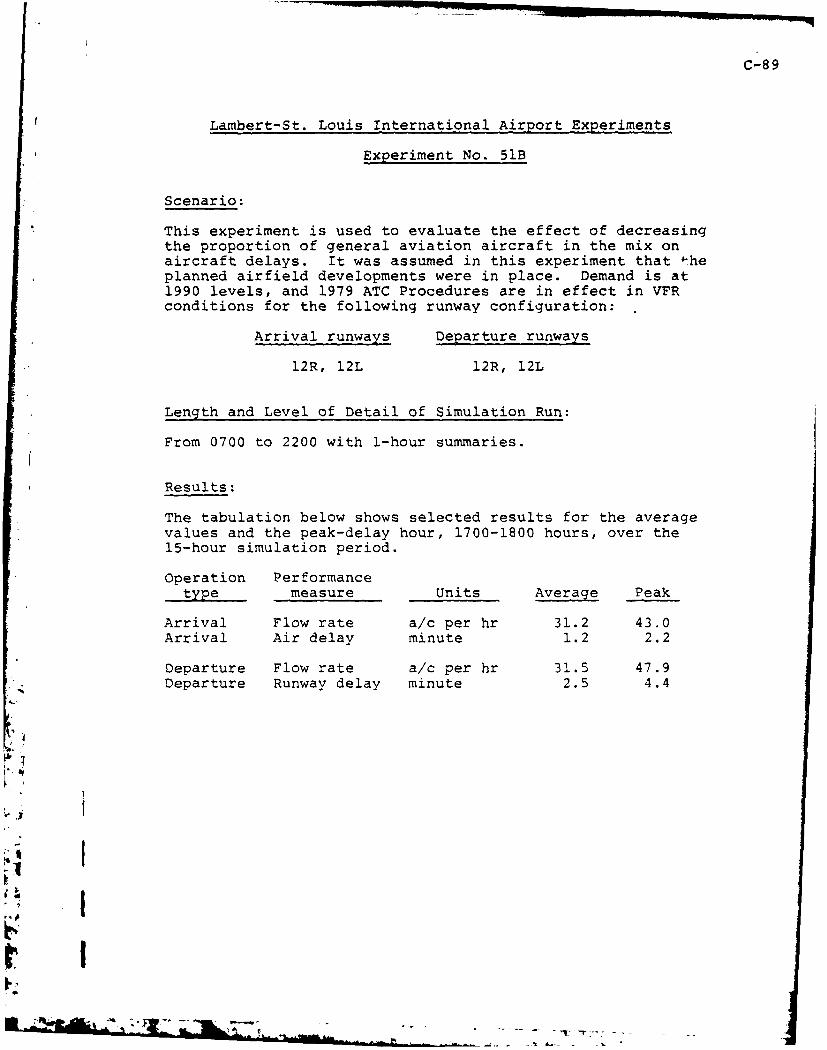
Experiment No. 51B
Scenario:
This experiment is used to evaluate the effect of decreasingthe proportion of general aviation aircraft in the mix onaircraft delays. It was assumed in this experiment that *heplanned airfield developments were in place. Demand is at1990 levels, and 1979 ATC Procedures are in effect in VFRconditions for the following runway configuration:
Arrival runways Departure runways
12R, 12L 12R, 12L
Length and Level of Detail of Simulation Run:
From 0700 to 2200 with 1-hour summaries.
Results:
The tabulation below shows selected results for the averagevalues and the peak-delay hour, 1700-1800 hours, over the15-hour simulation period.
Operation Performancetype measure Units Average Peak
Arrival Flow rate a/c per hr 31.2 43.0Arrival Air delay minute 1.2 2.2
Departure Flow rate a/c per hr 31.5 47.9Departure Runway delay minute 2.5 4.4
I
• . :- " "" - - . ..... -. - " -

- 0 j C CDEn 0. * Z'~a
S~ *0 Z Z c0 0 >
LU Lc< .JW~>
uj 0
a 0j
0. a-W 4
-C4
N - N
CC 0
AIL

C-91
Lambert-St. Louis International Airport Experiments
Experiment No. 52
Scenario:
This experiment is used to evaluate the effect of the plannedairfield developments on aircraft delays. Demand is at 1990levels, and 1979 ATC Procedures are in effect in IFRl condi-tions for the following runway configuration:
Arrival runways Departure runways
12R, 12L 12R, 12L
Length and Level of Detail of Simulation Run:
From 0700 to 2200 with 1-hour summaries.
Results:
The tabulation below shows selected results for the averagevalues and the peak-delay hour, 2100-2200 hours, over the15-hour simulation period.
Operation Performancetype measure Units Average Peak
Arrival Flow rate a/c per hr 28.0 28.2Arrival Air delay minute 60.6 141.9
Departure Flow rate a/c per hr 29.6 26.9Departure Runway delay minute 0.8 0.5
M7
I
.;,

x zOz
L
cc UJcc
0 C C6
2j
i *i
- I I
a~~~ ~ ~ N A-9X=ACX-Na=YdA
71 -I
C-93
Lambert-St. Louis International Airport Experiments
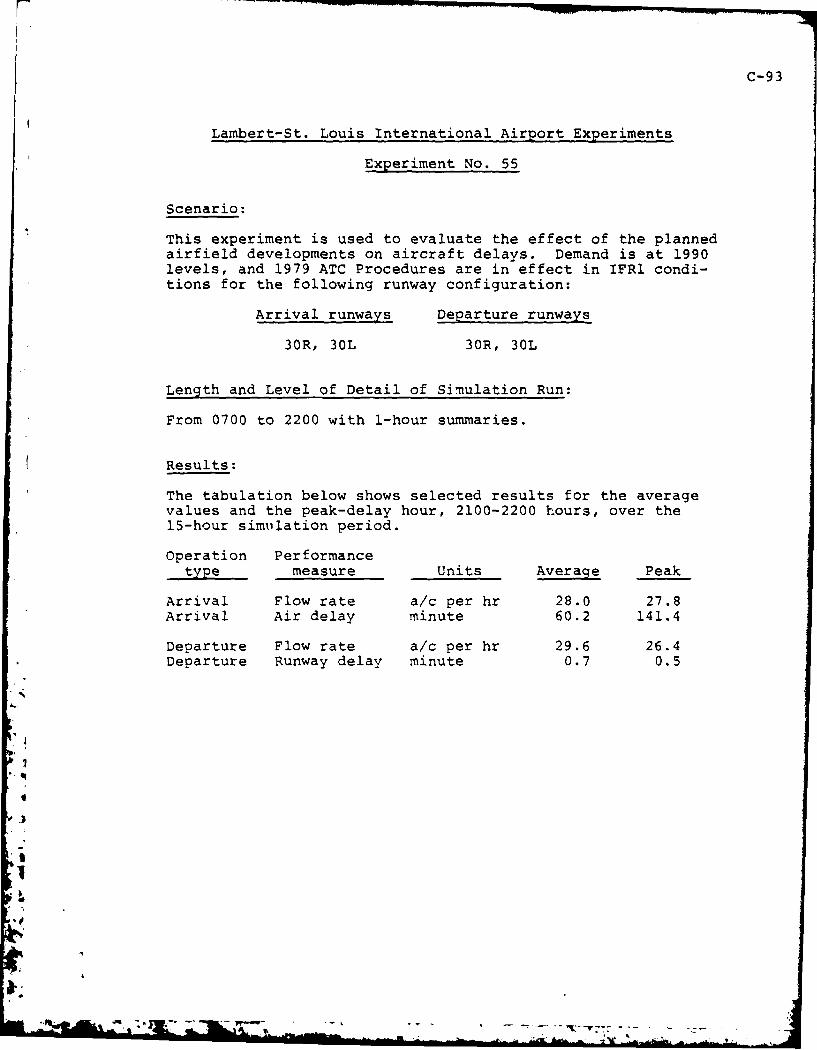
Experiment No. 55
Scenario:
This experiment is used to evaluate the effect of the plannedairfield developments on aircraft delays. Demand is at 1990levels, and 1979 ATC Procedures are in effect in IFRl condi-tions for the following runway configuration:
Arrival runways Departure runways
30R, 30L 30R, 30L
Length and Level of Detail of Simulation Run:
From 0700 to 2200 with 1-hour summaries.
Results:
The tabulation below shows selected results for the averagevalues and the peak-delay hour, 2100-2200 hours, over the15-hour simulation period.
Operation Performancetype measure Units Average Peak
Arrival Flow rate a/c per hr 28.0 27.8Arrival Air delay minute 60.2 141.4
Departure Flow rate a/c per hr 29.6 26.4Departure Runway delay minute 0.7 0.5
- . .. .

C- <
CL 0 z z ,
wmca c.a 9
J wuJ -
> a6
- *j
C CC
- a a
CN
-3

Lambert-St. Louis International Airport Experiments
Experiment No. 57A
Scenario:
This experiment is used to evaluate the effect of plannedairfield developments on aircraft delays. Demand is at1990 levels, and 1979 ATC Procedures are in effect in VFRconditions for the following runway configuration:
Arrival runways Departure runways
30R, 30L, 24 30R, 30L
Length and Level of Detail of Simulation Run:
From 0700 to 2200 with 1-hour summaries.
Results:
The tabulation below shows selected results for the averagevalues and the peak-delay hour, 1800-1900 hours, over the15-hour simulation period.
Operation Performancetype measure Units Average Peak
Arrival Flow rate a/c per hr 33.7 37.6Arrival Air delay minute 1.5 8.2
Departure Flow rate a/c per hr 33.8 44.9Departure Runway delay minute 4.5 11.2
La-7vV71=

Z) 4
c-0 om 2wUza..;o Co
GuOzo EJ
q..
- cc
z~- ___ __.
=CC
400
Af - v

1C-97
Lambert-St. Louis International Airport Experiments
Experiment No. 57
Scenario:
This experiment is used to evaluate th effect of plannedairfield developments on aircraft delays. Demand is at1990 levels, and 1979 ATC Procedures are in effect in IFRIconditions for the following runway configuration:
Arrival runways Departure runways
30R, 30L, 24 30R, 30L
Length and Level of Detail of Simulation Run:
From 0700 to 2200 with 1-hour summaries.
Results:
The tabulation below shows selected results for the averagevalues and the peak-delay hour, 1800-1900 hours, over the15-hour simulation period.
Operation Performancetype measure Units Average Peak
Arrival Flow rate a/c per hr 31.3 35.0Arrival Air delay minute 5.3 12.1
Departure Flow rate a/c per hr 31.5 43.5Departure Runway delay minute 2.7 6.4
L 3
-I'1 ' :' - .. .. ..

. -4
0 j
CL
___ ___ ___ __ ___ ___ ___ _x 0
U4,
_ _ _ _ _ >0
Ii j L. -C*~ -L * I
-7 Z
> 6.
dc- I
-- _ ____ ___ ____ ___ ____ ___ ____ __c
IX

C- 99
Lambert-St. Louis International Airport Experiments
f Experiment No. 58
Scenario:
This experiment is used to evaluate the effect of plannedairfield developments on aircraft delays. Demand is at 1990levels, and 1979 ATC Procedures are in effect in IFRi condi-tions for the following runway configuration:
Arrival runways Departure runways
12R, 12L 12R, 12L, 6
Length and Level of Detail of Simulation Run:
From 0700 to 2200 with 1-hour summaries.
Results:
The tabulation below shows selected results for the averagevalues and the peak-delay hour, 2100-2200 hours, over the15-hour simulation period.
Operation Performancetyemeasure Units Average Peak
Arrival Flow rate a/c per hr 28.1 28.5Arrival Air delay minute 59.7 140.7
Departure Flow rate a/c per hr 29.7 25.8Departure Runway delay minute 0.3 0.3
-7M7

0
fCoII II i IE A,..
- 1
q- -5 0
io >
0 0
6.?.
"act:
d-
Id3
z
an ~~

Lambert-St. Louis International Airport Experiments
Experiment No. 60
Scenario:
This experiment is used to evaluate the effect of the proposedLDA approach on aircraft delays. It was assumed in this exper-iment that the planned airfield developments were in place.Demand is at 1990 levels, and 1979 ATC Procedures are in effectin IFRl conditions for the following runway configuration:
Arrival runways Departure runways
30R, 30L 30R, 30L
Length and Level of Detail of Simulation Run:
From 0700 to 2200 with 1-hour summaries.
Results:
The tabulation below shows selected results for the averagevalues and the peak-delay hour, 1800-1900 hours, over the15-hour simulation period.
Operation Performancetype measure Units Average Peak-
Arrival Flow rate a/c per hr 31.3 34.7Arrival Air delay minute 2.6 5.9
Departure Flow rate a/c per hr 31.5 41.7Departure Runway delay minute 5.6 15.0
4.36

z z
CLx. 000.
* UJ
N .
-"not
-:

C-103
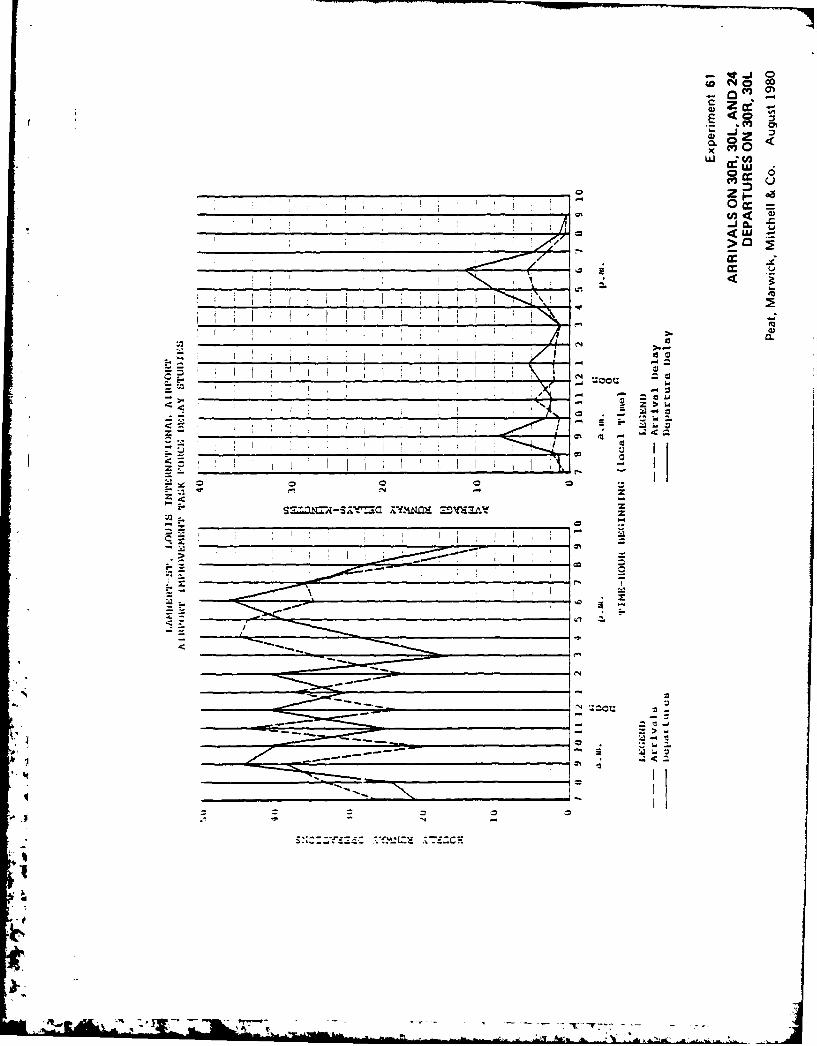
Lambert-St. Louis International Airport Experiments
Experiment No. 61
Scenario:
This experiment is used to evaluate the effect of the proposedLDA approach on aircraft delays. It was assumed in this exper-iment that the planned airfield developments were in place.Demand is at 1990 levels, and 1979 ATC Procedures are in effectin IFRi conditions for the following runway configuration:
Arrival runways Departure runways
30R, 30L, 24 30R, 30L
Length and Level of Detail of Simulation Run:
From 0700 to 2200 with 1-hour summaries.
Results:
The tabulation below shows selected results for the averagevalues and the peak-delay hour, 1800-1900 hours, over the15-hour simulation period.
Operation Performancetype measure Units Average Peak
Arrival Flow rate a/c per hr 31.3 34.6Arrival Air delay minute 2.6 4.1
Departure Flow rate a/c per hr 31.6 45.8Departure Runway delay minute 4.3 11.1
C4 00za
CC<
Un
cc 0
20 c
/ 4l
I = t

C-i05
Lambert-St. Louis International Airport Experiments
Experiment No. 62
Scenario:
This experiment is used to evaluate the effect of the proposedLDA approach on aircraft delays. It was assumed in this exper-iment that the planned airfield developments were in place.Demand is at 1990 levels, and 1979 ATC Procedures are in effectin IFRI conditions for the following runway configuration:
Arrival runways Departure runways
12R, 12L 12R, 12L, 6
Length and Level of Detail of Simulation Run:
From 0700 to 2200 with 1-hour summaries.
Results:
The tabulation below shows selected results for the averagevalues and the peak-delay hour, 1700-1800 hours, over the15-hour simulation period.
Operation Performancetype measure Units Average Peak
Arrival Flow rate a/c per hr 31.2 45.3Arrival Air delay minute 2.4 5.2
Departure Flow rate a/c per hr 31.5 50.0Departure Runway delay minute 1.3 2.5
,7-

0
0 L 0 <
x. 0 ~-
0 0
"CCU
> 6.
M4 -
NU

IC-i107
Lambert-St. Louis International Airport Experiments
I Experiment No. 63
* I Scenario:
This experiment is used to evaluate the effect of proposedterminal expansion on aircraft delays. Demand is at 1990levels, and 1979 ATC Procedures are in effect in VFR condi-tions for the following runway configuration:
Arrival runways Departure runways
12R, 12L 12R, l2L
Length and Level of Detail of Simulation Run:
From 0700 to 2200 with 1-hour summaries.
Results:
The tabulation below shows selected results for the averagevalues 'and the peak-delay hour, 1700-1800 hours, over the15-hour simulation period.
Operation Performancetype measure Units Average Peak
Arrival Flow rate a/c per hr 33.6 45.6Arrival Taxi-in delay minute 0.4 1.2
Departure Flow rate a/c per hr 33.6 44.1Departure Taxi-out delay minute 1.5 2.1
Number of aircraft delayed becauseof gate congestion: 2.
Average gate congestion delays incurredby these aircraft: 12.5 minutes.
II

4- m. t -
NVZzu z C
Ca _
-i ;
I ad
0 <o a. z2C -U
I~ "4
Cm
iPN
- I - 0 f4
m & ..- ....

Lambert-St. Louis International Airport Experiments
Exeien1o 64
I Scenario:
This experiment is used to evaluate the effect of relocatingthe general aviation airfield on aircraft delays. Demand isat 1990 levels, and 1979 ATC Procedures are in effect inVFR conditions for the following runway configuration:
Arrival runways Departure runways
12R, 12L 12R, 12L
Length and Level of Detail of simulation Run.:
From 0700 to 2200 with 1-hour summaries.
Results:
The tabulation below shows selected results for the averagevalues and the peak-delay hour, 1800-1900 hours, over the15-hour simulation period.
Operation Performancetype measure Units Average Peak
Arrival Flow rate a/c per hr 33.7 36.5Arrival Air delay minute 1.6 4.9
Departure Flow rate a/c per hr 33.7 47.5Departure Runway delay minute 3.1 6.8
k-

04C
I~ 5 '
Ir LJ.Jw*U
1-I _ _ _
Ila u2
____7_%__ I

I 'c-l
C-111
ILambert-St. Louis International Airport Experiments
I Experiment No. 64A
Scenario:
This experiment is used to evaluate the effect of relocatingthe general aviation airfield on aircraft delays. Demand isat 1990 levels, and 1979 ATC Procedures are in effect in VFRconditions for the following runway configuration:
Arrival runways Departure runways
12R, 12L 12R, 12LGA Operations on 17
Length and Level of Detail of Simulation Run:
From 0700 to 2200 with 1-hour summaries.
Results:
The tabulation below shows selected results for the averagevalues and the peak-delay hour, 0900-1000 hours, over the15-hour simulation period.
Operation Performancetype measure Units Average Peak
Arrival Flow rate a/c per hr 33.6 38.4Arrival Air delay minute 1.4 2.6
Departure Flow rate a/c per hr 33.6 45.1Departure Runway delay minute 2.9 6.5
"-1
'I

*-i C4 O
r' Wg!I060 mz1OE .;I
Q.* 0I~0<
0--O
4 - Co
~> -
f*. -
- zJS2~~C-S~C.'4.WA~ ~LW
VII
-1 4 )
t
AL AA
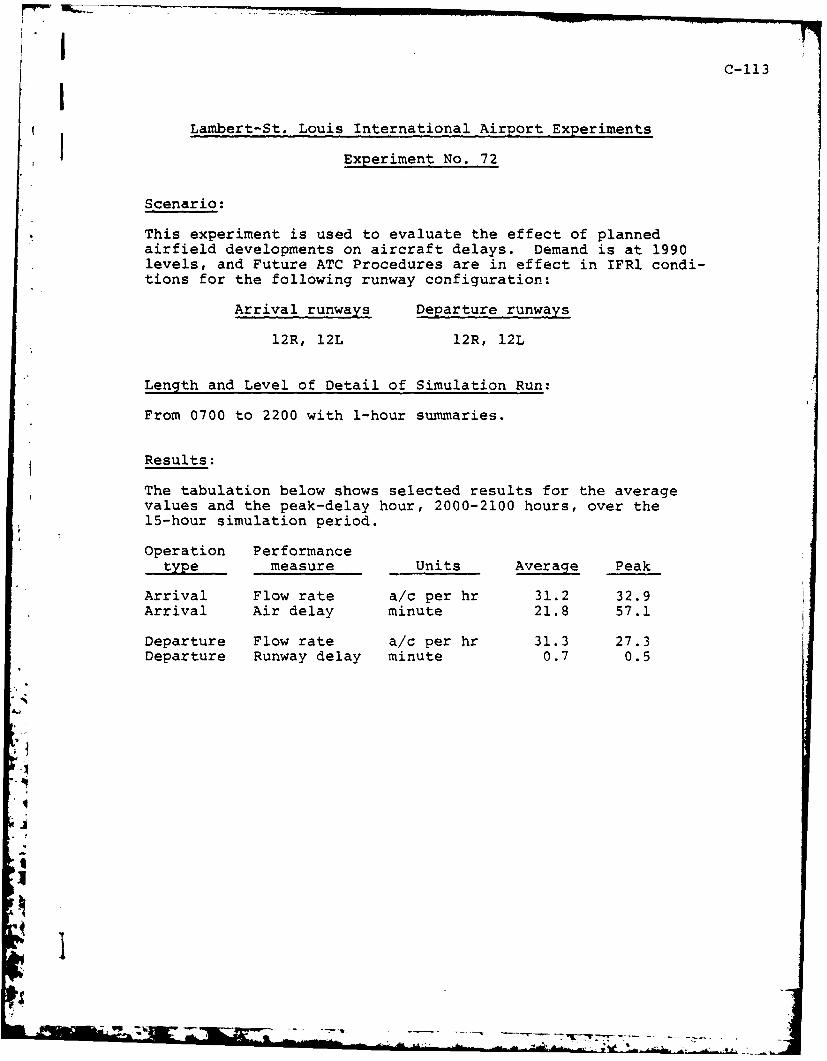
77'C-113I
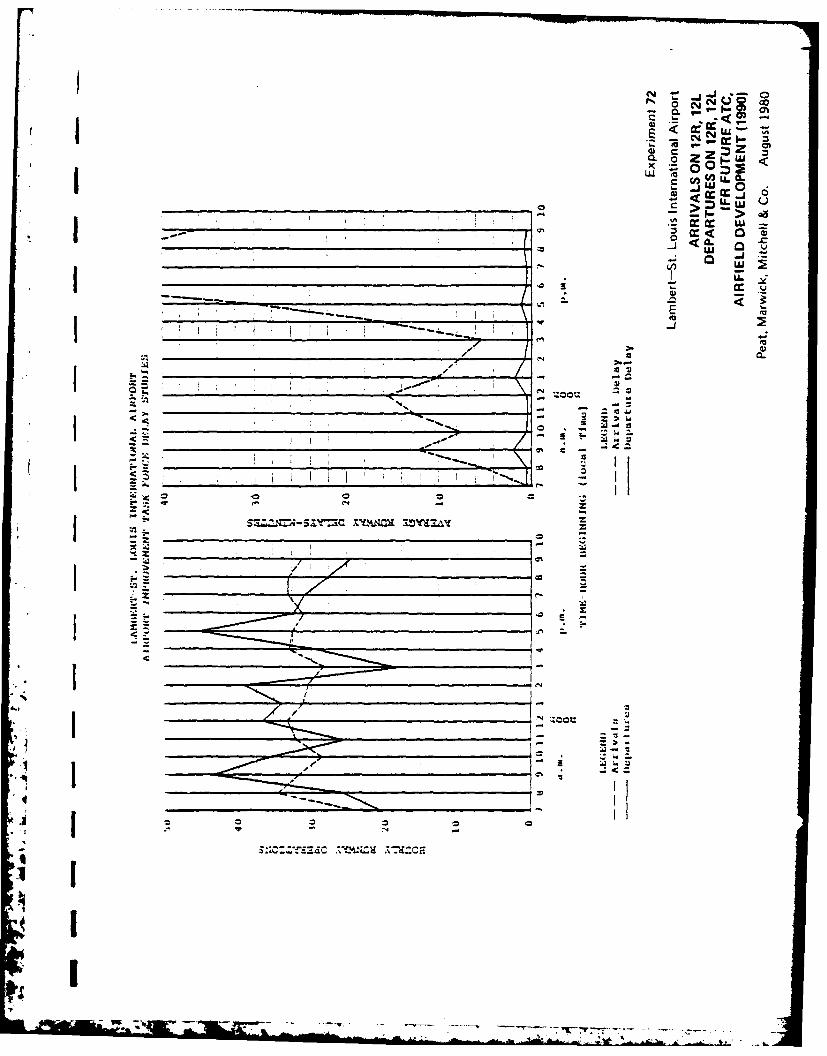
Lambert-St. Louis International Airport.Experiments
Experiment No. 72
Scenario:
This experiment is used to evaluate the effect of plannedairfield developments on aircraft delays. Demand is at 1990levels, and Future ATC Procedures are in effect in IFR1 condi-tions for the following runway configuration:
Arrival runways Departure runways
12R, 12L 12R, 12L
Length and Level of Detail of Simulation Run:
From 0700 to 2200 with 1-hour summaries.
Results:
The tabulation below shows selected results for the averagevalues and the peak-delay hour, 2000-2100 hours, over the15-hour simulation period.
Operation Performancetype measure Units Average Peak
Arrival Flow rate a/c per hr 31.2 32.9Arrival Air delay minute 21.8 57.1
Departure Flow rate a/c per hr 31.3 27.3Departure Runway delay minute 0.7 0.5
i
(S-" - -
) U) V)LLC
_* jUJ 0
-I! >@L w
cr. *
61
SMI =='A-Z'f -lC Vh Z(a-a
zc-t0
AL/
Attachment D
ASSUMPTIONS
pl

D-1
ASSUMPTIONS
The assumpti-n and inputs used in performing the simulationexperiments for the Lambert-St. Louis International AirportImprovement Task Force Delay Study were presented in DataPackage No. 5. The following contains additions and revisionsto those assumptions and inputs.I1. Separations on Parallel Runways (Present ATC Rules)
Arrival-Arrival Air Separation (nautical miles). Theaverage time separation between successive arrivals as theycross the runway threshold.
VFRTrail Aircraft ClassA B C D
Lead A 1.8 1.8 1.8 1.8Aircraft B 1.8 1.8 1.8 1.8Class C 1.8 1.9 3.0 3.1
D 5.3 5.5 4.7 3.9
IFRTrail Aircraft ClassA B C D
Lead A 3.2 3.2 4.1 4.2Aircraft B 3.2 3.2 4.1 4.2Class C 4.2 4.2 3.6 3.6
D 6.8 7.0 5.3 4.6
Departure-Dearture Air Separation (seconds). The averagetime separation between successive departures (on the samerunway) as they start their takeoff roll.
Different Flight Tracks
VFR and IFRl (above 800/2)
Trail Aircraft ClassA B C D
- Lead A 46 38 45 50Aircraft B 39 38 45 50Class C 40 38 45 50
D 120 120 120 70
'i

D-2
IFR2 (800/2 - 300/0.75)
Trail Aircraft ClassA B C D
Lead A 62 65 70 72Aircraft B 51 55 61 63Class C 50 55 60 62
D 120 120 120 80
IFR3 (below 300/0.75): Same as separations forsame flight track.
Same Flight Track
All weather categories
Trail Aircraft ClassA B C D
Lead A 79 93 95 95Aircraft B 62 70 77 77Class C 60 60 74 74
D 120 120 120 90
2. Separations for Two Intersecting Runways
Departure-Arrival Separation for Intersecting Runways(nautical miles). The average time for a departing aircraftto clear the intersection of runways.
Existing Airfield Layout
Departure-arrival separation between lead aircraft onRunway 30R and trail aircraft on Runway 24.
Trail Aircraft ClassA B C D
Lead A 1 .6 a 1.6 1.7 1.9Aircraft B 1 . a 1.5 1.6 1.7Class C 1 .4a 1.4 1.5 1.6
D 1 .4a 1.4 1.5 1.6
a. These separations are assumed to bezero in VFR weather.
Le '^lr T -

* 1D-3
Departure-arrival separation between lead aircraft on* Runway 30L and trail aircraft on Runway 24.
Trail Aircraft Classa B a C D
Lead A 1 .8 a 1 .8a 1.8 1.9Aircraft B 1 .8 a 1 8a 1.8 1.9Class C 1.6 a 1 .6 a 1.6 1.8
D 1 .6 1 . 6 1.6 1.8
a. These separations are assumed to bezero in VFR weather.
Airfield Development
Departure-arrival separation between lead aircraft onRunuay 30R and trail aizcraft on Runway 24.
Trail Aircraft ClassA B C D
Lead A 1 .8b 2.3 2.5 2.7Aircraft B 1 7 b 2.1 2.3 2.5Class C 1 .4b 1.7 1.9 2.1
D 1.4 1.7 1.9 2.1
Departure-arrival separation between lead aircraft onRunway 30L and trail aircraft on Runway 24.
Trail Aircraft ClassA B C D
Lead A 1 .7b 2.2b
Aircraft B 1 5 b 1 9b 2.0 2.2Class C 1 4 b 1 7b 1.8 2.0
D 1.4 1.7 1.8 2.0
b. These separations are assumed to bezero in VFR weather.
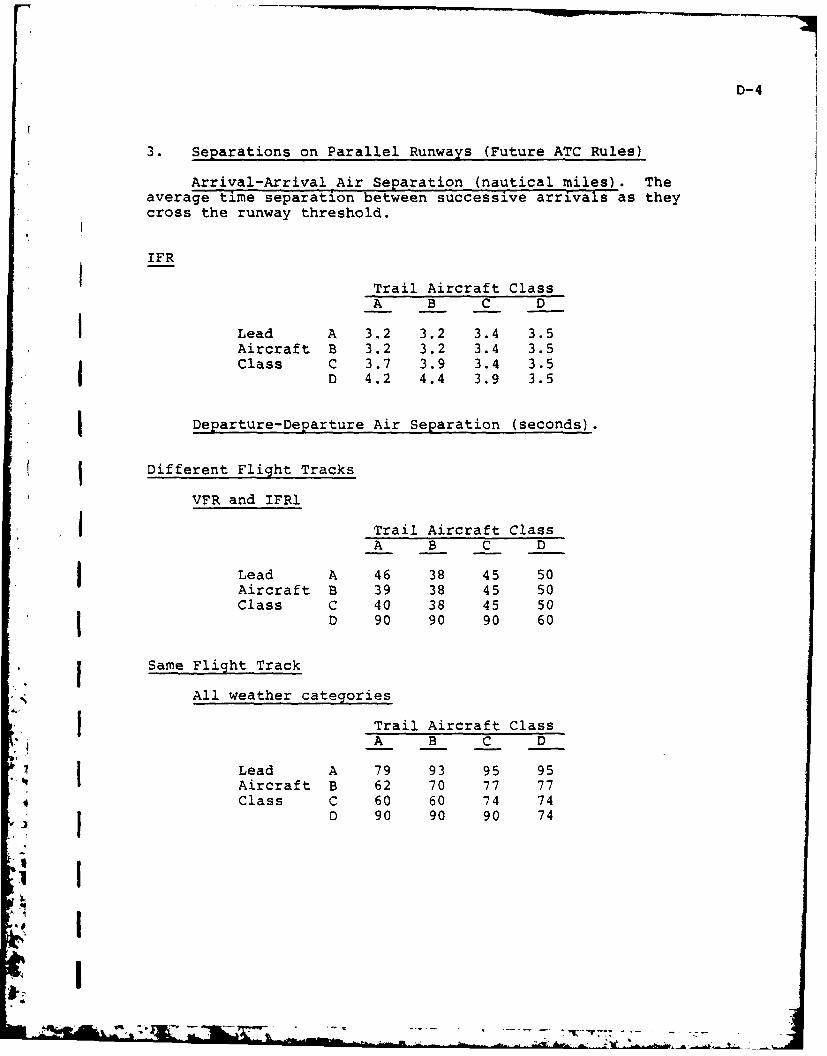
D-4
3. Separations on Parallel Runways (Future ATC Rules)
Arrival-Arrival Air Separation (nautical miles). Theaverage time separation between successive arrivals as theycross the runway threshold.
IFRI -Trail Aircraft ClassA B C D
I Lead A 3.2 3.2 3.4 3.5Aircraft B 3.2 3.2 3.4 3.5Class C 3.7 3.9 3.4 3.5
D 4.2 4.4 3.9 3.5
I Departure-Departure Air Separation (seconds).
I Different Flight Tracks
VFR and IFRl
ITrail Aircraft ClassA B C D
Lead A 46 38 45 50Aircraft B 39 38 45 50Class C 40 38 45 50
I 90 90 90 60
.ISame Flight Track
All weather categories
I Trail Aircraft ClassA B C D
Lead A 79 93 95 95Aircraft B 62 70 77 77
Class C 60 60 74 74J D 90 90 90 74
i i
i' I
TZ

D-5
4. Arrival Runway Occupancy Times (seconds)
The average elapsed time between the time an arrival crossesthe runway threshold and the time when it clears the runway.These data have been coordinated with St. Louis control towerstaff.
Existing Airfield Layout
Weighted averageAircraft Runway occupancy (seconds)Class 30R 30L
A 36 35B 47 44C 52 49D 56 55
Weighted averageAircraft Runway occupancy (seconds)Class 12L 12R
A 34 40B 44 43C 56 45D 61 50
Weighted averageAircraft Runway occupancy (seconds)Class 24 17
A 48 35B 45 --
C 52 -
D 59 -
Airfield Development
Weighted averageAircraft Runway occupancy (seconds)Class 30R 30L
A 37 35B 47 43C 52 49D 59 56

D-6
Weighted averageAircraft Runway occupancy (seconds)Class 12L 12R
A 34 40B 44 43C 56 45D 61 50
5. Runway Assignments
I The following tables show runway assignments assumed for allexperiments, for the existing and airfield development layouts.I
I
i II
i
I
I.
IN

D-7
Table D-.
RUNWAY ASSIGNMENT--EXISTING AIRFIELD LAYOUT* 1Perzent of aircraft
Experiment Arrivals DeparturesNo. Runway A B c D A B _ D_
1, IA, 26 12L 90 70 35 -- 90 70 35 --
12R 10 30 65 100 10 30 65 100
2, 27 12L -- -- -- -- 100 100 35 --
12R 100 100 100 100 .. .. 65 100
3, 28 12L .. .. .. .. 100 100 35 --
12R 100 100 100 100 .. .. 65 100
4, 4A, 29 30R 90 70 35 -- 90 70 35 --
30L 10 30 65 100 10 30 65 100
5, 30 30R .. .. .. .. 100 100 35 --
30L 100 100 100 100 .. .. 65 100
6, 31 30R .. .. .. .. 100 100 35 --
30L 100 100 100 100 .. .. 65 100
7A, 32A 30R -- 70 35 -- 90 70 35 --
30L -- 30 65 100 10 30 65 10024 100 .. .. .. .. .. .. ..
7, 32 30R .. .. .. .. 100 100 30 --
30L .. .. 100 100 .. .. 70 10024 100 100 .. .. .. .. .. ..
8 6 .. .. .. .. .. 20 80 --
12L 90 70 20 -- 100 80 20 --
12R 10 30 80 100 .. .. .. 100
9, 33 6 .. .. .. .. .. 20 70 --
12L .. .. .. .. 100 80 30 --
128. 100 100 100 100 -- - - 100
'1 10 6 .. .. .. .. .. 20 80 --
12L .. .. .. .. 100 80 20 --
12R 100 100 100 100 -- - - 100
11 24 100 100 100 100 100 100 100 100
12 12L -- 90 35 -- 100 90 30 --
12R -- 10 65 100 -- Ic 70 10017 100 .. .. .. .. .. .. ..
13, 34 12L .. .. .. .. 100 100 30 --
12R -- 100 100 100 .. .. 70 10017 100 .. .. .. .. .. .. ..

ID-8
Table D-2
* RUNWAY ASSIGNMENT--AIRFIELD DEVELOPMENT LAYOUT
Percent of aircraftArrivals Departures
Experiment No. Runway A B c D A B C D
35, 35A ,35B 12L 50 50 50 50 50 50 50 5044, 51, 51A, 12R 50 50 50 50 50 50 50 5051B, 63
36, 52, 72 12L .. .. .. .. 100 100 100 10012R 100 100 100 100 .. .. .. ..
38, 55 30R .. .. .. .. 100 100 100 10030L 100 100 100 100 .. .. .. ..
39A, 57A 30R 50 50 30 50 35 35 35 3530L .. .. 10 50 65 65 65 6524 50 50 60 .. .. .. .. ..
39, 57 30R .. .. .. .. 100 100 80 8030L .. .. 100 100 .. .. 20 2024 100 100 .. .. .. .. .. ..
40, 58 6 .. .. .. .. 60 60 60 --
12L .. .. .. .. 40 40 40 10012R 100 100 100 100 .. .. .. ..
41, 60 30R 50 50 50 so 50 50 50 5030L 50 50 50 O 50 50 50 50
42, 61 30R .. .. 50 50 50 50 50 5030L .. .. 50 so 50 50 50 5024 100 100 .. .. .. .. .. ..
43, 62 6 .. .. .. .. 60 60 60 --
12L 50 50 50 50 20 20 20 5012R 50 50 so 50 20 20 20 50
64 12L 50 50 50 50 50 50 50 5012R 50 50 50 50 50 50 50 50
64A 12L -- 80 40 40 100 80 30 3012R -- 20 60 60 -- 20 70 7017 100 .. .. .. .. .. .. ..
- -,- - -..-- V . , .-...--. . ---

D-9
6. Effect of Weather Conditions on Demand
j It is assumed that during IFRi weather, 57% of general aviationClass A operations and 37% of general aviation Class B operationswould not occur. During IFR2 weather, it is assumed that 86%I of general aviation Class A operations, 63% of general aviationClass B operations, and 100% of the military operations wouldnot occur.
7. Localizer Directional Aid (LDA) Operations
In LDA experiments, IFRl separations are utilized, and thearrivals on parallel runways are assumed to be independent,with the exception of wake turbulence dependency. When thereis a third arrival stream on Runway 24, it is assumed that onlyClass A arrivals occur on this runway and will hold short ofRunway 30R. Therefore, the three arrival streams are assumedto be independent.
8. Noise Abatement Scenarios
There are three scenarios studied for two runway uses in VFR:Runways 12L and 12R and Runways 30L and 30R, with the existingairfield layout. The simulation runs are performed withoutstretching the arrival gaps. In scenarios 2 and 3, thenoise abatement procedure is not in effect during the departurepeak hour (2 p.m. local time).
Scenario 1. In this scenario, the departures on bothrunways are assumed to make their turns as soon as theaircraft is airborne and stabilized.
Scenario 2. In this scenario, the departures on Runway 12L(or 30R are assumed to make their turns as soon as the aircraft
Ap is airborne and stabilized. Departures on Runway 12R (or 30L)are assumed to go straight out until they reach an altitude of1,500 feet AGL* (2,000 feet MSL**).
Scenario 3. In this scenario, the departures on bothrunways are assumed to follow the same flight path until they
* reach an altitude of 1,500 feet AGL (2,000 feet MSL).
*Above ground level.**Mean sea level.
m ini-V *- ~~---- -----. ~ ~ -- ~ - * - : - -- --- *-* -
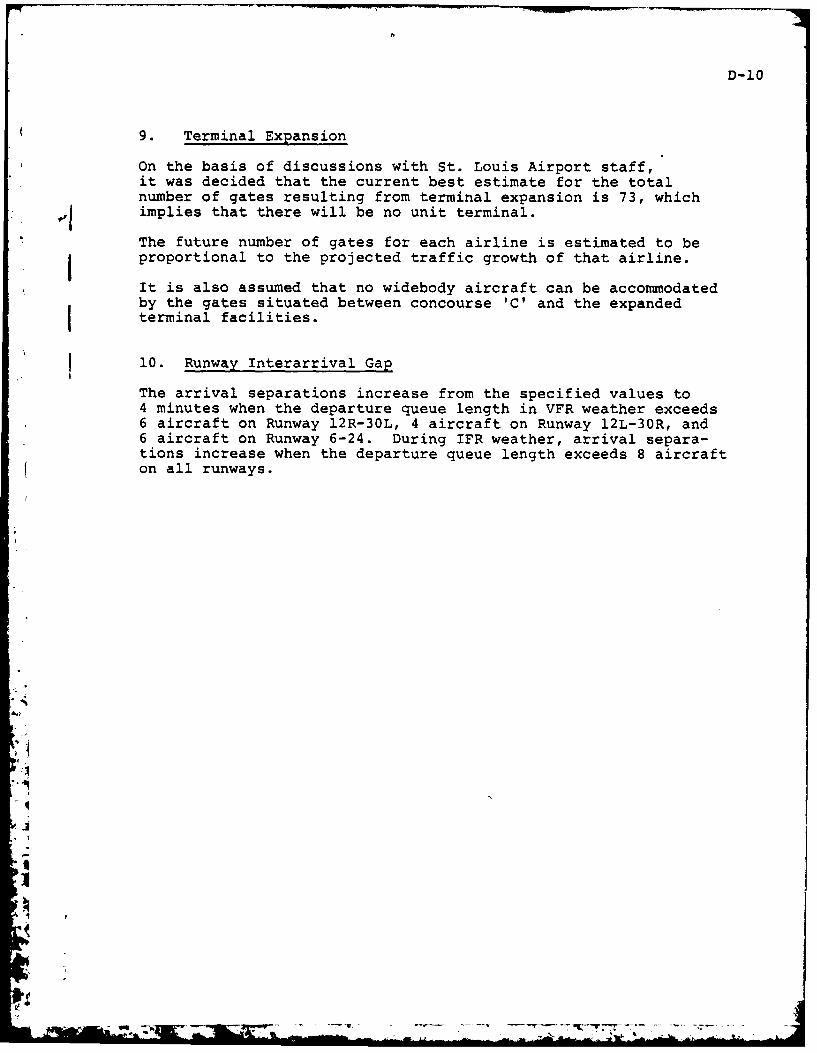
D-10
9. Terminal Expansion
On the basis of discussions with St. Louis Airport staff,it was decided that the current best estimate for the totalnumber of gates resulting from terminal expansion is 73, which4I implies that there will be no unit terminal.
The future number of gates for each airline is estimated to beproportional to the projected traffic growth of that airline.
It is also assumed that no widebody aircraft can be accommodatedby the gates situated between concourse 'C' and the expandedterminal facilities.
10. Runway Interarrival Gap
The arrival separations increase from the specified values to4 minutes when the departure queue length in VFR weather exceeds6 aircraft on Runway 12R-30L, 4 aircraft on Runway 12L-30R, and6 aircraft on Runway 6-24. During IFR weather, arrival separa-tions increase when the departure queue length exceeds 8 aircrafton all runways.
AI
46
_2

,TLJTE
Related Documents