UNCLASSIFIED ~?I I AD 403 534 DEFENSE DOCUMENTATION CENTER FOR SCIENTIFIC AND TECHNICAL INFORMATION CAMERON STATION. ALEXANDRIA. VIRGINIA UNCLASSIFIED

Welcome message from author
This document is posted to help you gain knowledge. Please leave a comment to let me know what you think about it! Share it to your friends and learn new things together.
Transcript

UNCLASSIFIED~?I I
AD 403 534
DEFENSE DOCUMENTATION CENTERFOR
SCIENTIFIC AND TECHNICAL INFORMATION
CAMERON STATION. ALEXANDRIA. VIRGINIA
UNCLASSIFIED

NOTICE: When government or other drawings, speci-fications or other data are used for any purposeother than in connection with a definitely relatedgovernment procurement operation, the U. S.Government thereby incurs no responsibility, nor anyobligation whatsoever; and the fact that the Govern-ment may have formulated, furnished, or in any waysupplied the said drawings, specifications, or otherdata is not to be regarded by implication or other-vise as in any manner licensing the holder or anyother person or corporation, or conveying any rightsor permission to manufacture, use or sell anypatented invention that my in any way be relatedthereto.
II

APGC-TDR-63-19 Vol 1
9 Firefly III, Sounding Rocket"I Launching Report
Launch Facility, Vehicles, and Data Reduction
"(33 Vehicles Launched 15 October-15 December 1962)by William K. Vickery
APGC Technical Documentary Report No. APGC-TDR-63-19 Vol 1APRIL 1963 APGC Project No. 4984WI
DDC..'r;3
MAY 141963FI-7MU JU 1
TISIA R
DEPUTY FOR AEROSPACE SYSTEMS TEST CNES~~AIR PROVING GROUND CENTEERR:::;:
AIR FORCE SYSTEMS COMMAND* UNITED STATES AIR FORCE
EGLIN AIR FORCE BASE, FLORIDA

Qualified requesters may obtain copies from ASTIA. Orders will beexpedited if placed through the librarian or other person designated torequest documents from ASTIA.
When US Government drawings, specifications, or other data are usedfor any purpose other than a definitely related government procurementoperation, the government thereby incurs no responsibility nor any obli-gation whatsoever; and the fact that the government may have formulated,furnished, or in any way supplied the said drawings, specifications, orother data is not to be regarded by implication or otherwise, as in anymanner licensing the holder or any other person or corporation, or con-veying any rights or permission to manufacture, use, or sell any patentedinvention that may in any way be related thereto.
Do not return this copy. Retain or destroy.
APGC-TDR-63-19
FOREWORD
This report, consisting of Volumes 1 and 2, describes the sounding
rockets, ballistic computations, range support, and the launch and flightdata obtained by the Air Proving Ground Center under APGC Project4984W1, Firefly III. Thirty-three sounding rockets were launched insupport of a basic research program directed by the Air Force Cam-bridge Research Laboratories. This project was conducted under theauthority of AFCRL/AFOAR Form 613 for Project 4984, AtmosphericChemical Physics (Firefly III).

APGC-TDR-63-19
Catdo crd my b fmW in th, back of thi doomeat.
ABSTRACT
Thirty-three sounding rockets (15 Nike-Cajun, 4 Nike-Apache,9 Honest John-Nike-Nike, and 5 Aerobee 150) were launched from theAerospace Launching Facility, Eglin Gulf Test Range, Florida. Theselaunchings were conducted in support of Project Firefly III, directed bythe Geophysics Research Directorate, Air Force Cambridge ResearchLaboratories, Office of Aerospace Research.
The overall report, consisting of Volumes 1 and 2, describes thesounding rockets, ballistic computations, range support, and the launchand flight data obtained. Specifically, Volume 2 presents only the theo-retical and empirical vehicle trajectory data tabulated at the Air ProvingGround Center.
Thirty-one rockets provided trajectories which were sufficient tomeet the scientific requirements. Two Nike-Cajun flights were unsatis-factory.
The maximum altitude predictions averaged approximately 3 percenthigh for the Aerobee 150's, 6 percent high for the Honest John-Nike-Nike's, and 7 percent high for the Nike-Cajun's. The maximum altitudepredictions were also satisfactory for the Nike-Apache rockets.
PUBLICATION REVIEWThis technical documentary report hae been reviewed and ia Y"poved.
A. T. CULBERTSONBtigadir General, USAPVice Commadr
S~iii

APGC.TDR-63-19
CONTENTS
Section Page
1.* INTRODUCTION I...... **,,***., *
2. SOUNDING ROCKETS, FIN SURVEY AND DATA RE-DUCTION, AND TRACKING AIDS ............. 1
Sounding Rockets ...............
Fin Survey and Data Reduction .**..*..**oo*..*.. 7TrackingAids ...*******o********************* 9
3. BALLISTIC COMPUTATIONS o e oeoeogge **.o********. 11Dispersion Studies see 00000 66000*6990.......... * 11Trajectory Predictions *age *see ooo............. 11Impact Predictions seg.. osoooseoooooooo 18Safe Impact Prediction Charts *.....,............ 18,
4. LAUNCH FACILITIES .. s.o.qo.o.qo.s.. ooo.ooqooooo* 235. EGTR TECHNICAL FACILITIES *...o ...o..... oooe.ooo 24
Aerobee 150 o......o............. 000*000000000000 24Honest John-Nike-Nike *...........,.......*.*** 24
N ike-Apache .................................. 27
6o RANGE WEATHER SUPPORT *..,................... 277o DATA REDUCTION o*.,oooqqoooqooooeossqo*oqoooo. 28
Phototheodolite Data *0,0*00000000000000000000,* 28
Radar Data oo*................................* 28Tabular Data *.....o..o...o......o.......*..*** 28Plotted Data o.......*.o.....o.o..o... .......... 29
Data Summary *505000000050000041
Vehicle Tracking *.......0.eo~.s.41
Vehicle Performance *............ 42Vehicle Performance Predictions *.,6060099009096 43
REFERENCES *................* 6
ILLUSTRATIONS AND TABLES
Figure Page
10 Aerobee 150 Vehicle and Payload Configurations .... 32. Honest John-Nike-Nike Vehicle and Payload Configu-
rations *........g~ssseseseOs0 5
iv

APGC-TDR-63- 19
ILLUSTRATIONS AND TABLES (Continued)
Figure Fage
3, Nike-Apache Vehicle and Payload Configuration,,,,a,, 64. Nike- Cajun Vehicle and Payload Configurations...,,,,. 85o Cajun Tabs **** 0** *0.***.***** 0****00 so 0000*0 96. Typical Flare Installation .... go************** ****,* 107. Aerobee 150 Range and Maximum Altitude vs. Launch
Angle for Various Payload Weights .,,,,,,,,,,,#,, 12
8. Honest John-Nike-Nike Range and Maximum Altitudevs. Launch Angle for Various Payload Weights ,.... 13
9. Nike-Apache Range and Maximum Altitude vs. LaunchAngle for Various Payload Weights .....***.****** 14
10. Nike-Cajun Range and Maximum Altitude vs. LaunchAngle for Various Payload Weights. (Small or noTabs) ** * * * . * *. . . * * * * * * * * * * * 15
11. Nike-Cajun Range and Maximum Altitude vs. LaunchAngle for Various Payload Weights (6-rps Tabs) .,.. 16
12. Nike- Cajun Range and Maximum Altitude vs. LaunchAngle for Various Payload Weights (6-rps Tabs,KD+ I00/) ........ ,.o ..... o , ** * o. **. 17
13. Aerobee 150 - Predicted Safe Impact Area ., .*,.. 1914. Honest John-Nike-Nike, Stage III, 300-lb Payload -
Predicted Safe Impact Area .***,,,*************** 2015. Nike-Apache - Predicted Safe Impact Area .***,,,.*** 2116, Nike-Cajun with 6-rps Tabs - Predicted Safe Impact
Area *o e o o e ee o o e o o e oe e e **e * 22
17. Aerospace Launching Facility ......... 0.0.....**** 2518. EGTR, Technical Facilities - January 1963 .... .0.. 2619. Sounding Rocket Actual Maximum Altitude Deviation
from Predicted Altitude .. , .... .0 3020. AFCRL Chemical Release Positions vs. Wind-Weighted
Theoretical Trajectories. Aerobee 150 (Karen andLaura) ******* .*********************** **** *** * 31
21. AFCRL Chemical Release Positions vs. Wind-WeightedTheoretical Trajectories. Aerobee 150 (Fanny andGilda) *** * ** * * ** * * * ** ** * ** 32
22. AFCRL Chemical Release Positions vs. Wind-WeightedTheoretical Trajectories. Honest John-Nike-Nike(Mabel, Dinah, Eva, Netty, Olga, Lisa, and Patsy).* 33
23, AFCRL Chemical Release Positions vs. Wind-WeightedTheoretical Trajectories. Nike-Apache. (Terry andSharon) **ego** 34
v

APGC-TDR-63-19
ILLUSTRATIONS AND TABLES (Continued)
Figure Fage
24. AFCRL Chemical Release Positions vs. Wind-WeightedTheoretical Trajectories. Nike-Apache (Ivy andEsther) **.*.o.. o....,. o..*.....ooo...eo.o.... • 35
25. AFCRL Chemical Release Positions vs. Wind-WeightedTheoretical Trajectories. Nike-Cajun (Alice,Queenie, and Paula) *.,,,,...,o..,,,......0.....0 36
26. AFCRL Chemical Release Positions vs. Wind-WeightedTheoretical Trajectories. Nike-Cajun. (Ruby, Sally,and Beverly) ,,,,,,,. ... ,.,,,,,,,.......,,,,,, 37
27. AFCRL Chemical Release Positions vs. Wind-WeightedTheoretical Trajectories. Nike-Cajun. (Bonny, Dag.mar, Cindy and Enid) 0.000000000..0000000,00.. 000 38
280 AFCRL Chemical Release Positions vs. Wind-WeightedTheoretical Trajectories. Nike-Cajun. (Louise andKitty) ,,,0 .. ,,.,,,,,, 0 . , , ...*0 0 . ,,,,,,.,,a ,,,,,.,,,, a0 00 06 39
29. Sign Convention for Spin Tab Installation ,,.. o&a , 4030. Aerobee 150 (Karen) Altitude vs, Time (Entire Tra-
je~ctory) ,.,.,,,,,,,,,, .... , ., ..... ,,,,,,.,,,,, 59
31. Aerobee 150 (Karen) Range vs. Displacement (EntireTrajectory) .,. , 0 ...... 0 ,. .... 0* ,00 ,,,.,.,0 ..000 .0.0 60
320 Aerobee 150 (Karen) Velocity vs. Time (Entire Tra-jectory) o.. , ....g ,. ,. , ..... see..,..,.,,,.,...og oooe 61
33. Aerobee 150 (Laura) Altitude vs. Time (Entire Tra-jectory) .,.....,..,...... o,, ... ,. ........ ,,,. b2
34. Aerobee 150 (Laura) Altitude vs. Time (TrajectoryThrough Burnout) .....*..... ... #,....,,,.,. ,,....* 63
35o Aerobee 150 (Laura) Range vs. Displacement (EntireTrajectory) ... ...... , .a a......... . ..... .... 64
36. Aerobee 150 (Laura) Range vs. Displacement (Tra-jectory Through Burnout) ......... .,,...,,,,,, 65
37. Aerobee 150 (Laura) Velocity vs, Time (Entire Tra-jectory) .,,................, ..... ,..,,,...... 66
38o Aerobee 150 (Laura) Velocity vs, Time (TrajectoryThrough Burnout) ,,,. ... , . .,......,,,.,., *.* 67
39. Aerobee 150 (Martha) Altitude vs, Time (Entire Tra-jectory) .. , ....... ............ ,..,...... .... 68
40. Aerobee 150 (Martha) Altitude vs. Time (TrajectoryThrough Burnout) ... . ..... .aa,..,. . .,.,,, 69
41o Aerobee 150 (Martha) Range vs. Displacement (EntireTrajectory) .***... * Goo 0@090 69000000 * Soo *00 99660 70
vi

APGC-TDR-63-19
ILLUSTRATIONS AND TABLES (Continued)
Figure Fage
42. Aerobee 150 (Martha) Range vs. Displacement (Tra-jectory Through Burnout) ,oo,**o,,e...... **OB 71
43, Aerobee 150 (Martha) Velocity vs. Time (Entire Tra-jectory) ,o***o.,o,.**.,. * 00..00,**72
44. Aerobee 150 (Martha) Velocity vs. Time (TrajectoryThrough Burnout) .o,,oooo.o.**o,,oo..ooo.oo,,,.. 73
45, Aerobee 150 (Fanny) Altitude vs. Time (Entire Tra-jectory) , o* * * , , * o oo* * , * ** * ** 74
46. Aerobee 150 (Fanny) Range vs. Displacement (EntireTrajectory) **.,.,,...,.,,,,.* ,**,,,. 75
47. Aerobee 150 (Fanny) Velocity vs. Time (Entire Tra-jectory) . o ... .. .. *.,S o*S S.o.. .. 76
48. Aerobee 150 (Gilda) Altitude vs. Time (Entire Tra-jectory) see* oso s** 0*** 00******* as*********see****00* 77
49. Aerobee 150 (Gilda) Range vs. Displacement (EntireTrajectory) .,o.,o.oo,.,.**o,,,o 78
50. Aerobee 150 (Gilda) Velocity vs. Time (Entire Tra-jectory) ********SS ******* SSSSS******* S **SS S 79
51. Honest John-Nike-Nike (Ethel) Altitude vs. Time (En-tire Trajectory) ,o,,ooo,,,o, . .****** 80
52. Honest John-Nike-Nike (Ethel) Altitude vs. Time (Tra-jectory Through Burnout) ,,. .,,,,,,,,,,,,,,, 81
53. Honest John-Nike-Nike (Ethel) Range vs. Displacement(Entire Trajectory) @.s.afe .... . . *@Soo.****.ses* 82
54. Honest John-Nike-Nike (Ethel) Range vs. DisplacementTrajectory Through Burnout) ........ ****.******** 83
55, Honest John-Nike-Nike (Ethel) Velocity vs. Time (En-tire Trajectory) ,,**.o .oo * . .** 84
56, Honest John-Nike-Nike (Ethel) Velocity vs. Time (Tra-jectory Through Burnout) .,.....0.*000*.*.,,,,,,, 85
57. Honest John-Nike-Nike (Dinah) Altitude vs. Time (En-tire Trajectory) o ,.oo. * .. ******.. *.. 86
58. Honest John-Nike-Nike (Dinah) Altitude vs. Time (Tra-jectory Through Burnout) **,so** o******** .***** 87
59. Honest John-Nike-Nike (Dinah) Range vs. Displacement(Entire Trajectory) S. ,**.e,,.......... 88
60. Honest John-Nike-Nike (Dinah) Range vs. Displacement(Trajectory Through Burnout) ... ,...,..,...,,00 . 89
61. Honest John-Nike-Nike (Dinah) Velocity vs. Time (En-tire Trajectory) ... ooo.ooo..o*ooooeoooooooS SSSOS 90
vii

APGC-TDR-63- 19
ILLUSTRATIONS AND TABLES (Continued)
Figure Page
62. Honest John-Nike-Nike (Dinah) Velocity vs. Time (Tra-jectory Through Burnout) ........... 91
63. Honest John-Nike-Nike (Eva) Altitude vs. Time (En-tire Trajectory) ................. .. 92
64. Honest John-Nike-Nike (Eva) Altitude vs, Time (Tra.jectory Through Burnout) .................... 93
65. Honest John-Nike-Nike (Eva) Range vs. Displacement(Entire Trajectory) ......... 0 .0 .0..... ......... 94
66. Honest John-Nike-Nike (Eva) Range vs. Displacement(Trajectory Through Burnout) 00000000.....0..... 95
67. Honest John-Nike-Nike (Eva) Velocity vs. Time (En-tire Trajectory) ...... . .. ........ 96
68. Honest John-Nike-Nike (Eva) Velocity vs. Time (Tra-jectory Through Burnout) *........0.. 0.0... sop 97
69. Honest John-Nike-Nike (Netty) Altitude vs. Time (En-tire Trajectory) ............ ...... 98
70. Honest John-Nike-Nike (Netty) Altitude vs. Time (Tra-jectory Through Burnout) ........... * 99
71. Honest John-Nike-Nike (Netty) Range vs. Displacement(Entire Trajectory) 0090..0000 ...... ........... 100
72. Honest John-Nike-Nike (Netty) Range vs. Displacement(Trajectory Through Burnout) 00000....0..000..0. 101
73. Honest John-Nike-Nike (Netty) Velocity vs. Time (En-tire Trajectory) ...... o .... 0 0 .#00 a00 0a& o 00 000 102
74o Honest John-Nike-Nike (Netty) Velocity vso Time (Tra-jectory Through Burnout) ........... a.............9 0 * 0 103
75. Honest John-Nike-Nike (Olga) Altitude vs. Time (En-tire Trajectory) ooeoo..o..o.ooo...oooo..o.oe~goosoo 104
76, Honest John-Nike-Nike (Olga) Altitude vs. Time (Tra-jectory Through Burnout) ........................ go 105
77. Honest John-Nike-Nike (Olga) Range vs. Displacement(Entire Trajectory) 0000000.000 ..... .............. 106
78, Honest 3ohn-Nike-Nike (Olga) Range vs. Displacement(Trajectory Through Burnout) o ................... o 107
79. Honest John-Nike-Nike (Olga) Velocity vs. Time (En-tire Trajectory) ... ..... o.o..*..*....... .o..o .... 108
80. Honest John-Nike-Nike (Olga) Velocity vs. Time (Tra-jectory Through Burnout) o~*.................... 109
81. Honest John-Nike-Nike (Lisa) Altitude vs. Time (En-tire Trajectory) .. ... ..... ...... 1 10
viii
AFGC-TDR-63-19
ILLUSTRATIONS AND TABLES (Continued)
Figure Page
82. Honest John-Nike-Nike (Lisa) Altitude vs. Time (Tra-jectory Through Burnout) ,*,,**0*****000,.,,****. ill
83. Honest John-Nike-Nike (Lisa) Range vs. Displacement(Entire Trajectory) .. 11, .o..,.,..,,o...., 112
84. Honest John-Nike-Nike (Lisa) Range vs. Displacement(Trajectory Through Burnout) .. ,,o,,oo,,****ooo,, 113
85. Honest John-Nike-Nike (Lisa) Velocity vs. Time (En-tire Trajectory) **o,** ooo,,***ego* 114
86. Honest John-Nike-Nike (Lisa) Velocity vs. Time (Tra-jectory Through Burnout) ,,,****,******o,,******,, 115
87. Honest John-Nike-Nike (Patsy) Altitude vs. Time (En-tire Trajectory) ************1****.*************** 116
88. Honest John-Nike-Nike (Patsy) Altitude vs. Time (Tra-jectory Through Burnout) 1........******.****.*** 117
89. Honest John-Nike-Nike (Patsy) Range vs. Displacement(Entire Trajectory) **1************************** 118
90. Honest John-Nike-Nike (Patsy) Range vs. Displacement(Trajectory Through Burnout) ,*************,***** 119
91. Honest John-Nike-Nike (Patsy) Velocity vs. Time (En-tire Trajectory) ....oooooooosee..... **o,*** 120
92. Honest John-Nike-Nike (Patsy) Velocity vs. Time (Tra-jectory Through Burnout) 0..********************* 121
93. Nike-Cajun (Alice) Altitude vs. Time (Trajectory ThroughBurnout) ************* e *e **..... ooo*o*o@****&*e 122
94o Nike-Cajun (Alice) Range vs, Displacement (Trajectory
Through Burnout) .* . 0*********** ****** ******** 123950 Honest John-Nike-Nike (Alice) Velocity vs. Time
(Trajectory Through Burnout) ,,,,,,*ooe,**e*** 124
96. Nike-Cajun (Brenda) Altitude vs. Time (TrajectoryThrough Burnout) a 0oooo**oooooo, a**o,*oo**** 125
97o Nike-Cajun (Brenda) Range vs. Displacement(Trajectory Through Burnout) ******************* 126
98o Nike-Cajun (Brenda) Velocity vs, Time (TrajectoryThrough Burnout) ooo **oooo.o,,,.***,ooooooo 127
99o Nike-Cajun (Brenda) Velocity vs, Time (Entire Tra-jectory) e oeoooeoooo***ooooooo,*o,,oessooso***0 128
100. Nike-Cajun (Ruby) Altitude vs. Time (TrajectoryThrough Burnout) oo.oo ,,oo .oo ...o o 0 o,,.o o*o0o, 129
101. Nike-Cajun (Ruby) Range vs, Displacement (EntireTrajectory) o .oe**** **** ********* * ****** *o*** 130
ix

APGC-TDR-63- 19
ILLUSTRATIONS AND TABLES (Continued)
Figure Page
102. Nike-Cajun (Ruby) Velocity vs. Time (Entire Tra-jectory . . . . . . . . . . . . . . . . . . .. 131
103. Nike-Cajun (Ruby) Velocity vs. Time (TrajectoryThrough Burnout) .............. ..... . ......... 132
104. Nike-Cajun (Sally) Altitude vs. Time (TrajectoryThrough Burnout) .............................. 133
105. Nike-Cajun (Sally) Range vs. Displacement (TrajectoryThrough Burnout) ... . 0. .. . ... ............. . 134
106. Nike-Cajun (Sally) Velocity vs. Time (TrajectoryThrough Burnout) ........... ......... .... ..... 135
107. Nike-Cajun (Beverly) Altitude vs. Time (TrajectoryThrough Burnout) ............................. 136
108. Nike-Cajun (Beverly) Range vs. Displacement (Tra-jectory Through Burnout) ....................... 137
109. Nike-Cajun (Beverly) Velocity vs. Time (TrajectoryThrough Burnout) ............. .............. 138
110. Nike-Cajun (Bonny) Altitude vs. Time (TrajectoryThrough Burnout) . ............................. 139
111. Nike-Cajun (Bonny) Range vs. Displacement (Tra-jectory Through Burnout) ...................... 140
112. Nike-Cajun (Bonny) Velocity vs. Time (TrajectoryThrough Burnout) .................. .... ..... 141
113. Nike-Cajun (Dagmar) Altitude vs. Time (TrajectoryThrough Burnout) .................. ., ..... . 142
114. Nike-Cajun (Dagmar) Range vs. Displacement (Tra-jectory Through Burnout) . ...................... 143
115. Nike-Cajun (Dagmar) Velocity vs. Time (TrajectoryThrough Burnout) ...... ........................ 144
116. Nike-Cajun (Cindy) Altitude vs. Time (TrajectoryThrough Burnout) ............................. 145
117. Nike-Cajun (Cindy) Range vs. Displacement (Tra-jectory Through Burnout) ...................... 146
118. Nike-Cajun (Cindy) Velocity vs. Time (TrajectoryThrough Burnout) .. ..... ................... 147
119. Nike-Cajun (Louise) Altitude vs. Time (TrajectoryThrough Burnout) ............................. 148
120. Nike-Cajun (Louise) Range vs. Displacement (Tra-jectory Through Burnout) ..................... 149
121. Nike-Cajun (Louise) Velocity vs. Time (TrajectoryThrough Burnout) .............................. 150
x

APGCoTDR-63- 1 q
ILLUSTRATIONS AND TABLES (Continued)
Figure Page
122. Nike-Cajun (Kitty) Altitude vs. Time (TrajectoryThrough Burnout) ************************** 151
123. Nike-Cajun (Kitty) Altitude vs. Time (TrajectoryThrough Burnout) .*1.**.***** * e***.*****. 152
124. Nike-Cajun (Kitty) Range vs. Displacement (EntireTrajectory) *.on*s.*.66909600609606* * .************ 153
125. Nike-Cajun (Kitty) Range vs. Displacement (Tra-jectory Through Burnout) ... • •................. 154
126. Nike-Cajun (Kitty) Velocity vs. Time (Entire Tra-jectory) • ******.*.***.**.. *..****.*... 155
127o Nike-Cajun (Kitty) Velocity vs. Time (TrajectoryThrough Burnout) ... **..oo*.. ... * . ......**** 156
128. Nike-Cajun (Dana) Altitude vs. Time (Entire Tra-jectory) • **. .. o..... . ....... ...... .. ,,.... . 157
129. Nike-Cajun (Dana) Altitude vs. Time (TrajectoryThrough Burnout) .......o 0 .0....... .*...... .... a58
130. Nike-Cajun (Dana) Range vs. Displacement (EntireTrajectory) o.....,,,,,.,,,,,,.. ,,,,,.,,,,., 159
131. Nike-Cajun (Dana) Range vs. Displacement (Tra-jectory Through Burnout) e*.*******.........** *. 160
132. Nike-Cajun (Dana) Velocity vs. Time (Entire Tra-jectory) o... Se.o..,.. ..... . .. ,..,,,,,,,,,... 161
133. Nike-Cajun (Dana) Velocity vs, Time (TrajectoryThrough Burnout) .,.. ,*qoqoq .~ ... ,..,,,,, ... 162
Table
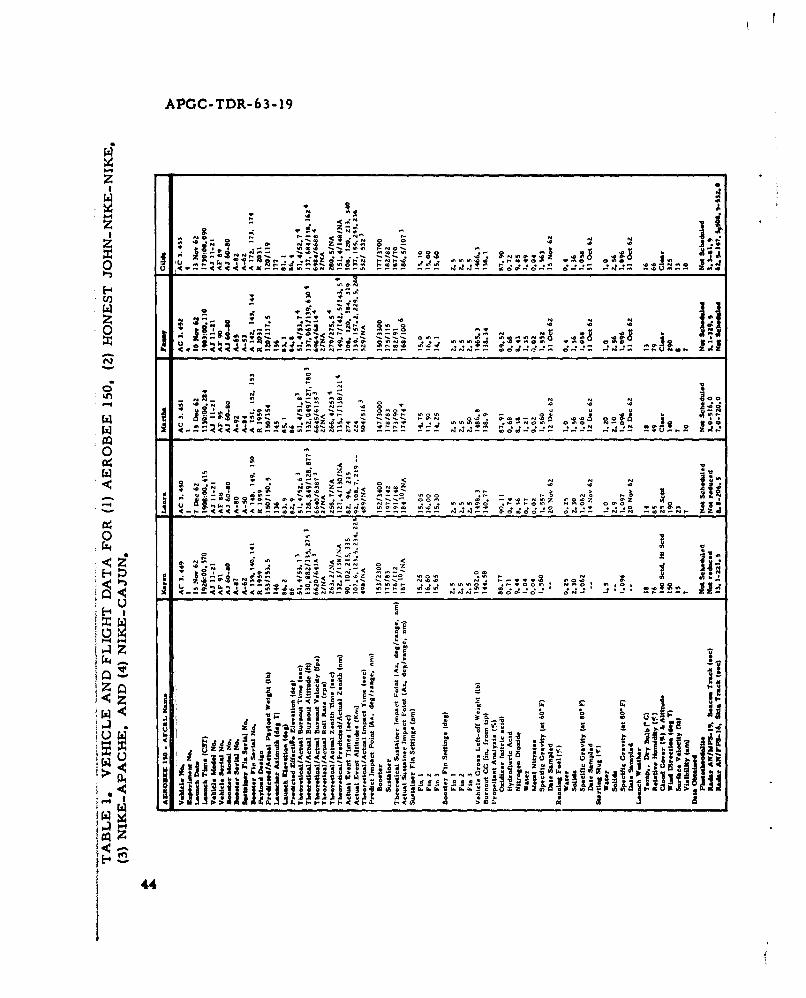
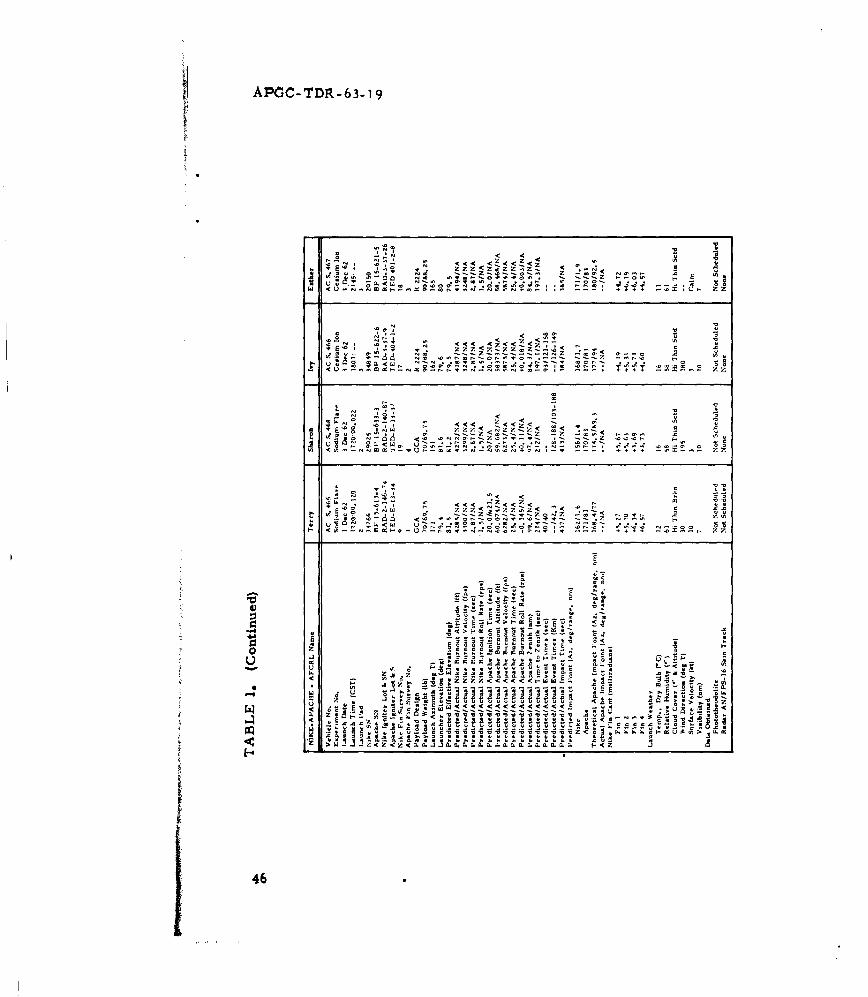
1. Vehicle and Flight Data for (1) Aerobee 150, (2) HonestJohn-Nike-Nike, (3) Nike-Apache, and (4) Nike-Cajun 44
2. Aerobee 150 Physical and Aerodynamic Data, Stage I,Stage IA, and Stage II ,...,,,,,,,,,,,,,,, 48
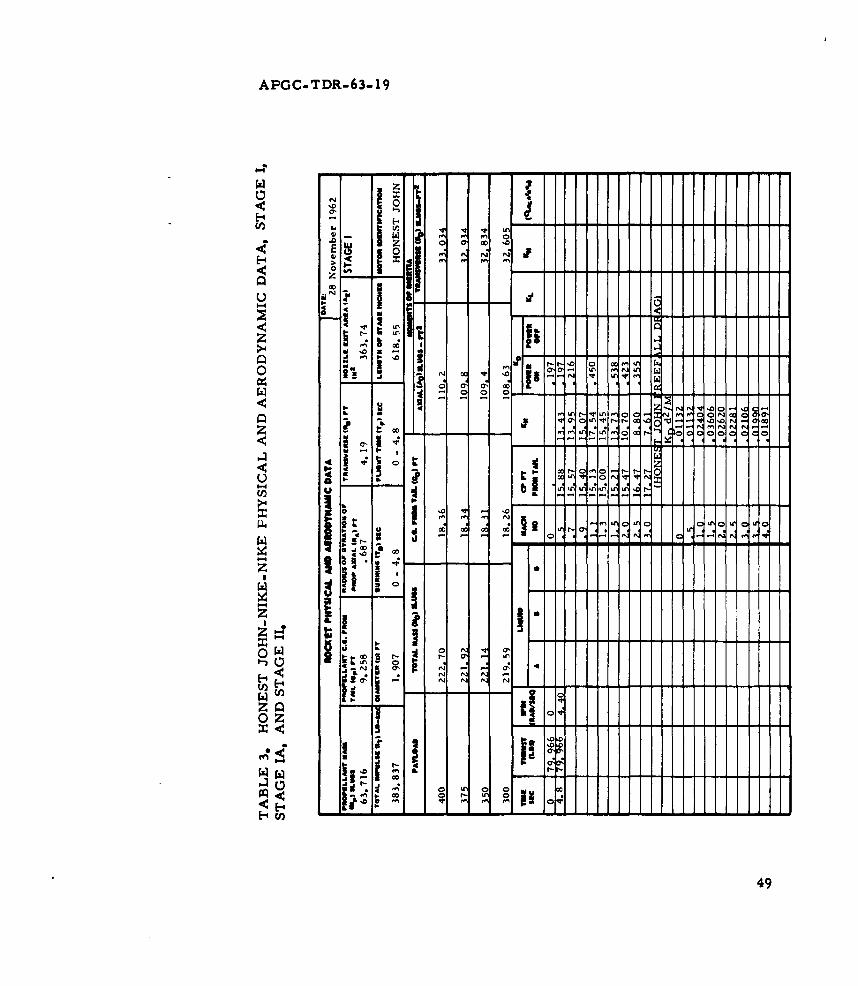
3, Honest John-Nike-Nike Physical and AerodynamicData, Stage I, Stage II, and StageIll *o*o*....& 49
4. Nike-Apache Physical and Aerodynamic Data, StageI and Stage II .,,,,,,,,,,,,,,,,,e,,,.SOSOS,,.S 52
5. Nike-Cajun Physical and Aerodynamic Data, Stage Iand Stage II see..e.ee. ee*ees oooos.*e0*.ee.e*9e. 54
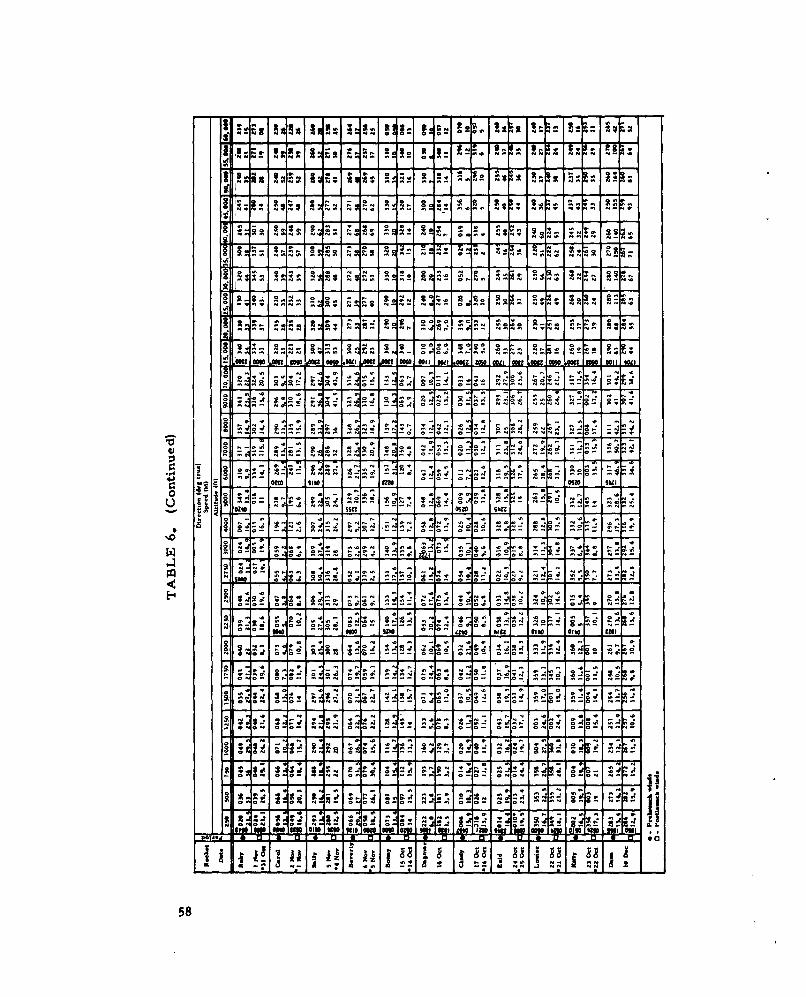
6. Wind Data e.,,e,,,,ee.,e,,,e,,e,.,,,,,,es .***.ee 56
xi

APGC-TDR-63- 19
SECTION 1 - INTRODUCTION
The Deputy for Aerospace Systems Test, APGC (Air Froving GroundCenter), launched 33 sounding rockets from the Aerospace LaunchingFacility at Site A- 1l, EGTR (Eglin Gulf Test Range), on Santa Rosa Island,Florida, between 15 October 1962 and 15 December 1962. There were5 Aerobee 150, 9 Honest John-Nike-Nike, 4 Nike-Apache, and 15 Nike-Cajun rockets launched in support of an AFCRL (Air Force CambridgeResearch Laboratories) basic research program designed to provide con-trolled releases of various chemicals into the upper atmosphere. Thesupport required of APGC was provided in accordance with the require-ments and schedule set forth by AFRCL.
APGC support in this program consisted of providing rocket as-sembly, launch facilities, launch and support operations, optical andradar tracking instrumentation and telemetry receiving stations, ballisticservices for vehicle trajectory and impact predictions, and trajectorydata reduction and analysis. Other support services were providedwhich included fin survey data reduction, spin tab and fiberglass nosecone fabrication, and the assembly of certain payload subsystems.
This portion of the report, Vol 1, describes the support and pre-sents the vehicle and flight data obtained. The flights are identified bythe AFCRL assigned name. The information presented with regard tovehicle and flight data is generally grouped by rocket system, with thesegroups divided by payload configuration and subdivided by firing order.Volume 2 of this report contains the theoretical and empirical vehicletrajectory data tabulated at APGC.
SECTION 2 - SOUNDING ROCKETS, FIN SURVEY AND DATA REDUCTION,AND TRACKING AIDS
SOUNDING ROCKETS
Four sounding rocket systems were utilized during the series oflaunchings, the Aerobee 150, the Honest John Nike-Nike, the Nike-Apache, and the Nike-Cajun. These systems are briefly discussed in
APGC-TDR-63- 19
the following paragraphs. The Atlantic Research Corporation was theprimary AFCRL payload contractor, and furnished hardware for all buttwo of the payloads. The Geophysics Corporation of America furnishedtwo payloads for NASA. Vehicle serial numbers, payload weights, fuelanalysis, fin survey data, and other rocket physical data are recorded,where applicable, in Table 1.
AEROBEE 150. The Aerobee 150 is a liquid-propellant soundingrocket. It consists of a 2. 5 KS 18, 000 solid propellant JATO boosterand the AJ 11-21 liquid propellant sustainer. See Fig. 1 for a sketch ofthe vehicle and payloads utilized, and Table 1 for additional vehicle data.
The sustainer carried a 10-in. range-safety extension which con-tained an AN/DPN-41 tracking beacon and an AN/DRW- 11 command re-ceiver. Three of the payloads, Karen, Laura, and Martha, wereequipped with telemetry transmitters.
The fins were set to provide a roll rate of 2 rps at sustainer burn-out. No attempt was made to verify the roll rate.
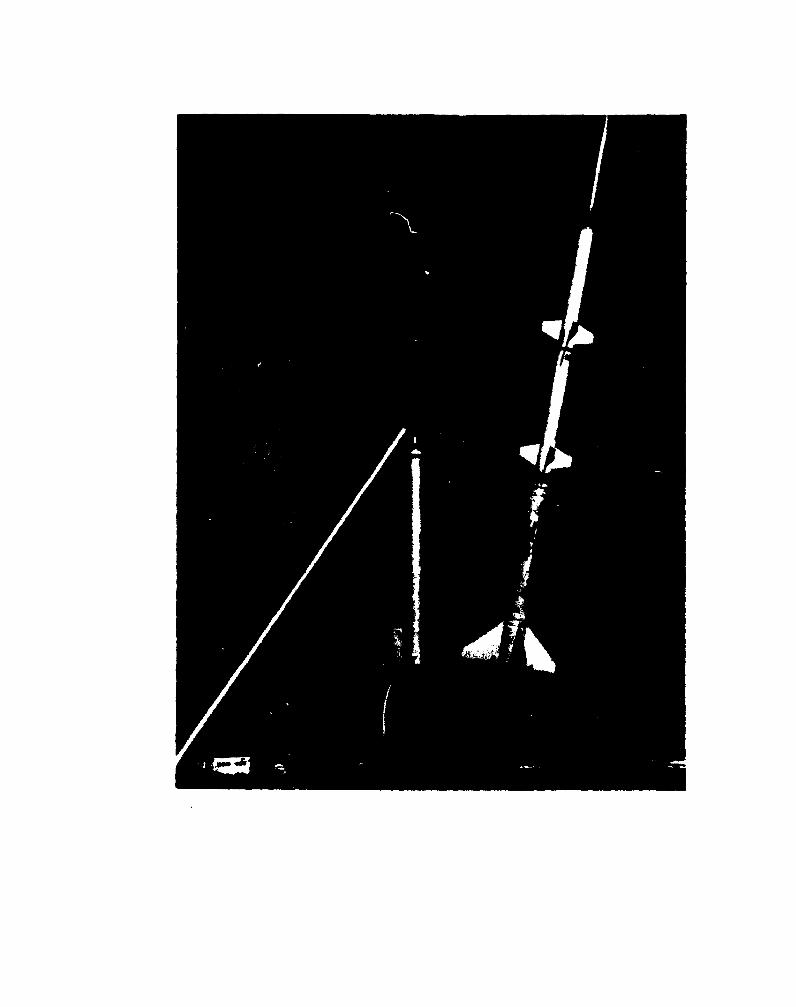
HONEST JOHN-NIKE-NIKE. The Honest John-Nike-Nike is a three-stage solid-propellant sounding rocket. The first stare is an HonestJohn M-6 rocket motor and the second and third stages are Nike M-5rocket motors. See Fig. 2 for a sketch of the vehicle and payloadsutilized, and Table 1 for additional vehicle data.
Standard Honest John fins were used on the first stage. Variableincidence fins I with Inconel steel leading edge caps were used for thesecond and third stages. The fins were surveyed and set to providea roll rate at burnout of each stage as follows:
Stage Roll Rate(rps)
1 0.72 1.03 7.0
The exception was Patsy which had the same roll rates for the first andsecond stages, but a third-stage burnout roll rate of 0.65 rps. The rollrates of these vehicles could not be determined from the tracking film.
Second- and third-stage ignition was accomplished by ground ignitingpyrotechnic delay igniters through a first-motion switch. Nominal ig-nition delays were launch plus 10 seconds for the second stage, andlaunch plus 25 seconds for the third stage.
'Fin ame manmwactured by the Space Vehicle Division, Atlantic Research Corporation.
2

APGC-TDR-63- 19
• -% u~i
aa
C4p
w - )"
00
_ I - I. ,•_ _ _I a°. U
-l 0
I 4)
o l 4.Uo,- II -
I ""4
Jo. a I,- -
*" IS
00 (
_en

APOC-TDR-63-19
0
A 5.'1u I (d
i E *
G >~
0 "I 2
4 4

APGC-TDR-63- 19
The first stage was separated by drag after burnout. The secondstage was held to the third stage with a retractable pin until launch plus20 seconds to prevent premature separation. After pin retraction thesecond stage was also separated by drag.
An AN/DPN-41 radar tracking beacon was flown on Ethel. All ve-hicles, except Hazel, carried tracking flares. The Ethel, Mabel, Dinah,Eva, Netty, and Olga payloads were equipped with telemetry transmitters.
NIKE-APACHE. The Nike-Apache is a two-stage solid-propellantvehicle. The first stage is a Nike M-5 rocket motor and the secondstage an Apache TE-307 rocket motor.
Variable incidence fins were used on the first stage and Apachefins 2 were used on the second stage. The fins for these vehicles weresurveyed and the first-stage fins canted to provide a roll rate of 1 1/2rps at first-stage burnout. The blank tabs on the second-stage finswere milled flat. The residual burnout roll rates for the second stagesare given in Table 3. Actual roll rates are not available.
Second-stage ignition was accomplished by ground igniting pyro-technic delay igniters through a first-motion switch. The nominal delaytime was launch plus 20 seconds. Actual times were not recorded, butwere about 20 to 21 seconds on the four vehicles, as reported by ob-servers. Flares or other tracking aids were not used.
The Nike-Apache and payload configurations are shown in Fig.3,and additional vehicle data are recorded in Table 1.
NIKE-CAJUN. The Nike-Cajun sounding rocket is a two-stagesolid-propellant vehicle. The first stage is a Nike M-5 rocket motor,and the second stage is a Cajun TE-82 Mod 1 rocket motor.
Variable incidence fins were used on the first stage and fixed fins 3
on the second stage. All fins were surveyed, and the first-stage finswere canted to provide a roll rate of 1 1/2 rps at first-stage burnout.Some second-stage fins were flown without wedges, some with smallwedges to provide approximately 1 rps at second-stage burnout, and somewith larger wedges to provide a 6-rps burnout roll rate. Predicted rollrates are shown in Table 1. Actual roll rates could not be determined.
2 Fins awe nmwdaotmed by the Space Vehicle Division, Atlantic Research Corporation.
3 Fine am manufactured by the Aerolab Development Company.
5

APGC-TDR-63- 19
Ii 111
I--
4! i
.21
] U
6 I
6

APGC-TDR-63- 19
See Fig. 4 for a sketch of the vehicle and payload configurationsflown, and refer to Table 1 for additional vehicle data. The spin tabsused for the 6-rps spin rate are shown in Fig. 5.
Second-stage ignition was accomplished by ground igniting pyrotech-nic delay igniters through a first-motion switch. Two nominal delaytimes were used, 16 and 17 seconds. Ballistic predictions used a 17.88-second second-stage ignition time, a value which was derived from anexamination of the ignition history of Cajuns previously launched at APGC.The average ignition delay for 11 recorded Cajun ignition times on thisseries was 18.73 seconds.
Tracking flares were flown on 12 of the 15 Nike-Cajuns. No trackingaids were used on Queenie, Paula, and Enid.
FIN SURVEY AND DATA REDUCTION
The fins were surveyed for the Honest John, Apache, and Cajun ve-hicles by assembling the fins to the motors, leveling, and surveying.A three-chord survey was performed on the Apache and Cajun fins, anda five-chord survey was performed on the Honest John fins. The Nikefins were mounted in a jig and a five-chord survey was accomplished.
The data from the surveys were reduced on an LGP-30 computerusing a program written by APGC from theory provided by AFCRL. Theprogram output provided the tab length for the Cajun spin tabs for a 6-rps roll rate, and the corresponding Nike fin cant angles for a I 1/2-rpsroll rate at Nike burnout. The Nike cant angles incorporated the effectof the 6-rps Cajun fin and tab. The program also provided the residualburnout roll rates for the Cajuns and Apaches without tabs, and theproper Nike cant angles for a 1 1/2-rps roll rate at first-stage burnout.The effect of the Cajun or Apache fin, and tab, if used, was neglectedfor low second-stage roll rates.
The Honest John fins were installed with the preset 30 minutes ofcant. The roll rate was corrected by tabs to 0. 7 rps at first-stage burn-out. The computer output provided the proper tab length for the HonestJohn fins and the Nike cant angles for the second and third stages. Theeffects of the second- and third-stage fin cants were incorporated intothe computation of the first-stage tab length and the effects of the third-stage fin cant included into the calculation of the second-stage fin-cantangle.
7

APOC-TDR-63-19
177tid
LEI
r --- 01
AAkn1
• 54
zCC
Uz
P4 J
Iii
8

APGC-TDR-63- 19
STab-Length
Leadins Edge
Root i Tip
Trailing Edge TNOTE: Tab lengths used are given in Table 1.
Fig. 5: Cajun Tabs.
The Aerobee 150 fins were surveyed and canted in accordance with
the Aerojet-General Field Test Procedure, AF TP-1121-0 19.
TRACKING AIDS
Flares were flown on 12 of the 15 Nike-Cajun vehicles and on 8 ofthe 9 Honest John-Nike-Nike vehicles. The flares were mounted on thefin shroud, between fins, and 180 degrees apart. A typical installationis shown in Fig. 6. The flares were U. S. Flare Division, Atlantic Re-search Corporation, Type 175C. The identification of the specific flares
used is given in Table 1. The flares provided 30 seconds of light sourceas a tracking aid.
A flashing light was flown on Honest John-Nike-Nike Hazel. Thelight flashed at I-second intervals until third-stage ignition, but wasinadequate as a tracking aid.
9

APGC-TDR-63- 19
_I_
d .5
Sm
F- . C
C. - ,
1od

APGC-TDR-63- 19
SECTION 3 - BALLISTIC COMPUTATIONS
DISPERSION STUDIES
Dispersion studies have been published for the vehicles launchedduring this project. The studies are listed in the References sectionof this report,
TRAJECTORY PREDICTIONS
Vehicle trajectory calculations were based upon the input datashown on Tables 2 through 5. Table 2 applies to the Aerobee 150; Table3 applies to the Honest John-Nike-Nike; Table 4 applies to the Nike-Apache; and Table 5 applies to the Nike-Cajun. The trajectory calcu-lations were performed on an IBM 7090 computer using a six-degree-of-freedom ballistic program.
The ,retical trajectories based on the input data, the actual launchersettings, and the winds nearest the time of launch have been computedand are provided along with the tabulated flight data in Volume 2. Thesetheoretical data are also plotted with the actual data in Figs. 30 through133.
The drag of the tracking flares was not considered for either theHonest John-Nike-Nike or the Nike-Cajun vehicles, but an additional3 lb for flare weight was added as payload for the Nike-Cajun. The dragof the 6-rps Cajun spin tabs was considered in the predictions, and 2 lbfor tab weight were added as Cajun payload. The drag and weight of thesmall tabs was neglected.
Maximum altitude and range versus launch angle for various payloadweights are shown for the Aerobee 150 (Fig. 7), Honest John-Nike-Nike(Fig. 8), Nike-Apache (Fig. 9), and the Nike-Cajun (Figs. 10, 11, and12).
The predictions for Honest John-Nike-Nike Ethel were based uponthe best information available prior to the flight. Ethel was flown as avehicle flight test, and the flight performance was used as a basis forthe prediction of the subsequent flights in the series.
The Nike-Apache predictions were based on a 10-degree half-anglenose cone. The physical configuration of the sodium flare payloads wasnot determined until shortly prior to the scheduled launch, and the lack
11

APOC-TDR-63- 19
Payload Weghts (Ib)
-- 120
200 in__ --- 5
-....250
160
-E 140
60
40
E0
167Uo828 68
LanhAgl dg
Fi.7Ueoe S ag n aiu liuev.Luc nl o
12

APGC-TDR-63- 19
2D0 -| I 1 I m- I -I-
Payload Weights (Ib)
300180 -. .350
lac ___ _ - - 40
160
\..
E120
100 t
40
65 70 75 80 85 90Launch Angle (dog)
Fig. 8: Honest John-Nike-Nike Range and Maximum Altitude vs. Launch
Angle for Various Payload Weights. 1
3.3

APGC-TDR-63-19
200 , I ' ,
payload Weigt(l b70
ISO
-160
Uq
140
E 1
Nx
120
0
Launch Angle (dog)
Fig. 9: Nike-Apache Range and Maximum Altitude vs. Launch Angle forVarious Payload Weights.
14

APCC-TDR-63-19
100' '
Payload Weights (lib)60
090
609
70-
I\
30-
n 6 80 84 88 92
Launch Angle (dog)
Fig. 10: Nike-Cajun Range and Maximum Altitude vs. Launch Angle forVarious Payload Weights. (Small or no Tabs.)
15

APOC-TDR-63-19
100 TT-
Payload Weights (lb)60
70
90
8O
70
E 60
I S
i 0 II I
10
30
Launch Angle (doe)
Fig. 11: Nike-Cajun Range and Maximum Altitude vs. Launch Anglefor Various Payload Weights (6-rps Tabs.)
16

APOC-TDR-63-19
Payload Weights (lb)
' 70I0_....... -- 9-84
90
80
E 70
60
NON
soX
2D
1074 76 78 80 82 84 86 88
Launch Angle (dog)
Fig, 12: Nike-Cajun Range and Maximum Altitude vs. Launch Angle forVarious Payload Weights. (6-rps Tabs, KD + 10%.)
17

APGC-TDR-63- 19
of time prevented recomputing the'ballistics for the 5 1/2-degree half-angle nose cone. The dispersion was arbitrarily increased to accountfor the variance.
The APGC maximum altitude predictions for the Nike-Cajun flightson Firefly II were examined and found to be high. The input data wererevised for Firefly III and the predictions were again high. Fig. 10was used for the prediction of the vehicles with small or no tabs, andFig. II was used for those vehicles with the 6-rps tabs. However, thepredictions would have closely approached the actual altitudes achievedif Fig. 11 had been used in the place of Fig. 10 and if a new predictionchart, shown as Fig. 12, had been used for Fig. 11. Fig. IZ is Fig. IImodified by adding 10 percent to the drag coefficient.
IM PACT PREDICTIONS
The impact predictions for these vehicles were made on a RoyalMcBee Corporation LGF-30 computer. The prediction program utilizedthe raw pilot balloon and radiosonde data (provided in azimuth and eleý-vation angles) and an approximation of the IBM 7090 ballistic trajectoryprogram to compute the impact points. The pilot balloon data were ob-tained by the single-theodolite measurement technique. The predictedimpact points are shown in Table 1. These values were checked bycomputing postlaunch wind-weighted theoretical trajectories on the IBM7090 computer. The impact points were extracted from the theoreticaltrajectories and are listed in Table 1. Actual impact points, whereavailable, are also listed.
In a few cases the prelaunch high-altitude winds used for impact pre-dictions were forecast winds. These were provided by the range weatherforecaster and were based on the latest available radiosonde and othermeteorological data available to the forecaster at that time,
In other cases, the high-altitude winds could not be measured be-cause of high wind velocities, although the direction was generally known.Estimates of velocity, when available from the forecaster, were used.Otherwise, the data from the nearest radiosonde release were used.This applied to either the prelaunch or postlaunch calculations.
SAFE IMPACT PREDICTION CHARTS
The charts shown as Fig#. 13 through 16 define the maximum allow-able impact area for the vehicles flown, and are for conditions under
18

APGC-TDR-63-19
200
180 -
160
140
Safe Impact Area
120
E W.
60
Stage I - 2.5943 ftsuýStage II 2.5-d43 n-
40 MNOTES:_1. Actual Launcher Azimuth Between 1360 and 1930
2. Actual Launcher Maximum Elevation 88°
3. Predicted impact point must be within limits shown.
20 tL~aunch Point
120 140 160 180 200 220 240Azimuth (dog)
Fig. 13: Aerobee 150 - Predicted Safe Impact Area.
19

APOC TDR-63 19
90
Eseimno
7DA
E
2.5 38ph nmeimn (Eprmet4
1 AtualLaucherAzimth etwe en 1400 nd 2,0 -n
14016 18 20 2 4 52o 1. Actual Launcher Azimuth (deg)e 10 nd20
Saf Predactt Area.on ut ewthnlmtsson
Lanh0on

APG;C-TDR-63-19
200
180 -- _ _
160 - - _ _ _ _ _
Safe Impact Area
140 W
120
3,100 - -- _ _
C
ao-
0 --- -L1'. ,.-4-,, + +
60 - A
Stage 2.5 3600 ft20 Stage II- 2.5 o - 27 nm _
NOTES: I
1. Actual Launcher Azimuth Between 1300 and 213°
2. Actual Launcher Maximum Elevation 8803. Predicted impact point must be within limits shown.
130 150 170 190 210 230 250fLounch PointJ Azimuth (dog)
Fig. 15: Nike-Apache - Predicted Safe Impact Area.
21

APO C-TDR- 63-19
100 1Stap I -2.5 -2885 ftStove 11-2.5v -15 nmNOTES: 1
90 1. Actual Launche, Azimuth Betweni 132a and 208M2. Actual Launcher Maximum Elevation 8803. Predicted impact point must be within limits shown.
60-
W-155
Ic
20Sector AlphaI
10 1____
120 140 160 180 200 220 240 260Azimuth (dog)
Fig. 16: Nike-Cajun with 6 -rps Tabs - Predicted Safe Impact Area.
U2

AFGC-TDR-63- 19
which the total water range is available. Warning Area 155, and a partthereof, Sector Alpha, is normally closed to probe operations duringdaylight hours. The entire area is open from sundown until sunrise, andSector Alpha may be reserved during daylight hours with sufficient ad-vance scheduling information. The charts are based upon the protectionof land masses by 2 1/2 sigma. The numerical value for the 2 1/2 sigmais indicated on each chart. Of course, with changes in dispersion, theboundaries change accordingly.
Range safety permitted launching, provided that the impact pointwas within the chart boundaries (the maximum effective elevation per-mitted is governed by the dispersion), the booster impact azimuths werewithin the maximum launcher setting azimuths and downrange 2 1/2 sig-ma or more, and the launcher settings were within the limits described.Other governing considerations, not discussed here, concern boat andair traffic in the range.
SECTION 4 - LAUNCH FACILITIES
The launch site was the Aerospace Launching Facility on Santa RosaIsland, Florida. Three boom-type general-purpose launchers were usedfor launching the solid-propellant vehicles. The Aerobee 150 vehicleswere tower launched. The locations of the launchers were as follows:
Fad North Latitude West Longitude Elevation
Above MSL
1 30- 23' 41. 398" 86" 42' 43. 222", 14. 0472 300 231 41. 385" 86* 42' 39. 970" 14.0503 300 23' 41. 469" 86* 421 36. 962" 14. 050
Tower 30- 23' 41. 154" 86* 42' 59. 544" 13.082
The Honest John-Nike-Nike vehicles were launched from the general-purpose launcher located on Pad 1. This launcher was modified and out-fitted with zero-launch fittings. The rocket was suspended at threepoints, i. e., front and rear lug positions on the Honest John motor andat the forward end of the second stage. The hangar attached to the sec-ond stage was of the retractable type.
The Nike-Cajun and Nike-Apache vehicles were launched from the
23

AFGC-TDR-63- 19
general-purpose launchers located on Pads 2 and 3. These launcherswere equipped with rails designed to simultaneously release both first-stage launch tees after 200 in. of travel. The launcher pads used areindicated on Table 1.
The Aerobee vehicles were launched from the Aerobee tower whichprovides 156 ft 10 in. of travel.
The Aerospace Launching Facility is shown in Fig. 17.
SECTION 5 - EGTR TECHNICAL FACILITIES
Contraves phototheodolites located on Santa Rosa Island, an AN/FPS-16 radar at Site A-20, an AN/MPS-49 radar at Site A-3, a teleme-try station at Site A-6, and an AN/FRW-2 command transmitter at SiteA-3 were provided, as necessary, in support of the project. The radarsare normally supported with an optical acquisition aid. In addition tothe optical aid, the AN/FPS-16 radar can be equipped with an acqui-sition aid which uses the telemetry signal to direct the radar antenna.This system, known as the AGAVE, was scheduled for most of thetelemetry transmitter equipped vehicles. See Fig. 18 for a map of theEGTR technical facilities.
The instrumentation scheduled for the various vehicles is discussedin the following paragraphs.
AEROBEE 150
One AN/MPS- 19 radar was scheduled for beacon track on all flights,and one AN/FPS-16 radar was scheduled for skin track on all flights ex-cept Fanny. AN/MPS-19 data were recorded on all flights; however, thedata were not reduced on Karen and Laura, in favor of the AN/FPS-16data. AN/FPS- 16 data were obtained on all flights for which the radarswere scheduled. All the AN/FFS-16 data were reduced. One AN/FRW-2 was scheduled for range safety purposes. Contraves phototheodoliteswere not provided for these flights.
HONEST JOHN-NIKE-NIKE
One AN/FFS- 16 was scheduled for skin track on all flights, and one
24

APGC- TDR-63- 19
I )
U, -,-'CiI
LL5
oA U S
4:(3
mm C

APGC-TDR-63-19
AN 'A S
74 V AM
Al*S
Fig.~ 18MGTTeh IclFclte Jaur193
261

APGC-TDR-63-19
AN/MPS= 19 was provided for beacon track on Ethel. The AN/FPS-16data on Ethel were not reduced, in favor of the AN/MPS= 19 data. AN/FPS- 16 data were obtained on all flights except Hazel and Mabel. Con-traves phototheodolites were scheduled on all flights except Mabel, Dinahand Eva. Hazel's flashing lights were inadequate as a tracking aid.Mabel carried flares and a telemetry transmitter, but the AGAVE wasnot scheduled for that flight.
NIKE-APACHE
Tracking aids were not flown on the Nike-Apache vehicles, andphototheodolites were not scheduled. An AN/FPS- 16 radar was pro-vided to skin track for three of the flights, but was unable to acquire thevehicles.
NIKE- CAJUN
Phototheodolites were scheduled on all flights. Data were obtainedon all but Queenie, Paula, Carol, Beverly, and Enid. Flares were notflown on Queenie, Paula, and Enid, and the flares were not ignited onCarol. AN/FPS- 16 radar skin track was scheduled on 9 flights, anddata were obtained on 5 flights.
SECTION 6 - RANGE WEATHER SUPPORT
The 4th Weather Group provided weather forecasts, single-theodolitepilot balloon and radiosonde wind measurements, and weather obser-vations at the time of launch. The wind measurements were taken bypilot balloon up to 10, 000 ft, and by radiosonde to 60, 000 ft. The winddata are shown in Table 6. The weather observations are listed inTable 1.
27

APGC-TDR-63- 19
SECTION 7 - DATA REDUCTION
PHOTOTHEODOLITE DATA
The Davis least-squares method for an N-station solution (2<N<6)was used to compute phototheodolite space-position data on an IBM 7090computer. This method is a true least-squares method which minimizesthe deviation in azimuth and elevation readings and yields the best possi-ble solution from the available data. The Bodwell 2-station solution isused for obtaining the trial point used in the N-station Davis solution.Standard deviations in space positions are derived from errors in azi-muth and elevation readings from each station. The film was read atthe rate of 10 data points per second and smoothed by a least-squaresfit of a third-degree moving-arc polynomial using 21 points. Velocityand acceleration are obtained by evaluating the first and second de-rivatives of the polynomial.
RADAR DATA
Radar data were computed as the product of the slant range anddirection cosines of the line of sight from the radar to the vehicle. Thedata were smoothed in the same manner as the phototheodolite data,except that 21 points were used through burnout, 99 points were usedthrough the trajectory to approximately 90, 000 ft on the descent, and47 points were used from 90, 000 ft to impact.
TABULAR DATA
The tabulated phototheodolite, radar, and theoretical data, groupedby vehicle, experiment, and launch order, are presented in Volume 2.
The data are reduced with reference to the applicable launcher andto the predicted impact azimuth of each particular flight. The predictedimpact azimuths are given in Table 1, and are shown on the plots ofrange versus displacement. Negative signs in the displacement columnindicate that the flight azimuth at that time is to the left of the predictedimpact azimuth (as seen from the launch point). The values of the ac-celeration shown are absolute values. The acceleration is negativewhen the velocity is decreasing. The data that occur at discontinutiesor near end points must be used with reservation, because of the possi-ble effect of the smoothing routine. Ignition and burnout times may bedisplaced as much as 0. 5 second, and velocities at end points tend to bedistorted.
28
APGC-TDR-32- 19
PLOTTED DATA
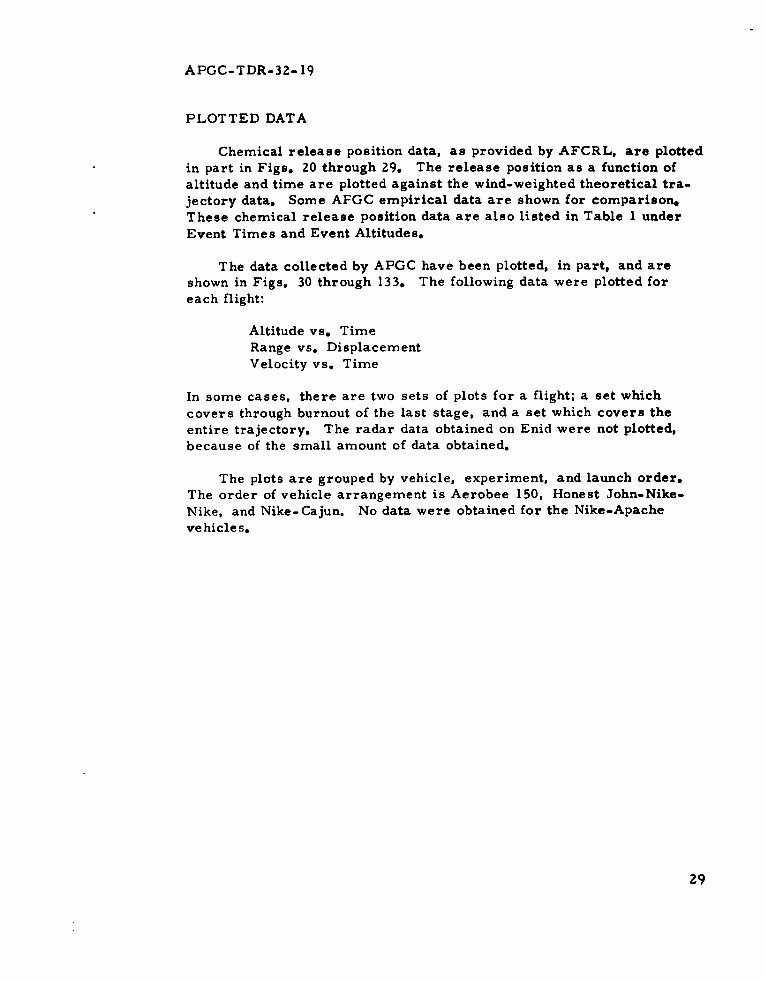
Chemical release position data, as provided by AFCRL, are plottedin part in Figs. 20 through 29. The release position as a function ofaltitude and time are plotted against the wind-weighted theoretical tra-jectory data. Some AFGC empirical data are shown for comparison.These chemical release position data are also listed in Table I underEvent Times and Event Altitudes.
The data collected by APGC have been plotted, in part, and areshown in Figs. 30 through 133. The following data were plotted foreach flight:
Altitude vs. Time
Range vs. DisplacementVelocity vs. Time
In some cases, there are two sets of plots for a flight; a set whichcovers through burnout of the last stage, and a set which covers theentire trajectory. The radar data obtained on Enid were not plotted,because of the small amount of data obtained.
The plots are grouped by vehicle, experiment, and launch order.The order of vehicle arrangement is Aerobee 150, Honest John-Nike-Nike, and Nike-Cajun. No data were obtained for the Nike-Apachevehicles.
29
APOC-TDR-63-19
44
A1AeAell
00051 io
Asa
050.)0!, 7an
JowA3
0~u 40U- C-
OIu1zt
1044 06.. 4411:
D4JD
300

APGC-TDR-63- 19
800,m0 _________--Km.m
Krene FPS-16 Track -L-- - -- -
700,000
M00
-'0 Kew
Laura FPS-16 Track600,000
/ wwm Wind-Weighted Thecwetical
0 Karen, Actual AFCRL Data7 Laura, Actual AFCRL Data400,0001 -I
300000 120 160 200 240 280 320
Time (see)
Fig. 20: AFCRL Chemical Release Positions vs. Wind-Weighted Theo-retical Trajectories. Aerobee 150. (Karen and Laura).
31
APGC-TDR-63- 19
1,000,000
Oida Th*or Ilcel
900,000
Fanny Tha#.etlcal / ,,',
800,000
700,000
SFA nny, Actual, MPS-19 Beacon Track
600,000
Gildo, Actual, FPSP16 Skin Track
500,000
400,000•Gildo
A Fanny
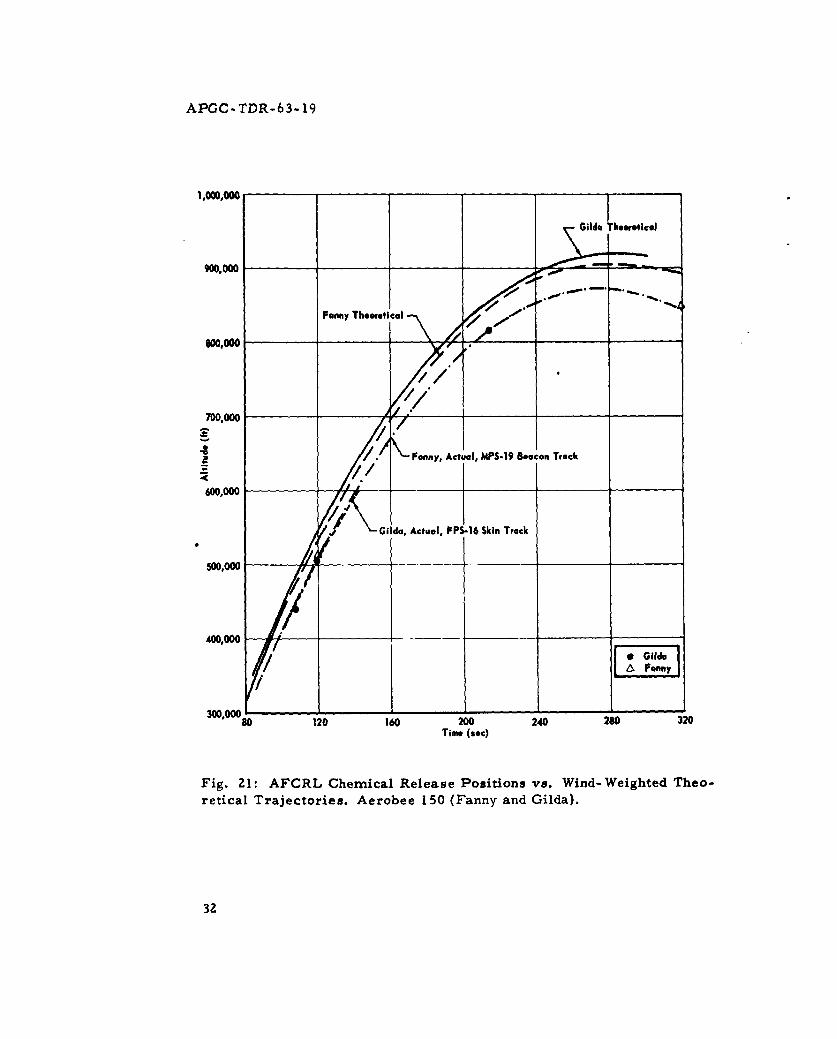
so 120 160 200 240 280 320Time (sac)
Fig. 21: AFCRL Chemical Release Positions vs. Wind-Weighted Theo-retical Trajectories. Aerobee 150 (Fanny and Gilda).
32

APOC TDR-63-19
60,0000•OO,0OOEve ;redicted.
550,000 __ -!z
Mabel, Lisa, Predicted
S50,0 Dinah Predicted
Patsy Predicted eOlgp Predicted
____00 I__ I__ Hef ty Predicted I
4so,00 A
S400.000
350,000
- Wind-Weghted TheoreticalAFCRL Data
300,000 -[ Mabelx Dinah
250000Actual Position FPS-16 Skin Tracko Lisa A Patsy
Maximum Altitude* Lisa A Patsy
200,000 175 .100 125 150 175 200 225 250 275 30
Time (sec)
Fig. ZZ: AFCRL Chemical Release Positions vs. Wind-Weighted Theo-retical Trajectories. Honest John-Nike-Nike (Mabel, Dinah, Eva, Netty,Olga Lisa. and Patsy).
33

APOC-TDR-63- 19
zi11l
u
U
0
C4
/ to
0
0
a.4
W
34

APGC-TDR-63-19
in
U
"4
4)
r34
0 u
.4 a
'. '%
44 .4
35
U
U
".2
U
05

APGC-TDR-63-19
375,000
350,000
325,000
300,000
oo,.
4"
275,000
250,000
225,000Wind-Weighted Theoretical
* Alice, ActualA Queenie, Actualo Paula, Actual
200,00080 100 120 140 160 180 200
Time (sec)
Fig. 25: AFCRL Chemical Release Positions vs. Wind-Weighted Theo-retical Trajectories. Nike-Cajun (Alice, Queenie, and Paula),
36

APGC-TDR-63-19
425.000
400,000
375,000
350,000
325,000
300,000
7
275,000
- Wind-Weighted Theoreticalo Ruby, Actual9 Sally, Actual2 0 Beverly, Actual250,000 ' ,20
a0 100 120 140 160 no 200Time (sec)
Fig. 26: AFCRL Chemical Release Positions vs. Wind-Weighted Theo-retical Trajectories. Nike-Cajun. (Ruby, Sally, and Beverly).
37
APGC-TDR-63-19
500,000
450,000
400,000
350,000
250,000 _______
Wind-Weighted Theoretical
AFCRL Data
a Bonny, ActualA Dagmar, Actual
200,000 x Cindy, ActualSEnid, Actual
.. Enid, FPS-16 Skin Track
150,0001 _75 100 125 150 175 200
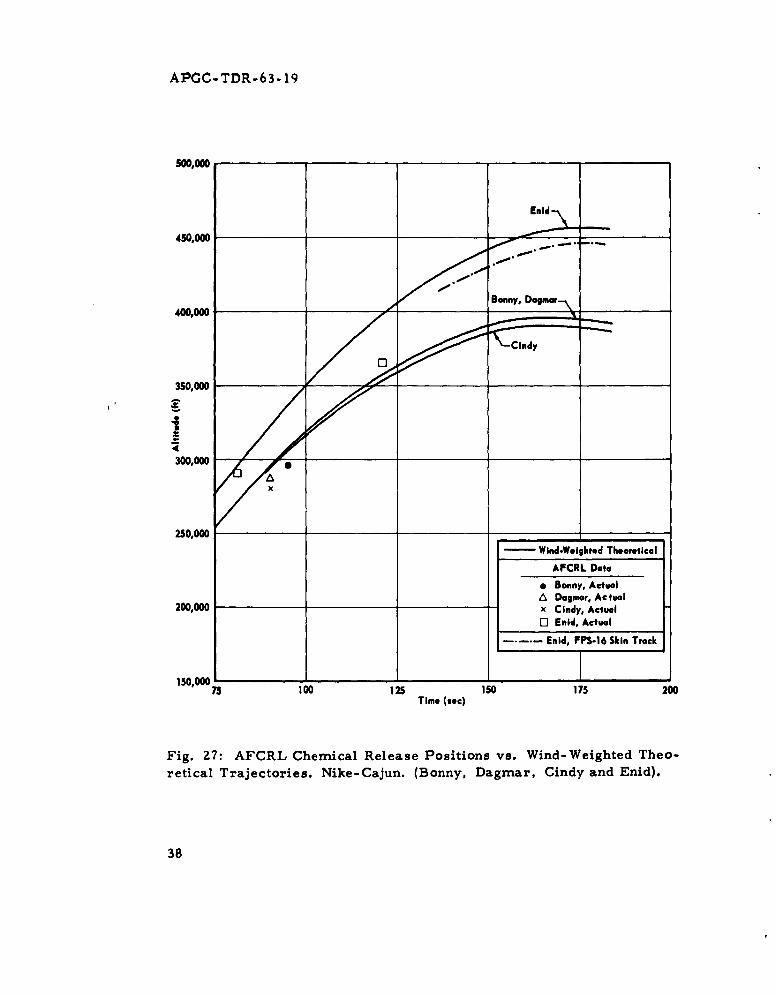
Time (sac)
Fig. 27: AFCRL Chemical Release Positions vs. Wind-Weighted Theo-retical Trajectories. Nike-Cajun. (Bonny, Dagmar, Cindy and Enid).
38
APGC-TDR-63-19
500,000 - _ _ _ _
450,000
400,000 0
350,000
300,000
250,000
- -- Wind.Weighted Thoeeftilel
200,000 AFCRL DOtt
o Louise, Actuale Kitty, Actual
A Kitty, Maximum Altitude, Roder Pen Plio
150o00075 100 125 150 175 200
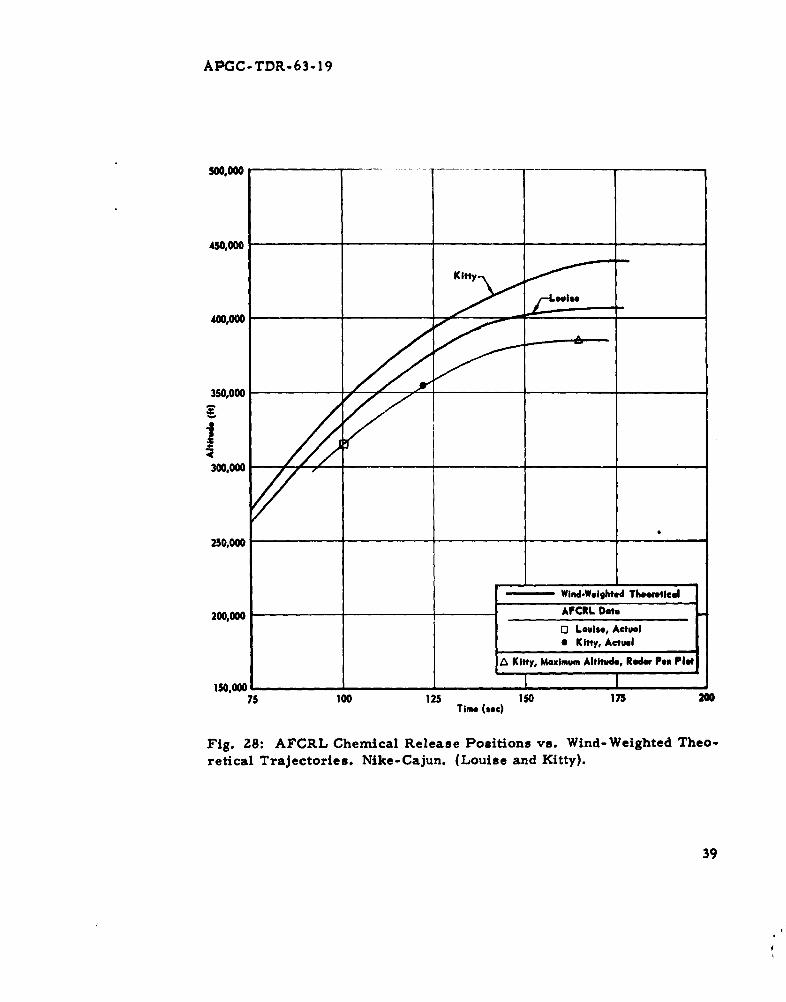
Time (sac)
Fig. 28: AFCRL Chemical Release Positions vs. Wind-Weighted Theo-retical Trajectories. Nike-Cajun. (Louise and Kitty).
39

APGC-TDR-63-19
Fin 1
Fin 4 + Fin 2
Fin 3
Aft Looking Forward
Fig. 29: Sign Convention for Spin Tab Installation.
40

APGC-TDR-63- 19
SECTION 8 - DISCUSSION
DATA SUMMARY
Vehicle physical data, launch conditions, and highlights of the ve-hicle trajectories have been assembled in Table 1. The following re-marks are for clarification of some of the data given.
Launch times given are taken from a lift-off switch. These valueswere compared with phototheodolite frame-of-first-fire times and differedin the third decimal place. Lift-off times were not recorded for fourflights, and the data for these flights were reduced to the nearest min-utes shown. Launch times are CST (Central Standard Time) and areequal to Greenwich Mean Time minus 6 hours.
Two values are shown for payload weight, a predicted weight usedfor the ballistic impact predictions and the actual weight.
The flight data shown have two values, a theoretical and an actual.The theoretical represents the performance from the wind-weighted
theoretical trajectories. The actual values are measured and the datasource is indicated.
The event times and altitudes were chemical release position dataprovided by AFCRL.
The impact azimuths derived from AFCRL chemical release datamay deviate from the actual impact azimuth by *5 degrees.
The direction of vehicle roll was clockwise (as viewed from theaft), except those shown with negative roll rates. The fin tabs wereapplied in accordance with the sign convention shown in Fig. 29.
VEHICLE TRACKING
Two vehicles were launched during the day, Ethel and Martha. All-others were launched at twilight (about one-half hour before local sun-rise or after sunset), or at night.
Optical tracking was a requirement, and tracking flares were pro-vided as indicated in other sections of this report. In several cases,flare burnout times were so close to final-stage burnout times that thereduced trajectory data end at or prior to burnout. The flares were
41

APGC-TDR-63- 19
consistant in reaching a burning time of approximately 30 seconds. (SeeTable 1 for the predicted burning times.)
Radar skin tracking was set forth as a requirement after the launchseries began, and became APGC's first large scale effort to provideAN/FPS- 16 skin track of high-acceleration multi-stage sounding rockets.All factors considered, this first effort was deemed to have been verysatisfactory. If the flare burning times had extended to the predictedvalues, the radars would have provided even more data.
Some factors influencing radar tracking, in addition to flare burningtime, were:
1. The third stage of the Honest John-Nike-Nike had a tendencyat ignition to break lock on automatic track.
2. The AGAVE was used on four Honest John-Nike-Nike flights,and definitely enhanced the AN/FFS- 16 radar acquisition c.apability.
3. The return signal on the third stage of the Honest John-Nike-Nike faded into the noise on five flights at approximately 475, 000ft altitude. The same thing happened on the Aerobee vehicles at analtitude of 700, 000 ft. This is a result of the effect of the attitude ofthe vehicle and slant range on the radar cross-section. On three of theHonest John-Nike-Nike flights and one Aerobee flight acquisition aidstracked throughout the trajectory and the targets were reacquired on thedescent.
AN/FPS- 16 radar skin track data were acquired on 7 of the 9Honest John-Nike-Nike flights and on 2 flights tracked throughout thetrajectory. On the four Aerobee flights which were skin tracked thedata acquired prior to loss of signal were better than the AN/MPS-19beacon track. AN/FPS- 16 radar skin tracking for the Nike-Cajuns washampered by the flare burning time, a faster vehicle, and a smallertarget. Yet, the radars acquired shortly after lift-off (on vehicles withflares) on 3 of 6 flights, and acquired some data on 5 of 9 (3 withoutflares) flights.
VEHICLE IERFORMANCE
Thirty-three vehicles were launched. Thirty-one vehicles achievedaltitudes which satisfied the scientific requirements. There were twoNike-Cajun failures, one because a malfunction occurred during second-stage burning and one because an error resulted in no second-stage
42

APGC-TDR-63- 19
ignition. One each Aerobee 150, Honest John-Nike-Nike, and Nike-Cajun provided flights which were much lower than would have normallybeen expected. There are insufficient data to explicitly define the causesof the low flights.
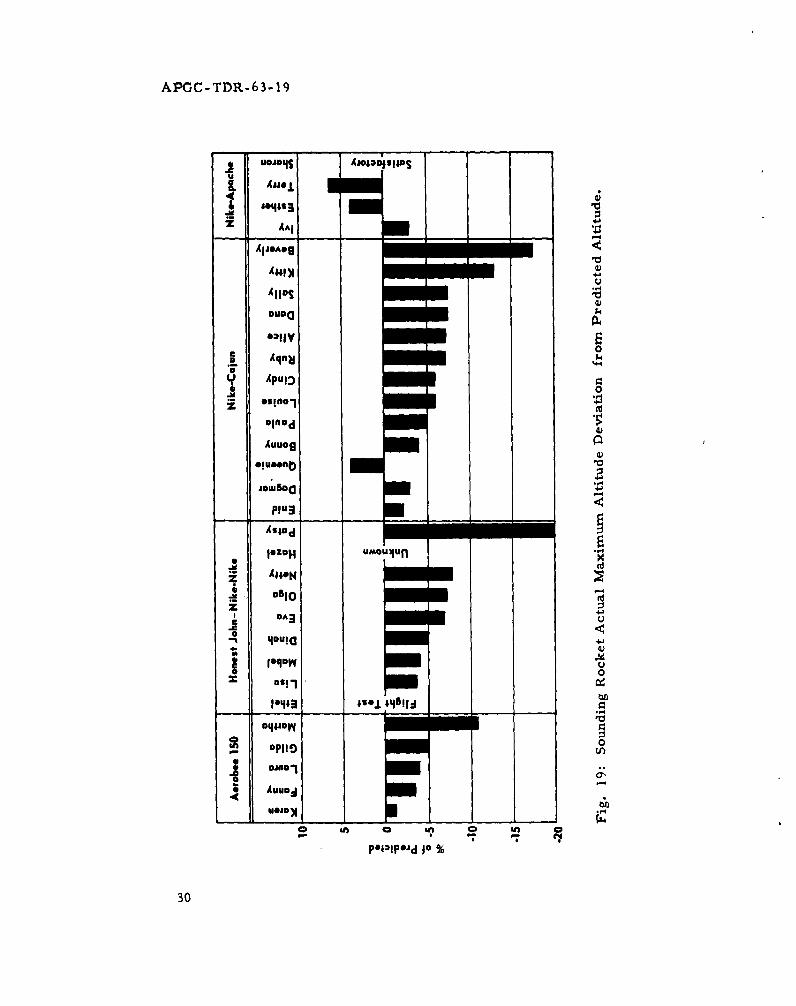
VEHICLE PERFORMANCE PREDICTIONS
Fig. 19 is a presentation of the percentage the maximum altitude isknown, or is estimated from known portions of the trajectory, to havedeviated from the APGC predicted maximum altitude. The followingpercentages are derived from the best data available, either trackingdata, AFCRL chemical release position data, or as further defined.The Aerobee predictions, discounting Martha, were about 3 percenthigh. The Honest John-Nike-Nike predictions were based upon the per-formance of Ethel, which may have been slightly above optimum. Thepredictions for these vehicles, discounting Ethel, Hazel, and Patsy,averaged about 6 percent high. The Nike-Cajun predictions averagedabout 7 percent high. The Nike Apache predictions were also satisfactory.No numerical value is assigned, because two payload configurations dif-
fered slightly from that upon which the predictions were based.
43
APGC-TDR-63-19
0 w ~~ C' aaa
.2
z z a
0 ~ ~ '~
-~ ~ ~ - - --- ---N 0N No ~~ ~ 4 ' - C
a Z '
0-~d '
inac-,Un,
N N a C; ; '
u -C * *'C - 'C "- ' - cc a,' Nc N g
4 a, iz V*r i .a 1' '0 X 0 Ka 0~~~~~e~~~ 1.C ' 0 - aa -A u C-~ ~ ~ ' ~ ~ ~ N ao * a ''0~ 01
>
4 0 C . '''O a'za C0 N
I F,. .N *. ,Z~.
04

APOC-TDR-63- 191If
TABLE 1, (Continued)
HONEST J01HN.NIKEENIKE ArcaL Mai.* Ethel Mabal Dinah V~a Natty Oilg
V hicle No. AC 20. 46 3 AC 20. 4154 AC 20. 455 AC 20. 461 AC 20. 456 AC 20.458
Zep.riment No. Flight Test 2 2 2 3 3
L unch Date 23 Oct 62 27 Nov62 3 Dec 62 6 Dec 62 12 Dec 62 14 Dc62
Launch Time (CST) I309:59.622 1759:59.895 2245:00. 147 02:. 755.2 20 6
L unch F'ad I IIHoedJon N354 04:210 2131 1639 2049
Ni1ke Second Stage SN 29017 28963 28970 28977 28989 44016
Nike Third Stage SN 281 20 2 897 1 28972 28966 77S2 20990
Honedt John Igniter Lot L SN RAD. 1-30. 50 RAD- I-I13-NA RA D.- 20-43 RAD.I- 1~3.NA RAD- 1-28-47 RAD.1 13-NA
Nih. Second Stag. Igniter SN 17 14 16 38 39 5Nihk: Third Stag. Igniter SN 23 25 23 Z4 a62Ifonest John Fin SN 1514 6 4 S I
Nike Second Stag. Fin Survey No. 1 7 5 tNtke Third St.g. Fin Survey No.' 30 36 14 IS II I
Flare, SN 12 & is 48&.5 1 & 12 I I &.19 98 3, 4 58&.8
Predicted Flare Burning Time (sec) 00 1310 65 65 6s 6S
Fayld Rjng 1 00 938 0 1918 R 1938 R8211317 R233 7
Predicted/Actual Payload Wright (38b3 343/ 32z 300 /299 300 /1031 300/134 325/3274/12
Launcher Azimunth (do& T) "59 373. 36 g4o 83775 6. 6Launc her Elevto (deg) 77.6 7008.77. 8.,4
Prditd ffciv Elevation (deg) 080 8 882.5 80 8
Predictedd/Actual Honest Joho Buroo..t Altitude (ft) 4513/4345 2 4338/NA 4117/NA 4135/NA 4089/4544' 4100/4494 2
Pr dicted/Actual Honest John Burnout Velooity (fp.) 1889/18082 18113/NA 1810/NA 3832/NA 1805/17602 1797/17672
Predicted/Actual Honest John Burnout Tinme (sect 4.8/4.7 2 4.8/NA 4.8S/NA 4.8/NA 4.8/4.92 4.8/S.02
Predicted/Actual Honest John Roil 8.8e (rpm) 0. 7/NA 0. 7/NA ID.7/NA 0.7/NA 0.7/NA 0.7/NA
Predicted/Actual Nike Second Stage Ignition Time (.rc) 10/8.62 10/ 109 30/NA 30/NA 30/9.00Z 10/9.11
Pred~icted/Actual Nike. Second Stage Burnout AIt~tUde (31) 19083/187832Z 38272/NA 38. Z19/39. 8031 3 18. 327/19,410~ 38is 150/39,85021 18,192/319,029 2
Prrdcted/Actto~l, Nikr Second Stage Burnout Velocity (Up.) 2987/29642 2935/NA I9425 Z.9713/.091 212.87/3.72 91/2.87/12.Pr.diced/Acta Hik Second Stage Burnout Time (nrct 12. 87/12. 4 32.87/NA 12.07M3.0~ 20/30 28/37 20/29
P rictedHk Seon StgIolRt re /NA 3/NA 3 /NA I /NA 3S/NA. I /NA
Predi cted/Actul H ike Thr tg 3oto ior(e) /23.7001 z5/2213 25I/23. 40 3 /23.6 ~ 25/6.622/.8Pedce/cta NIh,, Third Sta: g. Io-oo ATitue (-1) 57975 59 9 0/A58. 9S8/62. 915 3 59.,797/64, 922 S8. 667/64,030 58, 929/NA
Predicl~dj/Actual Nike Third Stage Burnout Velocity (fps) 5585/58442 5930/NA 59)08/S820I 5906/56901 S835/56442 5821/NA
Pr IdicrdActual Hike Third Stage Burnout Timvr (-0c 27.087/27. 32 27.87/NA 27.87/28.80 27.87 /29.8 3 27. 87/11.0 2 27. 87/NA
Predicte~d Hike Thirkd Stage Roll Rate (eps) 7/NA 7/NA 7/NA 7/NA 7/NA 7/NA
Perdlctd/Aetual Nike Third Stage Zenith (onm) 7Z. 7/06. S 4 92. l/NA 90/NA 93.6/NA 87. 5/NA 89.4/NA
predicted/Actual Nike Third Stage Time to Zenith (sect 186/2084 009/NA 206/NA 230/NA 203/NA 205/ 'NA
Actual Event Tim~es (nec) 323 80. 119, 147 80 79.2Z 96 80
Actual Event Altitude. (Km) 137 92.3 90. 127, 145 88.6 303.2 --
Predicted/,Actual Impact Time (sect 3S9/ 3964 403/NA 397/.'39Z 404/NA 391/378 3 19S/1303
Predicted Impact Point (Ac. deg/range, ft)Firnt Stage 159/15.400 163/13, 500 168/15,000 139/16, 400 156/14,400 31"/16. 400
Second Stage S I5/2a. 000 355/29.000 :71/29.000 339/29.000 158/26. 400 154/32,600
Third Stage 170/88 365 /91 370/100 170/76 190/97 170/97
Theoretical Impact Point (Ac. deg/raoge. ft)Third Stage 164/97 168/96 183/107 368/85 396/10z 177/94
Actual Impact Point (Ac. deg/range, (t) 6.10 8N19/.5115./71Third Stage 16./ o 57
30/NA 177/.90 3 Iss
3 0N 9/3336.71
Firnt Stage Fin Tab Length (in.)Fitn 1 +9. 366 +7. 375 +7. 445 +32. 274 -6. 48 417.73
Fl. 0 +5. 563 +9.600 -21. 443 .28. 595 .14.965 -39.758
Fin 3 +8%170 +5.425 +33.830 +10.930 +6. 56 +13. 23
Fin 4 +36.22 .10.000 -30.000 -10.000 -35.00 0
Second Stage Fin Cant (nmilliradiocnsFin 1 -5.76 .2.68 -4.40 -5.48 .6.70 -5.87
FinS2 -4.63 -2.70 .2.49 .8.2 6 .7.76 -.593
Fin 3 .4.05 .2.02 .2.3 -S.40 -33 5.72
Fin 41 -52 92 .4.0 .S5 -z2.163 5.68
Third Stage Fin Cant (milliradiannl+3.4 +42Fin .I +13.0 +13.66 +14.57 +33.99+343342
Fin 0 +13.1 +33.83 +14.96 +14.77 +13. 72 +12. S8
Fin 3 +33.3 +14.25 +35. 25 +35.00 +13.89 +12. 56
Fin 4 +13.31 +14.08 +14,85 +12.21 +33. 59 #14.22
Lau nch Weath.rTem.p.. Dry Bulb (C) 32 32 13 48
Reltiv Humidity (45,)13 42 9,1 9890
Cloud Cnver (% It Alt) Clear Hi Sold 333 Thin Sond clear Middle Ovc 25 SOdd
Wind Direction (deg T) 360 000 Calm 300 340 200
Surface Velocity (ktI 30 9 Calm 14 37 1 2
V~tielbility (nm) 8 7 7 7 6 in Hare 7
Phototheedolite nec( 3. 0 -Z. 08. Not Schedoled Not Scheduled Not Scheduled 2.0-33.0 3.0.27.31
Radar AN/MPS.19 Beacon Teach (seec) 4.0-384.0 NA NA NA NA HA
Radar AN/FPS.16 Skine Track (seec) Not reduced None 11.0-.148. S,301.347 9.6-123.0 39.145. 81319.377. 5 11.0.-33.4;19.5.33 S.]o800-3110.8S

Xthal Mabel nm..i tva N-7 ~ (Mil IHaxl Lim P86.I
AC 20. 463 AC Z0. 4S4 AC 20. 455 AC 20. 461 AC 20. 4M6 AC 20. 408 AC 20.461 AC 20. 468 AC 20. 460Flight Test 2 z 2 3 3 4 A4230Oct62 27 Nov 62 3 Dee61 6 Dec62 12 Dec 62 14 Dec 62 31 Oct 62 1 Now 62 4 Dec621309; S.622 17 S9ý59.89S Z24S00.9147 0429: 174559 928 17S0200. 16S 17S2:00. 160 1227:S9. ISS 1951:00.11S
1314 2048 1210 Z131 1639 2049 1093 1287 213429017 281963 26970 26977 28989 44036 ISO 44039 440492S120 28971 28972 26906 7702 20990 7969 26969 28987RADI). 1.0.50 RADl-I-13-NA RAN 1.29-43 RAD I- 13-NA RAD..l26 47 RAM.I- 13-NA RAD61.21.61 RAD- 1-27.47 RADMl.13.NA17 14 96 ts 99 Is 92 it Is29 25 23 24 26 22 as 27 201914 6 45 3 8 1 2 79 7 5 6 4 9 ZA 3 810 16 14 Is 13 Is 99 12 9712 h1I 46&5 91 &2 11 &19 9&694 568 Noo. I1&6 7 &1080 9130 60 6S 65 60 Nous 130 60R 2030 R19 930 R 1938 Rt 1938 Rt 2317 R 2117 Rt 2030 At 2030 Rt 20300343/321 300/299 300/301 300/334 325/327 425/328 13S5./317 325/319 325/327959 171 167 143 17S 906 169 162 14077.6 78.0 60.8 77 76.8 76.4 73.3 82.2 79.080 81 so 62.5 60 s0 80 92.2 s0
is"* (ft) 4593/43452 4115/NA 4117/NA 4995/NA 4089/45442 4103/44942 4016/NA 4146/42712 4110/44902wily (UP.) 889/180082 1lol1/NA 1810/NA 1812/NA 1805/17602 1787/11672Z 1604/NA 98031179r02 1604/18042a (see) 4.8/4.72 4.8$INA 4.8/NA 4. 6/NA 4.8/4.92 4.8/0.0 4.8/NA 4.8/4.6 4549a) 0.7/NA 0.7/INA 1D.7/NA 0.7/NA 0.7/INA 0.7/INA 0.7/NA 0. 7/NA 0.7/NA4 Time (seo) 10/0.62 10/ 109 90/NA 90/NA 10/9.82 10/9.92 10/NA 10/% 22 10/9.656it Atttulde (M6 91063/197832 18272/NA 98. 219/19,883 3 18.327/19. 4101 is. 150/199,6002 98. 992/919.0292 9 7.837/NA 16.,394/14.3152Z 9622/99.8062A Velocity (Op.) 207/29642 2935/NA 2934/Z9SS3 2931 /2"903 2 995/28372 Z916/Z8752 2993/NA 2913/39402Z 191 S2938 ;6 Time. lose) 12.87/12. 42 12.67/NA 1Z. 87/13.0 3 IZ.867/13.0 3 12,.87 /13. 7 Z 92.687/9.9 9 12.687/NA 92L87/Is.92 IL $7/13.132
II/NA I/NA I/INA I/INA 9/NA I/NA 9/NA )/NA I/INATim*. (see) 25/23.700' 2S/2239 2/231.43 .0/3.6~ 320/26.62 25/20. 62 25/NA 25/23. 92 2/a2.alA26ttcd. (ft) 57,977/59, 5992 59. 309/NA W6.958/62.9I5 3 59.797/64.922 S8. 667/64,.030 56, 929/NA 07. 034/NA 59.708/69. 3462Z.8 58. 963/91.59821Volocity (Op.) 5585/98442 5990/NA 5906/9823k 3 S6/5S690~ 3 0895/56442 5621/NA 0799/NA 0894/06632-8 5617/584SZTime. (.rc) Z7.87/27. 3 2 27.67/NA 27,87/28.S3 27. 87/29. 8 27.97/31.o2 27.87/NA 27.87/NA 27.87/26.8"~ 27.87/27.02
7/NA 7/NA 7/NA 7/NA 7/NA T/NA 7/NA 7/NA 0.65/NAmu..) 72,.7/86.5 92.9/ NA 90/NA 93. 6/NA 67. 5/NA 89. 4/NA 83. 4/NA 93/S9.S3 88. 9/3 92/73. 3ýZ.nfth (ec( 966/208 209/NA 206/NA 290/NA 203/NA 265/NA 199/NA 206/2033 205/2033
929 60, 119, 147 80 79.2 96 so No... None Nom.137 92.3 90, 927. 145 88.6 109,2 -- Non. No... Nam.3S9/ 3964 409/NA 39?/.392 404/NA 391/3783 ;95/383 3. 362/NA 401/4213 3"1/3723
t959/5,400 163/93, WO 968/15.000 139/16,400 956/94,400 158/16.400 169/18,900 156/9000 170114.200908/28.000 155/29,000 171/29.000 139/29.000 908/26.400 134/32.600 167/32.400 994/221000 170/28.900170/88 965/91 170/100 170/76 190/97 170/97 172/1110 170/65 170/97
164/97 16s/96 163/107 168/85 196/10Z 177/94 975/999 164.S/73 985/96
164.5/ S04 I9S7 10
/NA 177/p0"3 ISS 38/NA 193/919S3 165. 5/763 NA 166/493 1711/663
+9.366 +7.37S +7.445 +12.274 .6.48 +17.73 +8.297 +9.10 +17.68+S5.61 +9.600 .23.441 .26.595 .14.965 .19.708 -16.104 .14.11 -24.88+8.570 +S.420 +19.810 +10.930 .6.5S6 +13.23 +M2.411 48.44 +%.69+16.225 .90.000 .98.000 .90.000 .95.00 0 . -10.00 -95%.00 -30.00
.-. 76 -2.68 .4.40 .5.48 -6.70 s.5.87 -4.81 .2.06 46.35
.4.61 .2.78 -2.49 -8.06 -7.76 .0.91 .5.36 -L60 44.42
.4.05 .2.02 -Z. 15 -3.40 .3.11 .0.72 -6.49 .1.93 +9.52
.5.20 .1.92 .4.00 .2.61 -2.61 .5.68 -5S.94 -1.39 +9.46
+13.0 +13.66 +14.57 +19.99 +13.43 +14.23 -413.97 +95.05 Q2.99+13.1 +13.83 +14.96 +K4.77 +13.7Z2 +9. So +13.88 +13.9" +3.49+93.9 +14.2 ZS+15.25 495.00 +13.89 +12.S6 +14.15 +13.64 +2.89+13.1 +14.08 +14.&S +12.21 +93.59 +14.22 +14.24, +14.71 03.39
12 92 99 5 14 8 95.5 11 is96 42 985 9 a7 25 90 9Clear HiI Sctd 146 Thin. 8,34 Clear Middle 0., ZS sets Clear Clear CIO&?360 020 Ca-.. 300 340 280 340 095 370
909 Calm. 14 97 92 92 is 767 7 7 6 inasa ~ 7 8 it 7
9.0.26. Not Sch~edulIed Not Schedeed Not scheduled 2.0.33.0 9.0.27.9 Nest L 0.26.8a 2.S.27.34.0.3$4.0 NA NA NA NA NA NA NA NANot radwed No. 11.0-1416S,301-$4? 9.6-123.0 19-14% 5,319-377. 3 1833.41 nowe I).0.30AS10. 5.411 11.0.372
45
APCC-TDPR-63. 19
Sz zo - z
u C NNC .OqC R H0~ +- +
a0 m <A NCzN~ C < 0 -
N 'a, Cz
N ZZ t
.0v . . 0 .N C. . . . . , v.
0 CCN ~ 00
46C <000O~ N C ~ *

TABLE 1. (Continued)Il
NIKZ.CAJI2N - AFCRL Nan.e Alice Breands Oo...ia Paula Baby Carol Rallym- -11-=
VePhicI. N. AC 6. 434 AC 6. 435 AC 6.436 AC 6.437ACi43AC636C6.4E..cp~in..t No. 1 1 S 1La h Data 6 Oct 6Z 17 Oct 62 19 Oct62 25 Oct 62 Nov.Z' No62SNv.Launch T in. (CST) 511100. 090 1900:00. 132 0517:00. Z4 0521:00. 03 5 OZ.00S OZ:O2:Laoncl Pad 2 A Z 3ZaNil.. SN 28947 3474S zgIZO Zll114 2902346 98
Cajun. SN 0'V_16.)ZO.9 FV. 16-6-18 PV 16.163.A PV-16-8-13 IV 6 2- ,V 6138 P-6Nike. Igniter Lot &SN RAD-Z. 146-56 RAM 2_ 146 RADZ A146- 3S ItAD.A-146-17 ft -Z D 4-1 NAI94 RA-2C. Jun Igniter Lot & SN NA/-All TED-S-A.3-430 NA/-A TED-3..A.9 TED-9 .1 TD01 -ED-6Nike Fin Survey No. lOB 3 13 IA1 1Cajun Fin SN C_1019 C. 1013 C-1009 C-1004 C_ 103 6 C-1037 C.1038FlaeeIN 26&3 26la1 No- None. 17 L14 116&18 6 &A0t redictod Flae. Burning TimeO Isec) 130 s0 NA NA 80 s0 69,'.Yload D..lg. R 1689 R 1669 Rt 1689 Rt 1689 Rt 1689 It 1689 Rt 1699l"'aiod Weight (Ilb) 1929.1 S g/9Z.25 85/66 81/90 90/90 90M9 90/89Launch r Azimuoth Idell T) 191 164 201 194 186 196 144Leonohee: Elovatio. (dog) 84.8 86.8 81.5 84.A 93.A 94.Z 8A.ZPreedicte Ell@cti . Elevation (dog) 8%.4 8A.9 86.7 86.6 86.7 09.1 85
l'e~i d/Actual Nil.. Burnou~t Altitude (Ift 4Z7S/S8397 4213/6036Z 4Z7 3/NA 4289/NA 4276/1 0992 4270/NA 4A60/S7Preddiclod/Actual Nilk. Burou.ot Velocity (fps) 3279/308S7 3287/31392 3266/NA 3279/NA 3268/3114Z 3269/NA 3269/30
:'rdi ied/Actoat Nil.. Burnouct Tinm. 4000 2.87/3. 57 2.687/3. 62Z 2.7/NA 2. 87/INA Z. 87/3. 52 2.867/NA 2.87/3.rr.dicted/Actual Nil.. Burouot Roll Rate (eye) 1.9S/NA 1.1S/NA 1.1S/NA 1. S/NA 1. S/NA 1.1/NA -I./,
I ed~cie~d/IActoa Cajoc Ignition. Tinm. (meet) 17/20.110 16/16. 102 16/NA 16/ 18 17/22. 369 16/No.. 17/16,8A .. iie/cla Cajon Burouto~ Altitode (it) 46, S74/49, 1092 48. 261/41,.776 2 47, 124/NA 47, 199/NA S0, S16/S7. 199~ 10S. 469/NA 90. 277/
l'eediciedd/ActumI Cajun. Burnout Velocity (fps) S016/47342 5009/24622 4666/NA 4949/NA 1184/4967? 1170/NA S162/99ledi tod/Actoe. Cajun Bu nout Ti.m. (see) 20.6/23.62 19.6/19.2* 19. 6/NA 19.6/NA 20. 6/Z6. 2 19.6/NA 20.6/22
leedicted/Actuat Cajun Bournout Roll Rate (rp.) 6/NA 6/NA 6/NA 6/NA I/NA I/NA tuI/AI .edicted/Actoal Cajun Zenith (non) 61t/NA 60.3/INA 6i. 4/NA S7. 3/NA 67.7/NA 67. 9/NA 67. 0/N,I'ed~icted/Actual Tinme to Zenith loee) 161/NA MI3NA IS8. 3/NA 160/NA 1741NA MI2NA 172/NA
A "uaI Event Times. (sect N.R.. 115. 140. 14S Noa. 100.8, 110.6, 121. 3, 131.1., 101.6. 118, 7, None 10 5. 1Is!121. 136.6 146.1S. 166.8 132, 113.4
Acttal Event Attitude. (K..) N. R.. 93. 10 1. 2. None 90.7,95.7. 91. 96. 100. 4. 100.4 96. 109, 113. 117. 2 Noe.. 96. 7. I C
101.1 to01. 9. 06 100.4 112.0
"Itedicted/Actual Im~pact Tin.e Joec) 326/NA MI3NA 31S/NA 318/NA 346/NA 344/NA 343/NA'cedictod Impyact Point (A.. dog/range. mna)
Nik. 162/4:400 160/0610 158/4800 139/S000 192/7160 138/3600 143/10,Cajun. 17Z2SA 164/37.5 174/17.S 190/116 166.19.S 190/27 170/Z9
C~ajan Theoeetic*l Impyact Point (Am. dog/range. not) 178/26.2 16z/38 189/15.2 197/19 167118 198/2S 176. 9/lCa.Jun Actual Impyact Point (A., deg/eange. on.) iVI86/NA NA/NA .1.520
10/NA PJ214 I
0/NA 207/ Z93 NA/NA 01187 10
Nih. Fin Cant (nmilliradlans)Fin 1 1.92 1.04 3.73 1.99 3.45 9. 14 49Fin A .65 1.44 2.60 2.46 9.20 4.12 -.9.191
1i 3 2.74 0.92 0.09 1.19 4.716 0.40 .4.58Fin 4 3.01 0.12 2.01 0.72 3.01 4. 40 -3.79 2
r.j.Jtn Fin Tel. Length (in.)Fin 1 4.88 4.96 5.69 5.27 A (Two Tal.s) A (Two Tuel.) A (Twoofi:n Z 4.73 4.76 4.76 4.751 tel.. tal.. tab.Fin 3 6.05 6. 46 4.S3 5:11 180, ISO* 150,Fin 4 1.00 6.27 S.64 6.91 Apart Apart Apart
Lnc h Weatherle.,.Dry olRuh(C) 7 9.S to 6.8 S.9 8 6.7
rtelai,. HIurnidity (f) 87 66 84 69 60 79 67Clotd Con.. 1% & Attitude) clear Clear Cclar' Clear Clear III Thin Scld ClearWind D~ir.et-m (dog T) 030 310 030 010 010 OIl 100Socrete Velocity (l~Id) 4 6 12 8 11 6Vinilblliiy (on.) 77 is It0 10 7 7
1 M t., Obltai nedI htatnheodoit. (e17.) 3.5-29.6 2.1-81.4 Non. No.. 1.6-26.0 None 0.3-27.li. dar ANIFPS-16 (*ee) Not Sch~edule~d Not Sch~eduled Not Scl.eduled None 10 6 10. 4 No.. N.ne
213 3S.3
NA - Not applinableoo c Rt anailabl. 2. Centraves Phapotbetagoolite tabulated data. 4.- AN/ldMM.19 beacon trael. tabulated data. 6. AN/MIPS.I - Cantoawas Pbagttoode~dlits aimn data. 3 - Aw rips. It skin teec. tabulated data. 8- ANIFPS. 16 shin trac. pee plot. 7 . Fleet jat,

rot Sally Beverly BonnY Dilgma Cindy E.1d Loot.. Kitty Dn
6.436 A C 6. 410 AC 6. 445 AC 6.441 AC 6.441 AC 6.44Z AC 6,444 AC6.446 AC 6. 446 AC 6. 447S 6 6 6s pecial 7 7 Spbti.1
,6Z 9N N- 4z 6 Nov62 e 23o6z 16Oct 6Z 7 Octl 6z Z5 =62 22Oct 62 21Oct 62 10 Dec629.. 0549:00.00N 0 200:00.2135 0 S2:00.795 1 840:00.0 55 OS76:00.047 0030:00.06S 3979:00. 133 0519:00. 700 1 929,59.063
4 29112 1040 34740 MIS7 Z9974 ;a985 347467 28983 9291.6.6o '. 16. 7 10_.0 - IS- I.7. 29, 7'V1620.12 PV-.16.07 PV- 16- 1 0.70 PV-1.6-124-IZ PV-16-124-13 PV-16-8-14 PV.216-7zo.16P,: 7A D. 1. 14(-.71 RAMZ..146-.1? 3 RAD-Z_.146.1126 RA73.2.746-52 '2AD-2-146.369 R AM3Z.746.i0 RAD-2- 146-54 RAD.2.7146-.IS itAfl..41-317
D-.002.2.1 T t: .6. 2.9S TEI)9.1-8 TED-6-1.3.241 TED-5 .3.7..27 TED.6.7.4.236 TED-00 I- 1-3-47 15 ED.3.2-4-23s - T ED.9-.1- 1I9 N2 I A s 4_ S 6 7None
W127 C. 2075H C -2001 C.2020 C-1018 C.2006 C-1007 C-1016 C.1017 C-1021In3 6 & "o 2614 1367 6 967 6 36&70 No.e I & 46&8 36L7I3
6S 63 0 80 go so so 80 6%P20 72 689 R0 7689 It 2233 72' 2so R 225 so /3 Rt 2250 R2 7874 R 7R74 -
M6 930. 90/09 90/90 90/92 90/92. 9 67/65.S 70/73 7S/71 60/59.S9124 197 284 165 773 783 167 169 162
022 82.6 32.0 82.4 70.6 80.6 76.5 77.4 84.8.96 0046 2287887.7 86 811 so I2.I/NA I260/97s2 .NA 4239/1730 42ý44/NA 42S570 434/NA 4?6;,.,230Z 4277/ 3 4362/67552
77/N 169/ t042 '-NA 3Z2709/37222 3270/NA 3Z77/31 IF62 3329/NA 331S/31682Z 3316/313SZ 33411/31132:2/NA 2 * 7/3.5 92 .. NA Z.88 13. 12 2.88/NA Z.880/3. SZ 2.88/14A 2.87/5. -2 2.87/3. SZ 2.67 /3.61
.7.9/I NNA 12. N/NA 7.5/INA 7.3S/NA 7.5S/NA 7. S/NA 7.3S/NA 1. 5/NA 7./NAINo.. 2203. 77/22. 46S 17117,60S 1 16/151911 1 17/17,436 76/INA 176/76 .8 16/16,9351 ';/ZI.471* -79/NA N0. 17717/lo0414' 30. 27/7. k 4Q, 821/48. SzAg 49.9217/45.95222 49.653/47,.0012 57. 026/NA 491.844/6 7935 Z 0.OZU 0,t591 2 51. 084/5%32ZZ40/NA 9732/90,9 ~ 379/46947 3 9576/S3008 5777/7 512 3776/50752 5557/NA 1,432/53372? 9439/S3533 Z 676153835.6/1NA 10. 6/12.142 Z. 6/27. S 20. 6/21.7 12 9.6/19.32 20. 6/O. 6~ 279.6/NA 79.6/20.22 Z79.6/20. 4 20. 6lZS.4 3(NA e. I/NA '_-2/NA .004/NA +0. 146/NA +0.799/NA +0. 99/NA +0.3S9/NA -0.2Z3/NA *0. 621/NA
I(NA 67.0/ NA 66. 6/N'A 65.: 9/NA 63. Z2/NA 64.2/NA 76/725 68.2Z/NA 69.z/63' 77. 271.3 3/NA .722NA 17 2/NA 220/NA M70NA 769/NA 183/ ISMS 1773/NA 176/NA 209/787.53
2091172..6. 1-7. 247. 2 _- 99- 88.8- -- 3- 100.4 122 70g
116.7. 102. S. 207. 6. 89.1. 91..2, N. It.. 97.2 03.8. 736 84.2 881.6,77Z 96.7 l08 703.7
7/NA 147/ýNA 10417/N;A 5422/.. 140/-- I38/-. 3698/343l MI2NA 753/708 1681469
:/731: 247/70.o 10 41/7900 766/3160U 1767/300 27a/9300 169/4200 742/9705 1%7/77,000 156/17,)300s0/7 2 70/29 770/31 168/44 16q/47 1701.7 1 70/27 170/57 769/61 113/4930/29 176.3/72 706/33 169.5/47 1611/46 171/53 191/28.4 173/64 272/b9 209/39AJNA Moo; 10/.. n7226 20/. .471.3 5 l/NA -i~l
7 0/NA A30.3 S
5/NA Z02/28.53 ~ M287
7 0/NA 1 -j. . 209/§6.S3~
.4-4. 49 .497 +S.514 0.79 +4.8 +6.2 4.06 3.20 4.0-22 I9n0 .4.46 .6.S6 03.63 +-4.87 07.3 3.78- 4.76 4.0
.40 .4.78 -4.77 +5.90 42Z. 46 +3.69 +6.21 4.3S9 4.33 4.0.4:22 1. 772 -4.60 .4.39 +1.96 +3.6a +4.5 4.3AA 3.02 4.0
0 Tbnl 2 IT.. Ialb.) Z7 Ie I~..7In Non, None None None None None Non.be Wl, tab" None Non- None N... None Non, None
00 ISO IO* None Non:' None None None Non.N.,~Ae p2 a rt Apart None None None None None None :v
6.7 6.6 20.9 9 6 20.3 28 -7 0fl;7 8*8 09 '2 87 06 94 30 22
II Twon Sold Cle.r 77 Sold Cl... C'-r Clear Cloea Clear M~eo clear-IN t00 04S 072 051 360 020 330 3510 2301 6 to 703 4 127 20 72 70 72
*7 7 7 7 7 7 7 8 7
;e 0.7.-27.Z No..7..2. 4.7-27.2 2 .4.26-2 None 0.4-26.0 0.6.23.3 4.7-2%.44ooe None 72. S3.2.7 Not Sol doed,, Not Scheduled Not Sohedoled 236.S-1784.0 N... 289.1.705.7 14.6.460..
522.3.947.3
ia. 6. AN/M PS- 19 beacon track pen plot. It - Lent deta point feom tabuolated data. 10 -Derived from, AFCRL chem~ical ponition date.7 *Fiest data point fromntalbulated deta. 9 - Visual ob ...eotinn.
47

0 *
w~ z
1111

h-h
- ~~ ~ 1 -- --s
APGC-TDR-63- 19
oG0-4
zU ~oo
>4 10
z a
NX
ac - 0 -f-f
0 oý S0- je o -
4,
I0 W
10 a
44 -L,3 C'n N N
.. U
49

APOC- TpR.63-19
. U
'-~~~L ..-- ga' lo
01
Uoso o
oo 0' -
50cco

AFGC-TDR-63- 19
N
Z0
0-
n
E"m '
UU
10 0* -0 --
00 000 t
0DaN 4 C
0U "0
j-4n
IVI51

AFGC-TDR-63-19
4
zu W~c~
E-4 I vU3
u-u~I
52qr r c r

APGC-TDR-63- 19
N: if
IL
g ;un r
0NUo
.1]~ ~ ~ j~ Ln'~ 0 0I'v
.Al 0r 0 j
c5

APGC-TDR-63..19
Ln all 1- 0 00
00 , u
>4
00
541

AFGC-TDR-63- 19
a' +
.0ONC-
0
* In-
a a U
N 10
I-4 1
3.~0 o
N r o I- w14
a.02
co a,0000
t- f-a c~ooll I 55

APGC-TDR-63- 19
E t i g o I is - N N 0
I; sbt~~ N I ~ ~ ~ - N 0 g O
9. m N. P0
- ~ ~ V N N N N
0 0 - - I - - , - -- 0 -0
cal soout01 p. t em n o 1N 0.1ot00 1 cON em le 00. 0 11a i u 00N 0000 COLI01 O WN
Og N 0 0 0 N 0 0 ; g 0-
E-4 .N 4 00- O l 1
0 N 0 C NO N O 00 N
INO IN N- N CnO I M I N ONON N N O 0 0 O N p
.00.o 0 0. 0 00
N . 0N ON NN 0 0N . N, CN C. - NN~~~ 0C.CO 00 0
8~~~ 00-0 ~ .- -- - -0 - - -
N N - 0o C I owl00 0
0 .0 CN00 0 00
m00Z . N Co -0 N
N1 0.8 A. A C - . Z . C 0
N
N2-2.
00
0
C
";-ON OCO 000 C1l
-~= Ali0- 0 C 0 0 .
56 O 00 0N ~ OI

APGC-TDR-63- 19
001 u Im OZ001 e 01 1 01 &1 01 u lollioozO $ 3011ml 2-.Om .0mozo
Z2 a. ;ý .
o So 0N ~ 0 ' 0 0 ~o
o .020N 0.Ný oO
- -
o~ ~ Iz 0I 0 - 0 ' 0
0 ; -- * o. , o 0
It ' E 'a - - - - - -N - - -- -
ON00l N .0 . N.N N O 0' O 0 . . N N
f 130' 20 Su l m l' .0.0' O.u. . . ..t0 N 0'.
o0.0 ON '. 0'N 0 ~o0 0 N 0' 0000
000
.0 .*. N7
Ia is M ~ a !MI 1M !z x -z
0ou !ME b* Eli W: 1 -:W A A aivI
f ....Zo I= "• :" = • = ' ' Rat. ° ON°20:- 2 Q 000002U'o 0
N 0 000. -+ NO N+.: 00. 0 =- - 0, 00, N;o . ,O O* qSs. -o -z E
UK- .'N , C NUN. z 5 N
on Am Ow MROM_-1, W1 .o2 ., NM On NNNR .. N.O
Q1 WC. 1W2. R .. ' ; -0 sW"
Had010 MA -1; 11 Cv- Q-- wi h0Usitil
UI i NiON O O Q ; il 525i ONONONON lawN !W
o.+. 1 -..2 2_+.. 0
- -- 1 1 ' i S ; 1 0
; N C
C 0. 0U. , . . N..o . 0
o CO NC NO NOC o-
i. .. - -S 9. No U1
o o . . .. -- ..- N - U-, 0 0 .... , i l " .;-..•-0.. .
I -""!° " + • - - -:+ .':. + -"
o U, a m . 0. i 1 a a aA
C0 U .. C_ 0= 0.• . - - " a ail a i Nz. N . -
Jim
I o) ~ [ I 3 I C. . 0NUNNN .. 0 2 • •U... ~Y~ - l-~ -W - -U-
C tL.0 U ow U,
N.- N UN0- 0m U, 4C *UL4) 00 NCO00 0C~~ N N 060 __ loR
058_ 1000
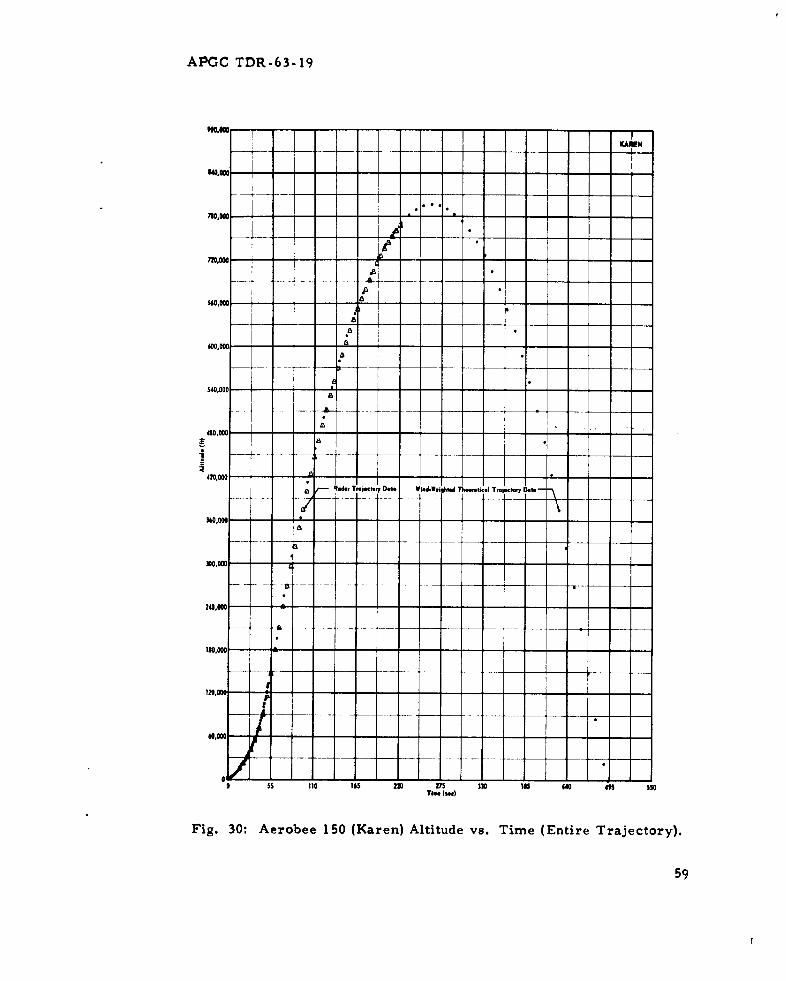
APGC TDR-63-19
KARNE
MAN0C - -4- - -- - -
fl00C-w
340,0K 0
1" '- --
S40,0OM - - - -
t To-- ---- 0- 65 2M 27 -3 M 40 4"5-
d00.00i- (w)
Fig 30 *1e 5 (ae)Attdev.Tm EtieTaetr)
420,0 - - - - - - - - - - - - -9
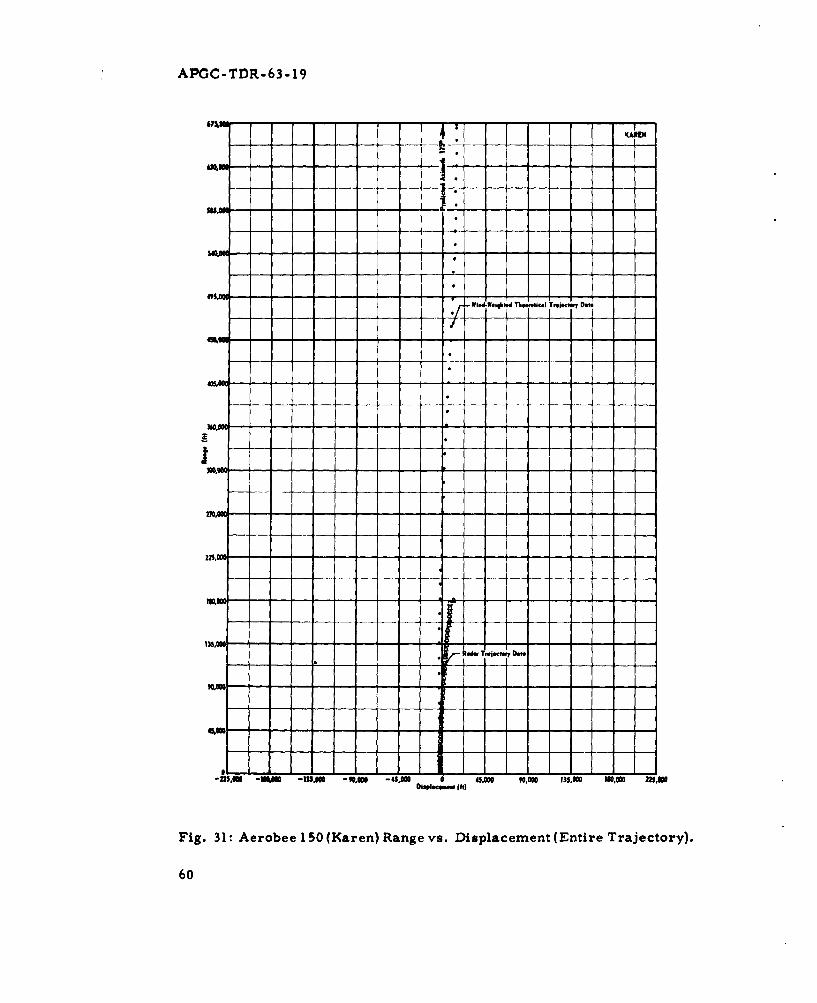
APGC-TDR-63-19
-" OO T--i t- .I
IMOO-
I '
-1. 1IS -135.10 -91,0 45.1 0 45.1M 00,00 333.16 310,000 23S.06
Fig. 31: Aerobee 150 (Karen) Range vs. Displacement (Entire Trajectory).
60

APO C - T DR -63-19
z-I- - -� - -- -
I
$40
U4)
- - - $4
4)$4
----------- r----- - - -
- -- --- I. 4)- __ ____I-
I- - - J
aI
4.'I U-- ---------------------- * 0
4)
42d
- -'-----.
42 4)---------------.-- $4
42
42-� 042
.42 - 4)- 4)
42/ .0- 42f------------------------------------ 0
* $4_ A 1.� 4)
-- N42
- %�42------------------------R
. ' . . �I* I.. I
--------------. �.'-v. - -
.... �1 -I S I I S I I I
�4I"I*A
61

APGC-TDR-63-19
LAURA
7207
54000
3.4., TJ-wy Dot.
d T
420,00 -
30.=0
20 3. 0- -
T" . .
II
Fig. 33: Aerobee 150 (Laura) Altitude vs. Time (Entire Trajectory).
62

APGC-TDR-63-19
165
I 5000
75S.0w) -
60- 0 - I -M
Taa
1 f
-0- -
[AA155.0 -------------------- T--c O~
aa,
TM.
a.•
Fig. 34: Aerobee 150 (Laura) Altitude vs. Time (Trajectory Throuzgh
Burnout).
63

APGC-TDR-63- 19
MAN0 --1---- 1---
INA : t" I I
- -
Fig.~ 35:-erobe 10 (Lura)Ran e d vs. Displacaoemet(E ntiDr e Trjetoy)
64"----------
43.d- TId.W.Ig&rd Dr.I.-,"y D.,
Ro;. T.I.t. Dt
a
- -..- ~ - - - - - - - - - - - -a
Fig. 35:10 Arbe10(ar)Rnev. Displacemen (Enire rajctoy
64

APGC-TDR-63-19
1~
S- -
,_,---4
Fig. 36: Aerobee 1 50 (Laura) Range vs. Displacement (Trajectory
Through Burnout).
65

APGC-TDR-63- 19
I i I B I i i
-•--- - -1 -
t'. * O
-eoct (fps),-
14
.49
10
04
66 -- - - • Ifn
-4
• 4'
4'~
66

APGC-TDR-63-19
,P4
P4
ilie
0
* A•1o 0
- -- 14
" I14
• 0L •4.'
IU
A N1
I --• U
I6
g.

APGC-TDR-63-19
a I.Wrgid .... ct . e i
Sa :
a
-R.&r T-Jc-y Dft
-"-a- F - -•-
77 "L at
a a
24010H
V $5 10 165 220 275 330 395 440 STie (w
Fig. 39: Aerobee 150 (Martha) Altitude vs. Time (Entire Trajectory).
68

APGC-TDR-63-19
-1i-1 A-- -
It~d. T.*I...pDo% a -
105.00 - -
Wi.d.Weig&, Tk"-fts TI t~k~ NY D
la
45,11 -
to 24 3t
a&
aA
! .o
LaP
Tim.. (me)-
Fig. 40: Aerobee 150 (Martha) Altitude vs. Time (TrajectoryThrough Burnout).
69
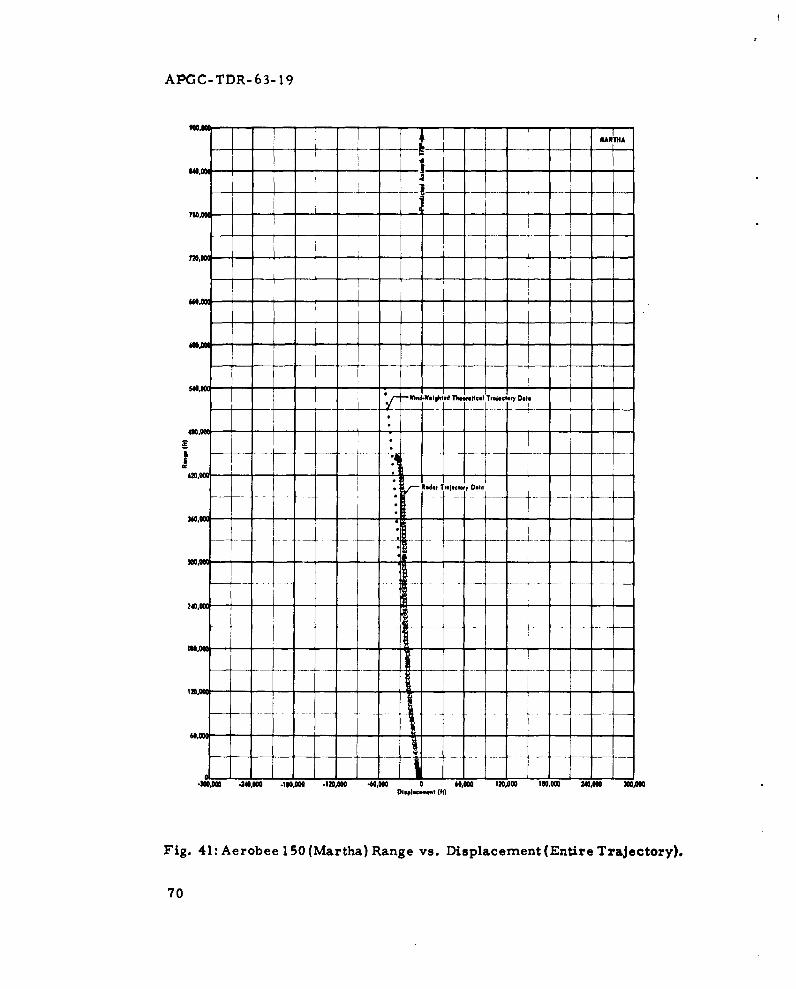
APGC-TDR-63- 19
•d., Nw , w.
i M - -4----- - - - - - - - - -
24000
410,000 -
-w -2,11 .7 4807Th
0,00: 00-
t I I - I
F SiO. - - -b- 1
70.
Fig. .100,0"W40n800e.1i000e100.1 24.000 300Tr0
Ill •O: i - - .1000 4,0 0 6,0 2.0
Dg~earat(t
41:Arbe10(ataRagv.Dipaent(treTaetr)
70a Tic yDi

APG:C-TDR-63-19
•-K- ---- 4 -
U -•
MR N
a
32,000 -
210CW,
S Wied-Weiphted Thee..tk T~Iec., e
a.
•0 .16,00 .MA.N0 .4w0 AM 0 4000 000 12,000 16,000 X000Dishsef". (109
Fig. 42: Aerobee 150 (Martha) Range vs. Displacement (TrajectoryThrough Burnout).
71

APGC-TDR-63-19
I -
-ci04J
* U
'4
-3.- 6141
41
- --- 1V
a
* IU------I---- A
I -- �- -- iA -
- -- I--- _ _ *1 -�
*1 * 41'.2
0
'.2
- 1------�--- 41 -* 41 @1
0)-- A-- .0
3 0'4
- 0)'.2
* .2.2
.2-- I
�2
���iI�tiIi - _ -

APGC-TDR-63- 19
-l----I
"i " .-- - --- .. . .. . . 04
-(J
1 16! ! I | i *I I •
_I-------------------
-I ~ - -- -4)7-
a'?

APGC-TDR-63- 19
Jw,,.
Rd.2 "ýnyDt W WlhdT v. ~if o]JOANN
Aa
74 .
AA
d " . . . . .. . .... . .
dA
43------------------ - -- - -
Jasa I--------------------------------------------------
43.----------------------------------------------------------------
Fi. 5 Aroe I-0(an)Attue-.Tm EtieTaetr)
42, - - - - - - - - - - - - - -
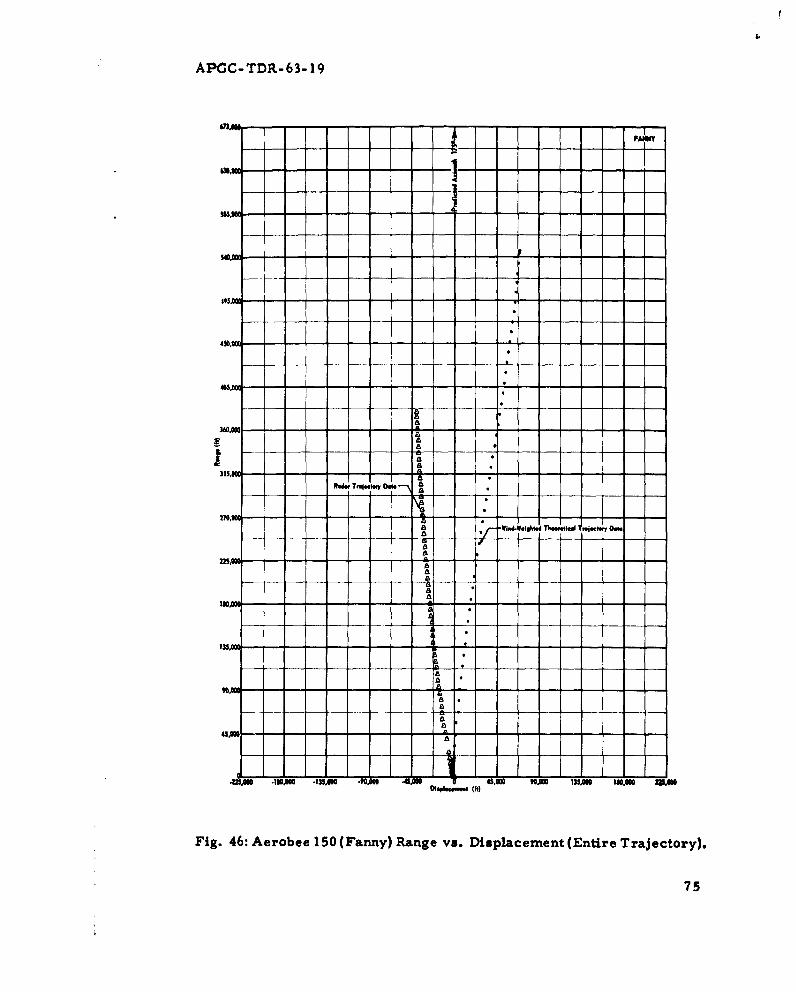
APGC-TDR-63-19
01AMY
MAN
450.u
40510%
Rs. - - *W -fa
315500 4500 -. 1-5 MA -
a vi
-- -- - 4-?
ci.o - - M
a
ca
a
Fig. 46: Aerobee 1ISO (Fanny) Range vs. Displacement (Entire Trajectory).
75

APGC-TDR-63-19
ro.4.
I-I-,
0
76

APOC-TDR-63-19
600010
2 - I
Al
420 --
aelm L
nom -
55 ItO 165 220 275 330 38 44 495 $5Ti... (mlc
Fig. 48: Aerobee 150 (Gilda) Altitude vs. Time (Entire Trajectory).
77

APGC-TDR-63-19
USA
450,-K
305,0M- -
- - - - 'tyD .1b- -
- ---- j---
Apo~~~ --w' --M~ ."M -43I fi p ",O -s, 10-0
Msoo- -ft
Fig.-~1 49-eoe S Gla ag s ipae et(nieTaetr)

APGC-TDR-63-19
4F4----
- -04
,"4
---------------------------.e0¢q$4
_ _ I z
-_" __I- - - - - - - - - -
--------
a 79----------------------
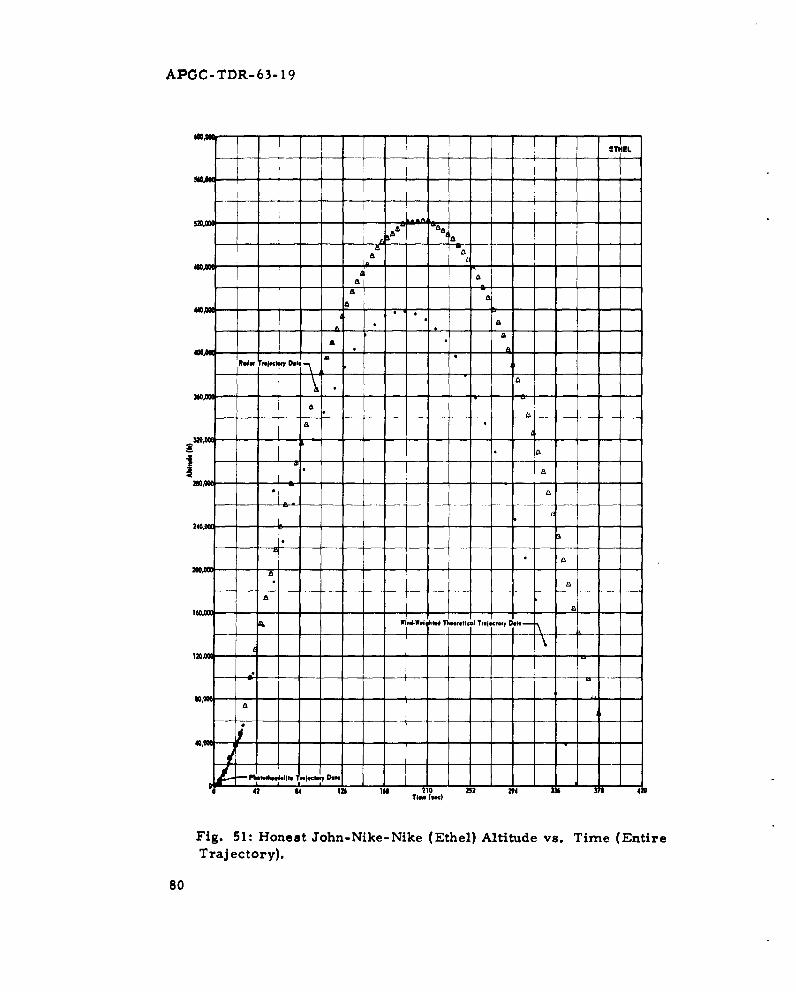
APGC-TDR-63- 19
MAN
200AD
4+A t•a
A
16, a
Fi. 51: -Ho------------- t------------------------------
Trajectory).rt~o Tolcor, )e -
80l
-- - - - -
34.----------------------------------------------
4• 8 126 164 10 22 29 3.1 37200e(s a
Fig. l: HnestJohn-ike-ike Ethel Alttudevs. im(ntr
T a~ ctr)
1408- --

APGC-TDR-63"- 19
130,3 - -- -
1 0 0. 2I0-I- I- I-[ IT
nt
90. I -
Fi. 52 HoetJh-ieNke(te)Attd-v.Tm Taetr
g b~qd.. T,.jec..ry Delt ---
Pheiet.ed.Il,. T..Ie m D~le .•1 5- - p •1Pd.Weitld h et. etI.. T..i..t..y D.t.
S S i0 15 30 T 2~e) 30 35 4 5 3
Fig. 52: Honest John-Nike-Nike (Ethel) Altitude vs. Time (Trajectory
Through Burnout).
81

APOC- TDR-63-19
M.--
IffE- - - -
/"Wind-Wei rfed ThMere1-a T,oiecwy Dt
120
40,W
440.40N000 000 1"00 4
a---------------------------------a ip ý
Fig.-----------------------------------)2------ Dspace en(Entre Tajecory)- -82- ---- ~- - - -

APCGC-TDR-63-19
3* -
-IF
27 Red., T Ifcw Daft
11,50 -
is,
r ; rW,•-.,Wh.i d Th..,. T.Ic . ,.T o...
D e • T J a
(.l
-1000-,0 S0 O0 *O-1,o
Fig. 54: Honest John-Nike-Nike (Ethel) Range vs. DisplacementTrajectory Through Burnout).
83

APG C -TDR -63-19
4-.-a u
4>
844

APGC-TDR-63- 19
- - - -- - - - - - - - - - -
b~e2 H
0
,J-
(I
1 4 85
Ao 4)al•
S - -- - - -84
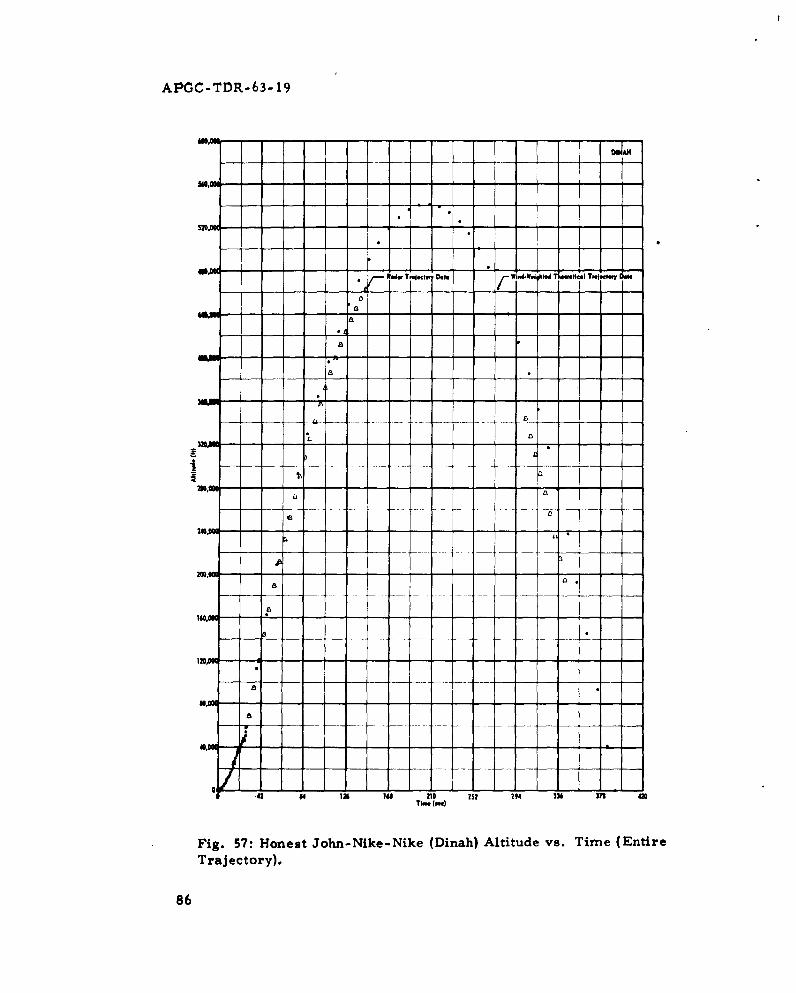
APGC-TDR-63- 19
-- �rDINAh
U..
-I. -
* ft.dw T.I�t, Dii. p Wi.4W.i ..d tImI T..j..iay Dut.
88
a
8
8
- - -- B
L B33 - ---- -
Iso, - ----
B
240 - --
200. 8
8160,00--
15,00- -
8
U,. - - -
a
40,00 - -
I -
42 04 15 141 210 232 294 336 370 15TI.. (..�l
FIg. 57: Honest John-Nike-Nike (Dinah) Altitude vs. Time (EntireTrajectory).
86
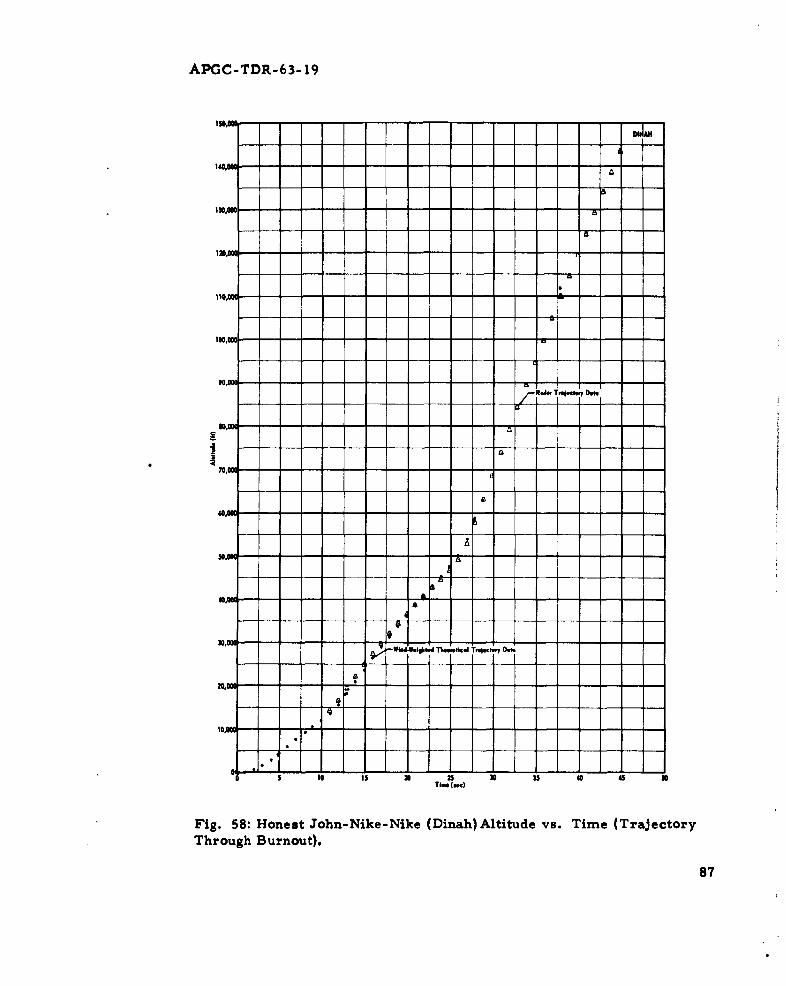
APCC-TDR-63- 19
130'M
T
:-
S-1iWeig-Wel•d Tlaw~fice[ Tmlewtm 0.
tot
TI" (wal)
Fig. 58: Honest John-Nike-Nike (Dinah)-Altitude vs. Time (Trajectory
Through Burnout).
87
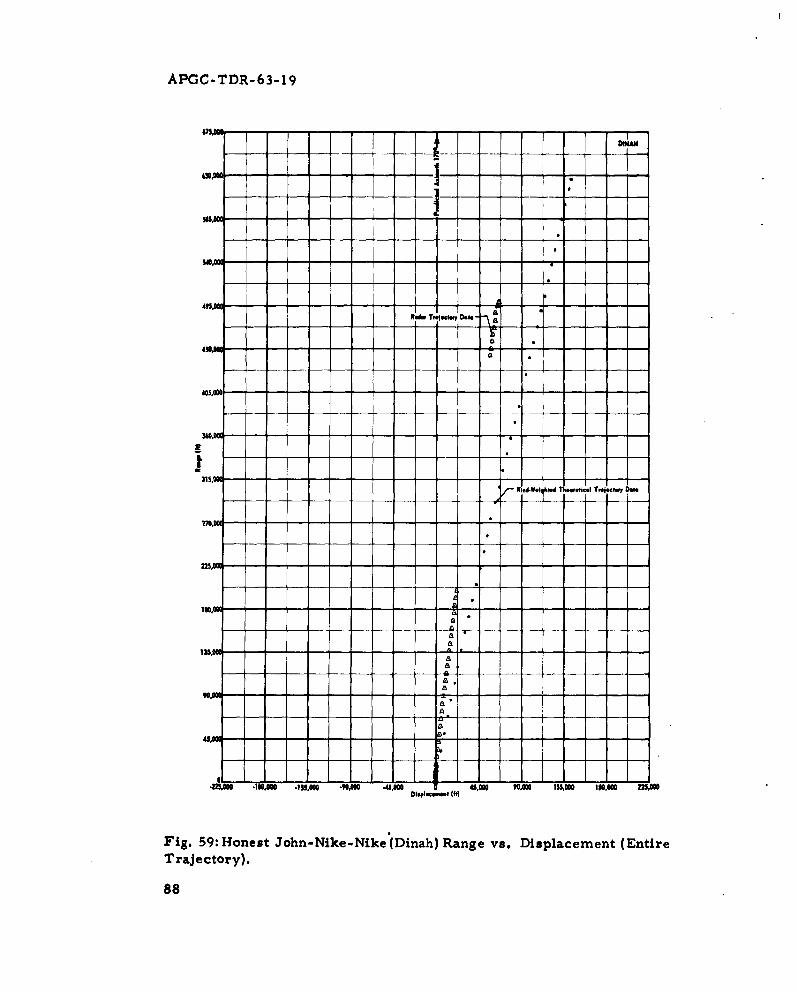
APGC-TDR-63-19
I '
MANMae. T.eIgcw Dft a
451M
40SAD0
A70 - 10' - U -" -Go 4 -00 "AO-3M 10,0
Trajectory).
88•
a.
90, -
•ms *Id0 .1350 -*,0M0 -43,0 45S,00 990*0 135.00 1l00*0 225*00OispejIe,,..t (CR)
Fig. 59: Honest John-Nike-Nike'(Dinah) Range vs. Displacement (Entire
Trajectory).
88

APGC-TDR-63-19
4H
V~!.
-
A
25,0
A
Ulmu
VAA
II
4. Til O..12,•
A
101M _M 0
Fig. 60: Honest John-Nike-Nike(Dinah) Range vs. Displacement(Trajectory Through Burnout).
89

APCGC-TDR-63- 19
'4
0
4)
44
90------------------------6

-- 4
1-- ----------------------
0
- - ---- 2
0- - p4
- - H
-- -- -fl------------------------------- - ---- p40
4 J
- - -- � U0
p4
-2 F-'0
---- I E- H
-- 52
4.)
I U
- A .2_ A-----
* ,!* I
1 0
- - --------------- I
II 0- - -�
------- z- ---- I
0
- 4 J* @2
0
0I-
N'0
(hI) �II3IA
91

APGC-TDR-63-19
Gm
EVA
Saa480AN
410"
a
W .
II3- a
)a
-- --- - - - - - - - --We ~dIk~~1km m •-"- - -a\
310
84 1
i T M 1O w 136 T7
NOM
Fig. 63: Honest John-Nike-Nike (Eva) Altitude vs. Time (Entire
Trajectory).
92

APGC-TDR-63-19
IN -F-130.
a
A
A
lie.
IDIOM
a
o---edw T-c oe
60,00
&&.&WeRid. TT u c.1 y Dto
ii
60.MAN
30,000
a
10 is 0 25 30 3 4a 45 SO
Fig. 64: Honest John-Nike-Nike (Eva) Altitude vs. Time (TrajectoryThrough Burnout).
93
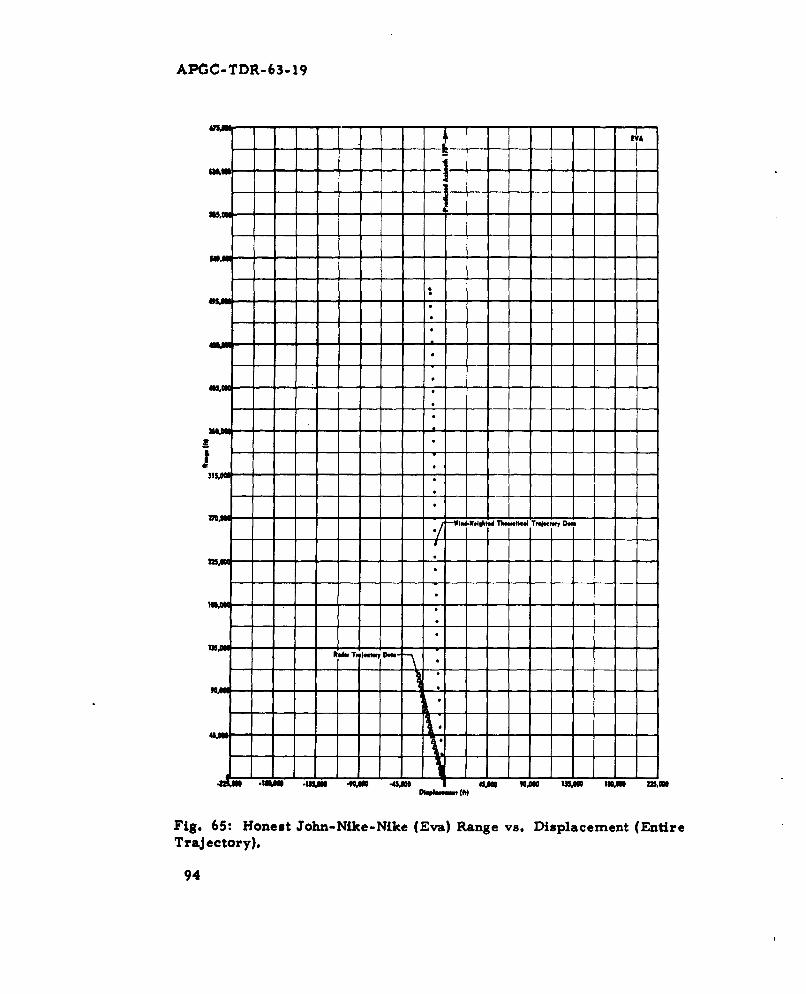
APOC-TDR-63-19
EVA
ISMW
276* WI.d-W@Ightid Thwolk.4 T...t.. Dom
M.WI
in"nSM -O
14 .10" .Ias M9.. -45*0 45*0 3*M SZSJU In*0 22.
Fig. 65: Honest John-Nike-Nike (Eva) Range vs. Displacement (Entire
Trajectory).
94

APOC-TDR-63-19
9 EVA
- - -- micmr I--
•/ -U -. -tl'r~ ll moc•Dt
VIM
torywwfe Throug Burnout)•
95

APGC-TDR-63- 19
- 0
, '.4
• I.e
- w
II
Sz
1 .. -C.,- •
I *'"-1 - - - - - - - - - - - - - -_
960
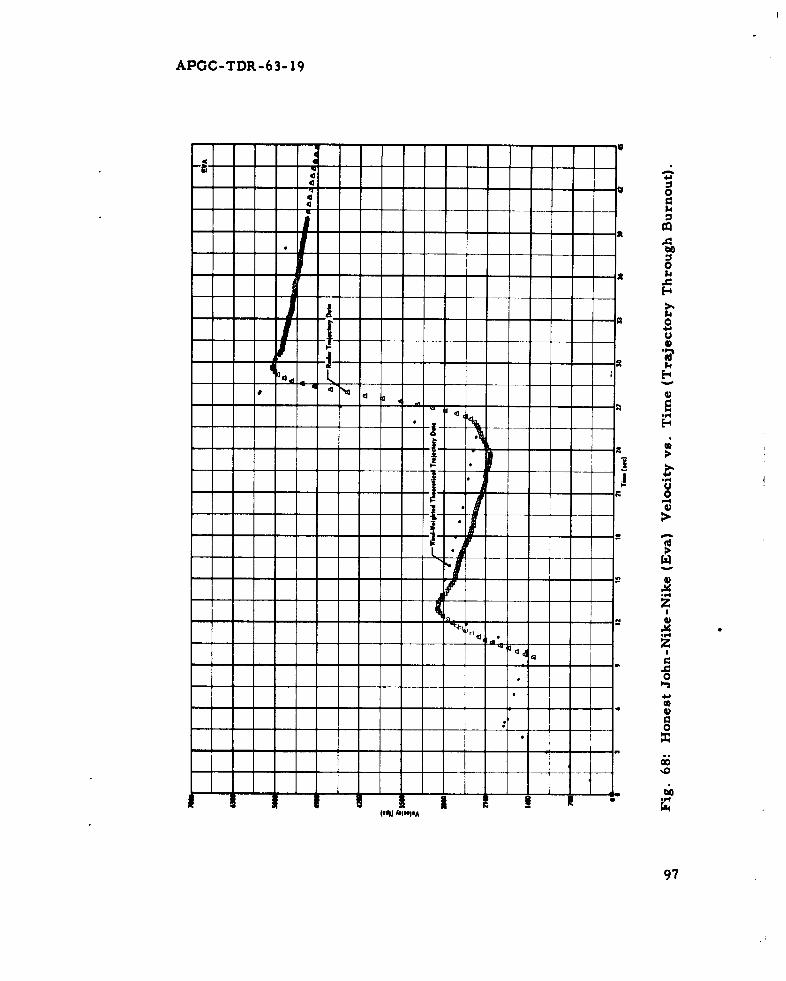
APGC-TDR-63- 19
,111
0
------------------------ -- t 5.
A • .
LI
-- -I ' -~- -- - -- - -- -
- - -- - - - - 1 • - W(-------------oA
97

APGC-TDR-63-19
_,N - - - - -. -
520#!- T-- -
I -M D
no=.
4200,0
*000
F60
- --1 1 - --1 - --0 - - - - 33 37 4-
320.Ti - -- -e-
Fi.6:H ns AJh -ieNk WIdW.,Itt. Al~ti~e jtude vs. T me(ntr
Trajectory).
98 ---------
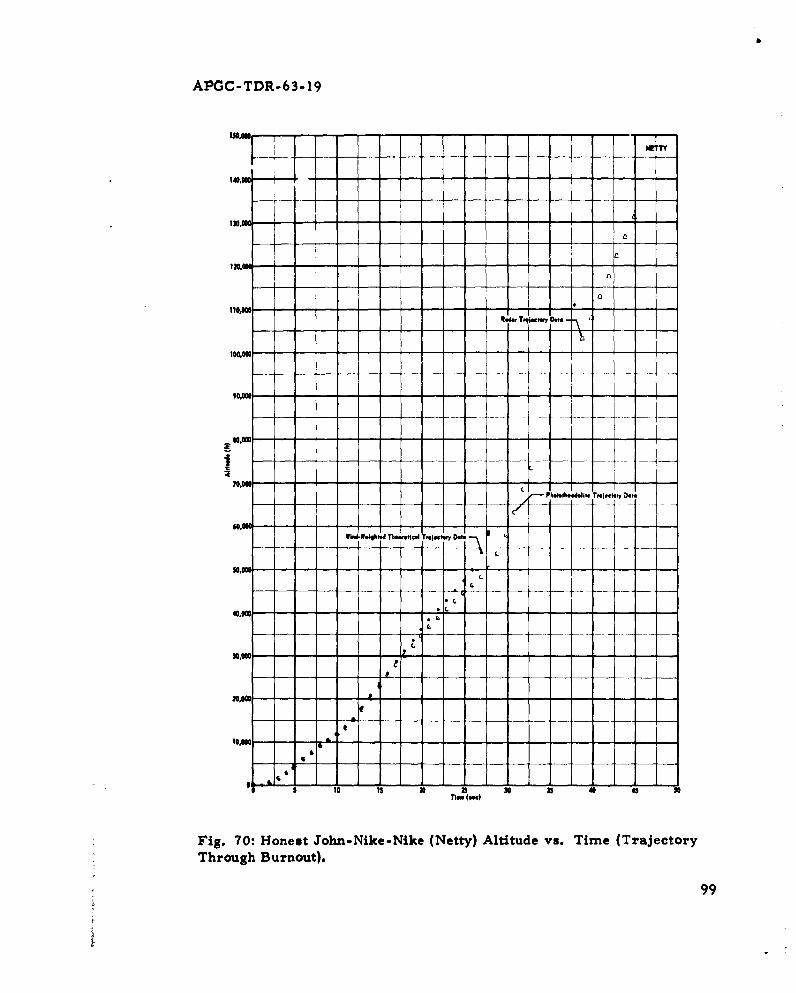
APGC-TDR-63-19
O TTY
-- , TIqjRc D et T
WirAI-*%ftedk~ Thoereocl T.Ieft"r D-1e
some I
40,00I
N.00.
€C.
k1
r- ' S 10 Is 30 2 0 35 40 45 soTime (9n)
Fig. 70: Honest John-Nike-Nike (Netty) Altitude vs. Time (Trajectory
Through Burnout).
99

APGC-TDR-63-19
WNTTY
[4 IKII 1z1 I
U05,000 I
Rei Tn te D.'4. •
AI i
.ad-W hd Th-ti-I Tr.j. y Data
360 i ,
325,= - 1 - - - - -
I J
.180,00 -15,0 -9'N 45,000 - 4-- -",ODD-135,M -80IM 2251
100 0 t IT
• 23.000 .1010,000 -1)5.,000 -90.000 -45,000 45,000 90.000 135,000 1800000 225,000
Fig. 71: Honest ,Tohn-Nike-Nike (Netty') R~ange vs. Displacement (Entir'eTrajectory).
100
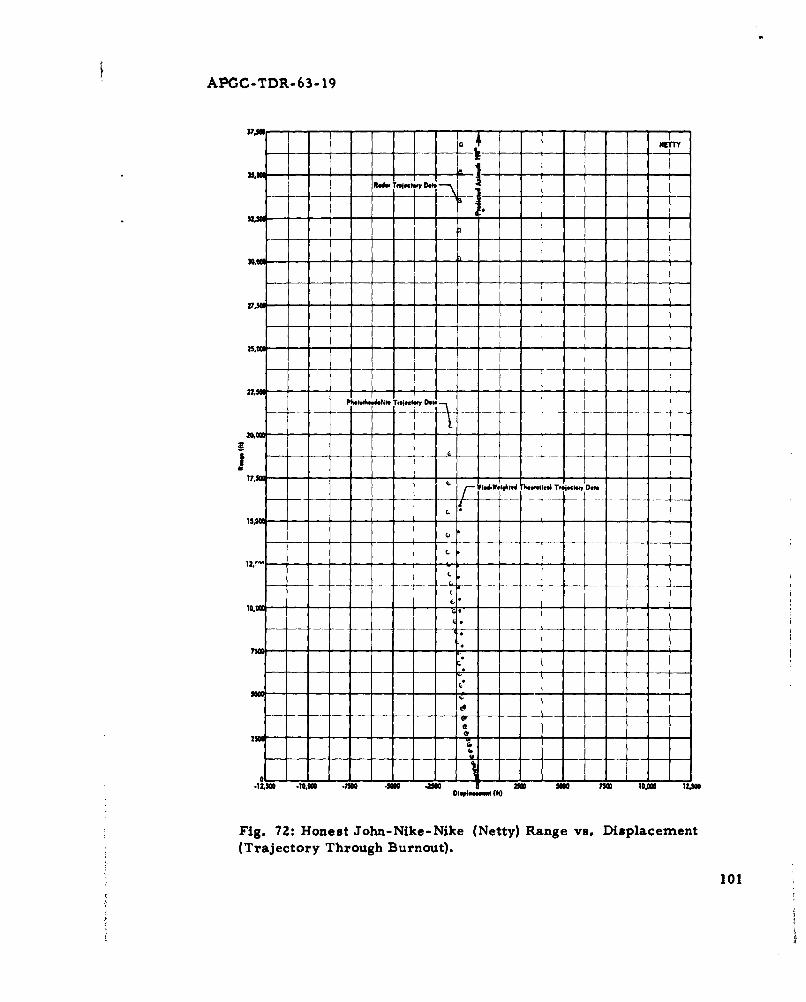
APOC-TDR-63-19
I i
20,.
L
230C
Fi. -2 Hoet-h-ieNk Ntt)Rnev.Dslcmn
(r
10
9
Fig. 72: Honest John-Nike-Nike (Netty) Range vs. Displacement(Trajectory Through Burnout).
101
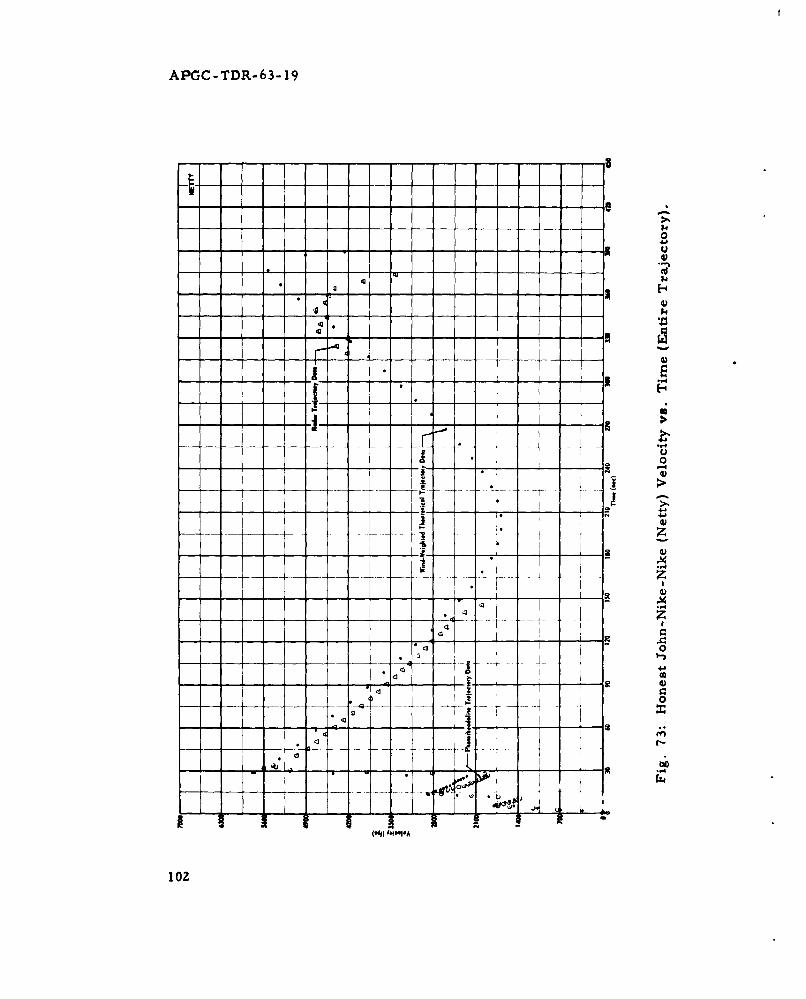
APGC-TD)R-63- 19
- -- g1
>
41
1024

APCGC-TDR-.63..19
4.'
03

APGC-TDR-63- 19
OLGA
WOD. I
U0,000--
Belo --
10, - -0- - - - - - - - - - - - -
104
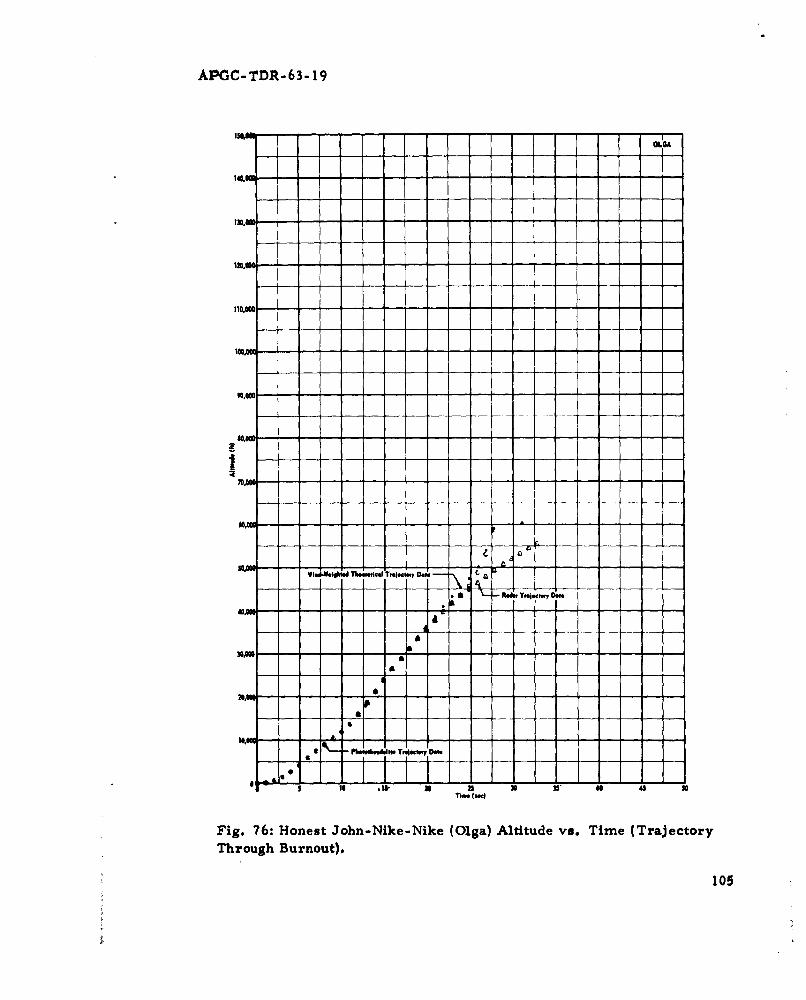
APOC-TDR-63-19
I - 1OLG
I10.0 -
Ulmu
AN-
1wm a 2 0 5 0 S s
-50 -e• Te•, -•.e
Fig. 76: Honest John-Nlke-Nike (Olga) Altitude vs. Time (TrajectoryThrough Burnout).
S~106
WI WIi Tz.i. .j.pD.

APGC-TDR-63- 19
--------------------------------
4$54
I A
!35,0.-------------------I - * i.
" Th..tI..I T..t" Dom• I
us,=- - - - - - - - - - -
Re... T.I.. . .. D
- ai
Trajectory).e. "
10688
1).-----------------------------B----------------------------8
8ieemm h
Fig. 77: Honest John-Nike-Nike (Olga) Range vs. Displacement(EntireTrajectory).
106

APGC-TDR-63-19
viaXX.
TII-----llt he~la|TlelqyOl
Mmm
• |1H .7wO w -a -00 SM 75M IFOR 1im
Fig 78: Honest John-Nike-Nike (Olga) Range vs. Displacement (Trajec-tory Through Burnout).
107

APGC-TDR-63-19
-:>
.4J
Lg . . . . . ..o
1 1 -- -- I108
- - -- - - - - - - -
Ir
- .. ..j_.
1 8
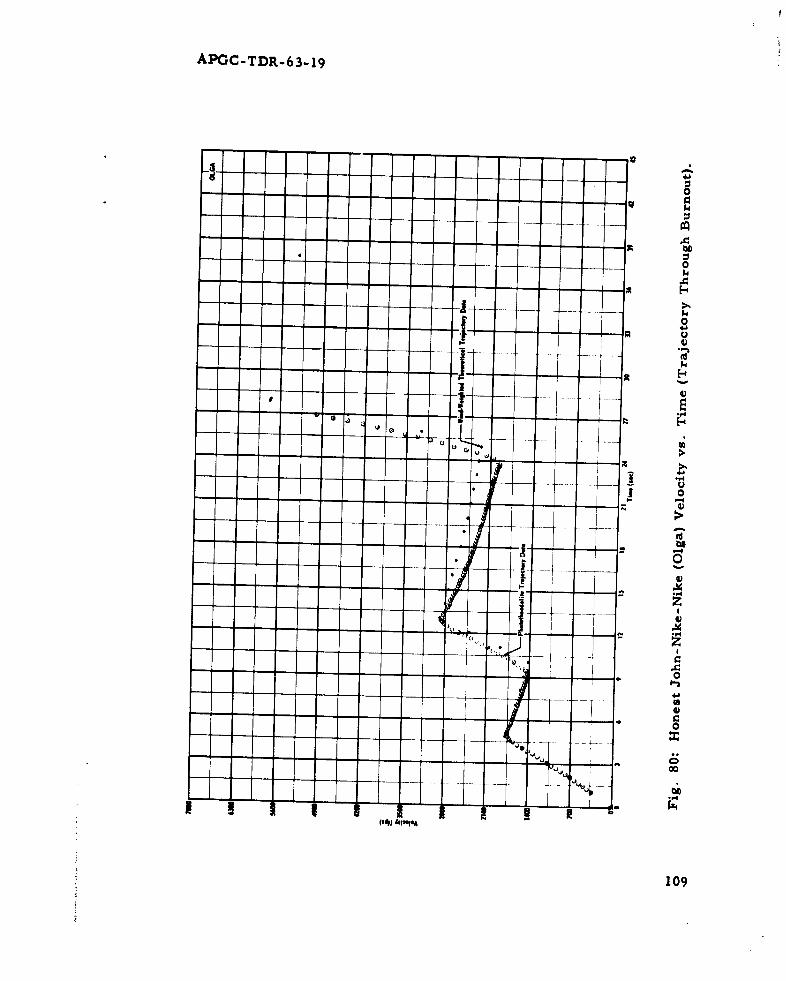
APGC;CTDR..63..1 9
0'4
---
109

APGC-TDR-63-19
0 LA-- - LSA
, 1.
- - - -- - --------- - -
440,00066
Aa
=10,00.- ~~~R~d. T,o... 1 Di
240,0M - - - - - - - - - - - - -
SLI
W• I We•ghlid Thw .icel Trmj..h,, 0...
120,00- -- --
4 LI
0 42 U 126 160 210 232 M4 334 371 420T1im (see
Fig. 81: Honest John-Nike-Nike (Lisa) Altitude vs Time (EntireTrajectory)
110
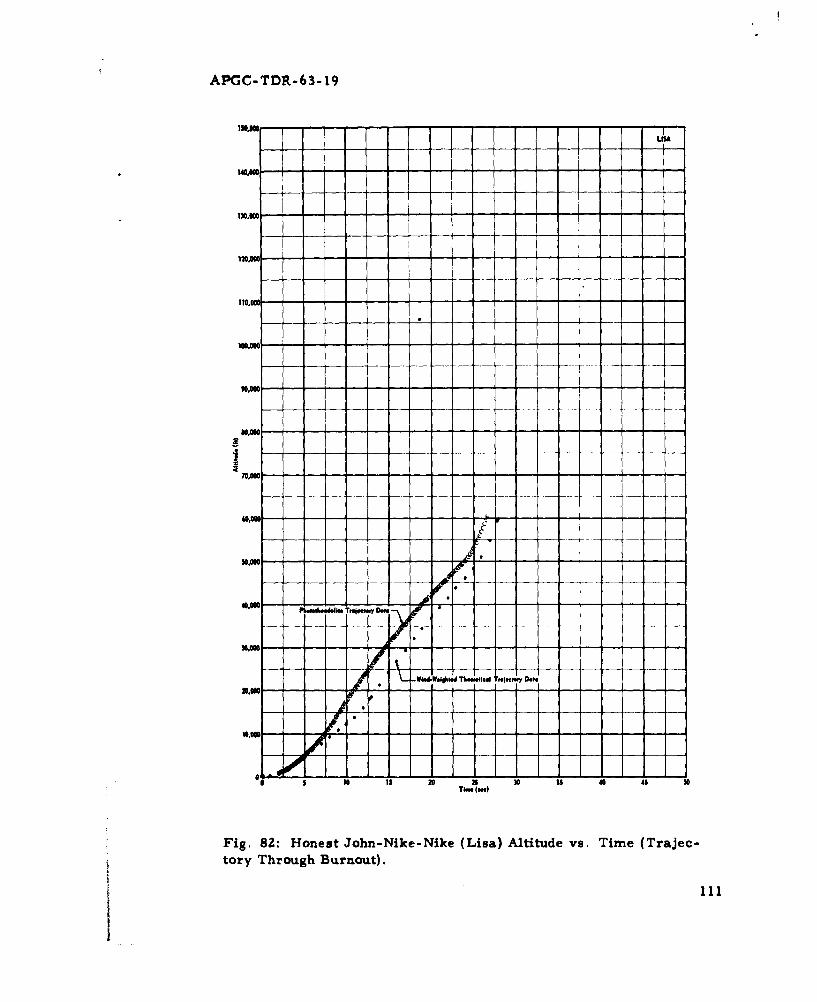
APGC-TDR-63- 19
USA
I low
110,00 - - - - - - - - - - - - - -
:1tI T I. T1c- 0 - -
5 10 is I 1 2T. ...U. ... so
Fig. 82-oetJh-ieNk Ls)Attd s ie(rjc
tory Through Burnout).
Il

APGC-TDR-63-19
T - USA
30, --1-
X0,000 -- Red., T,.Jftwy Dom.
240* 0 -
In'000
u - - -•eI N T-'l
409
-=,coo .4090 -130G -2.900 0MM0 .40,090 (h 40,000 MAN0. 000 120,09 0.00 a0,00
o I• m m . . . . . . ..0*. . .
Fig 83: Honest John-Nike-Nike (Lisa) Range vs. Displacement (EntireTrajectory)
112

APGC-TDR-63-19
VIMA
T I
32.
•1 AM 1 - F - ,
Fig. 84: Honest John-Nike-Nike (Lisa) Range vs. Displacement (Tra-jectory Through Burnout).
113

APGC-TDR-63- 19
-- -
dc
4 ý -
41
-40
1144

APOC-TDR-.63-.19
IV
___ 0
I - - M
M AIF115

APCC-TDR-63- 19
AP iTSY
MG A LI,
* Imd.W4o . %
48*' - -£ a•
116
a ,a
a c.
24 04I- -e0h 22 •4 1 -G
126

APGC-TDR-63-19
PATSY
1-0.-
IsmA
Thrug Bunot -
411
- ---
* rs1j
*WI.4W.Ig...dThw101 TgI~ ,,J
35.3; - *-
S 10 IS n • • 45
Tie B
Fi.8:U ns -- h-- ie-k Pty)Attd s Tm TaetrThrogh Brnou) •
S1
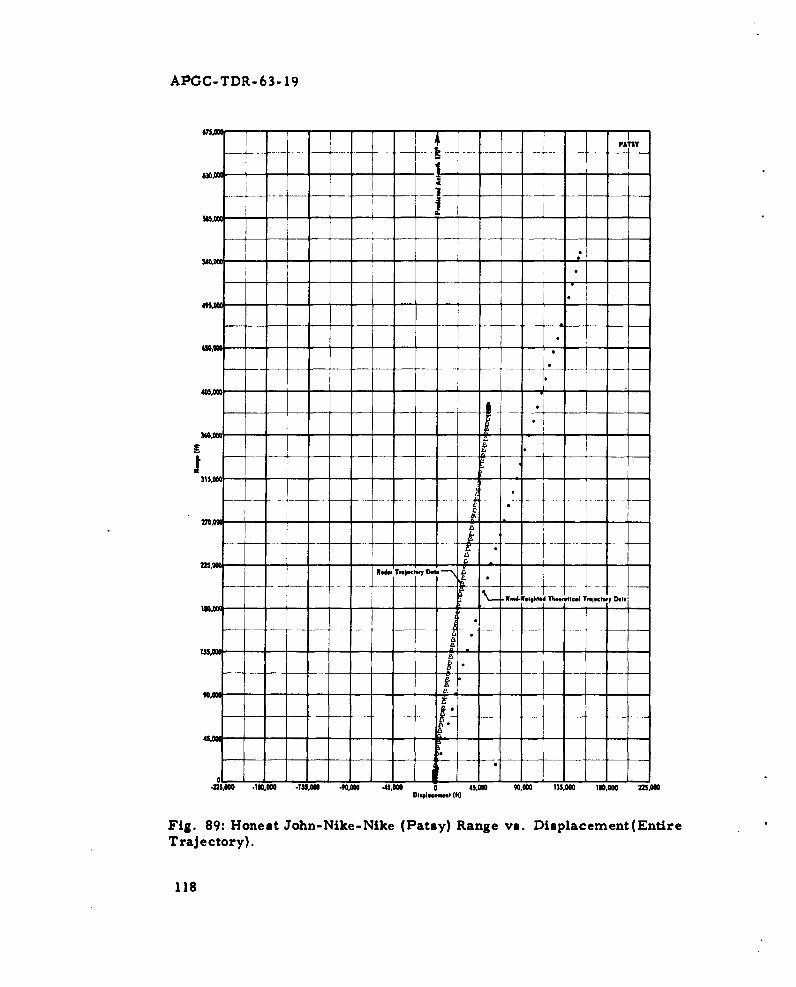
APOC-TDR-63- 19
~1.........PATSY
R.6w~~ -mi Do-
------------ T--f--- - -+- 'D
495 - -- - - - - - - - - - -- - -
LLkIi .. II
.JS------------00-"Am--------- "- 0 4,0------,00 10,0 nI
01.0- (h
Fg89HoetJh -Nk-------ty)Ragevs Dspacmet Enir
Trajectory). .t.
18*

APGC-TDR-63- 19
PA n'Y
I~h.; Tnq. ,O." --
22.
• • W•.Wel~mlTh7...11 TMIOCOe• Ooft
22, -- T -- I~--/ "'
250 IN
M~~~~t 4W2 I o 0D Z
Fig. 90: Honest John-Nike-Nlke (Patsy) Range vs. Displacement (Tra-S~jectory Through Burnout).
0119
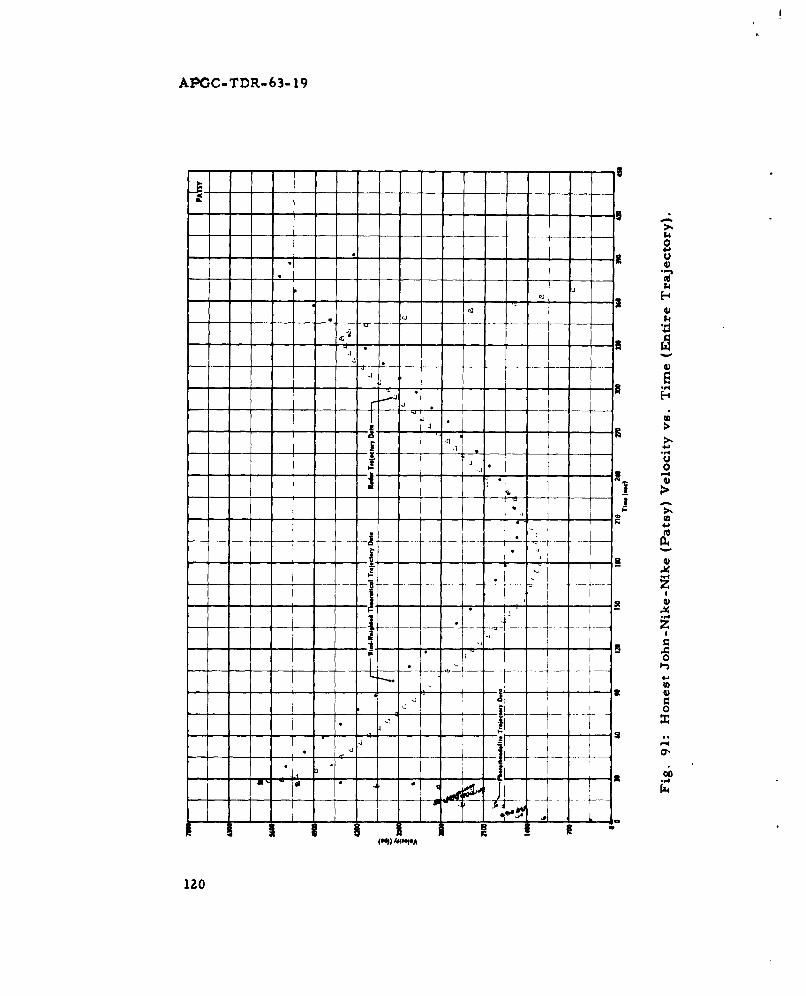
APGC-TDR-63- 19
----------------------------- I
a.
I..0
4J
a ------- 1 U4)
S.d
---------------------------------------- .4 4)U
- -j
*---------------
--fy-- - - -
-j
---------------- U
--A--A,-------------1
-A ---- ±-------
I- .4 0-- -4)
--------------------------------------4
-- - fijI � I4)
-- 1-----
4)-2
0
I-
-.- �- ---- K--�----;----' -4 _
----- '- - - - -
- - a----- -in--I I I -
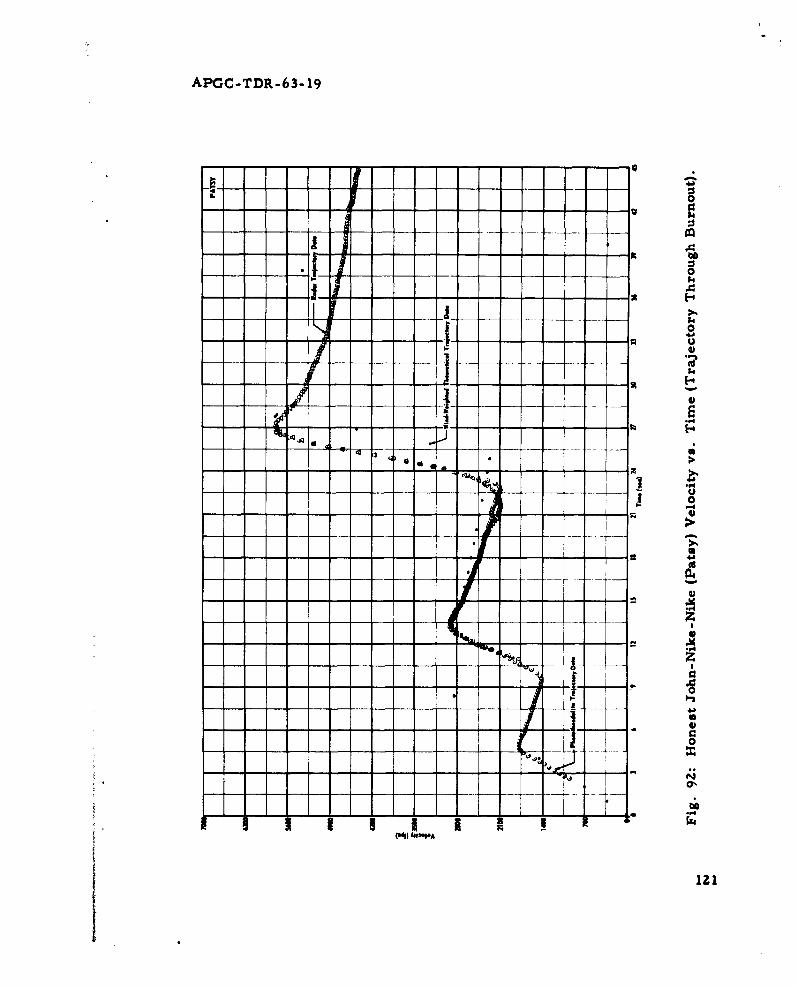
APGC-TDR-63-19
a.�0
'4
I [
- 0
1"
/_ ,1 0
121
.4"tll 0 O O

f
APGC-TDR-63- 19
AUC
-- ... ii i- 1- - --
5,M
Wtod-Welghted Theoretcal Toiecwoy Data
-'= - t
35'M
! 6 0 12 is is 21 24 2V7Ti m (----
Fig. 93: Nike-Cajun (Alice) Altitude vs. Time (Trajectory Through
Burnout).
g1 ------------------------------------------------

APGC-TDR-63- 19
?AuA=
34,41
II
,)..Ad3I. .j..y M I.W IgI tielTrjetw
Fig. 94: Nike-Cajun (Alice) Range vs. Displacement (Trajectory ThrougBurnout).
123
ii
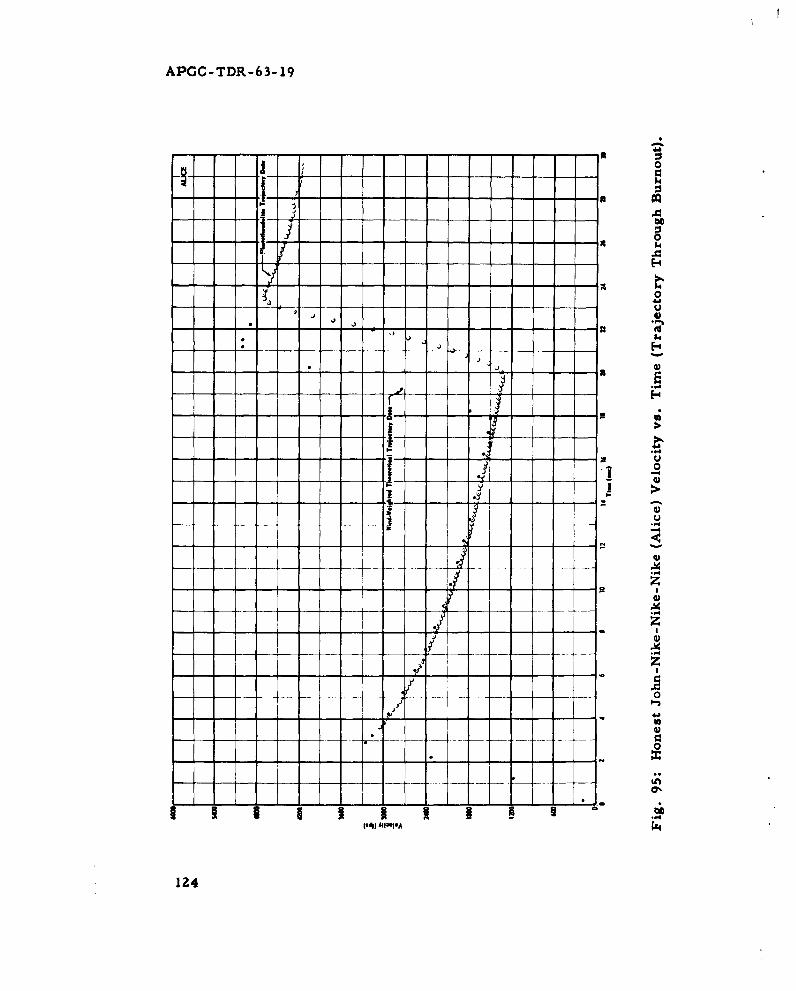
APGC-TDR-63-19
I- I
4a1
- I
0
) 4-
124
- -*-.--
,• z-I
y z----- ' - @
.3. __-- 0,
t3 4 JU
1Z4

APGC-TDR-63-19
;4K L -
IN 40
Ftwitbd- e vsl, . T m ( a TItcr h DeouI. - -
Ii..
3 6 12 5 16 21 2127
Ti.. C.".
If Fi.96 ie-au (rna)Attuevs ie TaecoyThog
Burnout)
12I/

APGC-TDR-63-19
n=,00 |
I" If lay
10,uc----------------------------------------------
Ho-- I
3w00
Fig. 97: Nike-Cajun (Brenda) Range vs. Displacement (TrajectoryThrough Burnout).
126

! ~AP•C- TDR- 63-19
-- -
i.4
-l - A ! •
(,J ) o
- - - ~ -- ---- --- 7

APGC-TDR-63-19
w 1
• F ~Wisdl.Weigktd Tlmiu4fcl Tm ,T
240,O-
130,0C-ýd .d.yOt
ItI
a n0 in W 200 240 no M2 344 a6Time (of)
Fig. 99: Nike-Cajun (Ruby) Velocity vs. Time (Entire Trajectory).
128

APGC-TDR-63-19
""i.... I on
I I
0 V V
Fig.- 100 Nik- 12
"V6.d*'W.It~d Th..a T,.i..wy 0.."./
-4.i
•'• L
4..J
0 1ii s 2 p/TL.(e
Fi.10:NieCau (uy)Atiue s Tm (rjetryTrog
Burnout)
12

APOC-TDR-63-19
"" ~ -i -
W XII
-- ..- - - - - - - -. ..- -
*
175,000
JJ
XQ,
12500 I•,• AMC • kM 2SIOMM IM ww ",M INM II a
Fig. 101: Nike- Cajun (Ruby) Range vs. Displacement (Entire Trajectory).
130

t APGC-TDR-63- 19
-I.-----------------------------
------------------ 26il-i-�------- I.
I- a..
----------------------------------------- 9
-- 14
-- - -- A.- U
-- _ I- -- N
j----------------- ---- 3
------------------------------------------------- �13
0
- - IA
------------------------------------------------------------- 3
-------------------------------------------------- D I'
----------------------------------------------------------------------------N
A CI _
-6I A
------------------------- 1����-------------------------------------------"-3I ___ __ __
...........................- pI. 4 U
�1�- - -
I I I � I I I U -1�(*�3 if3g*�
131

APGC-TDR-63- 19
i- -
-4 0
- --- --- - 1
L 0
- - 4JC.i / • -4
)' i 14• 1 -'
" o 1 ! )

APGC-TDR-63-19
I I-t t
V dfIih•NI Th-P-c1 Tmitecn, 0Oaft
45,000
- PU( - - -T -•, IrI
12 15 urt 24 V 3
T.I.
Fig. 104: Nike-Cajun (Sally) Altitude vs. Time (Trajectory ThroughBurnout).
133

APOC-TDR-63- 19
H~~I ll~II SLLY
13,2z C~t
10,000
9600
Vi"-U0,w tie Tm" ", .i ti Ii----
t6000 - - - - - - -
-,000 - o0 -2400 - 00 0 1
Fig. 105: Nike-Cajun (Sally) Range vs. Displacement (TrajectoryThrough Burnout).
134

SAPGC-TDR-63-19
f- -}g
I-l
- - - - -- - - -
-,- - -- A
0
i 41
----- 4-----! f-"
-
iI

APOC-TDR-63- 19
YamL
65,000 - Ii
1"u~k- -hf , "D.- -d. - ~ -t"Dt
30'M 1 1 1
Nlm -
1316,, -
0 ,9 12 I i S 1 24 27
Trm(m
Fig. 17Nieaun(eey)AttdvsTie(TactrThog
Burnout)
136

APGC-TDR-63-19
ism
12,m
1600
''12;-00 - M .. M0
12,0o /,
1o13
i -137

APGC-TDR-63- 19
/ .4
k ----- -- 4-
• 1 I -f~
1--8
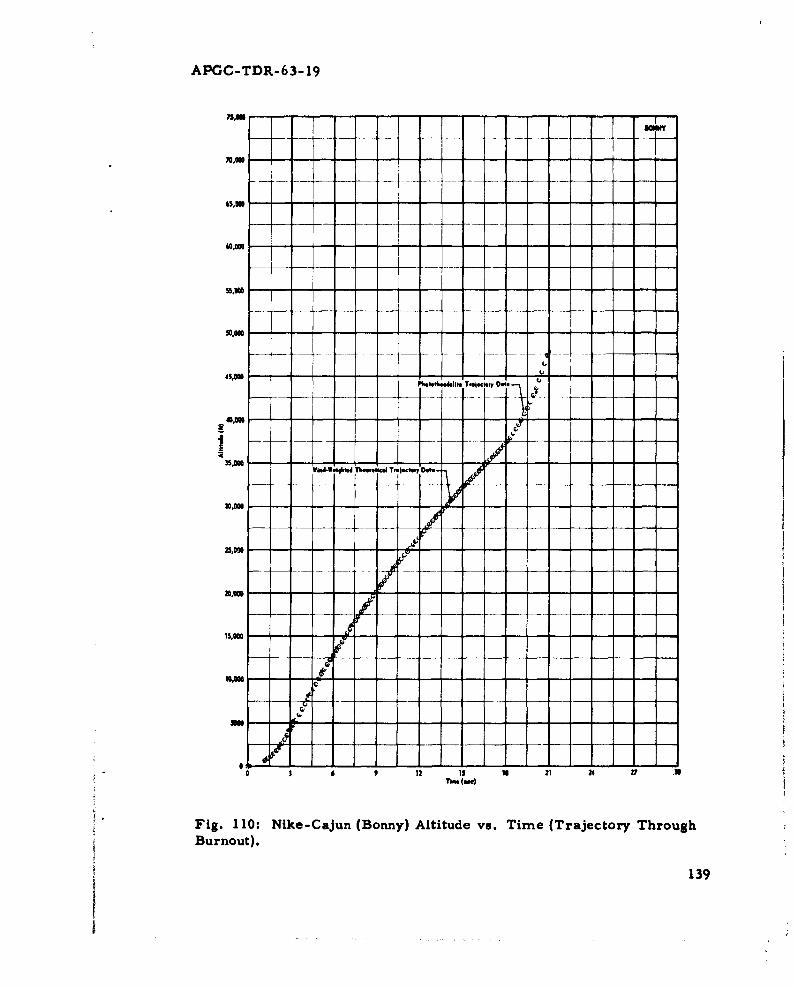
APGC-TDR-63-19
P6
I--
3 o.m -T 6d k . T-Ie - , D t
oO 12 is is 21 24 V7 ,Tkw (We)
S"Fig. 11I0: Nike-Cajun (Bonny) Altitude vs. Time (Trajectory ThroughS~Burnout).
139
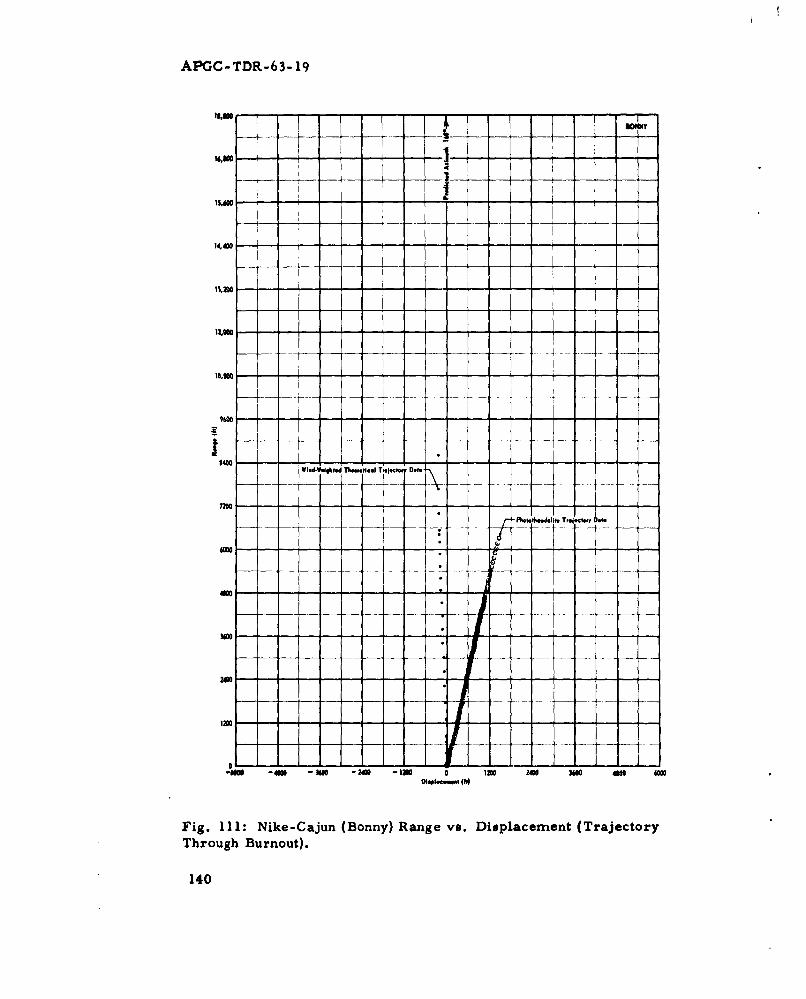
AP:GC-TDR-63- 19
1------1-
I I
i. -i- - " I - -
WlIWolFdTkmle TltoDg t---
7400
- I -- 1
WI~dV.Ihf" Iht- T o
-o-
-CO O0 -3N -a -lJ - -20 - - - - - - - - - 60
34000
040 I= -40 3w a
Fig. 111: Nike-Cajun (Bonny) Range vs. Displacement (TrajectoryThrough Burnout).
140

i• APGC-TDR-63-19
rU
P0
0
.2
I o-
148

APGC-TDR-63-19
, w
60,0W0 - -- - --
55,00P II.. N~.1 TrIiew , D,4.
CQ I
:6
0..
25, I:
XS,000
OL I I
-- w )
35,000 -
IS 6 9 12 1 Ia 21 24 N 00
Ti.. (see)
Fig. 113: Nike-Cajun (Dagmar) Altitude vs. Time (Trajectory ThroughBurnout).
142

APGC-TDR-63-19
_Z IM 4M"
Fig 1N----------
11a.
143-It -.
0--- Dipem.(9
Fig. 114: Nike-Cajun (Dagmar) Range vs. Displacement (TrajectoryThrough Burnout).
S~143
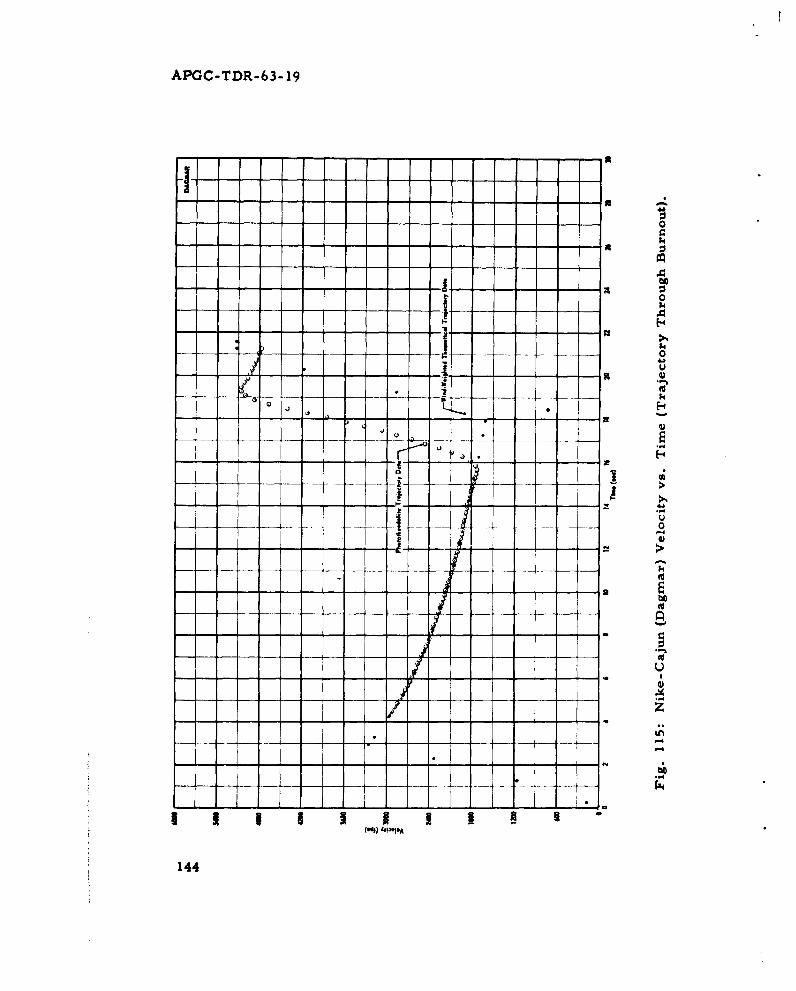
APOC-TDR-63- 19
I 'I
-I• ... .. . .. . . . ~. .... . . .
I (U
/ J
-- - -- - - - - -j- . . - " . . . . . i
I I1 m !(*tlI !;E-e
---------

APOC-TDR-63- 19
*low4
3I34
T. t.1

APG C-TDR-63-19
16,r00
S~~~Wied W.Ightted Thelflcll T.lecltq Do.-~12K -400
200
InK
0 4 3
M -
- 0
-a lO 40 - ..0 -*.,.. T -..tcI 0 0~ 10 0 2 •4 ,
Fig. 1 17: Nike-Cajun (Cindy) Range vs. Displacement (Trajectory
Through Burnout).
146

APGC-TDR-63-19
]- S
- I] - -
1 0 "
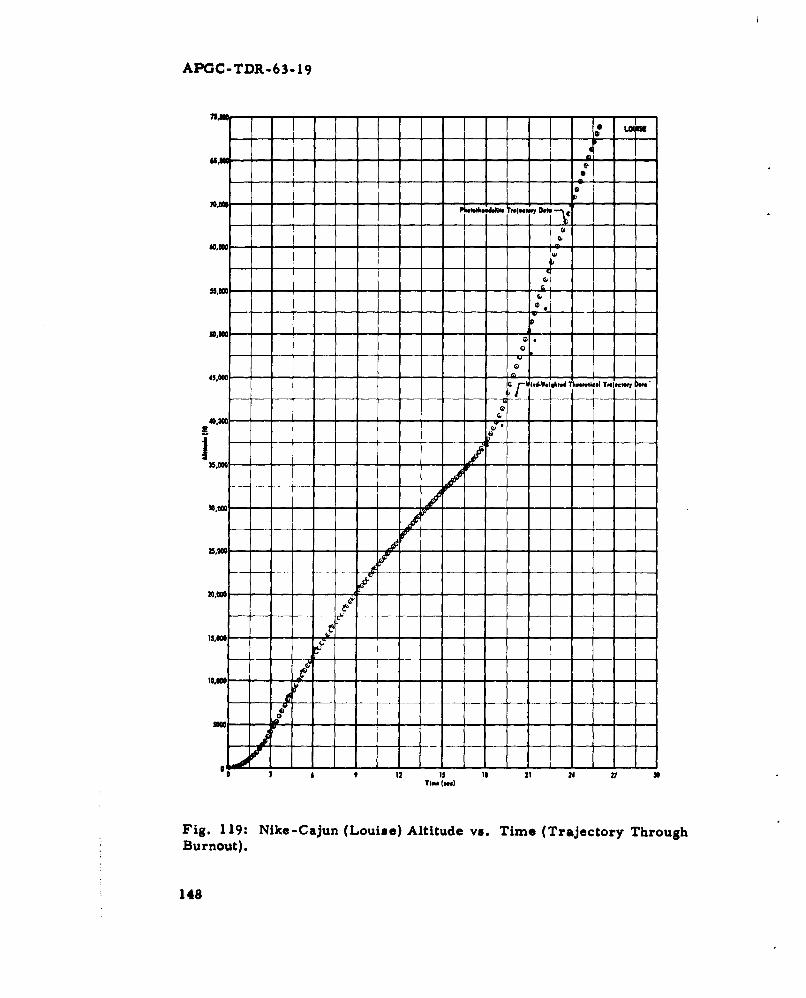
APGC-TDR-63-19
I 0
0
ior - "•m
45,0) -
45,00,
{- -
B surnout). -~-
1I4
S -
148,

4f
APGC-TDR-63-19
1 00
12,MQ
NOQa Tanw Pl
10,800
-
I
14
6OOO
£ ,
Fig.120 Nie-Caun Louoe)Rang vs Diplaemen (Tajetor
Thog Bunu0
.31

APGC-TrDR-63-19
,- -
0
• $ 0
5 k
/ 'U
I ao
! 1 l l 1 | I-
150

APGC-TDR-63-19
--.................... I1-T-
LK
- I -° - -
S3Se.W--h -• Tre I--
jJ+
3mG -1 1
1 12 Is Il1 21 24a
Th" (sft)
Fig. 122: Nike-Cajun (Kitty) Altitude vs. Time (Trajectory ThroughBurnout).
25mG - -- -1- 1

APGC-TDR-63-19
- -'M -
ZIUM
M .
210.3 -1 o 40 4" s 3
t..•
p Wkgd.W,4ksul Thm ! Tmjelw e s. O
152,
/ I I IslesI s •e.1
1*I (so)
Fig. 123: Nike-Cajun (Kitty) Altitude vs. Time (Entire Trajectory).
152

APGC-TDR-63-19
MO- - - I -I J
12500,
' 7 5 .1 T.-r
&1153
isWo. ,-- - - - - - - - - - - - - -T- - --'
I I-- - - - - - - - - - - - - - - -
,0 -- -- - -- - -- 1- - -- -
75~ - -- - - - - - - - - - - - - - - - - - - - - -
Fig. 124: Nike -Cajun (Kitty) Range vs. Displacement (Entire Trajectory).
153

APCGC-TDR-63- 19
KIT
%00
----- l--e---l--- T--------rei wy 0
F.
CM
C-
Fig W15:d -iee-jun(tKtc TrRjvl emen rajecIThrough-----------
154-
OW----------------------------------------------------------------
-- O -ai -1400 -2400 -130 0 1200 2400 1400 40100 4000D•uphI.m.st (hI
Fig. 125: Nike-Cajun (Kitty) Range vs. Displacement(TrajectoryThrough Burnout).
154

i APGC-TDR-63- 19
- -- j*
. .4
(14}) 41*l4
I U

APOC-TDR-63-19
,0 0
/ 4'
156

APGC-TDR-63-19
I I .
a a-
L •j -A
al
.d. T- -
a
L I
SI. - -.-- - -- ----.------
200.------ -- --- I
0 100 10 no no0 No0 no 40 4w0 MTIM (on)
Fig. 128: Nike-Cajun (Dana) Altitude vs. Time (Entire Trajectory).
157

APGC-TDR-63-19
'S 'DAN
f a
I .a
+&
a
TT. .- -4
1usc
-B
w - "-. .
25,UO
3M -° --
I s . - - - - • T -,. T-., 0 7 J
BE15.00 - -
- - - - - - - - - - -
6 1 ( ) II 21 2
Fig. 129: Nike-Cajun (Dana) Altitude vs. Timei (Trajectory Through
Burnout).
158

APGC-TDR-63-19
3 ,0 -!I - - - - - - -
_------- t - - -MIN
-IAW
100 -0 ..
0,00,
I I I i I
Fig. 130: Nike-Cajun (Dana) Range vs. Displacement (Entire Trajectory).
159

APGC-TDR-63- 19
g I - .---------- D.%-----
att
- Wh,&W.fdf Tw t ficel Tmift . Dw
LE
-dw0 -40 M-O -2400 -1230 0 IN00 M U00 0 M O0
Fig. 131: Nike- Cajun (Dana) Range vs. Displacement (TrajectoryThrough Burnout).
160

APGC-TDR-63- 19
- -- U
-I----------------------- -�- -U
- -- N _
--------------------------
- --- 2 U0
'4
.- -20'4
- -,
I.
--- a- - -
IF-'
-------------- I - -�
S
--- I--------�-.--------�3 1-1---------------------------------3 2 U0
- -
- -- I i-- -- 4
.1t QI-
-I-- -
-- 3 -4: 3- --- q
- 42- N
2
-..........................-
a - --------------- 2
�ur'* 42 U
I..---------------------------------
I II I I I U('�3) �I�PA
161
I

APGC-TDR-63- 19
'-!- -
-1I
34
- - - -- - - - - - - - - -
! | | l
(*1 4.,S
- - -
APGC-TDR-63- 19
REFERENCES
1. APGC-AIDR-62-29, Dispersion Study for the Honest John-Nike-Nike, unclassified report, dated December 1962.
2. APGC-AIDR-62-31, Dispersion Study for the Aerobee 1508 un-classified report, dated December 1962.
3. APGC-AIDR-63-7. Dispersion Study for the Nike-Cajun, unclas-sified report, dated January 1963.
4. APGC-AIDR-63- 18, Dispersion Study for the Nike-Apache. un-classified report, dated February 1963.
163

APGC-TDR-63- 19
INITIAL DISTRIBUTION
6 AFCRL (CRZER)10 AFCRL (CRZAC)
I NASA (GSFC)2 USASRDC1 Aerojet-General Corporation, Ft. Walton Beach, Florida1 Aerojet-General Corporation, Azusa, California1 Space-General Corporation, El Monte, CaliforniaI Space-General Corporation, Almagordo, New Mexico2 Atlantic Research Corporation, El Monte, California2 Atlantic Research Corporation, Alexandria, Virginia1 Chance-Vought Corporation, Astronautics Division1 Geophysics Corporation of America, Physics Research Division1 Thiokol, Elkton DivisionI Device Development Corporation1 Armour Research Foundation, Fhysical Chemistry ResearchI Oklahoma State University, Research FoundationI Georgia Institute of Technology1 University of Georgia, Department of Physics1 University of Michigan
30 ASTIA (TIPCR)APGC15 PGWHPI PGWRR1 PGWTI PGWF1 PGOPW1 FGOOSI PGOOCI PGVMS-6I FGAPT3 PGAFI3 PGEH
Page 164 of 164 Pages
Z.
z, I c-~~- 4 4I a -v
U 1o...0z~-
I- a
.a 2 ;~ - 0-I. ? ~ , o. J ?= I.W fi,..Z .1 j ,- 1. , .1 0 ! i
al
*: _. -1 ?.v " 111i0. CO0 A.
z* w I~ u r-*A. .. X
Xi -. rl . C
u toS ~ 0* ~
>4 A 0 >0 at a
aa A 1e~ a0~ ~ ** C
01 4 j -1!! 4 iz 4 a~ -
~~ .2.hi~ C~0.VI~a ~ *...~~j <I hi 0 5.Z~~S*.Q! O'
t. .i C<o 0 .i..'~.t 0. 0E HI_1ts~j.0
a ~ ~ . .~.3. .... R... ..~ 10 t I4 .
IaUS- E U,
Related Documents