Uncertainty Quantification & the PSUADE Software Mahmoud Khademi Supervisor: Prof. Ned Nedialkov Department of Computing and Software McMaster University, Hamilton, Ontario Canada 2012

Uncertainty Quantification & the PSUADE Software Mahmoud Khademi Supervisor: Prof. Ned Nedialkov Department of Computing and Software McMaster University,
Dec 14, 2015
Welcome message from author
This document is posted to help you gain knowledge. Please leave a comment to let me know what you think about it! Share it to your friends and learn new things together.
Transcript
Uncertainty Quantification & the PSUADE Software
Mahmoud KhademiSupervisor: Prof. Ned Nedialkov
Department of Computing and SoftwareMcMaster University, Hamilton, Ontario
Canada2012

Outline
Introduction to Uncertainty Quantification (UQ) IdentificationCharacterizationPropagationAnalysisCommon algorithms and methodsPSUADE: UQ software library and environment https://computation.llnl.gov/casc/uncertainty_quantification/
Conclusions & future research directions

Introduction to UQ
Quantitative characterization and reduction of uncertainty
Estimating probability of certain outcomes when some aspects of system are unknown
Advances of simulation-based scientific discovery caused emergence of verification and validation (V&V) and UQ
Many problems in the natural sciences and engineering have uncertainty

Identification
Model structure: models are only approximation to reality
Numerical approximation: methods are not exactInput and model parameters may only be known
approximatelyVariations in inputs and model parameters due to
differences between instances of same objectNoise, measurement errors and lack of data

Characterization
Aleatoric (statistical) uncertainties: differ each time we run same experiment
Monte Carlo methods are used, probability density function (PDF) can be represented by its moments
Epistemic (systematic) uncertainties: due to things we could in principle know but don't in practice
Fuzzy logic or generalization of Bayes theory are used

Propagation
How uncertainty evolve?Analyzing impact parameter uncertainties have on
outputsFinding major sources of uncertainties (sensitivity
analysis)Exploring “interesting” regions in parameter space
(model exploration)

Analysis
Assessing "anomalous" regions in parameter space
(risk analysis)
Creating integrity of a simulation model (validation)
Providing information on which additional physical
experiments are needed to improve understanding
of system (experimental guidance)

Selecting Proper Methods
Is there nonlinear relationship between uncertain and output variables?
Is uncertain parameter space high-dimensional?There may be some model form uncertaintiesHow much is computational cost per simulation?Which experimental data are available?

Monte Carlo Algorithms
Based on repeated random sampling to compute
their results
Used when it is not feasible to compute an exact
result with a deterministic algorithm
Useful for simulating systems with many degrees of
freedom, e.g. cellular structures

Monte Carlo Method: Outline
Define a domain of possible inputs
Generate inputs randomly from a probability density
function over domain
Perform a deterministic computation on inputs
Aggregate results
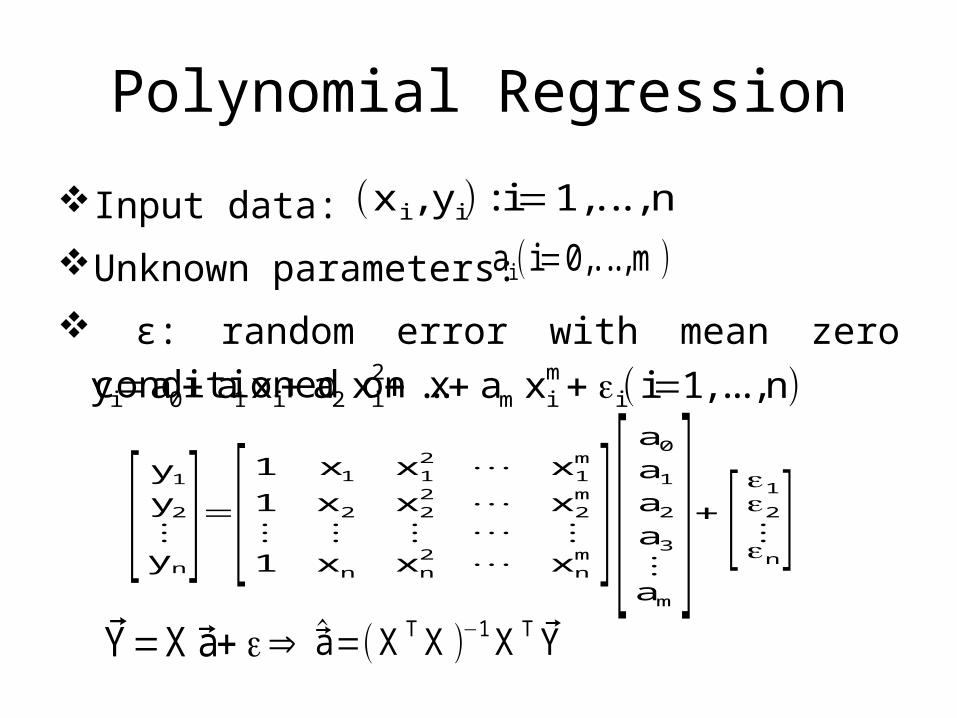
Polynomial Regression
Input data:Unknown parameters: ε: random error with mean zero conditioned on xyi=a0+ a1x i+ a2 xi
2+ ...+ am x im+ εi( i=1, ... , n)
[y1
y2
⋮yn]=[1 x1 x1
2 ⋯ x1m
1 x2 x22 ⋯ x2
m
⋮ ⋮ ⋮ ⋯ ⋮1 xn xn
2 ⋯ xnm][
a0
a1
a2
a3
⋮am
]+ [ε1ε2⋮εn]a i (i=0,. .. , m )
Y=X a+ ε⇒
(x i , y i) : i=1,. .. , n
a=(XTX )−1XT Y

MARSMARS (multivariate adaptive regression splines)
is weighted sum of some bases functions:
Each basis is constant 1, hinge function or product of them as:
orEach step of forward pass finds pair of bases
functions that gives maximum reduction in errorBackward pass prunes the model
f (x )=∑ c i B i (x )
max (0, c− x )max (0, x− c )

MARS Versus Linear Regression
y=25+ 6.1max (0, x−13)−3.1max (0,13−x) y=− 37+ 5 .1x

Principal Component Analysis
Consider a set of N points in n-dimensional space:
Principal Component Analysis (PCA) looks for n by m linear transformation matrix W mapping original n-dimensional space into an m-dimensional feature space, where m < n:
High variance is associated with more information
{x 1 , x 2 , ... , xN }
yk=WTxk (k= 1,. . , N )

Principal Component Analysis
Scatter matrix of transformed feature vectors is:
is scatter of input vectors & mean sProjection is chosen to maximize determinant of
total scatter matrix of projected samples:
are set of eigenvectors corresponding to m largest eigenvalues of scatter matrix of input vectors
Sy=∑ (yk−my)(yk−my)T=WTSxW
Sx m y yk '
Wopt=argmaxdet (WTSxW )=[w 1w2 ...wm ]{w i : i=1,. .. , m }

PSUADE: How it works?
Input section allows the users to specify number of inputs, their names, their range, their distributions, etc.
Driver program can be in any language provided that it is executable.
Run PSUADE with: [Linux] psuade psuade.inAt completion of runs, information will be displayed
and data file will also be created for further analysis

PSUADE Capabilities
Can study first order sensitivities of individual input parameter (main effect)
Can construct a relationship between some input parameters to model & output (response surface modeling)
Can quantify impact of a subset of parameters on output (global sensitivity analysis)
Can identify subset of parameters accounting for output variability (parameter screening)

PSUADE Capabilities
Monte Carlo, quasi-Monte Carlo, Latin hypercube and variants, factorial, Morris method, Fourier Amplitude Sampling Test (FAST), etc
Simulator Execution EnvironmentMarkov Chain Monte Carlo for parameter estimation
and basic statistical analysis Many different types of response surfacesMany methods for main, second-order, and total-
order effect analyses

Scatter plot of x1 and y Linear regres. (y with respect to x1)
Quadratic regres. (y with respect to x1) MARS (y with respect to x1)
y=sin(x1)+ 7 (sin (x2))2+ 0.1x3
4sin(x1)

Scatter plot of x2 and y Linear regres. (y with respect to x2)
Quadratic regres. (y with respect to x2) MARS (y with respect to x2)
y=sin(x1)+ 7 (sin (x2))2+ 0.1x3
4sin(x1)

Scatter plot of x3 and y Linear regres. (y with respect to x3)
Quadratic regres. (y with respect to x3) MARS (y with respect to x3)
y=sin(x1)+ 7 (sin (x2))2+ 0.1x3
4sin(x1)

Sensitivity Analysis
MARS screening rankings :
* Rank 1 : Input = 1 (score = 100.0)* Rank 2 : Input = 3 (score = 0.0)* Rank 3 : Input = 2 (score = 0.0)
MOAT Analysis (ordered):
Input 1 (mu*, sigma, dof) = 1.1011e-04 6.9425e-05 17Input 3 (mu*, sigma, dof) = 0.0000e+00 0.0000e+00 -1Input 2 (mu*, sigma, dof) = 0.0000e+00 0.0000e+00 -1
delta_test: perform Delta test:
Order of importance (based on 20 best configurations): (D)Rank 1 : input 1 (score = 80 )(D)Rank 2 : input 3 (score = 48 )(D)Rank 3 : input 2 (score = 38 )
y=sin(x1)+ 7 (sin (x2))2+ 0.1x3
4sin(x1)

Sensitivity Analysis
Gaussian process-based sensitivity analysis:
* Rank 1 : Input = 1 (score = 100.0)* Rank 2 : Input = 2 (score = 75.9)* Rank 3 : Input = 3 (score = 5.9)
Sum-of-trees-based sensitivity analysis:
* SumOfTrees screening rankings (with bootstrapping)* Minimum points per node = 10* Rank 1 : Input = 1 (score = 100.0)* Rank 2 : Input = 3 (score = 0.9)* Rank 3 : Input = 2 (score = 0.0)
y=sin(x1)+ 7 (sin (x2))2+ 0.1x3
4sin(x1)

Correlation Analysis
Pearson correlation coefficients (PEAR) - linear relationship - which gives a measure of relationship between X_i's & Y.
* Pearson Correlation coeff. (Input 1) = -8.526593e-01* Pearson Correlation coeff. (Input 2) = -3.777038e-18* Pearson Correlation coeff. (Input 3) = -2.356118e-18
Spearman coefficients (SPEA) - nonlinear relationship - which gives a measure of relationship between X_i's & Y.
* Spearman coefficient(ordered) (Input 1 ) = 8.833944e-01* Spearman coefficient(ordered) (Input 2 ) = 6.837607e-02* Spearman coefficient(ordered) (Input 3 ) = 5.189255e-02
y=sin(x1)+ 7 (sin (x2))2+ 0.1x3
4sin(x1)

Main Effect Analysis
RS-based 1-input Sobol' decomposition:
RSMSobol1: Normalized VCE (ordered) for input 1 = 1.003211e+00RSMSobol1: Normalized VCE (ordered) for input 2 = 9.395314e-32RSMSobol1: Normalized VCE (ordered) for input 3 = 4.440130e-33
McKay's correlation ratio:
INPUT 1 = 7.27e-01 (raw = 2.02e-09)INPUT 2 = 1.14e-11 (raw = 3.17e-20)INPUT 3 = 1.77e-35 (raw = 4.92e-44)
y=sin(x1)+ 7 (sin (x2))2+ 0.1x3
4sin(x1)

Response surface analysis (MARS) Response surface anal . (Linear regres.)
y=100(x2−x12)2+ (1−x1)
2 , x1 , x2ϵ[−2 ,2]

Response surface analysis (Quadratic) Response surface anal ysis (Cubic)
y=100(x2−x12)2+ (1−x1)
2 , x1 , x2ϵ[−2 ,2]

Response surface analysis (Sum-of-trees) Response surface anal ysis (Quartic)
y=100(x2−x12)2+ (1−x1)
2 , x1 , x2ϵ[−2 ,2]

Future Research Directions
Resolving curse of dimensionality
Representation of uncertainty
Bayesian computation & machine learning
techniques e.g. stochastic multi-scale systems for
model selection , classification & decision making
Visualization in high-dimensional spaces
Related Documents


![Y|y ¹Z¿ Ä] Ê»{Zy f¯{ {Y» Ê |ÀÆ» Äf ,®ÌeZf Y { ¹Â É cZÀË ¼eprofs.hut.ac.ir/~khademi/Statics_962_files/Homework-3.pdfState whether each member is in tension or](https://static.cupdf.com/doc/110x72/5eb2b6e6d86cf62c973856d9/yy-z-zy-f-y-f-oeezf-y-cz-.jpg)


