445 © 2012 Society of Chemical Industry and John Wiley & Sons, Ltd | Greenhouse Gas Sci Technol. 2:445–459 (2012); DOI: 10.1002/ghg Correspondence to: Chuanhe Lu, Lawrence Livermore National Laboratory, 7000 East Avenue, Livermore, CA 94551, USA. Email: [email protected] Received July 24, 2012; revised August 30, 2012; accepted August 31, 2012 Published online at Wiley Online Library (wileyonlinelibrary.com). DOI: 10.1002/ghg.1309 Modeling and Analysis Uncertainty quantification of CO 2 leakage through a fault with multiphase and nonisothermal effects Chuanhe Lu, Yunwei Sun, Thomas A. Buscheck, Yue Hao, Joshua A. White, and Laura Chiaramonte, Lawrence Livermore National Laboratory, 7000 East Avenue, Livermore, CA 94551, USA Abstract: The potential for CO 2 leakage through a permeable fault is a key concern for geologic CO 2 sequestration (GCS) in saline formations. If CO 2 migrates vertically upward through a fault from the storage reservoir to an overlying fresh-water aquifer, phase change can occur because temperature and pressure decrease with decreasing depth. The decrease in CO 2 density during phase transition causes an additional reduction in temperature. In this paper, we present a computational model for simulating the behaviour of a leaky fault connecting a saline CO 2 storage reservoir and an overlying fresh-water aquifer. We address phase transition, considering the nonlinear CO 2 enthalpy and viscosity functions. The model results indicate that the CO 2 leakage rate initially increases when CO 2 migration is driven by both buoyancy and overpressure during the period of injection. In the post-injection pe- riod, CO 2 leakage is only driven by buoyancy and the leakage rate decreases. The influence of noniso- thermal conditions is more pronounced during the first stage. The deterministic model of this faulted reservoir system is used within an uncertainty quantification (UQ) framework to rigorously quantify the sensitivity of the brine and CO 2 leakage in response to the uncertain model parameters. The results demonstrate that fault permeability is the most sensitive factor affecting both CO 2 and brine leakage rate. Reduced-order models of CO 2 and brine leakage are developed for the emulation of a large number of sample points, from which probability distributions are derived and can be incorporated in risk assessment of groundwater contamination resulting from CO 2 and brine leakage. © 2012 Society of Chemical Industry and John Wiley & Sons, Ltd Keywords: carbon dioxide; leakage; reduced-order model; risk analysis; thermal effect Introduction R isk assessment is an important component in guiding decision making during most phases of a GCS project, from initial site selection, design and permitting, all the way through site closure and monitoring. Some of the important risks to be as- sessed are those related to potential leakage of injected CO 2 into overlying groundwater aquifers. Specific concerns are that CO 2 leakage may change the pH in the fresh-water aquifers and increase the concentra- tion of total carbonate. Such acidic condition can influence dissolution and sorption mechanisms of many minerals and may thereby detrimentally affect groundwater quality, by enhancing dissolution and/or desorption of potentially hazardous trace metals. 1–6

Welcome message from author
This document is posted to help you gain knowledge. Please leave a comment to let me know what you think about it! Share it to your friends and learn new things together.
Transcript
445© 2012 Society of Chemical Industry and John Wiley & Sons, Ltd | Greenhouse Gas Sci Technol. 2:445–459 (2012); DOI: 10.1002/ghg
Correspondence to: Chuanhe Lu, Lawrence Livermore National Laboratory, 7000 East Avenue, Livermore, CA 94551, USA.
Email: [email protected]
Received July 24, 2012; revised August 30, 2012; accepted August 31, 2012
Published online at Wiley Online Library (wileyonlinelibrary.com). DOI: 10.1002/ghg.1309
Modeling and Analysis
Uncertainty quantifi cation of CO2 leakage through a fault with multiphase and nonisothermal effectsChuanhe Lu, Yunwei Sun, Thomas A. Buscheck, Yue Hao, Joshua A. White, and Laura Chiaramonte, Lawrence Livermore National Laboratory, 7000 East Avenue, Livermore, CA 94551, USA
Abstract: The potential for CO2 leakage through a permeable fault is a key concern for geologic CO2 sequestration (GCS) in saline formations. If CO2 migrates vertically upward through a fault from the storage reservoir to an overlying fresh-water aquifer, phase change can occur because temperature and pressure decrease with decreasing depth. The decrease in CO2 density during phase transition causes an additional reduction in temperature. In this paper, we present a computational model for simulating the behaviour of a leaky fault connecting a saline CO2 storage reservoir and an overlying fresh-water aquifer. We address phase transition, considering the nonlinear CO2 enthalpy and viscosity functions. The model results indicate that the CO2 leakage rate initially increases when CO2 migration is driven by both buoyancy and overpressure during the period of injection. In the post-injection pe-riod, CO2 leakage is only driven by buoyancy and the leakage rate decreases. The infl uence of noniso-thermal conditions is more pronounced during the fi rst stage. The deterministic model of this faulted reservoir system is used within an uncertainty quantifi cation (UQ) framework to rigorously quantify the sensitivity of the brine and CO2 leakage in response to the uncertain model parameters. The results demonstrate that fault permeability is the most sensitive factor affecting both CO2 and brine leakage rate. Reduced-order models of CO2 and brine leakage are developed for the emulation of a large number of sample points, from which probability distributions are derived and can be incorporated in risk assessment of groundwater contamination resulting from CO2 and brine leakage. © 2012 Society of Chemical Industry and John Wiley & Sons, Ltd
Keywords: carbon dioxide; leakage; reduced-order model; risk analysis; thermal effect
Introduction
Risk assessment is an important component in guiding decision making during most phases of a GCS project, from initial site selection, design
and permitting, all the way through site closure and monitoring. Some of the important risks to be as-sessed are those related to potential leakage of injected
CO2 into overlying groundwater aquifers. Specifi c concerns are that CO2 leakage may change the pH in the fresh-water aquifers and increase the concentra-tion of total carbonate. Such acidic condition can infl uence dissolution and sorption mechanisms of many minerals and may thereby detrimentally aff ect groundwater quality, by enhancing dissolution and/or desorption of potentially hazardous trace metals.1–6
C Lu et al. Modeling and Analysis: Uncertainty quantifi cation of CO2 leakage
446 © 2012 Society of Chemical Industry and John Wiley & Sons, Ltd | Greenhouse Gas Sci Technol. 2:445–459 (2012); DOI: 10.1002/ghg
Th e hazards related to CO2 migration depend on the leakage rate from the storage reservoir. To understand and quantify changes to groundwater quality, the leakage rates of CO2 and brine should be known fi rst. Fault geometry, eff ective permeability, and pressure buildup in the storage reservoir all can aff ect the CO2 leakage rate. Tao et al.7 evaluated leakage sensitivity to injection/storage depth, demonstrating that the risk of leakage is of the same magnitude at diff erent storage depths in the absence of overpressure in the storage reservoir. However, during the period of signifi cant pressure buildup, CO2 fl ux increases faster at greater injection depth than at shallower depth. A similar relationship between CO2 leakage rate and injection depth was studied by Celia et al.8 through fi eld-scale application of a semi-analytical model. Th ey also found that the size of the CO2 plume is strongly infl uenced by the residual brine saturation because of its infl uence on the relative permeability of CO2. Dockrill and Shipton9 studied factors controlling CO2 leakage from a natural geologic CO2 storage site in Utah, suggesting that multiphase fl ow and transport models of fault leakage must incorporate fault archi-tectures and include an assessment of the relative permeabilities of the fault seal and caprock. Th e simulation of leakage at sub-seabed GCS sites per-formed by Aoyagi et al.10 indicates that fault perme-ability signifi cantly aff ects CO2 leakage.11 Siirila et al.12 presented a quantitative risk assessment framework to predict the potential human health risk from CO2 leakage into drinking water aquifers. Th ey concluded that hydrologic fl ow and transport param-eters such as the degree of horizontal stratifi cation, sorption, and local scale dispersion are all important in assessing the overall risk. Uncertainties in CO2 leakage also can be controlled by heterogeneous porosity and permeability in the formations.13 Th ere-fore, many uncertainty factors must be considered for comprehensive risk assessment.
Th e CO2 is usually injected into a saline-formation in a supercritical state that is immiscible with water, with a liquid-like density and a gas-like viscosity. If CO2 migrates upward through a fault to a shallow groundwater aquifer, it experiences a large decrease in pressure and great volume expansion, resulting in strong Joule-Th omson cooling phenomenon.14–17 Th e strong cooling eff ect during the expansion of CO2 limits its fl ux.16,18 Although this phenomenon has been studied in the literature, multiphase fl ow, with consideration of thermophysical processes during
CO2 leakage into a shallow groundwater aquifer, is seldom performed, except for the work of Pruess,16,17 who conducted detailed analyses of phase transition and Joule-Th omson cooling phenomenon during CO2 leakage from a deep storage reservoir to a shallow aquifer.
In this paper, we analyze CO2 and brine leakage rates at the outlet of the fault where leakage occurs, investigate the sensitivity of parameters aff ecting CO2 and brine leakage, and fi nally apply these analyses to the risk assessment of CO2 leakage through the fault.
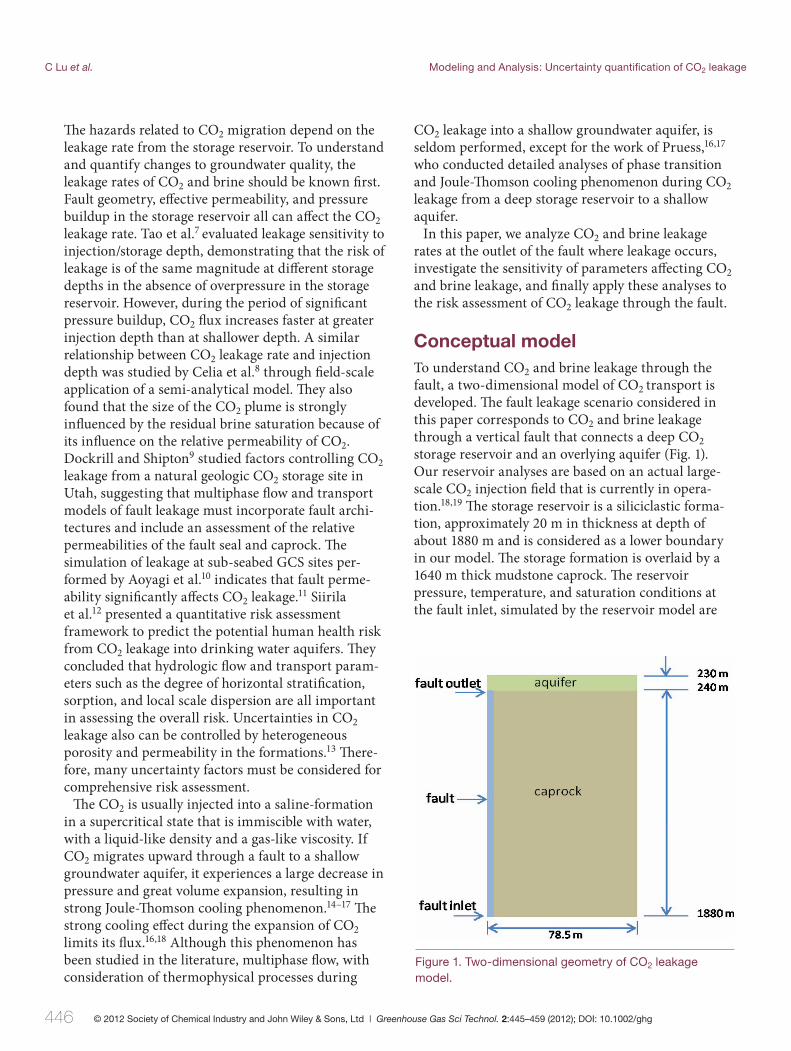
Conceptual modelTo understand CO2 and brine leakage through the fault, a two-dimensional model of CO2 transport is developed. Th e fault leakage scenario considered in this paper corresponds to CO2 and brine leakage through a vertical fault that connects a deep CO2 storage reservoir and an overlying aquifer (Fig. 1). Our reservoir analyses are based on an actual large-scale CO2 injection fi eld that is currently in opera-tion.18,19 Th e storage reservoir is a siliciclastic forma-tion, approximately 20 m in thickness at depth of about 1880 m and is considered as a lower boundary in our model. Th e storage formation is overlaid by a 1640 m thick mudstone caprock. Th e reservoir pressure, temperature, and saturation conditions at the fault inlet, simulated by the reservoir model are
Figure 1. Two-dimensional geometry of CO2 leakage model.
Modeling and Analysis: Uncertainty quantifi cation of CO2 leakage C Lu et al.
447© 2012 Society of Chemical Industry and John Wiley & Sons, Ltd | Greenhouse Gas Sci Technol. 2:445–459 (2012); DOI: 10.1002/ghg
used as boundary conditions. Th e aquifer properties and fault characteristics are hypothesized to cover a variety of fault-leakage conditions.
Th e fault-leakage system is conceptualized with the following simplifi cations and assumptions. Because the fault model is two-dimensional, it does not capture pressure gradients along the strike of the fault, and the resulting distribution of fl ow and mass transport in that vertical plane. Similarly, a two-di-mensional model does not capture the interaction of a fi nite three-dimensional CO2 plume intersecting the fault plane; thus, this geometry assumes the entire fault plane receives CO2 and brine fl ux. Furthermore, the fault is lumped in a simplistic fashion, represented as an equivalent Darcy continuum with an isotropic, homogeneous eff ective permeability assigned to the entire length of the fault. Constant values of porosity and permeability are assigned to the caprock and upper groundwater aquifer. Th is model does not account for the fault structure, heterogeneity along the fault, the infl uence of diagenesis or stress-depen-dent permeability, or the response of the fault to changes in in situ stress.
In the literature, fault permeability has been esti-mated using a variety of approaches that incorporate deformation mechanisms, host rock lithology, pres-ence of clays, diagenesis, stress, etc. In this particular case, given the hypothetical geometry of the fault, we adopt published relationships between fault perme-ability and host rock permeability in siliciclastic sediments (Table 1).20–22 Similarly, we apply litera-
turial values of typical aquifer permeabilities18,23 to our model.
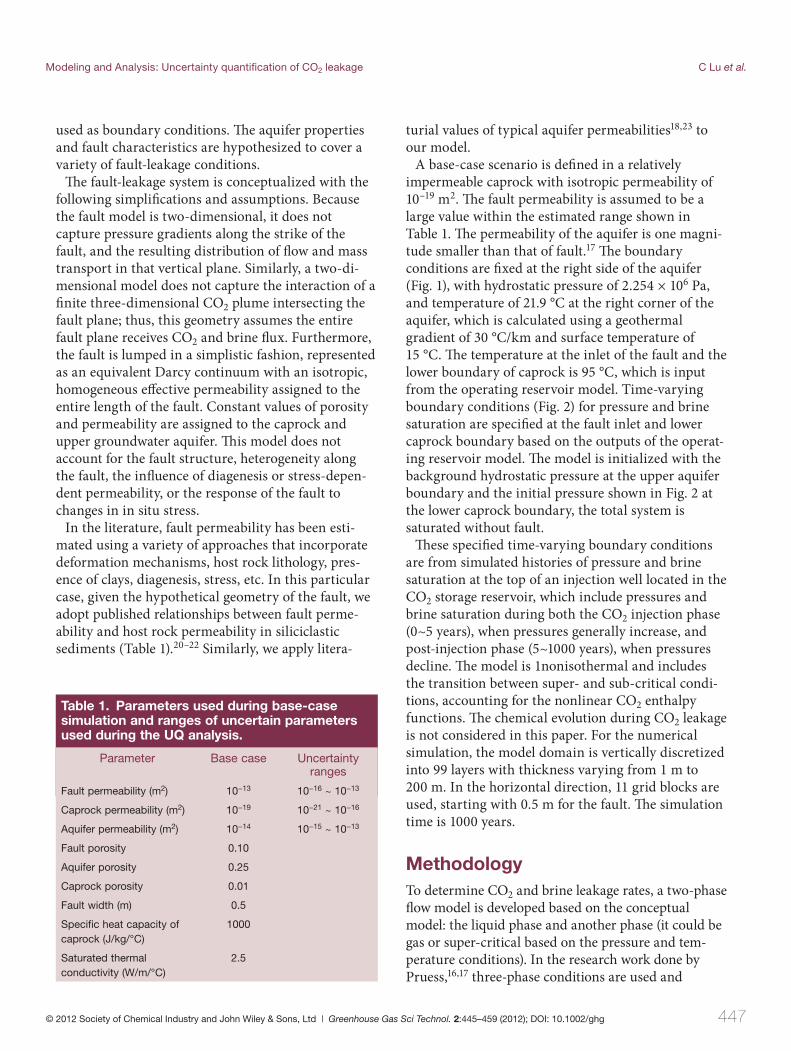
A base-case scenario is defi ned in a relatively impermeable caprock with isotropic permeability of 10–19 m2. Th e fault permeability is assumed to be a large value within the estimated range shown in Table 1. Th e permeability of the aquifer is one magni-tude smaller than that of fault.17 Th e boundary conditions are fi xed at the right side of the aquifer (Fig. 1), with hydrostatic pressure of 2.254 × 10⁶ Pa, and temperature of 21.9 °C at the right corner of the aquifer, which is calculated using a geothermal gradient of 30 °C/km and surface temperature of 15 °C. Th e temperature at the inlet of the fault and the lower boundary of caprock is 95 °C, which is input from the operating reservoir model. Time-varying boundary conditions (Fig. 2) for pressure and brine saturation are specifi ed at the fault inlet and lower caprock boundary based on the outputs of the operat-ing reservoir model. Th e model is initialized with the background hydrostatic pressure at the upper aquifer boundary and the initial pressure shown in Fig. 2 at the lower caprock boundary, the total system is saturated without fault.
Th ese specifi ed time-varying boundary conditions are from simulated histories of pressure and brine saturation at the top of an injection well located in the CO2 storage reservoir, which include pressures and brine saturation during both the CO2 injection phase (0~5 years), when pressures generally increase, and post-injection phase (5~1000 years), when pressures decline. Th e model is 1nonisothermal and includes the transition between super- and sub-critical condi-tions, accounting for the nonlinear CO2 enthalpy functions. Th e chemical evolution during CO2 leakage is not considered in this paper. For the numerical simulation, the model domain is vertically discretized into 99 layers with thickness varying from 1 m to 200 m. In the horizontal direction, 11 grid blocks are used, starting with 0.5 m for the fault. Th e simulation time is 1000 years.
MethodologyTo determine CO2 and brine leakage rates, a two-phase fl ow model is developed based on the conceptual model: the liquid phase and another phase (it could be gas or super-critical based on the pressure and tem-perature conditions). In the research work done by Pruess,16,17 three-phase conditions are used and
Table 1. Parameters used during base-case simulation and ranges of uncertain parameters used during the UQ analysis.
Parameter Base case Uncertainty ranges
Fault permeability (m2) 10−13 10−16 ~ 10−13
Caprock permeability (m2) 10−19 10−21 ~ 10−16
Aquifer permeability (m2) 10−14 10−15 ~ 10−13
Fault porosity 0.10
Aquifer porosity 0.25
Caprock porosity 0.01
Fault width (m) 0.5
Specifi c heat capacity of caprock (J/kg/°C)
1000
Saturated thermal conductivity (W/m/°C)
2.5
C Lu et al. Modeling and Analysis: Uncertainty quantifi cation of CO2 leakage
448 © 2012 Society of Chemical Industry and John Wiley & Sons, Ltd | Greenhouse Gas Sci Technol. 2:445–459 (2012); DOI: 10.1002/ghg
constant boundary conditions are setup at the lower boundary, which will cause that there is more CO2 transfer to liquid phase when the overpressure keeps exist and the temperature at shallow depth continues decreasing. So the simulation stops before 40 years when the temperatures at shallow depth approach the freezing point of water. In our model, variable bound-ary conditions are used and the inject period is only 5 years, there is more dissolution of CO2 before 5 years, but the amount of liquid CO2 in the system is small. Th e simulation can be perform through 1000 years.
Th e model is simulated using NUFT (Nonisother-mal Unsaturated-saturated Flow and Transport) code.24,25 NUFT is a fl exible multipurpose computer code for modeling multiphase, multi-component heat and mass fl ow and reactive transport in unsaturated and saturated porous media. It solves the continuum equations for the conservation of mass and energy with an integrated fi nite-diff erence spatial discretiza-tion. Th e code has been widely used for numerical modeling of subsurface multiphase fl ow and reactive transport processes. Applications include geological dis posal of nuclear waste,26,27 GCS,2,28 groundwater monitoring and remediation,29 and subsurface hydrocarbon production.30
Th e properties of CO2 vary along the fault because of the varying pressure and temperature with depth.
We use the Span and Wagner31 enthalpy function to capture the CO2 temperature evolution along the fault. Th e enthalpy is calculated as:
h(δ, τ )RT
= 1 + τ (φ 0τ + φ r
τ ) + δφ rδ (1)
where h (kJ/kg) is the specifi c enthalpy, δ is the reduced density (δ = ρ/ρc) [–], ρ is mass density (kg/m3), ρc is the critical density, (467.6 ± 0.6) (kg/m3), τ is the inverse reduced temperature (τ = Tc/T) [–], T is the thermodynamic temperature (K), Tc is critical temperature, (304.1282 ± 0.015) (K), R is the specifi c gas constant, (0.1889241 ± 0.0000116) [kJ/(kg K)], φ is the dimensionless Helmholtz energy, r is the residual, φ0 is the ideal gas part of the Helmholtz energy and φr is the residual part of the Helmholtz energy, φτ
0 and φτr
are derivatives of function φ0 and φr to τ, respectively, and φδ
r is the derivative of function φr to δ. Th e details of the equation solution are referred to Span and Wagner.31 Th e reference point to calculate the en-thalpy is at 25 °C and 1 atm.
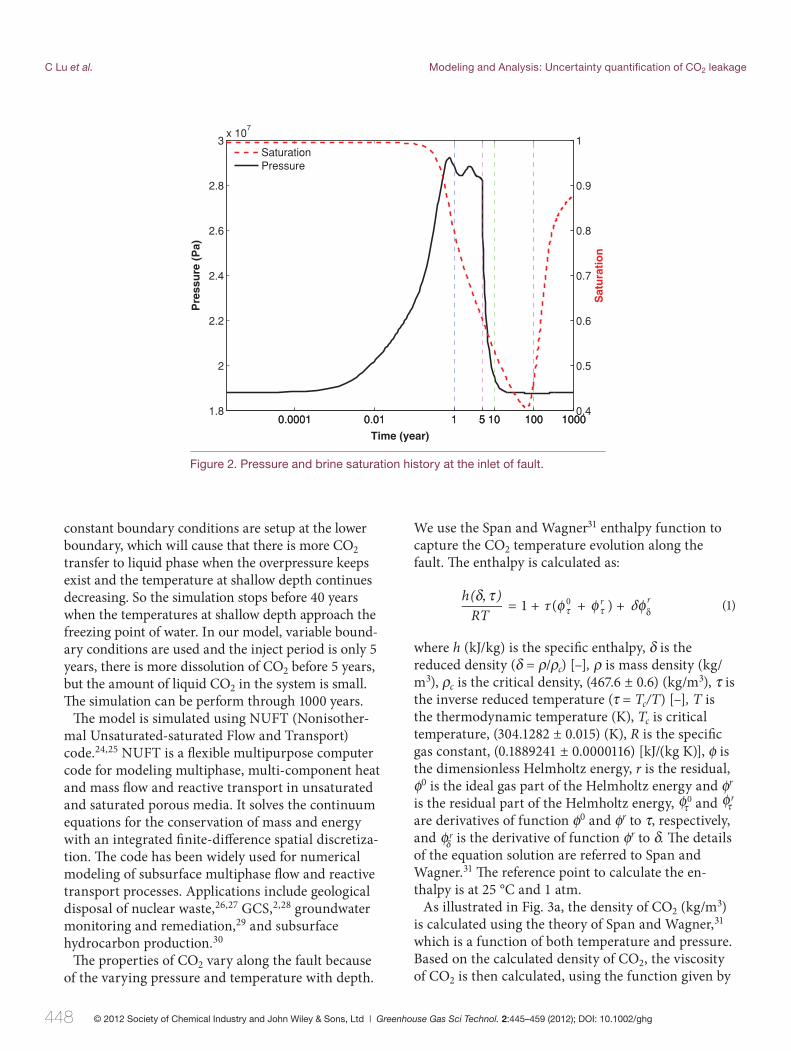
As illustrated in Fig. 3a, the density of CO2 (kg/m3) is calculated using the theory of Span and Wagner,31 which is a function of both temperature and pressure. Based on the calculated density of CO2, the viscosity of CO2 is then calculated, using the function given by
Figure 2. Pressure and brine saturation history at the inlet of fault.
0.0001 0.01 1 5 10 100 10001.8
2
2.2
2.4
2.6
2.8
3x 10
7
Time (year)
Pre
ssu
re (
Pa)
0.0001 0.01 1 5 10 100 10000.4
0.5
0.6
0.7
0.8
0.9
1
Satu
rati
on
SaturationPressure
Modeling and Analysis: Uncertainty quantifi cation of CO2 leakage C Lu et al.
449© 2012 Society of Chemical Industry and John Wiley & Sons, Ltd | Greenhouse Gas Sci Technol. 2:445–459 (2012); DOI: 10.1002/ghg
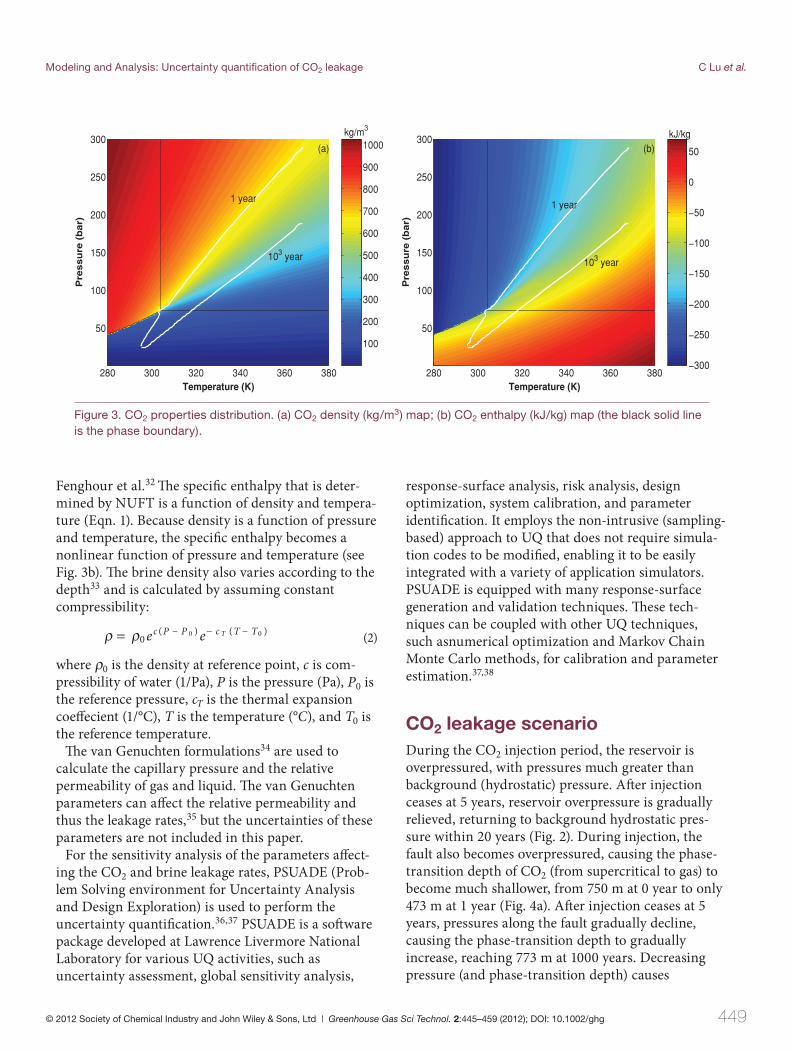
Fenghour et al.32 Th e specifi c enthalpy that is deter-mined by NUFT is a function of density and tempera-ture (Eqn. 1). Because density is a function of pressure and temperature, the specifi c enthalpy becomes a nonlinear function of pressure and temperature (see Fig. 3b). Th e brine density also varies according to the depth33 and is calculated by assuming constant compressibility:
ρ = ρ0ec (P − P 0 )e− c T (T − T0 ) (2)
where ρ0 is the density at reference point, c is com-pressibility of water (1/Pa), P is the pressure (Pa), P0 is the reference pressure, cT is the thermal expansion coeff ecient (1/°C), T is the temperature (°C), and T0 is the reference temperature.
Th e van Genuchten formulations34 are used to calculate the capillary pressure and the relative permeability of gas and liquid. Th e van Genuchten parameters can aff ect the relative permeability and thus the leakage rates,35 but the uncertainties of these parameters are not included in this paper.
For the sensitivity analysis of the parameters aff ect-ing the CO2 and brine leakage rates, PSUADE (Prob-lem Solving environment for Uncertainty Analysis and Design Exploration) is used to perform the uncertainty quantifi cation.36,37 PSUADE is a soft ware package developed at Lawrence Livermore National Laboratory for various UQ activities, such as uncertainty assessment, global sensitivity analysis,
response-surface analysis, risk analysis, design optimization, system calibration, and parameter identifi cation. It employs the non-intrusive (sampling-based) approach to UQ that does not require simula-tion codes to be modifi ed, enabling it to be easily integrated with a variety of application simulators. PSUADE is equipped with many response-surface generation and validation techniques. Th ese tech-niques can be coupled with other UQ techniques, such asnumerical optimization and Markov Chain Monte Carlo methods, for calibration and parameter estimation.37,38
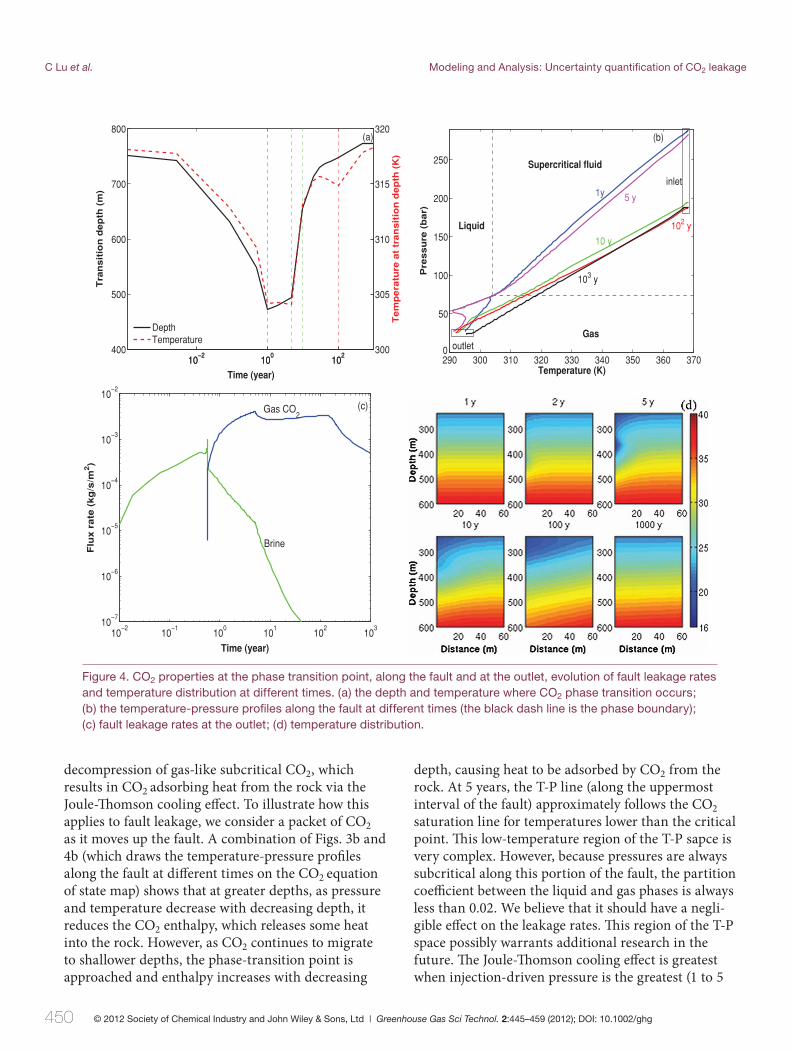
CO2 leakage scenarioDuring the CO2 injection period, the reservoir is overpressured, with pressures much greater than background (hydrostatic) pressure. Aft er injection ceases at 5 years, reservoir overpressure is gradually relieved, returning to background hydrostatic pres-sure within 20 years (Fig. 2). During injection, the fault also becomes overpressured, causing the phase-transition depth of CO2 (from supercritical to gas) to become much shallower, from 750 m at 0 year to only 473 m at 1 year (Fig. 4a). Aft er injection ceases at 5 years, pressures along the fault gradually decline, causing the phase-transition depth to gradually increase, reaching 773 m at 1000 years. Decreasing pressure (and phase-transition depth) causes
Figure 3. CO2 properties distribution. (a) CO2 density (kg/m3) map; (b) CO2 enthalpy (kJ/kg) map (the black solid line is the phase boundary).
100
200
300
400
500
600
700
800
900
1000
280 300 320 340 360 380
50
100
150
200
250
300
Temperature (K)
Pre
ss
ure
(b
ar)
(a)
1 year
103 year
kg/m3
−300
−250
−200
−150
−100
−50
0
50
280 300 320 340 360 380
50
100
150
200
250
300
Temperature (K)
Pre
ss
ure
(b
ar)
(b)
1 year
103 year
kJ/kg
C Lu et al. Modeling and Analysis: Uncertainty quantifi cation of CO2 leakage
450 © 2012 Society of Chemical Industry and John Wiley & Sons, Ltd | Greenhouse Gas Sci Technol. 2:445–459 (2012); DOI: 10.1002/ghg
depth, causing heat to be adsorbed by CO2 from the rock. At 5 years, the T-P line (along the uppermost interval of the fault) approximately follows the CO2 saturation line for temperatures lower than the critical point. Th is low-temperature region of the T-P sapce is very complex. However, because pressures are always subcritical along this portion of the fault, the partition coeffi cient between the liquid and gas phases is always less than 0.02. We believe that it should have a negli-gible eff ect on the leakage rates. Th is region of the T-P space possibly warrants additional research in the future. Th e Joule-Th omson cooling eff ect is greatest when injection-driven pressure is the greatest (1 to 5
decompression of gas-like subcritical CO2, which results in CO2 adsorbing heat from the rock via the Joule-Th omson cooling eff ect. To illustrate how this applies to fault leakage, we consider a packet of CO2 as it moves up the fault. A combination of Figs. 3b and 4b (which draws the temperature-pressure profi les along the fault at diff erent times on the CO2 equation of state map) shows that at greater depths, as pressure and temperature decrease with decreasing depth, it reduces the CO2 enthalpy, which releases some heat into the rock. However, as CO2 continues to migrate to shallower depths, the phase-transition point is approached and enthalpy increases with decreasing
Figure 4. CO2 properties at the phase transition point, along the fault and at the outlet, evolution of fault leakage rates and temperature distribution at different times. (a) the depth and temper ature where CO2 phase transition occurs; (b) the temperature-pressure profi les along the fault at different times (the black dash line is the phase boundary); (c) fault leakage rates at the outlet; (d) temperature distribution.
10−2
100
102
400
500
600
700
800
Time (year)
Tra
ns
itio
n d
ep
th (
m)
10−2
100
102
300
305
310
315
320
Te
mp
era
ture
at
tra
ns
itio
n d
ep
th (
K)
DepthTemperature
(a)
290 300 310 320 330 340 350 360 3700
50
100
150
200
250
Temperature (K)
Pre
ssu
re (
bar)
inlet
outlet
Supercritical fluid
Liquid
Gas
1y
103 y
102 y
5 y
(b)
10 y
10−2
10−1
100
101
102
103
10−7
10−6
10−5
10−4
10−3
10−2
Time (year)
Flu
x r
ate
(kg
/s/m
2)
Gas CO2
Brine
(c)
Modeling and Analysis: Uncertainty quantifi cation of CO2 leakage C Lu et al.
451© 2012 Society of Chemical Industry and John Wiley & Sons, Ltd | Greenhouse Gas Sci Technol. 2:445–459 (2012); DOI: 10.1002/ghg
years), as shown in Fig. 4a, which also plots tempera-ture at the phase-transition depth. Around 100 years, the temperature at the 11 transition depth decreases a little, it caused by the increased CO2 fl ux rate (Fig. 4c). Th us, this nonisothermal eff ect is strongest when the pressures are highest and the CO2 fl ux rate is large.
Th e Joule-Th omson cooling eff ect also can be readily observed in the evolution of temperature distribution (Fig. 4d). Temperatures along the fault decline due to this eff ect as CO2 expands during upward migration.17 Th e cooling eff ect is particularly acute at 5 years, which corresponds to the period of greatest overpres-sure. Low-temperature CO2 gas migrates upward, continuously accumulating in the aquifer, causing aquifer temperatures near the fault outlet to gradually decrease during the fi rst 100 years. Because CO2 gas fl ux begins a steady (fi nal) decline aft er 150 years (Fig. 4c), the Joule-Th omson cooling eff ect is dimin-ished, which allows the temperature distribution to laterally equilibrate within 1000 years (Fig. 4d).
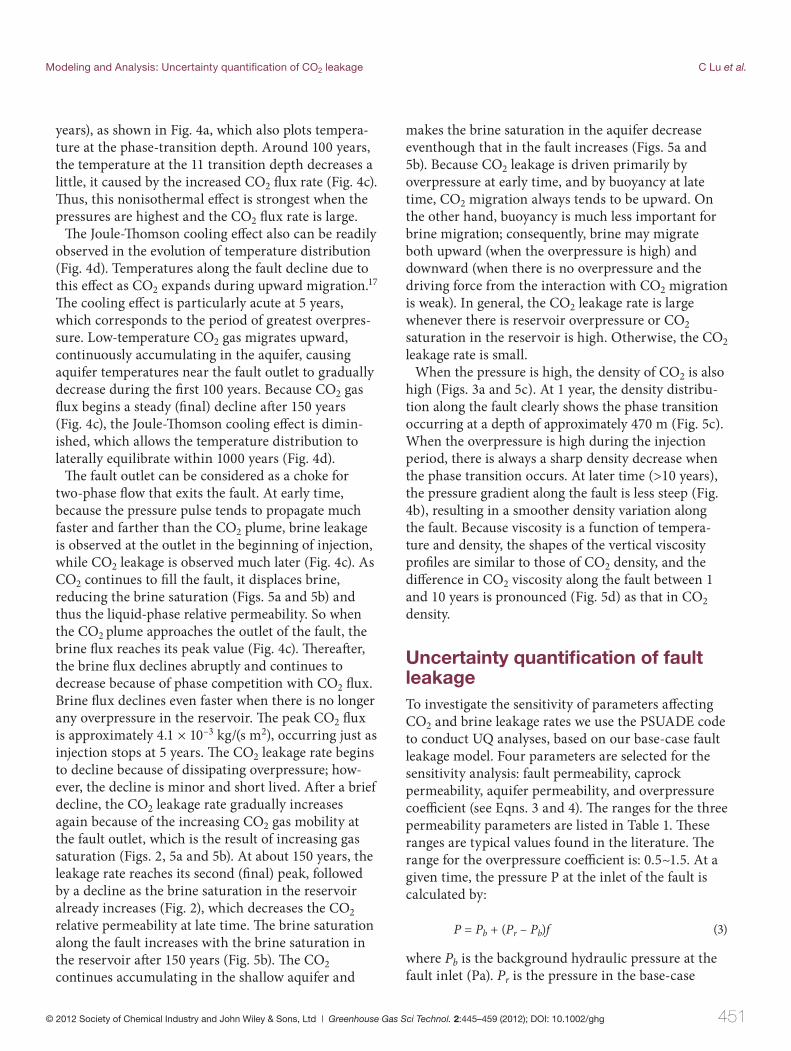
Th e fault outlet can be considered as a choke for two-phase fl ow that exits the fault. At early time, because the pressure pulse tends to propagate much faster and farther than the CO2 plume, brine leakage is observed at the outlet in the beginning of injection, while CO2 leakage is observed much later (Fig. 4c). As CO2 continues to fi ll the fault, it displaces brine, reducing the brine saturation (Figs. 5a and 5b) and thus the liquid-phase relative permeability. So when the CO2 plume approaches the outlet of the fault, the brine fl ux reaches its peak value (Fig. 4c). Th ereaft er, the brine fl ux declines abruptly and continues to decrease because of phase competition with CO2 fl ux. Brine fl ux declines even faster when there is no longer any overpressure in the reservoir. Th e peak CO2 fl ux is approximately 4.1 × 10⁻³ kg/(s m2), occurring just as injection stops at 5 years. Th e CO2 leakage rate begins to decline because of dissipating overpressure; how-ever, the decline is minor and short lived. Aft er a brief decline, the CO2 leakage rate gradually increases again because of the increasing CO2 gas mobility at the fault outlet, which is the result of increasing gas saturation (Figs. 2, 5a and 5b). At about 150 years, the leakage rate reaches its second (fi nal) peak, followed by a decline as the brine saturation in the reservoir already increases (Fig. 2), which decreases the CO2 relative permeability at late time. Th e brine saturation along the fault increases with the brine saturation in the reservoir aft er 150 years (Fig. 5b). Th e CO2 continues accumulating in the shallow aquifer and
makes the brine saturation in the aquifer decrease eventhough that in the fault increases (Figs. 5a and 5b). Because CO2 leakage is driven primarily by overpressure at early time, and by buoyancy at late time, CO2 migration always tends to be upward. On the other hand, buoyancy is much less important for brine migration; consequently, brine may migrate both upward (when the overpressure is high) and downward (when there is no overpressure and the driving force from the interaction with CO2 migration is weak). In general, the CO2 leakage rate is large whenever there is reservoir overpressure or CO2 saturation in the reservoir is high. Otherwise, the CO2 leakage rate is small.
When the pressure is high, the density of CO2 is also high (Figs. 3a and 5c). At 1 year, the density distribu-tion along the fault clearly shows the phase transition occurring at a depth of approximately 470 m (Fig. 5c). When the overpressure is high during the injection period, there is always a sharp density decrease when the phase transition occurs. At later time (>10 years), the pressure gradient along the fault is less steep (Fig. 4b), resulting in a smoother density variation along the fault. Because viscosity is a function of tempera-ture and density, the shapes of the vertical viscosity profi les are similar to those of CO2 density, and the diff erence in CO2 viscosity along the fault between 1 and 10 years is pronounced (Fig. 5d) as that in CO2 density.
Uncertainty quantifi cation of fault leakageTo investigate the sensitivity of parameters aff ecting CO2 and brine leakage rates we use the PSUADE code to conduct UQ analyses, based on our base-case fault leakage model. Four parameters are selected for the sensitivity analysis: fault permeability, caprock permeability, aquifer permeability, and overpressure coeffi cient (see Eqns. 3 and 4). Th e ranges for the three permeability parameters are listed in Table 1. Th ese ranges are typical values found in the literature. Th e range for the overpressure coeffi cient is: 0.5~1.5. At a given time, the pressure P at the inlet of the fault is calculated by:
P = Pb + (Pr – Pb)f (3)
where Pb is the background hydraulic pressure at the fault inlet (Pa). Pr is the pressure in the base-case
C Lu et al. Modeling and Analysis: Uncertainty quantifi cation of CO2 leakage
452 © 2012 Society of Chemical Industry and John Wiley & Sons, Ltd | Greenhouse Gas Sci Technol. 2:445–459 (2012); DOI: 10.1002/ghg
scenario run at the same time (Fig. 2), and f is the overpressure coeffi cient.
Th e overpressure can infl uence brine saturation. Th e evolution of pressure and brine saturation at the fault inlet is dependent on fault location within the reser-voir, relative to the center of the injection zone. For example, if the fault is downdip from the center of injection, it may see little CO2 (because it has mi-grated updip in the storage reservoir), while still experiencing a relatively large overpressure. Th erefore, for real settings, the relationship between pressure and brine saturation may not be linear. Th e uncer-tainty of pressure can refl ect the uncertainty of the fault location because the pressure pulse propagates
faster and radially. But it is diffi cult to match a perfect equation of brine saturation with the fault location. So, for the purpose of simplifying our model and focusing on the fault leakage assessment, we assumed a linear relationship between pressure and brine saturation at the fault inlet (the brine saturation is low when the overpressure is high), and the overpressure coeffi cient is also applied into the calculation of the brine saturation S at the fault inlet:
S = 1 – (1 – Sr)f (4)
where Sr is the brine saturation in the base-case scenario run at the same time (Fig. 2). Th e equation
Figure 5. Saturation evolution at the outlet, brine saturation and CO2 properties along the fault at different times. (a) saturation evolution at the outlet; (b) brine saturation; (c) CO2 density; (d) CO2 viscosity.
10−2
10−1
100
101
102
103
0
0.1
0.2
0.3
0.4
0.5
0.6
0.7
0.8
0.9
1
Time (year)
Sa
tura
tio
n
(a)BrineGas
0.3 0.4 0.5 0.6 0.7 0.8 0.9 1
400
600
800
1000
1200
1400
1600
1800
Brine saturation
Dep
th (
m)
1 y2 y5 y10 y102 y
103 y
(b)
0 100 200 300 400 500 600 700 800
400
600
800
1000
1200
1400
1600
1800
Density (kg/m3)
Dep
th (
m)
(c)
1 y
2 y
5 y
10 y
102 y
103 y
1.5 2 2.5 3 3.5 4 4.5 5 5.5 6
x 10−5
400
600
800
1000
1200
1400
1600
1800
Viscosity (Nt−s/m2)
Dep
th (
m)
(d)
1 y
2 y
5 y
10 y
102 y
103 y
Modeling and Analysis: Uncertainty quantifi cation of CO2 leakage C Lu et al.
453© 2012 Society of Chemical Industry and John Wiley & Sons, Ltd | Greenhouse Gas Sci Technol. 2:445–459 (2012); DOI: 10.1002/ghg
will be similar to the pressure calculation equation if it is written in term of gas saturation.
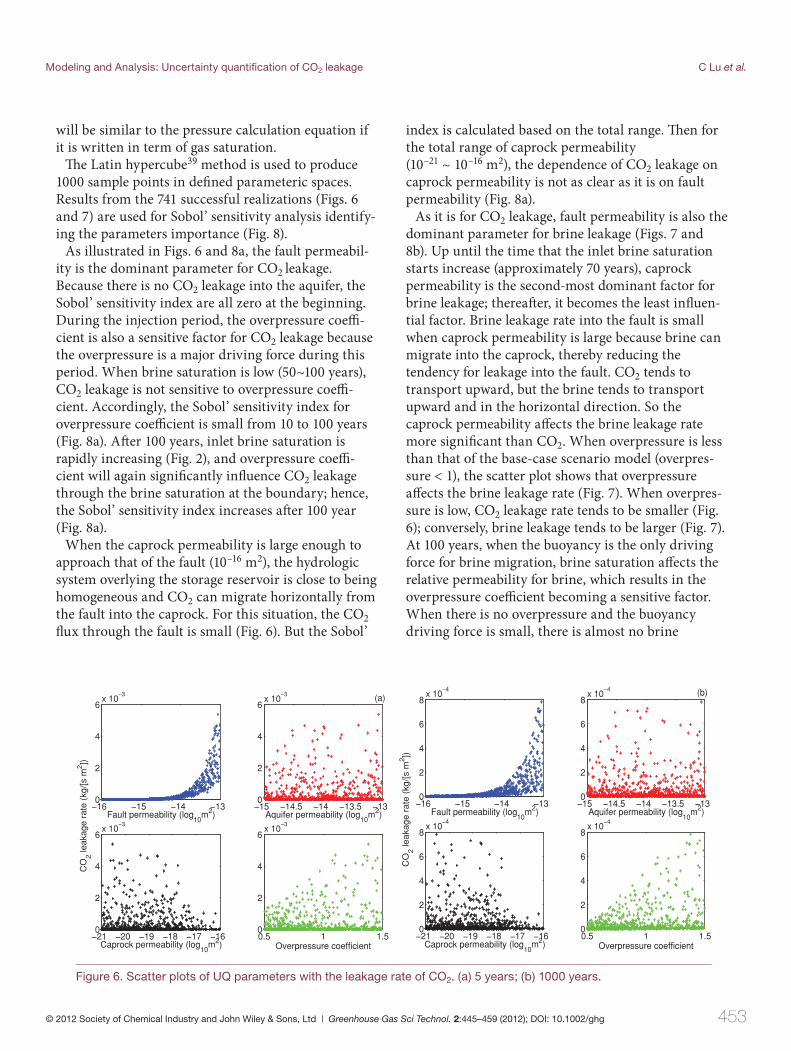
Th e Latin hypercube39 method is used to produce 1000 sample points in defi ned parameteric spaces. Results from the 741 successful realizations (Figs. 6 and 7) are used for Sobol’ sensitivity analysis identify-ing the parameters importance (Fig. 8).
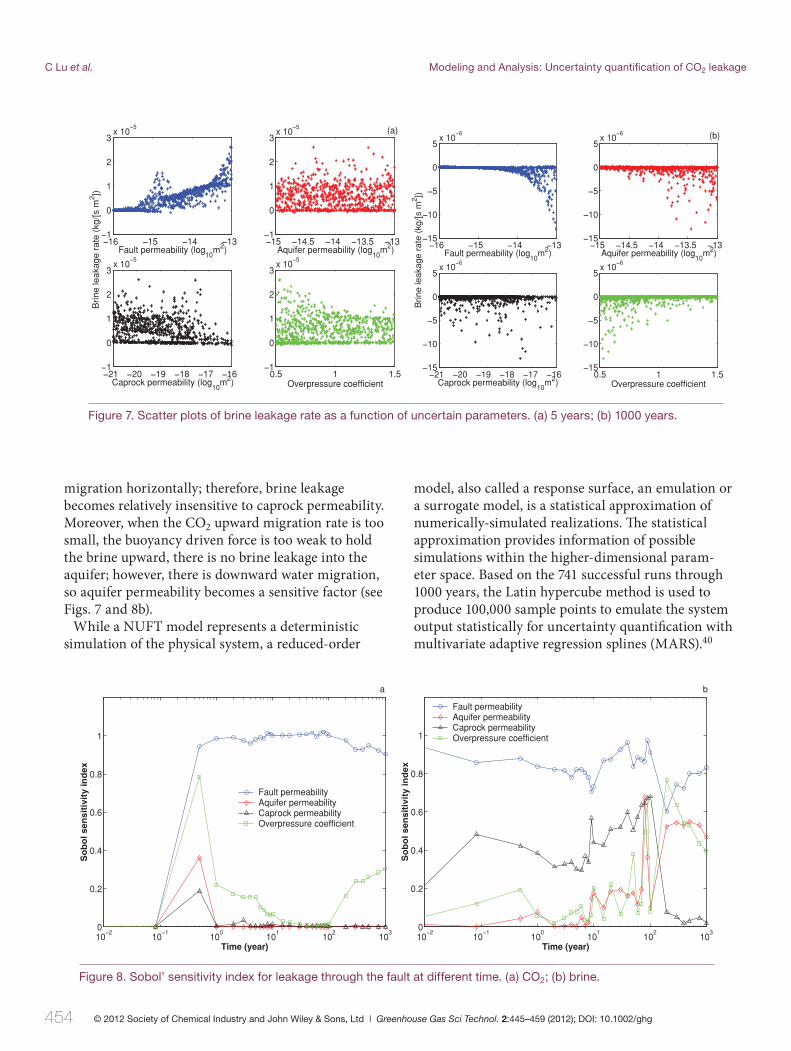
As illustrated in Figs. 6 and 8a, the fault permeabil-ity is the dominant parameter for CO2 leakage. Because there is no CO2 leakage into the aquifer, the Sobol’ sensitivity index are all zero at the beginning. During the injection period, the overpressure coeffi -cient is also a sensitive factor for CO2 leakage because the overpressure is a major driving force during this period. When brine saturation is low (50~100 years), CO2 leakage is not sensitive to overpressure coeffi -cient. Accordingly, the Sobol’ sensitivity index for overpressure coeffi cient is small from 10 to 100 years (Fig. 8a). Aft er 100 years, inlet brine saturation is rapidly increasing (Fig. 2), and overpressure coeffi -cient will again signifi cantly infl uence CO2 leakage through the brine saturation at the boundary; hence, the Sobol’ sensitivity index increases aft er 100 year (Fig. 8a).
When the caprock permeability is large enough to approach that of the fault (10–16 m2), the hydrologic system overlying the storage reservoir is close to being homogeneous and CO2 can migrate horizontally from the fault into the caprock. For this situation, the CO2 fl ux through the fault is small (Fig. 6). But the Sobol’
index is calculated based on the total range. Th en for the total range of caprock permeability (10–21 ~ 10–16 m2), the dependence of CO2 leakage on caprock permeability is not as clear as it is on fault permeability (Fig. 8a).
As it is for CO2 leakage, fault permeability is also the dominant parameter for brine leakage (Figs. 7 and 8b). Up until the time that the inlet brine saturation starts increase (approximately 70 years), caprock permeability is the second-most dominant factor for brine leakage; thereaft er, it becomes the least infl uen-tial factor. Brine leakage rate into the fault is small when caprock permeability is large because brine can migrate into the caprock, thereby reducing the tendency for leakage into the fault. CO2 tends to transport upward, but the brine tends to transport upward and in the horizontal direction. So the caprock permeability aff ects the brine leakage rate more signifi cant than CO2. When overpressure is less than that of the base-case scenario model (overpres-sure < 1), the scatter plot shows that overpressure aff ects the brine leakage rate (Fig. 7). When overpres-sure is low, CO2 leakage rate tends to be smaller (Fig. 6); conversely, brine leakage tends to be larger (Fig. 7). At 100 years, when the buoyancy is the only driving force for brine migration, brine saturation aff ects the relative permeability for brine, which results in the overpressure coeffi cient becoming a sensitive factor. When there is no overpressure and the buoyancy driving force is small, there is almost no brine
Figure 6. Scatter plots of UQ parameters with the leakage rate of CO2. (a) 5 years; (b) 1000 years.
−16 −15 −14 −130
2
4
6x 10
−3
Fault permeability (log10
m2)−15 −14.5 −14 −13.5 −130
2
4
6x 10
−3
Aquifer permeability (log10
m2)
−21 −20 −19 −18 −17 −160
2
4
6x 10
−3
Caprock permeability (log10
m2)
CO
2 leak
age
rate
(kg
/[s m
2 ])
0.5 1 1.50
2
4
6x 10
−3
Overpressure coefficient
(a)
−16 −15 −14 −130
2
4
6
8x 10
−4
Fault permeability (log10
m2)−15 −14.5 −14 −13.5 −130
2
4
6
8x 10
−4
Aquifer permeability (log10
m2)
−21 −20 −19 −18 −17 −160
2
4
6
8x 10
−4
Caprock permeability (log10
m2)
CO
2 leak
age
rate
(kg
/[s m
2 ])
0.5 1 1.50
2
4
6
8x 10
−4
Overpressure coefficient
(b)
C Lu et al. Modeling and Analysis: Uncertainty quantifi cation of CO2 leakage
454 © 2012 Society of Chemical Industry and John Wiley & Sons, Ltd | Greenhouse Gas Sci Technol. 2:445–459 (2012); DOI: 10.1002/ghg
migration horizontally; therefore, brine leakage becomes relatively insensitive to caprock permeability. Moreover, when the CO2 upward migration rate is too small, the buoyancy driven force is too weak to hold the brine upward, there is no brine leakage into the aquifer; however, there is downward water migration, so aquifer permeability becomes a sensitive factor (see Figs. 7 and 8b).
While a NUFT model represents a deterministic simulation of the physical system, a reduced-order
model, also called a response surface, an emulation or a surrogate model, is a statistical approximation of numerically-simulated realizations. Th e statistical approximation provides information of possible simulations within the higher-dimensional param-eter space. Based on the 741 successful runs through 1000 years, the Latin hypercube method is used to produce 100,000 sample points to emulate the system output statistically for uncertainty quantifi cation with multivariate adaptive regression splines (MARS).40
Figure 7. Scatter plots of brine leakage rate as a function of uncertain parameters. (a) 5 years; (b) 1000 years.
−16 −15 −14 −13−1
0
1
2
3x 10
−5
Fault permeability (log10
m2)
Brin
e le
akag
e ra
te (
kg/[s
m2 ])
−15 −14.5 −14 −13.5 −13−1
0
1
2
3x 10
−5
Aquifer permeability (log10
m2)
−21 −20 −19 −18 −17 −16−1
0
1
2
3x 10
−5
Caprock permeability (log10
m2)0.5 1 1.5
−1
0
1
2
3x 10
−5
Overpressure coefficient
(a)
−16 −15 −14 −13−15
−10
−5
0
5x 10
−6
Fault permeability (log10
m2)−15 −14.5 −14 −13.5 −13
−15
−10
−5
0
5x 10
−6
Aquifer permeability (log10
m2)
−21 −20 −19 −18 −17 −16−15
−10
−5
0
5x 10
−6
Caprock permeability (log10
m2)
Brin
e le
akag
e ra
te (
kg/[s
m2 ])
0.5 1 1.5−15
−10
−5
0
5x 10
−6
Overpressure coefficient
(b)
Figure 8. Sobol’ sensitivity index for leakage through the fault at different time. (a) CO2; (b) brine.
10−2
10−1
100
101
102
103
0
0.2
0.4
0.6
0.8
1
Time (year)
So
bo
l s
en
sit
ivit
y i
nd
ex
Fault permeabilityAquifer permeabilityCaprock permeabilityOverpressure coefficient
a
10−2
10−1
100
101
102
103
0
0.2
0.4
0.6
0.8
1
Time (year)
So
bo
l s
en
sit
ivit
y in
de
x
Fault permeabilityAquifer permeabilityCaprock permeabilityOverpressure coefficient
b
Modeling and Analysis: Uncertainty quantifi cation of CO2 leakage C Lu et al.
455© 2012 Society of Chemical Industry and John Wiley & Sons, Ltd | Greenhouse Gas Sci Technol. 2:445–459 (2012); DOI: 10.1002/ghg
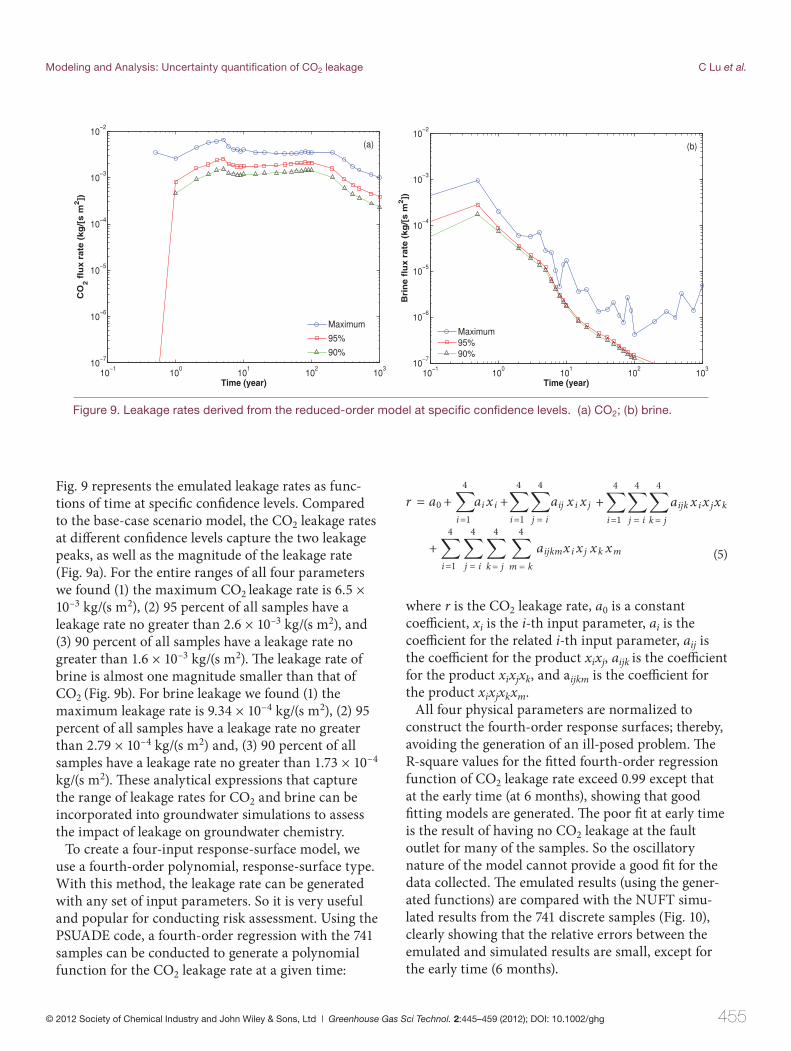
Fig. 9 represents the emulated leakage rates as func-tions of time at specifi c confi dence levels. Compared to the base-case scenario model, the CO2 leakage rates at diff erent confi dence levels capture the two leakage peaks, as well as the magnitude of the leakage rate (Fig. 9a). For the entire ranges of all four parameters we found (1) the maximum CO2 leakage rate is 6.5 × 10⁻³ kg/(s m2), (2) 95 percent of all samples have a leakage rate no greater than 2.6 × 10⁻³ kg/(s m2), and (3) 90 percent of all samples have a leakage rate no greater than 1.6 × 10⁻³ kg/(s m2). Th e leakage rate of brine is almost one magnitude smaller than that of CO2 (Fig. 9b). For brine leakage we found (1) the maximum leakage rate is 9.34 × 10⁻⁴ kg/(s m2), (2) 95 percent of all samples have a leakage rate no greater than 2.79 × 10⁻⁴ kg/(s m2) and, (3) 90 percent of all samples have a leakage rate no greater than 1.73 × 10⁻⁴ kg/(s m2). Th ese analytical expressions that capture the range of leakage rates for CO2 and brine can be incorporated into groundwater simulations to assess the impact of leakage on groundwater chemistry.
To create a four-input response-surface model, we use a fourth-order polynomial, response-surface type. With this method, the leakage rate can be generated with any set of input parameters. So it is very useful and popular for conducting risk assessment. Using the PSUADE code, a fourth-order regression with the 741 samples can be conducted to generate a polynomial function for the CO2 leakage rate at a given time:
r = a0+4
i=1ai x i +
4
i=1
4
j = iaij x i x j +
4
i=1
4
j = i
4
k= j
aijk x ix jxk
+4
i=1
4
j = i
4
k= j
4
m = k
aijkmxi x j xk xm
(5)
where r is the CO2 leakage rate, a0 is a constant coeffi cient, xi is the i-th input parameter, ai is the coeffi cient for the related i-th input parameter, aij is the coeffi cient for the product xixj, aijk is the coeffi cient for the product xixjxk, and aijkm is the coeffi cient for the product xixjxkxm.
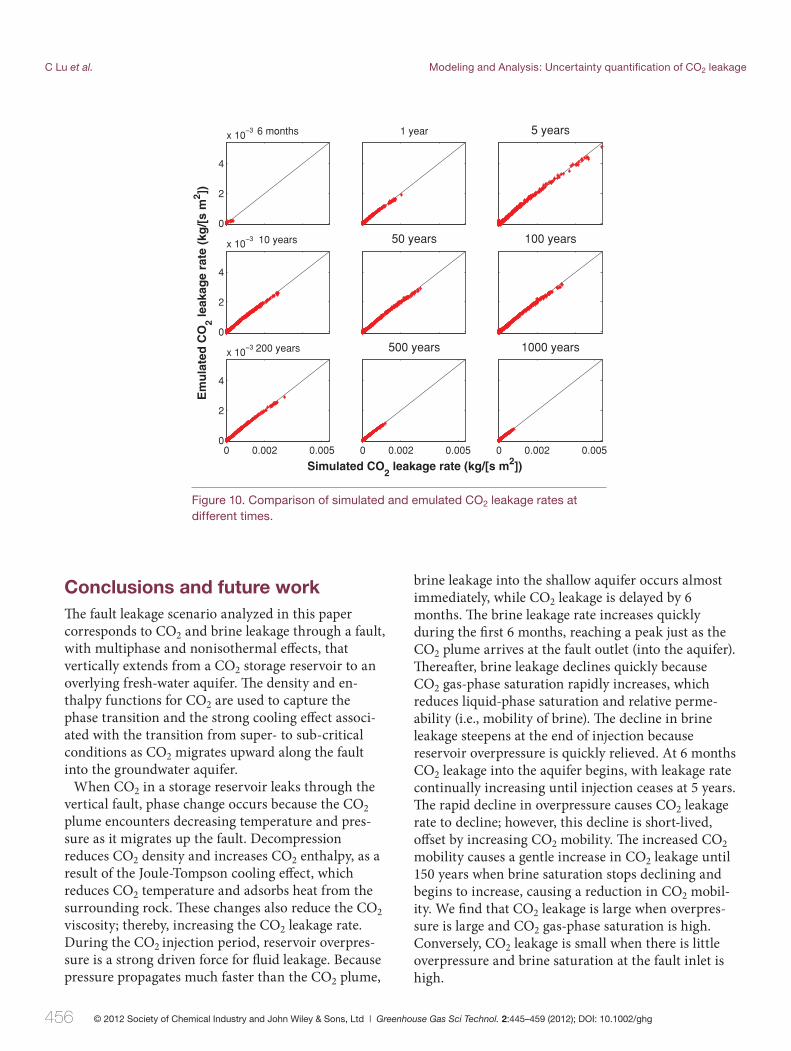
All four physical parameters are normalized to construct the fourth-order response surfaces; thereby, avoiding the generation of an ill-posed problem. Th e R-square values for the fi tted fourth-order regression function of CO2 leakage rate exceed 0.99 except that at the early time (at 6 months), showing that good fi tting models are generated. Th e poor fi t at early time is the result of having no CO2 leakage at the fault outlet for many of the samples. So the oscillatory nature of the model cannot provide a good fi t for the data collected. Th e emulated results (using the gener-ated functions) are compared with the NUFT simu-lated results from the 741 discrete samples (Fig. 10), clearly showing that the relative errors between the emulated and simulated results are small, except for the early time (6 months).
Figure 9. Leakage rates derived from the reduced-order model at specifi c confi dence levels. (a) CO2; (b) brine.
10−1
100
101
102
103
10−7
10−6
10−5
10−4
10−3
10−2
CO
2 f
lux
ra
te (
kg
/[s
m2])
Time (year)
(a)
Maximum
95%
90%
10−1
100
101
102
103
10−7
10−6
10−5
10−4
10−3
10−2
Time (year)
Bri
ne
flu
x r
ate
(k
g/[
s m
2])
(b)
Maximum95%90%
C Lu et al. Modeling and Analysis: Uncertainty quantifi cation of CO2 leakage
456 © 2012 Society of Chemical Industry and John Wiley & Sons, Ltd | Greenhouse Gas Sci Technol. 2:445–459 (2012); DOI: 10.1002/ghg
Conclusions and future workTh e fault leakage scenario analyzed in this paper corresponds to CO2 and brine leakage through a fault, with multiphase and nonisothermal eff ects, that vertically extends from a CO2 storage reservoir to an overlying fresh-water aquifer. Th e density and en-thalpy functions for CO2 are used to capture the phase transition and the strong cooling eff ect associ-ated with the transition from super- to sub-critical conditions as CO2 migrates upward along the fault into the groundwater aquifer.
When CO2 in a storage reservoir leaks through the vertical fault, phase change occurs because the CO2 plume encounters decreasing temperature and pres-sure as it migrates up the fault. Decompression reduces CO2 density and increases CO2 enthalpy, as a result of the Joule-Tompson cooling eff ect, which reduces CO2 temperature and adsorbs heat from the surrounding rock. Th ese changes also reduce the CO2 viscosity; thereby, increasing the CO2 leakage rate. During the CO2 injection period, reservoir overpres-sure is a strong driven force for fl uid leakage. Because pressure propagates much faster than the CO2 plume,
brine leakage into the shallow aquifer occurs almost immediately, while CO2 leakage is delayed by 6 months. Th e brine leakage rate increases quickly during the fi rst 6 months, reaching a peak just as the CO2 plume arrives at the fault outlet (into the aquifer). Th ereaft er, brine leakage declines quickly because CO2 gas-phase saturation rapidly increases, which reduces liquid-phase saturation and relative perme-ability (i.e., mobility of brine). Th e decline in brine leakage steepens at the end of injection because reservoir overpressure is quickly relieved. At 6 months CO2 leakage into the aquifer begins, with leakage rate continually increasing until injection ceases at 5 years. Th e rapid decline in overpressure causes CO2 leakage rate to decline; however, this decline is short-lived, off set by increasing CO2 mobility. Th e increased CO2 mobility causes a gentle increase in CO2 leakage until 150 years when brine saturation stops declining and begins to increase, causing a reduction in CO2 mobil-ity. We fi nd that CO2 leakage is large when overpres-sure is large and CO2 gas-phase saturation is high. Conversely, CO2 leakage is small when there is little overpressure and brine saturation at the fault inlet is high.
Figure 10. Comparison of simulated and emulated CO2 leakage rates at different times.
0
2
4
x 10−3 6 months 1 year 5 years
0
2
4
x 10−3
Em
ula
ted
CO
2 l
ea
ka
ge
ra
te (
kg
/[s
m2])
10 years 50 years 100 years
0 0.002 0.0050
2
4
x 10−3 200 years
0 0.002 0.005
500 years
Simulated CO2 leakage rate (kg/[s m
2])
0 0.002 0.005
1000 years
Modeling and Analysis: Uncertainty quantifi cation of CO2 leakage C Lu et al.
457© 2012 Society of Chemical Industry and John Wiley & Sons, Ltd | Greenhouse Gas Sci Technol. 2:445–459 (2012); DOI: 10.1002/ghg
Fault permeability is the dominant parameter for CO2 and brine leakage. Th e CO2 and brine leakage rates derived from the reduced-order, 4-parameter model capture the time evolution and magnitude of leakage rates in the base-case scenario model. Th e results from the reduced-order model also indicate that the maximum leakage rate of CO2 is no greater than 6.5 × 10⁻³ kg/(s m2) for all samples, no greater than 2.6 × 10⁻³ kg/(s m2) for 95 percent of the sam-ples, and no greater than 1.6×10⁻³ kg/(s m2) for 90 percent of the samples. Th e leakage rate of brine is almost one magnitude smaller than the CO2 leakage rate. Th e emulated results from the fourth-order polynomial function are in good agreement with the simulated samples. Because these analytical expres-sions capture the range of leakage rates for CO2 and brine, they can be incorporated into the groundwater simulations, and related risk assessments, to assess the impact of leakage on the groundwater chemistry.
In the current study, we present a fi rst-generation CO2 and brine leakage-risk profi le approach that can provide valuable input to models, and related risk-assessment studies, of shallow ground-water aquifers. Our approach has several limitations mainly due to its inherent two-dimensional geometry and to the simplifi ed representation of the fault zone geometry and properties. Because pressure buildup during CO2 injection has the potential to change porosity and permeability of the fault and reservoir formation, the next step we will be to couple the CO2 leakage model with geomechanical simulation. Th e location of fault in the CO2 reservoir can aff ect the relationship be-tween the pressure and brine saturation boundary conditions at the fault inlet, therefore it is important to include the infl uence of fault location in future sensi-tivity analyses. In future work, a reduced-order model for the reservoir, derived from three-dimensional reservoir model results, may be necessary to provide this relationship as a function of fault location. Th e uncertainty of van Genuchten parameters used in multi-phase fl ow also needs to be considered in the future work, since the hysteresis model can correctly cpature the behavior of CO2 migration when the regional pressure gradients or buoyancy forces become the major driven force in the post projection period.35
AcknowledgmentsTh e authors wish to thank Susan A. Carroll at Law-rence Livermore National Laboratory for her
comments that led to an improved manuscript. Th is research was funded by National Risk Assessment Partnership (NRAP), U.S. Department of Energy and performed under the auspices of the U.S. Department of Energy by Lawrence Livermore National Labora-tory under Contract No. DE-AC52-07NA27344. Th is paper is released by LLNL with a release number LLNL-JRNL-566032.
References 1. Apps JA, Zheng L, Zhang Y, Xu T, Birkholzer, JT. Evaluation of
potential changes in ground-water quality in response to CO2 leakage from deep geologic storage. Transport Porous Med 82(1):215–246 (2010).
2. Carroll S, Hao Y, Aines R. Geochemical detection of carbon dioxide in dilute aquifers. Geochem Trans 10:4 (2009).
3. Kharaka YK, Thordsen JJ, Kakouros E, Ambats G, Herkelrath WN, Beers SR, Birkholzer JT, Apps JA, Spycher NF, Zheng L, Trautz RC, Rauch HW, Gullickson KS. Changes in the chemistry of shallow groundwater related to the 2008 injection of CO2 at the ZERT fi eld site, Bozeman, Montana. Env Earth Sciences 60(2):273–284 (2010).
4. Wang S and Jaffe PR. Dissolution of a mineral phase in potable aquifer due to CO2 releases from deep formations; effect of dissolution kinetics. Energ Convers Manage 45(18–19):2833–2848 (2004).
5. Viswanathan H, Dai Z, Lopano C, Keating E, Hakala JA, Scheckel KG, Zheng L, Guthrie GD, Pawar R. Developing a robust geochemical and reactive transport model to evaluate possible sources of arsenic at the CO2 sequestration natural analog site in Chimayo, New Mexico. Int J Greenh Gas Con 10:199–214 (2012).
6. Zheng L, Apps JA, Spycher N, Birkholzer JT, Kharaka YK, Thordsen J, Beers SR, Herkelrath WN, Kakouros E, Trautz RC. Geochemical modeling of changes in shallow groundwa-ter chemistry observed during the MSU-ZERT CO2 injection experiments. Int J Greenh Gas Con 7:202–217 (2011).
7. Tao Q, Checkai D, Huerta N, Bryant SL. An improved model to forecast CO2 leakage rates along a wellbore. Energy Procedia 4:5385–5391 (2011).
8. Celia MA, Nordbotten JM, Court B, Dobossy M, Bachu S. Field-scale application of a semi-analytical model for estimation of CO2 and brine leakage along old wells. Int J Greenhouse Gas Cont 5:257–269 (2011).
9. Dockrill B and Shipton ZK. Structural controls on leakage from a natural CO2 geologic storage site: central Utah, U.S.A. J Struct Geol 32:1768–1782 (2010).
10. Aoyagi R, Kitamura O, Itaoka K, Igawa S, Suzuki S. Study on role of simulation of possible leakage from geological CO2 storage in sub-seabed for environmental impact assessment. Energy Procedia 4:3881–3888 (2011).
11. Sakamoto Y, Tanaka A, Tenma N, Komai T. Numerical study on fl ow behavior of CO2 in an aquifer for risk assessment of carbon capture and storage. Energy Procedia 4:4170–4177 (2011).
12. Siirila ER, Navarre-Sitchler AK, Maxwell RM, McCray JE. A quantitative methodology to assess the risks to human health from CO2 leakage into groundwater. Adv Water Resour 36:146–164 (2012).
C Lu et al. Modeling and Analysis: Uncertainty quantifi cation of CO2 leakage
458 © 2012 Society of Chemical Industry and John Wiley & Sons, Ltd | Greenhouse Gas Sci Technol. 2:445–459 (2012); DOI: 10.1002/ghg
13. Deng H, Stauffer PH, Dai Z, Jiao Z, Surdam, RC. Simulation of industrial-scale CO2 storage: Multi-scale heterogeneity and its impacts on storage capacity, injectivity and leakage. Int J Greenh Gas Con 7:202–217 (2011).
14. Katz DL and Lee RL. Physical behavior of natural gas systems physical and thermal properties, phase behavior, analyses. Natural gas engineering. McGraw-Hill Publ. Comp., New York, pp. 110–196 (1990).
15. Oldenburg C. Joule-Thomson cooling due to CO2 injection into natural gas reservoirs. Energ Convers Manage 48:1808–1815 (2007).
16. Pruess K. Leakage of CO2 from geologic storage: Role of secondary accumulation at shallow depth. Int J Greenh Gas Con 2(1):37–46 (2008).
17. Pruess K. Modeling CO2 leakage scenarios, including transitions between super- and sub-critical conditions, and phase change between liquid and gaseous CO2. Energy Procedia 4:3754–3761 (2011).
18. Preisig M and Prevost JH. Coupled multi-phase thermo-poro-mechanical effects. Case study: CO2 injection at In Salah, Algeria. Int J Greenh Gas Con 5:1055–1064 (2011).
19. Armitage PJ, Worden RH, Faulkner DR, Aplin AC, Butcher AR, Iliff J. Diagenetic and sedimentary controls on porosity in Lower Carboniferous fi ne-grained lithologies, Krechba fi eld, Algeria: A petrological study of a caprock to a carbon capture site. Mar Petrol Geol 27(7):1395–1410 (2010).
20. Antonellini M and Aydin A. Effect of faulting on fl uid fl ow in porous sandstones: Petrophysical properties. AAPG Bull 78:355–377 (1994).
21. Fisher QJ and Knipe RJ. Fault sealing processes in si-liciclastic sediments. Geol Soc, Lond, Spec Pub 147:283–297 (1998).
22. Hippler SJ. Microstructures and diagenesis in north sea fault zones: Implications for fault-seal potential and fault-migration rates. AAPG Bull 67:85–101 (1997).
23. Birkholzer JT, Zhou Q, Tsang CF. Large-scale impact of CO2 storage in deep saline aquifers: a sensitivity study on the pressure response in stratifi ed systems. Int J Greenh Gas Con 3:181–194 (2009).
24. Hao Y, Sun Y, Nitao JJ. Overview of NUFT: a versatile numerical model for simulating fl ow and reactive transport in porous media. Ebook: Groundwater Reactive Transport Models, Editors: Zhang F, Yeh GT, Parker JC. Bentham Science Publishers, ISBN 978-1-60805-029-1: 213–240 (2012).
25. Nitao JJ. User’s manual for the USNT module of the NUFT code, version 2 (NP-phase, NC-component, thermal). Lawrence Livermore National Laboratory, UCRL-MA-130653 (1998).
26. Buscheck TA, Glascoe LG, Lee KH, Gansemer J, Sun Y, Mansoor K. Validation of the multiscale thermohydrologic model used for analysis of a proposed repository at Yucca Mountain. J Contam Hydrol 62(3):421–440 (2003).
27. Sun Y, Buscheck TA, Lee KH, Hao Y, James SC. Modeling thermal-hydrologic processes for a heated fractured rock system: impact of a capillary-pressure maximum. Transport Porous Med 83(3): 501–523 (2010).
28. Johnson JW, Nitao JJ, Knauss KG. Reactive transport modeling of CO2 storage in saline aquifer to elucidate fundamental processes, trapping mechanisms and sequestra-tion partitioning. Geological Storage of Carbon Dioxide, Editors: Baines SJ and Worden RH. Geol Soc, Lond, Spec Pub 223:107–128 (2004).
29. Carrigan CR and Nitao JJ. Predictive and diagnostic simula-tion of in situ electrical heating in contaminated, low-permea-bility soils. Environ Sci Tech 34(22):4835–4841 (2000).
30. Sahni A, Kumar M, Knapp RB. Electromagnetic heating methods for heavy oil reservoirs. SPE/AAPG Western Regional Meeting, Long Beach, California, June 19–22 (2000).
31. Span R and Wagner W. A new equation of state for carbon dioxide covering the fl uid region from the triple-point temperate to 1100 K at pressures up to 800 MPa. J Phys Chem Ref Data 25(6):1509–1596 (1996).
32. Fenghour A, Wakeham WA, Vesovic V. The viscosity of carbon dioxide. J Phys Chem Ref Data 27(1):31–39 (1998).
33. Birkholzer JT, Nicot, JP, Oldenburg, CM, Zhou Q, Kraemer S, Bandilla KW. Brine fl ow up a borehole caused by pressure perturbation from CO2 storage: Static and dynamic evalua-tions. Int J Greenh Gas Con 5(4):850–861 (2011).
34. Liu HH, Doughty C, Bodvarsson GS. An active fracture model for unsaturated fl ow and transport in fractured rocks. Water Resour Res 34(10):2633–2646 (1998).
35. Doughty C. Modeling geologic storage of carbon dioxide: comparison of non-hysteretic and hysteretic characteristic curves. Energ Convers Manage 48(6):1768–1781 (2007).
36. Tong C. PSUADE User’s Manual. Lawrence Livermore National Laboratory, LLNL-SM-407882 (2005).
37. Tong C. PSUADE reference manual (Version 1.3.0). Lawrence Livermore National Laboratory, May (2010).
38. Sun Y, Tong C, Buscheck TA, Blink JA. Combining simulation and emulation for calibrating sequentially reactive transport systems. Transport Porous Med 92(2):509–526 (2012).
39. Mckay MD, Beckman RJ, Conover WJ. A comparison of three methods for selecting values of input variables in the analysis of output from a computer code. Technometrics 21(2):239–245 (1979).
40. Friedman JH. Multivariated adaptive regression splines. Ann Stat 19(1):1–141 (1991).
Chuanhe Lu
Chuanhe Lu is a postdoc researcher at Lawrence Livermore National Labora-tory. He received his PhD in Civil Engineering from University of La Coruna, where he has developed and applied the numerical simulation tools for reactive transport modeling in the
near fi eld of the deep spent fuel repository. His re-search interests include the multiphase fl ow and reactive transport in porous media, uncertainty and risk analysis, pure gas diffusion and sorption.
Yunwei Sun
Dr. Yunwei Sun is a physicist at Lawrence Livermore National Labora-tory. He received his PhD in Civil and Environmental Engineering from Technion-Israel Institute of Technology. His research focuses on simulation and uncertainty quantifi cation of
reactive transport in natural and engineered systems.
Modeling and Analysis: Uncertainty quantifi cation of CO2 leakage C Lu et al.
459© 2012 Society of Chemical Industry and John Wiley & Sons, Ltd | Greenhouse Gas Sci Technol. 2:445–459 (2012); DOI: 10.1002/ghg
Joshua A. White
Joshua White holds a MS and PhD in Civil and Environmental Engineering from Stanford University, and a BSE from Princeton University. He joined the Computational Geosciences Group at LLNL in 2009. His research focus is computational geomechanics, with an
emphasis on understanding and modeling coupled hydromechanical processes. Applications of interest to him include geologic CO2 sequestration, shale gas production, and underground coal gasifi cation.
Laura Chiaramonte
Dr. Laura Chiaramonte is a research scientist in the Computational Geome-chanics Group at LLNL Earth and Energy Division. Dr. Chiaramonte received a PhD in Geophysics and a MS in Structural Geology from Stanford University under a Fulbright Scholar-
ship. She received her BS in Geological Sciences from the University of Buenos Aires, Argentina. Her research interests include fault stability, seal integrity and geome-chanical analysis of CO2 sequestration projects.
Thomas A. Buscheck
Dr. Buscheck is the group leader of Geochemical, Hydrological, and Environmental Sciences at Lawrence Livermore National Laboratory. He received his PhD in Civil Engineering from the University of California at Berkeley. His research interests involve
multiphase heat and mass fl ow in porous media.
Yue Hao
Yue Hao is a research scientist at Lawrence Livermore National Labora-tory. He received his PhD in Mechani-cal Engineering from the Johns Hopkins University. His research interests include multiphase fl ow and reactive transport in porous media,
computational fl uid dynamics, and scientifi c computing.
Related Documents