* Correspondence address: CSI Mail Stop 5C3, 103 Science and Technology I, George Mason University, 4400 University Drive, Fairfax, VA 22030-4444, USA. Tel.: #1-703-993-1992; fax: #1-703-993-1993. E-mail address: shanna@gmu.edu (S.R. Hanna). 1 Current a$liation: Mass. General Hospital, Boston, MA, USA. 2 Current a$liation: Sonoma Technology, Inc., Petaluma, CA, USA. 3 Current a$liation: American Meteorological Society, Bos- ton, MA, USA. Atmospheric Environment 35 (2001) 891}903 Uncertainties in predicted ozone concentrations due to input uncertainties for the UAM-V photochemical grid model applied to the July 1995 OTAG domain Steven R. Hanna!,*, Zhigang Lu!,1, H. Christopher Frey", Neil Wheeler",2, Je!rey Vukovich#, Saravanan Arunachalam#, Mark Fernau$,3, D. Alan Hansen% !Harvard School of Public Health, Boston, MA, USA "North Carolina State University, Raleigh, NC, USA #North Carolina Supercomputing Center, Research Triangle Park, NC, USA $Earth Tech, Inc., Concord, MA, USA %EPRI, Palo Alto, CA, USA Received 19 January 2000; accepted 5 July 2000 Abstract The photochemical grid model, UAM-V, has been used by regulatory agencies to make decisions concerning emissions controls, based on studies of the July 1995 ozone episode in the eastern US. The current research concerns the e!ect of the uncertainties in UAM-V input variables (emissions, initial and boundary conditions, meteorological variables, and chemical reactions) on the uncertainties in UAM-V ozone predictions. Uncertainties of 128 input variables have been estimated and most range from about 20% to a factor of two. 100 Monte Carlo runs, each with new resampled values of each of the 128 input variables, have been made for given sets of median emissions assumptions. Emphasis is on the maximum hourly-averaged ozone concentration during the 12}14 July 1995 period. The distribution function of the 100 Monte Carlo predicted domain-wide maximum ozone concentrations is consistently close to log-normal with a 95% uncertainty range extending over plus and minus a factor of about 1.6 from the median. Uncertainties in ozone predictions are found to be most strongly correlated with uncertainties in the NO 2 photolysis rate. Also important are wind speed and direction, relative humidity, cloud cover, and biogenic VOC emissions. Di!erences in median predicted maximum ozone concentrations for three alternate emissions control assumptions were investigated, with the result that (1) the suggested year-2007 emissions changes would likely be e!ective in reducing concentrations from those for the year-1995 actual emissions, that (2) an additional 50% NO x emissions reductions would likely be e!ective in further reducing concentrations, and that (3) an additional 50% VOC emission reductions may not be e!ective in further reducing concentrations. ( 2001 Elsevier Science Ltd. All rights reserved. Keywords: Photochemical modeling; Model uncertainty; Monte Carlo uncertainty methods 1. Introduction Regulatory agencies are proceeding with use of photo- chemical grid models to make decisions concerning the speci"c magnitudes of NO x and VOC emissions reductions that are required in order to reduce concen- trations of ozone (see OTAG, 1997; EPA, 1998). There is also a question whether reductions in NO x or VOC emissions are more e!ective in reducing maximum ozone 1352-2310/01/$ - see front matter ( 2001 Elsevier Science Ltd. All rights reserved. PII: S 1 3 5 2 - 2 3 1 0 ( 0 0 ) 0 0 3 6 7 - 8

Welcome message from author
This document is posted to help you gain knowledge. Please leave a comment to let me know what you think about it! Share it to your friends and learn new things together.
Transcript
*Correspondence address: CSI Mail Stop 5C3, 103 Scienceand Technology I, George Mason University, 4400 UniversityDrive, Fairfax, VA 22030-4444, USA. Tel.: #1-703-993-1992;fax: #1-703-993-1993.
E-mail address: [email protected] (S.R. Hanna).1Current a$liation: Mass. General Hospital, Boston, MA,
USA.2Current a$liation: Sonoma Technology, Inc., Petaluma,
CA, USA.3Current a$liation: American Meteorological Society, Bos-
ton, MA, USA.
Atmospheric Environment 35 (2001) 891}903
Uncertainties in predicted ozone concentrations due to inputuncertainties for the UAM-V photochemical grid model applied
to the July 1995 OTAG domain
Steven R. Hanna!,*, Zhigang Lu!,1, H. Christopher Frey", Neil Wheeler",2,Je!rey Vukovich#, Saravanan Arunachalam#, Mark Fernau$,3, D. Alan Hansen%
!Harvard School of Public Health, Boston, MA, USA"North Carolina State University, Raleigh, NC, USA
#North Carolina Supercomputing Center, Research Triangle Park, NC, USA$Earth Tech, Inc., Concord, MA, USA
%EPRI, Palo Alto, CA, USA
Received 19 January 2000; accepted 5 July 2000
Abstract
The photochemical grid model, UAM-V, has been used by regulatory agencies to make decisions concerning emissionscontrols, based on studies of the July 1995 ozone episode in the eastern US. The current research concerns the e!ect of theuncertainties in UAM-V input variables (emissions, initial and boundary conditions, meteorological variables, andchemical reactions) on the uncertainties in UAM-V ozone predictions. Uncertainties of 128 input variables have beenestimated and most range from about 20% to a factor of two. 100 Monte Carlo runs, each with new resampled values ofeach of the 128 input variables, have been made for given sets of median emissions assumptions. Emphasis is on themaximum hourly-averaged ozone concentration during the 12}14 July 1995 period. The distribution function of the 100Monte Carlo predicted domain-wide maximum ozone concentrations is consistently close to log-normal with a 95%uncertainty range extending over plus and minus a factor of about 1.6 from the median. Uncertainties in ozonepredictions are found to be most strongly correlated with uncertainties in the NO
2photolysis rate. Also important are
wind speed and direction, relative humidity, cloud cover, and biogenic VOC emissions. Di!erences in median predictedmaximum ozone concentrations for three alternate emissions control assumptions were investigated, with the result that(1) the suggested year-2007 emissions changes would likely be e!ective in reducing concentrations from those for theyear-1995 actual emissions, that (2) an additional 50% NO
xemissions reductions would likely be e!ective in further
reducing concentrations, and that (3) an additional 50% VOC emission reductions may not be e!ective in furtherreducing concentrations. ( 2001 Elsevier Science Ltd. All rights reserved.
Keywords: Photochemical modeling; Model uncertainty; Monte Carlo uncertainty methods
1. Introduction
Regulatory agencies are proceeding with use of photo-chemical grid models to make decisions concerning thespeci"c magnitudes of NO
xand VOC emissions
reductions that are required in order to reduce concen-trations of ozone (see OTAG, 1997; EPA, 1998). There isalso a question whether reductions in NO
xor VOC
emissions are more e!ective in reducing maximum ozone
1352-2310/01/$ - see front matter ( 2001 Elsevier Science Ltd. All rights reserved.PII: S 1 3 5 2 - 2 3 1 0 ( 0 0 ) 0 0 3 6 7 - 8
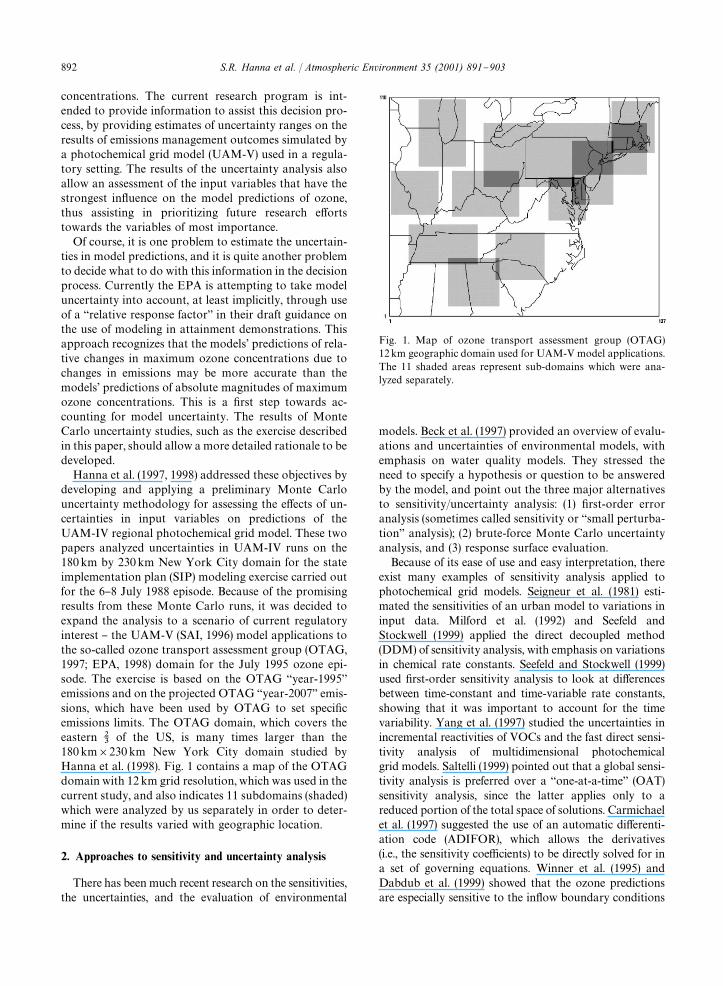
Fig. 1. Map of ozone transport assessment group (OTAG)12km geographic domain used for UAM-V model applications.The 11 shaded areas represent sub-domains which were ana-lyzed separately.
concentrations. The current research program is int-ended to provide information to assist this decision pro-cess, by providing estimates of uncertainty ranges on theresults of emissions management outcomes simulated bya photochemical grid model (UAM-V) used in a regula-tory setting. The results of the uncertainty analysis alsoallow an assessment of the input variables that have thestrongest in#uence on the model predictions of ozone,thus assisting in prioritizing future research e!ortstowards the variables of most importance.
Of course, it is one problem to estimate the uncertain-ties in model predictions, and it is quite another problemto decide what to do with this information in the decisionprocess. Currently the EPA is attempting to take modeluncertainty into account, at least implicitly, through useof a `relative response factora in their draft guidance onthe use of modeling in attainment demonstrations. Thisapproach recognizes that the models' predictions of rela-tive changes in maximum ozone concentrations due tochanges in emissions may be more accurate than themodels' predictions of absolute magnitudes of maximumozone concentrations. This is a "rst step towards ac-counting for model uncertainty. The results of MonteCarlo uncertainty studies, such as the exercise describedin this paper, should allow a more detailed rationale to bedeveloped.
Hanna et al. (1997, 1998) addressed these objectives bydeveloping and applying a preliminary Monte Carlouncertainty methodology for assessing the e!ects of un-certainties in input variables on predictions of theUAM-IV regional photochemical grid model. These twopapers analyzed uncertainties in UAM-IV runs on the180km by 230km New York City domain for the stateimplementation plan (SIP) modeling exercise carried outfor the 6}8 July 1988 episode. Because of the promisingresults from these Monte Carlo runs, it was decided toexpand the analysis to a scenario of current regulatoryinterest } the UAM-V (SAI, 1996) model applications tothe so-called ozone transport assessment group (OTAG,1997; EPA, 1998) domain for the July 1995 ozone epi-sode. The exercise is based on the OTAG `year-1995aemissions and on the projected OTAG `year-2007a emis-sions, which have been used by OTAG to set speci"cemissions limits. The OTAG domain, which covers theeastern 2
3of the US, is many times larger than the
180km]230km New York City domain studied byHanna et al. (1998). Fig. 1 contains a map of the OTAGdomain with 12 km grid resolution, which was used in thecurrent study, and also indicates 11 subdomains (shaded)which were analyzed by us separately in order to deter-mine if the results varied with geographic location.
2. Approaches to sensitivity and uncertainty analysis
There has been much recent research on the sensitivities,the uncertainties, and the evaluation of environmental
models. Beck et al. (1997) provided an overview of evalu-ations and uncertainties of environmental models, withemphasis on water quality models. They stressed theneed to specify a hypothesis or question to be answeredby the model, and point out the three major alternativesto sensitivity/uncertainty analysis: (1) "rst-order erroranalysis (sometimes called sensitivity or `small perturba-tiona analysis); (2) brute-force Monte Carlo uncertaintyanalysis, and (3) response surface evaluation.
Because of its ease of use and easy interpretation, thereexist many examples of sensitivity analysis applied tophotochemical grid models. Seigneur et al. (1981) esti-mated the sensitivities of an urban model to variations ininput data. Milford et al. (1992) and Seefeld andStockwell (1999) applied the direct decoupled method(DDM) of sensitivity analysis, with emphasis on variationsin chemical rate constants. Seefeld and Stockwell (1999)used "rst-order sensitivity analysis to look at di!erencesbetween time-constant and time-variable rate constants,showing that it was important to account for the timevariability. Yang et al. (1997) studied the uncertainties inincremental reactivities of VOCs and the fast direct sensi-tivity analysis of multidimensional photochemicalgrid models. Saltelli (1999) pointed out that a global sensi-tivity analysis is preferred over a `one-at-a-timea (OAT)sensitivity analysis, since the latter applies only to areduced portion of the total space of solutions. Carmichaelet al. (1997) suggested the use of an automatic di!erenti-ation code (ADIFOR), which allows the derivatives(i.e., the sensitivity coe$cients) to be directly solved for ina set of governing equations. Winner et al. (1995) andDabdub et al. (1999) showed that the ozone predictionsare especially sensitive to the in#ow boundary conditions
892 S.R. Hanna et al. / Atmospheric Environment 35 (2001) 891}903
in Los Angeles and the San Joaquin Valley, respectively.Hass et al. (1997) carried out a sensitivity study of fourEuropean long-range transport and dispersion models,"nding factors of two to three di!erences in the sensitivi-ties of the di!erent models to variations in emissions. Thelimitation of local sensitivity analysis is that it appliesonly in the neighborhood of the nominal parametervalues. Since photochemical processes are often non-lin-ear, the magnitude and even the sign of the sensitivitycoe$cients may vary as the nominal parameter valuesvary.
At the other extreme from simple `one-at-a-timea sen-sitivity studies, the response surface method (Tatanget al., 1997) attempts to "t orthogonal polynomials to theinput conditions and the predictions of numerical geo-physical models. Of course it is necessary to run themodels a su$cient number of times to have enough datato develop the response surfaces. It is claimed that 25 to60 times fewer runs are needed than for a Monte Carlosimple random sampling (SRS) exercise. Nevertheless,the response surface simply amounts to a `model ofa modela and therefore is susceptible to problems asso-ciated with scenarios outside of the range of parametersused to generate the data for deriving the model.
There has been a rapid growth in the application ofMonte Carlo uncertainty analysis methods to atmo-spheric transport and dispersion models. This `brute-forcea method, described by IAEA (1989), NCRP (1996)and Beck et al. (1997), is computer-intensive because itrequires many model runs (generally on the order of 100or more). However, because of the exponential growth ofcomputer speed and storage, it is now possible to easilycarry out 100 or more Monte Carlo runs with a complexphotochemical grid model such as UAM-V (SAI, 1996)applied to a large domain on the order of 10,000(100]100) horizontal grid cells. One of the "rst applica-tions of Monte Carlo uncertainty analysis to photochem-istry was the study of relations between stratosphericozone and chlorine reported by Stolarski et al. (1978).Alcamo and Bartnicki (1987) used Monte Carlo methodsto study the uncertainties in sulfur deposition predictedby the EMEF-W model in Europe. They found that it ismore important to specify the width (i.e., the standarddeviation) rather than the shape of the probability den-sity function (pdf ) of the input variables. Gao et al. (1996)applied Monte Carlo uncertainty analysis to the chem-ical rate parameters. Deuel et al. (1998) studied the uncer-tainties of the UAM-V model using Monte Carlomethods; however, the uncertainty ranges that they as-sumed for the input variables (vertical resolution, verticaldi!usivity, Plume-in-Grid method, land-use, chemical re-action rates, and emissions) were a factor of three or moreless than those recommended by the experts in the studyby Hanna et al. (1998) and in the current study. Bergin etal. (1999) applied Monte Carlo methods with latin hyper-cube sampling (LHS) to a Lagrangian photochemical
air pollution model (i.e., not a grid model) in SouthernCalifornia.
3. Expert elicitation process and resulting uncertaintyestimates
The "rst step in the Monte Carlo uncertainty analysisis to estimate the uncertainties in model input variables,which is di$cult because there is little speci"c informa-tion on this subject in the literature for the completespectrum of inputs (e.g., initial and boundary conditions,emissions components, meteorological variables, photo-lysis rates, and chemical rate constants). When this is thecase, Morgan and Henrion (1990) suggest that it is ap-propriate to carry out an expert elicitation where `ex-pertsa are asked to give estimates of uncertainties basedon their experience. The earlier phase of the research(Hanna et al., 1998) depended on advice from ten modelexperts to assess the uncertainties in UAM-IV modelinput variables. The current research improved upon thisprocess by attempting to reach about 100 experts viaa web page where the experts could enter their estimatesof UAM-V model input uncertainties. As a "rst step, theUAM-V input parameters to be varied were identi"ed bystudying the model documentation (SAI, 1996) and byreviewing reports on UAM-V applications to the OTAGdomain for the July 1995 episode (e.g., OTAG, 1997;EPA, 1998). As a second step, an expert elicitation pro-cess was carried out, from which the distribution func-tions (shapes and key parameters such as median andvariance) for each input variable could be estimated. Themedians for the 128 input variables were taken from theOTAG base runs for year-1995 emissions and for projec-ted year-2007 emissions.
Even though 100 experts were contacted, only about20 of them "lled in the requested information on the webpage. It was found that better information could beobtained by meeting with groups of experts at severaldi!erent laboratories. One reason for the minimal writ-ten response may be that many photochemical modelingexperts have not thought much about uncertainties ininput parameters and therefore the estimates are largelybased on intuition.
Although most experts agree that it may be importantto account for correlations among some input variables,not much information is available on such correlations.For example, there are surely some implicit correlationsamong some chemical rate constants that should bemaintained so that the 94-equation chemical mechanismwill produce results that agree with observations in envir-onmental chambers. Furthermore, there should be abalance or correlation among boundary concentrationsand emissions so that reasonable ozone concentrationpredictions are made. However, it is di$cult to translatethese general concerns about correlations into speci"c
S.R. Hanna et al. / Atmospheric Environment 35 (2001) 891}903 893
suggestions concerning the magnitudes of the correla-tions. Consequently no correlations were used in thecurrent application.
Another problem with the expert elicitation process isthat it is di$cult to "nd agreement on how the uncertain-ties of the eight meteorological input variables (e.g., windspeed, wind direction, and cloud cover) can be adequate-ly accounted for. The major concern is that all photo-chemical grid models are driven by the outputs ofdiagnostic or prognostic meteorological models, whichimpose dynamical constraints such as mass continuity. Ifthe input wind speed and direction were allowed to varyrandomly and independently at several monitoring sitesat a given hour, there would be spurious mass convergen-ces and divergences that would arise. This would lead tounrealistic build-up of pollutants in some areas and re-moval of pollutants in other areas. Therefore there wouldbe a need to apply a diagnostic or prognostic meteoro-logical model to each new and independent group ofrandomly generated wind observations in order to adjustthe wind "elds to assure that the mass-continuity cri-terion is satis"ed. Because of the great e!ort involved inrerunning a diagnostic or prognostic meteorologicalmodel each time a new set of randomly generated windsis prescribed, our approach has been to vary all windspeeds uniformly across the entire domain, thus assuringmass-continuity is maintained. Another approach couldbe to make use of available alternate meteorologicalmodel runs made by other groups; however, this methoddoes not adequately sample the full range of variability.Future research should focus on better methods for ac-counting for variability in meteorological inputs, such asapplying the Monte Carlo uncertainty methodology tothe diagnostic or prognostic meteorological modelsthemselves.
The distribution functions for most UAM-V inputvariables were assumed to be log-normal, as found formost environmental geophysical variables. The excep-tions are wind direction, ambient temperature, relativehumidity, and cloud cover, which are assumed tohave normal distributions. The experts were asked togive estimates of the uncertainty range that wouldinclude 95% of the possible values (i.e., from the 2.5thpercentile to the 97.5th percentile of the cumulative dis-tribution function (CDF)). For normal distributions, thestandard deviation then equals about 1
4of this range. For
log-normal distributions, the uncertainties were usuallyexpressed as `plus and minus a factor of >a for variableswith large ranges such as plus and minus a factor of 2 or3. For variables with smaller ranges, the uncertainty wasusually expressed as `plus and minus Z percenta, whichcan be considered equivalent to `plus and minus a factorof (>"1.0#Z/100)a. For a log-normal distribution, thestandard deviation of ln(X), where X is the dimensionalvalue of the physical variable, equals 0.5 ln(>). Forexample, the input initial ozone concentration, C
O3 *, is
assumed to have an uncertainty of plus and minus a fac-tor of 3 (encompassing 95% of possible values). Thereforethe standard deviation of ln (C
O3 *) is 0.5 ln(3)"0.55.
A list of the input variables, their 95% uncertaintyranges, their assumed distribution functions (all areeither log-normal or normal), and the standard devi-ations of the natural logarithm of the input variable (forlog-normal distributions) or the input variable itself (fornormal distributions) are given in Table 1. To save space,only the range, median, and mode of the uncertainties ofthe 94 carbon bond (CB)-IV chemical rate constants arelisted. More detailed justi"cations for the uncertaintyestimates for the six photolysis rates and the 94 chemicalreaction rates are given by Frey (1998). The uncertaintyestimates for many of the chemical reaction rates arebased on information published in papers by Atkinsonand Lloyd (1984), Thompson and Stewart (1991), De-More et al. (1994), Gao et al. (1995), and Russell et al.(1995), as well as guidance from several atmosphericchemists. Note that there is a factor of two uncertainty inall the photolysis rates and a median factor of 1.8 uncer-tainty in the 94 chemical rate constants. However, formany input parameters, the data required to estimate theuncertainties are not available.
The six `photolysis ratesa are associated or linked withsix of the 94 chemical reactions. Of particular interest isthe NO
2photolysis rate, which is associated or linked
with reaction 1: NO2PNO#O. During our study we
frequently encountered confusion concerning the di!er-ences between the uncertainties in the photolysis ratesand the uncertainties in the reaction rates. The di!erencecan be explained by considering that, for each photolysisreaction, there are two separately modeled sources ofuncertainty. One source of uncertainty, in the photolysisrate, is related to cloud cover, ozone column, etc., whichleads to uncertainty in the estimate of actinic #ux and,hence, provides a distribution of nominal photolysisrates. The other source of uncertainty in, for example, thechemical reaction NO
2PhlPNO#O, is related to
absorption cross section and quantum yield. This leadsto additional uncertainty, since even for a given actinic#ux we do not have exact knowledge of what the photo-lysis rate really is. The uncertainty in photolysis rate asconsidered as the reaction NO
2PhlPNO#O has to
do with uncertainty regarding absorption cross sectionand quantum yield, assuming that actinic #ux is known.In other words, even if cloud cover, ozone column, etc.were exactly known, so that actinic #ux were exactlyknown, there would still be uncertainty in the photolysisrate because of uncertainty regarding absorption crosssection and quantum yield.
The uncertainties in emissions rate in Table 1 aremostly `factor of twoa except for major point sources,which are a little better known (`factor of 1.5a). Weinitially considered the suggestions of some experts thatsome emissions classes (e.g., biogenic or mobile VOC
894 S.R. Hanna et al. / Atmospheric Environment 35 (2001) 891}903
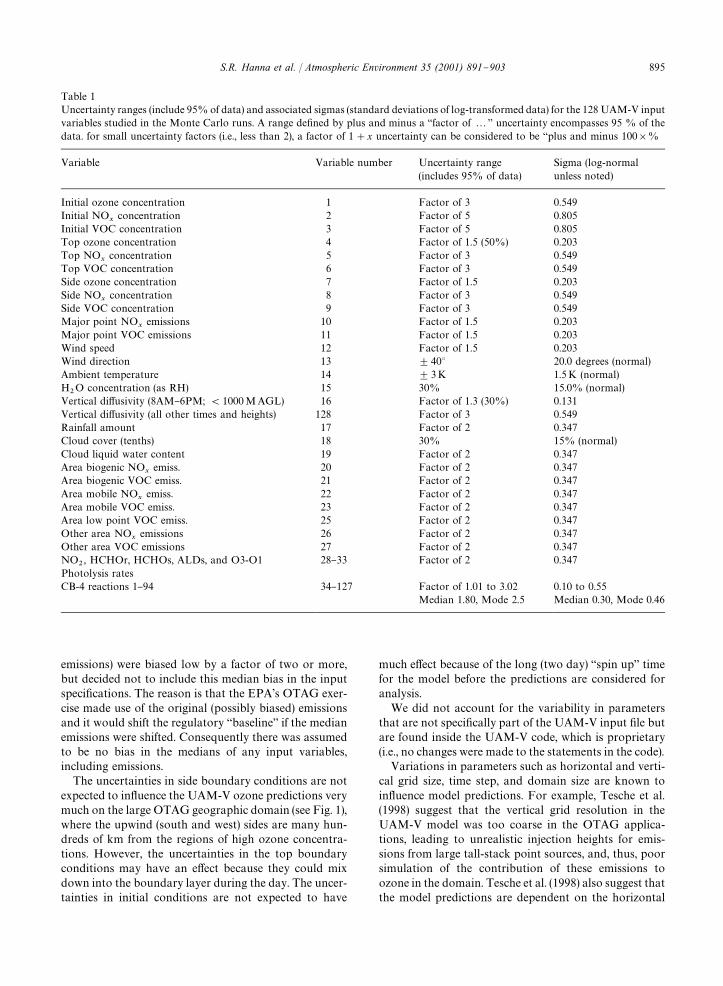
Table 1Uncertainty ranges (include 95% of data) and associated sigmas (standard deviations of log-transformed data) for the 128 UAM-V inputvariables studied in the Monte Carlo runs. A range de"ned by plus and minus a `factor of 2a uncertainty encompasses 95 % of thedata. for small uncertainty factors (i.e., less than 2), a factor of 1#x uncertainty can be considered to be `plus and minus 100]%
Variable Variable number Uncertainty range(includes 95% of data)
Sigma (log-normalunless noted)
Initial ozone concentration 1 Factor of 3 0.549Initial NO
xconcentration 2 Factor of 5 0.805
Initial VOC concentration 3 Factor of 5 0.805Top ozone concentration 4 Factor of 1.5 (50%) 0.203Top NO
xconcentration 5 Factor of 3 0.549
Top VOC concentration 6 Factor of 3 0.549Side ozone concentration 7 Factor of 1.5 0.203Side NO
xconcentration 8 Factor of 3 0.549
Side VOC concentration 9 Factor of 3 0.549Major point NO
xemissions 10 Factor of 1.5 0.203
Major point VOC emissions 11 Factor of 1.5 0.203Wind speed 12 Factor of 1.5 0.203Wind direction 13 $403 20.0 degrees (normal)Ambient temperature 14 $3K 1.5K (normal)H
2O concentration (as RH) 15 30% 15.0% (normal)
Vertical di!usivity (8AM}6PM; (1000MAGL) 16 Factor of 1.3 (30%) 0.131Vertical di!usivity (all other times and heights) 128 Factor of 3 0.549Rainfall amount 17 Factor of 2 0.347Cloud cover (tenths) 18 30% 15% (normal)Cloud liquid water content 19 Factor of 2 0.347Area biogenic NO
xemiss. 20 Factor of 2 0.347
Area biogenic VOC emiss. 21 Factor of 2 0.347Area mobile NO
xemiss. 22 Factor of 2 0.347
Area mobile VOC emiss. 23 Factor of 2 0.347Area low point VOC emiss. 25 Factor of 2 0.347Other area NO
xemissions 26 Factor of 2 0.347
Other area VOC emissions 27 Factor of 2 0.347NO
2, HCHOr, HCHOs, ALDs, and O3-O1 28}33 Factor of 2 0.347
Photolysis ratesCB-4 reactions 1}94 34}127 Factor of 1.01 to 3.02 0.10 to 0.55
Median 1.80, Mode 2.5 Median 0.30, Mode 0.46
emissions) were biased low by a factor of two or more,but decided not to include this median bias in the inputspeci"cations. The reason is that the EPA's OTAG exer-cise made use of the original (possibly biased) emissionsand it would shift the regulatory `baselinea if the medianemissions were shifted. Consequently there was assumedto be no bias in the medians of any input variables,including emissions.
The uncertainties in side boundary conditions are notexpected to in#uence the UAM-V ozone predictions verymuch on the large OTAG geographic domain (see Fig. 1),where the upwind (south and west) sides are many hun-dreds of km from the regions of high ozone concentra-tions. However, the uncertainties in the top boundaryconditions may have an e!ect because they could mixdown into the boundary layer during the day. The uncer-tainties in initial conditions are not expected to have
much e!ect because of the long (two day) `spin upa timefor the model before the predictions are considered foranalysis.
We did not account for the variability in parametersthat are not speci"cally part of the UAM-V input "le butare found inside the UAM-V code, which is proprietary(i.e., no changes were made to the statements in the code).
Variations in parameters such as horizontal and verti-cal grid size, time step, and domain size are known toin#uence model predictions. For example, Tesche et al.(1998) suggest that the vertical grid resolution in theUAM-V model was too coarse in the OTAG applica-tions, leading to unrealistic injection heights for emis-sions from large tall-stack point sources, and, thus, poorsimulation of the contribution of these emissions toozone in the domain. Tesche et al. (1998) also suggest thatthe model predictions are dependent on the horizontal
S.R. Hanna et al. / Atmospheric Environment 35 (2001) 891}903 895
grid resolution. However, because it requires at least oneweek of labor to reinterpolate emissions, meteorology,and other spatially-variable inputs each time the grid sizeis changed, we did not perturb those variables. We arestudying variations in only those variables that can easilybe perturbed in the model input "le.
4. Monte Carlo method as applied to the July 1995OTAG scenario
A long-term goal of the research is to develop a soft-ware framework that would allow the uncertainties ofregional photochemical grid models to be determined onother domains and for other episodes. The software usedin the current UAM-V applications is based on a frame-work that assumes that the user speci"es a set of N modelinput parameters, their mean and variance, and theirprobability density function (pdf ), as shown in Table 1.The Monte Carlo resampling software then generatesa batch "le containing M randomly selected sets of N in-put parameters that enable the user to run the modelM times with perturbed input data. Certain key outputparameters (e.g., predicted hourly ozone concentration inthe lowest model level) from each of the M runs are thenretrieved from the very large sets of model output "les.The other model outputs (several thousand megabytesfor each photochemical grid model run) are stored forpossible future analysis.
The OTAG domain is shown in Fig. 1 and a 12 kmhorizontal grid resolution is used by the UAM-V model,as for the OTAG (1997) and EPA (1998) exercises. Eventhough the OTAG ozone episode continued from 7}18July, it was decided that computer time could be saved ifthe simulations were stopped after 14 July, since themaximum concentrations of ozone were similar duringthe days that followed. The `ramp-upa period for theUAM-V model was 7}11 July and the model results wereanalyzed for the 12}14 July period.
We believe that the 7}14 July 1995 base case makesa reasonable foundation for the study of model uncer-tainty, primarily because of the reliance of the EPAon this episode for their decisions concerning emissionscontrols. This base case has been the subject of manyinvestigations concerning its adequacy for determiningemissions control strategies. Some potential problemareas have been identi"ed in other research projects. Forexample, Lurmann and Kumar (1997) point out a `biascreepa in the UAM-V model predictions for this episode,meaning that the model tends to underpredict in theearly days of the episode, and then tends to overpredict inthe later days. Dolwick et al. (1998) suggest that theremay be unreasonable accumulations of ozone and pre-cursors aloft in the model.
The median or base model inputs for the year-1995and year-2007 sets of 100 Monte Carlo runs were the
same as those used in the OTAG runs (OTAG, 1997;EPA, 1998) for the year-1995 and year-2007 emissions,respectively. It should be mentioned that the emissions"les were the only input variables that were di!erentbetween the four sets of 100 Monte Carlo runs. An initialmodel run was made for both year-1995 and year-2007 toassure that the current model outputs are consistent withthe earlier OTAG model outputs. An additional two setsof 100 Monte Carlo runs were made with 50% reductionsin year-2007 anthropogenic NO
xemissions and 50%
reductions in year-2007 anthropogenic VOC emissions,respectively. The base case median boundary and initialconcentrations were not changed for these four sets ofemissions scenarios, consistent with the assumptions inthe OTAG runs. In reality, there would be expected to bea correlation between emissions and initial and boundaryconditions, but there is no guidance in the literature onwhat these correlations would be. For a domain as largeas the OTAG domain, the maximum ozone concentra-tions in the middle of the domain are expected to be littlein#uenced by the initial and boundary conditions. An-other important fact is that the sets of 128 randomperturbation numbers for the 100 Monte Carlo runs wereidentical over the four base emissions scenarios, thusallowing di!erences in predictions between the sets ofruns to be better assessed.
The primary output variables saved for special analy-sis are maximum daily one- and 8 hr-averaged ozoneconcentration in the lowest grid layer during the 12}14July period for three alternate geographic de"nitions: (1)at any position on the entire OTAG domain, (2) at anyposition within 11 subdomains (Atlanta, Nashville,Chicago, Louisville, Charlotte, St. Louis, New York,New England, Philadelphia, Baltimore-Washington,Richmond, and Pittsburgh) within the larger OTAG do-main, and (3) at 155 speci"c locations where there areroutine monitors or where there is a special interest. Inaddition, the same output information is saved for NO
xand VOC, except only for 1-hr averages. Fig. 1 showedthe OTAG domain and the 11 subdomains. Most of thesubdomains are so-called UAM regions; however, thePittsburgh subdomain was expanded to include part ofthe Ohio River Valley and the Lake Erie shore. The 155speci"c locations are scattered throughout the domainshown in Fig. 1. Of the 155 speci"c locations, 135 areroutine monitoring sites, and 20 are `arti"ciala siteswhich have been arbitrarily located in `holesa in thedomain where there were no routine monitoring sites.
The analysis is concerned with three primary topics: (1)gross uncertainties in outputs, (2) correlations and regres-sions among inputs and outputs, and (3) di!erences inoutputs depending on median emissions assumptions.We have the most con"dence in the results for the "rsttopic, gross uncertainties in outputs, which are discussedin Sections 5.1 and 5.2. For example, with 100 MonteCarlo runs, the variance in the output variables can be
896 S.R. Hanna et al. / Atmospheric Environment 35 (2001) 891}903
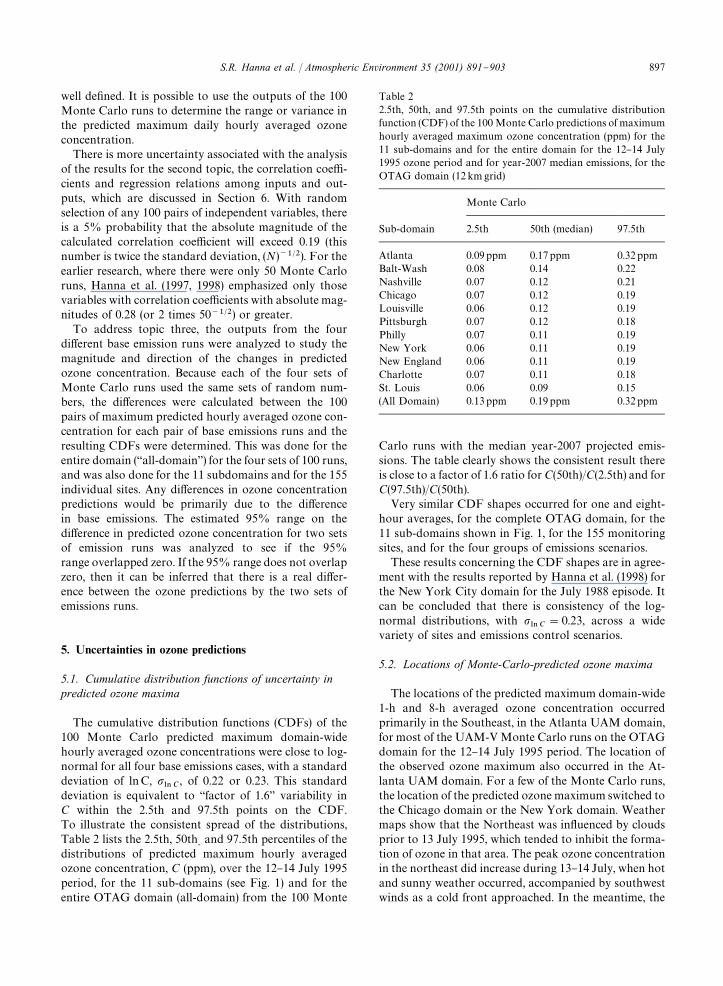
Table 22.5th, 50th, and 97.5th points on the cumulative distributionfunction (CDF) of the 100 Monte Carlo predictions of maximumhourly averaged maximum ozone concentration (ppm) for the11 sub-domains and for the entire domain for the 12}14 July1995 ozone period and for year-2007 median emissions, for theOTAG domain (12 kmgrid)
Monte Carlo
Sub-domain 2.5th 50th (median) 97.5th
Atlanta 0.09ppm 0.17ppm 0.32ppmBalt-Wash 0.08 0.14 0.22Nashville 0.07 0.12 0.21Chicago 0.07 0.12 0.19Louisville 0.06 0.12 0.19Pittsburgh 0.07 0.12 0.18Philly 0.07 0.11 0.19New York 0.06 0.11 0.19New England 0.06 0.11 0.19Charlotte 0.07 0.11 0.18St. Louis 0.06 0.09 0.15(All Domain) 0.13ppm 0.19ppm 0.32ppm
well de"ned. It is possible to use the outputs of the 100Monte Carlo runs to determine the range or variance inthe predicted maximum daily hourly averaged ozoneconcentration.
There is more uncertainty associated with the analysisof the results for the second topic, the correlation coe$-cients and regression relations among inputs and out-puts, which are discussed in Section 6. With randomselection of any 100 pairs of independent variables, thereis a 5% probability that the absolute magnitude of thecalculated correlation coe$cient will exceed 0.19 (thisnumber is twice the standard deviation, (N)~1@2). For theearlier research, where there were only 50 Monte Carloruns, Hanna et al. (1997, 1998) emphasized only thosevariables with correlation coe$cients with absolute mag-nitudes of 0.28 (or 2 times 50~1@2) or greater.
To address topic three, the outputs from the fourdi!erent base emission runs were analyzed to study themagnitude and direction of the changes in predictedozone concentration. Because each of the four sets ofMonte Carlo runs used the same sets of random num-bers, the di!erences were calculated between the 100pairs of maximum predicted hourly averaged ozone con-centration for each pair of base emissions runs and theresulting CDFs were determined. This was done for theentire domain (`all-domaina) for the four sets of 100 runs,and was also done for the 11 subdomains and for the 155individual sites. Any di!erences in ozone concentrationpredictions would be primarily due to the di!erencein base emissions. The estimated 95% range on thedi!erence in predicted ozone concentration for two setsof emission runs was analyzed to see if the 95%range overlapped zero. If the 95% range does not overlapzero, then it can be inferred that there is a real di!er-ence between the ozone predictions by the two sets ofemissions runs.
5. Uncertainties in ozone predictions
5.1. Cumulative distribution functions of uncertainty inpredicted ozone maxima
The cumulative distribution functions (CDFs) of the100 Monte Carlo predicted maximum domain-widehourly averaged ozone concentrations were close to log-normal for all four base emissions cases, with a standarddeviation of lnC, p
-/ C, of 0.22 or 0.23. This standard
deviation is equivalent to `factor of 1.6a variability inC within the 2.5th and 97.5th points on the CDF.To illustrate the consistent spread of the distributions,Table 2 lists the 2.5th, 50th
,and 97.5th percentiles of the
distributions of predicted maximum hourly averagedozone concentration, C (ppm), over the 12}14 July 1995period, for the 11 sub-domains (see Fig. 1) and for theentire OTAG domain (all-domain) from the 100 Monte
Carlo runs with the median year-2007 projected emis-sions. The table clearly shows the consistent result thereis close to a factor of 1.6 ratio for C(50th)/C(2.5th) and forC(97.5th)/C(50th).
Very similar CDF shapes occurred for one and eight-hour averages, for the complete OTAG domain, for the11 sub-domains shown in Fig. 1, for the 155 monitoringsites, and for the four groups of emissions scenarios.
These results concerning the CDF shapes are in agree-ment with the results reported by Hanna et al. (1998) forthe New York City domain for the July 1988 episode. Itcan be concluded that there is consistency of the log-normal distributions, with p
-/ C"0.23, across a wide
variety of sites and emissions control scenarios.
5.2. Locations of Monte-Carlo-predicted ozone maxima
The locations of the predicted maximum domain-wide1-h and 8-h averaged ozone concentration occurredprimarily in the Southeast, in the Atlanta UAM domain,for most of the UAM-V Monte Carlo runs on the OTAGdomain for the 12}14 July 1995 period. The location ofthe observed ozone maximum also occurred in the At-lanta UAM domain. For a few of the Monte Carlo runs,the location of the predicted ozone maximum switched tothe Chicago domain or the New York domain. Weathermaps show that the Northeast was in#uenced by cloudsprior to 13 July 1995, which tended to inhibit the forma-tion of ozone in that area. The peak ozone concentrationin the northeast did increase during 13}14 July, when hotand sunny weather occurred, accompanied by southwestwinds as a cold front approached. In the meantime, the
S.R. Hanna et al. / Atmospheric Environment 35 (2001) 891}903 897
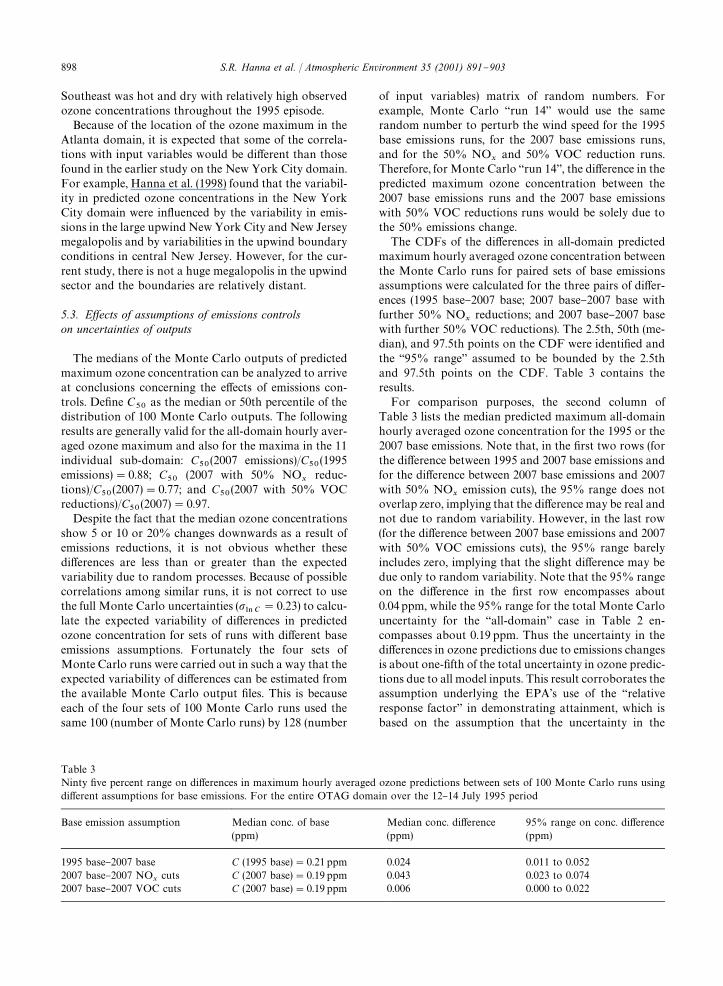
Table 3Ninty "ve percent range on di!erences in maximum hourly averaged ozone predictions between sets of 100 Monte Carlo runs usingdi!erent assumptions for base emissions. For the entire OTAG domain over the 12}14 July 1995 period
Base emission assumption Median conc. of base(ppm)
Median conc. di!erence(ppm)
95% range on conc. di!erence(ppm)
1995 base}2007 base C (1995 base)"0.21 ppm 0.024 0.011 to 0.0522007 base}2007 NO
xcuts C (2007 base)"0.19 ppm 0.043 0.023 to 0.074
2007 base}2007 VOC cuts C (2007 base)"0.19 ppm 0.006 0.000 to 0.022
Southeast was hot and dry with relatively high observedozone concentrations throughout the 1995 episode.
Because of the location of the ozone maximum in theAtlanta domain, it is expected that some of the correla-tions with input variables would be di!erent than thosefound in the earlier study on the New York City domain.For example, Hanna et al. (1998) found that the variabil-ity in predicted ozone concentrations in the New YorkCity domain were in#uenced by the variability in emis-sions in the large upwind New York City and New Jerseymegalopolis and by variabilities in the upwind boundaryconditions in central New Jersey. However, for the cur-rent study, there is not a huge megalopolis in the upwindsector and the boundaries are relatively distant.
5.3. Ewects of assumptions of emissions controlson uncertainties of outputs
The medians of the Monte Carlo outputs of predictedmaximum ozone concentration can be analyzed to arriveat conclusions concerning the e!ects of emissions con-trols. De"ne C
50as the median or 50th percentile of the
distribution of 100 Monte Carlo outputs. The followingresults are generally valid for the all-domain hourly aver-aged ozone maximum and also for the maxima in the 11individual sub-domain: C
50(2007 emissions)/C
50(1995
emissions)"0.88; C50
(2007 with 50% NOx
reduc-tions)/C
50(2007)"0.77; and C
50(2007 with 50% VOC
reductions)/C50
(2007)"0.97.Despite the fact that the median ozone concentrations
show 5 or 10 or 20% changes downwards as a result ofemissions reductions, it is not obvious whether thesedi!erences are less than or greater than the expectedvariability due to random processes. Because of possiblecorrelations among similar runs, it is not correct to usethe full Monte Carlo uncertainties (p
-/ C"0.23) to calcu-
late the expected variability of di!erences in predictedozone concentration for sets of runs with di!erent baseemissions assumptions. Fortunately the four sets ofMonte Carlo runs were carried out in such a way that theexpected variability of di!erences can be estimated fromthe available Monte Carlo output "les. This is becauseeach of the four sets of 100 Monte Carlo runs used thesame 100 (number of Monte Carlo runs) by 128 (number
of input variables) matrix of random numbers. Forexample, Monte Carlo `run 14a would use the samerandom number to perturb the wind speed for the 1995base emissions runs, for the 2007 base emissions runs,and for the 50% NO
xand 50% VOC reduction runs.
Therefore, for Monte Carlo `run 14a, the di!erence in thepredicted maximum ozone concentration between the2007 base emissions runs and the 2007 base emissionswith 50% VOC reductions runs would be solely due tothe 50% emissions change.
The CDFs of the di!erences in all-domain predictedmaximum hourly averaged ozone concentration betweenthe Monte Carlo runs for paired sets of base emissionsassumptions were calculated for the three pairs of di!er-ences (1995 base}2007 base; 2007 base}2007 base withfurther 50% NO
xreductions; and 2007 base}2007 base
with further 50% VOC reductions). The 2.5th, 50th (me-dian), and 97.5th points on the CDF were identi"ed andthe `95% rangea assumed to be bounded by the 2.5thand 97.5th points on the CDF. Table 3 contains theresults.
For comparison purposes, the second column ofTable 3 lists the median predicted maximum all-domainhourly averaged ozone concentration for the 1995 or the2007 base emissions. Note that, in the "rst two rows (forthe di!erence between 1995 and 2007 base emissions andfor the di!erence between 2007 base emissions and 2007with 50% NO
xemission cuts), the 95% range does not
overlap zero, implying that the di!erence may be real andnot due to random variability. However, in the last row(for the di!erence between 2007 base emissions and 2007with 50% VOC emissions cuts), the 95% range barelyincludes zero, implying that the slight di!erence may bedue only to random variability. Note that the 95% rangeon the di!erence in the "rst row encompasses about0.04ppm, while the 95% range for the total Monte Carlouncertainty for the `all-domaina case in Table 2 en-compasses about 0.19 ppm. Thus the uncertainty in thedi!erences in ozone predictions due to emissions changesis about one-"fth of the total uncertainty in ozone predic-tions due to all model inputs. This result corroborates theassumption underlying the EPA's use of the `relativeresponse factora in demonstrating attainment, which isbased on the assumption that the uncertainty in the
898 S.R. Hanna et al. / Atmospheric Environment 35 (2001) 891}903
di!erence of ozone maximum predictions between thebase and emissions control runs is less than the uncer-tainty in the ozone maximum predictions themselves.
The discussion above and the data in Table 3 deal withthe di!erences in the maximum hourly averaged ozoneconcentration over the entire OTAG domain (all-domain). The same analysis was carried out for the 11subdomains shown in Fig. 1 and for the 155 receptorsites. The 95% ranges on the CDFs of the di!erences inpredicted concentrations for the four emissions scenariosvary from site to site, sometimes overlapping zero andsometimes not. For example, consider the di!erence in1995 base emissions and 2007 base emissions (row 1 ofTable 3 gives the results for the `all-domaina maximumozone concentration). Approximately one-third of the155 sites have the 95% range overlap zero, implying thatthe di!erence is probably due to random variability atthose sites. At 11 of the sites, all in the Southeast, themedian di!erence is greater than zero (i.e., the concentra-tions are higher in 2007, after emissions controls areimplemented, than in 1995).
The 95% ranges on the di!erences were also studied atthe 155 sites for the 50% NO
xand the 50% VOC
emissions reductions. The 95% range does not overlapzero for about 80% of the 155 sites for the 50% NO
xemission reductions. However, the di!erences appear tobe caused solely by random variability at many sites inthe Northeast, implying that the NO
xemissions reduc-
tions may be more e!ective in the Southeast than in theNortheast. Five sites (in the Chicago, Baltimore-Wash-ington, Philadelphia, and New York domains) havea median di!erence greater than zero, meaning that themedian predicted maximum ozone concentration inthese areas actually increased with a 50% NO
xemissions
reduction.The di!erences for 50% VOC emissions reductions
suggest that any ozone concentration changes are solelydue to random variability. About 75% of the sites havethe 95% range overlap zero, and 10% of the sites (most inthe Southeast) have the median di!erence greater thanzero. In the latter cases, the median predicted maximumozone concentration increased with a 50% VOC reduc-tion. The VOC emissions reductions appear to be slightlymore e!ective in the Northeast than in the Southeast,although the changes are generally low everywhere onthe OTAG domain.
5.4. Diwerences in uncertainty estimates for 1-hr and 8-hraverages
The conclusions (based solely on UAM-V model pre-dictions) concerning Monte Carlo estimates of uncertain-ties in the predictions of maximum ozone concentrationsare little changed for 1- versus 8-hr averages. The maindi!erence is that the 8-hr average predicted maximumdaily ozone concentrations are about 10% lower than
the 1-hr averages. This 10% relation for photochemicalgrid model predictions was also suggested by Chock et al.(1999). The EPA has calculated this relation for observa-tions at their ozone-monitoring sites and found that,on average, the 8-h averages are observed to be about15% less than the 1-h averages for maximum dailyozone concentrations (see http://envpro.ncsc.org/OMS/pub/SiteInfo/Correlation-Report.txt). This agreementbetween the 10% "gure for model predictions and the15% "gure for observations is fairly good, consideringthat the observations are taken at single points and aretherefore expected to have more variability than themodel predictions, which represent ensemble averagesover grid volumes.
6. Input variables whose uncertainties have the largeste4ect on uncertainties in predicted ozone
6.1. Correlation analysis
It was stated earlier that the observed and predictedmaximum hourly averaged ozone concentrations usuallyoccurred in the Atlanta UAM domain. More precisely,the maximum occurred in northern Alabama, to the westof Atlanta. This is not a region subject to long-rangetransport to the same extent as the New York UAMdomain. In northern Alabama, there are relatively fewlarge source regions in the upwind direction (i.e., to thesouthwest), while in New York, there are many largesource regions in the upwind direction (e.g., New Jersey,Philadelphia, Baltimore, and Washington). It is thereforeexpected that some of the correlation coe$cients andregression results between variations in predicted max-imum ozone concentrations and variations in input para-meters may be di!erent for the current phase of theresearch than for the earlier study (Hanna et al., 1998).
The results of the latest set of Monte Carlo runssuggest that the NO
2photolysis rate is the variable
whose uncertainties are most strongly correlated to theuncertainties in predictions of maximum hourly averagedozone concentrations for the 12}14 July period. At over90% of the 155 receptor sites, variations in NO
2photoly-
sis rate show a correlation of about #0.6 with variationsin predicted maximum hourly averaged ozone concentra-tion. It is interesting that, in the entire set of over 90CB-IV photochemical reactions, this is the only processthat directly produces ozone, via the production ofatomic oxygen from NO
2through the reaction
(NO2PhlPNO#O), and the subsequent production
of ozone through the reaction (O#O2#(M)PO
3).
The analysis of the Monte Carlo runs also shows signi"-cant correlations (i.e., correlations with magnitudes ex-ceeding 0.19) between variations in predicted maximumhourly averaged ozone concentrations and variations inwind speed and direction, relative humidity, cloud cover,
S.R. Hanna et al. / Atmospheric Environment 35 (2001) 891}903 899
and biogenic VOC emissions. These results could allowfuture research to be focussed on better specifying theinput variables that have the strongest in#uence on theozone predictions.
Hanna et al. (1998) reported that, for the New YorkCity UAM domain, variations in the rate constants forsome chemical reactions were found to produce signi"-cant correlations with variations in maximum hourlyaveraged ozone concentrations predicted by UAM-IV. Itwas not obvious why these particular reactions weremore important than others. In the current study involv-ing UAM-V on the OTAG domain, some of the samereactions were found to be important. In particular, sig-ni"cant correlations are found with the following CB-IVreactions:
CB-IVReaction46:C2O
3#NOPNO
2#XO
2
#FORM#HO2.
CB-IVReaction50:C2O
3#HO
2P0.79FORM
#0.79XO2#0.79HO
2#0.79OH.
Further inspection suggests that these two reactions areespecially important for ozone production not only be-cause the "rst reaction produces NO
2, but also because
both reactions lead to a net increase in peroxyl radicalsthat can subsequently produce NO
2by reaction with
NO, as well as formaldehyde, a photochemical precursorof additional radicals that can lead to NO
2production.
Thus these reactions are radical ampli"ers.Hanna et al. (1998) found strong correlations between
variations in anthropogenic area source emissions ofVOC and variations in predicted maximum ozone con-centration in the New York City UAM domain. But thecurrent Monte Carlo study does not yield such highcorrelations. We postulate two reasons for this. The "rstreason is that the New York City domain studied earlierwas largely VOC-limited, such that substantial ozoneresponses were simulated for VOC emissions changes.On the other hand, the rural-dominated OTAG domainused in the current Monte Carlo study was largely NO
x-
limited, resulting in negligible simulated ozone responsesto VOC emissions reductions over most of the domain.The second postulated reason is that, for input to theUAM-V model used in the current Monte Carlo study,the anthropogenic area sources of VOC are separatedinto three components: mobile, low point, and other area.The Monte Carlo simple random sampling method picksvalues of these components separately and independ-ently. Because there is no correlation prescribed be-tween these components, the positive and negativeperturbations of the chosen random numbers (one formobile sources, one for low-point sources, and one forother area sources) tend to cancel out, leading to a re-duced e!ect of total VOC anthropogenic area sources onvariations in predicted ozone concentration. In contrast,
the anthropogenic VOC emissions inputs to UAM-IV inthe earlier study consisted of a single relatively large an-thropogenic area source term, whose variations thereforehad a stronger e!ect on variations in predicted ozone. This"nding suggests that future studies with inputs that areknown to be correlated might consider including estimatesof these correlations in the random sampling procedure.
The earlier results, on the relatively small New YorkCity domain, suggested that uncertainties in boundaryconcentrations were correlated to uncertainties in pre-dicted maximum ozone. This was not found in the currentstudy, probably because of the large di!erences in domainsizes. In the earlier study, there were large amounts ofozone, VOCs and NO
xon the upwind domain boundary
in central New Jersey. In contrast, for the relatively largeOTAG domain used in the current study, the domainboundaries were in rural areas far upwind of the regionwhere high ozone and precursor concentrations wereoccurring.
6.2. Regression analysis
Standard multiple linear regression analysis was ap-plied to the inputs and outputs of the 100 Monte Carloruns for each emission group. In a sense, this procedureattempts to replace the original UAM-V three-dimen-sional grid model with a response surface based on mul-tiple linear regression. This analysis was done for theinput variables whose variations showed a correlationexceeding 0.19 with the variations of the peak domain-wide hourly averaged ozone concentration. The criterion;0.19, represents the magnitude of the correlation coe$-cient where, for 100 pairs of independent variables, thereis 95% con"dence that the calculated correlation is sig-ni"cantly di!erent than zero. This analysis was donefor the OTAG-domain-wide maximum ozone concentra-tion, for the maximum in the 11 smaller UAM domains,and for 1 and 8-h averages. The ozone maximum couldoccur anytime in the 12}14 July 1995 period. The resultswere fairly consistent, as shown by the regression for-mulas listed below for the OTAG-domain 1-h maximumozone concentration for the four base emissions scen-arios. The numbers in parentheses (e.g., R2"0.74) indi-cate the fraction of the variance explained by the regres-sion formula. The input variables are expressed as frac-tions or relative changes (i.e., change in the variabledivided by the value of the variable). Shorthand notationis used for the key variables (refer to Table 1): u"windspeed (variable 12); CC"cloud cover (variable 18);VOCBIO"area biogenic VOC emissions (variable 21);NO
2phot"NO
2photolysis rate; R1"CB-IV reaction
1 (NO2PhlPNO#O); R15"CB-IV reaction 15
(NO3#NOP2NO
2); R41"CB-IV reaction 41
(FORM#NO3PHNO
3#HO
2#CO); and R46"
CB-IV reaction 46 (C2O
3#NOPFORM#NO
2#
HO2#XO
2).
900 S.R. Hanna et al. / Atmospheric Environment 35 (2001) 891}903
For year 1995 emissions (R2"0.74):
O3(ppm)"0.088 ppm!0.093(*u/u)!0.029(*CC/CC)
#0.051(*VOCBIO/VOCBIO)
#0.098(*NO2phot/NO
2phot)
#0.023(*R46/R46)
For year 2007 emissions (R2"0.71):
O3(ppm)"0.095 ppm!0.069(*u/u)!0.023(*CC/CC)
#0.044(*VOCBIO/VOCBIO)
#0.088(*NO2phot/NO
2phot)
#0.074(*R1/R1)!0.025(*R41/R41)
For year 2007 emissions with 50% cuts in NOx
(R2"0.72):
O3(ppm)"0.023 ppm!0.064(*u/u)
#0.023(*VOCBIO/VOCBIO)
#0.067(*NO2phot/NO
2phot)
#0.043(*R1/R1)#0.020(*R15/R15)
#0.020(*R41/R41)
For year 2007 emissions with 50% cuts in VOC(R2"0.72):
O3(ppm)"0.061 ppm!0.066(*u/u)
!0.022(*CC/CC)#0.052(*VOCBIO/
VOCBIO)#0.081(*NO2phot/NO
2phot)
#0.069(*R1/R1)
Recall that the prediction of median domain-widedaily maximum hourly-averaged ozone concentration isabout 0.20 ppm. The coe$cient of the relative NO
2photolysis rate change term, *NO
2phot/NO
2phot, is in
the range from 0.067 to 0.098 in the four equations above,implying that a 50% uncertainty in NO
2photolysis rate
causes about a 0.04 ppm, or a 20% uncertainty in pre-dicted maximum ozone concentration. The coe$cient ofthe relative wind speed change term, *u/u, has a similarrange from 0.064 to 0.093 in the four equations, alsoimplying that a 50% uncertainty in wind speed causesabout a 0.04 ppm, or a 20% uncertainty, in predictedozone concentration. The reason why the gross results ofthe correlation analysis, discussed in Section 6.1, showedthat the uncertainties in NO
2photolysis rates have a lar-
ger e!ect than uncertainties in wind speed on uncertain-ties in predicted maximum ozone concentrations is thatthe assumed total uncertainty is about 1.7 times as largefor the photolysis rate (p
-/ 1)05 3!5%"0.347) as for the wind
speed (p-/ u
"0.203).
It is seen that cloud cover, CC, has a consistent regres-sion constant of about 0.02}0.03 in the equations. Thusan uncertainty of 50% in cloud cover causes an uncer-tainty of about 0.01 ppm, or about 5%, in predictedmaximum ozone. The area biogenic VOC emissions,VOCBIO, have a regression coe$cient ranging from0.023 to 0.052, with the smaller number for the runs withreduced NO
xemissions. For most of the cases, a 50%
uncertainty in VOC biogenic emissions causes abouta 10% uncertainty in predicted maximum ozone.
Four chemical reactions appear in the four regressionequations, with reaction 1 (NO
2PNO#O), or variable
34, appearing three out of four times. This reaction`teamsa with the NO
2photolysis rate and is interesting
because this (along with reaction 2: O#O2#(M)P
O3) is the only mechanism for direct formation of ozone.
The regression constant for reaction 1 averages about0.06, implying that a 50% uncertainty in the rate con-stant for reaction 1 leads to about a 15% uncertainty inpredicted ozone concentrations. It follows that a priorityshould be given to more accurate determination of theNO
2photolysis rate and the reaction rate for reaction 1.
7. Limitations to study and recommendations for furtherresearch
The Monte Carlo uncertainty methodology isa powerful technique that is seeing increasing applica-tions to large three-dimensional environmental models.The earlier study (Hanna et al., 1998) and the currentstudy are meant to be preliminary demonstration exer-cises of the Monte Carlo methodology as applied tothree-dimensional photochemical grid models. The re-sults of these applications appear realistic and muchexperience has been gained in the methodology, whichhas been revised considerably over the course of theresearch. It would be appropriate for decision-makers touse this information on uncertainties as part of the pro-cess by which emissions reductions are prescribed.Nevertheless, there are a few limitations that should beaddressed:
Dependence on satisfactory model } The methodologyassumes that the model is satisfactory to begin with andis able to account properly for the major physical andchemical e!ects. The uncertainty analysis looks only atthe in#uence of uncertainties in model input parametersand variables on the uncertainties of model output vari-ables. The methodology does not account for de"cienciesin model formulations, which may lead to compensatingerrors and other e!ects that mask the true variabilitiesand dependencies. For these reasons, two di!erentphotochemical grid models may give di!erent resultswhen the Monte Carlo methodology is applied to them.
Dependence on good knowledge of input variable uncer-tainty }Our expert elicitation exercise suggests that most
S.R. Hanna et al. / Atmospheric Environment 35 (2001) 891}903 901
photochemical modelers have not devoted extensive ef-fort to estimating input variable uncertainties. Conse-quently the uncertainties assumed in Table 1 representpreliminary estimates which should be re"ned as thisresearch "eld matures. The best information exists for theuncertainties of the photochemical reaction rate con-stants, which have been studied for other purposes, suchas modeling the photochemistry of the stratosphere.Also, there has not yet been an acceptable way devised toestimate the variability in meteorological inputs, becauseof di$culties associated with the need to maintain massconservation in the wind "elds. The best way to treatmeteorological uncertainty would be to apply the MonteCarlo method to a diagnostic or prognostic meteorologi-cal model, beginning with uncertainties in the basic in-puts such as the surface wind and radiosonde inputs, butthis would be an extensive e!ort all by itself. Otherdi$culties exist in the estimation of uncertainties inboundary and initial conditions because there are notsu$cient observations of vertical and spatial "elds of thechemical constituents. Finally, the literature containsa long trail of discussions about possible biases in thebaseline emissions inputs, with recent improvements tosome components such as biogenic and mobile sourceVOCs. Nevertheless, few estimates of uncertainties inemissions are available.
Categorization of emissions classes } It was mentionedin Section 6 that the in#uence of variations in anthropo-genic VOC area source emissions on uncertainties inpredicted ozone concentration was decreased in the cur-rent study when compared with the previous study(Hanna et al., 1998). This is because the UAM-V modelused in the current study has three categories of anthro-pogenic area source emissions, whereas the UAM-IVmodel used in the previous study lumps the three catego-ries into a single class. By randomly and independentlyvarying these three categories, the total variation in com-bined emissions tends to be less because of cancellationsof positive and negative perturbations of the compo-nents. In reality, the components are correlated. If emis-sions classes are subdivided, it may be useful to estimatethe magnitudes of these correlations and account forthem in the resampling method. This is also true ofcorrelations between emissions and other input variablessuch as boundary VOC concentrations.
Long-range transport issues } Because of the use of thewords `ozone transporta in the name OTAG, there is aninterest in determining the uncertainty of ozone concen-trations due to variations in emissions inputs at locationsseveral hundred kilometers upwind of where the ozoneconcentration is being observed. In the current study, it isdi$cult to address long-range transport issues becauseall emissions in each category are varied uniformly acrossthe OTAG domain. To study transport issues, it wouldbe of interest to look at variations of emissions in cer-tain source groups, such as Midwest power plants, and
determine their in#uence on uncertainties in predictedozone concentrations in key downwind areas, such asnorthern New York or New England.
Acknowledgements
This research was sponsored by EPRI and a subset ofmember utilities under contracts WO3189-13 andWO9151-04. The authors acknowledge many scientistswho responded to our request for estimates of uncertain-ties for input parameters. Useful suggestions were re-ceived from the project technical consultants, PhilipRoth of Envair, Owen Ho!man of SENES Oak Ridge,and Eduard Hofer, and from Thomas Tesche of AlpineGeophysics.
References
Alcamo, J., Bartnicki, J., 1987. A framework for error analysis ofa long-range transport model with emphasis on parameteruncertainty. Atmospheric Environment 21, 2121}2131.
Atkinson, R., Lloyd, A.C., 1984. Evaluation of kinetic and mech-anistic data for modeling of photochemical smog. Journal ofPhysical and Chemical Reference Data 12, 315}444.
Beck, M.B., Ravetz, J.R., Mulkey, L.A., Barnwell, T.O., 1997. Onthe problem of model validation for predictive exposureassessments. In: Stochastic Hydrology and Hydraulics, Vol.11. Springer, Berlin, pp. 229}254.
Bergin, M.S., Noblet, G.S., Petrini, K., Dhieux, J.R., Milford,J.B., Harley, R.A., 1999. Formal uncertainty analysis ofa Lagrangian photochemical air pollution model. Environ-mental Science and Technology 33, 1116}1126.
Carmichael, G.R., Sandu, A., Potra, F., 1997. Sensitivity analysisfor atmospheric chemistry models via automatic di!erenti-ation. Atmospheric Environment 31, 475}489.
Chock, D.P., Chang, T.Y., Winkler, S.L., Nance, B.I., 1999. Theimpact of an 8 hr ozone air quality standard on ROG andNO
xcontrols on Southern California. Atmospheric Envi-
ronment 33, 2471}2485.Dabdub, D., DeHaan, L.L., Seinfeld, J.H., 1999. Analysis of
ozone in the San Joaquin Valley of California. AtmosphericEnvironment 33, 2501}2514.
DeMore, W.R., Golde, D.M., Hampson, R.F., Howard, C.J.,Kolb, C.E., Kurylo, M.J., Molina, M.J., Ravishankra, A.R.,Sander, S.P., 1994. Chemical kinetics and photochemicaldata for use in stratospheric modeling. Eval. 11, NASA JPLPbl. 92-26.
Deuel, H.P., Douglas, S.G., Burton, C.S., 1998. Estimation ofmodeling system noise for two applications of the UAM-Vmodeling system: one-hour ozone, eight-hour ozone, andozone exposure. SYSAPP-98/27, Systems Applications In-ternational, Inc., 101 Lucas Valley Road, San Rafael, CA94903, 38 pp.
Dolwick, P.D., Jang, C., Lo, S., Olerud, D., Vukovich, J.,Wheeler, N., 1998. In-depth evaluation of OTAG modeling.Paper No. 98-MP2B.03, Proceedings of the 91st AnnualAWMA Meeting, San Diego, CA, available from AWMA,One Gateway Center, Third Floor, Pittsburgh, PA 15222.
902 S.R. Hanna et al. / Atmospheric Environment 35 (2001) 891}903
EPA, 1998. OTAG Final Report ( http://www.epa.gov/ttn/otag/"nalrpt/index.htm).
Frey, H.C., 1998. Estimates of uncertainty in air quality inputsbased upon expert elicitation. North Carolina State Univer-sity, Raleigh, NC 28595.
Gao, D., Stockwell, W.R., Milford, J.B., 1995. First-order sensi-tivity and uncertainty analysis for regional-scale gas-phasechemical mechanism. Journal of Geophysical Research100D, 23153}23166.
Gao, D., Stockwell, W.R., Milford, J.B., 1996. Global uncer-tainty analysis of a regional-scale gas-phase chemistrymechanism. Journal of Geophysical Research 101,9107}9119.
Hanna, S.R., Chang, J.C., Fernau, M.E., 1998. Monte Carloestimates of uncertainties in predictions by a photochemicalgrid model (UAM-IV) due to uncertainties in input vari-ables. Atmospheric Environment 32, 3619}3628.
Hanna, S.R., Chang, J.C., Fernau, M.E., Hansen, D.A., 1997.Estimates of sensitivities of photochemical grid models touncertainties in input parameters, as applied to UAM-IV onthe New York domain. Proceedings, 22nd NATO/CCMSInternational Technical Meeting on Air Pollution Modelingand its Application. Plenum Press, New York.
Hass, H., Builtjes, P.J.H., Simpson, D., Stern, R., 1997. Compari-son of model results obtained with several European re-gional air quality models. Atmospheric Environment 31,3259}3279.
IAEA, 1989. Evaluating the Reliability of Predictions madeusing Environmental Transfer Models. IAEA Safety SeriesNo. 100, International Atomic Energy Agency, Vienna, Aus-tria.
Lurmann, F., Kumar, N., 1997. Evaluation of the UAM-Vmodel performance in OTAG simulations: summary ofperformance against surface observations. Final Report(Sonoma Technology, Inc.), Prepared for the U.S. EPA andOTAG, RTP, NC.
Milford, J.B., Gao, D., Russell, A.G., McRae, G.J., 1992. Use ofsensitivity analysis to compare chemical mechanisms forair-quality modeling. Environmental Science and Techno-logy 26, 1179}1189.
Morgan, M.G., Henrion, M., 1990. Uncertainty: A Guide toDealing with Uncertainty in Quantitative Risk and PolicyAnalysis. Cambridge University Press, New York.
NCRP, 1996. In: F.O. Ho!man (Ed.), A Guide for Uncer-tainty Analysis in Dose and Risk Assessments Related to
Environmental Contamination. NRCP Commentary No.14, National Council on Radiation Protection and Measure,7910 Woodmont Avenue, Bethesda, MD.
OTAG, 1997. OTAG Regional and Urban Scale ModelingWorkgroup. Modeling Report, Version 1.1.
Russell, A., Milford, J., Bergin, S., McBride, S., McNair, L.,Yang, Y., Stockwell, W.R., Croes, B., 1995. Urban ozonecontrol and atmospheric reactivity of organic gases. Science269, 491}495.
SAI, 1996. User's Guide to the Variable-Grid Urban AirshedModel (UAM-V). SYSAPP-95/027, Systems ApplicationsInternational, 101 Lucas Valley Road, San Rafael, CA 94903,138 pp.
Saltelli, A., 1999. Sensitivity analysis: could better methods beused? Journal of Geophysical Research 104, 3789}3793.
Seefeld, S., Stockwell, W.R., 1999. First-order sensitivity analysisof models with time-dependent parameters: an application toPAN and ozone. Atmospheric Environment 33, 2941}2953.
Seigneur, C., Tesche, T.W., Roth, P.M., Reid, L.E., 1981. Sensi-tivity of a complex urban air quality model to input data.Journal of Applied Meteorology 20, 1020}1040.
Stolarski, R.S., Butler, D.M., Rundel, R.D., 1978. Uncertaintypropagation in a stratospheric model, 2. Monte Carlo analy-sis of imprecisions due to reaction rates. Journal of Geo-physical Research 83, 3074}3078.
Tatang, M.A., Pan, W., Prinn, R.G., McRae, G.J., 1997. Ane$cient method for parametric uncertainty analysis of nu-merical geophysical models. Journal of Geophysical Re-search 102, 21925}21932.
Tesche, T.W., McNally, D.E., Emigh, R.A., 1998. Assessment ofthe OTAG modeling Paper 9A4, Proceedings 10th Confer-ence on Application of Air Pollution Meteorology, Ameri-can Meteorological Society, Vol. 45 Beacon St., Boston, MA,pp. 480}489.
Thompson, A.M., Stewart, R.W., 1991. E!ect of chemical kineticuncertainties on calculated constituents in a troposphericphotochemical model. Journal of Geophysical Research 96,13089}13108.
Winner, D.A., Cass, G.R., Harley, R.A., 1995. E!ect of alterna-tive boundary conditions on predicted ozone control strat-egy performance: a case study in the Los Angeles area.Atmospheric Environment 29, 3451}3464.
Yang, Y.-J., Wilkinson, J.G., Russell, A.G., 1997. Fast, directanalysis of multidimensional photochemical models. Envir-onmental Science and Technology 31, 2859}2868.
S.R. Hanna et al. / Atmospheric Environment 35 (2001) 891}903 903
Related Documents