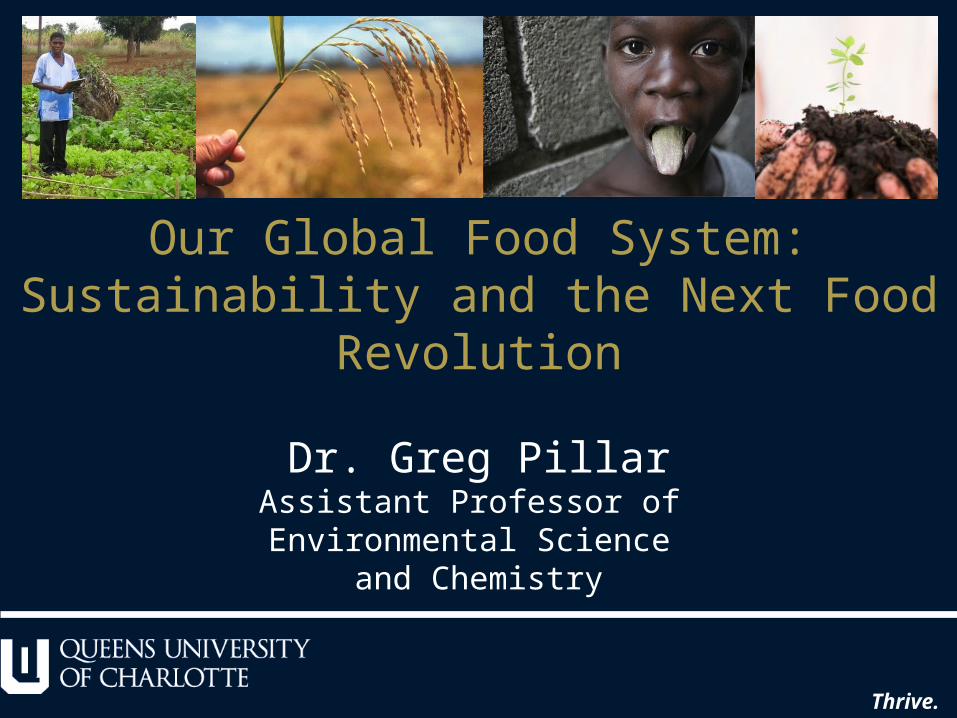
Our Global Food System: Sustainability and the Next Food Revolution Dr. Greg Pillar Assistant Professor of Environmental Science and Chemistry Thrive.

Welcome message from author
This document is posted to help you gain knowledge. Please leave a comment to let me know what you think about it! Share it to your friends and learn new things together.
Transcript
Our Global Food System:Sustainability and the Next Food Revolution
Dr. Greg PillarAssistant Professor of
Environmental Science and Chemistry
Thrive.

The Food Situation…..
1990 1995 2000 2005 2010
Mill
ions
of
Und
erno
ursh
ed P
eopl
ein
Dev
elop
ing
Cou
ntrie
s
750
800
850
900
950
1000
1050
FAO, 2009

The Food Situation…..
less than $1.00 per daymore than $1.00 per day
12%88%
less than $2.00 per daymore than $2.00 per day
40%
60%
less than $10.00 per daymore than $10.00 per day
80%
20%
World Bank Developer Indicators, 2008

The Food Situation…..
FAO, 2008

FAO, 2009
The Food Situation…..
Price of wheat, maize, rice and sorghum between 1999 and 2009
Year
99 00 01 02 03 04 05 06 07 08 09 10
US
Dol
lar
per
Ton
ne
0
200
400
600
800
1000
1200
Wheat (US)Maize (US)Rice (Thailand)Sorghum (US)

The Food Situation…..

www.standeyo.comwww.msnbc.comwww.usatoday.comwww.bbc.com

By Ariana Cubillos, AP

The Food Situation…..

The Challenges…..
Thrive.

Year
1750 1800 1850 1900 1950 2000 2050
Glo
bal h
uman
pop
ulat
ion
(bill
ions
)
0
2
4
6
8
10
1 billion1.6 billion
2.5 billion
6.0 billion
6.5 billion
2.5 people per second (80 million per year)
Challenge #1: - Population9.2 billion
Predicted
UN Population Division, 2009
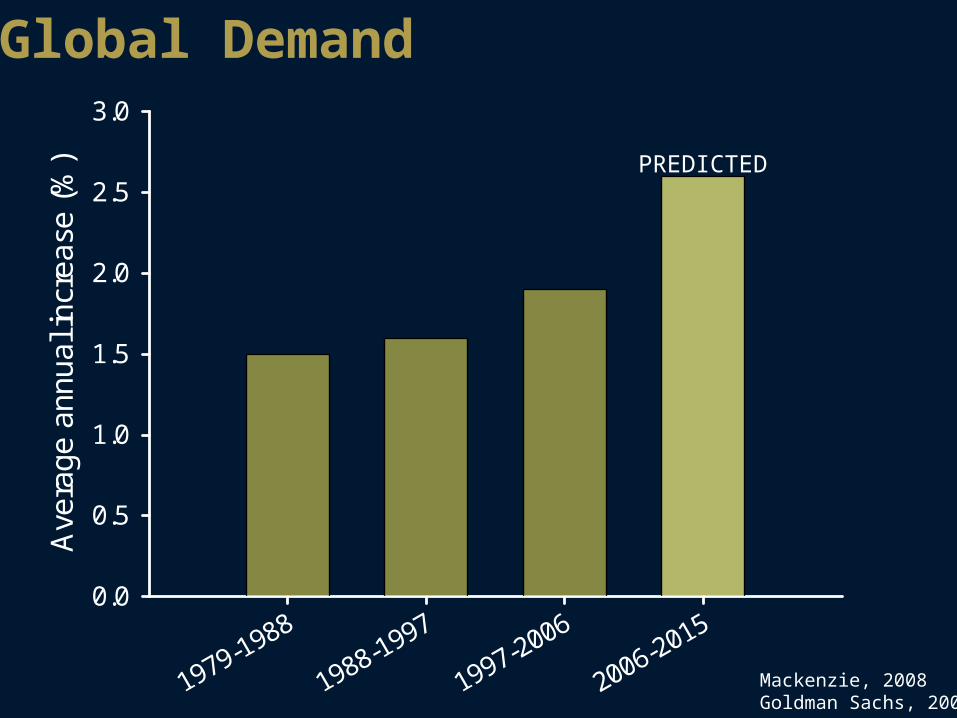
Mackenzie, 2008Goldman Sachs, 2007
Global Demand
1979-1988
1988-1997
1997-2006
2006-2015
Ave
rage
ann
ual i
ncre
ase
(%)
0.0
0.5
1.0
1.5
2.0
2.5
3.0
PREDICTED

Maize Wheat Rice
Ave
rage
ann
ual i
ncre
ase
(%)
0.0
0.5
1.0
1.5
2.0
2.5
3.0 1967 - 19961997 - 2006
Mackenzie, 2008FAO-STAT, 2008
Global Supply

1960 1970 1980 1990 2000 2010 2020
Yie
ld a
nd D
eman
d In
dexe
d to
196
5
1.0
1.5
2.0
2.5
3.0
3.5 Global Demand (Crop Product Consumption) Global Crop Yield
modified from Doyle & Zavislak, 2008 Goldman Sachs, 2007
Global Supply & Demand….
Norman Borlaug(1914 – 2009)

Fossil Fuel Resources
Machines
Plant Nutrients& Amendments
Seed
WaterAgricultural Chemicals
Fertilization
Tillage
Seeding
Irrigation
Pest Control
Purchased Inputs Farm Production
Harvest &Storage
Solar EnergyPrecipitation
Carbon Dioxide
Challenge #2: “Modern” Agriculture
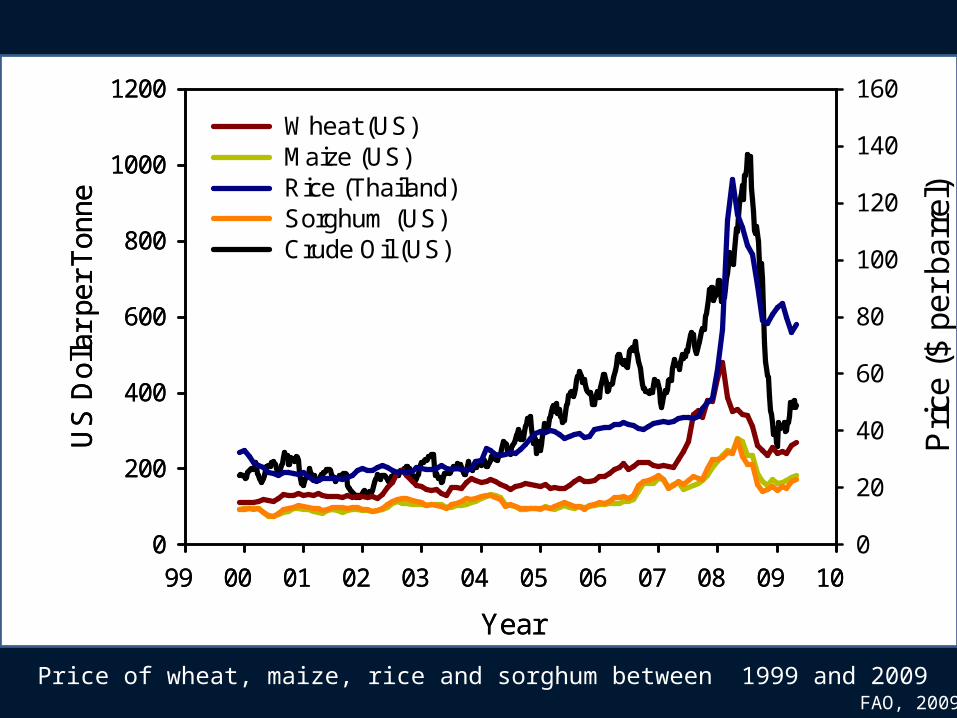
FAO, 2009Price of wheat, maize, rice and sorghum between 1999 and 2009
Year
99 00 01 02 03 04 05 06 07 08 09 10
US
Dol
lar
per
Ton
ne
0
200
400
600
800
1000
1200
Pric
e ($
per
bar
rel)
0
20
40
60
80
100
120
140
160
Wheat (US)Maize (US)Rice (Thailand)Sorghum (US)Crude Oil (US)
Year
99 00 01 02 03 04 05 06 07 08 09 10
US
Dol
lar
per
Ton
ne
0
200
400
600
800
1000
1200
Wheat (US)Maize (US)Rice (Thailand)Sorghum (US)

Photos by Jim Richardson, National Geographic
“The history of every nation, is eventually written in the way in which it cares for its soil”-- Franklin D. Roosevelt
Soil Degradation


17% 14%
46%
71%
49%77%
1.1 billion hectares1.0 billion hectares
0.20 billion hectares
0.38 billion hectares0.21 billion hectares
0.36 billion hectares
Land Use….
IndiaUnitedStates
Europe
Sub-SaharanAfrica
Central/SouthAmerica
China
Planted CropsTotal Arable, Rain-Irrigated Land World Soil Resources Report, 2000

Ecuador: The Ayme family of TingoFood expenditure for one week: $31.55 Menzel & D’Aluisio, 2008
Challenge #3: Food Culture

United States: The Revis family of North CarolinaFood expenditure for one week: $341.98 Menzel & D’Aluisio, 2008


http://libcom.orghttp://www.simonsenconsultingservices.comhttp://www.deltaflow.comhttp://blogs.princeton.edu

Corn
Feed55% Ethanol
30%
High fructoseCorn syrup
5%
Starch2%
Sweeteners2%
Cereals2%
Field corn surplusAlcohols
Sweet cornSeed4%
Total Annual U.S. Non-Export Corn Production: 10.5 billion bushels
National CornGrowers Association, 2008

1200 calories
875 calories
250 calories
170 calories
Walsh, 2009

Meat Production – Developing Countries
FAO-STAT, 2009Year
1960 1965 1970 1975 1980 1985 1990 1995 2000 2005
Mill
ions
of
tonn
es
0.0
0.5
1.0
1.5
2.0
2.5
3.0
3.5
Beef and BuffaloPigPoultry

Meat Production - Grain
Grain required (kg) to produce1 kg of protein
0 5 10 15 20 25
Beef
Pork
Eggs
Chicken
Milk
http://www.ces.purdue.edu

Meat Production - Water
Water required (kg) to produce 1 kg of protein
0 200 400 600 800
Beef
Milk
Pork
Chicken
Eggs

Gary Kazanjian – NY Times
Meat Production - Feedlots

www.factoryfarm.org
www.doveimaging.com

Challenge #4: The Environment
FAO, 2008

USDA Foreign Agricultural Service & NASA, 2005
Global Climate Change

Justin Mott, NY Times
Global Climate ChangeAu
stra
lian
Prod
uctio
n (m
illion
met
ric to
ns)
0.0
0.5
1.0
1.5
2.0
Wine GrapesRice
modified from NY Times, April 17, 2008
Amy Toensing
Are we approaching another food revolution?
Thrive.

Opportunity #1: Genetically Modified Foodhttp://www.american.com
http://www.macalester.edu

Flood tolerant rice (SUB1A)

Opportunity #2: Boost Production
modified from Mackenzie, 2008
Malawi
EthiopiaNigeria
UgandaMali
Mozambique
Yie
ld (
tonn
es p
er h
ecta
re)
0
1
2
3
4
5
Average National YieldPotential Yield (Plot Demonstrations)

Asia –Pacific
Latin America &Caribbean
Sub-SaharanAfrica
Developingcountries
High-incomecountries
Research and Development Spending
Modified from Pardey, Beintema, Dehmer and Wood, 2006
Ave
rage
ann
ual g
row
th (
%)
-2
0
2
4
6
8
10
121976 - 19811981 - 19911991 - 2000

Opportunity #3: Sustainable Agriculture

Smaller Farms (LOTS of them)

Justin Sullivan / Getty http://riotofreasons.blogspot.comhttp://greensgrow.org
Sustainable “Urban” Agriculture

http://www.verticalfarm.com/http://gliving.com http://greenbrooklyn.comhttp://activplace.com

Growing Farmers
Photos by John D. SimmonsElma C. Lomax Incubator Farm (Cabarrus County)

Opportunity #4: Food Sovereignty
http://www.panna.orghttp://www.irri.org

Von Braun & Meinzen-Dick, 2009
Selling Land Purchasing Land
“Land Grabbing”

http://www.organicfood-benefits.com/Menzel & D’Aluisio, 2008
Opportunity #5: Change the Culture

Local Food Policy Networks


Thank You!!
Online: http://www.pillarenvironmental.com
Twitter: PillarESci
Email: [email protected]
Thrive.
Related Documents