Unbiased diffeomorphic atlas construction for computational anatomy S. Joshi, a,b, * Brad Davis, a,b Matthieu Jomier, c and Guido Gerig b,c a Department of Radiation Oncology, University of North Carolina, United States b Department of Computer Science, University of North Carolina, United States c Department of Psychiatry, University of North Carolina, United States Available online 22 September 2004 Construction of population atlases is a key issue in medical image analysis, and particularly in brain mapping. Large sets of images are mapped into a common coordinate system to study intra-population variability and inter-population differences, to provide voxel-wise mapping of functional sites, and help tissue and object segmentation via registration of anatomical labels. Common techniques often include the choice of a template image, which inherently introduces a bias. This paper describes a new method for unbiased construction of atlases in the large deformation diffeomorphic setting. A child neuroimaging autism study serves as a driving application. There is lack of normative data that explains average brain shape and variability at this early stage of development. We present work in progress toward constructing an unbiased MRI atlas of 2 years of children and the building of a probabilistic atlas of anatomical structures, here the caudate nucleus. Further, we demonstrate the segmentation of new subjects via atlas mapping. Validation of the methodology is performed by comparing the deformed probabilistic atlas with existing manual segmentations. D 2004 Elsevier Inc. All rights reserved. Keywords: Computational anatomy; Brain atlases; Registration; Image segmentation Introduction Since Broadman 1909, the construction of brain atlases has been central to the understanding of the variabilities of brain anatomy. More recently, since the advent of modern computing and digital imaging techniques intense research has been directed toward the development of digital three-dimensional atlases of the brain. Most digital brain atlases so far are based on a single subject’s anatomy (Ho et al., 2002; Warfield et al., 2002). Although these atlases provide a standard coordinate system, they are limited because a single anatomy cannot faithfully represent the complex structural variability between individuals. A major focus of computational anatomy has been the development of image mapping algorithms (Gee et al., 1993; Miller and Younes, 2001; Rohlfing et al., 2003b; Thompson and Toga, 2002) that can map and transform a single brain atlas on to a population. In this paradigm, the atlas serves as a deformable template (Grenander, 1994). The deformable template can project detailed atlas data such as structural, biochemical, functional as well as vascular information on to the individual or an entire population of brain images. The transformations encode the variability of the population under study. A statistical analysis of the trans- formations can also be used to characterize different populations (Csernansky et al., 1998; Hohne et al., 1992; Talairach et al., 1988). For a detailed review of deformable atlas mapping and the general framework for computational anatomy, see Grenander and Miller (1998) and Thompson and Toga (1997). One of the fundamental limitations of using a single anatomy as a template is the introduction of a bias based on the arbitrary choice of the template anatomy. Thompson and Toga (1997) very elegantly address this bias in their work by mapping a new data set on to every scan in a brain image database. This approach addresses the bias by in effect forgoing the formal construction of a representative template image. Although this framework is mathematically elegant and powerful, it results in a computationally prohibitive approach in which each new scan has to be mapped independently to all the data sets in a database. This is analogous to comparing each subject under study to every previously analyzed image. As brain image databases grow the analysis problem grows combinatorially. In more recent and related work, Avants and Gee (2004) developed an algorithm in the large deformation diffeomorphic setting for template estimation by averaging velocity fields. Most other previous work (Bhatia et al., 2004) in atlas formation has focused on the small deformation setting in which arithmetic averaging of displacement fields is well defined. Guimond et al. (2000) develop an iterative averaging algorithm to reduce the bias. In the latest work of Bhatia et al. (2004), explicit 1053-8119/$ - see front matter D 2004 Elsevier Inc. All rights reserved. doi:10.1016/j.neuroimage.2004.07.068 * Corresponding author. Department of Radiation Oncology, Univer- sity of North Carolina. Fax: +1 919 962 1799. E-mail address: [email protected] (S. Joshi). Available online on ScienceDirect (www.sciencedirect.com.) www.elsevier.com/locate/ynimg NeuroImage 23 (2004) S151 – S160

Welcome message from author
This document is posted to help you gain knowledge. Please leave a comment to let me know what you think about it! Share it to your friends and learn new things together.
Transcript

www.elsevier.com/locate/ynimg
NeuroImage 23 (2004) S151–S160
Unbiased diffeomorphic atlas construction for
computational anatomy
S. Joshi,a,b,* Brad Davis,a,b Matthieu Jomier,c and Guido Gerigb,c
aDepartment of Radiation Oncology, University of North Carolina, United StatesbDepartment of Computer Science, University of North Carolina, United StatescDepartment of Psychiatry, University of North Carolina, United States
Available online 22 September 2004
Construction of population atlases is a key issue in medical image
analysis, and particularly in brain mapping. Large sets of images are
mapped into a common coordinate system to study intra-population
variability and inter-population differences, to provide voxel-wise
mapping of functional sites, and help tissue and object segmentation
via registration of anatomical labels. Common techniques often include
the choice of a template image, which inherently introduces a bias. This
paper describes a new method for unbiased construction of atlases in
the large deformation diffeomorphic setting.
A child neuroimaging autism study serves as a driving application.
There is lack of normative data that explains average brain shape and
variability at this early stage of development. We present work in
progress toward constructing an unbiased MRI atlas of 2 years of
children and the building of a probabilistic atlas of anatomical
structures, here the caudate nucleus. Further, we demonstrate the
segmentation of new subjects via atlas mapping. Validation of the
methodology is performed by comparing the deformed probabilistic
atlas with existing manual segmentations.
D 2004 Elsevier Inc. All rights reserved.
Keywords: Computational anatomy; Brain atlases; Registration; Image
segmentation
Introduction
Since Broadman 1909, the construction of brain atlases has
been central to the understanding of the variabilities of brain
anatomy. More recently, since the advent of modern computing
and digital imaging techniques intense research has been directed
toward the development of digital three-dimensional atlases of the
brain. Most digital brain atlases so far are based on a single
subject’s anatomy (Ho et al., 2002; Warfield et al., 2002).
Although these atlases provide a standard coordinate system, they
1053-8119/$ - see front matter D 2004 Elsevier Inc. All rights reserved.
doi:10.1016/j.neuroimage.2004.07.068
* Corresponding author. Department of Radiation Oncology, Univer-
sity of North Carolina. Fax: +1 919 962 1799.
E-mail address: [email protected] (S. Joshi).
Available online on ScienceDirect (www.sciencedirect.com.)
are limited because a single anatomy cannot faithfully represent
the complex structural variability between individuals. A major
focus of computational anatomy has been the development of
image mapping algorithms (Gee et al., 1993; Miller and Younes,
2001; Rohlfing et al., 2003b; Thompson and Toga, 2002) that can
map and transform a single brain atlas on to a population. In this
paradigm, the atlas serves as a deformable template (Grenander,
1994). The deformable template can project detailed atlas data
such as structural, biochemical, functional as well as vascular
information on to the individual or an entire population of brain
images. The transformations encode the variability of the
population under study. A statistical analysis of the trans-
formations can also be used to characterize different populations
(Csernansky et al., 1998; Hohne et al., 1992; Talairach et al.,
1988). For a detailed review of deformable atlas mapping and the
general framework for computational anatomy, see Grenander and
Miller (1998) and Thompson and Toga (1997). One of the
fundamental limitations of using a single anatomy as a template
is the introduction of a bias based on the arbitrary choice of the
template anatomy.
Thompson and Toga (1997) very elegantly address this bias in
their work by mapping a new data set on to every scan in a brain
image database. This approach addresses the bias by in effect
forgoing the formal construction of a representative template
image. Although this framework is mathematically elegant and
powerful, it results in a computationally prohibitive approach in
which each new scan has to be mapped independently to all the
data sets in a database. This is analogous to comparing each subject
under study to every previously analyzed image. As brain image
databases grow the analysis problem grows combinatorially.
In more recent and related work, Avants and Gee (2004)
developed an algorithm in the large deformation diffeomorphic
setting for template estimation by averaging velocity fields.
Most other previous work (Bhatia et al., 2004) in atlas
formation has focused on the small deformation setting in which
arithmetic averaging of displacement fields is well defined.
Guimond et al. (2000) develop an iterative averaging algorithm
to reduce the bias. In the latest work of Bhatia et al. (2004), explicit

S. Joshi et al. / NeuroImage 23 (2004) S151–S160S152
constraints requiring that the sum of the displacement fields add to
zero is enforced in the proposed atlas construction methodology.
These small deformation approaches are based on the assumption
that a transformations of the form h(x) = x + u(x), parameterized
via a displacement field, u(x), are close enough to the identity
transformation such that composition of two transformations can
be approximated via the addition of their displacement fields:
h1 B h2 xð Þ ˜ xþ u1 xð Þ þ u2 xð Þ: ð1Þ
The focus of this paper is a development of a methodology that
simultaneously estimates the transformations and an unbiased
template, in the large deformation setting. The method developed
herein does not assume the above approximation of Eq. (1) and
build atlases of populations with large geometric variability.
Methods
Given a collection of anatomical images, a natural problem is the
construction of a statistical representative of the population. If the
data associated with the population under study can be easily
parameterized by a flat Euclidean space, classical statistical methods
of simple averaging can be applied to generate such a representative.
The imaging data under the Gaussian assumption can be easily
represented as member of a flat space. The image can be represented
as a member of very large dimensional Euclidean space (RN, where
N is the number of voxels in the image). Alternatively, using
appropriate interpolation assumptions, the image can be assumed to
be a square integrable function, that is, a member of the (flat) Hilbert
space L2 (X), whereX is the underlaying coordinate space, usually a
compact subset of R3.
The geometric variability of the anatomy itself usually cannot
be represented by elements of a flat space. If the geometry of the
underlying anatomy can be adequately represented by a finite
number of landmarks, representative template landmark config-
uration can be estimated using the Procrustes method pioneered by
Kendall (1984) and championed by Bookstein (1991). The study of
anatomical shape is inherently related to the construction of
transformations of the underlying coordinate space that map one
anatomy to another. Various transformation groups of R3 have been
studied for understanding anatomical geometry. These groups vary
in dimensionality from simple global translations (R3) and rigid
rotations (SO(3)) to the infinite dimensional group of diffeo-
morphisms (H) (Miller et al., 2002). In this paper, we address the
problem of anatomical template construction as the joint estimation
of the most representative image and the associated anatomical
geometry given a database of brain images.
Averages in metric spaces
In this paper, the problem of building an anatomical template is
posed as a statistical estimation problem. For anatomical represen-
tations in which the underlying geometry is parameterized as a
Euclidean vector space, training data can be represented as a set of
vectors x1,: : :, xN in a vector space V.
In the small deformation elastic image mapping setting this is
assumed to be true, as the deformations are assumed to be close
enough to the identity mapping. Under this assumption the
displacement vector fields parameterizing the transformations can
be assumed to be elements of the Hilbert space of square integrable
functions L2(X).
In a vector space, with addition and scalar multiplication well
defined, an average representation of the training set can be
computed as the linear average
l ¼ 1
N
XNi ¼1
xi:
Linear averaging cannot be directly applied to the large
deformation setting as under the large deformation model the space
of transformations is not a vector space but rather the infinite
dimensional group H of diffeomorphisms of the underlying
coordinate system X.
In the group of diffeomorphisms, the addition of two diffeo-
morphisms is not generally a diffeomorphism and, hence, a
template based on linear averaging of transformations is not well
defined. In this paper, we extend the notion of averaging to general
metric spaces first proposed by Frechet (1948). For a general
metric space M, with a distance d: M � M Y R, the intrinsic mean
for a collection of data points xi can be defined as the minimizer of
the sum-of-squared distances to each of the data points. That is
l ¼ argminx a M
XNi ¼1
d x; xið Þ2:
In our previous work (Fletcher et al., 2003a,b), we have used
these concepts to extend first and second order statistical analysis
to finite dimensional Riemannian Manifolds for statistical analysis
of medial representations of objects.
In this paper, we apply this approach to the construction of large
deformation diffeomorphic templates. This work builds heavily on
the mathematical metric theory of diffeomorphisms developed by
Miller and Younes (2001).
Rigid template estimation
To exemplify the template estimation problem first, consider a
collection of N images Ii(x) of the same anatomy acquired with
unknown rigid registration. For such a collection of images, the
variability is the noise introduced by the imaging modality and the
rigid pose of the anatomy parameterized by rigid translations and
rotations ((Ti, Si) a R3 � SO(3)). The optimal template is one that
requires the dminimum amount of transformationT to each of the
anatomical images and which is most likely given the imaging
modality noise model. If the imaging modality is MRI than we can
assume an additive Gaussian noise. The template estimation
problem can then be stated as the quadratic minimization problem
II xð Þ ¼ argminI xð Þ; Ti;Sið Þ
XNi ¼1
ZX
Ii Sixþ TiÞ � I xð Þð Þð 2dx
þXNi ¼1
D Ti; Sið Þ2; ð2Þ
where D(Ti, Si) is the metric on the space of rigid transformations
from the identity transformation given by
D2 Ti; Sið Þ ¼ jjTijj2 þ jjlog Sið Þjj2:
In the above expression, the log is the matrix log which for a
rotation matrix can be easily calculated using the Rodriguez
formula. A straightforward extension of the well known Procrustes
method minimizes Eq. (2) above (Toga, 1999).

S. Joshi et al. / NeuroImage 23 (2004) S151–S160 S153
Although the above methodology has been extensively studied
for rigid transformations, the concept can be readily extended to
general transformations. Given a metric on a group of trans-
formations, the template construction problem can be stated as that
of estimating an image I that requires the minimum amount of
deformation to transform into every population image Ii. More
precisely, given a transformation group S with associated metric D:
S � S Y R, along with an image dissimilarity metric E(I1, I2), we
wish to find the image I such that
hhi; II� �
¼ argminhi a S;I
XNi ¼1
E Ii B hi; Ið Þ2 þ D e; hið Þ2 ð3Þ
where e is the identity transformation.
Large deformation diffeomorphic template estimation
Now consider a collection of N MRI images of different
anatomies acquired by the same imaging modality in rigid
registration. For such a collection of images, the variability is a
result of not only of the noise of the imaging modality but also
the inherent biological variability of the geometry of the
underlying anatomy. In sharp contrast to the above setting, to
study the geometry of the underlying anatomy, the finite
dimensional matrix group of rigid transformations must be
replaced by the infinite dimensional analogue, the group of
diffeomorphisms H.
Let X o R3 be the underlying coordinate system of the
template image. Let Xi o R3, i = 1,: : :,N be the coordinate
systems of the images Ii. The problem of estimating the most
representative template image can be stated as the estimation of
an image I, an associated independent coordinate system, which
requires the least deformation represented by diffeomorphisms
hi(x), to best match each of the input images. This framework is
depicted in Fig. 2.
We apply the theory of large deformation diffeomorphisms
(Dupuis et al., 1997; Joshi et al., 2003; Miller and Younes, 2001) to
generate deformations hi aH that are solutions to the Lagrangian
ODEs ddthi x; tð Þ = vi(hi(x, t), t), t a [0, 1]. The transformations hi
are generated by integrating velocity fields vi forward in time.
Inverse transformations hi�1 are generated by integrating the
negative velocity fields vi backward in time. The relationship
between vi and vi is simply given by vi(S, t) = �vi, (1� t). For a
single transformation, h, this relationship is shown in Fig. 1. The
location y = h(x, 1) is described in terms of the forward integration
of the velocity field v starting from the location x. Similarly, x can
be described in terms of integrating the negative velocity field v
backward in time starting at y.
We induce a metric on the space of diffeomorphisms by using a
Sobolev norm via a partial differential operator L on the velocity
Fig. 1. Velocity field integration.
field v. Let h be a diffeomorphism isotopic to the identity
transformation e. We define the squared distance D2(e, h) as
D2 e; hð Þ ¼ minv
Z 1
0
ZXjjLv x; tð Þjj2dxdt
subject to
h xð Þ ¼ xt
Z 1
0
v h x; tð Þ; tð Þdt:
The distance between any two diffeomorphisms is defined by
D h1; h2ð Þ ¼ D e; h�11 B h2
� �:
This distance satisfies all of the properties of a metric (Lorenzen
and Joshi, 2003). Namely it is nonnegative, symmetric, and
satisfies the triangle inequality. D is trivially nonnegative.
Symmetry follows from the fact that h�1 is generated by
integrating backward in time the negative of the velocity field that
generates h. Hence the minimizer is the same for both h and h�1,
implying that D(e, h) = D(e, h�1). Miller et al. (2002) give a
detailed discussion of D and show that it satisfies the triangle
inequality.
Having defined a metric on the space of diffeomorphisms, the
minimum energy template estimation problem (Eq. (3)) is
formulated as
hhi; II� �
¼ argminhi;I
XNi ¼1
E Ii B hi; Ið Þ2 þZ 1
0
ZXjjLvi x; tð Þjj2dxdt
subject tos : hi xð Þ ¼Z 1
0
vi hi x; tð Þ; tð Þdt:
ð4Þ
The above problem of estimating a template image I that is
the best representative for a population of N anatomical images
{Ii}i = 1N is depicted in Fig. 2.
Throughout this paper, we use the squared error dissimilarity
metric but other metrics such as the Kullback–Leibler divergence
can also be used (Kendall, 1984). Under the squared error
dissimilarity measure, the template estimation problem becomes
hhi; II� �
¼ argminhi;I
XNi ¼1
ZX
Ii hi xð Þð Þ � I xð Þð Þ2dx
þZ 1
0
ZXjjLvi x; tð Þjj2dxdt: ð5Þ
This minimization problem can be simplified by noticing that
for fixed transformations hi, the I that minimizes Eq. (5) is given
by
II xð Þ ¼ 1
N
XNi ¼1
Ii hi xð Þð Þ: ð6Þ
That is, I is the voxel-wise arithmetic mean of the deformed
images Ii (hi (x)). Note that the method for computing I from
{Ii} is determined by the image dissimilarity metric used. Other
image dissimilarity metrics would imply different methods for
computing I.
Combining Eqs. (5) and (6) results in
ð7Þ
hhi ¼ argminhi
XNi ¼1
ZX
Ii hi xð Þð Þ � 1
N
XNj ¼ 1
Ij hi xð Þð Þ !2
dx
þZ 1 Z
jjLvi x; tð Þjj2dxdt:
0 XNote that the solution to this minimization problem is
independent of the ordering of the N images.

Fig. 2. Template construction framework.
S. Joshi et al. / NeuroImage 23 (2004) S151–S160S154
This template construction framework produces transformations
hi such that hi :Vi Y V. Since each hi is a diffeomorphism, its
inverse hi�1 :Vi Y V exists and can be calculated by integrating the
negative velocity fields backward in time (Fig. 1). Image to image
correspondences can be computed from these transformations
using the composition rule
hhi;j ¼ hhj B hh�1i : Xi Y Xj: ð8Þ
Inverse consistent image registration
When the template construction framework presented in the
previous section is applied to two images the result is an inherently
inverse consistent image registration algorithm—no correction
penalty for consistency is required.
A registration framework is inverse consistent if image
ordering does not affect the registration result. Many image
registration algorithms are not inverse consistent because their
image dissimilarity metrics are computed in the coordinate system
of one of the images being registered. The choice of such a
reference image can bias the result of the registration. Inverse
consistent registration is desired when there is no a priori reason
to choose one image over another as a reference image. Previous
work (Guimond et al., 2000; Magnotta et al., 2003) has introduced
methods for computing approximate inverse consistent registra-
tions by applying inverse consistency constraints on intermediate
incremental transformations.
For two images I1 and I2, Eq. (7) reduces to
fhh1; hh2g ¼ argminh1h2
1
2
ZX
I1 h1 xð Þð Þ � I2 h2 xð Þð Þð Þ2dx
þZ 1
0
ZXjjLv1 x; tð Þjj2dxdt þ
Z 1
0
ZXjjLv2 x; tð Þjj2dxdt:
The transformations h1 and h2 map X to X1 and X2,
respectively. Using the composition rule (Eq. (8)), we define the
transformations h1,2: X1Y X2 = h2 B h1�1 and h2,1: V2 Y V2 = h1 B
h2�1. In other words, h1,2 is a transformation from I1 to I2 and h2,1
is a transformation from I2 to I1. This method is inverse consistent
since h1,2 B h2,1 = h2,1 B h1,2 = e, the identity transformation.
Implementation
In this paper, we present results based on a greedy fluid flow
algorithm and are currently working on implementing the full
space time optimization based on the Euler–Lagrange equations
derived by Lorenzen and Joshi (2003). Following the greedy fluid
algorithm of propagating templates described in Miller and Younes
(2001), we approximate the solution to the minimization problem
in Eq. (7) using an iterative greedy method. At each iteration k, the
updated transformation hik + 1, for each image Ii, is computed using
the update rule hik + 1 = hi
k(x + qvik(x)). hi
k and vik are the current
estimated transformation and velocity for the ith image, and e is thestep size. In other words, each final transformation hi is built up
from the composition of k transformations.
The velocity vik for each iteration k is computed as follows.
First, compute the updated template estimate
II k xð Þ ¼ 1
N
XNi ¼ 1
I ki xð Þ;
where Iik = Ii(hi
k (x)) is the ith image deformed by hik. Next, define
force functions
Fki xð Þ ¼ � I ki xð Þ � II ki xð Þ
qIki xð Þ:
This is the variation of the image dissimilarity term in Eq. (7)
with respect to hi. The velocity field vik is computed at each
iteration by applying the inverse of the differential operator L to the
force function, that is, vik(x) = L�1Fi
k(x), where L = aj2 + hjj +
g is the Navier–Stokes operator. This computation is carried out in
the Fourier domain (Joshi et al., 1997).
For each iteration the dominating computation is the Fast
Fourier Transform. Thus, the order of the algorithm is MNn log n
where M is the number of iterations, N is the number of images to
be registered, and n is the number of voxels in each image. The
complexity increases only linearly as images are added, making
the algorithm extremely scalable. Satisfactory correspondence is
typically achieved after 200 iterations. In practice, we use a multi
scale approach that initializes the fine (voxel) scale registration
with the up-sampled correspondence computed at a coarser scale
level. The finer scale levels only need to account for residue from
coarser scale levels and thus require far fewer iterations to
converge.
Driving application: autism neuroimaging study
In the following, we describe the application of the unbiased atlas
construction to an ongoing infant autism study directed by Joseph
Piven at UNC Chapel Hill. From the partnership with our Psychiatry
department, we have access to amorphologicMRI studywith a large
set of autistic children (N = 50), developmentally delayed subjects
(N = 25), and control subjects (N = 25), scanned at age two with
follow-up at age four. This project employs structural (MRI) and
functional (fMRI) neuroimaging techniques to examine the neural
basis of social cognitive, affective, and executive functioning

S. Joshi et al. / NeuroImage 23 (2004) S151–S160 S155
deficits in autism. The combined use of neuroimaging and neuro-
psychological data should further our understanding of the causes of
autism, thus assisting identification, prevention, and potentially
treatment of this disorder.
This study of early development imposes several significant
challenges to image analysis. Cross-sectional comparison between
healthy and autistic subjects at ages two and four and the study of
brain growth over the 2-year follow-up period require adequate
image analysis methods. Normative imaging data of healthy and
patient populations in this age range are not available, suggesting the
development of atlases that describe the mean and the statistical
variability in early development. We plan to build population atlases
that help us to study differences between groups and differences in
growth patterns. Methods have to cope with the relatively large
variability of head size and shape in these age groups and with
significant longitudinal changes due to growth.
Gray-level MRI data for atlas-building
The atlas building described here uses high-resolution T1-
weighted MRI with voxel size 0.781252 � 1.5 mm3. The standard
Fig. 3. Template Construction shown for five of the eight initial images. (a) Set of
between the initial images and the initial template estimate. Notice the structure of
and the final template estimate. These errors are normalized to the maximum inte
structure in the residue after the deformation. (e) Sum of squared errors as a func
segmentation pipeline of the UNC autism image analysis group
rigidly aligns the raw MR images to a Talairach coordinate space
by specifying anterior and posterior commissure (AC–PC) and the
interhemispheric plane. The transformation also interpolates the
images to a standard isotropic voxel-size of 1 � 1 � 1 mm3. We
randomly selected eight images from the total of currently over 80
cases in our database. The images were cropped for efficiency
reasons.
Construction of unbiased gray-level atlas
To evaluate the performance of this method we applied our
algorithm to a set of intensity adjusted 3D MR brain images taken
from eight different subjects. As a preprocessing step, these images
were aligned using an affine transformation. Axial slices from five
of these eight initial images are shown in the first column of Fig. 3.
There is noticeable large deformation variation between these
anatomies, especially around the ventricles. The second column of
Fig. 3 shows the deformed (3D) images after 500 iterations of our
algorithm. The deformed images look very similar, as they have
been deformed into the common coordinate space of the evolving
initial images. (b) Deformed images after 500 iterations. (c) Absolute error
the residual error around the ventricles and the cortex, the deformed images,
nsity range to show the locations of the residual errors. Notice the lack of
tion of the number of iterations.
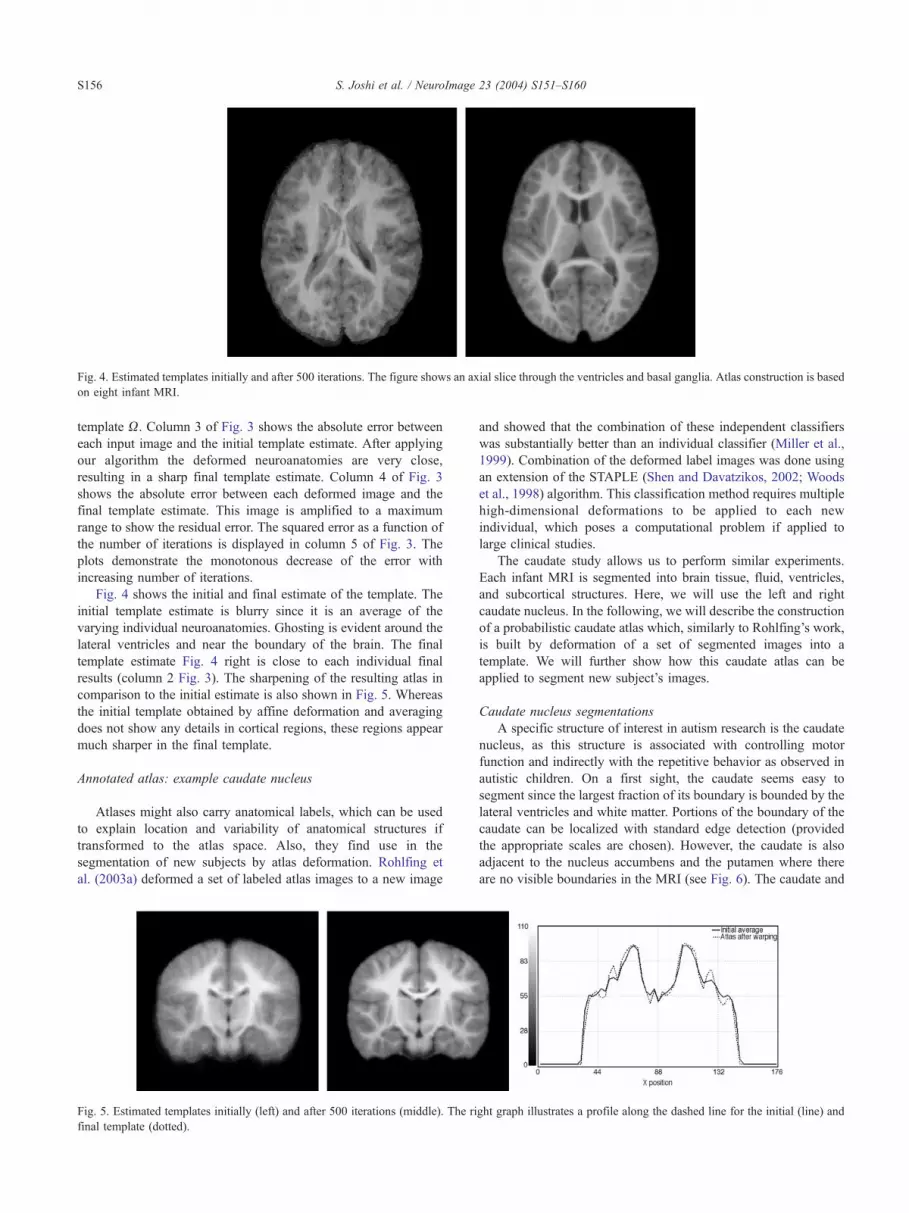
Fig. 4. Estimated templates initially and after 500 iterations. The figure shows an axial slice through the ventricles and basal ganglia. Atlas construction is based
on eight infant MRI.
S. Joshi et al. / NeuroImage 23 (2004) S151–S160S156
template X. Column 3 of Fig. 3 shows the absolute error between
each input image and the initial template estimate. After applying
our algorithm the deformed neuroanatomies are very close,
resulting in a sharp final template estimate. Column 4 of Fig. 3
shows the absolute error between each deformed image and the
final template estimate. This image is amplified to a maximum
range to show the residual error. The squared error as a function of
the number of iterations is displayed in column 5 of Fig. 3. The
plots demonstrate the monotonous decrease of the error with
increasing number of iterations.
Fig. 4 shows the initial and final estimate of the template. The
initial template estimate is blurry since it is an average of the
varying individual neuroanatomies. Ghosting is evident around the
lateral ventricles and near the boundary of the brain. The final
template estimate Fig. 4 right is close to each individual final
results (column 2 Fig. 3). The sharpening of the resulting atlas in
comparison to the initial estimate is also shown in Fig. 5. Whereas
the initial template obtained by affine deformation and averaging
does not show any details in cortical regions, these regions appear
much sharper in the final template.
Annotated atlas: example caudate nucleus
Atlases might also carry anatomical labels, which can be used
to explain location and variability of anatomical structures if
transformed to the atlas space. Also, they find use in the
segmentation of new subjects by atlas deformation. Rohlfing et
al. (2003a) deformed a set of labeled atlas images to a new image
Fig. 5. Estimated templates initially (left) and after 500 iterations (middle). The ri
final template (dotted).
and showed that the combination of these independent classifiers
was substantially better than an individual classifier (Miller et al.,
1999). Combination of the deformed label images was done using
an extension of the STAPLE (Shen and Davatzikos, 2002; Woods
et al., 1998) algorithm. This classification method requires multiple
high-dimensional deformations to be applied to each new
individual, which poses a computational problem if applied to
large clinical studies.
The caudate study allows us to perform similar experiments.
Each infant MRI is segmented into brain tissue, fluid, ventricles,
and subcortical structures. Here, we will use the left and right
caudate nucleus. In the following, we will describe the construction
of a probabilistic caudate atlas which, similarly to Rohlfing’s work,
is built by deformation of a set of segmented images into a
template. We will further show how this caudate atlas can be
applied to segment new subject’s images.
Caudate nucleus segmentations
A specific structure of interest in autism research is the caudate
nucleus, as this structure is associated with controlling motor
function and indirectly with the repetitive behavior as observed in
autistic children. On a first sight, the caudate seems easy to
segment since the largest fraction of its boundary is bounded by the
lateral ventricles and white matter. Portions of the boundary of the
caudate can be localized with standard edge detection (provided
the appropriate scales are chosen). However, the caudate is also
adjacent to the nucleus accumbens and the putamen where there
are no visible boundaries in the MRI (see Fig. 6). The caudate and
ght graph illustrates a profile along the dashed line for the initial (line) and

Fig. 6. Two and three-dimensional views of the caudate nucleus. Coronal slice of the caudate: original T1-weighted MRI (left), and overlay of
segmented structures (middle). Right and left caudate are shown shaded in green and red; left and right putamen are sketched in yellow, laterally exterior
to the caudates. The nucleus accumbens is sketched in red outline. Note the lack of contrast at the boundary between the caudate and the nucleus
accumbens, and the fine-scale cell bridges between the caudate and the putamen. At right is a 3D view of the caudate and putamen relative to the lateral
ventricles.
S. Joshi et al. / NeuroImage 23 (2004) S151–S160 S157
nucleus accumbens are distinguishable on histological slides, but
not on MRI of this resolution. Another btroublespotQ for the
caudate is where it borders the putamen; there are bfingersQ of cellbridges, which span the gap between the two. We have developed a
highly reliable manually assisted caudate segmentation using
SNAP, a tool based on 3D geodesic snakes (He Jianchun and
Christensen, 2003). This tool reduced segmentation from about 2 h
to approximately 10 min, still including manual experts’ definition
of nucleus accumbens and putamen boundaries.
Here, we used the caudate segmentations of the eight cases
selected for atlas building to construct a probabilistic caudate atlas.
Further, we selected five new cases from our database which are
not part of these eight images for testing caudate segmentation by
atlas deformation. These five cases were taken from the reliability
test series, with the advantage that we have six manual
segmentations (two raters with three segmentations each) for each
case, which represent a probabilistic gold standard.
Probabilistic caudate template using voxel voting
The caudate segmentations of the eight atlas images were
transformed into the atlas space by applying the individual
deformations obtained during atlas building. The set of deformed
caudate segmentations can be used to build a probabilistic caudate
atlas. The segmentations were combined by a voxel-wise voting
scheme counting the number of segmentations at each voxel.
Normalization by the number of images finally results in a
probabilistic caudate template. This segmentation template can be
seen as a level set within the range [0: : :1] where the level 0.5 definesthe average shape. Fig. 7 left illustrates a sagittal cut and the
corresponding 3D surface of the average shape.
Probabilistic caudate template using STAPLE
Zou et al. (2003) developed an algorithm to calculate the
composite gold standard estimate from multiple manual segmen-
Fig. 7. Probabilistic caudate atlas. The manual segmentations of the eight images
obtained during atlas building. (a) The eight deformed segmentations are superimp
The STAPLE algorithm is applied to represent a probabilistic best estimate (gold
probabilistic images and 3D surfaces of the average structure (probability 0.5).
tations (Shen and Davatzikos, 2002). The Simultaneous Truth and
Performance Level Estimation (STAPLE) method is based on an
expectation maximization (EM) algorithm. Given a set of binary
segmentations of the same object, STAPLE calculates the
maximum likelihood estimate of the composite bgold standardQor the best estimate of the unknown gold standard. The algorithm
calculates the specificity and sensitivity of each segmentation in
an iterative way. The major difference over voxel-wise voting is
its ability to assign weights for each individual segmentation
proportional to the performance, that is, segmentations which are
closer to the estimated gold standard get larger weights. The
STAPLE algorithm is applied to the set of eight segmented left
and right caudates after they were deformed to the atlas. It is
important to notice that we limited the STAPLE calculations to
disputed voxels only, so that regions with only background and
agreement within regions were not taken into account. Fig. 7,
right, illustrates a sagittal cut and the corresponding 3D average
object.
Segmentation of new unknown subjects
The combined unbiased MRI and caudate atlases can be
used to segment new subjects by atlas deformation. The use
of the unbiased atlas constructed from a representative set of
images eliminates the need to deform and combine multiple
labeled atlases. The MRI atlas is deformed using fluid
deformation. The same transformation is then applied to the
caudate template to transfer the probabilistic caudate to the
new image. Fig. 8 illustrates manual segmentation and
segmentation by deformation–segmentation. The comparison
demonstrates the potential of this segmentation technique not
only to segment well-visible boundaries but also transition
regions (e.g., like nucleus accumbens) which can only be
segmented in the anatomical context of embedding neighboring
structures.
used for atlas building are deformed using the individual deformation fields
osed by voxel-voting and normalized to form a caudate probability map. (b)
standard) of the true structure. The images show sagittal slices through this
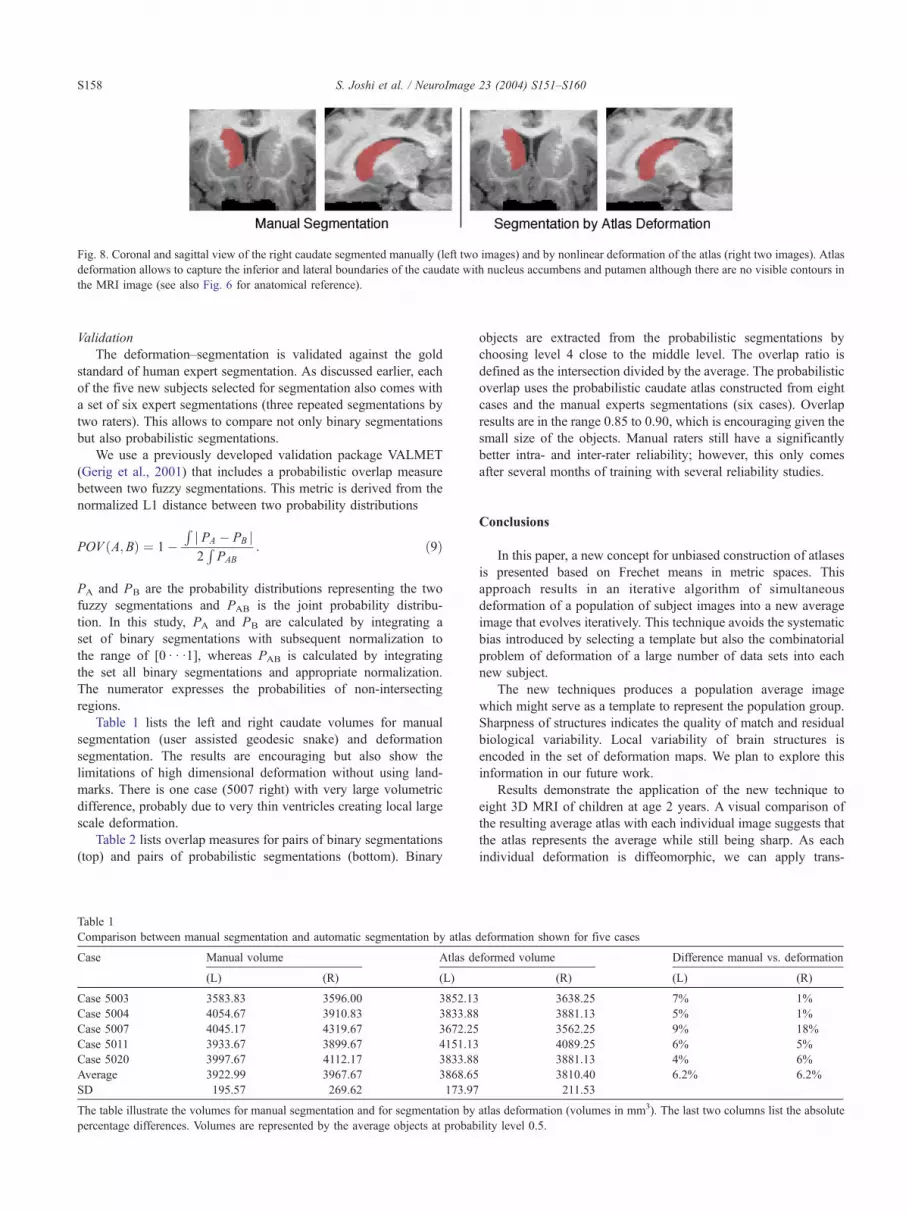
Fig. 8. Coronal and sagittal view of the right caudate segmented manually (left two images) and by nonlinear deformation of the atlas (right two images). Atlas
deformation allows to capture the inferior and lateral boundaries of the caudate with nucleus accumbens and putamen although there are no visible contours in
the MRI image (see also Fig. 6 for anatomical reference).
S. Joshi et al. / NeuroImage 23 (2004) S151–S160S158
Validation
The deformation–segmentation is validated against the gold
standard of human expert segmentation. As discussed earlier, each
of the five new subjects selected for segmentation also comes with
a set of six expert segmentations (three repeated segmentations by
two raters). This allows to compare not only binary segmentations
but also probabilistic segmentations.
We use a previously developed validation package VALMET
(Gerig et al., 2001) that includes a probabilistic overlap measure
between two fuzzy segmentations. This metric is derived from the
normalized L1 distance between two probability distributions
POV A;Bð Þ ¼ 1�Rj PA � PB j2RPAB
: ð9Þ
PA and PB are the probability distributions representing the two
fuzzy segmentations and PAB is the joint probability distribu-
tion. In this study, PA and PB are calculated by integrating a
set of binary segmentations with subsequent normalization to
the range of [0 : : :1], whereas PAB is calculated by integrating
the set all binary segmentations and appropriate normalization.
The numerator expresses the probabilities of non-intersecting
regions.
Table 1 lists the left and right caudate volumes for manual
segmentation (user assisted geodesic snake) and deformation
segmentation. The results are encouraging but also show the
limitations of high dimensional deformation without using land-
marks. There is one case (5007 right) with very large volumetric
difference, probably due to very thin ventricles creating local large
scale deformation.
Table 2 lists overlap measures for pairs of binary segmentations
(top) and pairs of probabilistic segmentations (bottom). Binary
Table 1
Comparison between manual segmentation and automatic segmentation by atlas
Case Manual volume Atlas de
(L) (R) (L)
Case 5003 3583.83 3596.00 3852.13
Case 5004 4054.67 3910.83 3833.88
Case 5007 4045.17 4319.67 3672.25
Case 5011 3933.67 3899.67 4151.13
Case 5020 3997.67 4112.17 3833.88
Average 3922.99 3967.67 3868.65
SD 195.57 269.62 173.97
The table illustrate the volumes for manual segmentation and for segmentation by
percentage differences. Volumes are represented by the average objects at probab
objects are extracted from the probabilistic segmentations by
choosing level 4 close to the middle level. The overlap ratio is
defined as the intersection divided by the average. The probabilistic
overlap uses the probabilistic caudate atlas constructed from eight
cases and the manual experts segmentations (six cases). Overlap
results are in the range 0.85 to 0.90, which is encouraging given the
small size of the objects. Manual raters still have a significantly
better intra- and inter-rater reliability; however, this only comes
after several months of training with several reliability studies.
Conclusions
In this paper, a new concept for unbiased construction of atlases
is presented based on Frechet means in metric spaces. This
approach results in an iterative algorithm of simultaneous
deformation of a population of subject images into a new average
image that evolves iteratively. This technique avoids the systematic
bias introduced by selecting a template but also the combinatorial
problem of deformation of a large number of data sets into each
new subject.
The new techniques produces a population average image
which might serve as a template to represent the population group.
Sharpness of structures indicates the quality of match and residual
biological variability. Local variability of brain structures is
encoded in the set of deformation maps. We plan to explore this
information in our future work.
Results demonstrate the application of the new technique to
eight 3D MRI of children at age 2 years. A visual comparison of
the resulting average atlas with each individual image suggests that
the atlas represents the average while still being sharp. As each
individual deformation is diffeomorphic, we can apply trans-
deformation shown for five cases
formed volume Difference manual vs. deformation
(R) (L) (R)
3638.25 7% 1%
3881.13 5% 1%
3562.25 9% 18%
4089.25 6% 5%
3881.13 4% 6%
3810.40 6.2% 6.2%
211.53
atlas deformation (volumes in mm3). The last two columns list the absolute
ility level 0.5.
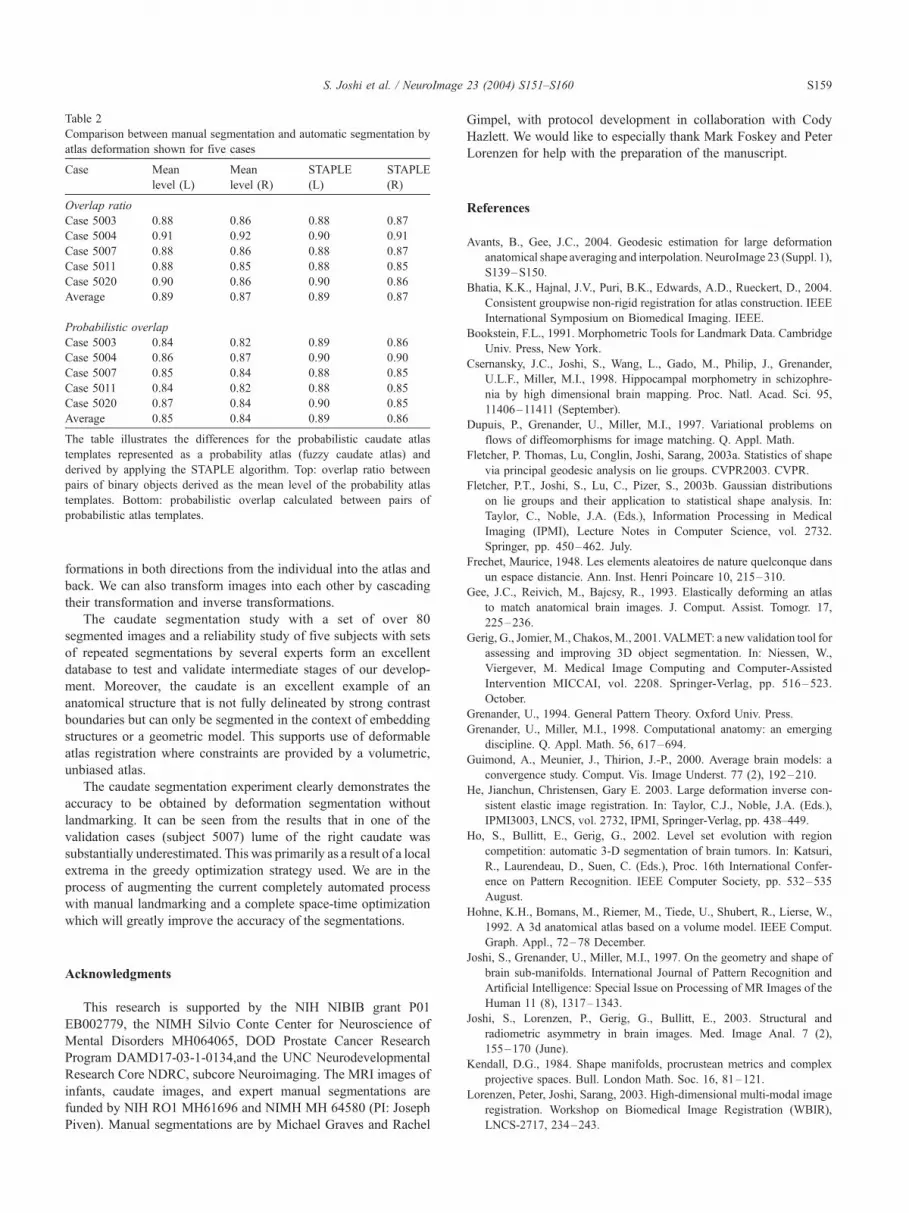
Table 2
Comparison between manual segmentation and automatic segmentation by
atlas deformation shown for five cases
Case Mean
level (L)
Mean
level (R)
STAPLE
(L)
STAPLE
(R)
Overlap ratio
Case 5003 0.88 0.86 0.88 0.87
Case 5004 0.91 0.92 0.90 0.91
Case 5007 0.88 0.86 0.88 0.87
Case 5011 0.88 0.85 0.88 0.85
Case 5020 0.90 0.86 0.90 0.86
Average 0.89 0.87 0.89 0.87
Probabilistic overlap
Case 5003 0.84 0.82 0.89 0.86
Case 5004 0.86 0.87 0.90 0.90
Case 5007 0.85 0.84 0.88 0.85
Case 5011 0.84 0.82 0.88 0.85
Case 5020 0.87 0.84 0.90 0.85
Average 0.85 0.84 0.89 0.86
The table illustrates the differences for the probabilistic caudate atlas
templates represented as a probability atlas (fuzzy caudate atlas) and
derived by applying the STAPLE algorithm. Top: overlap ratio between
pairs of binary objects derived as the mean level of the probability atlas
templates. Bottom: probabilistic overlap calculated between pairs of
probabilistic atlas templates.
S. Joshi et al. / NeuroImage 23 (2004) S151–S160 S159
formations in both directions from the individual into the atlas and
back. We can also transform images into each other by cascading
their transformation and inverse transformations.
The caudate segmentation study with a set of over 80
segmented images and a reliability study of five subjects with sets
of repeated segmentations by several experts form an excellent
database to test and validate intermediate stages of our develop-
ment. Moreover, the caudate is an excellent example of an
anatomical structure that is not fully delineated by strong contrast
boundaries but can only be segmented in the context of embedding
structures or a geometric model. This supports use of deformable
atlas registration where constraints are provided by a volumetric,
unbiased atlas.
The caudate segmentation experiment clearly demonstrates the
accuracy to be obtained by deformation segmentation without
landmarking. It can be seen from the results that in one of the
validation cases (subject 5007) lume of the right caudate was
substantially underestimated. This was primarily as a result of a local
extrema in the greedy optimization strategy used. We are in the
process of augmenting the current completely automated process
with manual landmarking and a complete space-time optimization
which will greatly improve the accuracy of the segmentations.
Acknowledgments
This research is supported by the NIH NIBIB grant P01
EB002779, the NIMH Silvio Conte Center for Neuroscience of
Mental Disorders MH064065, DOD Prostate Cancer Research
Program DAMD17-03-1-0134,and the UNC Neurodevelopmental
Research Core NDRC, subcore Neuroimaging. The MRI images of
infants, caudate images, and expert manual segmentations are
funded by NIH RO1 MH61696 and NIMH MH 64580 (PI: Joseph
Piven). Manual segmentations are by Michael Graves and Rachel
Gimpel, with protocol development in collaboration with Cody
Hazlett. We would like to especially thank Mark Foskey and Peter
Lorenzen for help with the preparation of the manuscript.
References
Avants, B., Gee, J.C., 2004. Geodesic estimation for large deformation
anatomical shape averaging and interpolation. NeuroImage 23 (Suppl. 1),
S139–S150.
Bhatia, K.K., Hajnal, J.V., Puri, B.K., Edwards, A.D., Rueckert, D., 2004.
Consistent groupwise non-rigid registration for atlas construction. IEEE
International Symposium on Biomedical Imaging. IEEE.
Bookstein, F.L., 1991. Morphometric Tools for Landmark Data. Cambridge
Univ. Press, New York.
Csernansky, J.C., Joshi, S., Wang, L., Gado, M., Philip, J., Grenander,
U.L.F., Miller, M.I., 1998. Hippocampal morphometry in schizophre-
nia by high dimensional brain mapping. Proc. Natl. Acad. Sci. 95,
11406–11411 (September).
Dupuis, P., Grenander, U., Miller, M.I., 1997. Variational problems on
flows of diffeomorphisms for image matching. Q. Appl. Math.
Fletcher, P. Thomas, Lu, Conglin, Joshi, Sarang, 2003a. Statistics of shape
via principal geodesic analysis on lie groups. CVPR2003. CVPR.
Fletcher, P.T., Joshi, S., Lu, C., Pizer, S., 2003b. Gaussian distributions
on lie groups and their application to statistical shape analysis. In:
Taylor, C., Noble, J.A. (Eds.), Information Processing in Medical
Imaging (IPMI), Lecture Notes in Computer Science, vol. 2732.
Springer, pp. 450–462. July.
Frechet, Maurice, 1948. Les elements aleatoires de nature quelconque dans
un espace distancie. Ann. Inst. Henri Poincare 10, 215–310.
Gee, J.C., Reivich, M., Bajcsy, R., 1993. Elastically deforming an atlas
to match anatomical brain images. J. Comput. Assist. Tomogr. 17,
225–236.
Gerig, G., Jomier, M., Chakos,M., 2001. VALMET: a new validation tool for
assessing and improving 3D object segmentation. In: Niessen, W.,
Viergever, M. Medical Image Computing and Computer-Assisted
Intervention MICCAI, vol. 2208. Springer-Verlag, pp. 516–523.
October.
Grenander, U., 1994. General Pattern Theory. Oxford Univ. Press.
Grenander, U., Miller, M.I., 1998. Computational anatomy: an emerging
discipline. Q. Appl. Math. 56, 617–694.
Guimond, A., Meunier, J., Thirion, J.-P., 2000. Average brain models: a
convergence study. Comput. Vis. Image Underst. 77 (2), 192–210.
He, Jianchun, Christensen, Gary E. 2003. Large deformation inverse con-
sistent elastic image registration. In: Taylor, C.J., Noble, J.A. (Eds.),
IPMI3003, LNCS, vol. 2732, IPMI, Springer-Verlag, pp. 438–449.
Ho, S., Bullitt, E., Gerig, G., 2002. Level set evolution with region
competition: automatic 3-D segmentation of brain tumors. In: Katsuri,
R., Laurendeau, D., Suen, C. (Eds.), Proc. 16th International Confer-
ence on Pattern Recognition. IEEE Computer Society, pp. 532–535
August.
Hohne, K.H., Bomans, M., Riemer, M., Tiede, U., Shubert, R., Lierse, W.,
1992. A 3d anatomical atlas based on a volume model. IEEE Comput.
Graph. Appl., 72–78 December.
Joshi, S., Grenander, U., Miller, M.I., 1997. On the geometry and shape of
brain sub-manifolds. International Journal of Pattern Recognition and
Artificial Intelligence: Special Issue on Processing of MR Images of the
Human 11 (8), 1317–1343.
Joshi, S., Lorenzen, P., Gerig, G., Bullitt, E., 2003. Structural and
radiometric asymmetry in brain images. Med. Image Anal. 7 (2),
155–170 (June).
Kendall, D.G., 1984. Shape manifolds, procrustean metrics and complex
projective spaces. Bull. London Math. Soc. 16, 81–121.
Lorenzen, Peter, Joshi, Sarang, 2003. High-dimensional multi-modal image
registration. Workshop on Biomedical Image Registration (WBIR),
LNCS-2717, 234–243.

S. Joshi et al. / NeuroImage 23 (2004) S151–S160S160
Magnotta, V.A., Bockholt, H.J., Johnson, H.F., Christensen, G.E., Andrea-
sen, N.C., 2003. Subcortical, cerebellar, and magnetic resonance based
consistent brain image registration. NeuroImage 19, 233–245 (June).
Miller, M.I., Younes, L., 2001. Group actions, homeomorphisms, and
matching: a general framework. Int. J. Comput. Vis. 41, 61–84 (January).
Miller, Michael I., Joshi, Sarang C., Christensen, Gary E., 1999. Large
deformation fluid diffeomorphisms for landmark and image match-
ing. In: Toga, Arthur W. (Ed.), Brain Warping, chapter 7. Academic
Press.
Miller, M.I., Trouve, A., Younes, L., 2002. On the metrics and
eulerlagrange equations of computational anatomy. Annu. Rev. Biomed.
Eng. 4, 375–405.
Rohlfing, Torstens, Russakoff, Daniel B., Maurer, Calvin R., 2003a.
Expectation maximization strategies for multi-atlas multi-label seg-
mentation. In: Taylor, Ch., Noble, A. (Eds.), Proceedings of
Information Processing in Medical Imaging IPMI, volume 2732 of
Lecture Notes in Computer Science LNCS. Springer-Verlag, Berlin,
pp. 210–221.
Rohlfing, Torstens, Russakoff, Daniel B., Maurer, Calvin R., 2003b.
Extraction and application of expert priors to combine multiple
segmentations of human brain tissue. In: Ellis, R.E., Peters, T.M.
(Eds.), Proceedings Medical Image Computing and Computer Assisted
Intervention MICCAI, volume 2879 of Lecture Notes in Computer
Science LNCS. Springer-Verlag Berlin, pp. 578–585.
Shen, Dinggang, Davatzikos, Christos, 2002. Hammer: hierarchical
attribute matching mechanism for elastic registration. IEEE Trans.
Med. Imaging 21 (11), 1421–1439 (November).
Talairach, J., Tournoux, P., 1988. Co-Planar Stereotaxis Atlas of the Human
Brain. Thieme Medical Publishers.
Thompson, Paul M., Toga, Arthur W., 1997. Detection, visualization and
animation of abnormal anatomic structure with a deformable proba-
bilistic brain atlas based on random vector field transformations. Med.
Image Anal. 1, 271–294.
Thompson, Paul M., Toga, Arthur W., 2002. A framework for computa-
tional anatomy. Comput. Vis. Sci. 5, 13–34.
Toga, A.W., 1999. Brain Warping. Academic Press.
Warfield, S.K., Zou, K.H., Wells III, W.M., 2002. Validation of image
segmentation and expert quality with an expectation-maximization
algorithm. In: Dohi, T., Kikinis, R. (Eds.), Medical Image Computing
and Computer Assisted Interventions, number 2488 in Lecture Notes in
Computer Science LNCS. Springer, pp. 298–306 September.
Woods, R.P., Grafton, S.T., Watson, J.D.G., Sicotte, N.L., Toga, A.W.,
Mazziotta, J.C., 1998. Automated image registration: ii. Intersubject
validation of linear and nonlinear models. J. Comput. Assist. Tomogr.
22, 155–165 (August).
Zou, K.H., Warfield, S.K., Fielding, J.R., Tempany, C.M.C., Wells, W.M.,
Kaus, M.R., Jolesh, F.A., Kikinis, R., 2003. Statistical validation
based on parametric receiver operating characteristic analysis of
continuous classification data. Acad. Radiol. 10 (12), 1359–1368
December.
Related Documents


![Deep Diffeomorphic Transformer Networks...curacy [25,42] or maintained the same performance level Original Accuracy: 0.78 Diffeomorphic Accuracy: 0.87 Affine Accuracy: 0.84 Affine+Diffeomorphic](https://static.cupdf.com/doc/110x72/610d8e4f8e38aa26d70e5239/deep-diffeomorphic-transformer-networks-curacy-2542-or-maintained-the-same.jpg)