20 14 report deep decarbonization pathways to Mexico Chapter

UN SDSN Deep Decarbonization Report 2014 Mexico_chapter
Feb 23, 2017
Welcome message from author
This document is posted to help you gain knowledge. Please leave a comment to let me know what you think about it! Share it to your friends and learn new things together.
Transcript

2014 report
deep decarbonizationpathways to
2014 report
deep decarbonizationpathways to
Mexico Chapter
Pathways to deep decarbonization � 2014 report 2
IDDRIThe Institute for Sustainable Development and International Relations (IDDRI) is a non-profit policy research institute based in Paris. Its objective is to determine and share the keys for analyzing and understanding strategic issues linked to sustainable development from a global perspective. IDDRI helps stakeholders in deliberating on global governance of the major issues of common interest: action to attenuate climate change, to protect biodiversity, to enhance food security and to manage urbanization, and also takes part in efforts to reframe development pathways.
SDSNSustainable Development Solutions Network (SDSN) mobilizes scientific and tech-nical expertise from academia, civil society, and the private sector in support of sustainable development problem solving at local, national, and global scales. SDSN aims to accelerate joint learning and help to overcome the compartmentalization of technical and policy work by promoting integrated approaches to the interconnected economic, social, and environmental challenges confronting the world.
Disclaimer
The 2014 DDPP report was written by a group of independent experts acting in their personal capacities and who have not been nominated by their respective governments. Any views expressed in this report do not necessarily reflect the views of any government or organization, agency or programme of the United Nations.
Published by Sustainable Development Solutions Network (SDSN) and Institute for Sustainable Development and International Relations (IDDRI), september 2014
The full report is available at deepdecarbonization.org.
Copyright © SDSN & IDDRI 2014
Publishers : Jeffrey Sachs, Laurence TubianaManaging editors : Emmanuel Guérin, Carl Mas, Henri Waisman Editing & copy editing : Claire Bulger, Elana Sulakshana, Kathy ZhangEditorial support : Pierre Barthélemy, Léna SpinazzéLayout and figures : Ivan Pharabod
1 Pathways to deep decarbonization � 2014 report
Preface
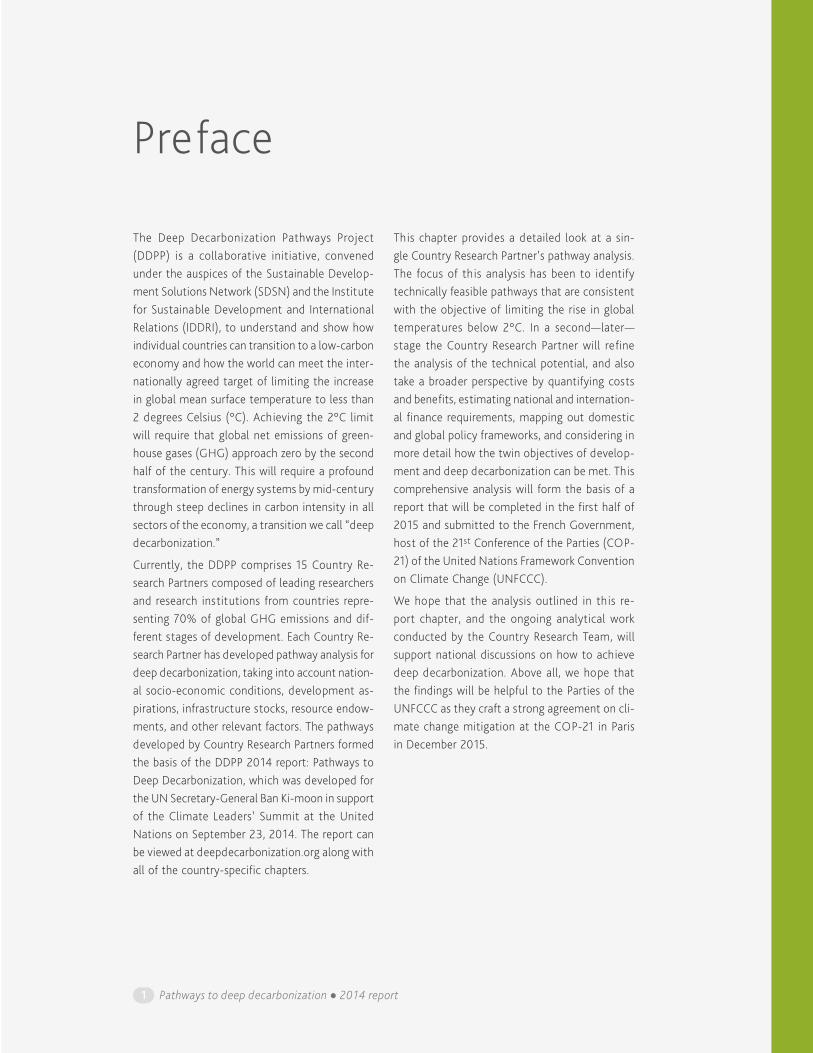
The Deep Decarbonization Pathways Project (DDPP) is a collaborative initiative, convened under the auspices of the Sustainable Develop-ment Solutions Network (SDSN) and the Institute for Sustainable Development and International Relations (IDDRI), to understand and show how individual countries can transition to a low-carbon economy and how the world can meet the inter-nationally agreed target of limiting the increase in global mean surface temperature to less than 2 degrees Celsius (°C). Achieving the 2°C limit will require that global net emissions of green-house gases (GHG) approach zero by the second half of the century. This will require a profound transformation of energy systems by mid-century through steep declines in carbon intensity in all sectors of the economy, a transition we call “deep decarbonization.”
Currently, the DDPP comprises 15 Country Re-search Partners composed of leading researchers and research institutions from countries repre-senting 70% of global GHG emissions and dif-ferent stages of development. Each Country Re-search Partner has developed pathway analysis for deep decarbonization, taking into account nation-al socio-economic conditions, development as-pirations, infrastructure stocks, resource endow-ments, and other relevant factors. The pathways developed by Country Research Partners formed the basis of the DDPP 2014 report: Pathways to Deep Decarbonization, which was developed for the UN Secretary-General Ban Ki-moon in support of the Climate Leaders’ Summit at the United Nations on September 23, 2014. The report can be viewed at deepdecarbonization.org along with all of the country-specific chapters.
This chapter provides a detailed look at a sin-gle Country Research Partner’s pathway analysis. The focus of this analysis has been to identify technically feasible pathways that are consistent with the objective of limiting the rise in global temperatures below 2°C. In a second—later—stage the Country Research Partner will refine the analysis of the technical potential, and also take a broader perspective by quantifying costs and benefits, estimating national and internation-al finance requirements, mapping out domestic and global policy frameworks, and considering in more detail how the twin objectives of develop-ment and deep decarbonization can be met. This comprehensive analysis will form the basis of a report that will be completed in the first half of 2015 and submitted to the French Government, host of the 21st Conference of the Parties (COP-21) of the United Nations Framework Convention on Climate Change (UNFCCC).
We hope that the analysis outlined in this re-port chapter, and the ongoing analytical work conducted by the Country Research Team, will support national discussions on how to achieve deep decarbonization. Above all, we hope that the findings will be helpful to the Parties of the UNFCCC as they craft a strong agreement on cli-mate change mitigation at the COP-21 in Paris in December 2015.
Pathways to deep decarbonization � 2014 report 2
1. Country profile 3
1.1. The national context for deep decarbonization and sustainable development 3
1.2. GHG emissions: current levels, drivers, and past trends 4
2. National deep decarbonization pathways 4
2.1. Illustrative deep decarbonization pathway 4
2.1.1. High-level characterization 4
2.1.2. Sectoral characterization 7
2.2. Assumptions 9
2.3. Alternative pathways and pathway robustness 10
2.4. Additional measures and deeper pathways 10
2.5. Challenges, opportunities and enabling conditions 10
2.6. Near-term priorities 10
Contents
Preface 1
Pathways to deep decarbonization � 2014 report 3
Mexico
Daniel Buira, Instituto Nacional de Ecología
y Cambio Climático
Jorge Tovilla, Independent Consultant
1Country profile
1.1 The national context for deep decarbonization and sustainable developmentGHG emissions in Mexico are rising due to an increasing use of fossil fuels. As the population slowly stabilizes (projected to be 151 million by 2050)1 and continued economic growth is expected, it is crucial to design a deep decarbonization strategy before new infrastructure is built. Many actions to mitigate climate change have valuable co-benefits (local health improvement, economic savings, and greater productivity, among others), and some are also linked to poverty reduction and social inclusion (for example food and energy security).Proven reserves of oil in Mexico are estimated to be around 1,340 million tons of oil equivalent (toe), while gas reserves represent an additional 430 million toe.2 The national energy reform approved recently is expected to boost investments in oil and gas production. Electricity generation is mainly produced from natural gas (50%), oil (11%), hydro (15%), and coal (13%); energy-intensive industry accounts for 13% of GDP.Urban population reached 72% in 2010, and it is expected to be close to 83% by 2030. Around 98% of households have access to electricity to date, and there are 210 vehicles per 1,000 people. In some rural areas, wood is still used as the main fuel for heating and cooking.
1
1 Comisión Nacional de Población (CONAPO), at: http://www.conapo.gob.mx
2 Data reported for January 2014. SENER, 2014, at: http://egob2.energia.gob.mx/SNIH/Reportes/ Portal.swf?ProgGuid=FCAF8F9D-21D6-4661-98B5-55D84B9C1D85
Mexico
Mexico Mexico
Pathways to deep decarbonization � 2014 report 4
The majority of future economic growth is ex-pected to be driven by tertiary activities (services), which could account for nearly 70% of national GDP by 2050; in 2010 they represented around 62% of the total GDP. As this sector is less inten-sive both in energy and in CO2 than other eco-nomic activities in Mexico, this shift is expected to decrease GHG emissions.As GDP per capita increases, medium-sized cities are expected to grow. Historic trends show that urban centers expand in patterns that increase energy consumption and land use change. Smart urban development has been identified as a key way to transition towards more efficient and sus-tainable green growth schemes in Mexico.
1.2 GHG emissions: current levels, drivers, and past trends
Total G HG emiss ions in Mexico reached 748 MtCO2e in 2010.3 The largest source of emissions is the combus tion of fossil fuels (56%), and the greatest contributors to th is
category are the transport sector and electricity generation (Figure 1). Historically, GHG emissions in Mexico have been driven by increases in both population and in GDP per capita (Figure 2a).4 Energy use per capita has increased as well, at an average rate of about 1% per year between 1995 and 2010. Total energy consumption reached around 176 million toe in 2010, including all consumption by final users (transport, industry, buildings), energy industries, and transmission losses.5 The distri-bution of final energy use was spread over the following fuels: gasoline (32%), electricity (16%), diesel (16%), natural gas (11%), LPG (10%), and wood (5%). Approximately 30% of all energy use is dedicated to transportation, and close to 70% of that energy is consumed by passenger transport alone. This trend reflects the increase in vehicle ownership, which doubled from 2000 to 2010 to approximately 207 vehicles per thousand people. This increased ownership and use has caused GHG emissions from the transport sector to increase at an annual rate of 3.2% between 1990 and 2010.
2National deep decarbonization pathways
2.1 Illustrative deep decarbonization pathway
2.1.1 High-level characterization
The illustrative deep decarbonization scenario de-scribed in this report has been devised to achieve reductions of CO2 emissions as a result of changes in energy use and production towards less emis-
sion-intensive alternatives. As shown in Table 1, this analysis assumes a GDP growth rate of 3% every year,6 from around 950 billion USD (at 2008 prices) in 2010 to some 3,100 billion USD in 2050.GDP per capita would reach $20,425 USD/person by 2050. Much of projected reduction in CO2 emissions across sectors relies on reducing the carbon in-tensity of electricity generation coupled with a
2
3 Inventario Nacional de Emisiones de Gases de Efecto Invernadero 1990-2010, INECC-SEMARNAT, 2013.4 GDP increased 28% from 1995 to 2000 causing final energy per dollar of GDP to decrease noticeably in the same
period. The significant increase in GDP reflects a recovery from the economic crisis of 1995, so only a limited amount of information can be gained from an examination of the 1995 to 2000 time period.
5 Balance Nacional de Energía, Sistema de Información Energética, SENER, 2014.6 In this study we assume 3% annual growth as illustrative of long-term sustained growth. Official estimates for an-
nual GDP growth in 2014 have been recently adjusted from 3.1% to 2.8% (Banco de México, communiqué: http://www.banxico.org.mx/informacion-para-la-prensa/comunicados/resultados-de-encuestas/expectativas-de-los-espe-cialistas/%7BB22F53FD-4129-ECE1-85E3-BCA42D652B16%7D.pdf).

Mexico
5 Pathways to deep decarbonization � 2014 report
switch from the combustion of fossil fuels to use of electricity in those final uses of energy where it is possible to do so. Although some assumptions
were made regarding the future energy consump-tion of some appliances, the deep decarbonization scenario modeled does not include the effects of
0
50
100
150
200
250 MtCO2
Agriculture
Waste
LULUCF
Processes
Coal
Natural Gas
Petroleum Products
Total MtCO2
Electricity(Allocationby End Use Sector)
Figure 1. Decomposition of GHG and Energy CO2 Emissions in 2010
1a. GHG emissions, by source 1b. Energy-related CO2 emissions by fuel and sectors
Electricity Generation
Industry
Transportation
Buildings
Other
44
Fugitive83
92
61
MtCO2 eq
748
(Land Use, Land Use Change, and Forestry)
Energy-relatedemissions
162 56 153 33 0
+ 47
421
246
126
33
405
100
0
200
300
400
500 MtCO2
0%
-10%
-20%
-30%
10%
20%
30%
2b. Energy-related CO2 emissions by sectors2a. Energy-related CO2 emissions drivers
Figure 2. Decomposition of historical energy-related CO2 Emissions, 1990 to 2010
Population
GDP per capita
Energy per GDP
Energy Related CO2 Emissionsper Energy
19951990
20001995
20052000
20102005 1990 1995 2000 2005 2010
Electricity Generation
Industry
Transportation
Buildings
295342
373405
269
Five-year variation rate of the drivers
Table 1. Development Indicators and Energy Service Demand Drivers
2010 2020 2030 2040 2050
Population [Millions] 113 127 137 145 151GDP per capita [$/capita] 8,339 9,987 12,407 15,764 20,425
Mexico
Pathways to deep decarbonization � 2014 report 6
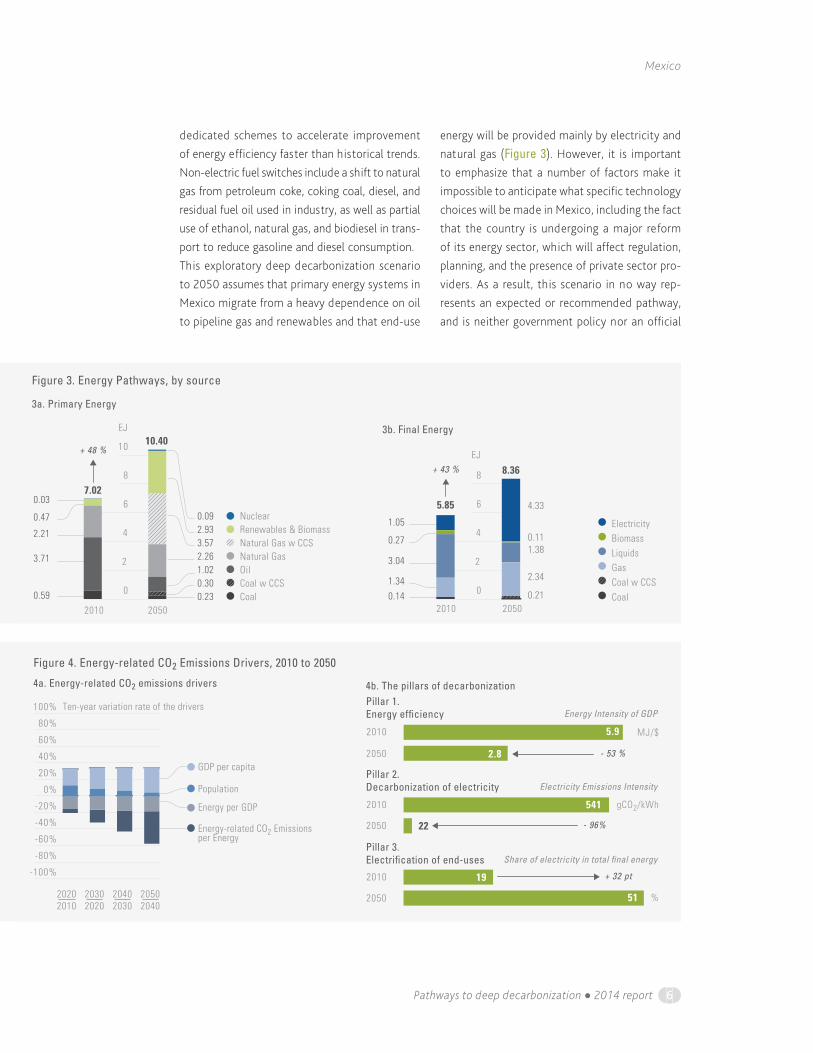
dedicated schemes to accelerate improvement of energy efficiency faster than historical trends.Non-electric fuel switches include a shift to natural gas from petroleum coke, coking coal, diesel, and residual fuel oil used in industry, as well as partial use of ethanol, natural gas, and biodiesel in trans-port to reduce gasoline and diesel consumption.This exploratory deep decarbonization scenario to 2050 assumes that primary energy systems in Mexico migrate from a heavy dependence on oil to pipeline gas and renewables and that end-use
energy will be provided mainly by electricity and natural gas (Figure 3). However, it is important to emphasize that a number of factors make it impossible to anticipate what specific technology choices will be made in Mexico, including the fact that the country is undergoing a major reform of its energy sector, which will affect regulation, planning, and the presence of private sector pro-viders. As a result, this scenario in no way rep-resents an expected or recommended pathway, and is neither government policy nor an official
8
6
4
2
0
10
8
6
4
2
0
+ 48 %
3a. Primary Energy
Natural GasNatural Gas w CCS
Oil
CoalCoal w CCS
Renewables & BiomassNuclear
Figure 3. Energy Pathways, by source
EJ
EJ
2010 2050
+ 43 %
3b. Final Energy
ElectricityBiomassLiquidsGas
CoalCoal w CCS
2010 2050
10.40
7.025.85
8.36
0.03
0.47
2.21
3.71
0.59
0.092.933.572.261.020.300.23
1.05
0.27
3.04
1.340.14
4.33
0.111.38
2.34
0.21
0%
-20%
-40%
-60%
-80%
-100%
20%
40%
60%
80%
100%
4a. Energy-related CO2 emissions drivers
- 53 %
- 96%
+ 32 pt
5.9
541
19
51
2.8
MJ/$
gCO2/kWh
%
2010
2050
2010
2050
2010
2050
Pillar 1.Energy ef�ciency Energy Intensity of GDP
Pillar 2.Decarbonization of electricity Electricity Emissions Intensity
Share of electricity in total �nal energyPillar 3.Electri�cation of end-uses
Population
GDP per capita
Energy per GDP
Energy-related CO2 Emissionsper Energy
Figure 4. Energy-related CO2 Emissions Drivers, 2010 to 2050
4b. The pillars of decarbonization
20202010
20302020
20402030
20502040
22
Ten-year variation rate of the drivers
Mexico
7 Pathways to deep decarbonization � 2014 report
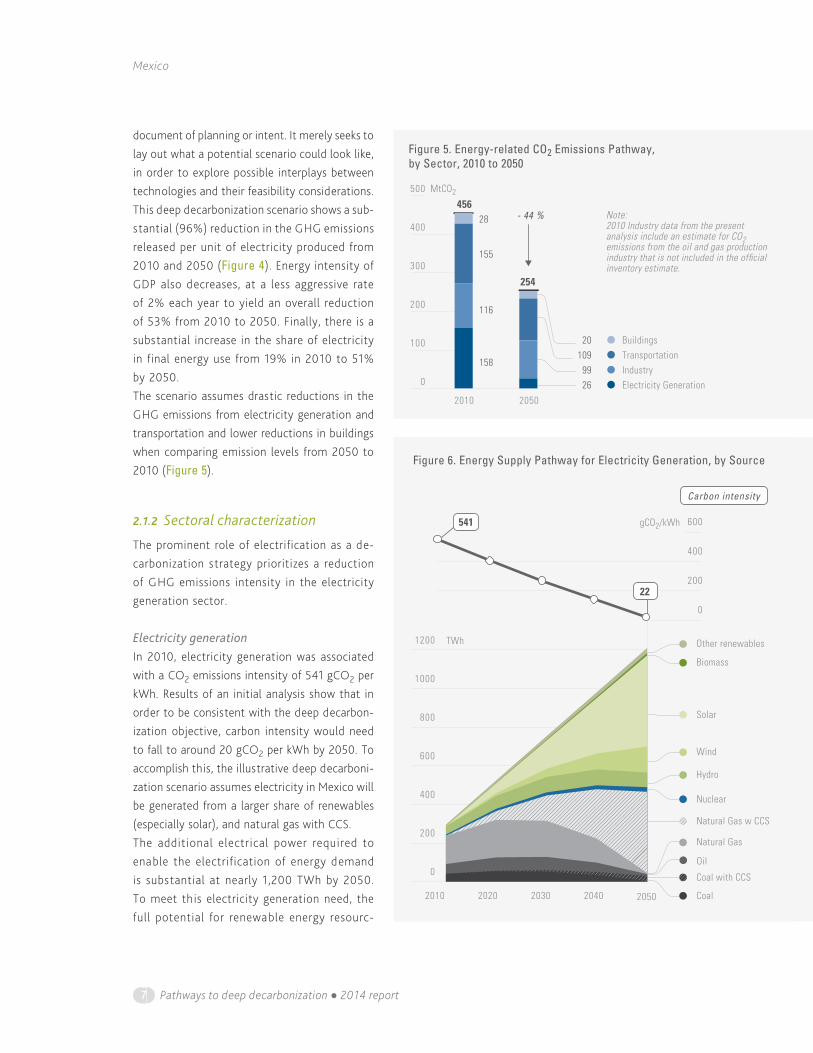
document of planning or intent. It merely seeks to lay out what a potential scenario could look like, in order to explore possible interplays between technologies and their feasibility considerations.This deep decarbonization scenario shows a sub-stantial (96%) reduction in the GHG emissions released per unit of electricity produced from 2010 and 2050 (Figure 4). Energy intensity of GDP also decreases, at a less aggressive rate of 2% each year to yield an overall reduction of 53% from 2010 to 2050. Finally, there is a substantial increase in the share of electricity in final energy use from 19% in 2010 to 51% by 2050. The scenario assumes drastic reductions in the GHG emissions from electricity generation and transportation and lower reductions in buildings when comparing emission levels from 2050 to 2010 (Figure 5).
2.1.2 Sectoral characterization
The prominent role of electrification as a de-carbonization strategy prioritizes a reduction of GHG emissions intensity in the electricity generation sector.
Electricity generationIn 2010, electricity generation was associated with a CO2 emissions intensity of 541 gCO2 per kWh. Results of an initial analysis show that in order to be consistent with the deep decarbon-ization objective, carbon intensity would need to fall to around 20 gCO2 per kWh by 2050. To accomplish this, the illustrative deep decarboni-zation scenario assumes electricity in Mexico will be generated from a larger share of renewables (especially solar), and natural gas with CCS. The additional electrical power required to enable the electrification of energy demand is substantial at nearly 1,200 TWh by 2050. To meet this electricity generation need, the full potential for renewable energy resourc-
0
100
300
200
500
400
MtCO2
- 44 %
Figure 5. Energy-related CO2 Emissions Pathway, by Sector, 2010 to 2050
Electricity GenerationIndustryTransportationBuildings
2010 2050
456
254
28
20109
9926
155
116
158
Note:2010 Industry data from the present analysis include an estimate for CO2 emissions from the oil and gas production industry that is not included in the of�cial inventory estimate.
200
0
600
1000
400
800
1200
200
400
0
600
TWh
gCO2/kWh
Figure 6. Energy Supply Pathway for Electricity Generation, by Source
2010 2020 2030 2040 2050
Coal with CCS
Natural Gas
Natural Gas w CCS
Nuclear
Hydro
Wind
Solar
Biomass
Other renewables
Oil
Coal
541
22
Carbon intensity
Mexico
Pathways to deep decarbonization � 2014 report 8
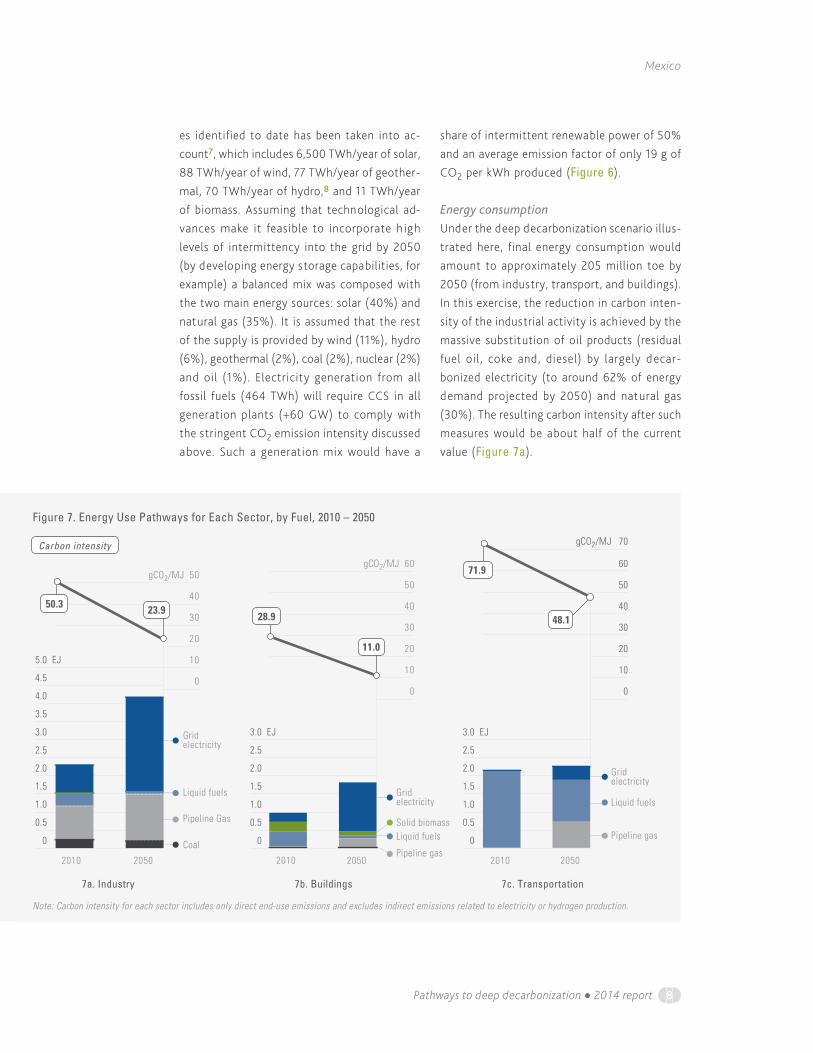
es identified to date has been taken into ac-count7, which includes 6,500 TWh/year of solar, 88 TWh/year of wind, 77 TWh/year of geother-mal, 70 TWh/year of hydro,8 and 11 TWh/year of biomass. Assuming that technological ad-vances make it feasible to incorporate h igh levels of intermittency into the grid by 2050 (by developing energy storage capabilities, for example) a balanced mix was composed with the two main energy sources: solar (40%) and natural gas (35%). It is assumed that the rest of the supply is provided by wind (11%), hydro (6%), geothermal (2%), coal (2%), nuclear (2%) and oil (1%). Electricity generation from all fossil fuels (464 TWh) will require CCS in all generation plants (+60 GW) to comply with the stringent CO2 emission intensity discussed above. Such a generation mix would have a
share of intermittent renewable power of 50% and an average emission factor of only 19 g of CO2 per kWh produced (Figure 6).
Energy consumptionUnder the deep decarbonization scenario illus-trated here, final energy consumption would amount to approximately 205 million toe by 2050 (from industry, transport, and buildings). In this exercise, the reduction in carbon inten-sity of the industrial activity is achieved by the massive substitution of oil products (residual fuel oil, coke and, diesel) by largely decar-bonized electricity (to around 62% of energy demand projected by 2050) and natural gas (30%). The resulting carbon intensity after such measures would be about half of the current value (Figure 7a).
1.5
1.0
0.5
0
2.0
2.5
3.5
5.0
3.0
4.0
4.5
1.5
1.0
0.5
0
2.0
2.5
3.0
1.5
1.0
0.5
0
2.0
2.5
3.0
30
40
50
0
10
2030
40
50
0
10
20
60
30
40
50
0
10
20
60
70
Figure 7. Energy Use Pathways for Each Sector, by Fuel, 2010 – 2050
EJ
EJ EJ
gCO2/MJgCO2/MJ
gCO2/MJ
Pipeline Gas
Liquid fuels
Gridelectricity
CoalPipeline gas
Liquid fuelsSolid biomass
Gridelectricity Liquid fuels
Pipeline gas
Gridelectricity
7a. Industry 7b. Buildings 7c. Transportation
2010 2050 2010 2050 2010 2050
50.3 23.928.9
11.0
71.9
48.1
Carbon intensity
Note: Carbon intensity for each sector includes only direct end-use emissions and excludes indirect emissions related to electricity or hydrogen production.
Mexico
9 Pathways to deep decarbonization � 2014 report
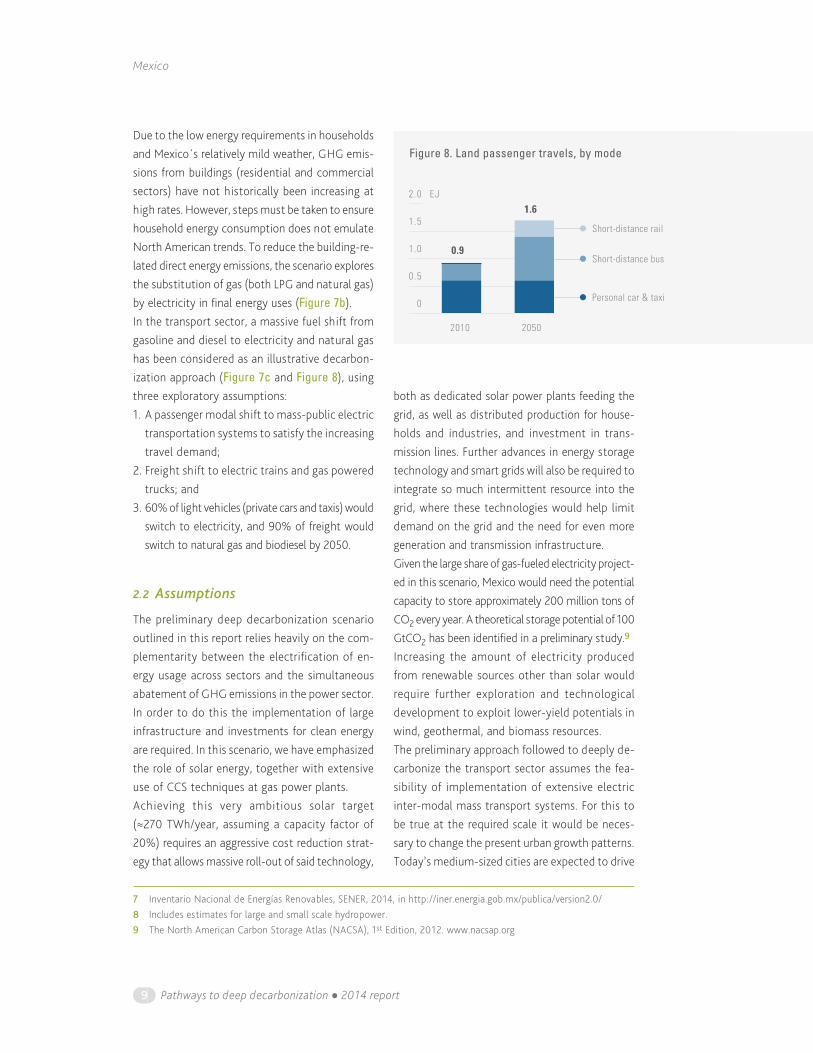
Due to the low energy requirements in households and Mexico´s relatively mild weather, GHG emis-sions from buildings (residential and commercial sectors) have not historically been increasing at high rates. However, steps must be taken to ensure household energy consumption does not emulate North American trends. To reduce the building-re-lated direct energy emissions, the scenario explores the substitution of gas (both LPG and natural gas) by electricity in final energy uses (Figure 7b).In the transport sector, a massive fuel shift from gasoline and diesel to electricity and natural gas has been considered as an illustrative decarbon-ization approach (Figure 7c and Figure 8), using three exploratory assumptions:1. A passenger modal shift to mass-public electric
transportation systems to satisfy the increasing travel demand;
2. Freight shift to electric trains and gas powered trucks; and
3. 60% of light vehicles (private cars and taxis) would switch to electricity, and 90% of freight would switch to natural gas and biodiesel by 2050.
2.2 Assumptions
The preliminary deep decarbonization scenario outlined in this report relies heavily on the com-plementarity between the electrification of en-ergy usage across sectors and the simultaneous abatement of GHG emissions in the power sector. In order to do this the implementation of large infrastructure and investments for clean energy are required. In this scenario, we have emphasized the role of solar energy, together with extensive use of CCS techniques at gas power plants.Ach ieving th is very ambitious solar target (≈270 TWh/year, assuming a capacity factor of 20%) requires an aggressive cost reduction strat-egy that allows massive roll-out of said technology,
both as dedicated solar power plants feeding the grid, as well as distributed production for house-holds and industries, and investment in trans-mission lines. Further advances in energy storage technology and smart grids will also be required to integrate so much intermittent resource into the grid, where these technologies would help limit demand on the grid and the need for even more generation and transmission infrastructure.Given the large share of gas-fueled electricity project-ed in this scenario, Mexico would need the potential capacity to store approximately 200 million tons of CO2 every year. A theoretical storage potential of 100 GtCO2 has been identified in a preliminary study.9
Increasing the amount of electricity produced from renewable sources other than solar would require further exploration and technological development to exploit lower-yield potentials in wind, geothermal, and biomass resources.The preliminary approach followed to deeply de-carbonize the transport sector assumes the fea-sibility of implementation of extensive electric inter-modal mass transport systems. For this to be true at the required scale it would be neces-sary to change the present urban growth patterns. Today’s medium-sized cities are expected to drive
7 Inventario Nacional de Energías Renovables, SENER, 2014, in http://iner.energia.gob.mx/publica/version2.0/8 Includes estimates for large and small scale hydropower. 9 The North American Carbon Storage Atlas (NACSA), 1st Edition, 2012. www.nacsap.org
1.5
1.0
0.5
0
2.0
Figure 8. Land passenger travels, by mode
0.9
1.6
2010 2050
EJ
Personal car & taxi
Short-distance bus
Short-distance rail
Mexico
Pathways to deep decarbonization � 2014 report 10
most of the future growth and would need to adopt and enforce best smart growth practices. This scenario also assumed that by 2050 electric vehicles will be widely available, and that it will be possible to divert freight from the road to electric trains without major technical issues.
2.3 Alternative pathways and pathway robustnessGiven the dependence of this approach on the decarbonization of the electricity generation sec-tor, it is important to explore alternative techno-logical scenarios for this sector. In this analysis we assume the presence of competitive energy storage systems that enable grids to include a high share of intermittent sources (solar or wind power) and are valuable to manage overall de-mand. However, if such a solar plan is unfeasible, an alternative pathway must be devised, perhaps by increasing the share of nuclear power or natural gas with CCS.
2.4 Additional measures and deeper pathwaysThe projected GHG emissions resulting from meas-ures considered in the illustrative deep decarbon-ization scenario could be further reduced by addi-tional actions that have not been yet evaluated.Other options that have not been explored at full capacity in the present study and that may have interesting potential are: additional renewables (wind, geothermal, and marine power), industrial processes redesigned to decrease energy intensity and byproduct GHG emissions, large-scale CCS in industrial facilities, massive adoption of hybrid ve-hicles, large-scale production of bio-fuels for trans-port, and partially substituting the natural gas in the pipeline network with lower-carbon alternatives.Municipal and agricultural waste can be a source of biogas, rather than GHG emissions. Utilizing biogas from landfills and water treatment oper-ations might help lower future consumption of natural gas for electricity generation.
2.5 Challenges, opportunities and enabling conditionsMajor challenges that may deter realization of this scenario include current energy subsidies (both for fossil fuels and electricity), economic potential, lack of resources to fund the transition, and the technological availability of cost-effec-tive options for CCS, electric vehicles, solar power harvesting, and biofuels production. Amongst the enabling conditions that require international cooperation, we identify technol-ogy development for energy storage and energy management (smart demand and smart grids), carbon taxes to imports and exports of fossil fuels, and the development of zero carbon or carbon negative agriculture and forestry techniques to support production of sustainable bioenergy crops and reduce emissions from these sectors.
2.6 Near-term prioritiesAlthough this is an initial exploration of deep de-carbonization in Mexico, some conclusions can be drawn from the magnitude of the challenge at hand. Adoption of better practices in urbani-zation and territorial planning could prove crucial to lower future energy consumption per capita and simultaneously improve quality of life. Bet-ter-organized cities could induce the behavioral changes needed for mode shifts in transportation.A robust low-carbon electricity generation policy is required to evaluate different future alterna-tives, increase certainty over governmental plans, and provide an economically feasible route for future development.Energy efficiency programs coupled with appro-priate energy price signals could help decrease the financial burden of the transformation needed by reducing energy demand and thus reducing the amount of funds needed to transition towards a deep decarbonization development pathway.


COUNTRY RESEARCH PARTNERS. Australia. Climate Works Australia; Crawford School of Public Policy, Australian National University (ANU); Commonwealth Scien-tifi c and Industrial Research Organization (CSIRO); Centre of Policy Studies, Victoria University. Brazil. COPPE, Federal University, Rio de Janeiro. Canada. Carbon Man-agement Canada; Navius Research; Simon Fraser University; Sharp. China. Institute of Energy, Environment, Economy, Tsinghua University; National Center for Climate Change Strategy and International Cooperation (NCSC). France. Université Grenoble Alpes, CNRS, EDDEN, PACTE; Centre International de Recherche sur l’Environnement et le Développement (CIRED), CNRS. Germany. Dialogik. India. The Energy and Resource Institute (TERI). Indonesia. Center for Research on Energy Policy-Bandung Institute of Technology, CRE-ITB; Centre for Climate Risk and Opportunity Management-Bogor Ag-riculture University (CCROM-IPB). Japan. National Institute for Environmental Studies (NIES); Mizuho Information and Research Institute (MIRI). Mexico. Instituto Nacional de Ecología y Cambio Climático (INECC). Russia. Russian Presidential Academy of National Economy and Public Administration (RANEPA); High School of Economics, Moscow. South Africa. The Energy Research Centre (ERC) University of Cape Town (UCT). South Korea. School of Public Policy and Management, Korea Development Institute (KDI); Korea Energy Economics Institute (KEEI); Korea Institute of Energy Research (KIER); Korea Environment Institute (KEI). United Kingdom. University College London (UCL) Energy Institute. United States of America. Energy + Environmental Economics (E3).
DDPP PARTNERS ORGANIZATIONS. German Development Institute (GDI); International Energy Agency (IEA); International Institute for Applied Systems Analysis (IIASA); World Business Council on Sustainable Development (WBCSD).
COLOMBIA
SLOVAKIA
Related Documents