INFOAAIATION TO USERS This manuscript has been reproduced from the microfilmmaster. UMI films the text directly from the original or copy submitted. Thus, some thesis and dissertation copies are in typewriter face, while others may be from any typeof computer printer. The quality of this reproduction is dependent upon the quality of the copy submitted. Broken or indistinct print, colored or poor quality illustrations and photographs,print bleedthrough, substandard margins, and improperalignment can adversely affect reproduction. In the unlikely event that the author did not send UMI a complete manuscript and there are missing pages, these will be noted. Also, if unauthorized copyright material had to be removed, a note will indicate the deletion. Oversize materials (e.g., maps, drawings, charts) are reproduced by sectioning the original, beginning at the upper left-hand corner and continuing from left to right in equal sections with small overlaps. Each original is also photographed in one exposure and is included in reduced form at the back of the book. Photographs included in the original manuscript have been reproduced xerographically in this copy. Higher quality 6" x 9" black and white photographic prints are available for any photographs or illustrations appearing in this copy for an additional charge. Contact UMI directly to order. U·M·I University Microfilms Internalional A Bell & Howell Information Company 300 North Zeeb Road. Ann Arbor. MI 48106-1346 USA 313/761-4700 800/521-0600

Welcome message from author
This document is posted to help you gain knowledge. Please leave a comment to let me know what you think about it! Share it to your friends and learn new things together.
Transcript

INFOAAIATION TO USERS
This manuscript has been reproduced from the microfilmmaster. UMI
films the text directly from the original or copy submitted. Thus, some
thesis and dissertation copies are in typewriter face, while others may
be from any typeof computer printer.
The quality of this reproduction is dependent upon the quality of the
copy submitted. Broken or indistinct print, colored or poor quality
illustrations and photographs,print bleedthrough, substandard margins,
and improper alignment can adversely affect reproduction.
In the unlikely event that the author did not send UMI a complete
manuscript and there are missing pages, these will be noted. Also, if
unauthorized copyright material had to be removed, a note will indicate
the deletion.
Oversize materials (e.g., maps, drawings, charts) are reproduced by
sectioning the original, beginning at the upper left-hand corner and
continuing fromleft to right in equal sections with small overlaps. Each
original is also photographed in one exposure and is included in
reduced form at the back of the book.
Photographs included in the original manuscript have been reproduced
xerographically in this copy. Higher quality 6" x 9" black and white
photographic prints are available for any photographs or illustrations
appearing in this copy for an additional charge. Contact UMI directly
to order.
U·M·IUniversity Microfilms Internalional
A Bell & Howell Information Company300North Zeeb Road. Ann Arbor. MI 48106-1346 USA
313/761-4700 800/521-0600


-------_.
Order Number 931218'1
Estimation of X-inefficiency: Korea and Taiwan
Chung, Woo-Taik, Ph.D.
University of Hawaii, 1992
U·M·!300 N. Zeeb Rd.Ann Arbor, MI 48106


ESTIMATION OF X-INEFFICIENCY:
KOREA AND TAIWAN
A DISSERTATION SUBMITTED TO THE GRADUATE DIVISION OF THEUNIVERSITY OF HAWAII IN PARTIAL FULFILLMENT
OF THE REQUIREMENTS FOR THE DEGREE OF
DOCTOR OF PHILOSOPHY
IN
ECONOMICS
DECEMBER 1992
BY
Woo-Taik Chung
Dissertation Committee:
Chung H. Lee, ChairpersonWalter Miklius
Seiji NayaYeong-Her Yeh
Hagen Koo
iii
. ACKNOWLEDGMENTS
I dedicate this dissertation to my late father and
mother. I am most grateful to my committee chairperson,
Dr. Chung Lee, for his invaluable guidance, suggestions,
and encouragement for the completion of this study. And
I would like to express my gratitude to the other committee
members, Drs. walter Miklius, Seiji Naya, Yeong-Her Yeh,
and Hagen Koo, for their insightful comments and advice
on earlier drafts. I also thank Dr. Myung-Hun Kang whose
support made it possible for me to successfully complete
this aissertation.
My wife, Ock-Bae, and my two sons, Tae-Oh and Tae-Doo,
deserve my deepest thanks for having shared the various
difficulties and long patience with unwavering love to
me.

iv
ABSTRACT
This study applies the X-inefficiency theory to
analyze different characteristics of the industrial
structure between Korea and Taiwan, which have achieved
rapid economic growth and export expansion during the past
three decades. Using the parameters of the estimated CES
production function by the Arrow, Chenery, Minhas and
Solow method and the Diwan method, X-inefficiency is
measured by the actual input costs deviating from their
cost-minimizing values. The results show that Taiwan is
more capital-intensive and has a higher X-inefficiency
rate in the average value of the total manufacturing
sector than Korea.
Since the lack of competition is the main theoretical
determinant of X-inefficiency, the competitive environment
hypothesis--i.e., the industry in a less competitive
environment has more X-inefficiency--is proposed and
tested in this study. We use X-inefficiency estimates
as a dependent variable. The concentration ratio and a
measure of capital-intensity are used as regressors for
market competition, and the degree of foreign dependency
and tariff level are used for international competition.
Our empirical results from Korea and Taiwan generally
support the competitive hypothesis.

v
In conclusion, the x-inefficiency theory is applicable
in both the Korean and Taiwanese economies through the
estimation of the production function or a test of
hypothesis by the degree of competition.

vi
TABLE OF CONTENTS
ACKNOWLEDGMENTS • .
ABSTRACT
LIST OF TABLES · · · · · ·LIST OF FIGURES . . · · · · · ·CHAPTER I INTRODUCTION · · · · · ·
1.1 Objective · · · . . . . . · · · · · ·1.2 Organization
CHAPTER II REVIEW OF THE LITERATURE · · · · · ·
iii
iv
viii
x
1
15
7
2.1 The XE Theory. • . • • • • • • • 72.1.1 Definition . . • • • • • • • • • 82.1.2 Assumptions of Neoclassical
and XE Theory •• • . • • 112.1.3 The Inert Area in XE Theory. 13
2.2 Empirical Evidence . • • • 172.2.1 Analysis of Ownership Form. • 172.2.2 Analysis of Regulated Firms • 202.2.3 Analysis of Market Structure. 23
2.3 Criticisms of the XE Theory. . • • • 29
CHAPTER III THEORETICAL FRAMEWORK • . • 32
3.1 Determinants of X-Inefficiency • . • 323.2 Characteristics of Industrial
Structure in Korea and Taiwan. 383.2.1 Industrial Structure . • • • • • 383.2.2 Industrial Concentration • • • • 45
CHAPTER IV MEASUREMENT OF X-INEFFICIENCY • 49
4.1 Estimation of the ProductionFunction • • • . • • • • • • • • • 49
4.1.1 The Arrow, Chenery, Minhasand Solow (1961) Method. • 50
4.1.2 The Diwan (1969) Method. 524.2 The Empirical Model for
X-Inefficiency • . . • • • . • • • 534.2.1 Cost-Minimizing Labor (L*). • 544.2.2 cost-Minimizing Capital (K*). 544.2.3 The Actual Model for Analysis 55
vii
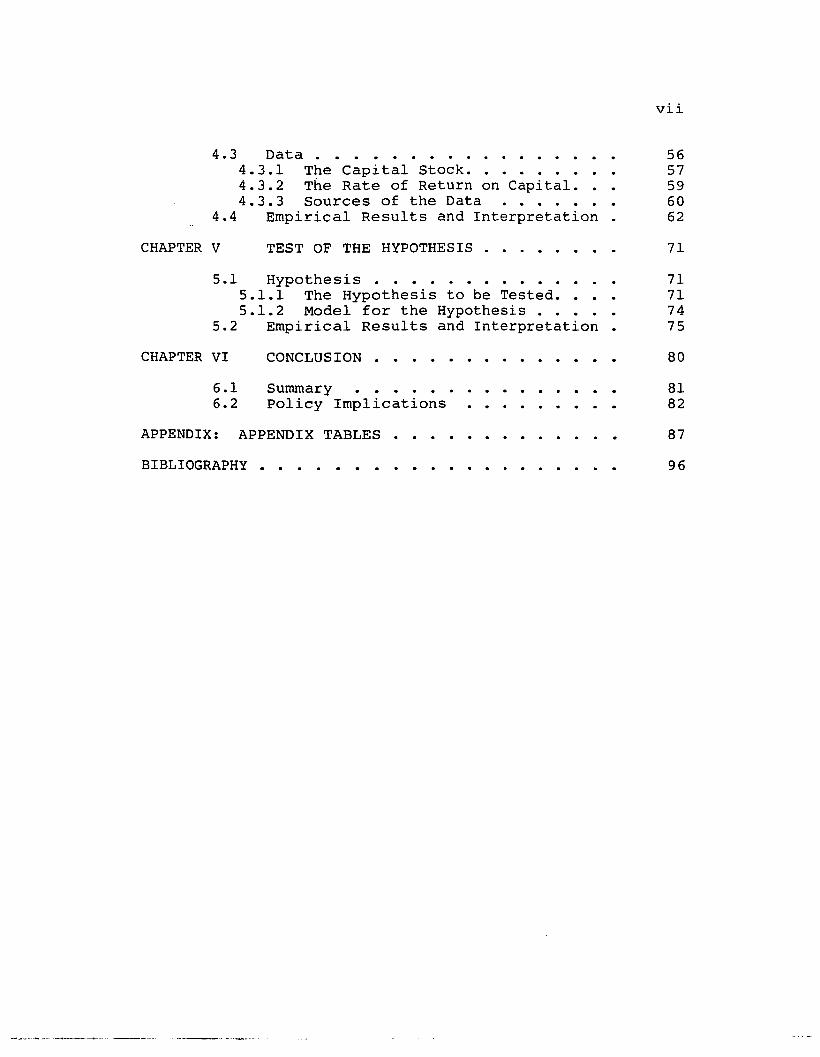
4.3 Data............... 564.3.1 The Capital Stock. • . . . . • 574.3.2 The Rate of Return on Capital. 594.3.3 Sources of the Data . • . . • 60
4.4 Empirical Results and Interpretation . 62
CHAPTER V TEST OF THE HYPOTHESIS . 71
5.1 Hypothesis....... . •. 715.1.1 The Hypothesis to be Tested. . 715.1.2 Model for the Hypothesis. . • 74
5.2 Empirical Results and Interpretation • 75
CHAPTER VI CONCLUSION • 80
6 .1 Summary • • • . • .6.2 Policy Implications ••..
APPENDIX: APPENDIX TABLES .
BIBLIOGRAPHY • • • . • • •
8182
87
96
Table"
2.1
3.1
3.2
3.3
3.4
4.1
4.2
5.1
5.2
5.3
5.4
LIST OF TABLES
Assumptions of Neoclassical andXE Theory . • . . . . • • . .
Composition of GNP
Industrial Structure of Korea and Taiwan.
Value-Added and Number of Employees ofVarious-Sized Firms in Korea and Taiwan •
Industrial Concentration Rate
X-Inefficiency Rate: Korea
X-Inefficiency Rate: Taiwan.
Regression Results for the Testof the Hypothesis: Korea
Regression Results for the Testof the Hypothesis: Taiwan •••
Correlation Coefficient Matrix: Korea .
Correlation Coefficient Matrix: Taiwan.
viii
Page
13
39
42
44
46
64
68
77
77
79
79
Appendix Tables
A.I Parameter Coefficients of ProductionFunction: Korea (ACMS, VWT) . . . . . . . . . 87
A.2 Parameter Coefficients of ProductionFunction: Taiwan (ACMS, VWT) . . . . 88
A.3 X-Inefficiency Rate: Korea (ACMS, ALI) . 89
A.4.1 X-Inefficiency Rate: Korea (Diwan, VMT) 90
A.4.2 X-Inefficiency Rate: Korea (Diwan, VWT) 91
A.5.1 X-Inefficiency Rate: Taiwan (Diwan, VWT) • 92
A.5.2 X-Inefficiency Rate: Taiwan (Diwan, VWT) • 93

Appendix Tables
A.6 Regression Results for the Test ofthe Hypothesis: Korea (Log) ..
ix
Page
94
A.7 Regression Results for the Test ofthe Hypothesis: Taiwan (Log) 95

Figure"
2.1
2.2
2.3
2.4
LIST OF FIGURES
Price and Technical Efficiency . .
X-Inefficiency •
The Inert Area •
A Multiperson Inert Area.
x
Page
9
11
15
16

1
CHAPTER I
INTRODUCTION
1.1 Objective
Microeconomic theory is fundamentally a theory of
the efficiency of resource allocation and studies of such
efficiency are carried out mostly in relation to market
structure. In other words, microeconomic theory primarily
deals with the question of what market structure allocates
resources most efficiently and what market structure
hinders the efficiency of resource allocation. It is for
this reason that economists have been studying how the
market structure functions.
In a completely competitive market system, resources
are distributed efficiently; in contrast, a monopolistic
market structure hinders the efficiency of resource
distribution. This reduction in efficiency under the
monopolistic market structure is called allocative
inefficiency. This inefficiency has been a leading issue
in efficiency discussions and, in fact, it would not be
an overstatement to say that discussions of efficiency
are generally referring to only allocative efficiency.
Some economists, however, argue that there is another kind
of inefficiency caused by a monopoly. This inefficiency,
X-inefficiency, is the welfare loss caused by a monopoly
2
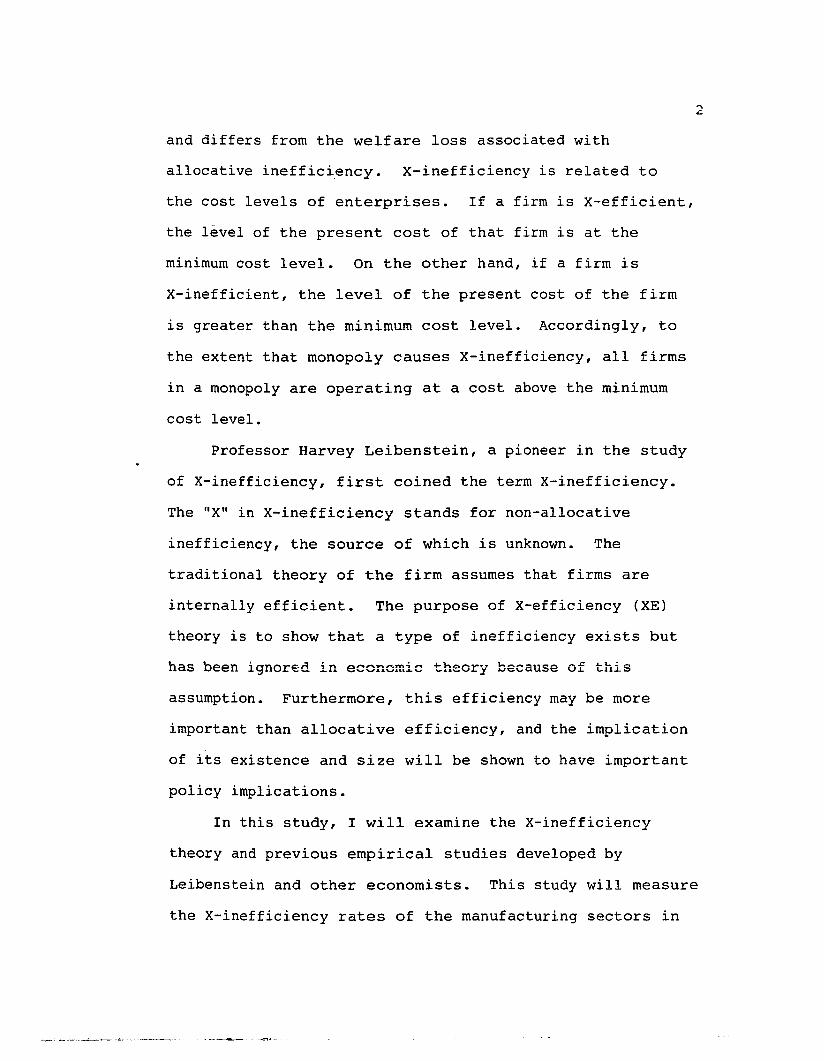
and differs from the welfare loss associated with
allocative Lne f f Lc i.enc y , X-inefficiency is related to
the cost levels of enterprises. If a firm is X-efficient,
the level of the present cost of that firm is at the
minimum cost level. On the other hand, if a firm is
X-inefficient, the level of the present cost of the firm
is greater than the minimum cost level. Accordingly, to
the extent that monopoly causes X-inefficiency, all firms
in a monopoly are operating at a cost above the minimum
cost level.
Professor Harvey Leibenstein, a pioneer in the study
of X-inefficiency, first coined the term X-inefficiency.
The "X" in X-inefficiency stands for non-allocative
inefficiency, the source of which is unknown. The
traditional theory of the firm assumes that firms are
internally efficient. The purpose of X-efficiency (XE)
theory is to show that a type of inefficiency exists but
has been ignored in economic theory because of this
assumption. Furthermore, this efficiency may be more
important than allocative efficiency, and the implication
of its existence and size will be shown to have important
pOlicy implications.
In this study, I will examine the X-inefficiency
theory and previous empirical studies developed by
Leibenstein and other economists. This study will measure
the X-inefficiency rates of the manufacturing sectors in

3
Korea and Taiwan, countries which have achieved rapid
economic growth and. export expansion with different
industrial structures in the past three decades. The study
also includes a cross-sectional analysis of each nation
as well as a national comparison.
The historical experiences of Korea and Taiwan are
similar in terms of their initial conditions, choice of
development strategy, and policies. Despite their
similarities, however, the economies of these two countries
also have some important differences. One difference is
the degree of industrial concentration in each country.
By the early 1980s, the Korean economy became dominated
by large conglomerates, known as chaebol, patterned after
the zaibatsu of Japan. The ten largest industrial groups
in Korea produced around 75 percent of the country's GOP.
In contrast, Taiwan has literally thousands of small
enterprises, all competing with one another. The largest
industrial enterprise in Taiwan does not come close to
the size of the conglomerates in Korea. l
This difference in industrial concentration is partly
the result of efforts by Korea's economic planners to
exploit economies of scale of large enterprises. The
Korean government also took a very active role in
controlling market forces. The government of Taiwan, in
lEconomics and Technology Institute (1989).
-......:. ....... _.._--_._ ..........-_:.-_----_.

4
contrast, tended to rely more on the workings of the free
market. The differ~nce, however, is only a matter of
degree: by the standards of the advanced industrialized
Western economies, both governments should be regarded
as interventionist.
Between 1966 and 1976, the number of manufacturing
firms in Taiwan increased by 150 percent while the average
size of individual enterprises, as measured by the number
of employees, increased by only 29 percent. In Korea,
the relation between these two changes goes the other way
around: the number of manufacturing firms increased by
a mere 10 percent while the number of employees per
t . . 2en erpr~se ~ncreased by 176 percent.
The result of Taiwan's route of development was the
much smaller size of private manufacturing enterprises
and the more competitive spirit that goes with it. Not
counting the very small firms with less than 5 employees,
which are not registered in the Korean census, the average
Taiwanese firm in 1976 with 34.6 employees was only one-
half as large as its Korean counterpart which had on
average 68.8 employees. Moreover, the very small firms,
which are ignored by the Korean census, constituted 43
percent of all manufacturing firms in Taiwan, bringing
the average size of Taiwanese firms down to 27 employees.
The disparity in firm size between the two countries seems

5
even greater when one looks at their large firms. In 1981,
the $10 billion gro~s receipt of Hyundai, Korea's largest
conglomerate, was three times as big as the $3.5 billion
gross "r ecei.pt; of Taiwan's 10 largest private firms
combined. 3
For a market economy to function efficiently, it must
be competitive. Competition depends on the presence of
many small firms and the absence of overwhelmingly large
ones. It is, therefore, of interest to find out whether
the different characteristics of the industrial structure
in Korea and Taiwan had any effect on the performance of
the two economies. In order to do this, this study
proposes and tests the competitive environment hypothesis,
which is the industry in a less competitive environment
has more X-inefficiency.
1.2 Organization
The organization of this study is as follows. In
Chapter II, the definitions and theories of XE are examined
and the literature on the subject is summarized. In
Chapter III, the theoretical determinants of X-inefficiency
are discussed and the industrial structure in Korea and
Taiwan are reviewed. Here we also set up the hypothesis
to be tested. In Chapter IV, the estimation method of
the production function is examined and a measuring model

to estimate the extent of X-efficiency is established.
Then the X-ineffici~ncy rates of each industry including
the total manufacturing sector are measured for Korea and
Taiwan, using the measuring model formulated with the CES
production function. In Chapter V, a model to test the
competitive environment hypothesis is developed and
employed. Finally, the characteristics of each country's
industrial structure are summarized on the basis of the
results of the analysis. The paper concludes with some
policy implications.
6
7
CHAPTER II
REVIEW OF THE LITERATURE
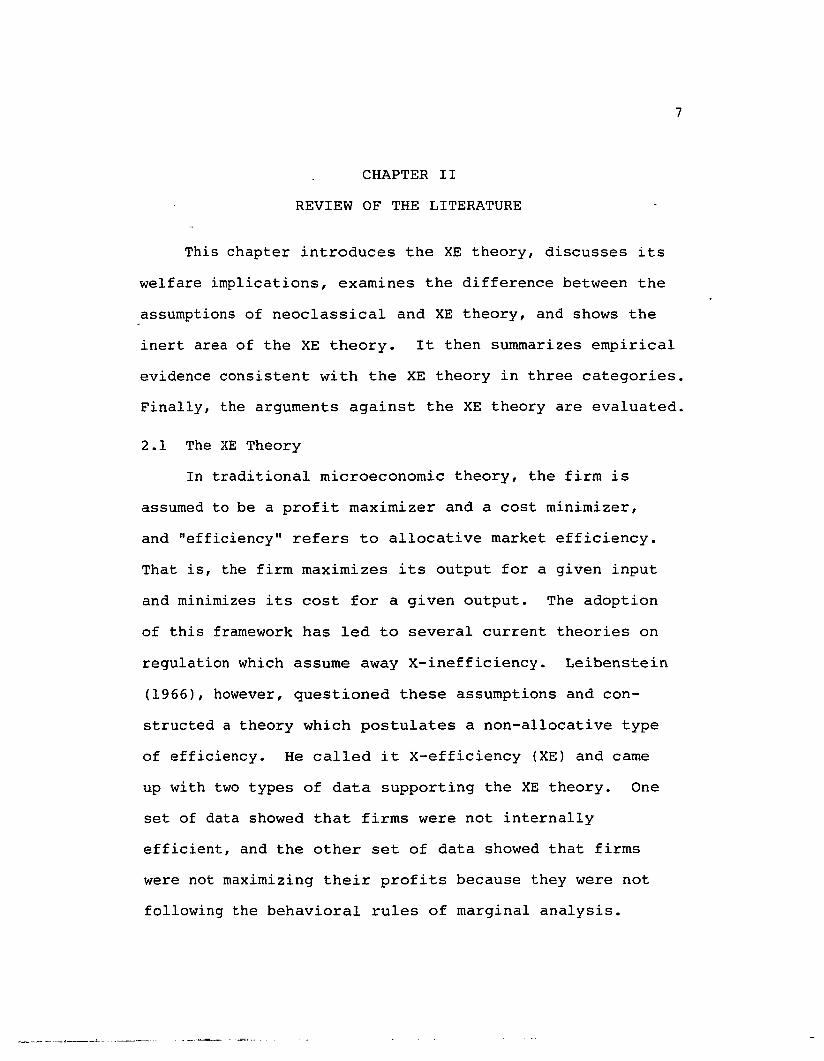
This chapter introduces the XE theory, discusses its
welfare implications, examines the difference between the
assumptions of neoclassical and XE theory, and shows the
inert area of the XE theory. It then summarizes empirical
evidence consistent with the XE theory in three categories.
Finally, the arguments against the XE theory are evaluated.
2.1 The XE Theory
In traditional microeconomic theory, the firm is
assumed to be a profit maximizer and a cost minimizer,
and "efficiency" refers to allocative market efficiency.
That is, the firm maximizes its output for a given input
and minimizes its cost for a given output. The adoption
of this framework has led to several current theories on
regulation which assume away X-inefficiency. Leibenstein
(1966), however, questioned these assumptions and con
structed a theory which postulates a non-allocative type
of efficiency. He called it X-efficiency (XE) and came
up with two types of data supporting the XE theory. One
set of data showed that firms were not internally
efficient, and the other set of data showed that firms
were not maximizing their profits because they were not
following the behavioral rules of marginal analysis.
---...--- --.._.-_._~._..----
8
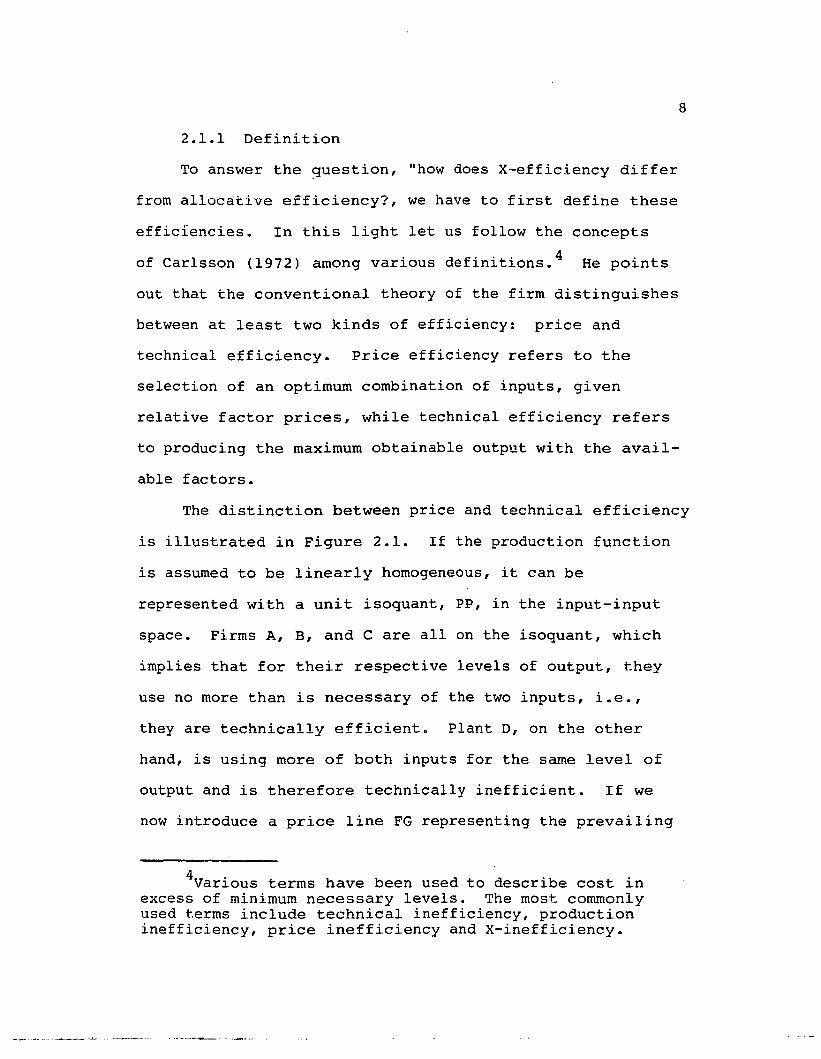
2.1.1 Definition
To answer the guestion, "how does X-efficiency differ
from allocative efficiency?, we have to first define these
efficiencies. In this light let us follow the concepts
of Carlsson (1972) among various definitions. 4 He points
out that the conventional theory of the firm distinguishes
between at least two kinds of efficiency: price and
technical efficiency. Price efficiency refers to the
selection of an optimum combination of inputs, given
relative factor prices, while technical efficiency refers
to producing the maximum obtainable output with the avail-
able factors.
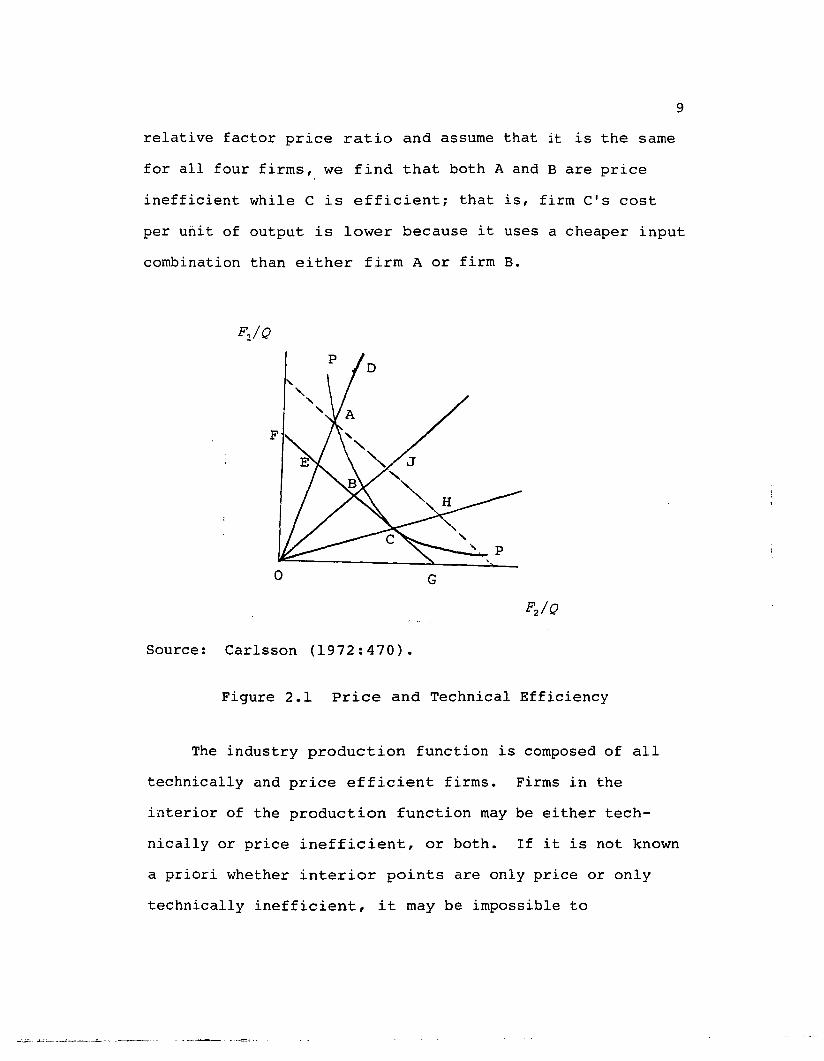
The distinction between price and technical efficiency
is illustrated in Figure 2.1. If the production function
is assumed to be linearly homogeneous, it can be
represented with a unit isoquant, PP, in the input-input
space. Firms A, B, and C are all on the isoquant, which
implies that for their respective levels of output, they
use no more than is necessary of the two inputs, i.e.,
they are technically efficient. Plant 0, on the other
hand, is using more of both inputs for the same level of
output and is therefore technically inefficient. If we
now introduce a price line FG representing the prevailing
4various terms have been used to describe cost inexcess of minimum necessary levels. The most commonlyused terms include technical inefficiency, productioninefficiency, price inefficiency and X-inefficiency.
9
relative factor price ratio and assume that it is the same
for all four firms, we find that both A and B are price
inefficient while C is efficient; that is, firm CiS cost
per unit of output is lower because it uses a cheaper input
combination than either firm A or firm B.
G
Source: Carlsson (1972:470).
Figure 2.1 Price and Technical Efficiency
The industry production function is composed of all
technically and price efficient firms. Firms in the
interior of the production function may be either tech
nically or price inefficient, or both. If it is not known
a priori whether interior points are only price or only
technically inefficient, it may be impossible to
10
distinguish between these two aspects of inefficiency.
Instead, we may ref~r to interior points as X-inefficient,
to use Leibenstein's terminology.
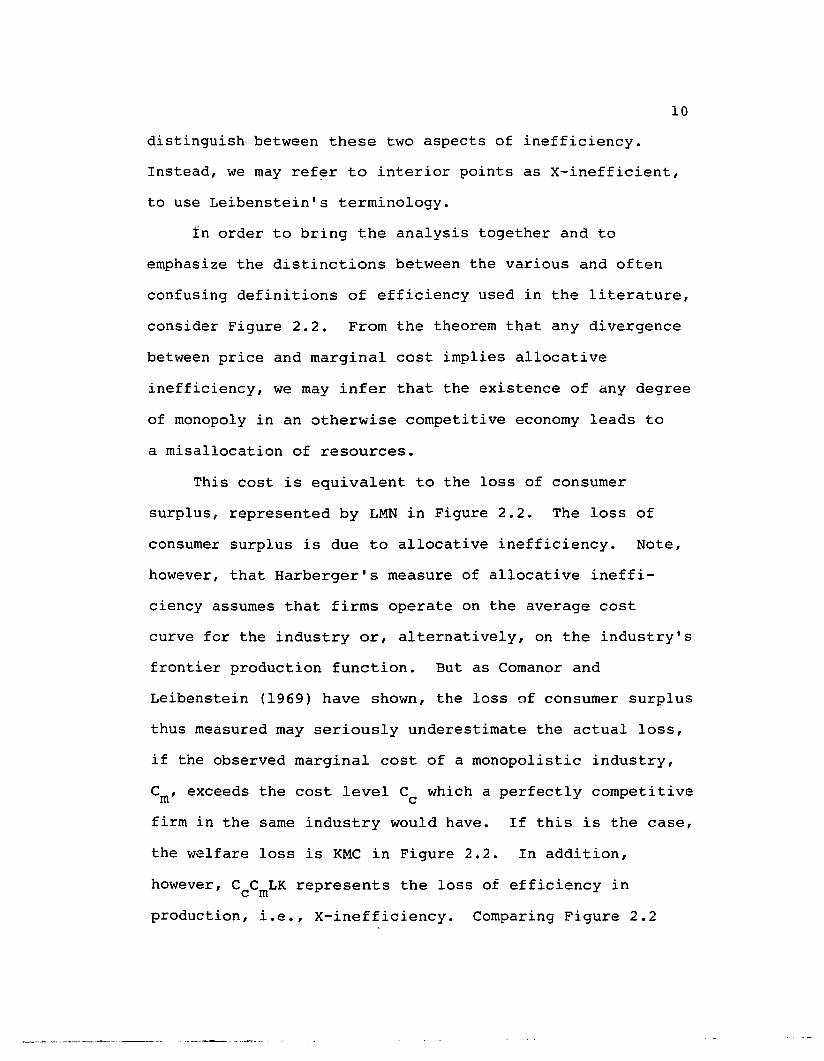
In order to bring the analysis together and to
emphasize the distinctions between the various and often
confusing definitions of efficiency used in the literature,
consider Figure 2.2. From the theorem that any divergence
between price and marginal cost implies allocative
inefficiency, we may infer that the existence of any degree
of monopoly in an otherwise competitive economy leads to
a misallocation of resources.
This cost is equivalent to the loss of consumer
surplus, represented by LMN in Figure 2.2. The loss of
consumer surplus is due to allocative inefficiency. Note,
however, that Harberger's measure of allocative ineffi-
ciency assumes that firms operate on the average cost
curve for the industry or, alternatively, on the industry's
frontier production function. But as Comanor and
Leibenstein (1969) have shown, the loss of consumer surplus
thus measured may seriously underestimate the actual loss,
if the observed marginal cost of a monopolistic industry,
Cm' exceeds the cost level Cc which a perfectly competitive
firm in the same industry would have. If this is the case,
the welfare loss is KMC in Figure 2.2. In addition,
however, C C LK represents the loss of efficiency inc m
production, i.e., X-inefficiency. Comparing Figure 2.2
11
with Figure 2.1, we note that firms A, B, and Dare
X-inefficient while C is X-efficient.
P
PmExcessProfits
CmX-inefficiency
Pc=Cc t--------+---I~4K
D
Qrn Qo Qc Q
Source: Carlsson (1972:472).
Figure 2.2 X-Inefficiency
2.1.2 Assumptions of Neoclassical and XE Theory
The XE theory shows without competitive pressure,
there results not only allocative market inefficiency,
but also another type of inefficiency which is manifest
as the excess unit cost of production among firms sheltered
from competitive pressure. The neoclassical theory assumes
that firms are producing according to their production
and cost functions. That is, firms are assumed to be
maximizing output from given inputs, including technology,

12
and therefore, they are minimizing unit costs. The input
output relationship. is thus technological. If, however,
production and cost processes are not primarily technolog
ical processes, then the neoclassical theory needs to be
modified. The XE theory is one such modification.
Let us compare how the assumptions of neoclassical
theory and XE theory differ. The neoclassical theory
contains the following assumptions. First, the units to
be studied are firms and households. Second, all behavior
is maximizing behavior. Third, human behavior is very
responsive to changes in the environment. Fourth, labor
contracts are complete. Fifth, human effort is assumed
to be a given. Sixth, the interest of the owners is always
consistent with that of their agents.
The XE theory, on the other hand, makes the following
assumptions. First, the decision unit is assumed to be
the individual who must exert some effort, which is made
up of the following components: activities, Ai the pace
of activities, Pi their quality, Qi and the time sequence,
T. These are called an APQT bundle by Leibenstein (1966).
In general, a job interpretation will reflect a number
of effort points, which is referred to as an effort
position. Second, individuals are assumed to be selec
tively, not completely, rational. Third, human behavior
is not always responsive to changes in the environment.
Fourth, labor contracts are incomplete. Fifth, human
13
effort is a discretionary variable rather than a constant.
Sixth, the interests of owners may differ from those of
their agents.
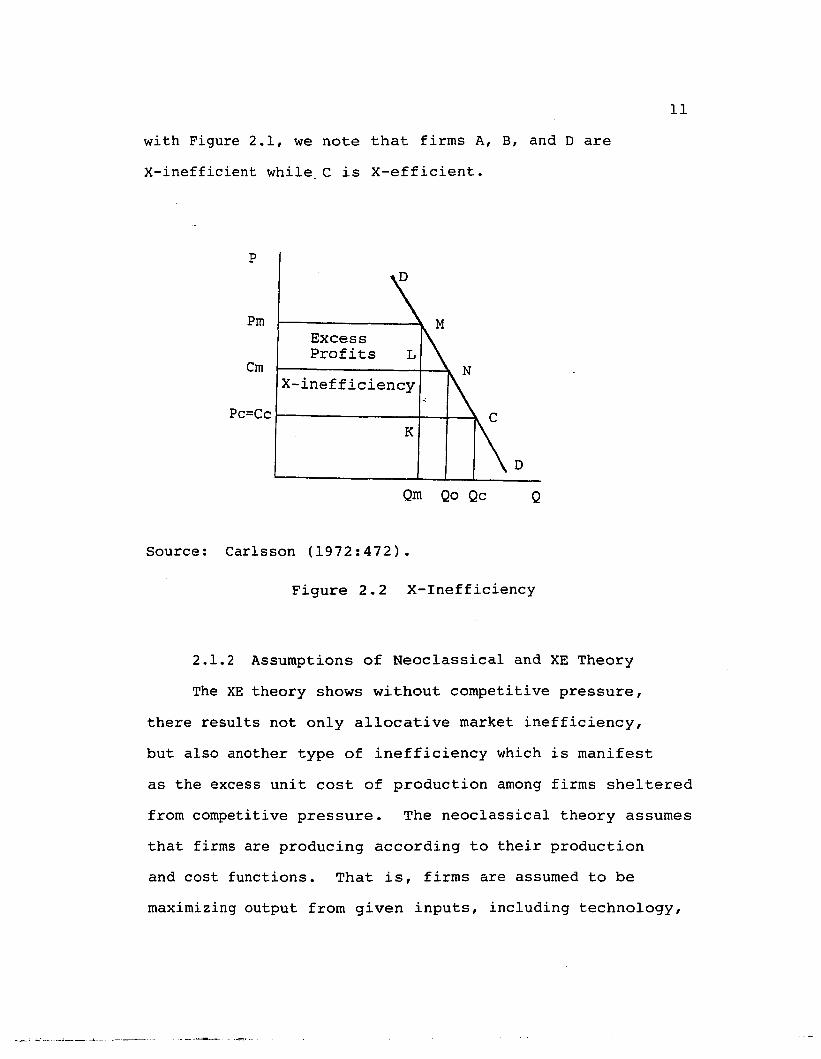
Table 2.1
Assumptions of Neoclassical and XE Theory
Components Neoclassical Theory XE Theory
l. Units Firms and Households Individuals
2. Psychology Rationality SelectiveRationality
3. Changes in the Very Responsive Not AlwaysEnvironment Responsive
(Inertia)
4. Labor Complete IncompleteContracts
5. Human Effort Assumed Given DiscretionaryVariable
6. Agent- Identity of Differentialprincipal Interests
Source: Leibenstein (1978a:20).
2.1.3 The Inert Area in XE Theory5
Firms do not automatically convert inputs into the
technologically maximum output rate for several reasons.
For example, while firms buy labor time, production
requires labor effort or what Leibenstein refers to as
"directed effort, at or beyond some level of skill." That
5Th i s section is abstracted partially from Frantz(1988).
14
is, the essential element of human inputs--i.e., directed
effort--is not dire?tly purchased, and this is one of many
distinctions between human and non-human inputs. Effort
is thus viewed as the outcome of an individual's response
to motivations provided by his own psyche and/or by the
external environment.
The concepts of individual effort discretion and
multiperson inert areas imply that no single person within
a firm controls all the relevant variables that determine
effort. In this case, effort or productivity may be
thought of as the outcome of a "game." Leibenstein makes
use of the prisoner's dilemma to illustrate the determin
ation of productivity. Briefly, the prisoner's dilemma
is a situation in which each individual acts according
to his own self-interest, but the outcome is not optimal
for any individual. To state this another way, a
prisoner's dilemma exists when the opportunities for
adversarial behavior reduce cooperative but superior
behavior.
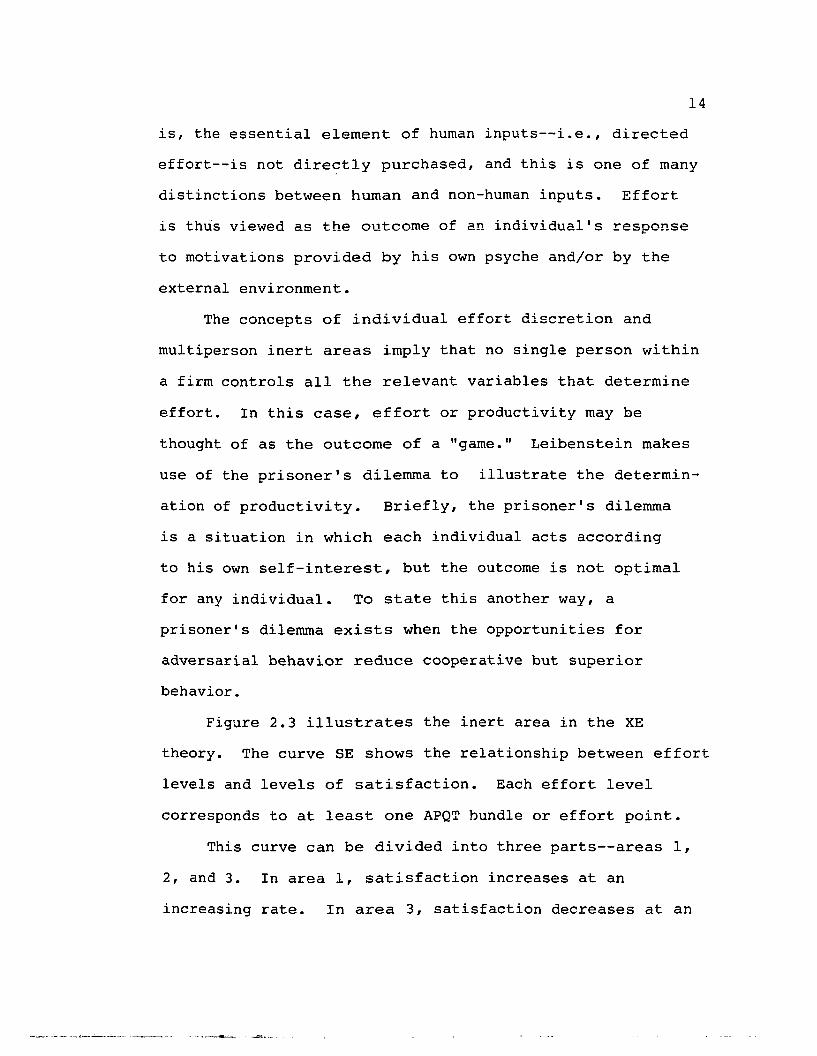
Figure 2.3 illustrates the inert area in the XE
theory. The curve SE shows the relationship between effort
levels and levels of satisfaction. Each effort level
corresponds to at least one APQT bundle or effort point.
This curve can be divided into three parts--areas 1,
2, and 3. In area 1, satisfaction increases at an
increasing rate. In area 3, satisfaction decreases at an

15
increasing rate; that is, individuals prefer less effort
to more effort for effort levels exceeding E2.
Area 2
is the range bounded by effort levels El and E2
• In this
range~ satisfa~tion neither increases nor decreases as
rapidly as in areas 1 and 2, respectively. In fact, area 2
is shown to have a relatively "flat top," which means that
there is a range of effort-satisfaction points such that
within this range each effort-satisfaction point is
indistinguishable from every other effort-satisfaction
point. This indistinguishable range is referred to as
the "inert area." In Figure 2.3, the inert area is
arbitrarily drawn as the area bounded by effort levels
El and E2 , and satisfaction levels Sl and S2.
Satisfaction
Area 1 Area 3Area 2
SE
'------""-----.......J..-----Efforto
Sl
82
E1 E2
Source: Frantz (1988:79).
Figure 2.3 The Inert Area
16
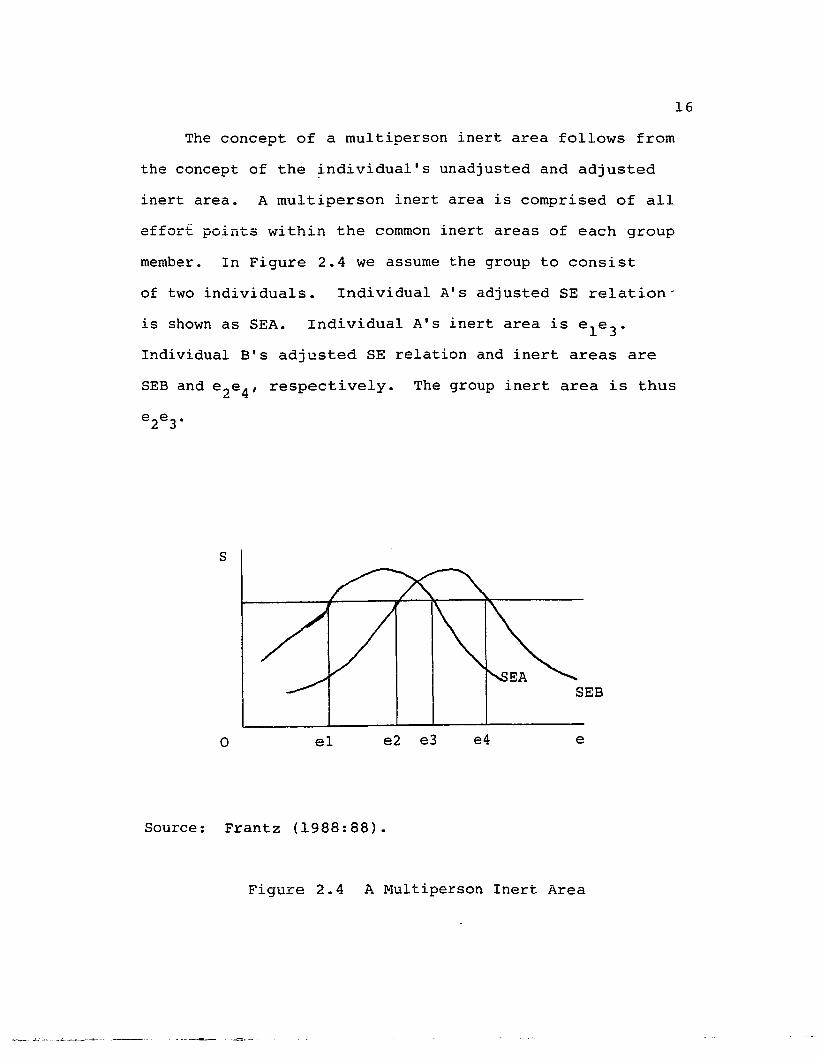
The concept of a multiperson inert area follows from
the concept of the ~ndividual's unadjusted and adjusted
inert area. A multiperson inert area is comprised of all
effort points within the common inert areas of each group
member. In Figure 2.4 we assume the group to consist
of two individuals. Individual A's adjusted SE relation'
is shown as SEA. Individual A's inert area is e le 3•
Individual B's adjusted SE relation and inert areas are
SEB and e 2e4 , respectively. The group inert area is thus
e 2e3 •
S
o el e2 e3 e4 e
Source: Frantz (1988:88).
Figure 2.4 A Multiperson Inert Area

17
As the size of the group becomes larger, group effort
takes on the charac~eristics of a public good. We might
expect that, ceteris peribus, an increase in the number
of group members will reduce the size of the group's inert
area; that is, an increase in the number of group members
reduces the number of effort points that will be acceptable
to everyone. 6
The concept of the multiperson inert area also means
that relatively low as well as relatively high effort
levels will not be part of the group inert area. Thus,
the effort level exhibited by the group will approach the
"average" level of productivity of each group member.
2.2 Empirical Evidence
We now present empirical evidence consistent with
implications of the X-inefficiency theory. Following
Frantz (1988), the evidence is divided into three
categories to review empirical research: (1) evidence
on ownership form, including public versus private owner-
ship, (2) evidence on regulated firms, most notably, public
utilities, and (3) evidence on market structure.
2.2.1 Analysis of Ownership Form
Traditionally, microeconomic theory assumes that
firms attempt to maximize profit--that is, firms are
6Group cohesiveness and productivity is discussedin Frantz and Green (1982).
_-_::.: . .;:...;:":~ .. __._.•.....L-- ....

18
single-minded in the pursuit of profits. Accordingly,
the theory implicit~y assumes that every individual in
the.firm is similarly inclined or that he can be made to
act as if he is. These assumptions are in part due to
viewing the firm as an organization in which the owners
occupy the top of the "pyramid."
In practice, many corporations are owned by a large,
diverse group of stockholders whose interests are not the
dominant force directing these corporations. In other
words, managers have some discretion as to how much of
their physical and mental effort they will consciously
direct toward maximizing the profits of the corporation,
how much will be spent achieving other clearly expressed
goals, and how much will simply be "squandered" from lack
of attention.
Shelton (1967) studied the performance of a group
of firms producing the same output and using the same
capital and non-capital inputs, differing only with respect
to ownership form. The study was carried out for a nation
wide fast-food chain consisting of 22 restaurants, which
were mostly owned and operated by franchisees that were
independent from the parent company both legally and in
terms of own remuneration. Ownership changed from either
a franchisee-owner (Fa) to the company management (eM),
or vice versa. The sales-volume changes were slightly
in favor of FOs, but the profit patterns were more striking.

19
The profit margins (profit/sales) for FOs averaged
9.5 percent; the profit margins for CMs averaged 1.8
percent. An executive of the parent company offered an
explanation for the findings in these terms: "
franchisee-owners just watch the little things closer;
they utilize the cooks and waitresses better; they reduce
waste" (p. 1257). Despite the close supervision and
profit incentives given to company managers, performance
was superior under independent franchisee-owners. Shelton
concluded that investing your own money and being paid
only out of profits made the difference in reducing
X-inefficiency.
Monsen, Chiu, and Cooley (1968) studied the relation
ship between ownership form and profits using industry
data on 72 firms for the period 1952-1963. Profits, or
the return on an owner's investment, were measured as the
ratio of net income to net worth. The authors found that
"two quite different motivation incentive systems are at
work--one for owners and another for managers" (p. 442).
One implication of this finding is that the assumption
of profit maximization is less applicable for manager
controlled firms.
In the matter of public versus private ownership,
publicly owned firms are believed to be less X-efficient
than privately owned ones. The reasons are as follows:
first, the government's taxing powers can be used to
20
subsidize the firm if necessary; second, the owners of
these firms cannot allocate the profits of the firm as
freely as they could if the firm were privately owned;
third,·· publicly owned firms are often monopolies. However,
analysis of the data showed mixed results.
Bruggink (1982) found, based on a sample of 77
publicly owned and 9 privately owned water utilities in
the United States in 1960, that while the slope of both
the average variable and marginal cost curves are identical
for the publicly and privately owned firms, the cost curves
for the publicly owned firms were lower than that for the
private firms. Public ownership is thus associated with
greater X-efficiency. In contrast to Bruggink's findings,
Tyler (1979) and Gillis (1982) found a relatively large
amount of X-inefficiency in public firms, which are
involved in the manufacture of plastics and steel in
Brazil, and mining in Bolivia and Indonesia.
2.2.2 Analysis of Regulated Firms
Justification for a natural monopoly on the basis
of economies of scale relies on the assumption that
X-inefficiency is zero. If the costs of production are
not affected by market structure, then the monopolization
of public utilities is a more appropriate public policy.
If, on the other hand, monopolization raises costs above
competitive industry levels, then the net effect of
monopolization depends on the relative impact of economies
21
of scale (which lowers the cost of a m0nopoly) and
X-efficiency (which. raises the cost of a monopoly).
The relative effects of economies of scale and
X-efficiency were measur-ed by Frimeaux (1977) in his study
of electric utility firms in the United States. He
compared the average total costs of a sample of publicly
owned electric utility monopolists with the average total
costs of a sample of publicly owned electric utility
duopolists for the period 1964-1968, using published data
from the F;ederal Power Commission. The data showed that
unit costs fell among the monopoly firms as output
increased; that is, the monopoly public utilities
benefitted from economies of scale, but that below ~22
million kilowatt hours, the X-efficiency effect outweighs
that of economies of scale. In addition, the data
indicated that the X-efficiency effect is larger for
smaller firms; that is, smaller firms are believed to be
more "disciplined lt by competition than are larger firms.
One criticism of Primeaux's study is based on the
general tendency that monopolies have greater production
capacities than competitive firms. From this one can infer
that the monopolist's higher unit costs may be due not
to X-inefficiency but to the necessity of maintaining a
greater amount of excess capacity. Primeaux (1978) tested
this hypothesis, i.e., that monopolists had greater
capacity, and found that competition had no effect on

capacity utilization. In other words, the capacity
22
"explanation" for h~gher costs among monopolists, along
with the resulting rejection of the x-efficiency
explanation for higher costs, is not consistent with the
findings of his study of capacity utilization and market
structure.
A potential tradeoff exists not only between XB and
economies of scale, but also between XB ana economies of
scope. Economies of scope exist when it is cheaper to
pLoduce two products in one firm than to produce the two
products in separate firms. One example of economies of
scope is a public utility firm that sells both electricity
and natural gas for home heating. However, while economies
of scope may lower the cost of the combination utility
below that of a utility producing either electricity or
natural gas, the lack of competitive pressure may raise
costs above that of the straight utilities via the XE
effect.
stevenson (1982) examined the costs of generating
electricity among a sample of 79 U.S. utilities, 25
combination utilities, and 54 straight utilities. He
defined a combination utility as one that receives at
least 15 percent of its total revenues from gas, while
a straight utl1ity receives less than 5 percent of its
total revenue from gas. In estimating a translog cost
function for all 79 utilities for 1970 and 1972, Stevenson
-._---_.-._-_..._--_.

23
found that the average cost of generating electricity was
lower for straight ptilities than for combination
utilities. He also compared cost functions among straight
and combination utilities for 1964 and 1972 so as to
separate out the effects of the indep~ndent variables
{i.e., input prices: output, the utilization rate of plant
capacity, and regional dummy variables for the Northeast,
Northwest, West, and South} from "time trends." The
results showed that comp~titive pressure not only leads
to lower costs at any point in time, but to a larger down
ward shift in the cost function over time.
2.2.3 Analysis of Market Structure
A study of the relationship between market power and
protection from foreign competition on the one hand and
X-inefficiency on the other was done by Bergsman (1974).
He developed a model for estimating the effects of
protection on both allocative inefficiency and other
inefficiency and presented estimates for six less developed
countries--Brazil, Malaysia, Mexico, Norway, Pakistan,
and the Philippines. He found that by protecting domestic
firms from foreign competition, the price of the foreign
good is higher and consumers select a consumption bundle
different from what would be selected under free trade.
On the other hand, protection resulted in X-inefficiency
when durnestic costs of production could be lowered but
24
are not because the pressure for cost control is reduced
by trade barriers.
Finally, protection resulted in "monopoly returns"
when domestic and foreign costs are kept close despite
protection so that Bergsman lumped X-inefficiency and
monopoly returns together in his estimates. He found that
X-inefficiency plus monopoly returns was significant and
considerably larger than the cost of misallocation. Of
the six countries studied, the total value of the
X-inefficiency and the monopoly returns was around 5 or
6 percent of GNP in two of the countries and between 2
ap-d 3 percent in three others. These effects seem to
depend only on the level of protection, and the size of
the domestic markets does not seem to have any significant
effect (Bergsman 1974:420).
Lecraw (1977, 1979) estimated allocative price
inefficiency and X-inefficiency for a sample of 400 firms
in 12 4-digit industries in Thailand for the period 1962
1974. A non-linear form of the CES production function
was used to estimate the production function directly
without assuming profit maximizing behavior on the part
of the firms. Once the parameters of the CES function
were known, a comparison could be made between each of
the capital-labor (K/L) ratios and the actual and the cost
minimizing level of actual costs. Lecraw estimated the
potential output (Q*) for each firm and then compared it
25
to actual output (Q). If the value of this ratio Q/Q*,
which he called 01, is less than 1.0, this indicated that
the firm is producing less than the maximum possible output
with given inputs. Therefore, a value of 01 that is less
than 1.0 measures the extent of technical X-inefficiency.
Allocative price inefficiency was estimated by taking
the actual capital-labor ratio (K/L) to the capital-labor
ratio that would minimize cost (K*/L*). A value of ~his
ratio, (K/L}/(K*/L*) which Lecraw ~alled02, that is greater
than 1.0 indicates that the firm's capital-labor ratio
is excessively capital intensive; that is, its actual K/L
ratio is in excess of that which, given the input prices,
would minimize costs. Finally, allocative price
inefficiency and X-inefficiency were combined by taking
the ratio of actual total costs for the technology
utilized to the minimum total costs which would be incurred
if the most efficient technology were chosen. He called
this ratio 03. The resulting values of Dl, D2, and D3
indicated the existence of significant amounts of both
allocative price inefficiency and X-inefficiency.
The average value of 01 across the 12 industries was
0.74; that is, on average, each industry was producing
approximately 25 percent less than it could have with
its existing inputs. The average value for 02 across the
12 industries was 1.71, indicating that overly capital
intensive technologies were ereployed on average. The
26
average value 03 was 1.60, indicating that costs exceeded
technologically mi.ni.mum levels by 60 percent. Contrary
to the a priori prediction of X-inefficiency theory,--
however, non-owner managed firms were more X-efficient.
Lecraw's explanation for this seeming contradiction,
which he derived from his interviews with company managers,
is that the managers were not aware of the extent of
X-inefficiency that the owners were willing to allow;
consequently the managers chose an appropriate technology
which maximized profits, which is the main objective of
all enterprises, in order to reduce their risk of censure
QY the owners of the firm (Lecraw 1977:119). In other
words, owner-managers were not only interested in
maximizing profits, i.e., in being X-efficient, but were
also trying to maximize the satisfaction derived from
using modern Western technology which entails some cost
disadvantages. This has come to be known as "e ngineering-
man satisfactions, II a term coined by Wells (1973).
White (1979)· examined the effects of engineering-man
satisfactions by assuming that Pakistani entrepreneurs
wanted to emulate u.s. entrepreneurs' capital/labor
(technology) choices. To test for the effects of
competition on the capital/labor ratio, he used both the
Pakistani four-firm concentration ratio and the percentage
of industry output exported by Pakistani industries. The
latter ratio was measured as a dichotomous variable; that

27
is, industries exporting at least 10 percent of their
output were classif~ed as facing the pressure of foreign
competition while those industries exporting less than
10 percent were considered to be sheltered from foreign
competition.
The capital-labor ratio was defined in three separate
ways, each utilizing a different definition of labor:
(1) total labor, (2) production labor, and (3) non
production labor. White's findings are as follows: (1) as
the captial-labor ratio increases in the United States,
the capital-labor ratio in Pakistan falls progressively
further behind that of its u.s. counterpart; (2) the
capital-labor ratio in Pakistan increases as the 4-firm
concentration ratio increases; and (3) the capital-labor
ratio in Pakistan is higher if less than 10 percent of
the industry's output is exported. These results are
consistent with his hypothesis that competition forces
firms to be more X-efficient, or cost-conscious.
Weiss and Pascoe (1985) performed tests of independent
effects of X-inefficiency and economies of scale (sub
optimal capacity) on the costs of production, using the
Federal Trade Commission's Line of Business Data for 233
manufacturing industries for the years 1974-1976. They
found that X-inefficiency increases in more highly
concentrated industries. While part of this result may

28
be due to economies of scale, they believe that
X-inefficiency is ~till a lively force in highly con
centrated industries. 7
Using the Lecraw (1977) model of the Thai manu-
facturing sector, Kang (1990) measured the X-inefficiency
rate of the total manufacturing sector and small-classified
industries in Korea for the period 1970-1984. According
to his analysis, X-inefficiency of the total manufacturing
sector is 17.2 percent, which is far above the 5-10 percent
rate that is generally presumed. At the same time, the
X-inefficiency rate of the total manufacturing sector
showed a high positive correlation with the general
concentration rate (for the 10 largest company groups and
the 30 largest company groups); that is, the X-inefficiency
rate increases as the concentration rate increases.
Results of an analysis of the industries show
comparatively large X-inefficiency in the labor-intensive
industries and consumer industries, and comparatively
small X-inefficiency in the capital-intensive industries.
In addition, time-series analysis of X-inefficiency and
eR 5, the ratio of sales of top 5 largest firms to total
industry sales, shows a considerably high correlation
7siegfried and Wheeler (1981) provide a usefuldiscussion of the issues in partition X-efficiency,excess capacity, and suboptimal capacity.
29
between the concentration of economic power and
X-inefficiency.
2.3 Criticisms of the XE Theory
Arguments against the XE theory have been made and
some of these arguments are supported by empirical work.
Holtman (1983) maintained that the XE theory and the
empirical evidence supporting it are consistent with
generalized neoclassical theory once the concepts of
uncertainty and utility maximization are included in the
analysis. Holtman's reasoning was that owner-managed firms
in Shelton's study face less uncertainty in the work
efforts of their employees than do company-managed firms,
and hence will have higher profits. Similarly, De Alessi
(1983) asserted that by using the concepts of property
rights and transactions costs, generalized neoclassical
theory is better able to explain the central postulates
f h b . h f t' 8o XE t eory ut W1t ewer assump 10ns.
On the other hand, Schap (1985) argued that the higher
costs of a monopoly are due to the rent-seeking, rent-
dissipation process. Crain and Zardkoohi (1980) asserted
that X-inefficiency is a linear function of rent-seeking
expenditures such that an increase in rent-seeking is
offset by an equally large decrease in X-inefficiency.
8s e e Williamson (1985) for a discussion of ex anteand ex post transactions costs.
~~:.-.;....._;.;_..-_._--~_.._--_.- . ---_.........--- ..-=~.-

30
Thus, changes in X-(in)efficiency have no effect on net
welfare. Rent-seeking and XE theory, however, are not
easily comparable. The idea of rent-seeking rests upon
the concept of rent, which is that part of a payment to
any resource in excess of its opportunity cost. Rent
seeking behavior is a form of maximizing profits and is
purposeful and directed. Thus, the firm expends scarce
resources on rent-seeking until the marginal benefit is
equal to the marginal cost, and hence, given its rent
seeking expenditures, the firm is a cost-minimizer.
The leisure-effort criticism of XE theory is perhaps
most forcefully presented by Stigler (1976). Stigler
attacked the concept of X-inefficiency, 'arguing that it
is based on the lack of motivation of workers and
inefficient market knowledge of the firm. For example,
what appears to be a lack of motivation may actually be
effort directed toward other utility-producing output,
such as, leisure and health, and thus Stigler concluded
that "when more of one goal is achieved at the cost of
less of another goal, the increase in output due to
increased effort is not an increase in efficiency; it is
a change in output" (Stigler 1976:213).
In his response to Stigler's critique, Leibenstein
(1978b) argued that Stigler did not show that the
transference of effort to other utility-producing goals
(for example, leisure and health) results in a compensating

31
increase in utility; thus, there may still be a net loss
in total utility f~om effort discretion. Parish and Ng
(1972), Levin (1974), Peel (1974), and Pasour (1982) made
similar arguments that less output and more leisure is
not necessarily a sign of any type of inefficiency. Martin
(1978) also discussed effort-leisure tradeoffs in the
context of the efficiency effect of protection from
international trade.
In sum, the differences between those who advocate
the XE theory and those who do not seem to be based on
differences in the assessment of the cost of acquiring
information and different evaluations of the value of the
utility produced when workers do not devote maximum effort
to the production of measured output.

32
CHAPTER III
THEORETICAL FRAMEWORK
3.1 Determinants of X-Inefficiency
What are the determinants of X-inefficiency? To
answer this question, Carlsson (1972) synthesizes the
various possible determinants. In an ideal world of
perfect compet~tion where all firms are profit maximizers,
information is perfect and costless, and changes in
technology are costless and instantaneous, there could
be no inefficiency in either the short or long run. All
firms would produce the optimal product mix using the
optimal combination of factors, achieving the maximum
output with their given respective resources.
There are many obvious ways in which reality differs
from this ideal situation. All economists agree that the
absence of perfect competition admits the possibility of
inefficiency because the lack of competitive pressure
allows inefficient firms to survive even in the long run.
The presence or absence of perfect competition is an
empirical, not a theoretical, question. Instead, the
theoretical justification for inefficiency hinges on
whether firms do or do not maximize profits and on what
is meant by "profit maximization." Is profit maximization
the attempt to maximize profits or does it refer to

33
success in maximizing profits? Failure to attempt profit
maximization may be .referred to as ex ante or motivational
failure, while unsuccessful attempts to maximize profits
may be-referred to as ex post (actual or accidental)
failures.
In the absence of competitive pressure, firms are
free to pursue goals other than maxiffiizing profits, and
thus can adversely affect resource allocation and
efficiency in the long run. The existence of non-profit
objectives of individuals and groups within firms is
certainly neither a startling nor novel idea in economics.
We would like to discuss the response of more contemporary
economists to the apparent non-profit maximizing behavior
of firms.
Scitovsky's paper (1943), although appearing more
than 20 years before Leibenstein's first treatment of XE
theory, was original in its approach and served as a
paradigm for others. According to Scitovsky;s model, the
manager has a ~tility function containing income and
leisure as its arguments.
Baumol's model (1959), which was the outgrowth of
his work with a business consulting firm, postulates that
for the "typical" oligopolist, the objective is to maximize
sales subject to the firm earning some "minimum" level
of profits. For Marris (1963), the modern corporation-
i.e., the oligopoly--is characterized by the separation

34
of ownership from finance, and managers maximize utility
which is a function.of the growth of the firm and their
own security.
Williamson (1964) incorporated non-monetary values
into his model of motivation and behavior with an "expense-
preference function." He assumes that managers operate
the firm so as to maximize their own utility, which is
a function of staff, emoluments, and discretionary profits,
subject to the constraint that after-tax profits be greater
than or equal to some minimum level.
Monsen and Downs (1965) show that both size and
corporate ownership form affect behavior, while traditional
price theory treats the firm as if it were a single person.
They assume that in large managerial firms, owners desire
steady dividend income and gradually increasing stock
prices, while managers attempt to maximize their lifetime
income.
Motivational failure may also result from the
separation of ownership and control of the firm due to
differences in objective functions between managers and
owners. Note that these are all sufficient, though not
necessary conditions for inefficiency; it is possible but
unlikely that a managerial firm is as efficient as a
profit-maximizing one. 9 Indeed, the leading managerial
9AS long as the firm is maximizing an objectivefunction, it will reach the frontier, at least in the long
35
models include the traditional profit maximization analysis
as a special case ~hat prevails when the environmental
pressure is sufficiently severe.
It is possible to distinguish between managerial and
behavioral models of the firm. While managerial models
may be regarded primarily as ex ante non-maximizing,
behavioral models emphasize the decision processes by which
the firm tries to reach its goal, which mayor may not
be maximum profits. Thus, in the case when profit
maximization is assumed to be the goal of the firm, it
is possible to bridge the gap between the behavioral and
conventional theories and to put behavioral content into
the profit maximization hypothesis by postulating a set
of decision rules under which the firm operates.
Examples of such rules of thumb are cost-plus pricing,
focal point pricing, fixed payout ratios, etc. While it
is possible that relatively simple decision rules are more
efficient in the long run than "more sophisticated" proce-
dures, adherence to such rules may cause X-inefficiency
run. A firm which maximizes managerial leisure willeventually reach the frontier production function forthat kind of output. But this is a different frontierfrom that which describes the production of the firm'ssaleable output, and the firm would therefore be observedto be inefficient. Another way of stating this is thatcertain outputs of the firm (namely, managerial leisure)may be assigned zero weights in computing the firm'saggregate output, and this leads to observed inefficiency.
36
in particular markets at particular times (i.e., in the
short run). Also, 9nce certain rules are established,
it may be extremely difficult (costly) to change them.
Top officials may be reluctant to disturb colleagues and
subordinates, and even more importantly, minor function
aries are often reluctant to disturb the routines of their
superiors. Leibenstein uses the terms "inert areas" and
"organizational or frictional equilibria" to describe this
kind of behavior. If the stimulus is not strong enough-
for example in the form of a threat to the firm's survival
or to make the potential net gain greater than the costs
(economic, psychic, etc.) of change--the firm will continue
its inefficient practices.
Thus, what may be called frictional costs or costs
of moving to the frontier from an interior position are
one set of sources of inefficiency even in a maximizing
model. Another source is costs of information and
uncertainty, or the costs of discovering the true
production function.
One set of reasons why the production function is
costly to discover has to do with market imperfections
in input markets. As Leibenstein pointed out, contracts
for labor are incomplete, i.e., the employer does not know
the precise capabilities of laborers, and job specifica
tions are incomplete. Also, many inputs are not marketed
37
at allor, if marketed, are not available on equal terms
to all firms. Exam~les of these are managerial skills,
technical knowledge, and patent rights. Thus each firm
may be faced with a different set of production factors
and hence a different achievable production function.
Of course, we are interested in relative efficiency, i.e.,
the efficiency of each firm relative to the best existing
and applied technology in the industry.
A profit-maximizing firm may be X-efficient with
respect to its own production function, given its resources
(both purchasable and non-purchasable) and environment,
while it is inefficient with respect to the industry
production function. This is true because other firms
in the same industry have different resource endowments
(particularly with respect to non-purchasable inputs) and
can therefore reach a different production function. At
the cost of acquiring the proper information and making
the necessary adjustments in its production processes,
any firm in the industry can reach the industry's frontier.
The presence of uncertainty also makes it costly
to discover the true frontier. uncertainty causes
X-inefficiency by adversely affecting the average
utilization of capital and the size of the firm and by
making production planning more difficult due to the
uncertainty of prices on output (especially if the product
is new), the unpredictability of competitors, changes in
--...;..,:;.--.~..-~---_-..-.:...-.._- .-_..

38
raw material prices and wages, and other costs, especially
in projects requiring several years for completion.
3.2 Characteristics of Industrial Structure
.' d' 101n Korea an Ta2wan
3.2.1 Industrial Structure
Since the 1960s, both Taiwan and Korea have
experienced rapid economic growth. Accordingly, the
industrial structures of both countries have changed.
As shown in Table 3.1, the mining and manufacturing
industry sector of Korea, which occupied 19.5 percent of
GNP in 1965, increased to 30.3 percent in 1983, while the
agriculture and fishery sector decreased from 24.7 percent
in 1965 to 16.3 percent in 1983. In Taiwan, the mining
and manufacturing industry occupied 22.6 percent of GNP
in 1965 and 44.2 percent in 1983, but the agriculture and
fishery sector decreased from 26.0 percent to 7.2 percent
over the same period. In both countries, export manu-
facturing increased rapidly with the progress of
industrialization. From the beginning of the 1980s, the
value of manufactured exports increased more than threefold
in Taiwan and Korea. This growth in manufactured exports
reflects the fact that industrialization in both countries
was accomplished through the development of the export
manufacturing sector.
10 h i " d J: • d h 1T 15 sect20n 2S rawn ~rom Econom1cs an Tec no ogyInstitute (1989).
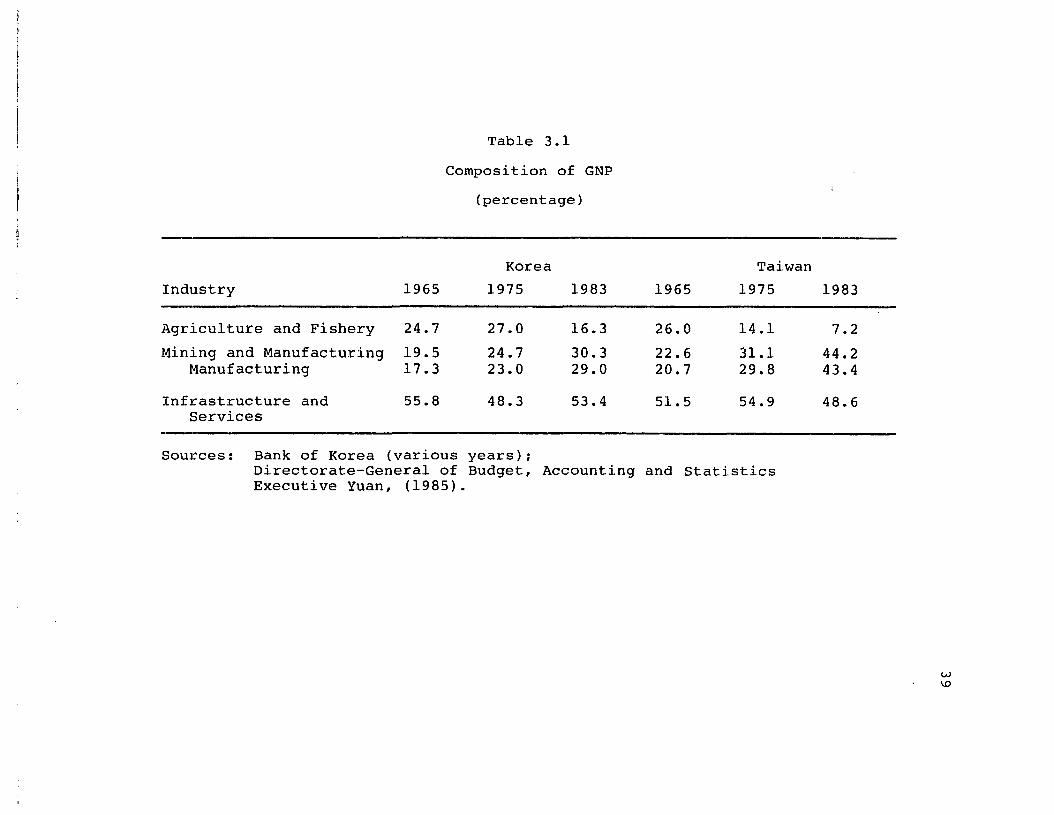
Table 3.1
Composition of GNP
(percentage)
Korea Taiwan
Industry 1965 1975 1983 1965 1975 1983
Agriculture and Fishery 24.7 27.0 16.3 26.0 14.1 7.2
Mining and Manufacturing 19.5 24.7 30.3 22.6 31.1 44.2Manufacturing 17.3 23.0 29.0 20.7 29.8 43.4
Infrastructure and 55.8 48.3 53.4 51.5 54.9 48.6Services
Sources: Bank of Korea (various years);Directorate-General of Budget, Accounting and StatisticsExecutive Yuan, (1985).
WI.D
40
The shift in the structure of the manufacturing sector
in both countries f9llows the standard pattern in which
the ·relative importance of the primary industries decrease
while "that of the secondary industries increase. But there
are also some differences in the development of the
manufacturing sector between these two countries.
In Taiwan, the ratio of manufacturing products to
GDP is comparatively higher than that of Korea, and the
number of those employed in the Taiwan manufacturing sector
is also higher. While this is partly due to the deeper
industrialization in Taiwan, the main reason is that
Taiwan's industrialization has had a greater employment
creating effect compared to Korea's. This is a natural
result of the fact that Taiwan has promoted the industrial
ization strategy by fostering small and medium-sized firms.
On the other hand, Korea's industrialization process has
focused on promoting large enterprises which lag behind
the small and medium-sized firms in terms of employment
creation.
Both countries have similar patterns of change in
the internal manufacturing industrial structure: both
reflect Hofman's industrialization process in which the
rate of the production-goods industries in the national
economy is increasing while the growth of the consumer
products industries is decreasing (see Table 3.2). The
production rate of the heavy and chemical industries, and

41
the volume of exports and employment are all increasing,
reflecting the fact that the industrial structure of both
countries ~re shifting from light industry to heavy and
chemical industry. In other words, as industrialization
deepens, the heavy and chemical industry has expanded as
the comparative advantage changed from the labor-intensive
light industry sector to the capital-intensive heavy and
chemical industry sector.
Notwithstanding, around 1980, the speed with which
the heavy and chemical industries developed in the two
countries differs somewhat. In 1976, output from the heavy
and chemical sector as a share of total manufacturing
output was almost the same at 29 percent in both countries.
However, by 1985, the shares had increased to 40.7 percent
and 34.4 percent in Korea and Taiwan, respectively. with
regard to exports, the ratio of heavy and chemical products
to total manufactured exports was similar at around 27
percent in 1976: but by 1985, the shares had risen to 49.4
percent in Korea and 34.5 percent in Taiwan. The employ
ment pattern also supports the view that the development
of the heavy and chemical industry in Korea has been more
rapid than that of Taiwan in the 1980s.
These differences in the pattern of development of
the heavy and chemical industries are due to the
substantial investments in the heavy and chemical
industries in Korea. Beginning in the mid-1970s, Korea

Table 3.2
Industrial Structure of Korea and Taiwan
Korea
1976 1980 1985
Ratio of the heavy and chemicalindustries' output to total GNP 28.8 32.1 40.7
Ratio of the heavy and chemicalindustries' exports to 27.1 38.6 49.4total exports
1976
28.2
27.2
Taiwan
1980
35.7
30.4
1985
34.4
34.5
Ratio of employment in theheavy and chemical industries 25.3 27.6 31.9 27.3 30.9 29.3to total employment
Manufacturing/GOP (%}a 20.6 29.6 30.7 36.7 40.1 40.0b
Notes:
Sources:
aManufacturing sector and GOP of Korea are based on 1980 fixed prices.Those of Taiwan are based on 1981 fixed prices.
bpigure for 1984.
Economic Planning Board (various years); Bank of Korea (various years);Directorate-General of Budget, Accounting and Statistics, ExecutiveYuan (1985, 1986).
,J:.
l\J

43
began to concentrate its investments in the steel,
machinery, shipmen~, electronics, and automobile
industries, and fostered them as export industries. This
policy resulted in sluggish business activities in the
beginning of the 1980s due to overlapping and excessive
investments. But these concentrated investments also
promoted rapid industrialization, especially export
industrialization of the heavy and chemical industry.
In contrast to the industrialization process of Korea,
Taiwan promoted public enterprises rather than private
enterprises, though a considerable amount of private
investment in the heavy industry and chemical sector was
carried out by small and medium-sized enterprises. Thus,
the Taiwanese style of industrialization resulted in a
slower speed of the export industrialization in the heavy
industry and chemical sector.
Data on the share of value-added and the number of
employees of various-sized firms in the manufacturing
sector in Korea and Taiwan are shown in Table 3.3. In
Korea, the shares of large firms.' value-added and number
of employees to the total value added and number of
employees in the manufacturing sector were 39.2 percent
and 26.8 percent, respectively, in 1967; these shares
increased to 55.0 percent and 43.4 percent in 1979. On
the other hand, in Taiwan, the shares of value-added and
number of employees for large firms decreased from 60.1
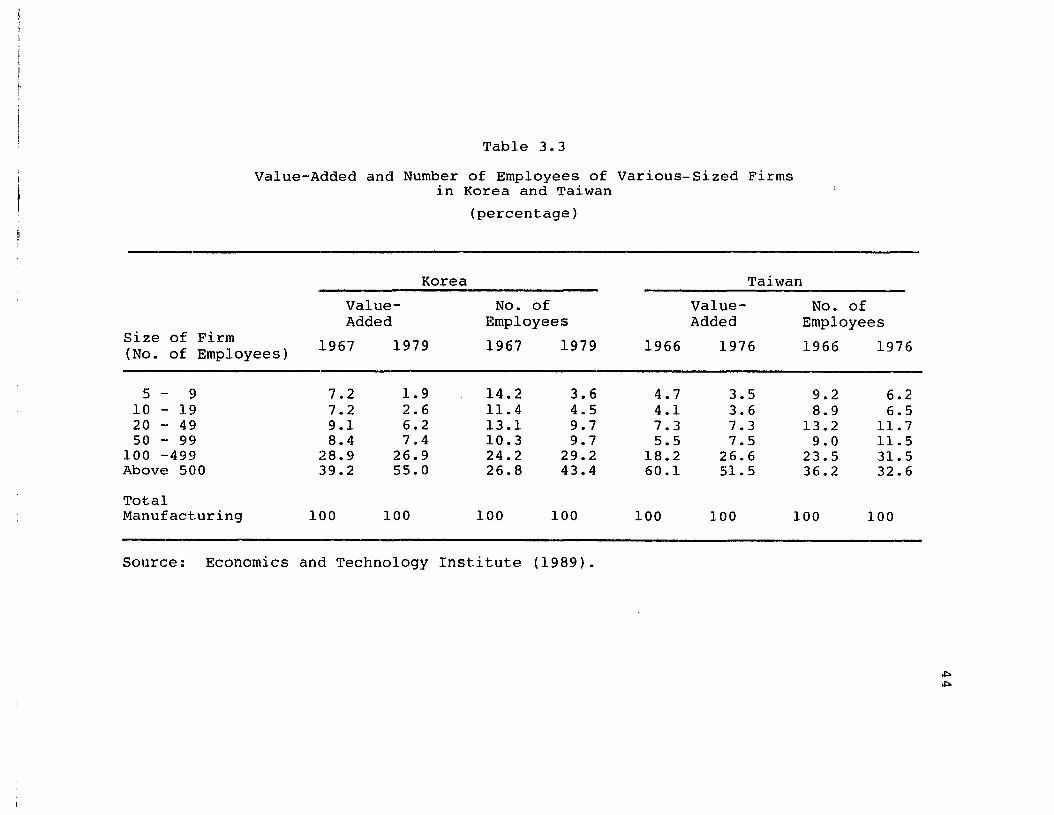
Table 3.3
Value-Added and Number of Employees of Various-Sized Firmsin Korea and Taiwan
(percentage)
Korea Taiwan
Value- No. of Value- No. ofAdded Employees Added Employees
Size of Firm1967 1979 1967 1979 1966 1976 1966 1976(No. of Employees)
5 - 9 7.2 1.9 14.2 3.6 4.7 3.5 9.2 6.210 - 19 7.2 2.6 11.4 4.5 4.1 3.6 8.9 6.520 - 49 9.1 6.2 13.1 9.7 7.3 7.3 13.2 11. 750 - 99 8.4 7.4 10.3 9.7 5.5 7.5 9.0 11. 5
100 -499 28.9 26.9 24.2 29.2 18.2 26.6 23.5 31. 5Above 500 39.2 55.0 26.8 43.4 60.1 51. 5 36.2 32.6
TotalManufacturing 100 100 100 100 100 100 100 100
-Source: Economics and Technology Institute (1989).
>l:>>l:>

45
percent and 36.2 percent, respectively, in 1966, to 51.1
percent and 32.6 pe!cent in 1976. These figures indicate
that Korea's industrial structure has shifted toward large
enterprises, based on capital-intensive heavy and chemical
industrialization.
3.2.2 Industrial Concentration
The industrial concentration rate can be analyzed
by using the sales amount, number of employees, assets,
on value-added as the criterion. In this study; comparison
of industrial concentration in Korea and Taiwan uses the
sales amount as a standard firm scale. For Korea, the
concentration rate was calculated as the ratio of the
total sales of the largest three companies to toal sales
of the industry (there were 331 5-digit classification
industries), and for Taiwan, the concentration rate was
calculated as the ratio of total sales of the largest four
companies to the total sales of the industry (131
industries).
As shown in Table 3.4, Taiwan's industrial concentra
tion is remarkably different from that of Korea. For
instance, Korea's share of high concentration industries
of above 60 percent were 55.9 percent and 52.9 percent
in 1977 and 1981, while Taiwan's remained at 22.9 percent.
In short, Taiwan's industrial market structure is
relatively competitive compared to that of Korea. In
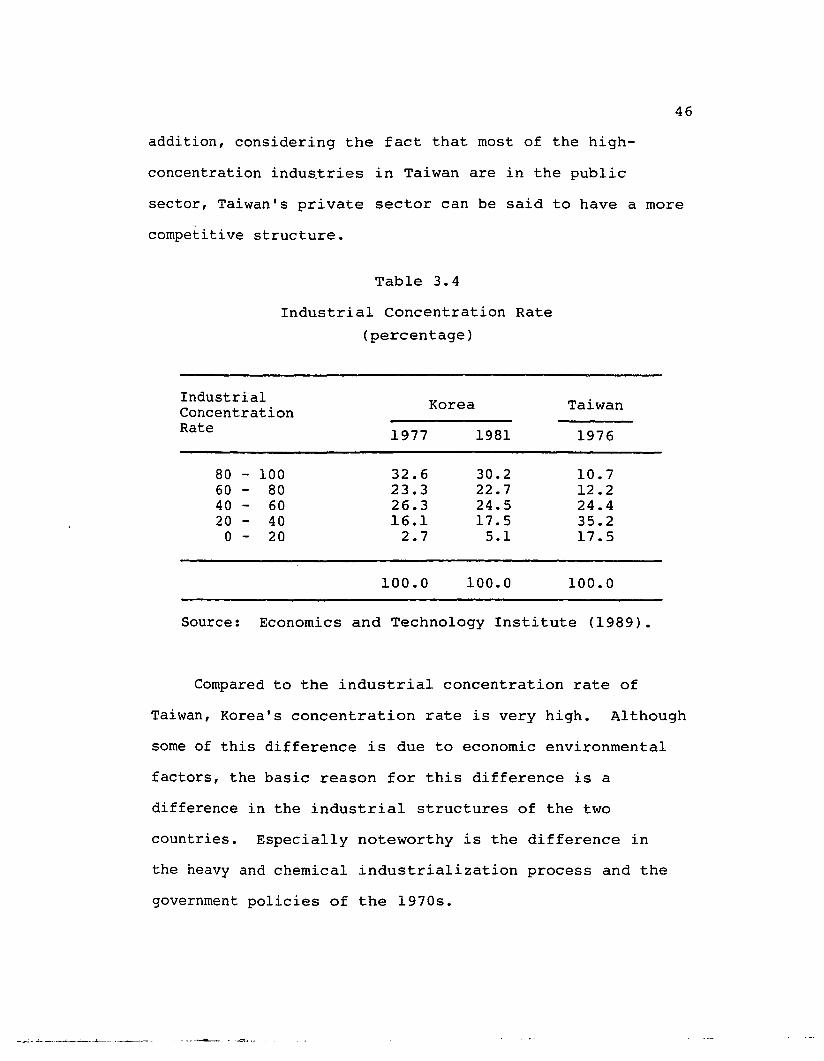
46
addition, considering the fact that most of the high-
concentration indu~tries in Taiwan are in the public
sector, Taiwan's private sector can be said to have a more
competitive structure.
Table 3.4
Industrial Concentration Rate
(percentage)
Industrial Korea TaiwanConcentrationRate 1977 1981 1976
80 - 100 32.6 30.2 10.760 - 80 23.3 22.7 12.240 - 60 26.3 24.5 24.420 - 40 16.1 17.5 35.2
0 - 20 2.7 5.1 17.5
100.0 100.0 100.0
Source: Economics and Technology Institute (1989).
Compared to the industrial concentration rate of
Taiwan, Korea's concentration rate is very high. Although
some of this difference is due to economic environmental
factors, the basic reason for this difference is a
difference in the industrial structures of the two
countries. Especially noteworthy is the difference in
the heavy and chemical industrialization process and the
government policies of the 1970s.
_~_ .;.....~.. __..l-.-~•. -4--__ .. ..

47
A major factor behind the different industrial
concentration rates of Korea and Taiwan is the different
industrial technology policies of the two countries,
especially monetary assistance and interest rate policies.
Taiwan's policy assistance was non-discriminating. Korea's
policy assistance, on the other hand, was concentrated
in special industrial sectors, especially the export and
heavy and chemical sectors; there was relatively
insufficient assistance for small and medium-sized firms.
Most of the Korean monetary assistance was carried
out through policy financing, which provided capital to
strategic heavy and chemical industries such as iron and
steel, non-ferrous metals, shipbuilding, machinery,
chemicals, and electronics. Especially since the late
1970s, when heavy and chemical industrialization was
promoted in full scale, policy financing was concentrated
toward large, capital-intensive heavy and chemical
strategic industries.
Moreover, these policy-financed companies enjoyed
the double benefit of lower interest and capital avail
ability (at least until the rates for financing loans and
general loans were equalized in 1982). The fact that this
generous policy financing was provided mostly to large
enterprises explains the rapid expansion of Korean
conglomerates and the relative degradation of the status

48
of small and medium-sized firms which are engaged in light
industries.
Korean interest rates were relatively low, while
Taiwan adopted a high interest rate policy. Since a low
interest rate policy would induce a relatively capital
intensive industrial structure, the low interest rate
economy would result in a relatively more capital-intensive
heavy and chemical industrialization than would a high
interest rate economy. Thus, with a high interest rate
policy, Taiwan has promoted development of labor-intensive,
small and medium-sized enterprises. As a result, in spite
of the promotion of heavy and chemical industrialization,
Taiwan's industrial concentration is not very high. On
the other hand, Korea experienced rapid growth of
industrial concentration after it began to promote heavy
and chemical industrialization. These differences are
attributed to the different interest rate policies pursued
by the two countries.
49
CHAPTER IV
MEASUREMENT OF X-INEFFICIENCY
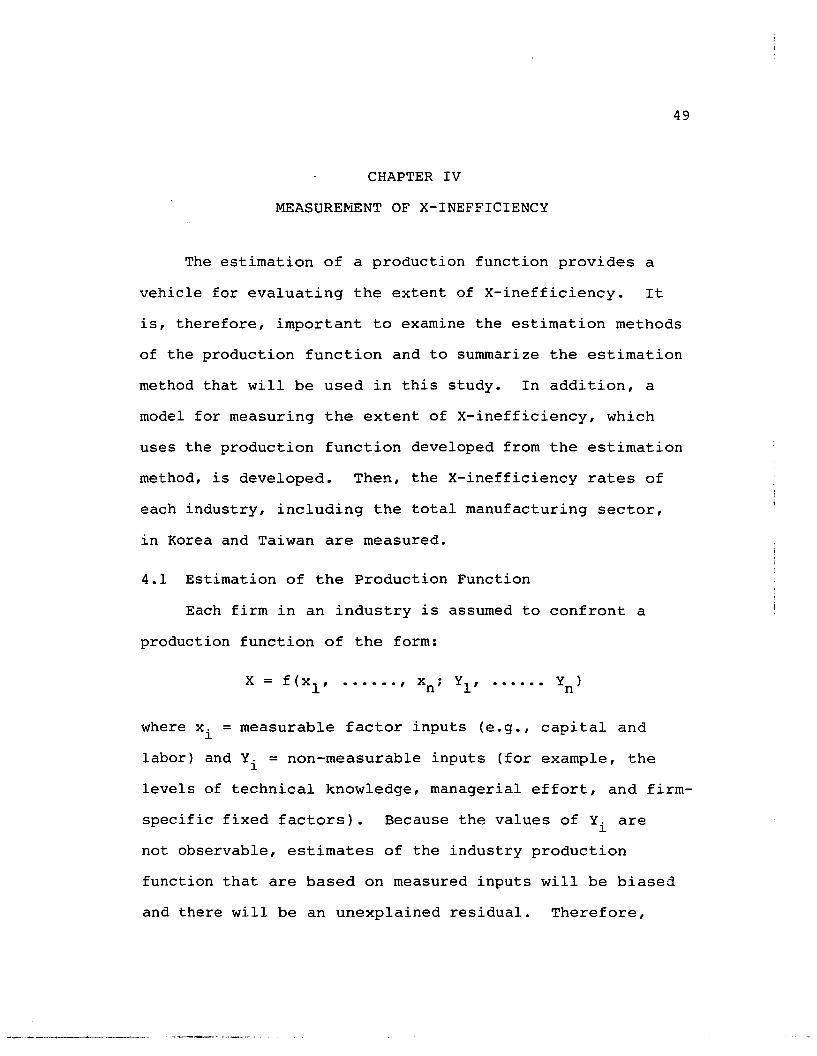
The estimation of a production function provides a
vehicle for evaluating the extent of X-inefficiency. It
is, therefore, important to examine the estimation methods
of the production function and to summarize the estimation
method that will be used in this study. In addition, a
model for measuring the extent of X-inefficiency, which
uses the production function developed from the estimation
method, is developed. Then, the X-inefficiency rates of
each industry, including the total manufacturing sector,
in Korea and Taiwan are measured.
4.1 Estimation of the Production Function
Each firm in an industry is assumed to confront a
production function of the form:
X = f(xl,...... , x .
n'
where x. = measurable factor inputs (e.g., capital and1.
labor) and Yi = non-measurable inputs (for example, the
levels of technical knowledge, managerial effort, and firm-
specific fixed factors). Because the values of Y. are1.
not observable, estimates of the industry production
function that are based on measured inputs will be biased
and there will be an unexplained residual. Therefore,

50
the residual will contain the specification, aggregatiou,
and measurement err9rs which are unavoidable in empirical
estimation of production functions.
Among the many methods of inferring production
functions, this paper employs the method used in Arrow,
Chenery, Minhas, and Solow (1961) and Diwan (196~).
4.1.1 The Arrow, Chenery, Minhas and Solow(196l) Method
A production function, which is homogeneous and has
a constant elasticity of substitution, can be shown as
follows:
where X = value-added
K = capital
L = labor (amount of labor input measuredby manhour)
y = production efficiency.
is = capital intensiveness
p = substitution rate among factors
\l = economies of scale
and y>O, 0<0<1, p>-l.
The elasticity of substitution (cr) is expressed as
cr={l/l+p). Thus when p = 0, equation (l) reduces to a
Cobb-Douglas production function, and when p~=, equation
(1) is the Leontief production function.
( 1 )
51
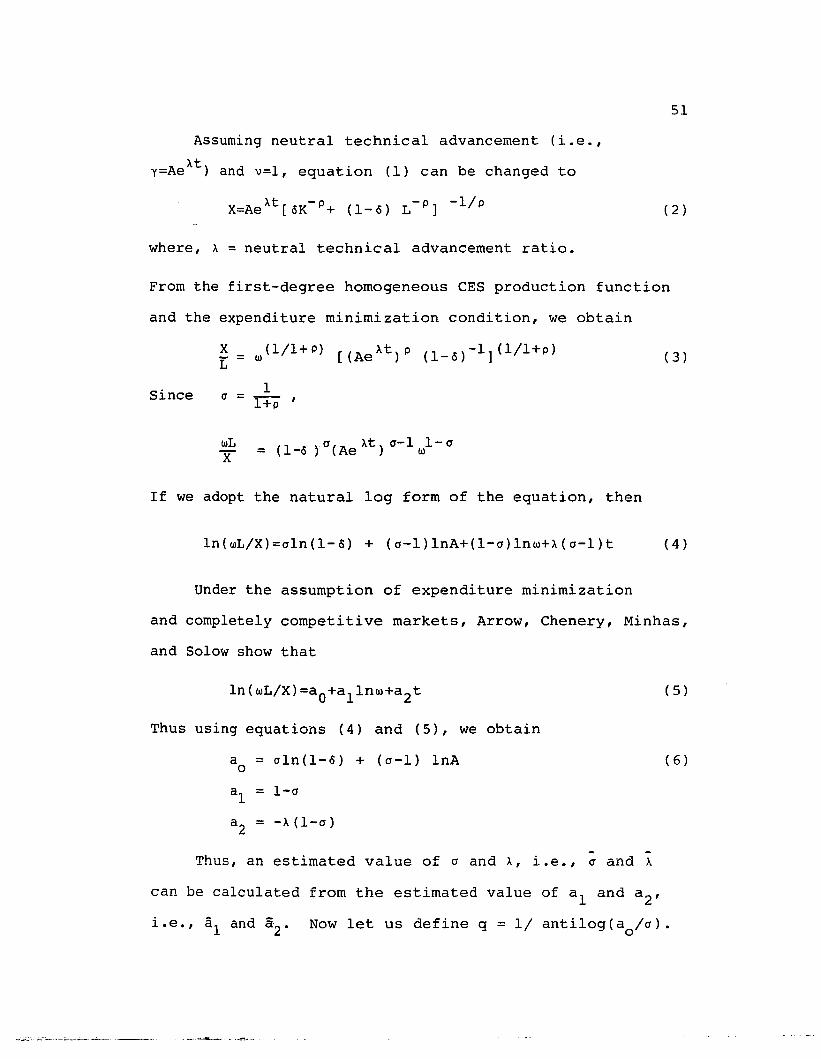
Assuming neutral technical advancement (i.e.,
xty=Ae ) and v=l, equation (1) can be changed to
where, x = neutral technical advancement ratio.
( 2 )
From the first-degree homogeneous CES production function
and the expenditure minimization condition, we obtain
since
E= w(l/l+P) [(Aext)P (l_o)-l](l/l+p)
1a = l+p ,
( 3 )
If we adopt the natural log form of the equation, then
In(wL/X)=aln(l-o) + (a-l)lnA+(l-a)lnw+X(a-l)t (4)
Under the assumption of expenditure minimization
and completely competitive markets, Arrow, Chenery, Minhas,
and Solow show that
Thus using equations ( 4 ) and ( 5 ) , we obtain
a = aln(l-o) + ( a-l) InA0
al = I-a
a2 = -A(l-a)
Thus, an estimated value of a and X, i.e., a and A
( 5 )
( 6 )
...-~-;.;""--':":""" ...~~_ ..--,:,,,-.-
can be calculated from the estimated value of a l and a2,
i.e., al and a2 • Now let us define q = 1/ antilog(ao/a) •

52
From equation (6) and since p = (l-a)/a, we obtain
q = AP/(l-o).
If we let y= Ae At in the production function and express
A in terms of q, we find, after some manipulation that,
Xl - X2 = 0/(1-0)
where Xl = q(K/X)Pe APt, X2
= (K/L)P.
The value of 0/(1-0) can be inferred to be the mean value,
(Xl-X2 ) , so the estimated value of 0 can be calculated.
Lastly, A can be calculated from aO= cr In(1-6) + (a-I)
InA.
4.1.2 The Diwan (1969) Method
When we assume economies of scale and neutral tech
nological advancement (i.e., Y=Ae At), the general CES
production function can be obtained as follows:
where Y=AeAt = neutral technology advancement
v = economies of scale
K = capital
L = labor (amount of labor input asmeasured by manhour)
X = value-added
o = capital intensiveness
a = 1/ (l+p), p= substitution parameter
and y>O, 0<0<1, p>-l.
(7)
53
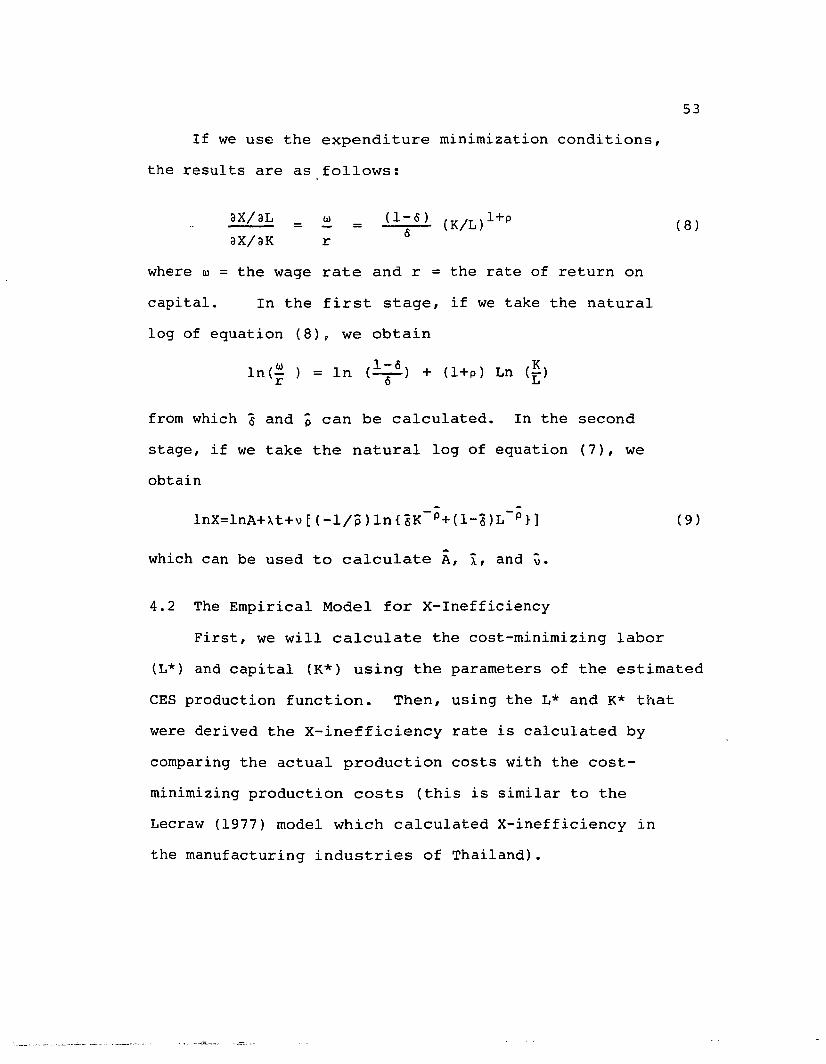
If we use the expenditure minimization conditions,
the results are as follows:
aXIaLax/aK
w=r
= (1-0) (K/L)l+ps ( 8 )
where w = the wage rate and r = the rate of return on
capital. In the first stage, if we take the natural
log of equation (8), we obtain
In(~ ) = In (!=!) + (1+1') Ln (!)r 0 L
from which 5 and p can be calculated. In the second
stage, if we take the natural log of equation (7), we
obtain
- -InX=lnA+xt+vE(-l/p)ln{5K-p+(1-5)L-p}]
which can be used to calculate A, x, and v.
4.2 The Empirical Model for X-Inefficiency
First, we will calculate the cost-minimizing labor
( 9 )
(L*) and capital (K*) using the parameters of the estimated
CES production function. Then, using the L* and K* that
were derived the X-inefficiency rate is calculated by
comparing the actual production costs with the cost-
minimizing production costs (this is similar to the
Lecraw (1977) model which calculated X-inefficiency in
the manufacturing industries of Thailand).

54
4.2.1 Cost-Minimizing Labor (L*)
The following ~quation results from the cost-
minimizing conditions are,
The natural log of equation (10) is
v -p(p+l)lnL=lnA+At+ln(l-o)+ln'1-(-+l)ln[oK +p
(l-o)L-P]-lnw
From equation (9), we get:
(11),
(12)
If we substitute equation (12) into equation (11),
we obtain the following:
(p+l)lnL=lnA+At+ln(l-o)+ln'1-('1+p) (!)[lnA+At-lnX]-lnw (13)p "
1 - P '1+pInL*=(p.rr) [,,(lnA+At)+ln(l-o)+ln'1+ --'1-lnX-lnw] (14)
4.2.2 Cost-Minimizing Capital (K*)
Using the cost-minimizing conditions, we obtain the
following
r= ax/ aK=Ae At (_~) [ sx"p+ (1- 0) L- p] - ( '1/ P2:.-1°(-p)K- p-:-1p
KP+l=AeAto'1[oK-P+(l-o)L-P]-'1/p)-l/i (15)
If we apply the natural log to equation (15) we derive
(p+l)lnK=lnA+At+lno+ln'1-(~+l)ln[K~P+P
(1- 0 ) L - ~ j .;Lrrr (16)

55
Similar to the approach used in determining the cost-
minimizing level of labor, substitute equation (12) into
equation (16), to derive
(p+l)lnK=lnA+At+lno+lnv-(v+P)(~)[lnA+At-lnX]-lnrv v1 -P v+p
InK*=(---+l) [--j (lnA+At)+lno+lnv+(---)lnX-lnr]p v v
4.2.3 The Actual Model for Analysis
X-inefficiency is related to the cost level of
enterprises. An enterprise that is X-efficient is
(17)
(18)
operating at the industry's minimizing cost level, while
an enterprise that is X-inefficient is operating at a cost
level that is above the minimizing cost level. Accordingly,
the fact that monopoly causes not only allocative
inefficiency but also X-inefficiency means that a monopoly
firm operates above the minimizing cost level.
Allocative price inefficiency was estimated by taking
the ratio of the actual capital-labor ratio (K/L) to the
capital-labor ratio which would minimize cost (K*/L*),
(K/L)
(K*/L*)(19)
If Dl is greater than 1, then the firm's capital-labor
ratio is excessively capital-intensive: that is, its actual
K/L ratio is in excess of that which, given input prices,
would minimize costs. If Dl is less than 1, then the K/L
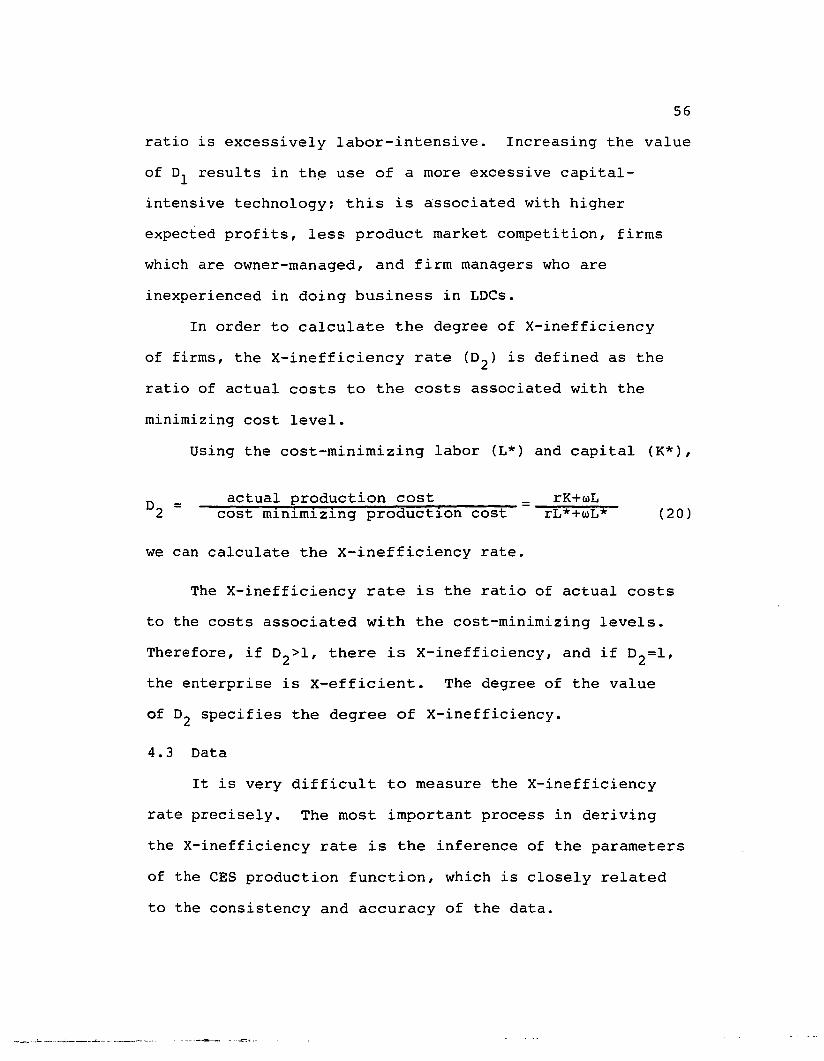
56
ratio is excessively labor-intensive. Increasing the value
of 01 results in th~ use of a more excessive capital
intensive technology; this is associated with higher
expected profits, less product market competition, firms
which are owner-managed, and firm managers who are
inexperienced in doing business in LOCs.
In order to calculate the degree of X-inefficiency
of firms, the X-inefficiency rate (02) is defined as the
ratio of actual costs to the costs associated with the
minimizing cost level.
Using the cost-minimizing labor (L*) and capital (K*),
(20)rK+wL
rL*+wL*actual production cost =
cost minimizing production cost ~~~~~
we can calculate the X-inefficiency rate.
The X-inefficiency rate is the ratio of actual costs
to the costs associated with the cost-minimizing levels.
Therefore, if 02>1, there is X-inefficiency, and if 02=1,
the enterprise is X-efficient. The degree of the value
of 02 specifies the degree of X-inefficiency.
4.3 Oata
It is very difficult to measure the X-inefficiency
rate precisely. The most important process in deriving
the X-inefficiency rate is the inference of the parameters
of the CES production function, which is closely related
to the consistency and accuracy of the data.
__ ._ ..... _ .. _._":;_~._-L-_._. ••

57
To set up the model for analysis, data on value-added,
labor, capital, the. wage rate, and the rate of return on
capital are needed. Here, labor refers to total labor
hours·of total laborers and the wage rate is the average
wage rate per time unit. Although it is not difficult
to measure value-added, labor, and wage rates, there are
many problems in measuring capital and the rate of return
on capital because of the difficulty in defining these
terms and other problems. Therefore, for these two
variables, concrete definitions should be established and
appropriate alternative variables should be used.
4.3.1 The Capital Stock
So far, there is no consistent and accurate method
for calculating the capital stock. The method for
measuring the capital stock varies in each country and
requires much time and labor. However, for the purpose
of this analysis, the following broad definition is given.
Capital stock is accumulated through the economic
cycle process, and is used for a given period and consumed
or becomes outdated due to continuous technological
development or is lost through unexpected incidents such
as an accident or a disaster. In general, two definitions
are used to measure the capital stock--gross capital stock
and net capital stock.
Gross capital stock is also referred to as the
reacquisition value of capital and is the amount needed
_".-:::.:• .;...:;....:-.._~.....;.......:....---L- . ._ .•• _ ••........--....- ~ .• -=.•._.
58
to reacquire the capital stock as a new product. Net
capital stock is tne reprocurement value of capital, and
is the amount needed to reprocure the capital at the time_.
of the estimation period. Thus, net capital stock
indicates the value of the capital stock taking into
account depreciation.
Capital stock can be defined in various ways depending
on the purpose of the analysis. The actual capital stock
of a production function is generally defined as an
indicator of production capacity of existing capital assets
in a unit period, and is calculated as the reacquisition
value (gross capital stock) of the capital which was
appraised according to a base year and reprocurement value
(net capital stock).
Note here two points regarding the inference of
capital stock in this analysis. First, capital (the object
of the inference) is limited to tangible fixed capital
which excludes inventory assets, for it is very difficult
to calculate the value of intangible capital. Second,
capital flows are excluded from this analysis.
To measure capital stock, pya's (1987, 1991) first
estimates net capital stock using different depreciation
rates for each industry and asset and then estimates gross

59
capital stock considering capital abolition will be used
for Korea. 11
4.3.2 The Rate of Return on Capital
In a perfectly competitive market system, the cost
of a production input is identical to its marginal
productivity. Accordingly, in theory, the cost of capital
is equal to the marginal product of capital and is
identical to the interest rate under a perfectly
competitive market system. In reality, however, perfectly
competitive markets do not exist, it is very difficult
to calculate marginal productivity. There are too many
restraints on using the real interest rate as a measure
of the marginal product of capital, and we must instead
use the income received by a unit of capital for the rate
of return on capital.
Considered to be the opportunity cost of capital,
the rate of return on capital is determined by the credit
and financial status of a company and an appraisal by
investors of the potential profitability of the firm.
Accordingly, in this analysis, two alternative variables
are used on proxies for the rate of return on capital.
The first alternate variable is (value added-wages)/
tangible fixed assets. The second proxy is the average
llsee Pyo (1987) for a detailed explanation on hisestimation method of capital stock.
60
loan interest rate of financial institutions and other
sectors.
4.3.3 Sources of the Data
The Korean data used for the empirical analysis of
this study were obtained from various issues of the Report
on Mining and Manufacturing Survey by the Economic Planning
Board from 1970 to 1989, Financial Statements Analysis
by the Bank of Korea, and Labor Statistical Yearbook by
the Ministry of Labor. Due to the lack of data on the
number of employees and labor hours in some industries,
the CES production function was estimated using data for
19 years from 1971 to 1989. Although an estimate of the
production function for the total manufacturing sector
and for 28 3-digit industries were intended, the tobacco
industry (314) and the footwear industry (324) were
excluded because of insufficient data; as a result, the
production function of the total manufacturing sector and
26 3-digit industries were estimated.
Data on gross capital stock are from Pyo (1987).
The year-end gross values of tangible fixed assets were
calculated using purchasing and selling amounts from the
Report on Mining and Manufacturing Survey. The average
loan interest rate is obtained from the Financial State
ments Analysis. In order to convert nominal values to
real values, the wholesale price index was used to deflate
wages and value-added.

6l
Among the competitive environment variables, the
concentration rate~ CR3 and CRS estimated by the Fair Trade
Corr~ittee of the Economic Planning Board were used for
the degree of industry concentration; the data used for
production function estimation were also used for the
degree of capital intensity. For the variable defining
the degree of foreign dependency, adjustments were made
to the values of export and import dependency derived in
the input-output table of the Bank of Korea. For the
tariff level, a simple average of data for 3 years (1978,
1982, 1988) from the Agency of Korea Customs were used.
Taiwanese data from 1970 to 1989 were obtained from
various issues of the Taiwan Statistical Data Book, Taiwan
~, Survey of Taiwan Industrialists by the Council for
Economic Planning and Development. Due to insufficient
data on number of employees and value-added, the CES
production function was estimated using 1973-1988 data.
For comparative study with Korea, 2-digit industries that
are similar to the Korean 3-digit industries were selected,
and the production function was estimated for the total
manufacturing sector and 20 2-digit industries.
Since there are no estimated data on capital stock
in Taiwan, the "real operational asset" was employed as
a proxy variable. This variable is calculated using the
same increasing rate from 4-year data (1971, 1976, 1981,
1986) in the Survey of Taiwan Industrialists. As for

62
tangible fixed assets as a proxy for the rate of return
on capital, the val.ues of "real fixed assets" in the
Taiwan Statistical Data Book were used as proxies.
For the variable on competitive environment, a simple
average of CR5 for 4 years (1985-1988) in the Taiwan
Statistical Data Book was used for the degree of industry
concentration. As in the Korean case, the data used for
production function estimation were used for the degree
of capital intensity. For the degree of foreign dependency,
export and import data from the Taiwan Trade Statistical
Monthly, which is published by the Ministry of Finance,
were employed. Production data were obtained from the
Taiwan Industrial Production Statistical Monthly, which
is published by the Council for Economic Planning and
Development. Tariff level data, however, were not
available.
4.4 Empirical Results and Interpretation
To estimate the CES production function, the Arrow,
Chenery, Minhas, and Solow (ACMS) method and the Diwan
method were applied. As a proxy variable for the rate
of return on capital, the ratio of (value added-wages)/
tangible fixed asset (VWT hereafter) and the average loan
interest rate (ALI) were used. As a result, the
X-inefficiency rate (Dl and O2) was consistent in both
Korea and Taiwan when the ACMS method was applied and when
63
VWT was used as a proxy variable for the rate of return
on capital. This m~ans that estimating the CES production
function by the ACMS method is the result of using a strong
restraint condition of the parameter v which shows the
extent of the economies of scale to be 1. In addition,
the fact that using the VWT variable yields consistent
results shows that this proxy variable reflects the rate
of return on capital relatively well. Consequently, the
ACMS production function estimation method and the VWT
'11 b d . Lv z i i nef f i 12measure W1 e use ~n ana YZ1ng X-1ne 1c1ency.
Table 4.1 shows the X-inefficiency rates for the total
manufacturing sector and 26 3-digit industries in Korea.
These rates were calculated from the result of the
production function estimation which was obtained with
the ACMS method using VMT as a proxy variable for the
rate of return on capital. Because a log value for the
parameter of the production function was not available
for one industry, 01 and 02 of the total manufacturing
sector and only 25 of the 26 industries were estimated.
As shown in Table 4.1, Dl is 1.204 and 02 is 1.153
for the total manufacturing sector. These values indicate
that the total manufacturing sector in Korea is capital-
intensive and 15.3 percent X-inefficient. Among the
12 por a comparison of the results using the Oiwanmethod and the ALI measures, see Appendix Tables A.3 toA. 5.2.

Table 4.1
X-Inefficiency Rate: Korea
Industry Average
DlRange
D2Average Range
Total
Food & BeveragesTextilesApparelLeatherWood ProductsFurniturePaper ProductsPrinting & PublishingIndustrial ChemicalsOther Chemical ProductsPetroleum ProductsOther Petroleum ProductsRubber ProductsPlastic ProductsPottery, China & EarthwareGlass & Glass ProductsOther Non-metallic Mineral
ProductsIron & Steel Basic Industries
1.204
1.7281.3400.9032.8660.4100.4821.1431.1310.9941.5131.4650.7771.9530.8400.9141.160
1.7802.400
0.761-1.548
0.5J.7-7.1791.054-1.7800.606-1. 3800.760-6.8420.169-0.6480.067-0.9570.828-1.3430.443-1.5590.403-1.5431.027-1.9850.758-1.8790.232-1.6810.563-8.3270.378-1. 3250.140-1.5220.740-1. 959
1. 346-2.2631. 359-6.382
1.153
1. 5391.2320.9432.0870.5650.6861.1051.0830.9971.4151.4540.8251.5470.8970.9541.107
1. 6232.073
0.794-1. 367
0.720-5.6831.048-1.47'30.796-1.1750.834-4.1020.403-0.8670.420-0.9730.744-1.2380.586-1. 4300.509-1.3001. 008-1. 8170.954-2.6340.330-1.4120.770-5.1210.588-1.2470.484-1. 2180.840-1. 450
1.308-2.2121. 317-3. OOC
0'\~

Table 4.1 (continued)X-Inefficiency Rate: Korea
D1D2
Industry Average Range Average Range
Non-ferrous Metal Basic Products 2.514 0.811-7.397 2.125 1.005-6.736Fabricated Metal Products 1.072 0.721-1.409 1.048 0.878-1.287Machinery 2.241 1.282-3.650 1.794 1.304-2.642Electrical Machinery 1.040 0.561-1. 567 1.014 0.592-1.450Transport Equipment 1.975 1.058-5.247 1. 699 1.073-3.626Professional & Measuring
Equipment 1.038 0.456-2.052 1. 006 0.646-1. 452Other 1.262 0.783-1.680 1.159 0.854-1.446
0'1VI
66
industries, the leather, rubber, primary iron and steel,
primary non-ferrou~ metals, machinery, and transport
equipment industries have relatively large values of 01.
That is, these industries are more capital intensive
compared with the real factor price ratio. On the other
hand, the wood, furniture, and other petrochemical
industries are labor-intensive industries. The values
of 02' which reflects the X-inefficiency rate, were above
2 in the leather, primary iron and steel, and primary
non-ferrous metals industries, indicating that the
X-inefficiency rates of these industries are over 100
percent. The wood and furniture industries show the lowest
X-inefficiency rate.
Recall that there exists a close relationship between
01 and 02. As was shown in Table 5.3, the coefficient
of correlation between 01 and 02 is 0.987, indicating an
almost absolute correlation.
The X-inefficiency rates for industries in Taiwan
are shown in Table 4.2. As with the rates in Table 4.1,
the X-inefficiency rates were calculated with the ACMS
method which estimated the production function using VWT.
Of the total manufacturing sector and 20 2-digit
industries, the average value and range of 01 and 02 of
17 industries and the total manufacturing sector were
calculated. Three industries were excluded since the
_~_ . .;.... ~ ._,:,,-,_-6.-__ .~ ..
67
parameter of the production function did not have a log
value and the production function could not be estimated.
According to Table 4.2, the values of 01 and 02 of
the total manufacturing sector are 1.395 and 1.269,
respectively. These values indicate that the total
manufacturing sector in Taiwan is capital-intensive and
has an X-inefficiency rate of 26.9 percent. Compared with
Korea, Taiwan is more capital-intensive and has a higher
X-inefficiency rate.
This result is quite different from what was
originally expected. Nevertheless, the surprising findings
can be explained. One possible explanation lies in the
managerial efficiency of large enterprises. It seems that
the increased economic concentration or rise of the
chaebol, i.e., large business groups in Korea, may in part
be a requirement for rapid economic growth. X-inefficiency
in terms of organizational and entrepreneurial advantages
possessed by chaebol may have been particularly important
in their moving into new, large-scale, capital-intensive
areas requiring modern technology, such as heavy and
chemical industries. This may also explain the govern
ment's tendency to rely on large chaebol groups to achieve
efficiency through economies of scale, especially in the
heavy and chemical industries, and to promote exports by
establishing general trading companies.
__ •. ...l- _ •.••_. ~_ .•. • .• _.•-.~ -•.• ..e': ••_.
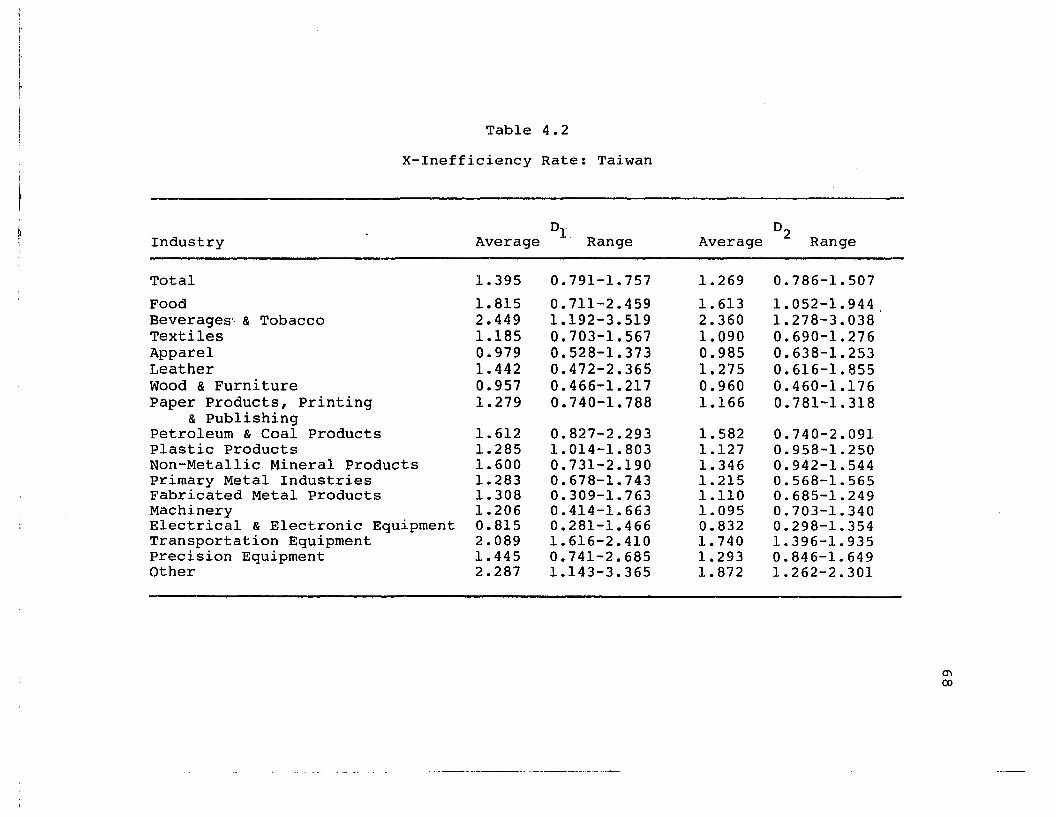
Table 4.2
X-Inefficiency Rate: Taiwan
Industry°1Average . Range °2Average Range
Total
FoodBeverages' & TobaccoTextilesApparelLeatherWood & FurniturePaper Products, Printing
& PublishingPetroleum & Coal ProductsPlastic ProductsNon-Metallic Mineral ProductsPrimary Metal IndustriesFabricated Metal ProductsMachineryElectrical & Electronic EquipmentTransportation EquipmentPrecision EquipmentOther
1.395
1.8152.4491.1850.9791.4420.9571.279
1.6121.2851.6001.2831.3081.2060.8152.0891.4452.287
0.791-1.757
0.711-2.4591.192-3.5190.703-1.5670.528-1.3730.472-2.3650.466-1.2170.740-1.788
0.827-2.2931.014-1.8030.731-2.1900.678-1.7430.309-1. 7630.414-1.6630.281-1.4661. 616-2.4100.741-2.6851.143-3.365
1.269
1. 6132.3601.0900.9851.2750.9601.166
1.5821.1271.3461.2151.1101.0950.8321. 7401.2931.872
0.786-1.507
1. 052-1. 9441.278-3.0380.690-1.2760.638-1.2530.616-1.8550.460-1.1760.781-1. 318
0.740-2.0910.958-1.2500.942-1. 5440.568-1.5650.685-1.2490.703-1.3400.298-1.3541.396-1.9350.846-1. 6491. 262-2.301
enco
69
The primary advantage enjoyed by the chaebol lies
in synergy, or the ~conomies of scope inherent in multi
product activities. As pointed out earlier, entrepreneur
ship is an important constraint, especially in the early
stages of economic development. The chaebol can more
easily obtain the capital, technology, and managerial
resources required to transform an idea into an innovation
and an economic opportunity into an actual investment and
production decision; in this respect, they are able to
make better use of entrepreneurship. In Korea, this was
particularly relevant for the export drive and industrial
restructuring during the past two decades. The participa
tion of chaebol in a number of different markets
facilitated the flow of information, which in turn reduced
uncertaintyin decision-making on investment and production.
At the same time, diversification dispersed risk and
stabilized the rate of return on investment for the
chaebol.
A second explanation for the unexpected results is
that the proxy variables of capital stock used for both
countries rely on different estimation methods. Given
that the capital stock is the most important variable in
the estimation of the production function, results obtained
using a cross-sectional approach which are presented in
the next chapter, seem to be more appropriate.
70
Therefore, comparing the X-inefficiency rates of both
countries by the ab~olute value of 01 and 02 seems
inappropriate. It would be more reasonable to compare
the X~inefficiency rates of industries within each
country rather than the X-inefficiency rates of industries
across the two countries.
As shown in Table 4.2, the food, transportation
equipment, and other manufacturing industries are more
capital-intensive compared with the real factor rice ratio
and the apparel, wood and furniture, and electric machinery
industries are relatively labor-intensive. The values
of 02 are similar to the values of 01 suggesting that there
is a significant correlation between 01 and 02 in Taiwan
(as was the case in Korea). The correlation coefficient
between 01 and 02 is 0.974, again indicating an almost
absolute correlation although less than that of Korea (see
Table 5.4).13
l3s e e Appendix Tables A.l and A.2 for a parametricestimation of production functions by industries usingthe ACMS method and VWT measure in Korea and Taiwan.

71
CHAPTER V
TEST OF THE HYPOTHESIS
5.1 Hypothesis
5.1.1 The Hypothesis to be Tested
Since it was postulated earlier that the lack of
competition is the main theoretical determinant of
X-inefficiency, the main efforts of this analysis of
efficiency are directed at finding an acceptable measure
of the degree of competition. The basic difficulty is
that there is no generally accepted theory of how
competition should be measured, and even if there were
such a theory, the necessary data may not be available.
Hence, complementary measures such as the concentration
ratio, the nominal tariff level, etc. are used here.
The concentratio ratio is one of the most commonly
used measures of the competitive structure of an industry.
The implicit assumption is that the higher the degree of
seller concentration, the lower is the degree of
competition, i.e., the concentration ratio is supposed
to measure the market power of the largest firms. A number
of writers have suggested that a high concentration may
make for high price-cost margins as collusion is likely
to be more effective the greater is the share of the larger
firms.

72
An alternative explanation is that increasing
concentration leads. to an increase in unit wage costs
relative to material costs; this, in turn, may be due to
X-inefficiency and/or labor union pressure in more
concentrated industries.
However, because of the difficulty of taking foreign
competition into account in computing concentration ratios
and because the possibilities of the existence of close
substitutes, the concentration ratio may not be a very
good measure of competition. Even more important in the
present context, is that it is unclear, as one might expect
at first, that the concentration ratio should be negatively
correlated with the level of efficiency, especially in
the presence of economies of scale (unless the concentra
tion ratio can be corrected for these) and if firms
specialize in a narrower range of output than the industry
as a whole. In fact, the more important are the economies
of scale and specialization, the greater is the probability
that the concentration ratio is positively correlated with
the efficiency index.
In order to correct the concentration ratio for
economies of scale, capital intensity (a kind of
technology) can be used as one of several scale variables.
Wells (1973) and Ranis (1975) have generated hypotheses
concerning appropriate technology. They argue that because
of import protection and few domestic producers, the
~.--- j,... -_•••~-----:-----.•---_•••
73
absence of competition in many markets in LDCs may also
discourage labor-i~tensive technology. Protected
producers, cushioned from the cost-minimizing rigors of
competition, may well "indulge" in capital-intensive
production methods. If this argument is correct, it
,,;:;..,j
implies that pro-competition (and pro-trade) policies in
LDCs may be more beneficial than just the static deadweight
loss measures would indicate. Unfortunately, this
hypothesis has had only anecdotal impressionist support
and has not been rigorously tested.
Wells and Ranis argue that in less developed
countries, this inefficiency is likely to take the form
of excessive use of capital-intensive equipment and
methods. Capital-intensive technologies involve large
quantities of shiny new equipment, which convey the aura
of being up-to-date and yield high prestige. They may,
as Wells argues, bring out the engineering instincts in
entrepreneurs. They require less administrative efforts
on the part of entrepreneurs, particularly with respect
to labor relations, since there are fewer workers to be
supervised. In short, capital-intensive equipment in less
developed countries embodies a fair amount of non-pecuniary
benefits. The entrepreneur enjoying a monopoly or market
power position (whether it be due to protection by tariffs
or licenses or other barriers to entry by potential rivals)
is likely to trade off some potential profits for equipment
74
that is more capital-intensive than cost minimization would
dictate. In contr~st, the entrepreneur in a more
competitive environment finds his choices more limited
and under tighter constraints, and he is likely to choose
more labor-intensive methods. 14
For the analysis of industrial characteristics of
Korea and Taiwan as they are related to X-inefficiency,
the following testable hypothesis is proposed: the
industry in a less competitive environment has more
X-inefficiency. This competitive environment hypothesis
can be subjected to econometric tests if one has data on
the relative competitiveness of different industries.
5.1.2 Model for the Hypothesis
The most important factor involved in testing the
hypothesis proposed above is the selection of proxy
variables for the competitive environment. Korea and
Taiwan have achieved rapid economic growth with outward-
looking policies during the last three decades. Therefore,
international competition as well as market competition
must be taken into consideration.
In order to prepare the testable model for the
competitive environment hypothesis, estimates of Dl and
D2 are used as the dependent variable. Regressors include
the concentraion ratio and capital-intensity as proxies for
l4s e e White (1979).
-_ ..__..-._---._---_ __ _-_.

75
market competition, and the degree of foreign dependency
and the tariff level as proxies for international
competition. For foreign dependency, the export/output
ratio-is used as a proxy for the degree of export
dependency and the import/consumption ratio is used as
the proxy for the degree of import dependency.
Regression equations for testing the hypothesis can
be set up as follows:
01 = f (CR, KI, XO, IO, TL)
02 = (CR, KI, XO, IO, TL)
where CR = concentration ratio
KI = capital-intensity
XO = export dependency
IO = import dependency
TL = tariff level
These two regression equations are estimated using data
on 28 industries in Korea (3-digit level) and 20 industries
in Taiwan (2-digit level), including total manufacturing
sector for the 1970-1989 period.
5.2 Empirical Results and Interpretation
Table 5.1 shows the regression results of the test
of the competitive environment hypothesis in Korea. 1 5
15I n the Korean case, CR3 and CR5 were simultaneouslyused as proxy variables for industry concentration. Theresults exhibit a higher significance level for CRS thanCR3. On the other hand, Table 5.3 displays the CRS resultssince only it was used as an indicator of industry concentration in Taiwan •
.>-..--..- _._------_ ..---_....
':..-.-..- ...... _.~._~- ..,-""",---
76
The regression results for 01 show that we cannot
reject at the 5 pe~cent marginal level of significance
the hypothesis that capital intensity, import dependency
and t~riff level have a positive effect on the level of
allocative inefficiency. The concentration ratio and
export dependency do not, however, have any statistically
significant effect.
Capital intensity may indicate the presence of scale
economies; import dependency on the use of imported
capital equipment; and the tariff level larger capacities
than economically efficient at the level of free-trade
prices. It appears that they all tend to lead to the use
of an overly capital-intensive technique.
The regression results for 02 also show that we cannot
reject at the 5 percent marginal level of significance
the hypothesis that capital intensity, import dependency,
and tariff level have a positive effect on the level of
X-inefficiency. It is clear that the factors that lead
to the choice of overly capital-intensive techniques also
contribute to X-inefficiency" In other words, in the case
of Korea the policy of promoting capital-intensive
industries with tariff protection has led to waste of
capital and X-inefficiency.
The regression results for Taiwan (Table 5.2) show
that in the case of Taiwan only the industrial concentra-
tion ratio is a statistically significant factor for °1 "
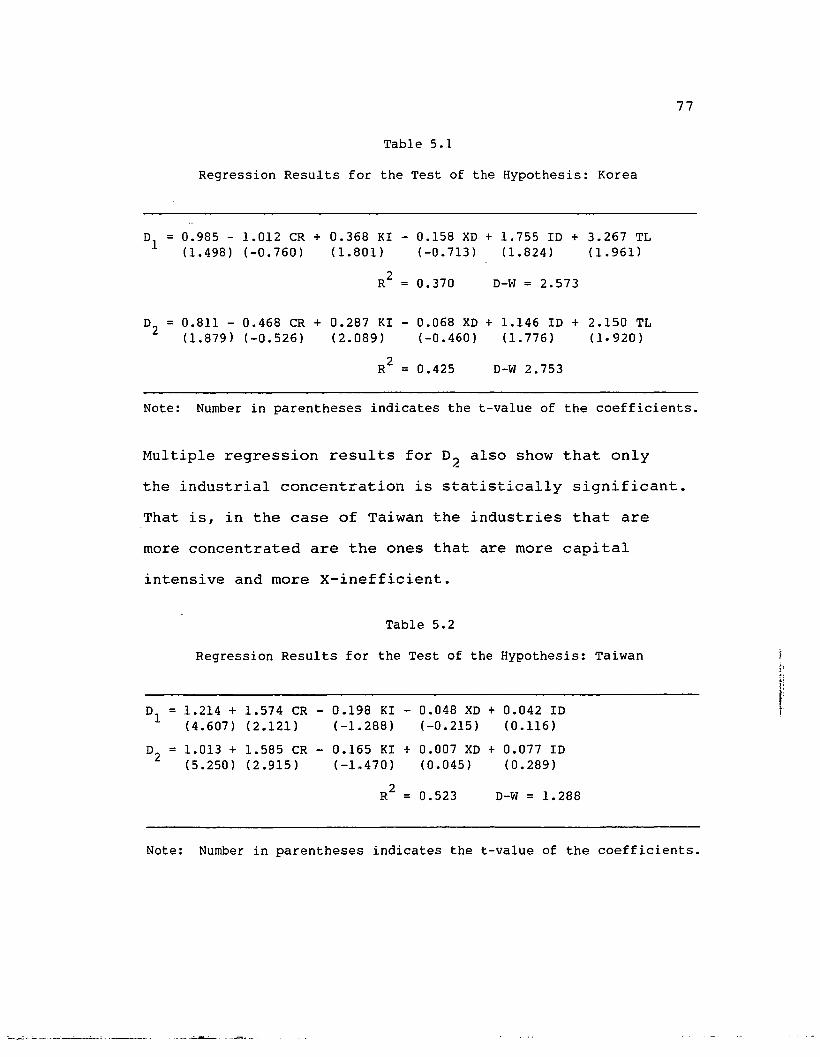
77
Table 5.1
Regression Results for the Test of the Hypothesis: Korea
01
0.985 1.012 CR + 0.368 KI - 0.158 XO + 1. 755 ID + 3.267 TL(1.498) (-0.760) (1.801) (-0.713) (1.824) (1.961)
R2 0.370 o-w = 2.573
O2
= 0.811 - 0.468 CR + 0.287 KI 0.068 XO + 1.146 ID + 2.150 TL(1.879) (-0.526) (2.089) (-0.460) (1. 776) (1.920)
R2= 0.425 o-w 2.753
Note: Number in parentheses indicates the t-value of the coefficients.
Multiple regression results for 02 also show that only
the industrial concentration is statistically significant.
That is, in the case of Taiwan the industries that are
more concentrated are the ones that are more capital
intensive and more X-inefficient.
Table 5.2
Regression Results for the Test of the Hypothesis: Taiwanf:.;r:
01 1.214 + 1.574 CR 0.198 KI - 0.048 XO + 0.042 IDf'
= r(4.607) (2.121) (-1.288) (-0.215) (0.U6)
O2
= 1.013 + 1.585 CR 0.165 KI + 0.007 XO + 0.077 ID(5.250) (2.915) (-1.470) (0.045) (0.289)
R2
= 0.523 o-w = 1.288
Note: Number in parentheses indicates the t-value of the coefficients.
:"-~_. .--_.• --"':_~_---L-_~_. .
78
The different results for Korea and Taiwan may be
explained in terms of different growth strategies taken
by these two economies. Although they both have taken
an export-oriented growth strategy, Korea's industrial
structure is centered on large private enterprises and
heavy and chemical industries whereas Taiwan's industrial
structure is generally focused on small and medium-sized
firms and light industries and large public enterprises
in mostly import-substitute industries. In the case of
Korea, large private enterprises are basically in the
export business and their large size would therefore not
confer any monopoly power to them. In contrast, the large
public enterprises in Taiwan would have monopoly power
and would therefore be inclined to be more X-inefficient
than their Korean private counterparts. It should be noted
here that the different results for the two countries can
be due in part to the different proxy variables we have
16used for import dependency.
16Korea: import dependency = impo~t/total supply =
import/intermediate demand + consumption+ export
Taiwan: import dependency = import/production

Table 5.3
Correlation Coefficient Matrix: Korea
79
D1 D2 CR KI XD ID TL
D1 1.000
D2 0.987 1.000
CR 0.371 0.440 1.000
KI 0.336 0.442 0.694 1.000
XD -0.258 -0.277 -0.285 -0.312 1.000
ID 0.326 0.305 0.398 0.081 0.027 1.000
TL 0.202 0.155 0.005 -0.3800 -0.021 -0.053 1.000
Table 5.4
Correlation Coefficient Matrix: Taiwan
D1 D2 CR KI XD ID
D1 1.000
D2 0.974 1.000
CR 0.519 0.660 1.000
KI 0.227 0.348 0.793 1. 000
XD -0.283 -0.296 -0.437 -0.332 1.000
ID -0.154 -0.157 -0.202 0.004 -0.027 1.000
----._~_..---:-_..-'.__...__._.. . -~---....-...- _..-=~.-

80
CHAPTER VI
CONCLUSION
The purpose of this study is to apply the X
inefficiency theory in analyzing the different character
istics of the industrial structure in Korea and Taiwan.
As discussed in Chapter II, according to Leibenstein,
there are three reasons for the existence of X-inefficiency.
First, labor contracts are incomplete. Second, the
production function cannot be precisely determined or
known. Third, not all of the input elements are marketed,
and for those that are, the appraisal of their value may
differ between purchasers. Because of these reasons, the
cost minimization hypothesis of the neoclassical economic
theory is generally not viewed as accurate.
In general, X-inefficiency grows with less competitive
pressure and the degree of separation between ownership
and management. Competition has the effect of making firms
more rational. This effect can be created by reducing
the opportunity to engage in the various forms of
discretionary behavior available to employment of the
monopolist, including behaving in an arbitrary, sloppy,
bureaucratic, arrogant, and non-responsive fashion. Such
inefficient behavior is also due to the fact that the

81
manager's concern over the company's profit is generally
less than that of tpe owner.
Since the lack of competition is the main theoretical
determinant of X-inefficiency, a competitive environment
hypothesis was proposed in this study. The hypothesis
is that an industry in a less competitive environment has
greater X-inefficiency. For competitive environment
variables, the concentration ratio and a measure of capital
intensity were used to test for market competition, and
measures of export dependency, import dependency, and
tariff levels were used to test for international
competition.
6.1 Summary
The test results for Korea show the hypothesis that
capital intensity, import dependency and tariff level
significantly affect the X-inefficiency rate cannot be
rejected at a relatively high significance level. In
Korea, the industries with relatively high capital
intensity, relatively high import dependency, and
relatively high tariff rates are the heavy and chemical
industries which the government promoted as import
substitute industries in the 1970s. Given that they were
actively promoted with subsidized credit and protection
from foreign competition, it is not surprising to ·find
a relatively high rate of X-inefficiency in these

82
industries. On the other hand, in Taiwan only the
industrial concentr?tion variable cannot be rejected (again
at a relatively high significance level). This is to be
expected as the more highly concentrated industries in
Taiwan tend to be state-owned enterprises in protected
domestic markets and would thus tend to be more capital
intensive and more X-inefficient.
The fact that the industrial concentration variable
is statistically significant for Taiwan but not for Korea
may be in part due to the omission of the tariff variable
for Taiwan. It is, however, more likely that the
difference in their industrial structure. Because of
Taiwan's focus on small and medium-sized firms and light
manufacturing industries, capital intensity hardly affects
X-inefficiency whereas for the Korean industrial structure,
which is based on large firms and heavy and chemical
industries, capital intensity affects X-inefficiency to
a greater degree.
6.2 Policy Implications
Since the results of this study imply that uncompeti
tive industries tend to have greater X-inefficiency, it
suggests many policy implications. That is, in enforcing
policies, it is important to move in a direction in which
the competitive environment is promoted. For instance,
although we could accept the notion and existence of scale
83
economies, extreme capital intensity could hinder the
competitive enviroqment of the market economy.
Additionally unconditional industry protection could hamper
the competitive environment and increase X-inefficiency.
The concentration of economic power may be inevitable,
so long as a discrepancy in entrepreneurial capabilities
among individuals exists. At the same time, it cannot
be denied that diversification of business activities is,
at least partly, a natural manifestation of profit-seeking
and risk-dispersing motives. Therefore, public policy
toward pro-competition should tread the line between
discouraging the inefficient or anti-competitive diversifi
cation and respecting bona fide entrepreneurship. The
most effective means for this may be to expose firms to
competitive pressures. Faced with tight competition, no
firm has recourse but to shed itself of excess capacity
in terms of organization and inefficient management. In
this respect, pro-competition policies such as the removal
of entry barriers to firms from home and abroad is both
fundamental and necessary.
What is needed for firms in the ever-changing world
is not a "blind" adherence to the same old market but
flexible adjustment, resulting at times in diversification
across different markets or in focusing on a niche in the
firm's traditional market. The characteristics of a firm
84
are defined, not by the nature of its products, but by
its managerial resqurces. Even among firms in the same
market, therefore, the pattern of adjustment, in terms
of both internal reorganization and product mix, is
different when market conditions change. It is hence a
matter-of-course that the government does not interfere
in the decisions of private firms, providing instead
competitive incentives for the self-specialization of
firms.
The Korean economy has benefited thus far from the
presence of the chaebol. They have mobilized resources,
taken risks, and spearheaded success in a range of
industries. Their vigorous competition with each other
has been essential to Korean dynamism. At this stage,
however, the chaebol's role in the economy must not only
change but must become less central if rapid advancement
is to continue. The presence of more independent firms
that are more focused on particular fields of specialty
will foster innovation and be a force for upgrading
competitive advantage. More centers of initiative, more
potential buyers for new products and services, and less
political clout in the hands of a small group of firms
will be essential to further economic development.
As is true in any rapidly advancing economy, the
vigor of domestic rivalry has been essential to industrial
success to date. There are inevitable pressures to curb

85
domestic rivalry. In addition, the ability of large groups
to discourage entry is considerable, given their size and
relationship with the government. It is important for the
government to resist the tendency to focus on the short
term "inefficiency" of domestic rivalry and miss its
fundamental significance for dynamic progress. Strong
anti-trust laws need to be established, as well as an
orientation to prevent too much concentration in
industries. Mergers that consolidate an industry to one
or more firms should be prohibited.
Furthermore, one of the policy measures toward pro
competition is to foster small and medium industries
(SMIs). This policy has been based on a number of
objectives, including an "affirmative action" program
to offset past discriminatory access to credit and prevent
auY abuses of credit markets by monopolistic borrowers,
i.e., the large fir~s. These measures to overcome
distortions in the credit master are "second-best inter
ventions" and should be considered prudent and useful
interim measures until capital market biases can be wrung
out of the system.
Another objective of an active SMI policy is that
smaller firms are better able to withstand demand shocks,
since they have greater flexibility to adapt their
production techniques and products. This flexibility is,
of course, dependent on access to capital. There may be
86
technological advantages to the economy of SMls in terms
of innovation; however, a distinction should be made
between small industries and medium-sized industries
because some minimum production levels are normally needed
to sustain certain modern technological innovation.
Finally, future research directives and problems for
empirical analysis on X-inefficiency remain. First, since
the estimated parameters of the production function
sensitively react to the materials, calculating level and
methods, research period, and model setting, it is
recommended that several models employing various methods
be estimated and compared with one another. Second,
development of more practical and economically proper proxy
variables for the capital stock and the rate of return
on capital, which are the most critical variables in
estimating the production function, is required. Third,
development of generalized competitive variables, which
is the most important variable in the competitive
environment hypothesis, and development of adequate proxy
variables for X-inefficiency are also necessary.

87
APPENDIX
APPENDIX TABLES
Table A.l
Parameter Coefficients of Production Function: Korea (ACMS, VWT)
0.0830.5860.643XIO-5
0.3730.865
Industry
Total
Food & BeveragesTextilesApparelLeatherWood ProductsFurniturePaper ProductsPrinting & PublishingIndustrial ChemicalsOther Chemical ProductsPetroleum ProductsOther Petroleum ProductsRubber ProductsPlastic ProductsPottery, China &
EarthenwareGlass & Glass ProductsOther Non-metallic
Mineral ProductsIron & Steel Basic
IndustriesNon-ferrous Metal
Basic ProductsFabricated Metal ProductsMachineryElectrical MachineryTransport EquipmentProfessional &
Measuring EquipmentOther
_-":' .. J- .:-. .._~_~_~__ . . . ,. ~_._-.-.-...- •..~. o.
0.508
0.9530.4350.3620.9100.9500.7100.0230.3750.6570.8050.7650.7390.6230.7940.454
0.3610.453
0.774
0.643
0.236
-0.007
0.1890.041
-0.0710.1740.1210.0530.0850.1910.042
-13.9290.013
-0.0050.6910.1680.137
0.073-0.009
0.246
-0.096
0.1430.3660.1180.0820.154
0.098
A
0.105
0.1670.0280.0970.0410.1160.0850.0050.0050.1280.778XI067
0.7220.6940.0000.0390.009
0.0300.078
0.007
0.306
0.0020.778XIO-3
0.0010.0180.052
0.007
p
0.183
-0.2000.1710.127
-0.235-0.369-0.088
0.8740.1650.213
-0.593X10⁻³
0.6040.047
-0.021-0.083
0.074
0.2600.310
0.060
0.107
0.4860.0482.3610.258
-0.194
0.229
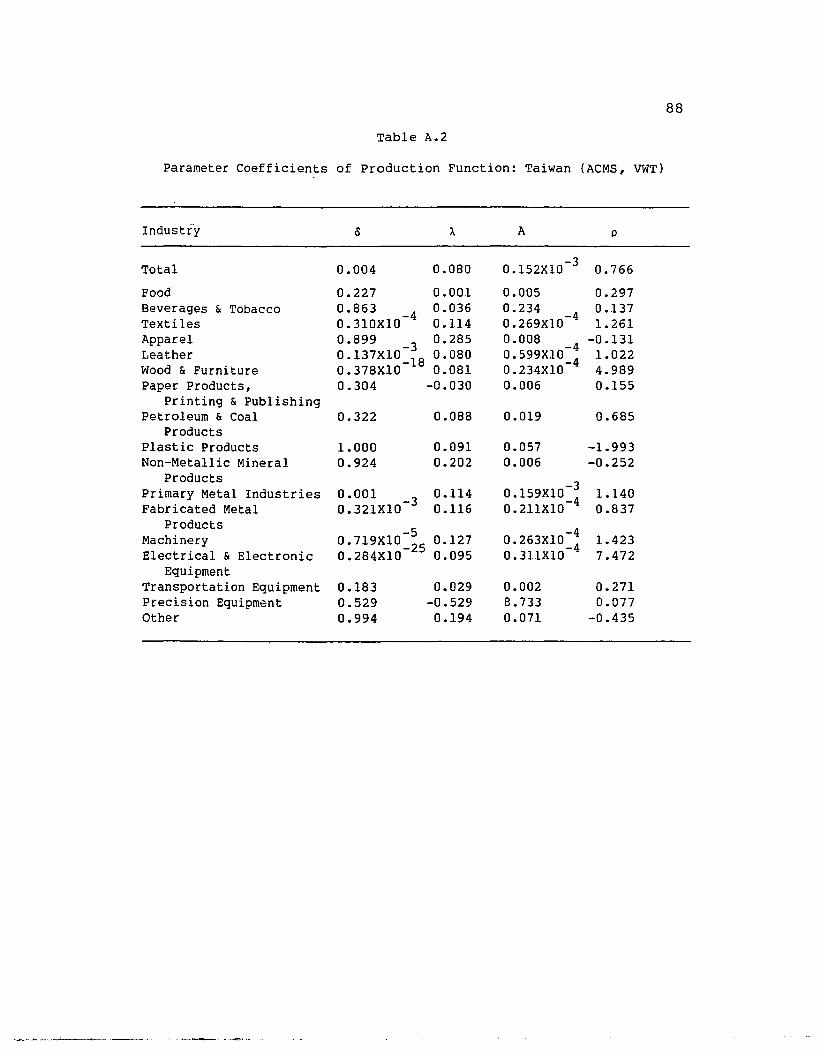
Table A.2
88
Parameter Coefficients of Production Function: Taiwan (ACMS, VWT)
rndust ry 15 A A p
Total 0.004 0.080 0.152XIO- 3 0.766
Food 0.227 0.001 0.005 0.297Beverages & Tobacco 0.863 0.036 0.234 0.137Textiles 0.310XIO-4 0.114 0.269XlO-4
1. 261Apparel 0.899 0.285 0.008 -4 -0.131Leather 0.137XIO-3 0.080 0.599XlO_
41.022
Wood & Furniture 0.378XIO-18 0.081 0.234XIO 4.989Paper Products, 0.304 -0.030 0.006 0.155
Printing & PublishingPetroleum & Coal 0.322 0.088 0.019 0.685
ProductsPlastic Products 1.000 0.091 0.057 -1. 993Non-Metallic Mineral 0.924 0.202 0.006 -0.252
Products-3Primary Metal Industries 0.001 0.114 0.159XIO_
41.140
Fabricated Metal 0.321XIO-3 0.116 0.211XIO 0.837Products
-5 -4Machinery 0.719XIO_250.127 0.263X10_
41.423
Electrical & Electronic 0.284XIO 0.095 0.311X10 7.472Equipment
Transportation Equipment 0.183 0.029 0.002 0.271Precision Equipment 0.529 -0.529 8.733 0.077Other 0.994 0.194 0.071 -0.435

Table A.3
X-Inefficiency Rate: Korea (ACMS, ALI)
Industry
89
Total
Food & BeveragesTextilesApparelLeatherWood ProductsFurniturePaper ProductsPrinting & PublishingIndustrial ChemicalsOther Chemical ProductsPetroleum ProductsOther Petroleum ProductsRubber ProductsPlastic ProductsPottery, China & EarthwareGlass & Glass ProductsOther Non-Metallic Mineral ProductsIron & Steel Basic IndustriesNon-ferrous Metal Basic ProductsFabricated Metal ProductsMachineryElectrical MachineryTransport EquipmentProfessional & Measuring EquipmentOther
0.294
0.0740.4030.1460.2740.0740.1360.5320.3200.3560.1850.3330.0930.2630.2040.3660.3280.5220.5720.4650.5170.7810.6240.5380.1650.303
0.517
0.1470.6230.5500.4290.2290.4670.7170.6180.5010.3440.4180.3080.5590.4290.6570.5740.6490.672006270.7370.8690.7730.7190.3910.637
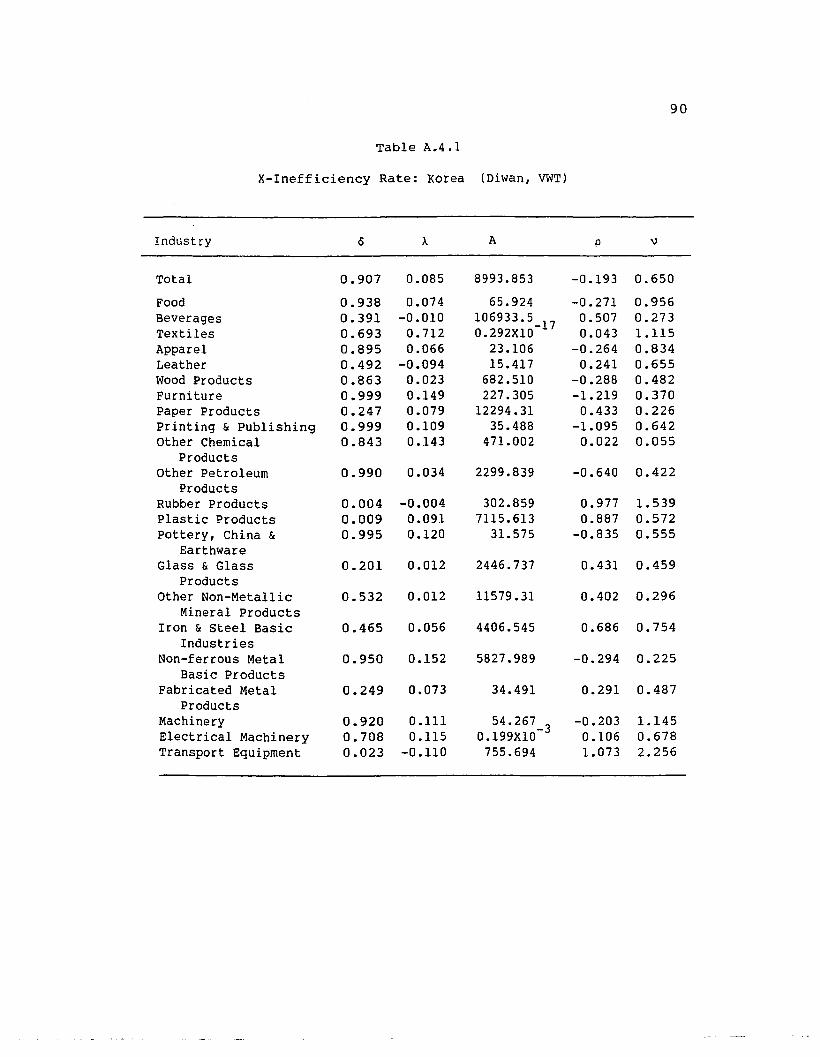
Table A.4.1
X-Inefficiency Rate: Korea (Diwan, VWT)
90
Industry 15 A A p "Total 0.907 0.085 8993.853 -0.193 0.650
Food 0.938 0.074 65.924 -0.271 0.956Beverages 0.391 -0.010 106933.5_17 0.507 0.273Textiles 0.693 0.712 0.292XlO 0.043 1.115Apparel 0.895 0.066 23.106 -0.264 0.834Leather 0.492 -0.094 15.417 0.241 0.655Wood Products 0.863 0.023 682.510 -0.288 0.482Furniture 0.999 0.149 227.305 -1. 219 0.370Paper Products 0.247 0.079 12294.31 0.433 0.226printing & PUblishing 0.999 0.109 35.488 -1.095 0.642Other Chemical 0.843 0.143 471.002 0.022 0.055
ProductsOther Petroleum 0.990 0.034 2299.839 -0.640 0.422
ProductsRubber Products 0.004 -0.004 302.859 0.977 1.539Plastic Products 0.009 0.091 7115.613 0.887 0.572Pottery, China & 0.995 0.120 31. 575 -0.835 0.555
EarthwareGlass & Glass 0.201 0.012 2446.737 0.431 0.459
ProductsOther Non-Metallic 0.532 0.012 11579.31 0.402 0.296
Mineral ProductsIron & Steel Basic 0.465 0.056 4406.545 0.686 0.754
IndustriesNon-ferrous Metal 0.950 0.152 5827.989 -0.294 0.225
Basic ProductsFabricated Metal 0.249 0.073 34.491 0.291 0.487
ProductsMachinery 0.920 0.111 54.267 -0.203 1.145Electrical Machinery 0.708 0.115 0.199XIO-3
0.106 0.678Transport Equipment 0.023 -0.110 755.694 1.073 2.256

Table A.4.2
X-Inefficiency Rate: Korea (Diwan, VWT)
Industry
91
Total
FoodBeveragesTextilesApparelLeatherWood ProductsFurniturePaper ProductsPrinting & PublishingOther Chemical ProductsOther Petroleum ProductsRubber ProductsPlastic ProductsPottery, China & EarthwareGlass & Glass ProductsOther Non-Metallic Mineral ProductsIron & Steel Basic IndustriesNon-ferrous Metal Basic ProductsFabricated Metal ProductsMachineryElectrical MachineryTransport Equipment
1.031
1.0221.0261.0091.0531.0691.047
16.9851.008
108.9901.0192.0971.0391.011
25.8841.0291.0111.0301.8591.0271.0631.0161.042
0.333
0.14444.791
0.3100.3952.0910.7129.897
18.3991203.014
3.6350.218
688.459499.869
3.59414.429
9.605109.506
1.7781.5940.2410.497
1351.874
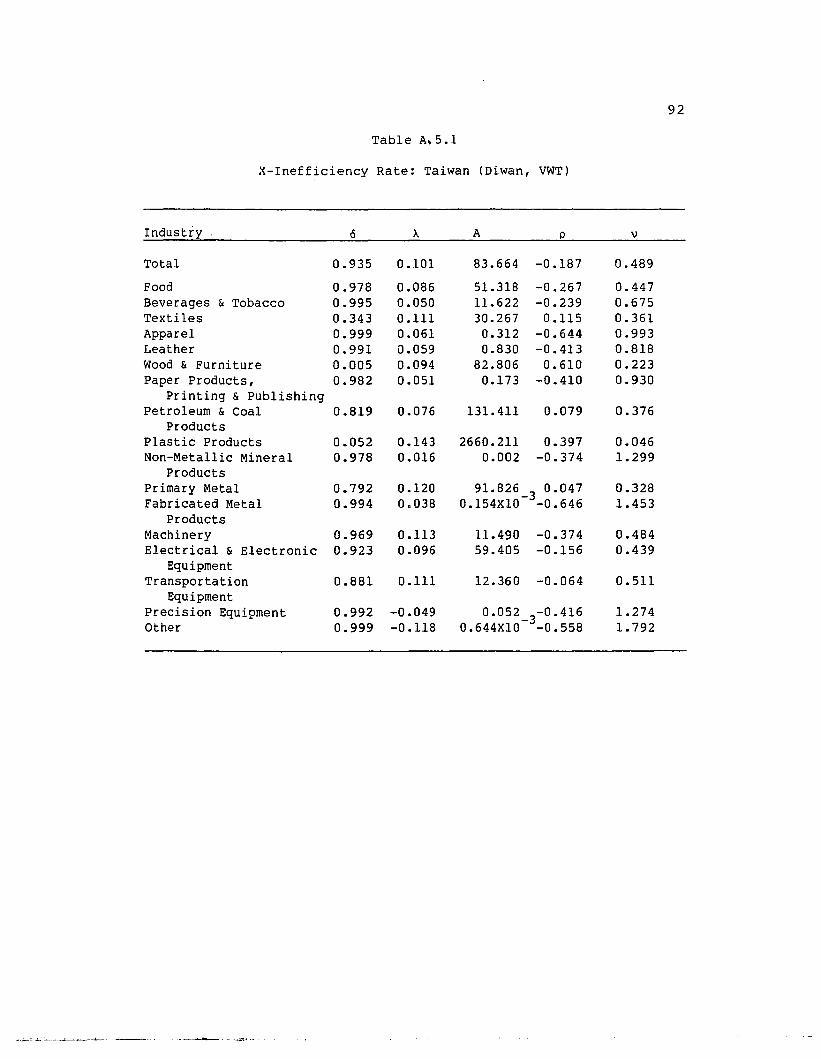
Table A.5.1
X-Inefficiency Rate: Taiwan (Diwan, VWT)
Industry 15 A A o "Total 0.935 0.101 83.664 -0.187 0.489
Food 0.978 0.086 51.318 -0.267 0.447Beverages & Tobacco 0.995 0.050 11.622 -0.239 0.675Textiles 0.343 0.111 30.267 0.115 0.361Apparel 0.999 0.061 0.312 -0.644 0.993Leather 0.991 0.059 0.830 -0.413 0.818Wood & Furniture 0.005 0.094 82.806 0.610 0.223Paper Products, 0.982 0.051 0.173 -0.410 0.930
Printing & PublishingPetroleum & Coal 0.819 0.076 131.411 0.079 0.376
ProductsPlastic Products 0.052 0.143 2660.211 0.397 0.046Non-Metallic Mineral 0.978 0.016 0.002 -0.374 1.299
ProductsPrimary Metal 0.792 0.120 91.826 0.047 0.328Fabricated Metal 0.994 0.038 0.154XlO-3-0.646 1.453
ProductsMachinery 0.969 0.113 11.490 -0.374 0.484Electrical & Electronic 0.923 0.096 59.405 -0.156 0.439
EquipmentTransportation 0.881 0.111 12.360 -0.064 0.511
EquipmentPrecision Equipment 0.992 -0.049 0.052 -0.416 1.274Other 0.999 -0.118 0.644X10⁻³-0.558 1.792
--~:..~. :......._-_-:..-__.-'--- -_..--_.... . --..........-..-. ---~..-
92

Table A.5.2
X-Ineffic~ency Rate: Taiwan (Oiwan, VWT)
93
Industry
Total
Food,Beverages & TobaccoTextilesApparelLeatherWood & FurniturePaper Products, Printing & PublishingPetroleum & Coal ProductsPlastic ProductsNon-Metallic Mineral ProductsPrimary Metal IndustriesFabricated Metal ProductsMachineryElectrical & Electronic EquipmentTransportation EquipmentPrecision EquipmentOther
0 1 D2
1.002 3.996
1.057 7.0201.032 6.1071.013 3.0041.047 1.3441.066 3.3401.018 2.8561.036 1.5971.012 3.4991.014 11.8431.047 1.0161.032 4.5831.898 0.5621.046 4.9831.017 5.2851.008 4.2811.079 1.2381.056 1.081

94
Table A.6
Regression Results for the Test of the Hypothesis: Korea (Log)
In D1 = 0.883 - 0.247 In CR5
+ 0.217 In KI - 0.224 In XO +(3.828) (-0.432) (1.682) (-0.369)
0.072 In ID +(0.917)
0.212 In TL(1.963)
R2 = 0.410 O-w = 2.599
In D2
= 0.653 + 0.027 In CR5
+ 0.179 In KI + 0.005 In XO(3.536) (0.060) (1.740) (0.099)
+ 0.029 In IO + 0.113 In TL(0.463) (1.323)
R2 = 0.406 O-w = 2.469
Note: Number in prentheses indicates the t-va1ue of the coefficients.

Table> A.7
Regression Results for the Test of the Hypothesis: Taiwan (Log)
95
In D1 = 0.532 + 0.189 In CR5- 0.099 In KI - 0.088 In XD + 0.038 In ID
(1.188) (0.854) (-0.557) (-0.831) (0.476)
R2 = 0.269 D-W = 1.568
In D2 = 0.434 + 0.152 In CR5- 0.035 In KI - 0.068 In XD + 0.021 In ID
(1.159) (0.823) (-0.236) (-0.767) (0.315)
R2 = 0.350 D-W = 1.378
Note: Number in parentheses indicates the t-value of thecoefficients.

96
BIBLIOGRAPHY
Arrowl Ko, Chenery, H., Minhas, B., and Solow, R. 1961."Capital-Labor Substitution and Economic Efficiency."Review of Economic Statistics, Vol. 43, pp. 225-50.
Bank of Korea (BOK). Various years. Economic StatisticalYearbook, various issues. Seoul: BOK.
. Various years. Financial Statements----~A~n-a~l-y-sis, various issues. Seoul: BOK.
Baumol, Wo 1959. "The Revenue Maximization Hypothesis."in Business Behavior, Value, and Growth, pp. 45-53.New York: Macm~llan.
Bergsman, J. 1974. "Commercial Policy, AllocativeEfficiency and 'X-Efficiency' 0" Western EconomicReview, Vol. 8, Dec., pp. 409-33.
Bruggink, T. 1982. "Public versus Private Enterprisein the Municipal Water Industry: A Comparison ofOperating Costs." Quarterly Revie~'l of Economicsand Business, Vol. 22, Spring, pp. 111-25.
Carlsson, B. 1972. "The Measurement of Efficiency inProduction: An Application to Swedish ManufacturingIndustries, 1968." Swedish Journal of Economics,Vol. 74, Dec., pp. 468-85.
Chung, H. S. 1992. "Contribution Analysis of Export onEconomic Growth: Comparison for Korea and Taiwan"(in Korean). Korean Economy, No. 18-2, Sung KyunKwan University.
Comanor, W., and Leibenstein, H. 1969. "AllocativeEfficiency, X-Efficiency and the Measurement ofWelfare Losses." Economica, Vol. 36, pp 0 304-309.
Council for Economic Planning and Development (CEPD).Various years. Taiwan Statistical Data Book, variousissues. Taipei: CEPD.
various years. Taiwan GNP, various issues.Tal.pel: CEPD.

97
Various years. Survey of TaiwanIndustrialists, various issues. Taipei: CEPD.
Various years. Taiwan IndustrialistsProduction Statistical Monthly, various issues.Taipei: CEPD.
Crain, M. and Zardkoohi, A. 1980. nX-Efficiency andNonpecuniary Rewards in a Rent-Seeking Society: ANeglected Issue in the Property Rights Theory of theFirm." American Economic Review, Vol. 70, Sept.,pp. 784-92.
De Alessi, M. 1983. "Property Rights, Transactions Costs,and X-Efficiency: An Essay in Economic Theory."American Economic Review, Vol. 75, March, pp. 64-81.
Directorate-General. 1985. Accounting and Statistics.Taipei: DG.
Diwan, R. 1969.of Scale."
"Alternative Specifications of EconomiesEconomica, Nov., pp. 442-53.
Economic Planning Board. Various years. Report on Miningand Manufacturing Survey (in Korean). Seoul: EPB.
Economics and Technology Institute. 1989. IndustrialStructure and Economic Performance for Korea andTaiwan (in Korean). Seoul: Korea Univers~ty.
Executive Yuan.of China.
1985. National Income of the RepublicTaipei: EY.
1985, 1986. Statistical Yearbook of theRepublic of China. Taipei: EY.
Frantz, R. 1985. "X-Efficiency Theory and its Critics."Quarterly Review of Economics and Business, Vol. 25,No.4, pp. 38-58.
• 1988. X-Efficiency: Theory, Evidence and----~A~p~p-l~~~Lc~ations. Boston: Kluwer Academic Publishers.
Frantz, R., and Green, L. 1982. "Prejudice, Mistrust,and Labor Effort: Social Influences on Productivity."Journal of Behavioral Economics, Vol. II, Summer,pp. 101-31.

98
Gillis, M. 1982. "Allocative and X-Efficiency in StateOwned Mining Enterprises: Comparisons Between Boliviaand Indonesia." Journal of Comparative Economics,Vol. 6, March, pp. 1-23.
Holtman, A. 1983. "Uncertainty, Organizational Form,and X-Efficiency." Journal of Economics and Business,Vol. 35, pp. 131-37.
Kang, Myung-Hun. 1990. "A Short Consideration ofX-Inefficiency" (in Korean). Kyong Je Hak Yon Gu,Vol. 38, No.1, pp. 1-25.
Kim, C. K., YOo, J. S., and Hwang, K. M. 1984. TheProductivity Analysis of the Manufacturing Sectorin Korea, Taiwan and Japan (in Korean). Seoul:Economic Institute in Hanyang University.
Korean Development Bank (KDB). 1990. The Analysis ofFinancial Data (in Korean). Seoul: KDB.
Lecraw, D. 1977. "Empirical Tests for X-inefficiency."Kyklos, Vol. 30, No.1, pp. 116-20.
1979. "Choice of Technology in Low-Wagecountries: A Neoclassical Approach." QuarterlyJournal of Economics, Vol. 93, Nov., pp. 631-54.
Leibenstein, H. 1966. "Allocative Efficiency vs.X-Effici.ency." American Economic Review, Vol. 56,June, pp. 392-415.
1978a. General X-Inefficiency Theory andEconomic Development. New York: Oxford universityPress.
1978b. "X-Inefficiency Xists: A Reply toand Xorcist." American Economic Review, Vol. 68,March, pp. 203-11.
. 1983. "Property Rights Theory and----;X;---;E~f~f:!"l.~ic~iency Theory: A Comment." American Economic
Review, Vol. 73, Sept., pp. 831-42.
Levin, H. 1974.Production."pp. 831-42.
"Measuring Efficiency in EducationalPublic Finance Quarterly, Vol. 2, Nov.,
Marris, R. 1963. "A Model of the Managerial Enterprise."Quarterly Journal of Economics, Vol. 77, May,pp. 185- 2 09 •
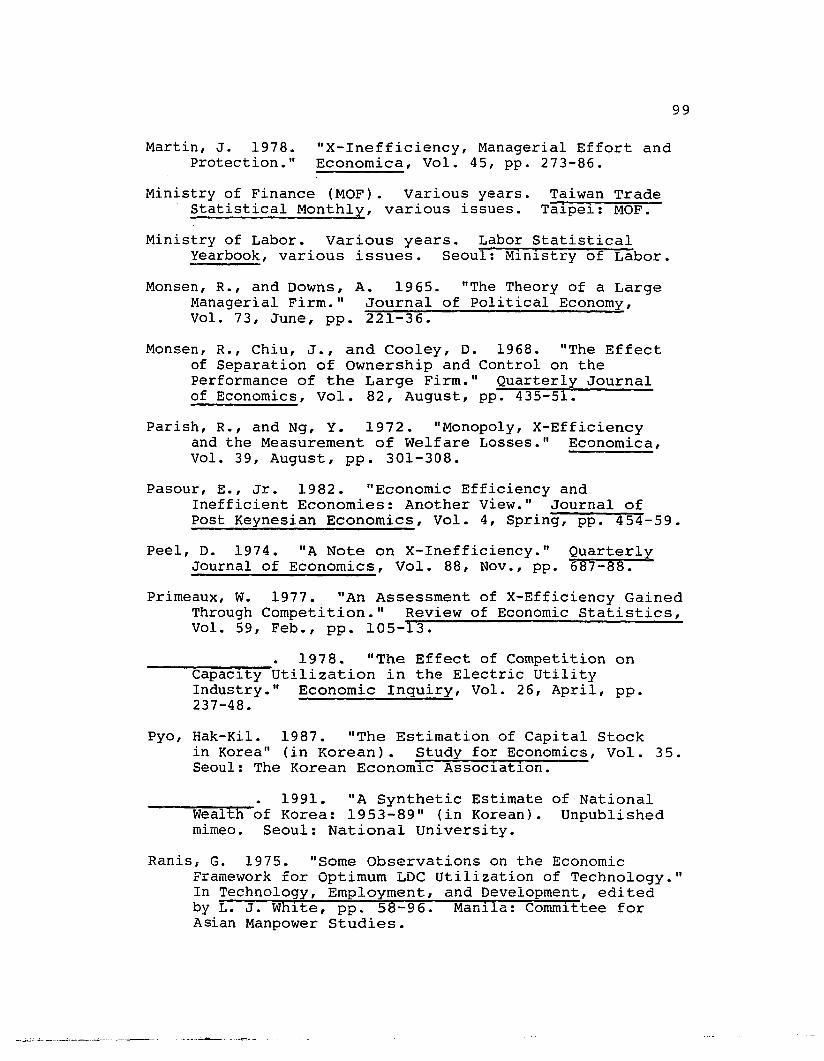
Martin, J. 1978.Protection."
99
"X-Inefficiency, Managerial Effort andEconomica, Vol. 45, pp. 273-86.
Ministry of Finance (MOF). Various years.Statistical Monthly, various issues.
Taiwan TradeTaipei: r10F.
Ministry of Labor. Various years. Labor StatisticalYearbook, various issues. Seoul: Ministry of Labor.
Monsen, R., and Downs, A. 1965. "The Theory of a LargeManagerial Firm." Journal of Political Economy,Vol. 73, June, pp. 221-36.
Monsen, R., Chiu, J., and Cooley, D. 1968. "The Effectof Separation of Ownership and Control on thePerformance of the Large Firm." Quarterly Journalof Economics, Vol. 82, August, pp. 435-51.
Parish, R., and Ng, Y. 1972. "Monopoly, X-Efficiencyand the Measurement of Welfare Losses." Economica,Vol. 39, August, pp. 301-308.
Pasour, E., Jr. 1982. "Economic Efficiency andInefficient Economies: Another View." Journal ofPost Keynesian Economics, Vol. 4, Spring, pp. 454-59.
Peel, D. 1974. "A Note on X-Inefficiency." QuarterlyJournal of Economics, Vol. 88, Nov., pp. 687-88.
Primeaux, W. 1977. "An Assessment of X-Efficiency GainedThrough Competition." Review of Economic Statistics,Vol. 59, Feb., pp. 105-13.
1978. "The Effect of Competition oncapacity Utilization in the Electric UtilityIndustry." Economic Inquiry, Vol. 26, April, pp.237-48.
Pyo, Hak-Kil. 1987. "The Estimation of Capital Stockin Korea" (in Korean). Study for Economics, Vol. 35.Seoul: The Korean Economic Association.
1991. "A Synthetic Estimate of NationalWealth of Korea: 1953-89" (in Korean). Unpublishedmimeo. Seoul: National University.
Ranis, G. 1975. "Some Observations on the EconomicFramework for Optimum LDC utilization of Technology."In Technology, Employment, and Development, editedby L. J. White, pp. 58-96. Manila: committee forAsian Manpower Studies.

100
Schap, D. 1985. "X-Inefficiency in a Rent-SeekingSociety: Graphical Analysis." Quarterly Review ofEconomics and Business, Spring, pp. 19-27.
Scit6vsky, T. 1943. "A Note of Profit Maximization andits Implications." Review of Economic Studies,Vol. 11, No.1, pp. 57-60.
Shelton, J. 1967. "Allocative Efficiency versus'X-Efficiency': Comment." American Economic Review,Vol. 57, Dec., pp. 1252-58.
Siegfried, J., and Wheeler, E. 1981. "Cost Efficiencyand Monopoly Power: A Survey." Quarterly Review ofEconomics and Business, Vol. 21, Spring, pp. 25-46.
Stevenson, R. 1982. "X-Inefficiency and InterfirmRivalry: Evidence from the Electric utility Industry."Land Economics, Vol. 58, Feb., pp. 52-66.
Stigler, G. 1976. "The X-istence of X-Efficiency."American Economic Review, Vol. 66, March, pp. 213-16.
Tyler, W. 1979. "Technical Efficiency in Production ina Developing Country: An Empirical Examinationi ofthe Brazilian Plastics and Steel Industries."Oxford Economic Papers, Vol. 31, Nov., pp. 477-95.
Weiermair, K., and Perlman, M. 1990. Studies in EconomicRationality: X-Efficiency Examined and Extolled.Ann Arbor: The university of Michigan Press.
Weiss, L., and Pascoe, G. 1985. "Concentration,X-Inefficiency and Mr. Pelzman' s Superior Firms."Social Systems Research Institute Working Paper,No. 8501. Madison: university of Wisconsin.
Wells, L. 1973. "Economic Man and Engineering Man: Choiceand Technology in a Low Wage Country." Publ ic Pol icy,Vol. 21, Summer, pp. 319-42.
White, L. 1979. "Appropriate Technology, X-Inefficiency,and a Competitive Environment: Some Evidence fromPakistan." Quarterly Journal of Economics, Vol. 90,Nov., pp. 575-89.

Williamson, o. 1964. The Economics of DiscretionaryBehavior: Management Objectives in a Theory of theFirm. Englewood cliffs, N.J.: Prentice-Hall.
• 1985. The Economic Institutions of----~G~·a-p-l~it~a~lism. New York: Free Press.
~-.:.;.;:c;..;....,-;.:.._-_.~_~__~_ .. ~
101
Related Documents