UMG 512-PRO Class A power quality analyser Smart Energy & Power Quality Solutions

Welcome message from author
This document is posted to help you gain knowledge. Please leave a comment to let me know what you think about it! Share it to your friends and learn new things together.
Transcript
UMG 512-PROClass A power quality analyser
UMG 512-PRO
Smart Energy & Power Quality Solutions
2
UMG 512-PROClass A power quality analyser
3
UMG 512-PROClass A power quality analyser
2 digital outputs• Pulse output kWh / kvarh• Switch output• Threshold value output• Logic output(expandable via external I/O modules)
2 digital inputs• Pulse input• Logic input• State monitoring• HT / LT switching
RCM – Residual Current Monitoring• 2 residual current inputs
Interfaces• Ethernet• Profi bus (DSUB-9)• RS485 Modbus (terminal strip)
Communication• Profi bus (DP/V0)• Modbus (RTU, TCP, Gateway)• TCP/IP• BACnet (optional)• HTTP• FTP (fi le transfer)• TFTP• NTP (time synchronisation)• SMTP (email function)• DHCP• SNMP
Accuracy of measurement• Energy: Class 0.2S (... / 5 A)• Current: 0.1 %• Voltage: 0.1 %
Networks• IT, TN, TT networks• 3 and 4-phase networks
Measured data memory• 256 MByte FlashMeasured data memory
Power quality • Harmonics up to the 63rd harmonic,
odd / even• Flicker measurement• Short term interruptions (from 10 ms)• Transient recorder (> 39 μs)• Start-up currents (> 10 ms)• Imbalance• Half wave RMS recordings
(up to 11 min.)• Events can be displayed as
waveforms
Programming language• Graphical programming• Jasic®
• PLC functionality
Network visualisation software• GridVis®-Basic
(in the scope of supply)
Thermistor input• PT100, PT1000, KTY83, KTY84
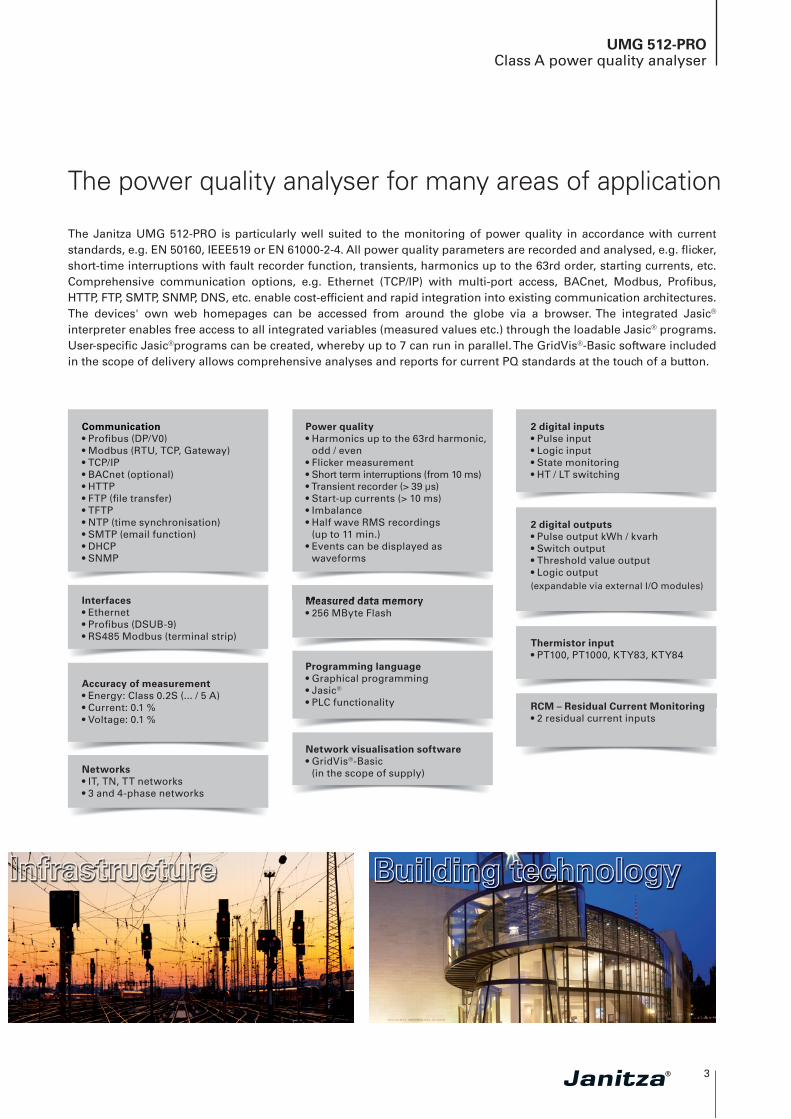
The power quality analyser for many areas of application
The Janitza UMG 512-PRO is particularly well suited to the monitoring of power quality in accordance with current standards, e.g. EN 50160, IEEE519 or EN 61000-2-4. All power quality parameters are recorded and analysed, e.g. fl icker, short-time interruptions with fault recorder function, transients, harmonics up to the 63rd order, starting currents, etc. Comprehensive communication options, e.g. Ethernet (TCP/IP) with multi-port access, BACnet, Modbus, Profi bus, HTTP, FTP, SMTP, SNMP, DNS, etc. enable cost-effi cient and rapid integration into existing communication architectures. The devices' own web homepages can be accessed from around the globe via a browser. The integrated Jasic®
interpreter enables free access to all integrated variables (measured values etc.) through the loadable Jasic® programs. User-specifi c Jasic®programs can be created, whereby up to 7 can run in parallel. The GridVis®-Basic software included in the scope of delivery allows comprehensive analyses and reports for current PQ standards at the touch of a button.
4
UMG 512-PROClass A power quality analyser
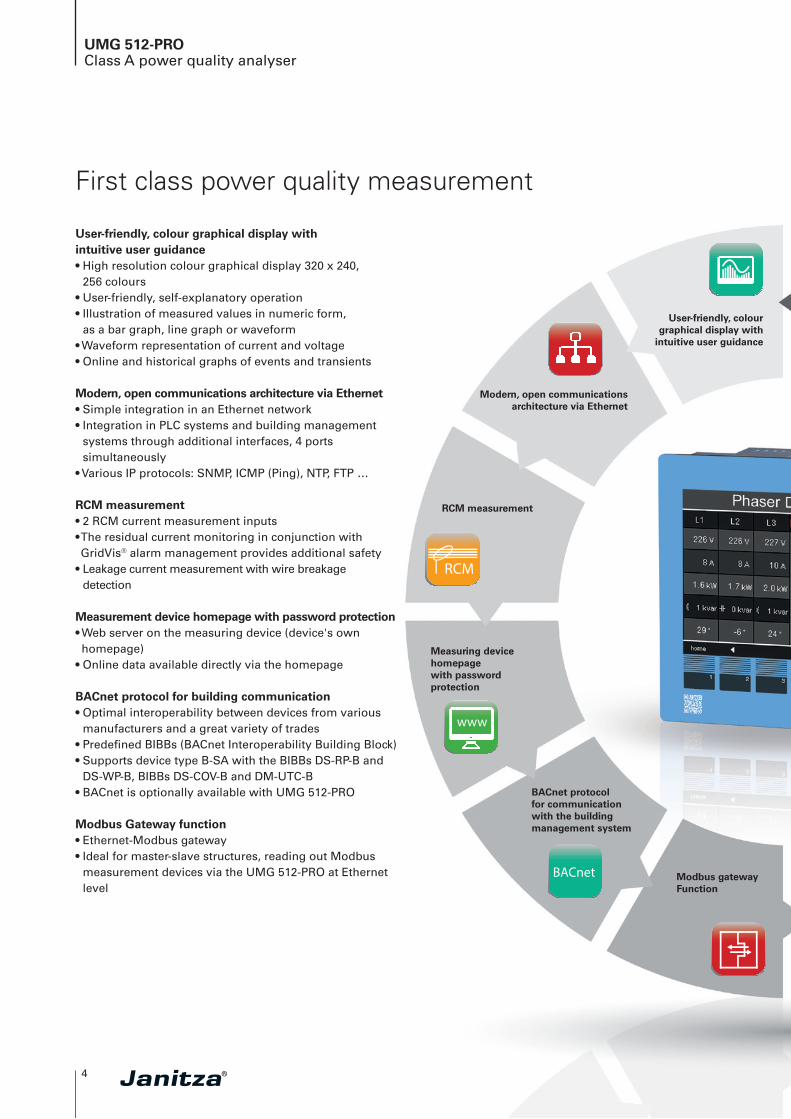
User-friendly, colour graphical display with intuitive user guidance• High resolution colour graphical display 320 x 240,
256 colours• User-friendly, self-explanatory operation• Illustration of measured values in numeric form,
as a bar graph, line graph or waveform• Waveform representation of current and voltage• Online and historical graphs of events and transients
Modern, open communications architecture via Ethernet• Simple integration in an Ethernet network• Integration in PLC systems and building management
systems through additional interfaces, 4 ports simultaneously
• Various IP protocols: SNMP, ICMP (Ping), NTP, FTP …
RCM measurement• 2 RCM current measurement inputs• The residual current monitoring in conjunction with GridVis® alarm management provides additional safety
• Leakage current measurement with wire breakage detection
Measurement device homepage with password protection• Web server on the measuring device (device's own homepage)
• Online data available directly via the homepage
BACnet protocol for building communication• Optimal interoperability between devices from various
manufacturers and a great variety of trades• Predefi ned BIBBs (BACnet Interoperability Building Block) • Supports device type B-SA with the BIBBs DS-RP-B and
DS-WP-B, BIBBs DS-COV-B and DM-UTC-B• BACnet is optionally available with UMG 512-PRO
Modbus Gateway function• Ethernet-Modbus gateway• Ideal for master-slave structures, reading out Modbus
measurement devices via the UMG 512-PRO at Ethernet level
User-friendly, colour graphical display with
intuitive user guidance
Modern, open communications architecture via Ethernet
RCM measurement
Measuring device homepagewith password protection
BACnet protocol for communication with the building management system
Modbus gatewayFunction
First class power quality measurement
RCM
4 MB
64Channels
FCO
O
Ethernetanschluß Ethernet-Modbus-GatewayImpulsaus- undImpulseingänge
GridVis®
GridVisReporting AlarmmanagementGraphen
GridVIS
Allgemein E
RCM
PQ
www
Homepage
Jasic
Jasic
BACnet
BACnet
MID
MID
Allgemein A
Allgemein C
Farbiges Gra�kdisplay
Benutzerverwaltung
1 2 3
Ereignisse
Flicker
32 MB 128 MB 256 MB 512 K
Class A..-4-30
Class A..-4-30
Spannungsqualität
29. 40. 63.
Oberschwingungen
4 MB
4Tari�s
7Tari�s
8Tari�s
Tarife
Class0,2 kWh
Class0,5 kWh
Class1,0 kWh
Messgenauigkeit
Modbus
32 MB 128 MB 256 MB 512 K
Transienten
32 MB 128 MB 256 MB
Datenspeicher
512 K
14Tari�s
25.
25.
Grenzwertüberwachung
BLK
Hybridschaltung
Dynamische BLK
Pv
Niedrige Verluste
Lange Lebensdauer
o
Optimiertes, thermisches Design
Verdrosselte Ausführung
min
THD
Minimierte Netzrückwirkung
Segmentierter Film
Selbstheilung
Intelligente Regelung
1Tari�s
2Tari�s
FCO
O
CO
Temperatureingang
EmaxSpitzenlastoptimierung
Stromwandlereingänge
mA
Sicherheit
Überwachung
Drosselspule
Schützspule
Sicherung Unterteil
Kondensator
Team-Viewer
®
CO
KPISaaS
SaaS
RCM
4 MB
64Channels
FCO
O
Ethernetanschluß Ethernet-Modbus-GatewayImpulsaus- undImpulseingänge
GridVis®
GridVisReporting AlarmmanagementGraphen
GridVIS
Allgemein E
RCM
PQ
www
Homepage
Jasic
Jasic
BACnet
BACnet
MID
MID
Allgemein A
Allgemein C
Farbiges Gra�kdisplay
Benutzerverwaltung
1 2 3
Ereignisse
Flicker
32 MB 128 MB 256 MB 512 K
Class A..-4-30
Class A..-4-30
Spannungsqualität
29. 40. 63.
Oberschwingungen
4 MB
4Tari�s
7Tari�s
8Tari�s
Tarife
Class0,2 kWh
Class0,5 kWh
Class1,0 kWh
Messgenauigkeit
Modbus
32 MB 128 MB 256 MB 512 K
Transienten
32 MB 128 MB 256 MB
Datenspeicher
512 K
14Tari�s
25.
25.
Grenzwertüberwachung
BLK
Hybridschaltung
Dynamische BLK
Pv
Niedrige Verluste
Lange Lebensdauer
o
Optimiertes, thermisches Design
Verdrosselte Ausführung
min
THD
Minimierte Netzrückwirkung
Segmentierter Film
Selbstheilung
Intelligente Regelung
1Tari�s
2Tari�s
FCO
O
CO
Temperatureingang
EmaxSpitzenlastoptimierung
Stromwandlereingänge
mA
Sicherheit
Überwachung
Drosselspule
Schützspule
Sicherung Unterteil
Kondensator
Team-Viewer
®
CO
KPISaaS
SaaS
5
UMG 512-PROClass A power quality analyser
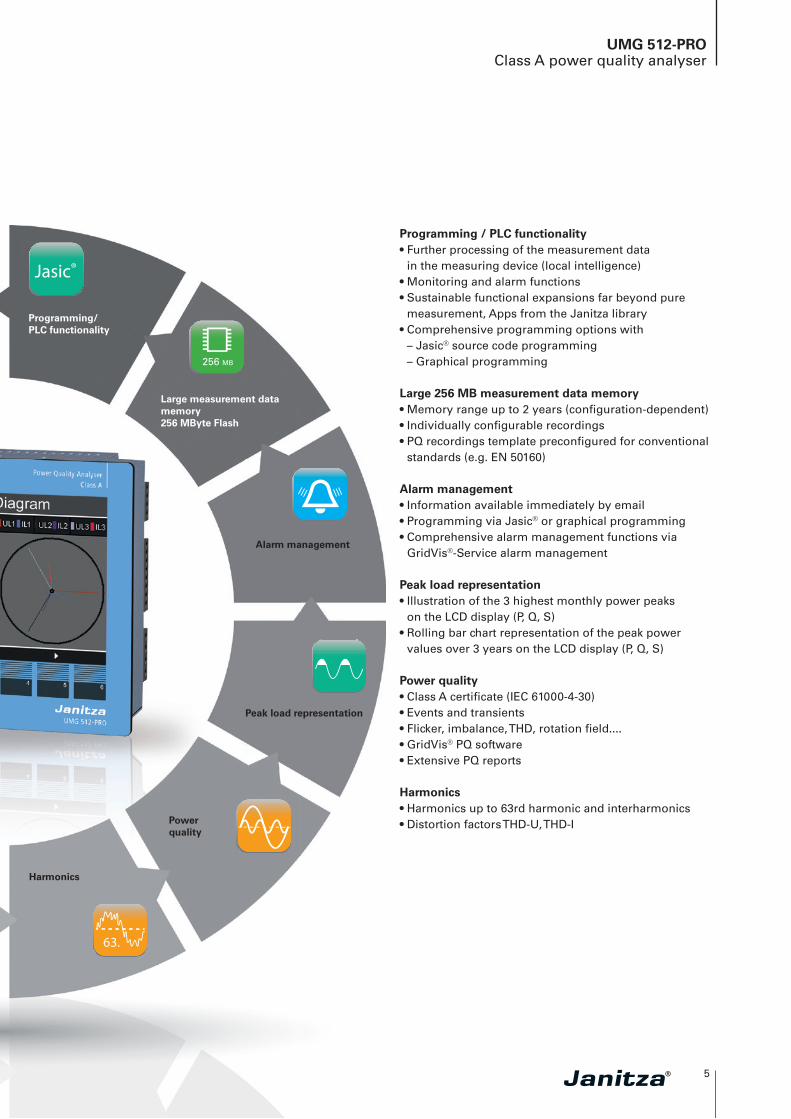
Programming / PLC functionality• Further processing of the measurement data
in the measuring device (local intelligence)• Monitoring and alarm functions• Sustainable functional expansions far beyond pure
measurement, Apps from the Janitza library• Comprehensive programming options with
– Jasic® source code programming – Graphical programming
Large 256 MB measurement data memory • Memory range up to 2 years (confi guration-dependent)• Individually confi gurable recordings• PQ recordings template preconfi gured for conventional
standards (e.g. EN 50160)
Alarm management• Information available immediately by email• Programming via Jasic® or graphical programming• Comprehensive alarm management functions via
GridVis®-Service alarm management
Peak load representation• Illustration of the 3 highest monthly power peaks
on the LCD display (P, Q, S)• Rolling bar chart representation of the peak power
values over 3 years on the LCD display (P, Q, S)
Power quality • Class A certifi cate (IEC 61000-4-30)• Events and transients• Flicker, imbalance, THD, rotation fi eld....• GridVis® PQ software• Extensive PQ reports
Harmonics • Harmonics up to 63rd harmonic and interharmonics• Distortion factors THD-U, THD-I
Harmonics
Programming/PLC functionality
Large measurement data memory256 MByte Flash
Alarm management
Peak load representation
Powerquality
RCM
4 MB
64Channels
FCO
O
Ethernetanschluß Ethernet-Modbus-GatewayImpulsaus- undImpulseingänge
GridVis®
GridVisReporting AlarmmanagementGraphen
GridVIS
Allgemein E
RCM
PQ
www
Homepage
Jasic
Jasic
BACnet
BACnet
MID
MID
Allgemein A
Allgemein C
Farbiges Gra�kdisplay
Benutzerverwaltung
1 2 3
Ereignisse
Flicker
32 MB 128 MB 256 MB 512 K
Class A..-4-30
Class A..-4-30
Spannungsqualität
29. 40. 63.
Oberschwingungen
4 MB
4Tari�s
7Tari�s
8Tari�s
Tarife
Class0,2 kWh
Class0,5 kWh
Class1,0 kWh
Messgenauigkeit
Modbus
32 MB 128 MB 256 MB 512 K
Transienten
32 MB 128 MB 256 MB
Datenspeicher
512 K
14Tari�s
25.
25.
Grenzwertüberwachung
BLK
Hybridschaltung
Dynamische BLK
Pv
Niedrige Verluste
Lange Lebensdauer
o
Optimiertes, thermisches Design
Verdrosselte Ausführung
min
THD
Minimierte Netzrückwirkung
Segmentierter Film
Selbstheilung
Intelligente Regelung
1Tari�s
2Tari�s
FCO
O
CO
Temperatureingang
EmaxSpitzenlastoptimierung
Stromwandlereingänge
mA
Sicherheit
Überwachung
Drosselspule
Schützspule
Sicherung Unterteil
Kondensator
Team-Viewer
®
CO
KPISaaS
SaaS
RCM
4 MB
64Channels
FCO
O
Ethernetanschluß Ethernet-Modbus-GatewayImpulsaus- undImpulseingänge
GridVis®
GridVisReporting AlarmmanagementGraphen
GridVIS
Allgemein E
RCM
PQ
www
Homepage
Jasic
Jasic
BACnet
BACnet
MID
MID
Allgemein A
Allgemein C
Farbiges Gra�kdisplay
Benutzerverwaltung
1 2 3
Ereignisse
Flicker
32 MB 128 MB 256 MB 512 K
Class A..-4-30
Class A..-4-30
Spannungsqualität
29. 40. 63.
Oberschwingungen
4 MB
4Tari�s
7Tari�s
8Tari�s
Tarife
Class0,2 kWh
Class0,5 kWh
Class1,0 kWh
Messgenauigkeit
Modbus
32 MB 128 MB 256 MB 512 K
Transienten
32 MB 128 MB 256 MB
Datenspeicher
512 K
14Tari�s
25.
25.
Grenzwertüberwachung
BLK
Hybridschaltung
Dynamische BLK
Pv
Niedrige Verluste
Lange Lebensdauer
o
Optimiertes, thermisches Design
Verdrosselte Ausführung
min
THD
Minimierte Netzrückwirkung
Segmentierter Film
Selbstheilung
Intelligente Regelung
1Tari�s
2Tari�s
FCO
O
CO
Temperatureingang
EmaxSpitzenlastoptimierung
Stromwandlereingänge
mA
Sicherheit
Überwachung
Drosselspule
Schützspule
Sicherung Unterteil
Kondensator
Team-Viewer
®
CO
KPISaaS
SaaS
6
UMG 512-PROClass A power quality analyser
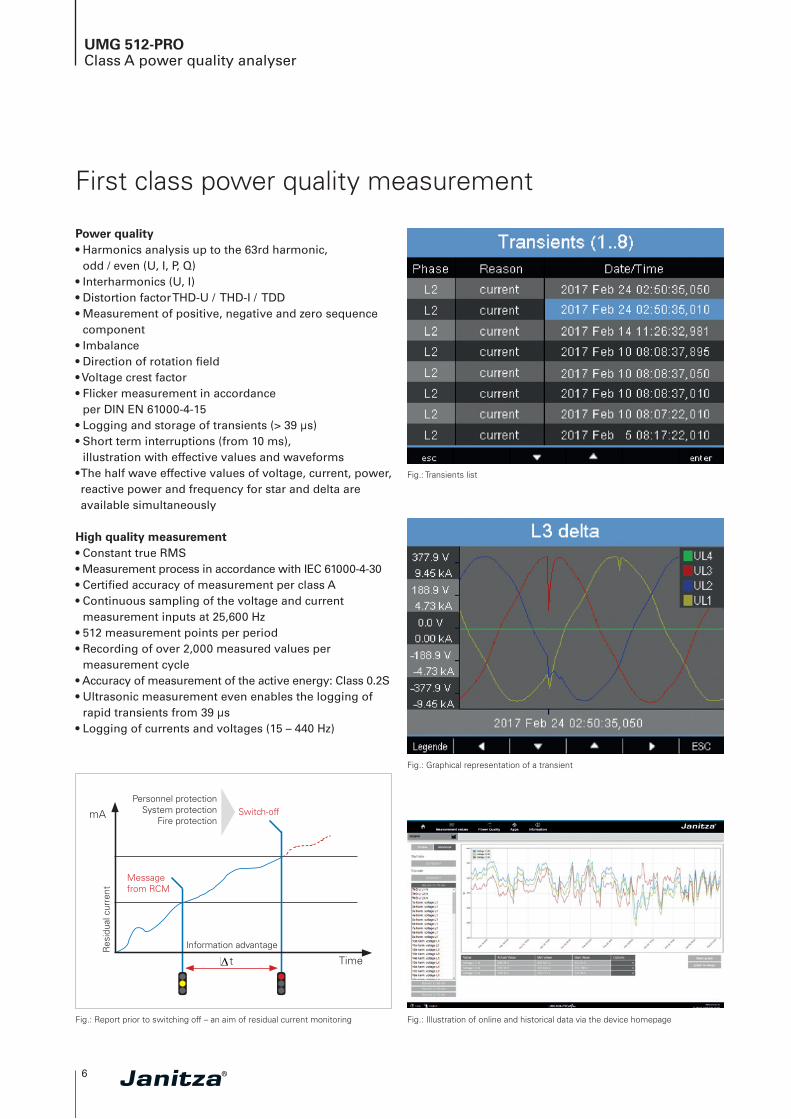
Power quality• Harmonics analysis up to the 63rd harmonic,
odd / even (U, I, P, Q)• Interharmonics (U, I)• Distortion factor THD-U / THD-I / TDD• Measurement of positive, negative and zero sequence
component• Imbalance• Direction of rotation fi eld• Voltage crest factor• Flicker measurement in accordance
per DIN EN 61000-4-15• Logging and storage of transients (> 39 µs)• Short term interruptions (from 10 ms),
illustration with effective values and waveforms• The half wave effective values of voltage, current, power, reactive power and frequency for star and delta are available simultaneously
High quality measurement• Constant true RMS• Measurement process in accordance with IEC 61000-4-30• Certifi ed accuracy of measurement per class A• Continuous sampling of the voltage and current
measurement inputs at 25,600 Hz• 512 measurement points per period• Recording of over 2,000 measured values per
measurement cycle• Accuracy of measurement of the active energy: Class 0.2S• Ultrasonic measurement even enables the logging of
rapid transients from 39 µs• Logging of currents and voltages (15 – 440 Hz)
First class power quality measurement
Fig.: Report prior to switching off – an aim of residual current monitoring
mA
Timet
Information advantageRes
idua
l cur
rent
Messagefrom RCM
Switch-offPersonnel protection
System protectionFire protection
Fig.: Illustration of online and historical data via the device homepage
Fig.: Transients list
Fig.: Graphical representation of a transient
7
UMG 512-PROGridVis® software
GridVis® – network visualisation software
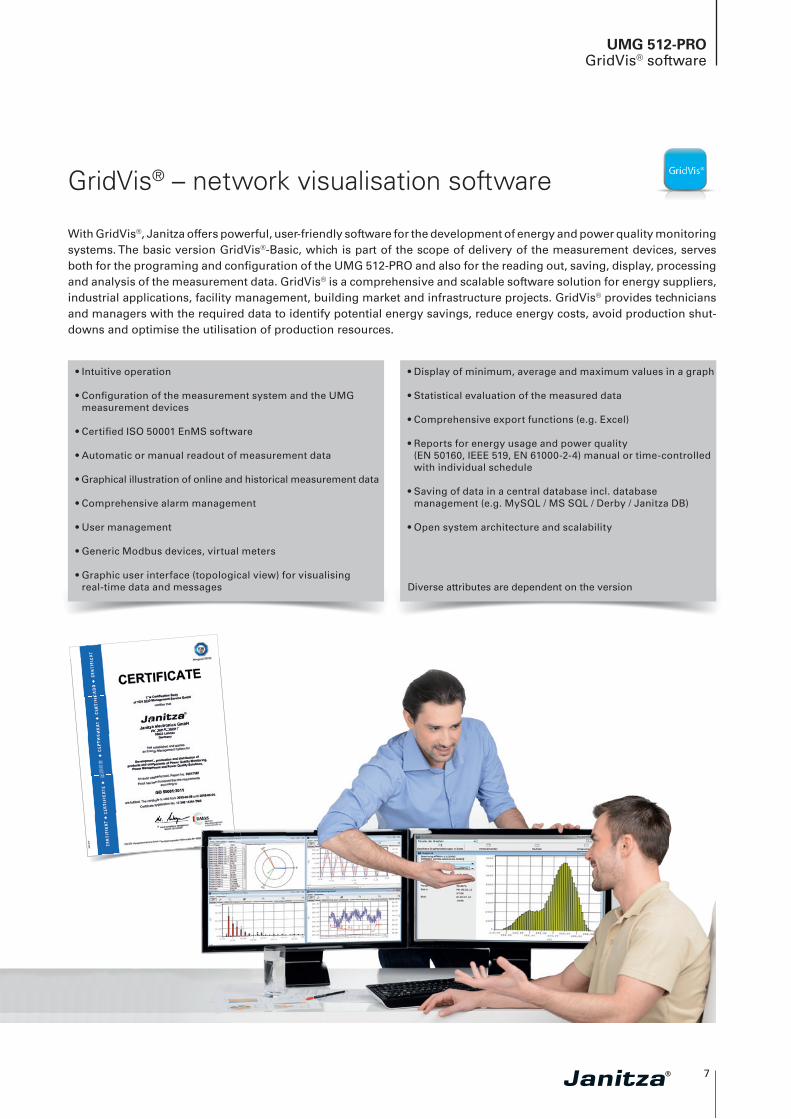
With GridVis®, Janitza offers powerful, user-friendly software for the development of energy and power quality monitoring systems. The basic version GridVis®-Basic, which is part of the scope of delivery of the measurement devices, serves both for the programing and confi guration of the UMG 512-PRO and also for the reading out, saving, display, processing and analysis of the measurement data. GridVis® is a comprehensive and scalable software solution for energy suppliers, industrial applications, facility management, building market and infrastructure projects. GridVis® provides technicians and managers with the required data to identify potential energy savings, reduce energy costs, avoid production shut-downs and optimise the utilisation of production resources.
• Intuitive operation
• Confi guration of the measurement system and the UMG measurement devices
• Certifi ed ISO 50001 EnMS software
• Automatic or manual readout of measurement data
• Graphical illustration of online and historical measurement data
• Comprehensive alarm management
• User management
• Generic Modbus devices, virtual meters
• Graphic user interface (topological view) for visualising real-time data and messages
• Display of minimum, average and maximum values in a graph
• Statistical evaluation of the measured data
• Comprehensive export functions (e.g. Excel)
• Reports for energy usage and power quality (EN 50160, IEEE 519, EN 61000-2-4) manual or time-controlled with individual schedule
• Saving of data in a central database incl. database management (e.g. MySQL / MS SQL / Derby / Janitza DB)
• Open system architecture and scalability
Diverse attributes are dependent on the version
8
UMG 512-PROGridVis® software
Reporting
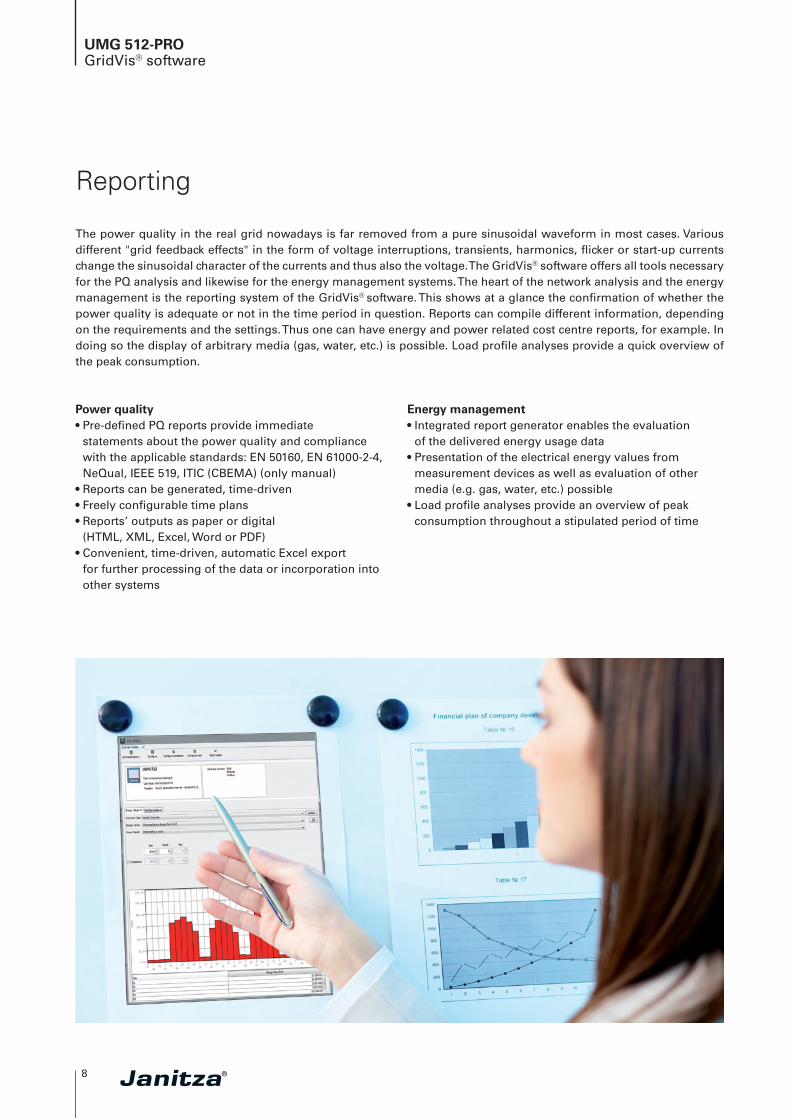
The power quality in the real grid nowadays is far removed from a pure sinusoidal waveform in most cases. Various different "grid feedback effects" in the form of voltage interruptions, transients, harmonics, fl icker or start-up currents change the sinusoidal character of the currents and thus also the voltage. The GridVis® software offers all tools necessary for the PQ analysis and likewise for the energy management systems. The heart of the network analysis and the energy management is the reporting system of the GridVis® software. This shows at a glance the confi rmation of whether the power quality is adequate or not in the time period in question. Reports can compile different information, depending on the requirements and the settings. Thus one can have energy and power related cost centre reports, for example. In doing so the display of arbitrary media (gas, water, etc.) is possible. Load profi le analyses provide a quick overview of the peak consumption.
Power quality• Pre-defi ned PQ reports provide immediate
statements about the power quality and compliance with the applicable standards: EN 50160, EN 61000-2-4, NeQual, IEEE 519, ITIC (CBEMA) (only manual)
• Reports can be generated, time-driven• Freely confi gurable time plans• Reports’ outputs as paper or digital
(HTML, XML, Excel, Word or PDF)• Convenient, time-driven, automatic Excel export
for further processing of the data or incorporation into other systems
Energy management• Integrated report generator enables the evaluation
of the delivered energy usage data• Presentation of the electrical energy values from
measurement devices as well as evaluation of other media (e.g. gas, water, etc.) possible
• Load profi le analyses provide an overview of peak consumption throughout a stipulated period of time
9
UMG 512-PROGridVis® software
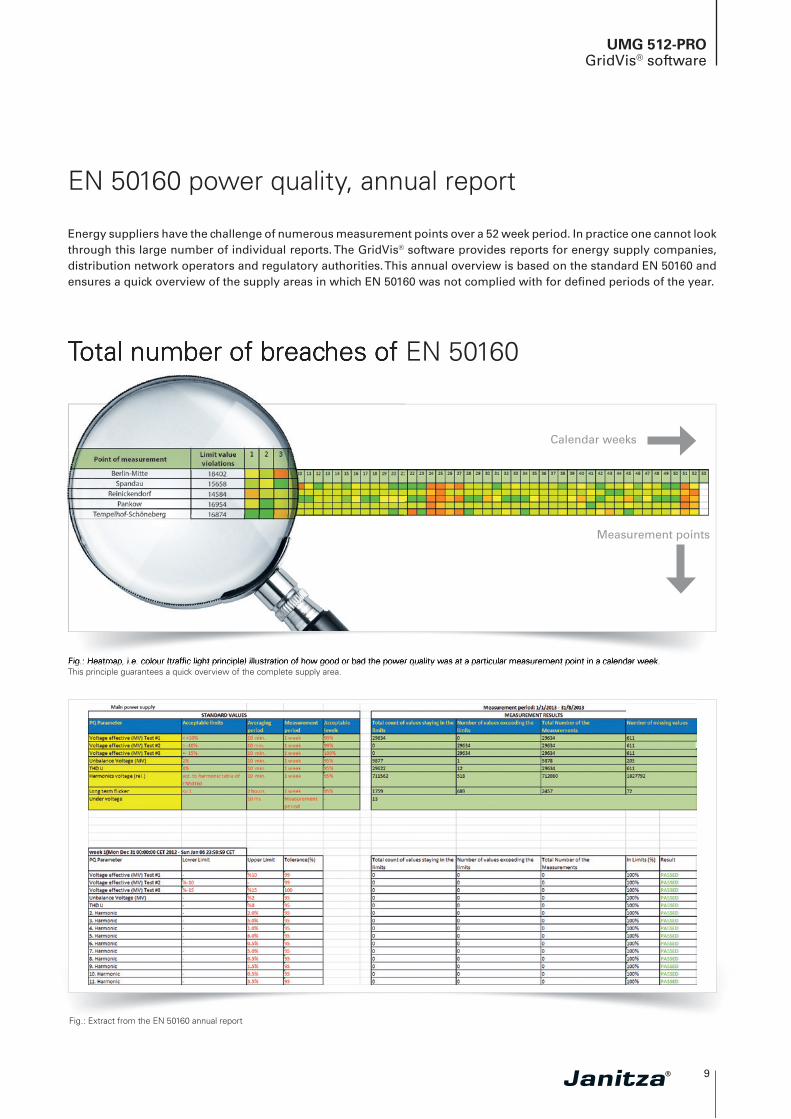
Energy suppliers have the challenge of numerous measurement points over a 52 week period. In practice one cannot look through this large number of individual reports. The GridVis® software provides reports for energy supply companies, distribution network operators and regulatory authorities. This annual overview is based on the standard EN 50160 and ensures a quick overview of the supply areas in which EN 50160 was not complied with for defi ned periods of the year.
EN 50160 power quality, annual report
Fig.: Extract from the EN 50160 annual report
Total number of breaches of EN 50160
Fig.: Heatmap, i.e. colour (traffi c light principle) illustration of how good or bad the power quality was at a particular measurement point in a calendar week. This principle guarantees a quick overview of the complete supply area.Fig.: Heatmap, i.e. colour (traffi c light principle) illustration of how good or bad the power quality was at a particular measurement point in a calendar week.
Calendar weeks
Measurement points
Total number of breaches of EN 50160
10
UMG 512-PROClass A power quality analyser
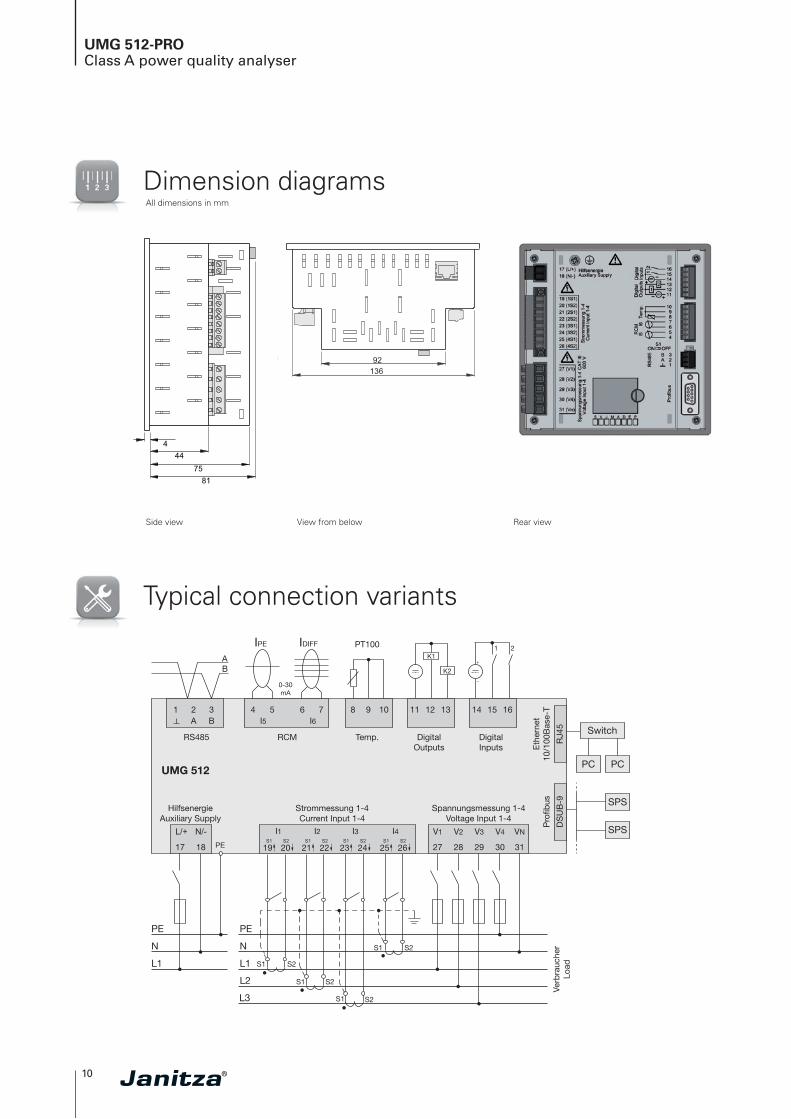
Typical connection variants
UMG 512
A +
-
1
PE
N
L1
V1 V2 V3 V4
Spannungsmessung 1-4Voltage Input 1-4
27 28 29 30
L2
Strommessung 1-4Current Input 1-4
S1 S2
S1
S1
S2
S2
S1 S2
S1 S2
I1
19 20S1 S2
I2
21 22S1 S2
I3
23 24S1 S2
I4
25 26
VN
31
L3
HilfsenergieAuxiliary Supply
17 18
L/+ N/-PE
Verb
rauc
her
Load
PE
N
L1
RS485
B
8 9 10
Temp.
PT100IPE IDIFF
0-30 mA
4 5 6 7
RCM
I5 I611 12 13
DigitalOutputs
K1
K2
14 15 16
DigitalInputs
2
Eth
erne
t10
/100
Bas
e-T
RJ4
5 Switch
PCPC
Pro
fibus
DS
UB
-9
SPS
SPS
2 3A B
1
Dimension diagramsAll dimensions in mm
Side view View from below Rear view
11
UMG 512-PROClass A power quality analyser
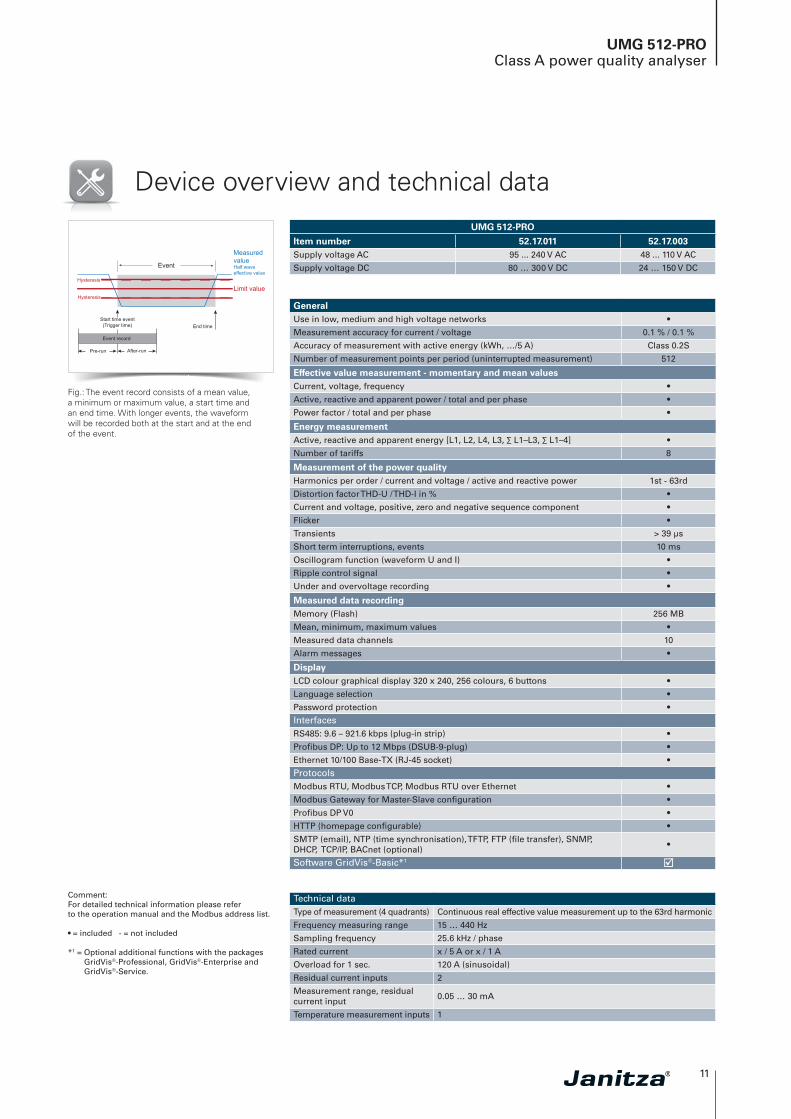
Device overview and technical dataUMG 512-PRO
Item number 52.17.011 52.17.003Supply voltage AC 95 ... 240 V AC 48 ... 110 V AC
Supply voltage DC 80 … 300 V DC 24 … 150 V DC
Comment: For detailed technical information please refer to the operation manual and the Modbus address list.
• = included - = not included
*1 = Optional additional functions with the packages GridVis®-Professional, GridVis®-Enterprise and GridVis®-Service.
Limit value
MeasuredvalueHalf wave effective value
Start time event(Trigger time)
End time
Event record
Event
Hysteresis
Hysteresis
Pre-run After-run
Fig.: The event record consists of a mean value, a minimum or maximum value, a start time and an end time. With longer events, the waveform will be recorded both at the start and at the end of the event.
GeneralUse in low, medium and high voltage networks •
Measurement accuracy for current / voltage 0.1 % / 0.1 %
Accuracy of measurement with active energy (kWh, …/5 A) Class 0.2S
Number of measurement points per period (uninterrupted measurement) 512
Effective value measurement - momentary and mean valuesCurrent, voltage, frequency •
Active, reactive and apparent power / total and per phase •
Power factor / total and per phase •
Energy measurementActive, reactive and apparent energy [L1, L2, L4, L3, ∑ L1–L3, ∑ L1–4] •
Number of tariffs 8
Measurement of the power qualityHarmonics per order / current and voltage / active and reactive power 1st - 63rd
Distortion factor THD-U / THD-I in % •
Current and voltage, positive, zero and negative sequence component •
Flicker •
Transients > 39 µs
Short term interruptions, events 10 ms
Oscillogram function (waveform U and I) •
Ripple control signal •
Under and overvoltage recording •
Measured data recordingMemory (Flash) 256 MB
Mean, minimum, maximum values •
Measured data channels 10
Alarm messages •
DisplayLCD colour graphical display 320 x 240, 256 colours, 6 buttons •
Language selection •
Password protection •
InterfacesRS485: 9.6 – 921.6 kbps (plug-in strip) •
Profibus DP: Up to 12 Mbps (DSUB-9-plug) •
Ethernet 10/100 Base-TX (RJ-45 socket) •
ProtocolsModbus RTU, Modbus TCP, Modbus RTU over Ethernet •
Modbus Gateway for Master-Slave configuration •
Profibus DP V0 •
HTTP (homepage configurable) •
SMTP (email), NTP (time synchronisation), TFTP, FTP (file transfer), SNMP, DHCP, TCP/IP, BACnet (optional)
•
Software GridVis®-Basic*1
Technical dataType of measurement (4 quadrants) Continuous real effective value measurement up to the 63rd harmonic
Frequency measuring range 15 … 440 Hz
Sampling frequency 25.6 kHz / phase
Rated current x / 5 A or x / 1 A
Overload for 1 sec. 120 A (sinusoidal)
Residual current inputs 2
Measurement range, residual current input
0.05 … 30 mA
Temperature measurement inputs 1

Smart Energy & Power Quality Solutions
Item no.: 33.03.673 • Doc. no.: 2.500.046.9 • 04/2018 • Subject to technical alterations.
Sal
es p
artn
er
Janitza electronics GmbHVor dem Polstück 6D-35633 LahnauGermany
Tel.: +49 6441 9642-0Fax: +49 6441 [email protected]
Related Documents