03/2013

UMENG Insight Report - China Mobile Internet 2012 Review
Jul 15, 2015
Welcome message from author
This document is posted to help you gain knowledge. Please leave a comment to let me know what you think about it! Share it to your friends and learn new things together.
Transcript
03/2013
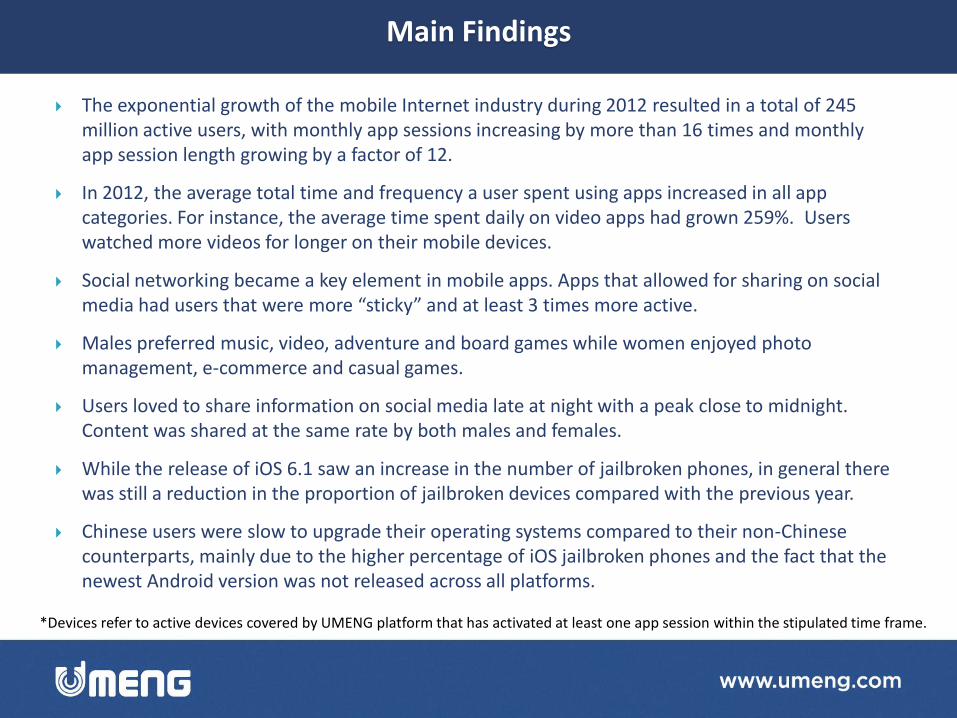
The exponential growth of the mobile Internet industry during 2012 resulted in a total of 245 million active users, with monthly app sessions increasing by more than 16 times and monthly app session length growing by a factor of 12.
In 2012, the average total time and frequency a user spent using apps increased in all app categories. For instance, the average time spent daily on video apps had grown 259%. Users watched more videos for longer on their mobile devices.
Social networking became a key element in mobile apps. Apps that allowed for sharing on social media had users that were more “sticky” and at least 3 times more active.
Males preferred music, video, adventure and board games while women enjoyed photo management, e-commerce and casual games.
Users loved to share information on social media late at night with a peak close to midnight. Content was shared at the same rate by both males and females.
While the release of iOS 6.1 saw an increase in the number of jailbroken phones, in general there was still a reduction in the proportion of jailbroken devices compared with the previous year.
Chinese users were slow to upgrade their operating systems compared to their non-Chinese counterparts, mainly due to the higher percentage of iOS jailbroken phones and the fact that the newest Android version was not released across all platforms.
*Devices refer to active devices covered by UMENG platform that has activated at least one app session within the stipulated time frame.
Main Findings

Big Data Era Shaping Users Lifestyle 1
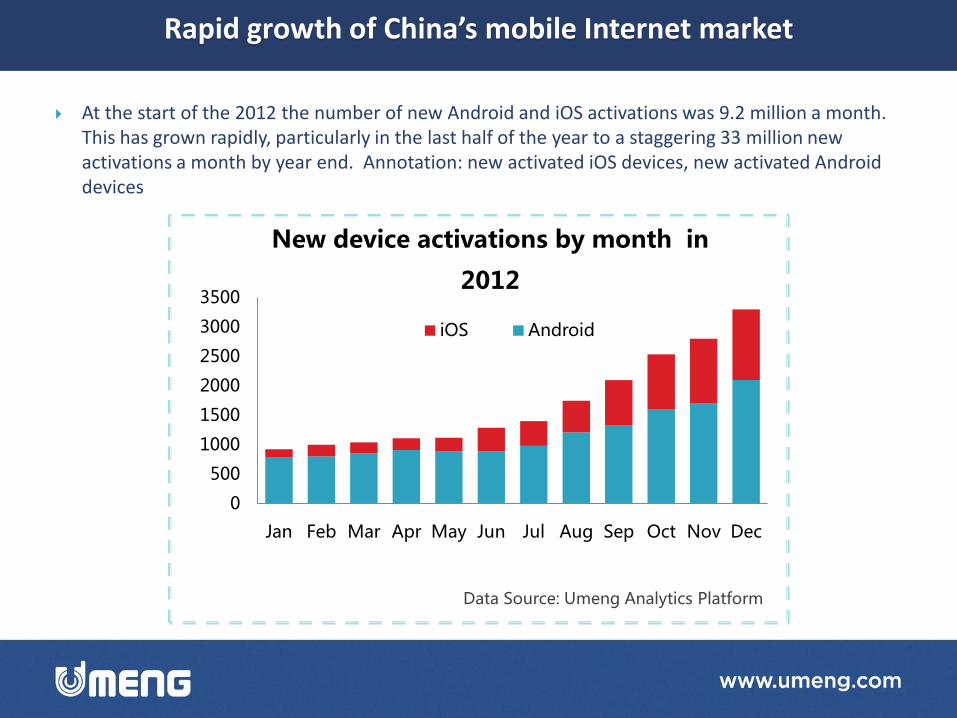
At the start of the 2012 the number of new Android and iOS activations was 9.2 million a month. This has grown rapidly, particularly in the last half of the year to a staggering 33 million new activations a month by year end. Annotation: new activated iOS devices, new activated Android devices
0
500
1000
1500
2000
2500
3000
3500
Jan Feb Mar Apr May Jun Jul Aug Sep Oct Nov Dec
New device activations by month in
2012
iOS Android
Data Source: Umeng Analytics Platform
Rapid growth of China’s mobile Internet market
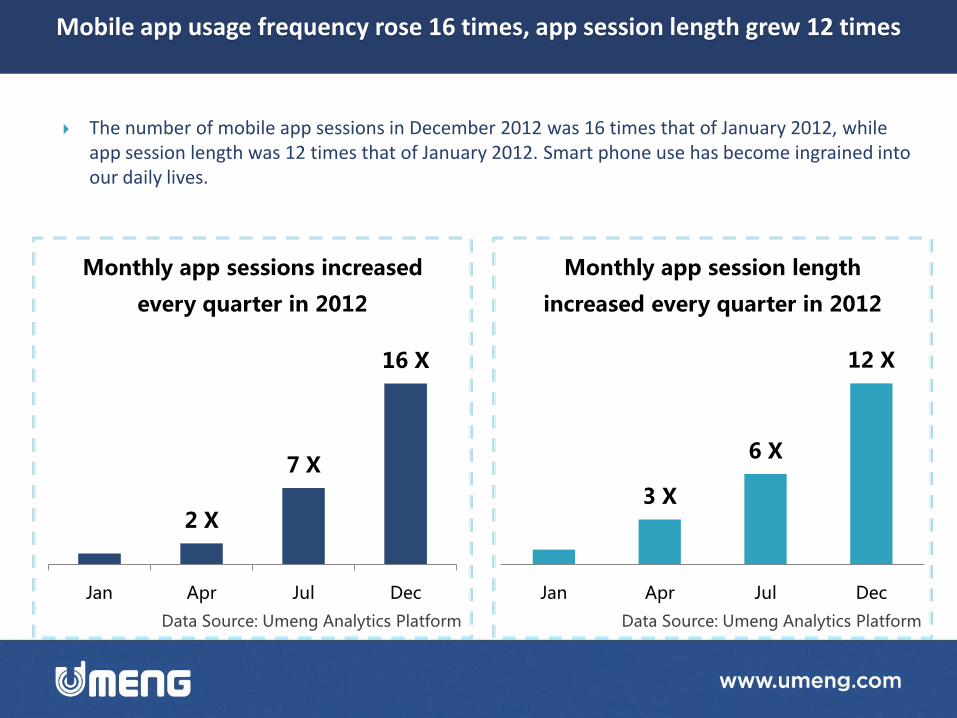
The number of mobile app sessions in December 2012 was 16 times that of January 2012, while app session length was 12 times that of January 2012. Smart phone use has become ingrained into our daily lives.
2 X
7 X
16 X
Jan Apr Jul Dec
Monthly app sessions increased
every quarter in 2012
Data Source: Umeng Analytics Platform Data Source: Umeng Analytics Platform
3 X
6 X
12 X
Jan Apr Jul Dec
Monthly app session length
increased every quarter in 2012
Mobile app usage frequency rose 16 times, app session length grew 12 times
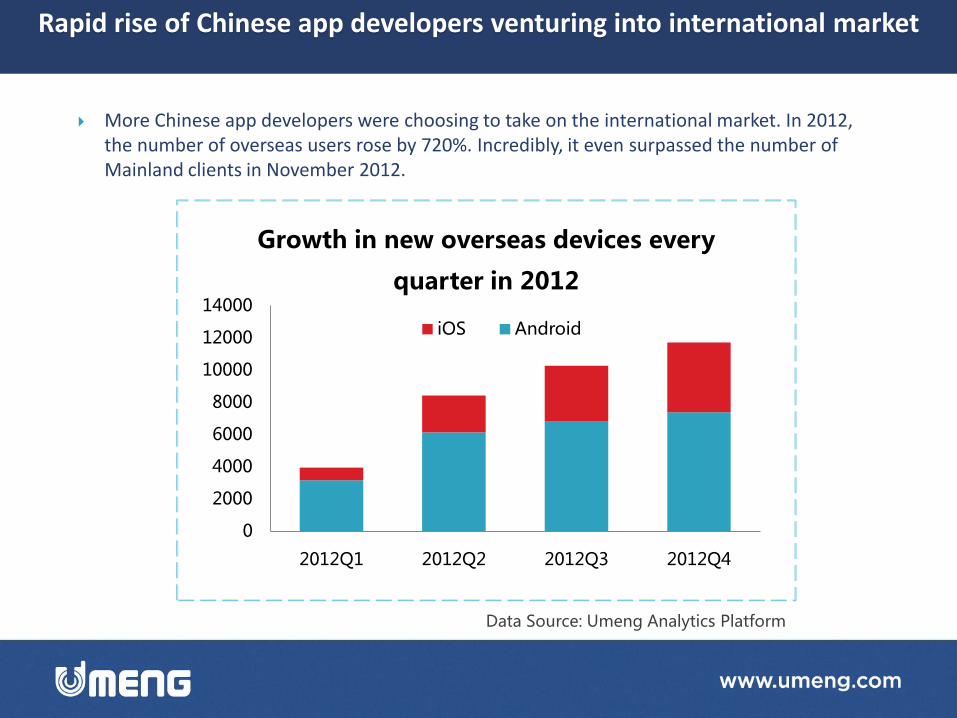
More Chinese app developers were choosing to take on the international market. In 2012, the number of overseas users rose by 720%. Incredibly, it even surpassed the number of Mainland clients in November 2012.
Data Source: Umeng Analytics Platform
0
2000
4000
6000
8000
10000
12000
14000
2012Q1 2012Q2 2012Q3 2012Q4
Growth in new overseas devices every
quarter in 2012
iOS Android
Rapid rise of Chinese app developers venturing into international market
Mobile App Users Behavior 2
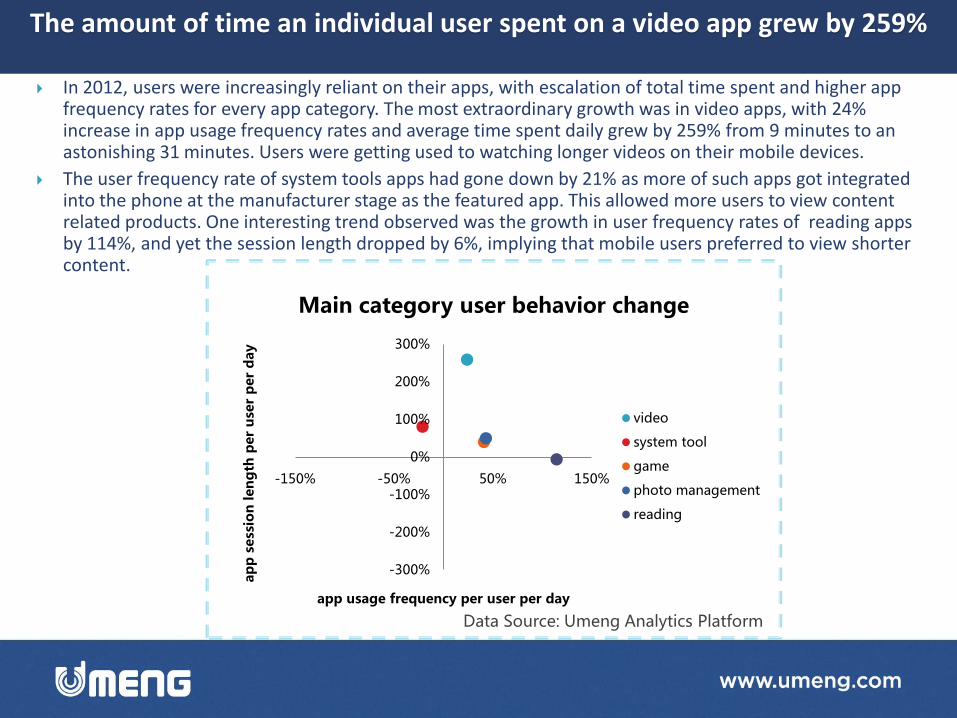
In 2012, users were increasingly reliant on their apps, with escalation of total time spent and higher app frequency rates for every app category. The most extraordinary growth was in video apps, with 24% increase in app usage frequency rates and average time spent daily grew by 259% from 9 minutes to an astonishing 31 minutes. Users were getting used to watching longer videos on their mobile devices.
The user frequency rate of system tools apps had gone down by 21% as more of such apps got integrated into the phone at the manufacturer stage as the featured app. This allowed more users to view content related products. One interesting trend observed was the growth in user frequency rates of reading apps by 114%, and yet the session length dropped by 6%, implying that mobile users preferred to view shorter content.
-300%
-200%
-100%
0%
100%
200%
300%
-150% -50% 50% 150%
ap
p s
ess
ion
len
gth
per
use
r p
er
day
app usage frequency per user per day
Main category user behavior change
video
system tool
game
photo management
reading
Data Source: Umeng Analytics Platform
The amount of time an individual user spent on a video app grew by 259%

There was no gender split on iOS system, while there were more males using Android at 55.3%.
Different sexes had distinctive preferences over different apps such as games, e-commerce, video, entertainment, music and photo management. 68% - 75% of users using e-commerce apps were females while photo management apps had around 60% of its users being females. On the other hand, music and video apps were more attractive to male users.
Data Source: Umeng Analytics Platform Data Source: Umeng Analytics Platform
Android e-commerce iOS e-commerce
Android video iOS video
Android photo iOS photo
Android music iOS music
Android games iOS games
Android entertainment iOS entertainment
Male-Female ratio by app category
Male Female
50%
Male 55.3%
Female 44.7%
Android user distribution by gender
Male 50.1%
Female 49.9%
iOS user distribution by gender
Women preferred photo management and e-commerce apps
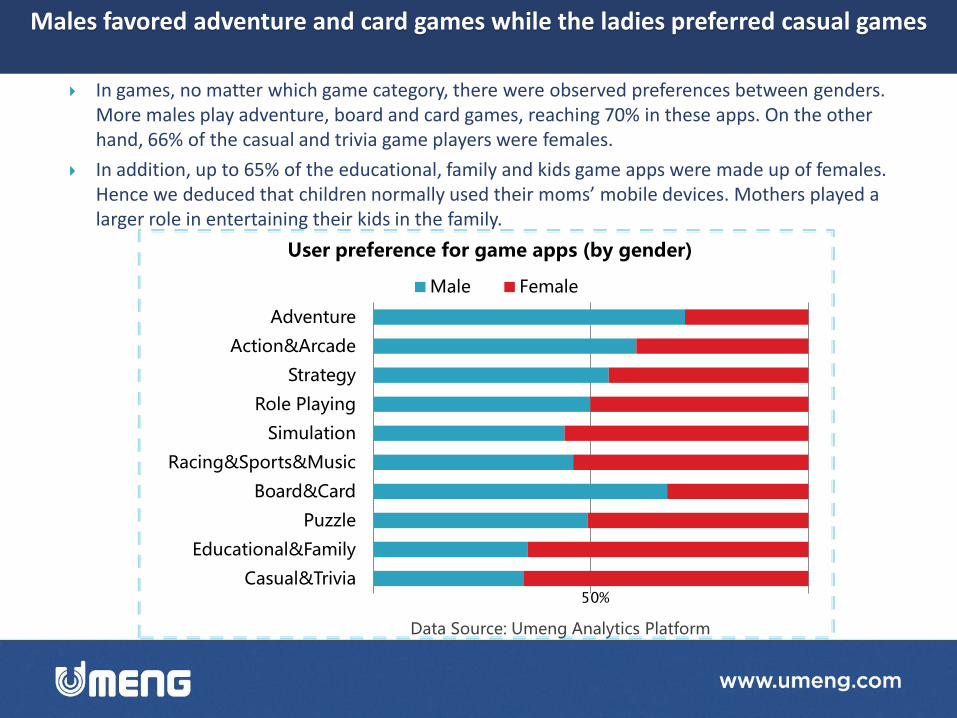
In games, no matter which game category, there were observed preferences between genders. More males play adventure, board and card games, reaching 70% in these apps. On the other hand, 66% of the casual and trivia game players were females.
In addition, up to 65% of the educational, family and kids game apps were made up of females. Hence we deduced that children normally used their moms’ mobile devices. Mothers played a larger role in entertaining their kids in the family.
Data Source: Umeng Analytics Platform
Casual&Trivia
Educational&Family
Puzzle
Board&Card
Racing&Sports&Music
Simulation
Role Playing
Strategy
Action&Arcade
Adventure
User preference for game apps (by gender)
Male Female
50%
Males favored adventure and card games while the ladies preferred casual games
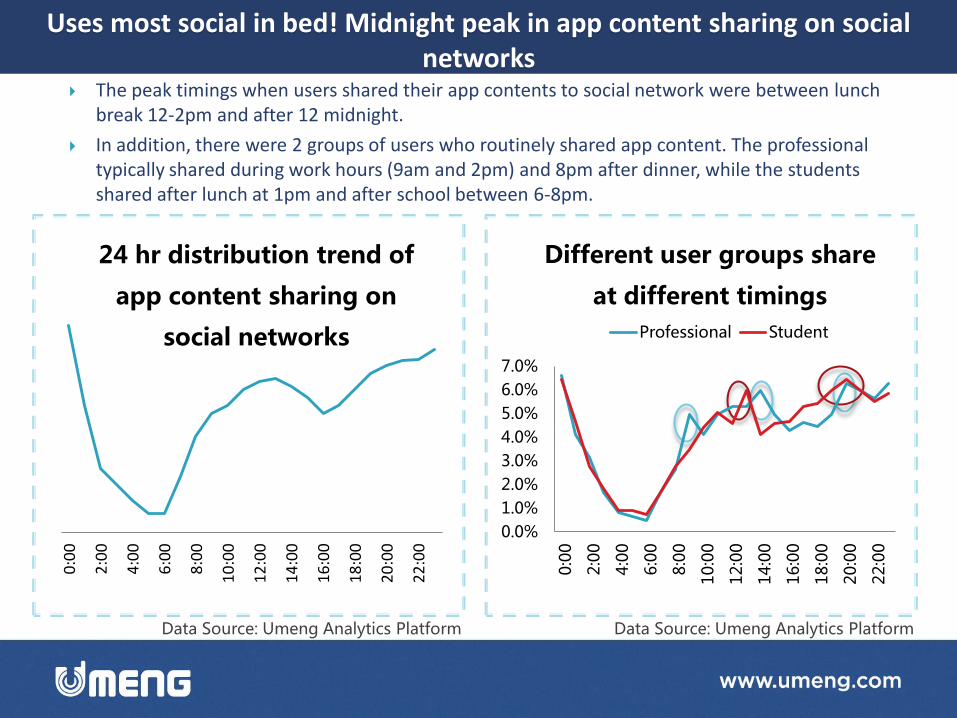
The peak timings when users shared their app contents to social network were between lunch break 12-2pm and after 12 midnight.
In addition, there were 2 groups of users who routinely shared app content. The professional typically shared during work hours (9am and 2pm) and 8pm after dinner, while the students shared after lunch at 1pm and after school between 6-8pm.
Data Source: Umeng Analytics Platform Data Source: Umeng Analytics Platform
0:0
0
2:0
0
4:0
0
6:0
0
8:0
0
10
:00
12
:00
14
:00
16
:00
18
:00
20
:00
22
:00
24 hr distribution trend of
app content sharing on
social networks
Uses most social in bed! Midnight peak in app content sharing on social networks
0.0%
1.0%
2.0%
3.0%
4.0%
5.0%
6.0%
7.0%
0:0
0
2:0
0
4:0
0
6:0
0
8:0
0
10:0
0
12:0
0
14:0
0
16:0
0
18:0
0
20:0
0
22:0
0
Different user groups share
at different timings
Professional Student
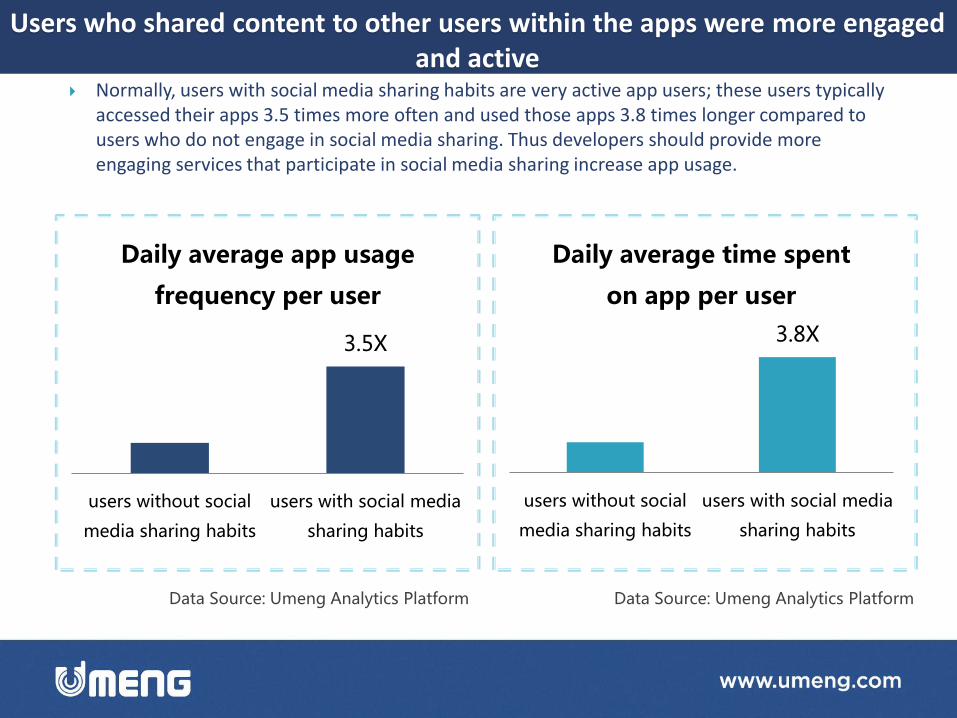
Normally, users with social media sharing habits are very active app users; these users typically accessed their apps 3.5 times more often and used those apps 3.8 times longer compared to users who do not engage in social media sharing. Thus developers should provide more engaging services that participate in social media sharing increase app usage.
Data Source: Umeng Analytics Platform Data Source: Umeng Analytics Platform
3.5X
users without social
media sharing habits
users with social media
sharing habits
Daily average app usage
frequency per user
3.8X
users without social
media sharing habits
users with social media
sharing habits
Daily average time spent
on app per user
Users who shared content to other users within the apps were more engaged and active
Smart device trends in 2012 3
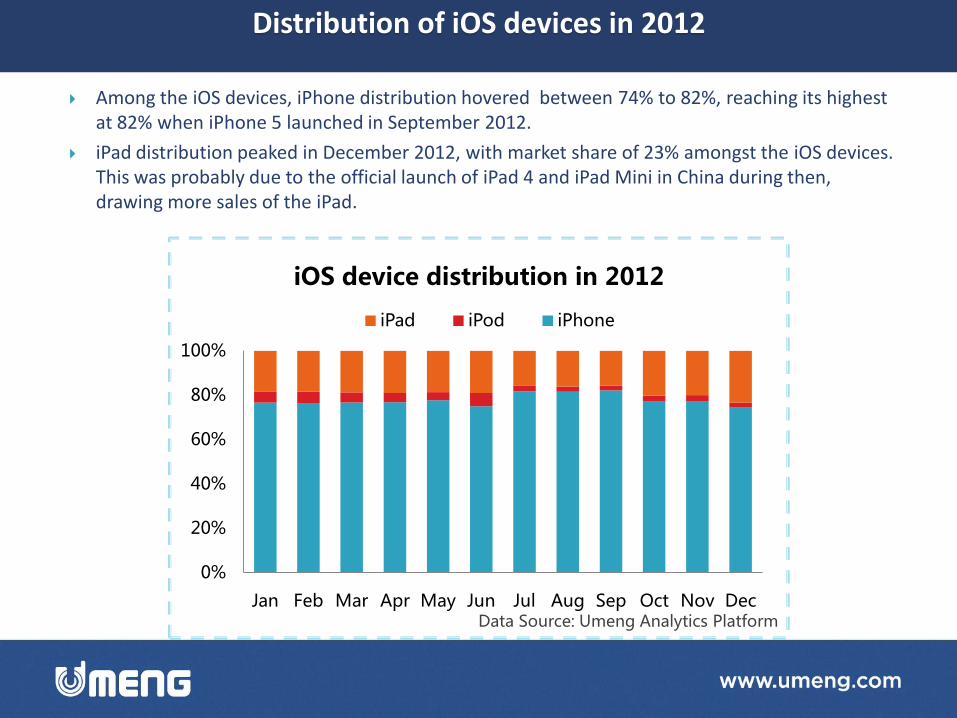
Among the iOS devices, iPhone distribution hovered between 74% to 82%, reaching its highest at 82% when iPhone 5 launched in September 2012.
iPad distribution peaked in December 2012, with market share of 23% amongst the iOS devices. This was probably due to the official launch of iPad 4 and iPad Mini in China during then, drawing more sales of the iPad.
0%
20%
40%
60%
80%
100%
Jan Feb Mar Apr May Jun Jul Aug Sep Oct Nov Dec
iOS device distribution in 2012
iPad iPod iPhone
Data Source: Umeng Analytics Platform
Distribution of iOS devices in 2012
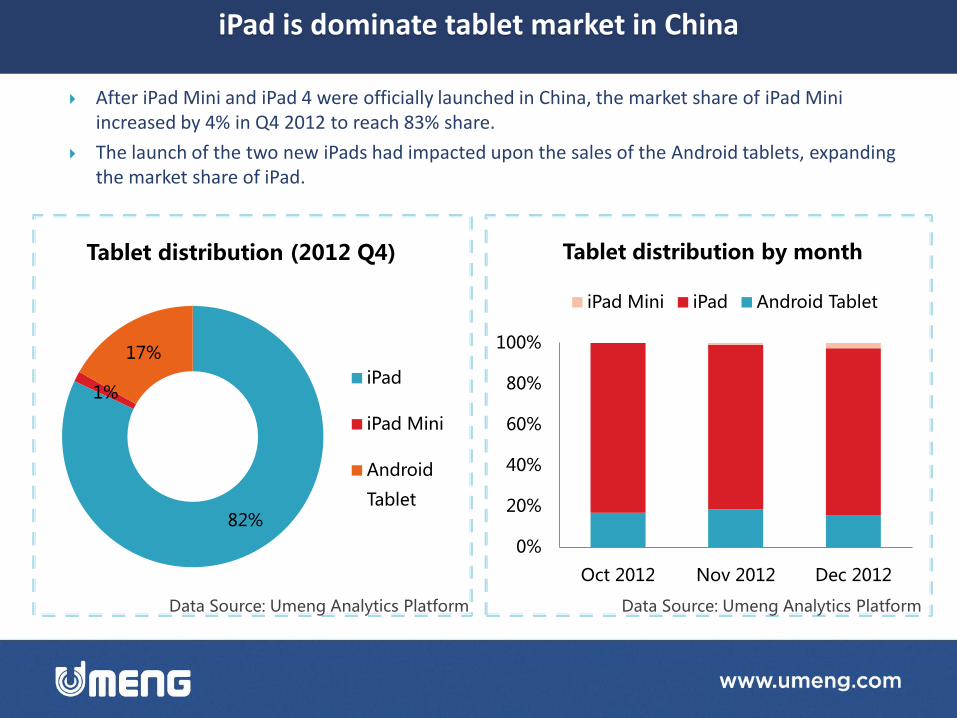
After iPad Mini and iPad 4 were officially launched in China, the market share of iPad Mini increased by 4% in Q4 2012 to reach 83% share.
The launch of the two new iPads had impacted upon the sales of the Android tablets, expanding the market share of iPad.
Data Source: Umeng Analytics Platform Data Source: Umeng Analytics Platform
82%
1%
17%
Tablet distribution (2012 Q4)
iPad
iPad Mini
Android
Tablet
0%
20%
40%
60%
80%
100%
Oct 2012 Nov 2012 Dec 2012
Tablet distribution by month
iPad Mini iPad Android Tablet
iPad is dominate tablet market in China
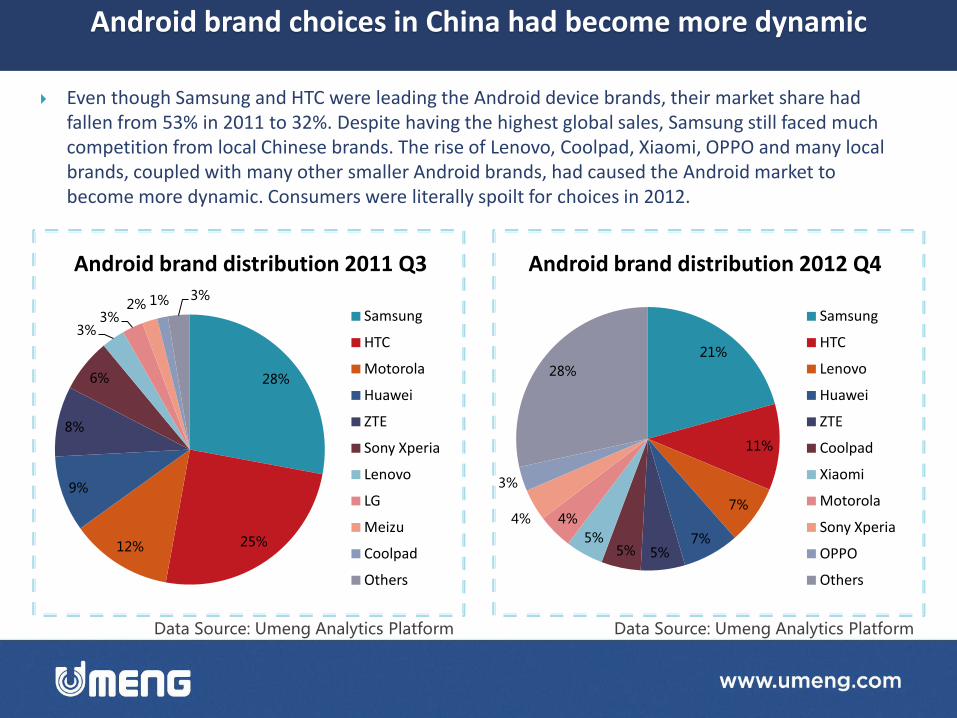
Even though Samsung and HTC were leading the Android device brands, their market share had fallen from 53% in 2011 to 32%. Despite having the highest global sales, Samsung still faced much competition from local Chinese brands. The rise of Lenovo, Coolpad, Xiaomi, OPPO and many local brands, coupled with many other smaller Android brands, had caused the Android market to become more dynamic. Consumers were literally spoilt for choices in 2012.
Data Source: Umeng Analytics Platform Data Source: Umeng Analytics Platform
21%
11%
7%
7% 5% 5%
5%
4% 4%
3%
28%
Android brand distribution 2012 Q4
Samsung
HTC
Lenovo
Huawei
ZTE
Coolpad
Xiaomi
Motorola
Sony Xperia
OPPO
Others
28%
25% 12%
9%
8%
6%
3% 3%
2% 1% 3%
Android brand distribution 2011 Q3
Samsung
HTC
Motorola
Huawei
ZTE
Sony Xperia
Lenovo
LG
Meizu
Coolpad
Others
Android brand choices in China had become more dynamic
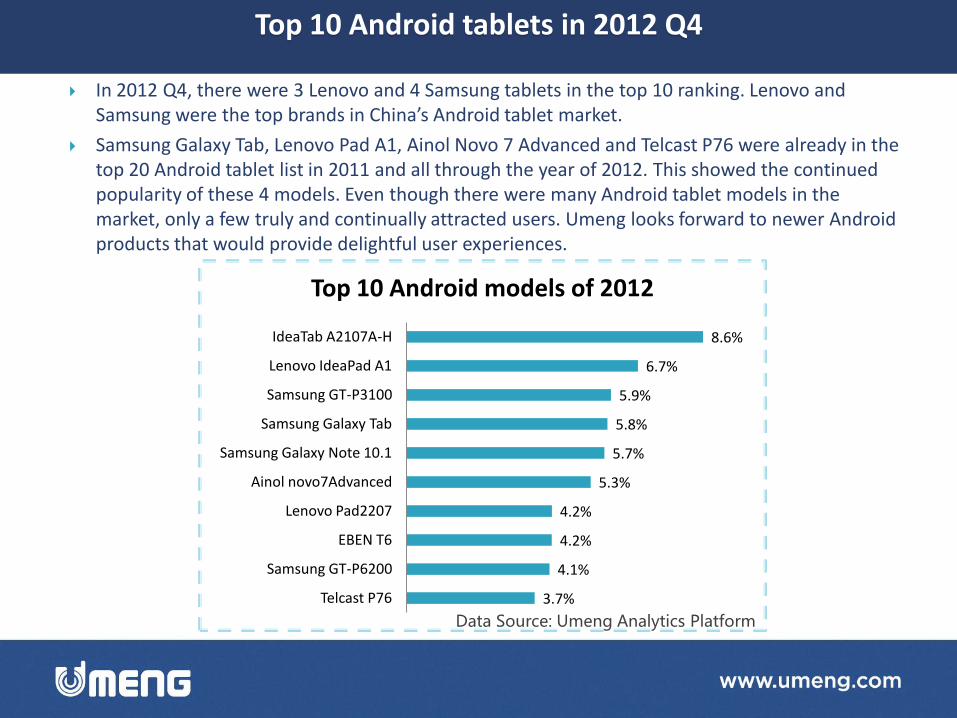
In 2012 Q4, there were 3 Lenovo and 4 Samsung tablets in the top 10 ranking. Lenovo and Samsung were the top brands in China’s Android tablet market.
Samsung Galaxy Tab, Lenovo Pad A1, Ainol Novo 7 Advanced and Telcast P76 were already in the top 20 Android tablet list in 2011 and all through the year of 2012. This showed the continued popularity of these 4 models. Even though there were many Android tablet models in the market, only a few truly and continually attracted users. Umeng looks forward to newer Android products that would provide delightful user experiences.
Data Source: Umeng Analytics Platform
3.7%
4.1%
4.2%
4.2%
5.3%
5.7%
5.8%
5.9%
6.7%
8.6%
Telcast P76
Samsung GT-P6200
EBEN T6
Lenovo Pad2207
Ainol novo7Advanced
Samsung Galaxy Note 10.1
Samsung Galaxy Tab
Samsung GT-P3100
Lenovo IdeaPad A1
IdeaTab A2107A-H
Top 10 Android models of 2012
Top 10 Android tablets in 2012 Q4
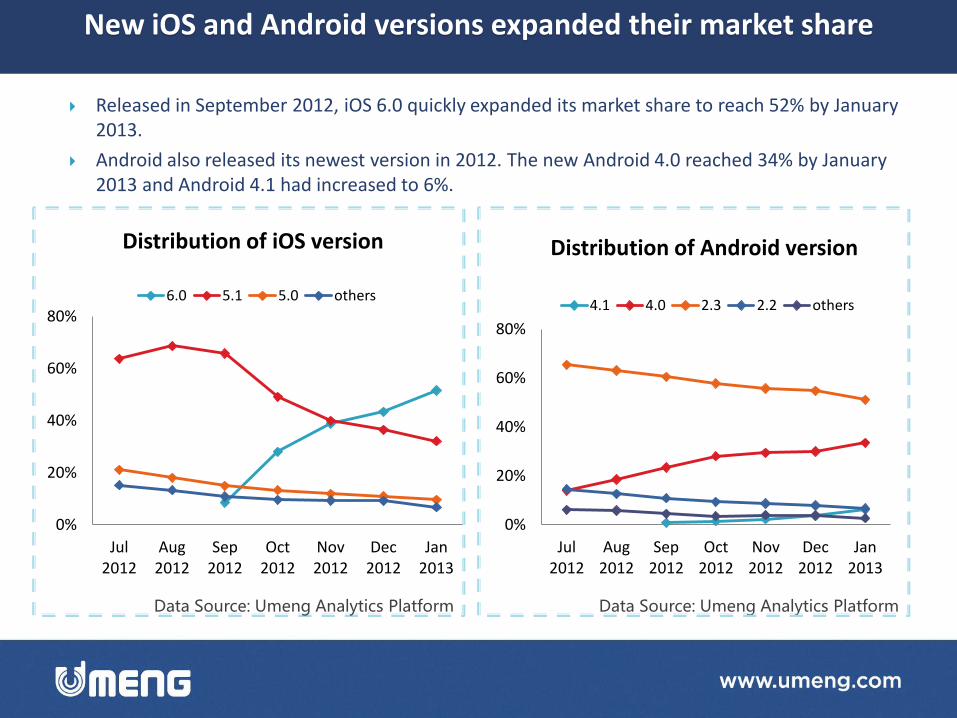
Released in September 2012, iOS 6.0 quickly expanded its market share to reach 52% by January 2013.
Android also released its newest version in 2012. The new Android 4.0 reached 34% by January 2013 and Android 4.1 had increased to 6%.
Data Source: Umeng Analytics Platform Data Source: Umeng Analytics Platform
0%
20%
40%
60%
80%
Jul 2012
Aug 2012
Sep 2012
Oct 2012
Nov 2012
Dec 2012
Jan 2013
Distribution of iOS version
6.0 5.1 5.0 others
0%
20%
40%
60%
80%
Jul 2012
Aug 2012
Sep 2012
Oct 2012
Nov 2012
Dec 2012
Jan 2013
Distribution of Android version
4.1 4.0 2.3 2.2 others
New iOS and Android versions expanded their market share
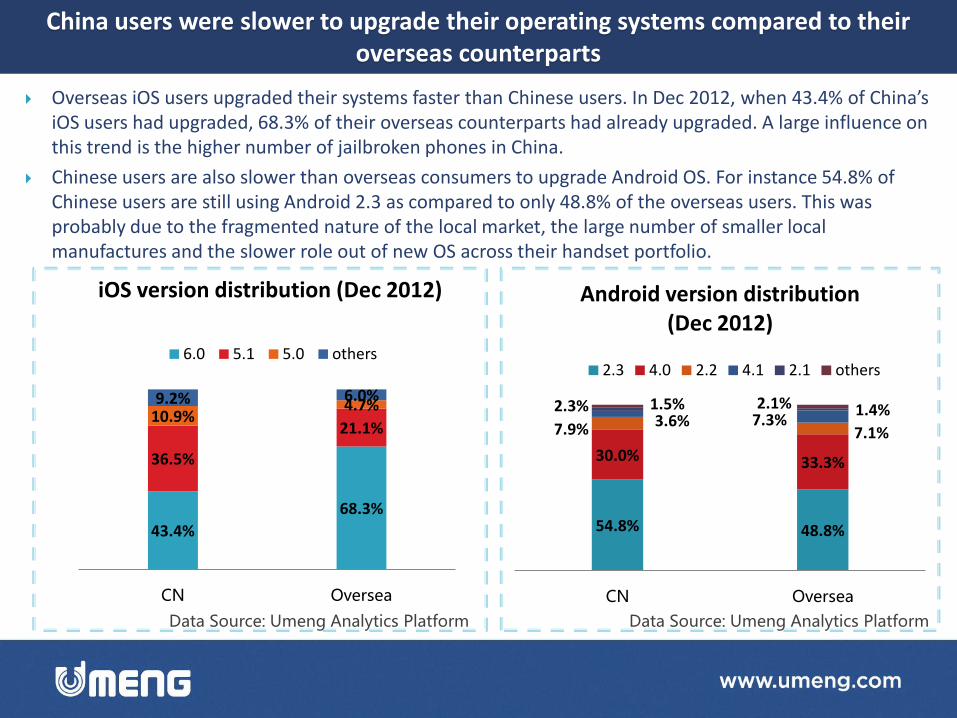
Overseas iOS users upgraded their systems faster than Chinese users. In Dec 2012, when 43.4% of China’s iOS users had upgraded, 68.3% of their overseas counterparts had already upgraded. A large influence on this trend is the higher number of jailbroken phones in China.
Chinese users are also slower than overseas consumers to upgrade Android OS. For instance 54.8% of Chinese users are still using Android 2.3 as compared to only 48.8% of the overseas users. This was probably due to the fragmented nature of the local market, the large number of smaller local manufactures and the slower role out of new OS across their handset portfolio.
54.8% 48.8%
30.0% 33.3%
7.9% 7.1% 3.6% 7.3%
2.3% 1.4% 1.5% 2.1%
CN Oversea
Android version distribution (Dec 2012)
2.3 4.0 2.2 4.1 2.1 others
43.4%
68.3%
36.5%
21.1% 10.9%
4.7% 9.2% 6.0%
CN Oversea
iOS version distribution (Dec 2012)
6.0 5.1 5.0 others
Data Source: Umeng Analytics Platform Data Source: Umeng Analytics Platform
China users were slower to upgrade their operating systems compared to their overseas counterparts
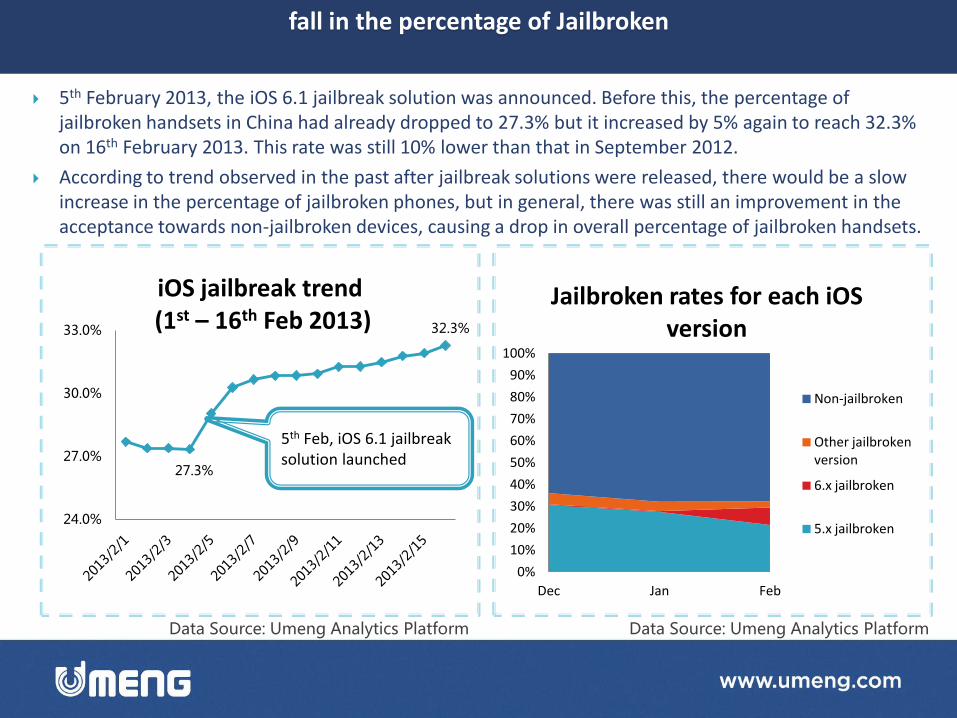
5th February 2013, the iOS 6.1 jailbreak solution was announced. Before this, the percentage of jailbroken handsets in China had already dropped to 27.3% but it increased by 5% again to reach 32.3% on 16th February 2013. This rate was still 10% lower than that in September 2012.
According to trend observed in the past after jailbreak solutions were released, there would be a slow increase in the percentage of jailbroken phones, but in general, there was still an improvement in the acceptance towards non-jailbroken devices, causing a drop in overall percentage of jailbroken handsets.
27.3%
32.3%
24.0%
27.0%
30.0%
33.0%
iOS jailbreak trend (1st – 16th Feb 2013)
5th Feb, iOS 6.1 jailbreak solution launched
Data Source: Umeng Analytics Platform Data Source: Umeng Analytics Platform
0%
10%
20%
30%
40%
50%
60%
70%
80%
90%
100%
Dec Jan Feb
Jailbroken rates for each iOS version
Non-jailbroken
Other jailbroken version
6.x jailbroken
5.x jailbroken
fall in the percentage of Jailbroken
Definition of terms:
Devices: All devices in this report refer to active devices covered by Umeng platform that has activated at least one app session within the stipulated time frame.
Release Date:
Mar 2013
Data Source:
Analysis data based on over 100,000 Android and iOS apps from Umeng platform. Data is taken in the entire period of year 2012.
Statement:
Above data belong to Umeng platform. Any use of data can be used for free provided that Umeng is quoted as the original source.
Contact us : [email protected]
About this report
Umeng Analytics
Umeng App Analytics Platform is the leading and largest provider of mobile app analytics and developer services in China. We help app developers to analyse user behaviour, enabling them to stategize to efficiently distribute and promote their apps. Umeng covers more than 100,000 apps across iOS, Android, Windows Phone and Windows 8 platforms.
UMtrack
The lack of an official iOS apps channel analytics tool that is easy to use and provide accurate data is a constant challenge for iOS app developers. Umeng’s Umtrack provides developers with accurate analysis of users, helping app developers track their users whom have come from different channels.
App network
App network is a total solution for app developers that integrates in-house ads, cross-promotion and advertising. It delivers efficient distribution for apps and helps apps to maximise inventory value, growing the size and value of app users.
UMENG Product Overview
Umeng, a Beijing-based startup founded in April 2010, offers enterprise-class analytics, App Network and Social network plugin to over 100,000 apps across iOS, Android, Windows Phone platforms. Umeng has since raised more than USD10 million from Matrix Partners and Innovation Works.
The team is working around the clock to build better solutions for mobile app developers.
www.umeng.com
weibo.com/umengcom
Related Documents