1 U.S. DEPARTMENT OF ENERGY (DOE) COLLEGIATE WIND COMPETITION UNIVERSITY OF MASSACHUSETTS LOWELL Wind Turbine Team Dean Kennedy Mechanical Engineering [email protected] Christopher Daly Plastics Engineering [email protected] Donna DiBattista Plastics Engineering [email protected] Michael Dube Mechanical Engineering [email protected] Michael Schaefer Plastics Engineering [email protected] Erika Sjöberg Mechanical Engineering [email protected] Erik Anderson Mechanical Engineering [email protected] Battery Kiosk Team Parth Patel Plastics Engineering [email protected] Peter Jones Plastics Engineering [email protected] Meaghan Riley Plastics Engineering [email protected] Adapter Case Team David Phung Mechanical Engineering [email protected] Jeffrey Chung Mechanical Engineering [email protected] Patrick Logan Mechanical Engineering [email protected] Electrical Engineering Team Alexandre Sampaio Electrical Engineering [email protected] Albert Andino Electrical Engineering [email protected] Isaac Grullon Electrical Engineering [email protected] Jigar Patel Electrical Engineering [email protected] Graphic Designer Kristin Morrissey Entrepreneurship [email protected] Business Team Bobby LeBoeuf Entrepreneurship [email protected] Gregory Lennartz Entrepreneurship [email protected] Faculty Advisors David Willis Mechanical Engineering [email protected] Christopher Hansen Mechanical Engineering [email protected] Christopher Niezrecki Mechanical Engineering [email protected] Jack Wilson Management [email protected] Stephen Johnston Plastics Engineering [email protected] Yi Yang Management [email protected] Ziyad Salameh Electrical Engineering [email protected]

Welcome message from author
This document is posted to help you gain knowledge. Please leave a comment to let me know what you think about it! Share it to your friends and learn new things together.
Transcript

1
U.S. DEPARTMENT OF ENERGY (DOE) COLLEGIATE WIND COMPETITION
UNIVERSITY OF MASSACHUSETTS LOWELL
Wind Turbine Team
Dean Kennedy Mechanical Engineering [email protected]
Christopher Daly Plastics Engineering [email protected]
Donna DiBattista Plastics Engineering [email protected]
Michael Dube Mechanical Engineering [email protected]
Michael Schaefer Plastics Engineering [email protected]
Erika Sjöberg Mechanical Engineering [email protected]
Erik Anderson Mechanical Engineering [email protected]
Battery Kiosk Team
Parth Patel Plastics Engineering [email protected]
Peter Jones Plastics Engineering [email protected]
Meaghan Riley Plastics Engineering [email protected]
Adapter Case Team
David Phung Mechanical Engineering [email protected]
Jeffrey Chung Mechanical Engineering [email protected]
Patrick Logan Mechanical Engineering [email protected]
Electrical Engineering Team
Alexandre Sampaio Electrical Engineering [email protected]
Albert Andino Electrical Engineering [email protected]
Isaac Grullon Electrical Engineering [email protected]
Jigar Patel Electrical Engineering [email protected]
Graphic Designer
Kristin Morrissey Entrepreneurship [email protected]
Business Team
Bobby LeBoeuf Entrepreneurship [email protected]
Gregory Lennartz Entrepreneurship [email protected]
Faculty Advisors
David Willis Mechanical Engineering [email protected]
Christopher Hansen Mechanical Engineering [email protected]
Christopher Niezrecki Mechanical Engineering [email protected]
Jack Wilson Management [email protected]
Stephen Johnston Plastics Engineering [email protected]
Yi Yang Management [email protected]
Ziyad Salameh Electrical Engineering [email protected]

2
Design Objective The engineering design of the GoJuice wind turbine-
kiosk-phone system (Figure 1) aligns with its business objec-
tive – to provide a streamlined smartphone battery ex-
change experience using batteries charged by renewable
energy sources. Consumers lead busy lives and demand
immediate gratification, so the engineering design must ac-
count for the intermittent wind source and slow battery
charge rate of mobile electronic devices. GoJuice provides a
business value proposition to the consumer offered by no
other competitor via a seamless engineering approach that
transforms intermittent wind energy sources into immedi-
ately available power for mobile devices via GoJuice’s simple
and convenient battery exchange.
The GoJuice system technical design re-
sponds to the economics of renewable energy,
the practical limitations of wind/solar power
generation for smartphones and the technologi-
cal constraints of transportable solutions for
charging portable electronic devices. The eco-
nomics of wind energy strongly disfavor small installed system sizes due to the dramatic increase in the
cost per installed capacity (Figure 2). The GoJuice team recognizes that to avoid being a niche player in
the renewable energy space, the engineering design must progress toward larger capacity systems in
order to minimize the cost differential with solar and other renewable energy resources. Simultaneously
the turbine must be transportable between seasonal deployment locations; as such, the team has car-
Figure 1. GoJuice System Diagram
Figure 2. Energy Cost per Watt
0
2
4
6
8
10
12
10 100 1000 10000
$/W
att
System Size (Watt)
Solar
Wind
3
ried prototype systems and found that an installed rotor diameter of 2.5 meters balances the needs of
economics with transportability.
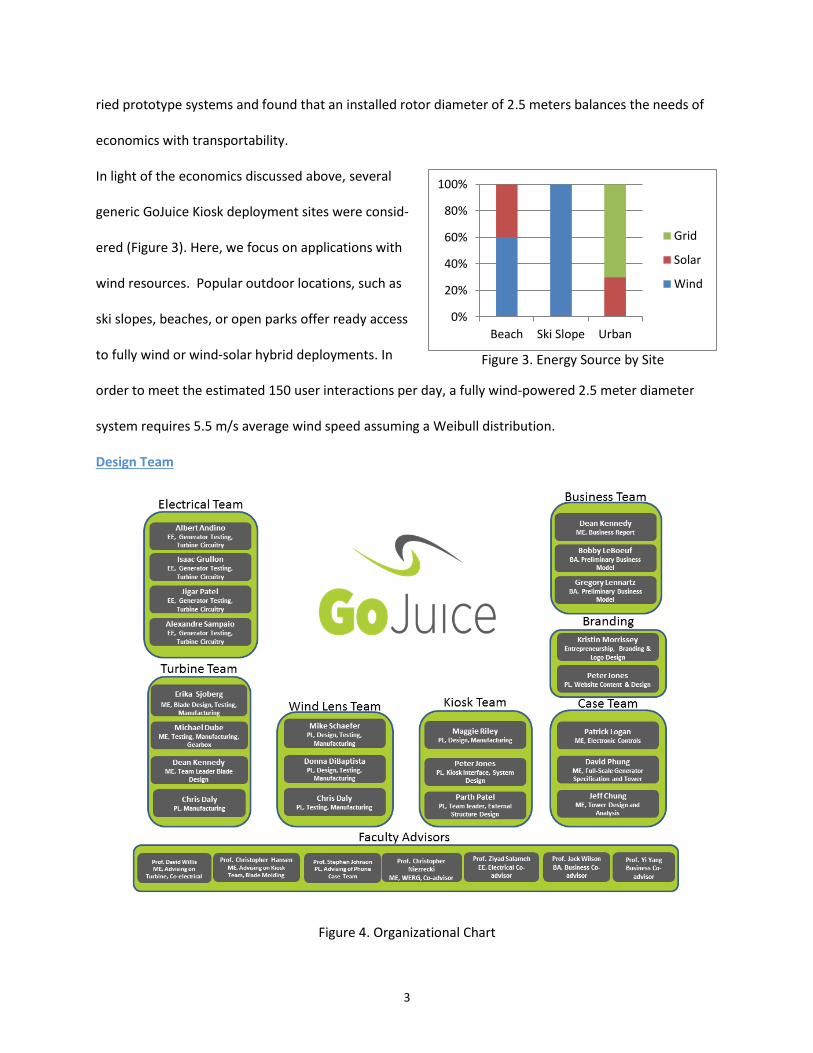
In light of the economics discussed above, several
generic GoJuice Kiosk deployment sites were consid-
ered (Figure 3). Here, we focus on applications with
wind resources. Popular outdoor locations, such as
ski slopes, beaches, or open parks offer ready access
to fully wind or wind-solar hybrid deployments. In
order to meet the estimated 150 user interactions per day, a fully wind-powered 2.5 meter diameter
system requires 5.5 m/s average wind speed assuming a Weibull distribution.
Design Team
Figure 4. Organizational Chart
Figure 3. Energy Source by Site
0%
20%
40%
60%
80%
100%
Beach Ski Slope Urban
Grid
Solar
Wind

4
System Design Overview The unique design features include: (1) an efficient and non-intrusive energy transfer via a one-
minute auxiliary battery exchange (2) an efficient shrouded downwind turbine and direct drive Perma-
nent Magnet Generator (PMG) system that exploits the benefits of larger-scale wind generation and (3)
a cost-competitive wind/solar, community based smartphone charging strategy that exploits the benefi-
cial economies of community and scale.
Wind Turbine Technical Documentation The wind turbine engineering design is described in three sections: (1) Full-Scale turbine, (2)
Wind Lens Diffuser, and (3) Validation (i.e., competition) Scale Turbine.
Full-Scale Turbine
Design and Analysis
Design Objective: The purpose of the wind turbine is to generate the
power required by the kiosk for auxiliary battery charging and kiosk
functions while being easy to transport, install and maintain. To meet
this goal, the turbine should (1) be efficient, lightweight and trans-
portable (2) passively align with the wind (3) operate safely in high
traffic areas and (4) exploit efficiency augmenting wind lens research.
Figure 5. Full Scale Turbine Design
Design Overview: The GoJuice wind turbine is a three-bladed, downwind, shrouded rotor design (Figure
5). An efficient blade design was determined using in-house, ideal Betz-analysis and Blade Element Mo-
mentum Theory computer software. A relatively large tip speed ratio (TSR = 6.0) and low solidity (Solidi-
ty = 0.11) was selected to achieve higher coefficient of performance and reach the rotational velocities
required by direct-drive permanent magnet generators. To ensure safety at high wind speeds, electro-
magnetic braking is applied. The overall wind turbine system specifications are listed in Table 1.
5
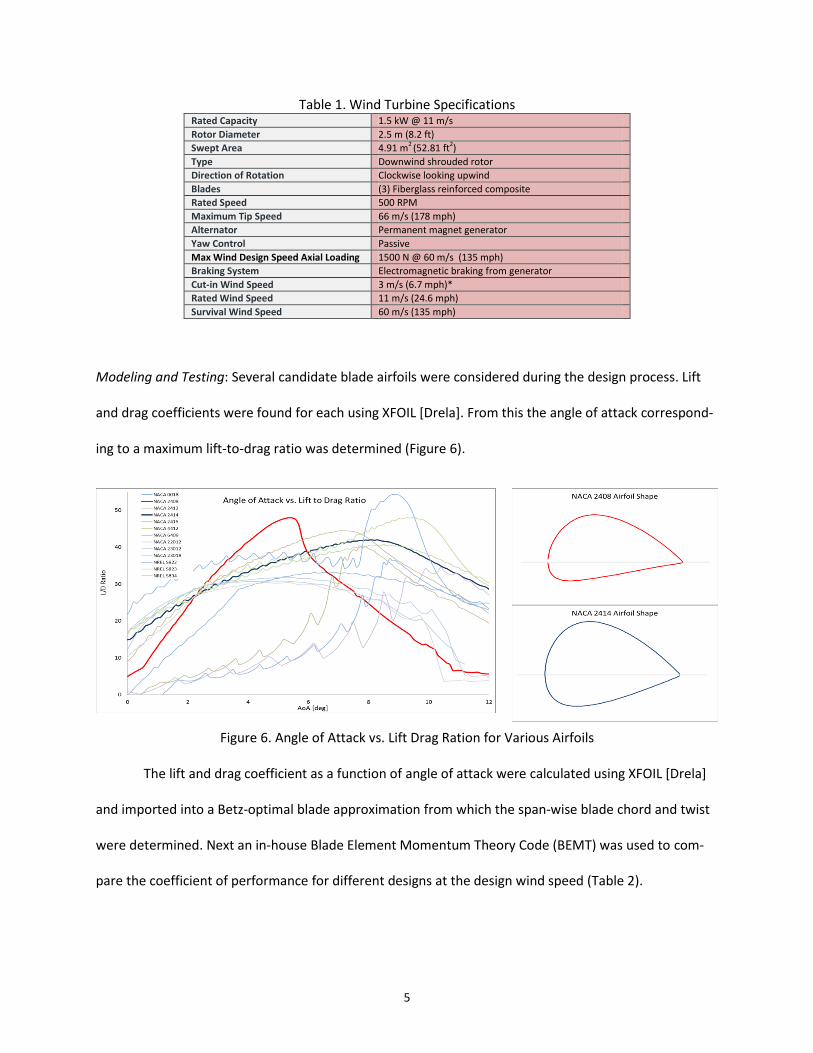
Table 1. Wind Turbine Specifications Rated Capacity 1.5 kW @ 11 m/s
Rotor Diameter 2.5 m (8.2 ft)
Swept Area 4.91 m2 (52.81 ft2)
Type Downwind shrouded rotor
Direction of Rotation Clockwise looking upwind
Blades (3) Fiberglass reinforced composite
Rated Speed 500 RPM
Maximum Tip Speed 66 m/s (178 mph)
Alternator Permanent magnet generator
Yaw Control Passive
Max Wind Design Speed Axial Loading 1500 N @ 60 m/s (135 mph)
Braking System Electromagnetic braking from generator
Cut-in Wind Speed 3 m/s (6.7 mph)*
Rated Wind Speed 11 m/s (24.6 mph)
Survival Wind Speed 60 m/s (135 mph)
Modeling and Testing: Several candidate blade airfoils were considered during the design process. Lift
and drag coefficients were found for each using XFOIL [Drela]. From this the angle of attack correspond-
ing to a maximum lift-to-drag ratio was determined (Figure 6).
The lift and drag coefficient as a function of angle of attack were calculated using XFOIL [Drela]
and imported into a Betz-optimal blade approximation from which the span-wise blade chord and twist
were determined. Next an in-house Blade Element Momentum Theory Code (BEMT) was used to com-
pare the coefficient of performance for different designs at the design wind speed (Table 2).
Figure 6. Angle of Attack vs. Lift Drag Ration for Various Airfoils

6
Table 2. Theoretical Coefficient of Performance for various airfoils
Airfoil 0006 0018 2408 2414 2415 22012 23012 23018 S822 6409
Optimal AoA Not conv. 7 5.3 8.3 8.5 5.9 5.5 6.1 9.8 3.7
Cp Not conv. 32.14 36.35 36.12 35.74 29.11 29.98 31.13 32.53 34.02
A NACA 2414 airfoil was selected due to its high coefficient of performance, its structurally ad-
vantageous thickness and its moderate stall behavior. A turbine rotor diameter of 2.5 meters will deliver
the required 1,565 W-h to the kiosk at a mean wind speed of 5 m/s (11mph). The turbine has a target
rated power of 1,560 W at a wind speed of 11 m/s. The desired cut-out speed is 20 m/s (45 mph) and
the turbine blades are designed to withstand maximum sustained winds of up to 60 m/s (135mph). Be-
tween the cut-in and cut-out wind speeds, the blades were analyzed using the BEMT code (Reynolds
number: Re = 421500 and tip speed ratio: TSR = 6). Above the cut-out speed, turbine blade loads were
approximated using an equivalent arrangement of flat plates perpendicular to the flow. The maximum
axial load is 1,500 N at 60 m/s (135 mph). The predicted axial load and power generation as a function of
wind speed are shown in Figure 7.
Careful siting is critical to the success of wind turbine installations. The time required for a functional
kiosk to recharge 150 auxiliary batteries as a function of time is shown in Figure 8. A wind-only solution
should only be considered when daily power-average wind speeds of 5 m/s (11.2 mph) and greater are
available; however, a hybrid wind-solar strategy should be considered at sites with lower average wind
speeds.
Figure 7. BEMT Results for Power and Axial Load at Varying Wind Speeds

7
Average wind u Weibull average wind u Power output Wind Power output Weibull % Difference
3.10 3.85 35.89 68.55 0.48
4.87 6.05 139.27 265.99 0.48
7.09 8.80 428.59 818.53 0.48
8.86 11.00 837.10 1598.71 0.48
10.19 12.64 1273.10 2431.43 0.48
Figure 8. Time Dependence of Wind Speed for Charging the GoJuice Kiosk
A modular 250 W solar panel can be attached to the turbine, reducing charging times significant-
ly in areas with a lower power-average wind speeds ranging from 4-5 m/s. The times calculated in Figure
8 can be reduced when looking at the Weibull distribution of wind speed. When a Weibull distribution
(Shape Factor= 2) is employed, these power average velocities are increased and should be considered
in the selection of kiosk sites with wind turbines (Figure 9).
Figure 9. Weibull Probability Distribution of Wind Speed.
Turbine Blade Manufacturing: To minimize weight and improve blade-to-blade consistency, the full scale
turbine blades are manufactured from molded fiberglass. The pressure and suction sides of the blade
were fabricated separately using two female molds. A desktop CNC machine with a ¼” ball mill was used
to machine the blade molds from blocks of machineable Ure-
thane foam (Ultra Machinable Prototyping foam, McMaster-
Carr).
Two layers of black pigmented gel coat were applied to the
mold surfaces to create a hardened, smooth and impermeable
Figure 10. Release Film Application

8
surface. Prior to the fiberglass layup, a layer of mold release wax and Polyvinyl Alcohol (PVA) was ap-
plied to prevent the epoxy from adhering to the molds. An epoxy resin (2000, Fiberglass) was mixed
with a cure hardener (2060, Fiberglass) and a 5 percent black epoxy pigment (43 Black Polyester, Fiber-
glass). Once mixed, a thin layer of resin was spread over the blade mold surface and four sheets of fiber-
glass fabric were layered onto the mold (Figure 10). The pressure side of the blade was reinforced using
sheets of 3/32” balsa core. A layer of a perforated release film and a breather fabric was layered on top
of the blades and vacuum bagged to compact the composite and to remove the excess resin. (Figure 11)
Figure 11. Blade Assembly
The blade was cured at ambient temperature, after which the bagging was removed from the blade
halves and the blades were removed from the mold. A dremel tool with a diamond-reinforced cutting
wheel was used to cut along the edges of the blade. To reinforce the root as well as attach the blades to
the hub, a 3.75” by 0.75” piece of oak was glued to the root of each blade section.
Hub and Tower Assembly
Objective: The wind turbine hub and tower provide the critical connection between the wind turbine
and the ground. This assembly must enable passive wind-alignment and be able to withstand the maxi-
mum wind loads from the turbine and shroud. Finally, the system should be lightweight and easy to in-
stall. Overview: A 4.0 meter tower structure supported by four guy-wires was designed to position the
wind turbine for improved wind power extraction and maintain a ground clearance of just under 3 me-
ters. A tower structural analysis has been performed to ensure the lightweight tower can sustain the

9
maximum design wind loading. Modeling and Testing: A minimum
tower height of 4.0 meters was selected to provide sufficient clear-
ance for the average human male (1.8 meters). To maintain a cost
effective design, standard steel tubing was considered. Considering
this tower height, a beam bending analysis was performed to de-
termine the basic tower dimensions. For wind speeds up to 15 m/s,
a minimum of 48.3 mm OD and 3 mm thickness is required for the
steel pipe. This was determined by modeling the turbine blade as a thin disk perpendicular to wind flow
and calculating the drag force as shown in Figure 12. A maximum bending stress of 209.6 MPa is ex-
pected 1.25 m below the mounting position of the turbine. It is at this location where 4 steel guy wires
with a 4.8 mm minimum diameter will attach to reduce the bending stresses in the tower (3.6 kN of ten-
sion per wire). The tower base can either be secured using a steel ground spike if the ground conditions
are suitable enough or using bolts through a flange if operating over concrete. The guy-wires will be an-
chored outward similarly and tightened with tensioning devices. For purposes of testing, the built tower
was 2.5 meters tall with an adjustable hub mount. The tower is welded to a flange and bolted to a
wooden platform where the guyed wires are also attached. The entire structure is then to be weighted
down. A prototype 2.0 meter tower has been constructed using galvanized scaffold tube/steel pipes for
structural strength and corrosion resistance.
Electrical Generation and Control Objective: The electrical power generation and control system converts the wind energy into direct
current (DC) power, while maintaining safe operating conditions across a range of wind speeds.
Overview: An off-the-shelf electrical generation and control system has been specified for the full-scale
wind turbine. A three phase, permanent magnet generator (currently specified as an EnergyStar 1kW
generator) is used to convert the turbine mechanical enegy to AC power. An off-the-shelf emergency
Figure 12. Support Structure
10
Figure 13. A Cut-Away CAD Rendering of the Wind Lens
braking switch is installed, followed by a high current three-phase rectifier. Initially, an off-the-shelf
Maximum Power Point Tracking controller will be prescribed for the product to achieve optimal wind
power extraction and govern turbine operation in high winds; however, over time GoJuice will design
and source a custom MPPT controller of its own.
Wind Lens Design Objective: The purpose of the wind lens is to improve the wind turbine’s power generating capa-
bility by, (1) increasing the wind kinetic energy through the rotor while maintaining reasonable wind
turbine system axial loads, (2) reducing variation in wind speed, and (3) providing improved wind-
alignment capability.
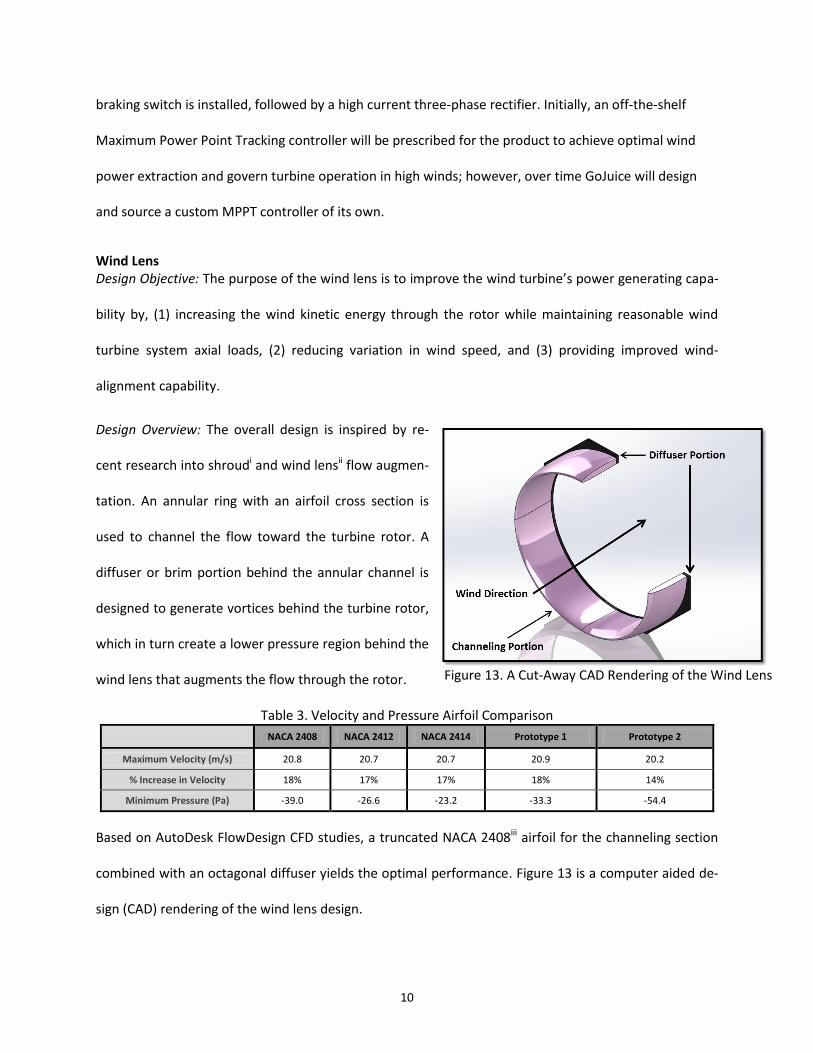
Design Overview: The overall design is inspired by re-
cent research into shroudi and wind lensii flow augmen-
tation. An annular ring with an airfoil cross section is
used to channel the flow toward the turbine rotor. A
diffuser or brim portion behind the annular channel is
designed to generate vortices behind the turbine rotor,
which in turn create a lower pressure region behind the
wind lens that augments the flow through the rotor.
Table 3. Velocity and Pressure Airfoil Comparison
NACA 2408 NACA 2412 NACA 2414 Prototype 1 Prototype 2
Maximum Velocity (m/s) 20.8 20.7 20.7 20.9 20.2
% Increase in Velocity 18% 17% 17% 18% 14%
Minimum Pressure (Pa) -39.0 -26.6 -23.2 -33.3 -54.4
Based on AutoDesk FlowDesign CFD studies, a truncated NACA 2408iii airfoil for the channeling section
combined with an octagonal diffuser yields the optimal performance. Figure 13 is a computer aided de-
sign (CAD) rendering of the wind lens design.
11
Figure 15. Prototype of Validation Turbine
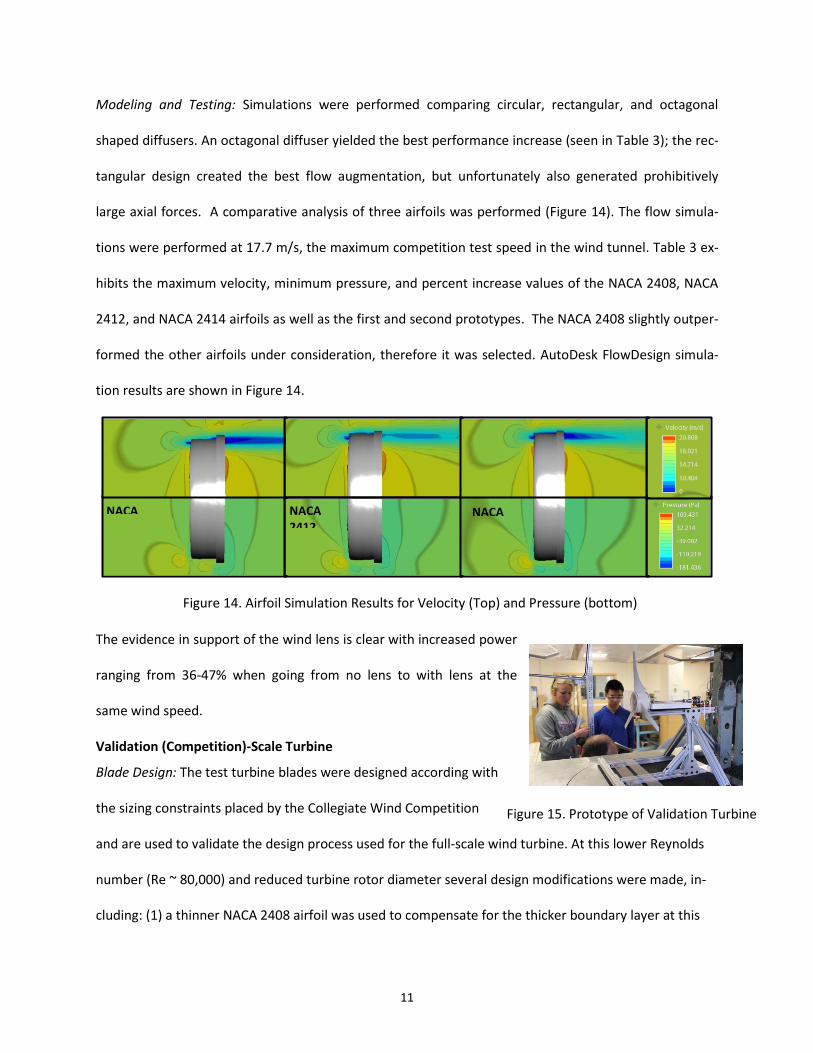
Modeling and Testing: Simulations were performed comparing circular, rectangular, and octagonal
shaped diffusers. An octagonal diffuser yielded the best performance increase (seen in Table 3); the rec-
tangular design created the best flow augmentation, but unfortunately also generated prohibitively
large axial forces. A comparative analysis of three airfoils was performed (Figure 14). The flow simula-
tions were performed at 17.7 m/s, the maximum competition test speed in the wind tunnel. Table 3 ex-
hibits the maximum velocity, minimum pressure, and percent increase values of the NACA 2408, NACA
2412, and NACA 2414 airfoils as well as the first and second prototypes. The NACA 2408 slightly outper-
formed the other airfoils under consideration, therefore it was selected. AutoDesk FlowDesign simula-
tion results are shown in Figure 14.
The evidence in support of the wind lens is clear with increased power
ranging from 36-47% when going from no lens to with lens at the
same wind speed.
Validation (Competition)-Scale Turbine
Blade Design: The test turbine blades were designed according with
the sizing constraints placed by the Collegiate Wind Competition
and are used to validate the design process used for the full-scale wind turbine. At this lower Reynolds
number (Re ~ 80,000) and reduced turbine rotor diameter several design modifications were made, in-
cluding: (1) a thinner NACA 2408 airfoil was used to compensate for the thicker boundary layer at this
NACA 2408
NACA 2412
NACA 2414
Figure 14. Airfoil Simulation Results for Velocity (Top) and Pressure (bottom)

12
lower Reynolds number (2) new blade chord and twist distributions are required to maintain an optimal
rotor design with a tip speed ratio of 6 (3) a gearbox was used to increase the generator rotational ve-
locity and (4) appropriately different manufacturing techniques were adopted. These adjustments were
made to allow testing and validation of the design process. The blades for the validation turbine were
designed using Solidworks and 3D printed using ABS (Figure 15).
Testing and Design Validation: The objective of the testing was to verify the BEMT code outputs, meas-
ure the effectiveness of the wind lens, and to measure the optimal load at varying wind speeds. The tur-
bine was installed in UMass Lowell’s 2ft x 3ft x 4ft subsonic Wind Tunnel. For these tests, a 5-ohm rheo-
stat was used to provide an adjustable load for turbine performance tuning. These results illustrate the
importance of low electrical circuit resistance on increasing energy output efficiency.
Figure 16. Effect of Wind Velocity and Electrical Resistance to Efficiency and Power
The left hand side of Figure 16 shows Efficiency vs. Velocity for the optimal velocity range of 6-
10 m/s. This corresponds to an efficiency range of 27-42% with a 1.5-Ohm load and 13-18% with a 5-
Ohm load. The experimental power curves exhibit a non-linear wind speed-power relationship that
bears some resemblance to the expected cubic behavior. The tunnel-scale turbine power output varied
from 6-23 W at 30% loading in the optimal velocity range and 4-9 W with a 5-Ohm load in the optimal
velocity range.
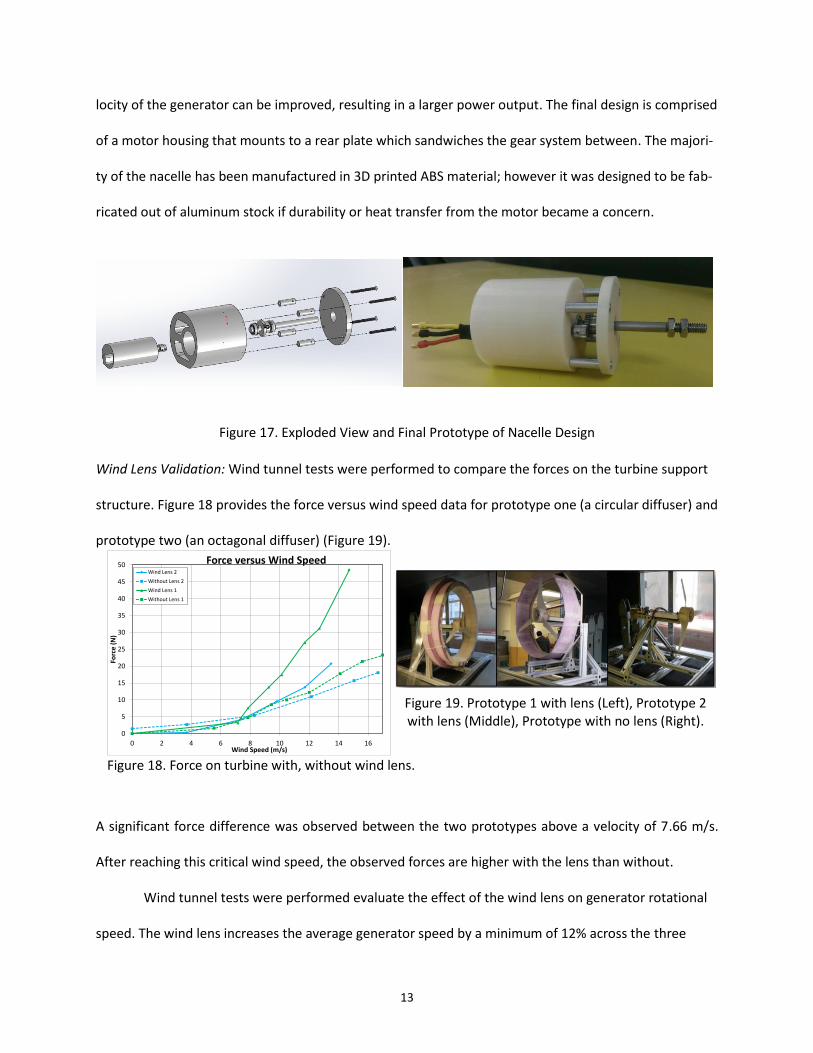
Nacelle Design Overview: The main objective of the test nacelle design (Figure 17) was to enclose a gear-
ing system to improve the stability of torque transfer. By providing a gear ratio of 2.5:1, the angular ve-
13
locity of the generator can be improved, resulting in a larger power output. The final design is comprised
of a motor housing that mounts to a rear plate which sandwiches the gear system between. The majori-
ty of the nacelle has been manufactured in 3D printed ABS material; however it was designed to be fab-
ricated out of aluminum stock if durability or heat transfer from the motor became a concern.
Figure 17. Exploded View and Final Prototype of Nacelle Design
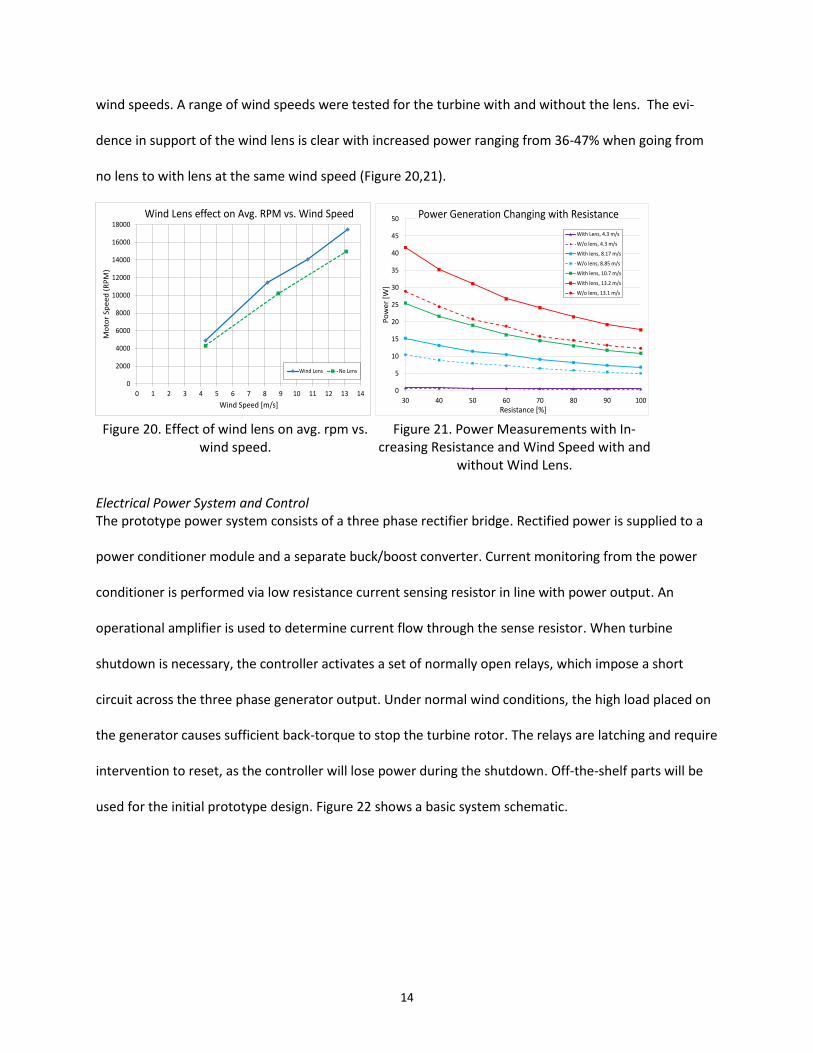
Wind Lens Validation: Wind tunnel tests were performed to compare the forces on the turbine support
structure. Figure 18 provides the force versus wind speed data for prototype one (a circular diffuser) and
prototype two (an octagonal diffuser) (Figure 19).
A significant force difference was observed between the two prototypes above a velocity of 7.66 m/s.
After reaching this critical wind speed, the observed forces are higher with the lens than without.
Wind tunnel tests were performed evaluate the effect of the wind lens on generator rotational
speed. The wind lens increases the average generator speed by a minimum of 12% across the three
Figure 19. Prototype 1 with lens (Left), Prototype 2 with lens (Middle), Prototype with no lens (Right).
0
5
10
15
20
25
30
35
40
45
50
0 2 4 6 8 10 12 14 16
Forc
e (
N)
Wind Speed (m/s)
Force versus Wind SpeedWind Lens 2
Without Lens 2
Wind Lens 1
Without Lens 1
Figure 18. Force on turbine with, without wind lens.
14
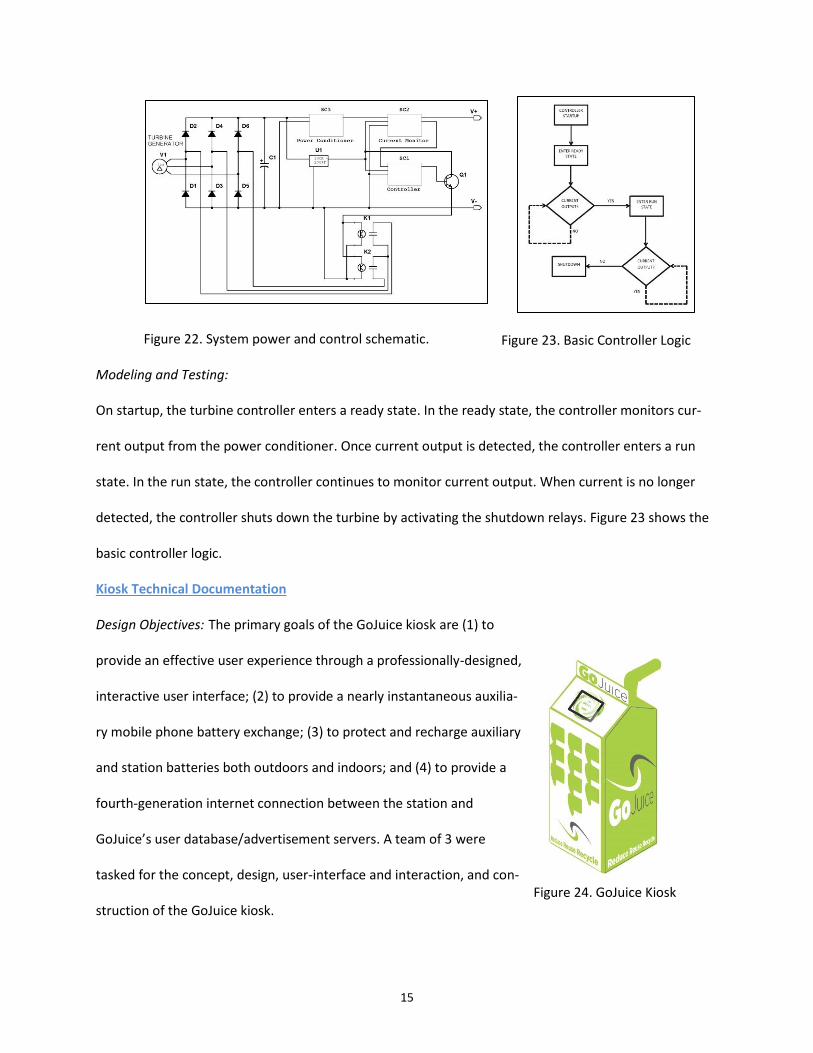
wind speeds. A range of wind speeds were tested for the turbine with and without the lens. The evi-
dence in support of the wind lens is clear with increased power ranging from 36-47% when going from
no lens to with lens at the same wind speed (Figure 20,21).
Electrical Power System and Control The prototype power system consists of a three phase rectifier bridge. Rectified power is supplied to a
power conditioner module and a separate buck/boost converter. Current monitoring from the power
conditioner is performed via low resistance current sensing resistor in line with power output. An
operational amplifier is used to determine current flow through the sense resistor. When turbine
shutdown is necessary, the controller activates a set of normally open relays, which impose a short
circuit across the three phase generator output. Under normal wind conditions, the high load placed on
the generator causes sufficient back-torque to stop the turbine rotor. The relays are latching and require
intervention to reset, as the controller will lose power during the shutdown. Off-the-shelf parts will be
used for the initial prototype design. Figure 22 shows a basic system schematic.
Figure 21. Power Measurements with In-creasing Resistance and Wind Speed with and
without Wind Lens.
0
5
10
15
20
25
30
35
40
45
50
30 40 50 60 70 80 90 100
Po
we
r [W
]
Resistance [%]
Power Generation Changing with Resistance
With Lens, 4.3 m/s
W/o lens, 4.3 m/s
With lens, 8.17 m/s
W/o lens, 8.85 m/s
With lens, 10.7 m/s
With lens, 13.2 m/s
W/o lens, 13.1 m/s
Figure 20. Effect of wind lens on avg. rpm vs. wind speed.
0
2000
4000
6000
8000
10000
12000
14000
16000
18000
0 1 2 3 4 5 6 7 8 9 10 11 12 13 14
Mo
tor
Spe
ed
(R
PM
)
Wind Speed [m/s]
Wind Lens effect on Avg. RPM vs. Wind Speed
Wind Lens No Lens
15
Figure 22. System power and control schematic.
Modeling and Testing:
On startup, the turbine controller enters a ready state. In the ready state, the controller monitors cur-
rent output from the power conditioner. Once current output is detected, the controller enters a run
state. In the run state, the controller continues to monitor current output. When current is no longer
detected, the controller shuts down the turbine by activating the shutdown relays. Figure 23 shows the
basic controller logic.
Kiosk Technical Documentation
Design Objectives: The primary goals of the GoJuice kiosk are (1) to
provide an effective user experience through a professionally-designed,
interactive user interface; (2) to provide a nearly instantaneous auxilia-
ry mobile phone battery exchange; (3) to protect and recharge auxiliary
and station batteries both outdoors and indoors; and (4) to provide a
fourth-generation internet connection between the station and
GoJuice’s user database/advertisement servers. A team of 3 were
tasked for the concept, design, user-interface and interaction, and con-
struction of the GoJuice kiosk. Figure 24. GoJuice Kiosk
Figure 23. Basic Controller Logic

16
Engineering Specifications Table 5 below, represents the daily energy requirement for a GoJuice Kiosk that will be powered by
100% Wind, and/or a hybrid system including solar and grid.
Table 5. Kiosk Power Consumption and Daily Energy Requirements
Mode Power Consumption Hours/day Daily Energy Requirement Interface Mode 200 W 2.5 h1 500 W-h/day Sleep Mode 10 W 21.5 h 215 W-h/day Charging Mode 7.5 W per battery 0.75 h x 150 charges 850 W-h/day Total 1,565 W-h/day
The energy generated by the wind tur-
bine and/or solar panels for off grid
kiosk system will store generated ener-
gy in two deep-cycle batteries, each 12
Volt and 125 A-h. The deep-cycle bat-
teries will provide the necessary power
to charge 10 auxiliary batteries at any
given time, which would be sufficient
to support 150 auxiliary batteries over
a 15-hour time period. These 12-Volt batteries are connected to the kiosk universal 12-V power bus. For
kiosks connected to the electrical grid, there is no need for internal kiosk energy storage, and green
power is exchanged with the grid through net metering; hence, AC wind power and DC solar power are
transformed to 12 V-DC and directly connected to the internal kiosk power. The kiosk has two opera-
tional states: an interface mode, and a sleep mode, and a continuous charging mode. The interface
mode is when the kiosk is in operation by playing an advertisement and exchanging auxiliary batteries.
Sleep mode is during which the kiosk is running only the screensaver and the RFID embedded system.
Interface & Internal
Components
Auxiliary Battery
Charging
0
500
1000
1500
2000
2500
0 50 100 150 200 250 300
Kio
sk E
ne
rgy
Re
qu
ire
me
nt
[W-h
/day
]
Number of Batteries
Kiosk Daily Energy Requirement
Figure 25. GoJuice Kiosk Required Power

17
Figure 26. User Interface
During charging mode, most of the power harnessed is routed to recharge the batteries. Each station
stores and manages 150 auxiliary mobile phone batteries, each 3.7 V and 1,200 mAh, which are directly
recharged from the 12-V power bus. Depending on the number of battery exchanges occurring at a giv-
en kiosk, the daily energy requirement would increase incrementally by 5.625 W-h/charge, with a fixed
energy cost of 715 W-h/day, as represented in Figure 25. The conversion of green power to usable ener-
gy will involve some losses. In the case of wind power, there will be losses due to the conversion to AC
to DC current by a rectifier and voltage down-regulation to charge the auxiliary batteries. Losses of
about 10% are typical for each conversion. This represents a 10% loss three times, or a loss factor of (1 –
0.1)3 = 0.729. This means around 73% of the power produced can be used for charging.
User Interface and Interaction: Kiosk users are first identified as they approach the station using the RFID
tag embedded in the GoJuice phone case. The auxiliary battery ex-
change is performed efficiently (< 1 minute) with minimal user in-
teraction. During the battery exchange, the customer views a tar-
geted interactive advertisement streaming on the kiosk’s low-
power touchscreen, followed by a summary of their green energy
savings (Figure 26). A detailed user experience flowchart is provid-
ed in Figure 27. The user experience is augmented by downloading
the optional GoJuice phone application, which provides: (1) a syn-
opsis of the environmental impact of phone charging behavior; (2) the locations of nearby GoJuice sta-
tions; and (3) storage of electronic coupons served by GoJuice.
18
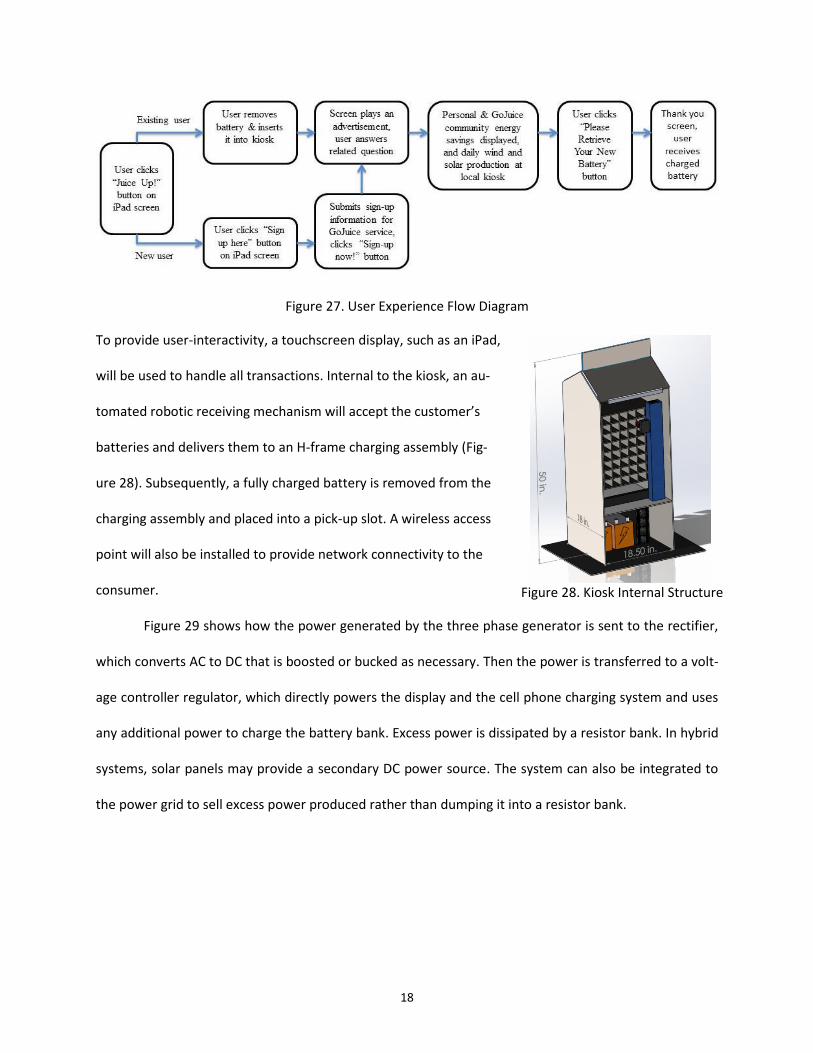
Figure 27. User Experience Flow Diagram
To provide user-interactivity, a touchscreen display, such as an iPad,
will be used to handle all transactions. Internal to the kiosk, an au-
tomated robotic receiving mechanism will accept the customer’s
batteries and delivers them to an H-frame charging assembly (Fig-
ure 28). Subsequently, a fully charged battery is removed from the
charging assembly and placed into a pick-up slot. A wireless access
point will also be installed to provide network connectivity to the
consumer.
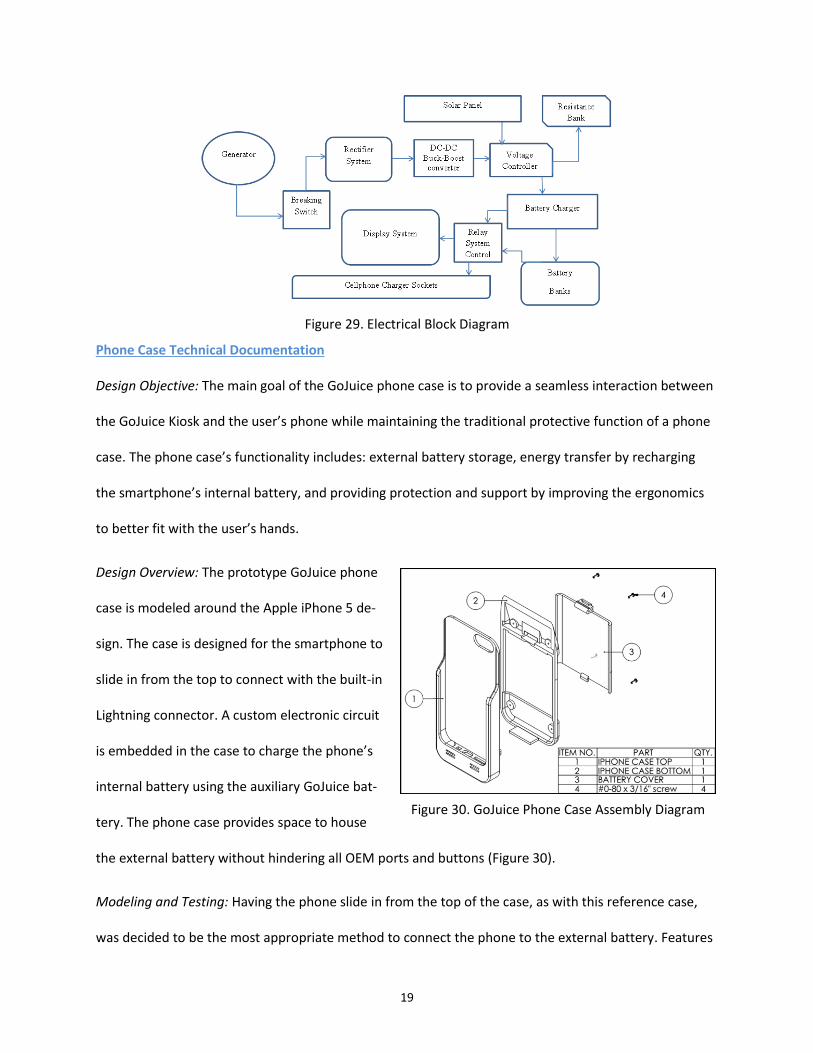
Figure 29 shows how the power generated by the three phase generator is sent to the rectifier,
which converts AC to DC that is boosted or bucked as necessary. Then the power is transferred to a volt-
age controller regulator, which directly powers the display and the cell phone charging system and uses
any additional power to charge the battery bank. Excess power is dissipated by a resistor bank. In hybrid
systems, solar panels may provide a secondary DC power source. The system can also be integrated to
the power grid to sell excess power produced rather than dumping it into a resistor bank.
Figure 28. Kiosk Internal Structure
19
Figure 29. Electrical Block Diagram
Phone Case Technical Documentation
Design Objective: The main goal of the GoJuice phone case is to provide a seamless interaction between
the GoJuice Kiosk and the user’s phone while maintaining the traditional protective function of a phone
case. The phone case’s functionality includes: external battery storage, energy transfer by recharging
the smartphone’s internal battery, and providing protection and support by improving the ergonomics
to better fit with the user’s hands.
Design Overview: The prototype GoJuice phone
case is modeled around the Apple iPhone 5 de-
sign. The case is designed for the smartphone to
slide in from the top to connect with the built-in
Lightning connector. A custom electronic circuit
is embedded in the case to charge the phone’s
internal battery using the auxiliary GoJuice bat-
tery. The phone case provides space to house
the external battery without hindering all OEM ports and buttons (Figure 30).
Modeling and Testing: Having the phone slide in from the top of the case, as with this reference case,
was decided to be the most appropriate method to connect the phone to the external battery. Features
Figure 30. GoJuice Phone Case Assembly Diagram

20
such as length, thickness, battery cavity size, cut-outs for OEM ports, and handling-grip were changed to
better suit the needs of the user. Prototypes of the GoJuice phone case were manufactured from 3D-
printed ABS plastic. An electrical circuit was created to allow for recharging of the smartphone by using
the external battery. This was accomplished by satisfying two required inputs for the iPhone 5: an input
5.0 VDC and an input 2.0 VDC on the data terminals to communicate with the iPhone 5. A DC/DC boost
converter was necessary to step-up the 3.7 VDC output of the external battery to 5.0 VDC while providing
a maximum rated current of 600 mA. The standard Apple-issued power supply that is included with the
iPhone offers a current draw of 500 mA. Major design improvements from student surveys include:
making the battery cover easier to remove, additional space to house the electronics, and increased er-
gonomics for the user by rounding sides/corners and secure attachment of the phone and case.
Engineering Diagrams: The electrical schematic of the GoJuice phone case is shown in Figure 31.
Figure 31. GoJuice Phone Case Electronics Schematic
i Aranake, Aniket C., Vinod K. Lakshminarayan, and Karthik Duraisamy. Computational Analysis of Shrouded Wind Turbine. N.p., n.d. Web. i "Kyushu University RIAM Wind Engineering Section Homepage - Wind Lens." Kyushu University RIAM Wind Engi-neering Section Homepage - Wind Lens. N.p., n.d. Web. 11 Apr. 2014. i "NACA 2408 (naca2408-il)." NACA 2408 (naca2408-il). N.p., n.d. Web. 12 Apr. 2014.
Related Documents