Ultrasound Harmonic Classification of Microemboli

Welcome message from author
This document is posted to help you gain knowledge. Please leave a comment to let me know what you think about it! Share it to your friends and learn new things together.
Transcript

Ultrasound Harmonic Classification of
Microemboli

ISBN 90-77595-64-3
c©2004, P. Palanchon, Dept. of Experimental Echocardiography, Thoraxcentre, Erasmus MC,
The Netherlands.
All rights reserved. No part of this publication may be reproduced, stored in a retrieval system
or transmitted in any form or by any means, electronic, mechanical, photocopying, recording
or otherwise, without the prior written permission of the author.
Printed in The Netherlands by: Optima Grafische Communicatie, Rotterdam.
Cover illustration: Harmonic Bubbling.

Ultrasound Harmonic Classification of
Microemboli
Harmonisch ultrageluid voor het classificeren
van Micro-embolieen
PROEFSCHRIFT
Ter verkrijging van de graad van doctoraan de Erasmus Universiteit Rotterdam,
op gezag van de Rector MagnificusProf. dr. S.W.J. Lamberts,
en volgens het besluit van het College voor Promoties.
De openbare verdediging zal plaatsvinden opwoensdag 22 september 2004 om 15:45 uur
door
Peggy Christiane Palanchon
geboren te Rosny-Sous-Bois, Frankrijk.

PROMOTIECOMMISSIE
PROMOTORS Prof. dr. J. KleinProf. dr. ir. N. de Jong
OVERIGE LEDEN Prof. D.H. EvansProf. dr. ir. A.F.W. van der SteenProf. dr. B.F. LachmannProf. dr. ir. N. BomProf. dr. H.H.M. Korstendr. R.G.A. Ackerstaffdr. G.H. Visser
The financial contributions of Terumo (Tustin CVS, USA), BraccoResearch S.A. (Geneva, Switzerland), Oldelft (Delft, the Netherlands),Spencer Technology (Seattle, USA) are gratefully acknowledged.
Financial support by the Netherlands Heart Foundation for thepublication of this thesis is gratefully acknowledged.

A Ayache et Enzo,
A mes parents,


Contents
1 General introduction 11.1 Embolus and embolism . . . . . . . . . . . . . . . . . . . . . 21.2 Sources of embolization and associated symptoms . . . . . . 21.3 Emboli detection techniques . . . . . . . . . . . . . . . . . . 31.4 Clinical applications . . . . . . . . . . . . . . . . . . . . . . 81.5 Outline of the thesis . . . . . . . . . . . . . . . . . . . . . . 9
2 Production of calibrated gaseous emboli 192.1 Introduction . . . . . . . . . . . . . . . . . . . . . . . . . . . 202.2 Description of the device . . . . . . . . . . . . . . . . . . . . 212.3 Bubble pattern characteristics . . . . . . . . . . . . . . . . . 232.4 Conclusions . . . . . . . . . . . . . . . . . . . . . . . . . . . 31
3 Modelling of gaseous microemboli in an ultrasound field 353.1 Introduction . . . . . . . . . . . . . . . . . . . . . . . . . . . 373.2 Theoretical model . . . . . . . . . . . . . . . . . . . . . . . 383.3 Experimental setup . . . . . . . . . . . . . . . . . . . . . . . 403.4 Results and discussions . . . . . . . . . . . . . . . . . . . . 423.5 Conclusions . . . . . . . . . . . . . . . . . . . . . . . . . . . 50
4 Harmonic emissions of gaseous bubbles applied to mi-croemboli detection 534.1 Introduction . . . . . . . . . . . . . . . . . . . . . . . . . . . 554.2 Simulations . . . . . . . . . . . . . . . . . . . . . . . . . . . 574.3 Measurements . . . . . . . . . . . . . . . . . . . . . . . . . . 594.4 Results . . . . . . . . . . . . . . . . . . . . . . . . . . . . . . 624.5 Conclusions . . . . . . . . . . . . . . . . . . . . . . . . . . . 66
i
ii CONTENTS
5 Emboli characterization using subharmonic and ultrahar-monic emissions 715.1 Introduction . . . . . . . . . . . . . . . . . . . . . . . . . . . 725.2 Methods . . . . . . . . . . . . . . . . . . . . . . . . . . . . . 745.3 Results and discussions . . . . . . . . . . . . . . . . . . . . 765.4 Conclusions . . . . . . . . . . . . . . . . . . . . . . . . . . . 83
6 Emboli detection using new transducer designs 876.A Single frequency transducer . . . . . . . . . . . . . . . . . . 89
6A.1 Introduction . . . . . . . . . . . . . . . . . . . . . . . 906A.2 Measurements and results . . . . . . . . . . . . . . . 916A.3 Discussions and conclusions . . . . . . . . . . . . . . 94
6.B Multifrequency transducer . . . . . . . . . . . . . . . . . . . 976B.1 Introduction . . . . . . . . . . . . . . . . . . . . . . . 986B.2 Transducer design . . . . . . . . . . . . . . . . . . . 986B.3 Experimental setup . . . . . . . . . . . . . . . . . . . 996B.4 Results and discussions . . . . . . . . . . . . . . . . 1006B.5 Conclusions . . . . . . . . . . . . . . . . . . . . . . . 107
7 Ultrasonic manipulation of a gaseous embolus 1117.1 Introduction . . . . . . . . . . . . . . . . . . . . . . . . . . . 1137.2 Materials and methods . . . . . . . . . . . . . . . . . . . . . 1147.3 Results and discussions . . . . . . . . . . . . . . . . . . . . 1167.4 Conclusions . . . . . . . . . . . . . . . . . . . . . . . . . . . 123
8 Summary and conclusions 1258.1 Introduction . . . . . . . . . . . . . . . . . . . . . . . . . . . 1268.2 Nonlinear scattering . . . . . . . . . . . . . . . . . . . . . . 1268.3 Embolus transducer . . . . . . . . . . . . . . . . . . . . . . 1288.4 Ultrasound manipulation of a gaseous embolus . . . . . . . 1298.5 General discussion and future directions . . . . . . . . . . . 129
Samenvatting 133
Dankwoord 137
Curriculum Vitæ 139
List of publications 141


Chapter 1General introduction
1
2 CHAPTER 1. General introduction
1.1 Embolus and embolism
An embolus is defined as a foreign body that arises from a location andtravel in the blood stream. It may consist of gas bubbles or biologic ag-gregates such as blood clots, fat cells, tumor tissues, platelet aggregates orfibrin clots. A single or multiple emboli can result in a sudden interruptionof blood flow to an organ or body part called embolism. Depending onthe clinical situation, the nature, the size and the number of emboli canshow important variations. For instance, up to 620 embolic events per30 minutes period were recorded in patients with prosthetic heart valves1while patient with carotid plaque can produce only a single embolus perhour. It is quite complex, however, to estimate precisely the size rangeof clinically significant embolus. Literature indicates that an embolus sizecan vary from 20µm to 300µm2,3.
The consequences of an embolism are strongly correlated to the em-bolus type (nature, number and size) and the location of the embolism.They can either be immediate or appear slowly over the time4,5. Embolismcan lead to momentary neurological deficits up to heart attack and stroke.Stroke is the third leading cause of death in western countries and 80% ofthem are a direct result of a cerebral thrombosis or embolism blocking anartery in the brain or in the neck.
1.2 Sources of embolization and associated symptoms
Emboli have been reported in a wide variety of clinical fields. A shortdescription of the possible sources of embolism and its outcome is givenbelow.
- Cardiac surgery: Neuropsychological and neurological deficits afterroutine Cardiopulmonary bypass surgery (CPB) have been reported in upto 79% of patients6 and are attributed to the presence of microemboli7,8.These neurological deficits range from postoperative delirium to intellec-tual function and memory deficits to stroke9,10. The microemboli have beenreported to be both gaseous11,12 or particulate13. Despite the use of mem-brane oxygenators and filters in the arterial line, microemboli can pass intothe circulation and microembolic events were noticed during several stagesof the intervention: aortic cannulation and decannulation, cross-clampingof the aorta, and at the start of cardiac ejection14,15.
- Carotid Endarterectomy (CEA): Embolic events were recorded duringeach stage of the operation and they can be both gaseous or particulateemboli16. Particulate emboli were noticed before, during and after the dis-section phase and they are produced by the rupture of an atheroscleroticplaque or by the breaking off of a thrombus formed on an ulcerated sur-

Emboli detection techniques 3
face. Gaseous emboli mainly occur upon release of common carotid arterycrossclamps or during manipulations for inserting a shunt17.
- Carotid artery and middle cerebral artery stenosis: A stenosis is de-fined as an atherosclerotic plaque appearing on the carotid wall and caus-ing a narrowing of the vessel. An unstable plaque can break off into smallpieces that will move and obstruct small brain vessels thereby leading toischemic stroke. In-Vivo studies have shown that a high number of partic-ulate embolic events were detected especially in patients with high-gradestenosis18−20.
- Prosthetic heart valve: prosthetic heart valve replacement, particu-larly when mechanical devices are used, is associated with the generationof microemboli that can persist through out the follow up period. Theycan be either fibrin or platelet microemboli or gaseous bubbles producedby cavitation occurring around the prothesis1,21−23.
- Cerebral angiography: neurological complications following angiogra-phy are supposed to be the result of microembolism. Most of them aregaseous emboli and they are produced during catheter flushing and con-trast injection. Nevertheless, some particulate emboli may also arise fromclot adherent to guidewires and atheromatous debris24,25.
-Cerebral angioplasty: The most common complication of carotid an-gioplasty is distal embolization of debris and/or thrombus. Nevertheless,some clinical studies have shown that most of them are asymptomatic26−28.
- Atrial fibrillation: Atrial fibrillation is a disorder of the heart beatleading to the formation of stagnant blood within the atria. Clots can beformed from this blood and enter into the circulation. Atrial fibrillation isthe cause of 15% of all strokes29.
- Diving and hyperbaric medicine: gaseous bubbles released in the tis-sue or the bloodstream during compression or decompression exposure areconsidered precursors to decompression sickness. They can affect nerves,arteries, veins, muscles and bones2,30.
Microembolic signals were also reported, to a less extend, in the follow-ing clinical situations: patient with bone fractures31; patient with acutemyocardial infarction32, detection of right-to-left shunts33; during aneurys-mal subarachnoid hemorrhage34; Eisenmenger’s syndrome35; mitral valveprolapse36; dilative cardiomyopathy37; left ventricular assist device38; bac-terial endocarditis39 and Sneddon syndrome40.
1.3 Emboli detection techniques
Transcranial Doppler (TCD) is nowadays recognized as a valuable instru-ment in the detection of microemboli. The ability of Doppler ultrasound
4 CHAPTER 1. General Introduction
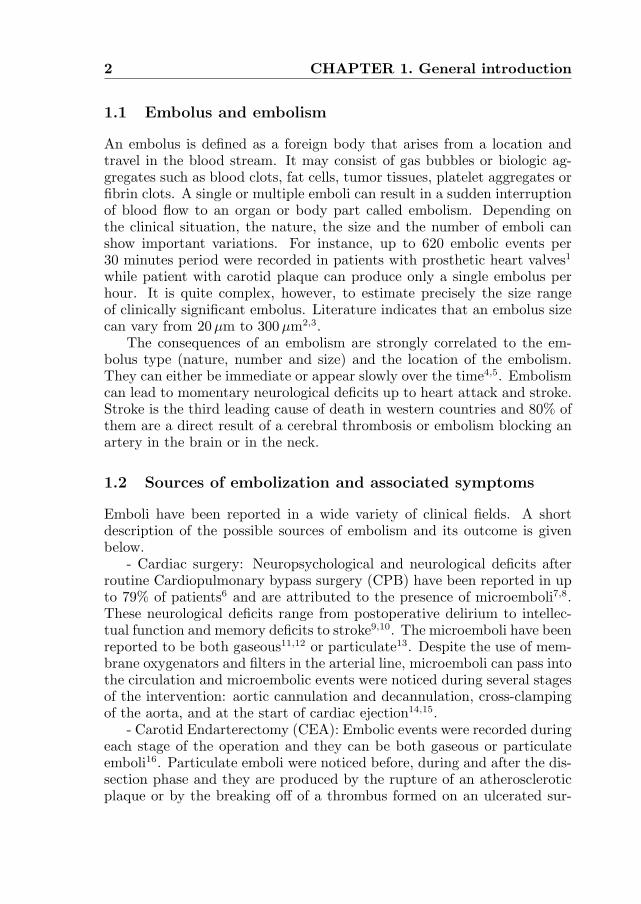
to detect emboli circulating in the blood stream was first described inthe sixties during cardiopulmonary bypass and experimental hyperbaricdecompression8,41. Conventionally, the middle cerebral artery is insonatedusing a TCD device transmitting a frequency between 2MHz and 2.5MHz.The Doppler probe is adequately fixed over the temporal bone and theDoppler sample volume depth is set between 50 mm and 55 mm. The prin-ciples underlying the Doppler technique are simple: when a moving particle(particulate or gaseous) is passing through the Doppler sample volume, theimpedance mismatch between the embolus and the surrounding mediumleads to an increase in the received Doppler signal which can be clearlydistinguished from the background flow signal (Figure 1.1).
Figure 1.1: Microembolic signal in the Doppler waveform.
Microembolic signals (MES) present specific features that were firstlycatalogued by Spencer42 and next by the Consensus Committee of theNinth International Cerebral Hemodynamics. They are summarized inTable 1.1. Transient signals may also be induced by patient or trans-ducer movements and by surgical manipulations and therefore be falselyclassified as MES signals. The distinction between both signals can beperformed by exploiting the specific characteristics of artifacts42 presentedin Table 1.2. The detection of MES using TCD monitoring, is based onthe previous features, and in particular on the measurement of the relativeintensity increase also called Embolus to Blood Ratio (EBR). This ratiois defined as the difference between the acoustic power from the embolussignal and that of the surrounding medium expressed in dB43. The EBRis strongly correlated to the nature and the size of the embolus (gaseousemboli produce stronger signals than solid particles), the Doppler sam-ple volume (smaller volume leads to a better detection) and the technicalsettings (gain, frequency)44. The discrimination between true MES andartefacts is a crucial point in TCD monitoring. It is not an easy task:there are many circumstances where a MES and an artefact present thesame signature. For instance, MES due gaseous emboli can conduct to an

Emboli detection techniques 5
Basic Criteria of Doppler Microembolic Signals1- Short duration signal (between 1 and 100ms)
2- Duration depends on the travel time through theDoppler sample volume
3- High intensity signal (increase of the amplitude between30 dB and 60 dB above the background Doppler level)
4- Unidirectional signal (as long as it remains in the dynamicrange of the Doppler system)
5- Appear randomly within the cardiac cycle6- Characterized by a particular auditory effect
(harmonic chirps or clicks depending on their velocity)
Table 1.1
Basic Criteria of Doppler Artefact Signals1-Bi-directional signals (they appears simultaneously
above and below the Doppler baseline)2-High power in the low frequency region
3-Sound like noisy impact
Table 1.2
electronic saturation of the TCD system. Indeed, the MES will appear bi-directionally on the TCD waveform. The gold standard remains the humanexperts who analyze the audio Doppler signals. Nevertheless, it is costly,requires man power and is time consuming and therefore it is restricted toresearch studies. To enter into a clinical routine, several approaches havebeen investigated to develop an automated detection system.
On-line detection systems using a neural network showed good per-formance but their sensitivity remained low45−47. Lately, the use of afrequency filtering approach was found to be valuable in improving thedetection of MES and their discrimination from artefacts. This techniqueis based on the principle that MES reach their maximum intensity over anarrow frequency band whereas the intensity of artefacts is concentratedat low frequencies. Using this technique, the EBR could be increased byup to 3 dB48,49 which is important to detect MES of low intensity fromDoppler speckle. The performance of an online system has been testedusing various embolic sources. This system led to similar sensitivity andspecificity to that of human experts for signals recorded after carotid en-

6 CHAPTER 1. General Introduction
darterectomy and in patients with symptomatic carotid stenosis while theresults are less good when emboli are due to asymptomatic carotid stenosisand atrial fibrillation50,51. Fan et al.52 have reported an automated methodusing a ‘rule based expert system’. It exploits the knowledge acquired overthe years concerning the characteristics of MES signals and artefacts. Itis based on the Fast Fourier Transform (FFT) approach that uses boththe time domain and the frequency domain features of the embolic sig-nals. The preliminary results look promising with a sensitivity of 94.7%and a specificity of 95.1% which is comparable to the results from humanexperts. The low sensitivity of the TCD methods to detect MES has beenattributed to use of the FFT that cannot provide a good temporal andspectral resolution simultaneously. Some alternatives have been proposedand the most effective method consists of studying the Doppler signal us-ing the wavelet analysis. The MES signal is decomposed into a set offunctions whose time and duration are jointly defined. The high frequencycomponents are filtered using narrow time windows while larger windowsare applied to low frequency components. The preliminary results empha-size the good performance of this signal analysis53,54. Various other signalanalysis approaches have been investigated in order to improve the embo-lus detection such as the pseudo-Wigner distribution function (WDF)55,56,the non-linear forecasting57, methods based on the postembolic spectralpatterns58 or on the narrow band hypothesis59 and parametric autoregres-sive modelling60, but they did not contribute to significant improvementin TCD performances.
The dual-gate or multigate approach could offer an appreciable progresstowards a better discrimination between embolic signals and artefacts. Theapproach is based on the assumption that an embolus will travel with theblood flow while artefact will not. Therefore, if the artery is insonifiedat two depths, an embolic signal will be characterized by a time delaybetween the two channels whereas an artefact will occur simultaneouslyin both channels. The discrimination between true MES and artefact isbased on the occurrence of this time delay between both Doppler signals.Preliminary reports showed promising results both in-vitro and in-vivo,with a sensitivity approaching 100% when the measurements of the timedelay are performed manually61−64. Nevertheless, when this technique isapplied to automatic detection, its sensitivity is not superior to those re-ported in previous methods. The main limitation of this approach resultsfrom a low signal to noise ratio which do not allow detection of embolus.A second limitation is coming from the artery anatomy. The insonificationof the vessel at two separate locations requires an adequate temporal win-dow that may be difficult to obtain. Furthermore, Smith et al.65 reportedthat emboli may slip from one artery to another, in which case the em-

Emboli detection techniques 7
bolic signal will appear only in one channel. Therefore, the performance ofthis method can be seriously reduced. Molloy and Markus66 have reporteda decay in sensitivity from 98.9% down to 75.2% in the case of a MESthat was detected only in a single channel. To overcome this limitation, avariant of the multigate approach was proposed by Russel67. The secondsample volume takes place outside the vessel, close to the temporal boneand it is called ‘reference gate’. Therefore, only artefacts will lead to an in-tensity increase in the second sample volume. This technique is also basedon multifrequency Doppler that insonates both sample volumes simulta-neously at frequencies of 2 and 2.5MHz. A new parameter derived fromthis multiple insonification is defined: the quarter Doppler shift, directlyderived from the Doppler shift formula. This approach leads to a sensitiv-ity of 98.6%, but the contribution of the quarter Doppler shift comparedto the reference gate is not clearly specified. Combining the multigate ap-proach with the characteristics of the backscattered signal could improvethe MES detection. Indeed, Devuyst et al.54,68 combined the dual-gateTCD with the wavelet representation to classify MES. Their off-line au-tomated system reached a sensitivity of 97% and a specificity of 98% forseparating artifacts from MES signals.
The second challenge in the microemboli research field is the discrim-ination between gaseous and solid emboli. Previous studies have demon-strated that the EBR is strongly dependent on the composition and thesize of an embolus69,70.The intensity of the Doppler signal is directly cor-related to the acoustic impedance mismatch between the embolus and thesurrounding blood where larger difference in impedance gives rise to highersignal intensity. The acoustic impedance of the whole blood, a gaseous em-bolus and a solid particle (fat cells) are respectively 1.47MRayls, 368Raylsand 1.68MRayls. Consequently, gaseous emboli produce stronger signalsthan particulate emboli. The EBR is also strongly dependant on the em-bolus size: a larger embolus produces a higher intensity. Indeed, the EBRcannot be used as a unique parameter to characterize an embolus sincea small air bubble can produce an intensity increase similar to the onegenerated by a large solid embolus.
Several attempts have been made to develop a method to classify theMES based on the determination of several parameters such as the MEP,the embolic duration, the embolic velocity and the effective sample vol-ume length (SVL) defined as the product of the embolic velocity andduration69−73. A more complex approach, based on a classification tree,was developed by Devuyst et al.68. MES are classified as solid or gaseousmatter, by extracting only four parameters from the TCD signals: thepeak frequency, the time delay, the relative power and the symmetry ofthe signal envelope. They achieved a specificity of 86% and a sensitivity

8 CHAPTER 1. General Introduction
of 89%. Recently, the technique using dual frequencies was also investi-gated by Russel67. The method is based on the theory that solid emboliscatter stronger signals at high frequency compared to a low frequencywhile gaseous emboli behave in the opposite manner. The study reportssurprisingly good results even though the approach suffers from several lim-itations. The acoustic pressures generated at the region of interest needto be equal for both frequencies which is difficult to achieve if we accountfor skull reflections, attenuation due to inhomogeneities, diffraction andpropagation effects. In addition, the selected frequencies (2 and 2.5MHz)are too close to each other to reach a significant difference between theresponses at the two frequencies and attain by that sufficient sensitivity.As an example and according to theory, for an air bubble, the difference inscattering cross section is less than 1 dB when the frequency increases from2 MHz to 2.5MHz. For a solid embolus of the same size and according tothe Rayleigh theory, this difference is only of 3.8 dB. This simple calcula-tion demonstrates that the sensitivity is a critical issue for this approachto discriminate between solid and gaseous emboli. All these studies havedemonstrated the difficulties to develop a robust method to classify andto a less extent size emboli. TCD represents a powerful instrument forthe detection of emboli but improvements concerning both an automateddetection and classification with a sufficient sensitivity and specificity needto be carried out.
1.4 Clinical applications
Large differences in the recorded rate of MES have been noticed amongthe results obtained in several studies dealing with the same clinical as-pect. This discordance can be imputed to different TCD monitoring timeperiod as well as to technical parameters that can strongly influence thecharacteristics of the recorded embolic signals44. Due to these differentinterpretations, the clinical significance of embolic signals could remainuncertain74. Nevertheless, several studies have pointed out the clinicalvalue of MES detection in various domains. For instance, MES monitoringduring coronary bypass were directly correlated to a decline of cognitivefunctions10 and the positive effect of carotid endarterectomy in preventingstroke was established for patients with high grade carotid stenosis76,77.TCD monitoring was also successfully used to demonstrate the effective-ness of antiplatelet and antithrombotic therapy78. The clinical significanceof each type of embolus (gaseous or solid) is relatively speculative becausethere is no reliable technique to distinguish between gaseous and partic-ulate matter. However, there is circumstantial evidence that particulate
Outline of the thesis 9
emboli are potentially far more damaging than gaseous emboli75. A reliabledetection and characterization technique may have a number of importantclinical implications: monitoring during surgery may help to prevent theformation of microemboli and therefore make the procedure safer, espe-cially during cardiac and carotid surgery. The determination of the natureof an embolus will make possible to specifically determine which lesion isimplicated when embolic signals are detected in patients with several pos-sible causes of embolism. It may also improve the identification of patientsat high or low risk of embolism and will help to evaluate drug treatmentefficiency.
1.5 Outline of the thesis
The aim of this thesis was to investigate a new method to detect, charac-terize and size microemboli. We know that gas microbubbles, under spe-cific US exposure conditions, can scatter energy at harmonic frequencies,subharmonic frequencies and ultraharmonic frequencies. These nonlinearscattering properties are specific to gaseous emboli and cannot be relatedto solid emboli. This difference between solid and gaseous microemboliin their nonlinear scattering properties is of significant relevance and thuscan be utilized as a parameter to characterize them. In order to validatethis approach in a controlled environment, a ’bubble maker’ was developedto generate a stream of uniform microbubbles and is described in detailsin Chapter 2. The generated microbubbles have a diameter ranging from10 µm to 200µm and their number and precise size can be controlled inde-pendently. A visual observation of the dynamics of gaseous microemboliunder ultrasonic insonification may help to validate the theory on whichthe classification method is based.
In Chapter 3, ultrafast optical recordings of the interaction between agas bubble and ultrasound are presented. These optical recordings demon-strate the dependency of the nonlinear behavior of the gaseous emboli onthe ultrasound exposure settings. They also appear as a valuable tool toestimate the performance of the theoretical model to predict the oscilla-tions of a gaseous emboli induced by an ultrasound pulse. To evaluatethe performances of the new emboli classification technique, acoustic scat-tering properties of gaseous emboli of various diameters and excited atdifferent ultrasound settings are measured in an in vitro setup. The re-sults are given in Chapters 4 and 5. In Chapter 4, we focused on higherharmonic components generation as a tool to detect and classify emboli.To enlarge the range of the detectable gaseous emboli, we investigated inChapter 5 the generation of subharmonic and ultraharmonics as a func-

10 CHAPTER 1. General Introduction
tion of gaseous emboli size. The currently available technology has limitedperformance in the low frequency range. Therefore, new transducers areneeded in order to apply our approach. Two transducer designs for emboliclassiflcation are proposed in Chapter 6. The design of these transduc-ers is based on separate transmitting and receiving technology. The flrsttransducer is capable to classify only a limited range of emboli sizes. Towiden the classiflable size range, the flrst design was improved using a mul-tifrequency transducer. Both transducers were evaluated in a controlled invitro environment.
In Chapter 7, the focus is directed towards elucidating the mechani-cal in°uence of the ultrasound beam on gas microemboli. Fast recordingswere carried out and demonstrated a strong radiation on microemboli de-pending on their initial radiation size and the ultrasonic parameters. Theexperimental data were compared to a theoretical model and conflrmedthat such strong radiation forces may lead to erroneous readings of theDoppler emboli signals.
References
1. D. Georgiadis, D. Grosset, A. Kelman, A. Faichney, and K.R. Lees, \Preva-lence and characteristics of intracranial microemboli signals in patients withdifierent types of prosthetic cardiac valves", Stroke vol. 25, no. 11: pp. 587-592, 1994.
2. B.A. Hills and B.D. Butler, \Size distribution of intravascular air emboliproduced by decompression", Undersea Biomed Res, vol. 8, no. 3: pp. 163-170, 1981.
3. I. Gersh, \Bubbles in bone and associated structures, lung and spleenof guinea pigs decompressed rapidly from high pressure atmospheres",J Cell Comp Physiol, vol. 26: pp. 101-117, 1945.
4. M.F. Newman, J.L. Kirchner, B. Phillips-Bute, V. Gaver, H. Grocott,R.H. Jones, D.B. Mark, J.G. Reves and J.A. Blumenthal, \Longitudinal as-sessment of neurocognitive function after coronary artery bypass surgery",New Engl J Med, vol. 344, no. 6: pp. 395-402, 2001.
5. J.M. Murkin, D.L. Baird, J.S. Martzke, S.J. Adams, and P. Lo, \Long-termneurological and neuropsychological outcome 3 years after coronary arterybypass surgery", Anesth Analg, vol. 82: pp. S328, 1996.
6. P.J. Shaw, D. Bates, N.E.F. Cartlidge, J.M. French, D. Heaviside, D.G. Ju-lian, and D.A. Shaw, \Neurologic and neuropsychological morbidity follow-ing major surgery: comparison of coronary artery bypass and peripheralvascular surgery", Stroke, vol. 18, no. 4: pp. 700-707, 1987.

References 11
7. W. Pugsley, L. Klinger, C. Paschalis, T. Treasure, M. Harrison, and S. New-man, “The impact of microemboli during cardiopulmonary bypass on neu-ropsychological functioning”, Stroke, vol. 25, no. 7: pp. 1393-1399, 1994.
8. W.G. Austen and D.H. Howry, “Ultrasound as a method to detect bubblesor particulate matter in the arterial line during cardiopulmonary bypass”,J Surg Res, vol. 5, no. 6: pp. 283-284, 1965.
9. G.W. Roach, M. Kanchuger, C.M. Mangano, M.F. Newman, N. Nussmeier,R. Wolman, A. Aggarwal, K. Marschall, S.H. Graham, C. Ley, G. Ozanne,and D.T. Mangano, “Adverse cerebral outcomes after coronary bypasssurgery”, New Engl J Med, vol. 335, no. 25: pp. 1857-1863, 1998.
10. O.A. Selnes, M.A. Goldsborough, L.M. Borowicz, and G.M. McKhann,“Neurobehavioural sequelae of cardiopulmonary bypass”, The Lancet,vol. 353, no. 9164: pp. 1601-1606, 1999.
11. N.L. Mills and J.L. Ochsner, “Massive air embolism during cardiopul-monary bypass. Causes, prevention and management”, J Thorac Car-diovasc Surg, vol. 80, no. 5: pp. 708-717, 1980.
12. E.G. Gallagher and D.T. Pearson, “Ultrasonic identification of sources ofgaseous microemboli during open heart surgery”, Thorax, vol. 28, no. 3:pp. 295-305, 1973.
13. A.K. Kaza, J.T. Cope, and S.M. Fiser, “Elimination of fat microemboliduring cardiopulmonary bypass”, Ann Thorax Surg, vol. 75, no. 2: pp. 555-559, 2003.
14. S.K. Braekken, D. Russell, R. Brucher, M. Abdelnoor, and J.L. Svennivig,“Cerebral microembolic signals during cardiopulmonary bypass surgery:Frequency, time of occurrence and association with patient and surgicalcharacteristics”, Stroke, vol. 28, no. 10: pp. 1988-1992, 1997.
15. J. Van der Linden and H. Casimir-Ahn, “When do cerebral emboli appearduring open heart operations?”, Ann Thorax Surg, vol. 51, no. 2: pp. 237-241, 1991.
16. R.G.A. Ackerstaff, C. Jansen, and F.L. Moll, “Carotid endarterectomy andintraoperative emboli detection”, Echocardiography, vol. 13, no. 5: pp. 543-550, 1996.
17. M.P. Spencer, “Transcranial Doppler monitoring and causes of stroke fromcarotid endarterectomy”, Stroke, vol. 28, no. 4: pp. 685-691, 1997.

12 CHAPTER 1. General Introduction
18. S.M. Siebler,G. Rose, D. Bendfeldt,H. Steinmetz, “Silent cerebral embolismcaused by neurological symptomatic high grade carotid stenosis. Eventrates before and after carotid endarterectomy”, Brain, vol. 116, no. 5:pp. 1005-1015, 1993.
19. V.L. Babikian, C. Hyde, V. Pochay, and M.R. Winter, “Clinical corre-lates of high intensity transient signals detected on Transcranial Dopplersonography in patients with cerebrovascular disease”, Stroke, vol. 25, no. 8:pp. 1570-1573, 1994.
20. A.M. Forteza, V.L. Babikian, C. Hyde, M.R. Winter, and V. Pochay, “Effectof time and cerebrovascular symptoms on the prevalence of microembolicsignals in patients with cervical carotid stenosis”, Stroke, vol. 27, no. 4:pp. 687-690, 1996.
21. S.K. Braekken, D. Russell, R. Brucher, and J.L. Svennivig, “Incidence andfrequency of cerebral embolic signals in patients with a similar bileafletmechanical heart valve”, Stroke, vol. 26, no. 7: pp. 1225-1230, 1995.
22. D. Grosset, P. Cowburn,D. Georgiadis, H.J. Dargie, A. Faichney, andK.R. Lees, “Ultrasound detection of cerebral emboli in patient with pros-thetic heart valves”, J Heart Valve Dis, vol. 3, no. 2: pp. 128-132, 1994.
23. D. Milano, A. D’Alfonso, R. Codecasa, M. De Carlo, C. Nardi, G. Orlandi,L. Landucci, and U. Bortolotti, “Prospective evaluation of frequency andnature of Transcranial high-intensity Doppler signals in prosthetic valverecipients”, J Heart Valve Dis, vol. 8, no.: pp. 488-494, 1999.
24. H.S. Markus, A. Loh, D.Israel, T. Buckenham, A. Clifton, and M.M. Brown,“Microscopic air embolism during cerebral angiography and strategies forits avoidance”, The Lancet, vol. 341, no. 8848: pp. 784-787, 1993.
25. A.Dagirnanjian, D.A. Davis, W.E. Rothfus, Z.L. Deeb, and A.L. Gold-berg, “Silent cerebral microemboli occurring during carotid angiography:Frequency as determined with doppler sonography”, Am J of Roentgenol,vol. 161, no. 5: pp. 1037-1040, 1993.
26. H.S. Markus, A. Clifton, T. Buckenham, and M.M. Brown, “Carotid angio-plasty: Detection of embolic signals during and after procedure”, Stroke,vol. 25, no. 12: pp. 2403-2406, 1994.
27. G. Orlandi, S. Fanucchi, C. Fioretti, G. Acerbi, M. Puglioli, R. Padolec-chia, F. Sartucci, and L. Murri, “Characteristics of cerebral microembolismduring carotid stenting and angioplasty alone”, Arch Neurol, vol. 58, no. 9:pp. 1410-1413, 2001.
References 13
28. F. Crawley, J. Stygall, S. Lunn, M. Harrison, M.M. Brown, and S. Newman,“Comparison of microembolism detected by Transcranial Doppler and neu-ropsychological sequelae of carotid surgery and percutaneous transluminalangioplasty”, Stroke, vol. 31, no. 6: pp. 1329-1334, 2000.
29. C.H. Tegeler, L.P. Hitchings, M. Eicke, J. Leighton, R.K. Fredericks,T.R. Downes, D.A. Stump, and G.L. Burke, “Microemboli detection instroke associated with atrial fibrillation”, J Cardiovascul Tech, vol. 9, no.:pp. 283-284, 1990.
30. M.P. Spencer, S.D. Campbell, J.L. Sealey, F.C. Henry, and J. Lindberg,“Experiments on decompression bubbles in the circulation using ultrasonicand electromagnetic flowmeter”, J Occup Med, vol. 11, no. 5: pp. 238-244,1969.
31. A.M. Forteza, S. Koch, J.G. Romano, G. Zych, I.C. Bustillo, R.C. Duncan,and B. V.L., “Transcranial Doppler detection of fat emboli”, Stroke, vol. 30,no. 3: pp. 2687-2691, 1999.
32. Z.G. Nadareishvili, Z. Choudary, C. Joyner, D. Brodie, and J.W. Norris,“Cerebral microembolism in acute myocardial infarction”, Stroke, vol. 30,no. 12: pp. 2679-2682, 1999.
33. D.W. Droste, K. Silling, J. Stypmann, M. Grude, V. Kemeny, T. Wichter,K. Khune, and E.B. Ringelstein, “Contrast Transcranial Doppler ultra-sound in the detection of right-to-left shunts: time window and thresholdin microbubbles number”, Stroke, vol. 31, no. 7: pp. 1640-1645, 2000.
34. J.G. Romano, A.M. Forteza, M. Concha, S. Koch, R.C. Heros, J.J. Morcos,and V.L. Babikian, “Detection of microemboli by Transcranial Dopplerultrasonography in aneurysmal subarachnoid hemorrhage”, Neurosurgery,vol. 50, no. 5: pp. 1026-1031, 2002.
35. D.W. Droste, M.A. Ritter, G. Monnig, V. Kemeny, G. Breithardt, andE.B. Ringelstein, “Abundance of microembolic signals detected by Tran-scranial Doppler ultrasound in a patient with Einsenmenger’s syndrome”,Cerebrovasc Dis, vol. 9, no. 6: pp. 334-336, 1999.
36. D.W. Droste, R. Schlossberg, R. Mitusch, and M. Kaps, “Low frequencyof clinically silent circulating emboli in patient with mitral valve prolapseor patent foreman ovale detected by bigated Transcranial Doppler ultra-sound”, Neurol Res, vol. 20, no. 6: pp. 499-503, 1998.
37. D. Georgiadis, A. Lindner, M. Manz, M. Sonntag, P. Zunker,H.R. Zerkowski, and M. Borggrefe, “Intracranial microembolic signals in500 patients with potential cardiac or carotid embolic source and in normalcontrols”, Stroke, vol. 28, no. 6: pp. 1203-1207, 1997.

14 CHAPTER 1. General Introduction
38. D.G. Nabavi, D. Georgiadis, C. Schmid, T.G. Mackay, H.H. Scheld, andE.B. Ringelstein, “Clinical relevance of intracranial microembolic signals inpatients with left ventricular assist devices. a prospective study”, Stroke,vol. 27, no. 5: pp. 891-896, 1996.
39. M. Eicke, J. Klein, G.S. Werner, and W. Paulus, “Ongoing cerebral mi-croembolism in patients with bacterial endocarditis”, J Neuroimaging,vol. 7: pp. 232, 1997.
40. M. Sitzer, D. Sohngen, and M. Siebler, “Cerebral microembolism in patientwith Sneddon’s syndrome”, Arch Neurol, vol. 52, no. 3: pp. 271-275, 1995.
41. M. Spencer, S. Campbell, J. Sealey, F. Henry, and J. Lindenbergh, “Ex-periments on decompression bubbles in the circulation using ultrasonic andelectromagnetic flowmeters”, J Occup Med, vol. 11, no. 5: pp. 238-244,1969.
42. M.P. Spencer, “Detection of cerebral arterial emboli”, TranscranialDoppler, edited by D.W. Newell and R. Aaslid: pp. 215-230, 1992.
43. M.A. Moehring and J.R. Klepper, “Pulse Doppler ultrasound detec-tion, characterization and size estimation of emboli in flowing blood”,IEEE Trans Biomed Eng, vol. 41, no. 1: pp. 35-44, 1994.
44. D.W. Droste, H.S. Markus, and M.M. Brown, “The effect of different set-tings of ultrasound pulse amplitude, gain and sample volume on the appear-ance of emboli studied in a Transcranial Doppler mode”, Cerebrovasc Dis,vol. 4 (Suppl 3): pp. 152-156, 1994.
45. V. Kemeny, D. Droste, S. Hermes, D. Nabavi, Schulte-Altedorneburg,M. Siebler, and B. Ringelstein, “Automatic embolus detection by a neu-ral network”, Stroke, vol. 30, no. 4: pp. 807-810, 1999.
46. M. Siebler, G. Rose, M. Sitzer, A. Bender, and H. Steinmetz, “Real-timeidentification of cerebral microemboli with US feature detection by a neuralnetwork”, Radiology, vol. 192, no. 3: pp. 739-742, 1994.
47. E.V. van Zuilen, W.H. Mess, C. Jansen, I. van der Twell, J. van Gijn, andR.G.A. Ackerstaff, “Automatic embolus detection compared with humanexperts”, Stroke, vol. 27, no. 10: pp. 1840-1843, 1996.
48. H.S. Markus, M. Cullinane, and G. Reid, “Improved automated detection ofembolic signals using a novel frequency filtering approach”, Stroke, vol. 30,no. 8: pp. 1610-1615, 1999.
49. H. Markus and G. Reid, “Frequency filtering improves ultrasonic embolicsignal detection”, Ultrasound Med Biol, vol. 25, no. 5: pp. 857-860, 1999.
References 15
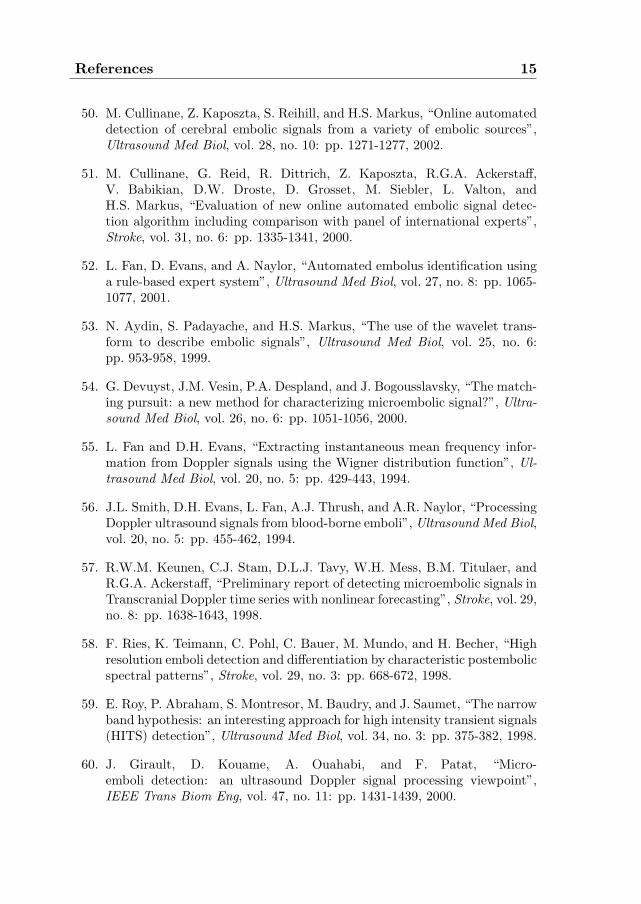
50. M. Cullinane, Z. Kaposzta, S. Reihill, and H.S. Markus, “Online automateddetection of cerebral embolic signals from a variety of embolic sources”,Ultrasound Med Biol, vol. 28, no. 10: pp. 1271-1277, 2002.
51. M. Cullinane, G. Reid, R. Dittrich, Z. Kaposzta, R.G.A. Ackerstaff,V. Babikian, D.W. Droste, D. Grosset, M. Siebler, L. Valton, andH.S. Markus, “Evaluation of new online automated embolic signal detec-tion algorithm including comparison with panel of international experts”,Stroke, vol. 31, no. 6: pp. 1335-1341, 2000.
52. L. Fan, D. Evans, and A. Naylor, “Automated embolus identification usinga rule-based expert system”, Ultrasound Med Biol, vol. 27, no. 8: pp. 1065-1077, 2001.
53. N. Aydin, S. Padayache, and H.S. Markus, “The use of the wavelet trans-form to describe embolic signals”, Ultrasound Med Biol, vol. 25, no. 6:pp. 953-958, 1999.
54. G. Devuyst, J.M. Vesin, P.A. Despland, and J. Bogousslavsky, “The match-ing pursuit: a new method for characterizing microembolic signal?”, Ultra-sound Med Biol, vol. 26, no. 6: pp. 1051-1056, 2000.
55. L. Fan and D.H. Evans, “Extracting instantaneous mean frequency infor-mation from Doppler signals using the Wigner distribution function”, Ul-trasound Med Biol, vol. 20, no. 5: pp. 429-443, 1994.
56. J.L. Smith, D.H. Evans, L. Fan, A.J. Thrush, and A.R. Naylor, “ProcessingDoppler ultrasound signals from blood-borne emboli”, Ultrasound Med Biol,vol. 20, no. 5: pp. 455-462, 1994.
57. R.W.M. Keunen, C.J. Stam, D.L.J. Tavy, W.H. Mess, B.M. Titulaer, andR.G.A. Ackerstaff, “Preliminary report of detecting microembolic signals inTranscranial Doppler time series with nonlinear forecasting”, Stroke, vol. 29,no. 8: pp. 1638-1643, 1998.
58. F. Ries, K. Teimann, C. Pohl, C. Bauer, M. Mundo, and H. Becher, “Highresolution emboli detection and differentiation by characteristic postembolicspectral patterns”, Stroke, vol. 29, no. 3: pp. 668-672, 1998.
59. E. Roy, P. Abraham, S. Montresor, M. Baudry, and J. Saumet, “The narrowband hypothesis: an interesting approach for high intensity transient signals(HITS) detection”, Ultrasound Med Biol, vol. 34, no. 3: pp. 375-382, 1998.
60. J. Girault, D. Kouame, A. Ouahabi, and F. Patat, “Micro-emboli detection: an ultrasound Doppler signal processing viewpoint”,IEEE Trans Biom Eng, vol. 47, no. 11: pp. 1431-1439, 2000.
16 CHAPTER 1. General Introduction
61. J.L. Smith, D.H. Evans, L. Fan, P.R.F. Bell, and A.R. Naylor, “Differenti-ation between emboli and artefacts using dual-gated Transcranial Dopplerultrasound”, Ultrasound Med Biol, vol. 22, no. 8: pp. 1031-1036, 1996.
62. D. Georgiadis, J. Goeke, M. Hill, D. Nabavi, F. Stogbauer, P. Zunker,and E. Ringelstein, “A novel technique for identification of Doppler micro-embolic signals based on the coincidence method”, Stroke, vol. 27, no. 4:pp. 683-686, 1996.
63. D. Georgiadis, A. Wenzel, H. Zerkowski, S. Zierz, and A. Lindner, “Au-tomated intraoperative detection of Doppler microemboli signals using thebigate approach”, Stroke, vol. 29, no. 1: pp. 137-139, 1998.
64. W.H. Mess, M. Titulaer, and G.A. Ackerstaff, “A new algorithm for off-lineautomated emboli detection based on the pseudo-wigner power distributionand the dual gate TCD technique”, Ultrasound Med Biol, vol. 26, no. 3:pp. 413-418, 2000.
65. J.L. Smith, D.H. Evans, and A.R. Naylor, “Signals from dual gatedTCD systems: curious observations and possible explanations”, Ultra-sound Med Biol, vol. 23, no. 1: pp. 15-24, 1997.
66. J. Molloy and H.S. Markus, “Multigated Doppler ultrasound in the de-tection of emboli in a flow model and emboli signals in patients”, Stroke,vol. 27, no. 9: pp. 1548-1552, 1996.
67. D. Russell and R. Brucher, “Online automatic discrimination between solidand gaseous cerebral microemboli with the first multifrequency TranscranialDoppler”, Stroke, vol. 33, no. 8: pp. 1975-1980, 2002.
68. G. Devuyst, G.A. Darbellay, J.M. Vesin, V. Kemeny, M. Ritter,D.W. Droste, C. Moline, J. Serena, R. Sztajzel, P. Ruchat, C. Lucchesi,G. Dietler, E.B. Ringelstein, P.A. Despland, and J. Bogousslavsky, “Au-tomatic classification of HITS into artifacts or solid or gaseous emboli bya wavelet representation combined with dual gated TCD”, Stroke, vol. 32,no. 12: pp. 2803-2809, 2001.
69. H.S. Markus and M.M. Brown, “Differentiation between different patho-logical cerebral embolic materials using Transcranial Doppler in an in vitromodel”, Stroke, vol. 24, no. 1: pp. 1-5, 1993.
70. D. Russell, R. Brucher, K.P. Madden, W.M. Clark, P.M. Sandset, andJ.A. Zivin, “The intensity of the Doppler signal caused by arterial embolidepends on embolus type and size”, Stroke, vol. 23, no. 1: pp. 158, 1992.

References 17
71. J.L. Smith, D.H. Evans, P.R.F. Bell, and A.R. Naylor, “A comparison offour methods for distinguishing Doppler signals from gaseous and particu-late emboli”, Stroke, vol. 29, no. 7: pp. 1133-1138, 1998.
72. D. Georgiadis, T.G. Mackay, A.W. Kelman, D.G. Grosset, D.J. Wheastley,and L. K.R., “Differentiation between gaseous and formed embolic materialsIn-Vivo: application in prosthetic heart valve patients”, Stroke, vol. 25,no. 8: pp. 1559-1563, 1994.
73. D.W. Droste, H.S. Markus, D. Nassiri, and M.M. Brown, “The effect of ve-locity on the appearance of embolic signals studied in Transcranial Dopplermodels”, Stroke, vol. 25, no. 5: pp. 986-991, 1994.
74. J.D. Easton, “Cerebral embolism and Doppler ultra-sound”,Cerebrovasc Dis, vol. 9, no. 3: pp. 188-192, 1999.
75. M.E. Gaunt, P.J. Martin, S. J.L., T. Rimmer, G. Cherryman, D.A. Ratliff,P.R.F. Bell, and A.R. Naylor, “Clinical relevance of intraoperative em-bolization detected by Transcranial Doppler ultrasonography during carotidendarterectomy: a prospective study of 100 patients”, Br J Surg., vol. 81,no. 10: pp. 1435-1439, 1994.
76. M. Siebler, M. Sitzer, G. Rose, D. Bendfeldt, and H. Steinmetz, “Silentcerebral embolism caused by neurological symptomatic high grade carotidstenosis. Event rates before and after carotid endarterectomy”, Brain,vol. 116, no. 5: pp. 1005-1015, 1993.
77. E.V. van Zuilen, F.L. Moll, F.E.E. Vermeulen, H.W. Mauser, J. van Gijn,and R.G.A. Ackerstaff, “Detection of cerebral microemboli by means ofTranscranial Doppler monitoring before and after carotid endarterectomy”,Stroke, vol. 26, no. 2: pp. 210-213, 1995.
78. M. Goertler, M. Baeumer, R. Kross, T. Blaser, G. Lutze, S. Jost, andC.W. Wallesch, “Rapid decline of cerebral microemboli of arterial originafter intravenous acetylsalicylic acid”, Stroke, vol. 30, no. 1: pp. 66-69,1999.


Chapter 2Production of calibrated gaseous
emboli
Abstract
For a better understanding of the immediate and long-term consequences ofembolism, clinical investigations following the insertion of gaseous bubblesinto the body as well as new detection methods need to be carried on. Forthat purpose, a device has been developed to generate a uniform stream ofmicrobubbles with a diameter ranging between 20µm and 300µm. Thisdevice comprises a glass micropipette connected to an air pressure source.The micropipette tip crosses a variable liquid flow and the produced bubblesare carried away by the flow. These created bubbles have a very narrow sizeand density distribution: 90% of the bubbles lie within ±6% of the meanradius and the number of bubbles does not exceed a variation of 10% .The size and density of the produced bubbles can be controlled by adjustingthree independent parameters: the liquid flow, the gas pressure level andthe micropipette shape. For a given micropipette, increasing the liquid flowor decreasing the gas pressure level leads to a reduction of the bubbles sizewhile the number of produced bubbles increases. As an example, a doublingof the liquid flow results in a variation of the bubble size up to 40%. Thistechnique offers the advantage of generating uniform bubbles of known sizeand number depending on the settings selected and appears as a valuabletool for embolism studies.
Based on the publication: “Production of standardized air bubbles: application toembolism studies” by P. Palanchon, J. Klein and N. de Jong, Review of Scientific In-struments, vol. 74, no. 4: 2558-2564, 2003.
19

20 CHAPTER 2. Production of calibrated gaseous emboli
2.1 Introduction
The occurrence of gas bubbles into the intravascular and intracerebral cir-culation and its neurological or arterial repercussion is of great concern inseveral clinical procedures. Depending on the clinical situation, the natureof the emboli (gaseous or solid) and the number of embolic events can varygreatly. Hills and Butler1 measured intravascular gaseous emboli rangingfrom 19µm up to 700µm following decompression in living dogs. Gersh2
detected bubble sizes between 60µm and 300µm in both intravascular andextravascular sites. The number of embolic signals can also show wide vari-ations. Georgiadis et al.3 recorded between 0-620 embolic events per 30minutes period for patients with prosthetic heart valves. Mullges et al.4have observed between 0.53 and 59.05 embolic signals per minute duringextracorporeal circulation in patient undergoing cardiac surgery. Accord-ing to these results, the development of a device allowing the productionof air bubbles of controllable size and density would be a valuable tool forembolism studies, either for clinical (consequences following the insertionof gas bubbles into the circulation) or technical (new ways for detectionand characterization of microemboli) investigations.
Various methods have been proposed to generate gas bubbles. Oneapproach is based on electrolysis. Although this technique allows the pro-duction of very small bubbles (Miller5 was able to generate bubbles be-tween 2 µm and 15µm), the wide size distribution and the high numberof bubbles limit significantly this method of production. Furthermore, theproduction of the bubbles is not easy to reproduce. A second approach isbased on the gas injection principle and has been extensively studied the-oretically and experimentally through different apparatus6−13. Hills andButler14, have developed a method to produce a stream of microbubbleswith a narrow size distribution. Nitrogen was forced to pass through hypo-dermic needles to form bubbles. The bubbles produced ranged from 20µmto 250 µm. More recently, following a similar principle, Ganan-Calvo andGordillo15 have described a nonlinear phenomenon based on microfluidicphysics that allowed the production of air bubbles. Bubbles as small as5 µm were created by using different physical parameters such as the orificediameter, the liquid viscosity and the surface tension. These methods offerto the operator the possibility of producing a wide range of controllablebubble sizes but the number of bubbles produced remains quite high andcannot be adjusted by the operator.
This chapter presents a method to generate a stream of bubbles ofknown size and number. A homemade micropipette is submerged into aflowing liquid in a vertical tube. Gas is injected through the micropipette,allowing bubbles to escape from the micropipette tip and to be transported

Description of the device 21
by the liquid flow. The gas pressure, micropipette shape and liquid flowcan be adjusted to selectively produce bubble sizes ranging from 20µm upto 300µm.
2.2 Description of the device
The micropipettes were made of glass capillaries (Model GD 1, Narishige,Japan) with an outer diameter of 1 mm and an inner diameter of 0.6mm.These tubes were placed in a pipette puller (Narishige, Japan). This in-strument is designed to manufacture a variety of micropipettes throughmanual adjustments: the heating range and the weight, which is placed atthe tip the tube. The variation of one of these parameters influences theshape and the diameter of the micropipette. Three parameters were mea-sured: the inner diameter, the length and the contraction length in orderto specify the micropipettes. Their definitions are given in Figure 2.1a.
Length
Contraction length
1 mm
0.5 mm
Diameter
a b c d
Figure 2.1: a) Definitions of the micropipette dimensions, b),c) and d)micropipette shape of type I, type II and type III.
Several trials have been performed to demonstrate the effect of thepuller settings on the produced micropipette: an increase of the heaterlevel resulted in an increase of the micropipette length while its diameterand its contraction length decreased. When the weight attached at theend of the micropipette increased, the length and the contraction lengthincreased while the diameter decreased. Examples of the micropipetteare displayed in Figures 2.1b, c and d for three different puller settings:heater 65/weight 30g (type I), heater 70/weigth 120g (type II) and heater80/weigth 30g(type III). For each case, three micropipettes were madeand their dimensions measured. The dimension variations are not greater
22 CHAPTER 2. Production of calibrated gaseous emboli
than 3% for the micropipette length and 2% for the diameter while thecontraction length remains identical. Indeed, the pipette puller assures areproducible way to generate micropipettes of known dimensions.
Liquid flow
Micropipette
Gas Flow
Water Tank
Figure 2.2: Bubble maker drawing.
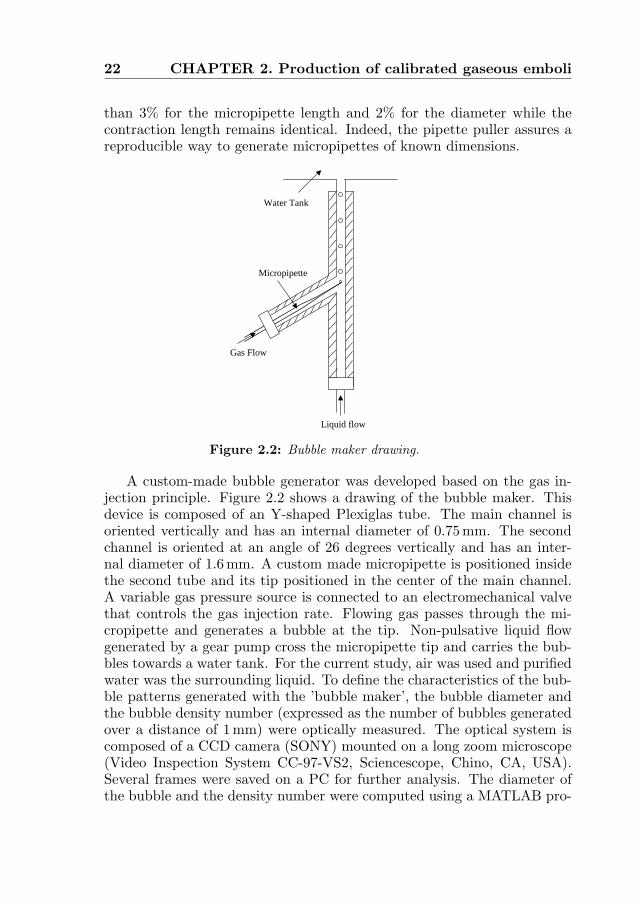
A custom-made bubble generator was developed based on the gas in-jection principle. Figure 2.2 shows a drawing of the bubble maker. Thisdevice is composed of an Y-shaped Plexiglas tube. The main channel isoriented vertically and has an internal diameter of 0.75mm. The secondchannel is oriented at an angle of 26 degrees vertically and has an inter-nal diameter of 1.6mm. A custom made micropipette is positioned insidethe second tube and its tip positioned in the center of the main channel.A variable gas pressure source is connected to an electromechanical valvethat controls the gas injection rate. Flowing gas passes through the mi-cropipette and generates a bubble at the tip. Non-pulsative liquid flowgenerated by a gear pump cross the micropipette tip and carries the bub-bles towards a water tank. For the current study, air was used and purifiedwater was the surrounding liquid. To define the characteristics of the bub-ble patterns generated with the ’bubble maker’, the bubble diameter andthe bubble density number (expressed as the number of bubbles generatedover a distance of 1mm) were optically measured. The optical system iscomposed of a CCD camera (SONY) mounted on a long zoom microscope(Video Inspection System CC-97-VS2, Sciencescope, Chino, CA, USA).Several frames were saved on a PC for further analysis. The diameter ofthe bubble and the density number were computed using a MATLAB pro-
Bubble pattern characteristics 23
gram (Matlab, Mathworks). The diameters of 30 bubbles were measuredas well as the distance separating two successive bubbles. The opticalsystem was positioned 7 cm above the micropipette tip. Since the mainapplication of interest is to direct the bubbles towards an ultrasound de-vice, we do not measure the bubble diameters when they are released fromthe tip of the micropipette. The size measurements was made so as to no-tice any possible difference in the bubble diameter at different locations inthe water tank. However, no significant change was observed which can beexplained by the fact that the time delay between the moment where thebubbles are created at the micropipette tip and the location where the bub-bles are observed is short enough to keep the bubble diameter the same(dissolution effects are negligible). Measurement of the bubbles numberdensity was carried out instead of the frequency production of the bubblescommonly used. This choice was motivated by the ultrasonic application.Here, studies dealing with the interaction between bubbles and an ultra-sound field require a prior knowledge of the number of bubbles present inthe ultrasound beam.
2.3 Bubble pattern characteristics
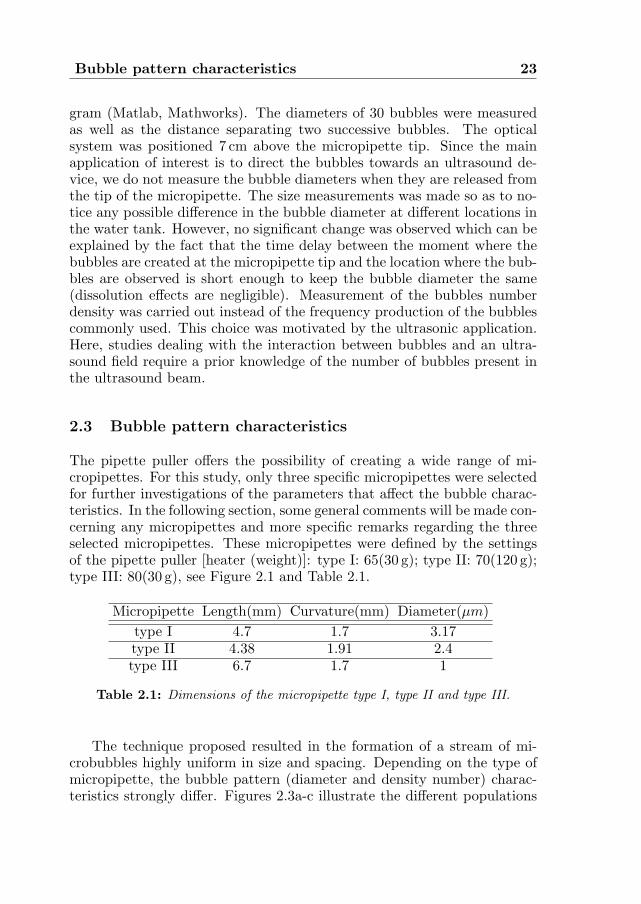
The pipette puller offers the possibility of creating a wide range of mi-cropipettes. For this study, only three specific micropipettes were selectedfor further investigations of the parameters that affect the bubble charac-teristics. In the following section, some general comments will be made con-cerning any micropipettes and more specific remarks regarding the threeselected micropipettes. These micropipettes were defined by the settingsof the pipette puller [heater (weight)]: type I: 65(30 g); type II: 70(120 g);type III: 80(30 g), see Figure 2.1 and Table 2.1.
Micropipette Length(mm) Curvature(mm) Diameter(µm)type I 4.7 1.7 3.17type II 4.38 1.91 2.4type III 6.7 1.7 1
Table 2.1: Dimensions of the micropipette type I, type II and type III.
The technique proposed resulted in the formation of a stream of mi-crobubbles highly uniform in size and spacing. Depending on the type ofmicropipette, the bubble pattern (diameter and density number) charac-teristics strongly differ. Figures 2.3a-c illustrate the different populations

24 CHAPTER 2. Production of calibrated gaseous emboli
of bubbles that could be generated using micropipettes types I, II and III,using a liquid flow of 400ml/h.
a b c
Figure 2.3: Examples of the bubbles produced by the three selected mi-cropipettes.
The size distributions are displayed in Figure 2.4 for the three types ofmicropipettes at a selected liquid flow of 400 ml/h. The uniformity of thebubble diameter can be appreciated in Figures 2.4a-c and it appears to bedependent on the size of the produced bubbles: generation of the smallestbubbles (Figure 2.4a results in a very narrow size distribution: 100% of thebubbles lie within ±4µm and 86% within ±2µm. The bubbles producedby micropipette type I are much larger and their size distribution is some-what wider: only 78% of the bubbles are less than ±4µm and 70% less±2µm. The bubble’s density number also exhibits a narrow distribution.Micropipettes types I, II and III produce, respectively, maximal densitynumber variations of 8.2%, 6.7% and 12.3%. Overall, at any given flowand for any kind of micropipette, 90% of the bubbles have a diameter lessthan ±6% of their mean diameter while their density number does not ex-ceed 10%. To test the reproducibility of the bubble generation process, weperformed three different sets of experiments: (a) the bubble maker wasrun for 30 min and the size of the bubbles was checked every 5 min; (b) thesystem was stopped and run again every hour for a period of 4 hours. Themeasurements showed that the size and density distributions remain iden-tical for these two sets of measurements. The last experiment (c) consistedof comparing the bubbles obtained from different micropipettes producedwith the same pipette puller settings. As demonstrated in the previoussection, the variation in the micropipette dimension was small when thesame settings of the pipette puller was used. The bubble patterns for this

Bubble pattern characteristics 25
35 43 51 59 67 750
4
8
12
16
20
Diameter [µm]
Num
ber
of B
ubbl
es
Mean=70 µm
35 43 51 59 67 750
4
8
12
16
20
Diameter [µm]
Num
ber
of B
ubbl
es
Mean=46 µm
35 43 51 59 67 750
4
8
12
16
20
Diameter [µm]
Num
ber
of B
ubbl
es
Mean=52 µm
a b c
Figure 2.4: Bubble size distributions for the three types of micropipettes:a) type I, b) type II, c) type III.
configuration remained very similar. The mean diameter of the bubblesvaries by ±2µm. The bubbles density number could reach a difference of1.3 bubbles/mm.
Parameters affecting the bubble patterns
The incidence of different parameters on the bubble size and number wasinvestigated experimentally. The physics behind the bubble formation pro-cess have not been studied since the main objective of this work was togenerate bubbles and explore the capabilities of the bubble maker for animmediate application.
Gas pressure:
The release of microbubbles at the micropipette tip requires the use ofa minimal gas pressure level. This threshold depends on the dimensionsof the micropipette employed. For micropipettes type I, II and III, theminimal gas pressure required is 2.3 bars, 4 bars and 5 bars, respectively.Others examples of pressure threshold are displayed in Table 2.2. The gassource could deliver pressures between 1 bar and 7 bars. In some cases,higher pressures were required. Such micropipettes were discarded fromthis study.
The effects of the gas pressure on the bubble diameter were carried outby progressively increasing the gas pressure applied to the micropipettefrom 2.3 bars up to 6 bars. Micropipette type I was chosen since it has thelowest pressure threshold for bubble generation. Figure 2.5a presents thevariation of the bubble size as a function of the gas pressure for a liquidflow of 400 ml/h. For a pressure between 2.3 bars and 5 bars, the bubblediameter increases linearly with the gas pressure. Typically, an increase

26 CHAPTER 2. Production of calibrated gaseous emboli
of 20 µm is observed for a variation of (1 bar). At 6 bars, the relationshipbetween the bubble size and the gas pressure is no longer linear. For pres-sures above 5 bars, the bubble size only increases very slightly. For higherpressures, the generated bubbles are nonuniform in size. The gas pressureis then too high for a stable rate of production. The influence of gas pres-sure on the variation of the density number is displayed in Figure 2.5b.The density number decreases linearly with the gas pressure up to 5 bars.A decrease of around 0.6 bubbles/mm was measured for variation of 1 barin the gas pressure. For pressures higher than 5 bars, the density of thebubbles remains almost identical. A high level on non-uniformity in thedensity of the bubbles was also noticed for higher pressures.
Pressure [bar]
Dia
met
er [
µm]
2 3 4 5 650
70
90
110
130
150
2 3 4 5 62
3
4
Pressure [bar]
Den
sity
Num
ber
(bub
bles
/mm
)
a b
Figure 2.5: a) Bubble size variations as a function of the air pressure;b) bubble density number variation as a function of the air pressure.
In order to quantify the change in bubble pattern with the gas pres-sure, micropipette type II and III have also been studied. For both mi-cropipettes and at a given liquid flow of 400ml/h, the gas pressure wasraised by 1.5 bars from the threshold of each micropipette. The varia-tions in diameter and density number were measured following an increasein gas pressure. From these measurements it appears that the variationof either the bubble diameter or the density number is strongly depen-dent on the type of micropipette and cannot be theoretically predicted.Micropipette type II did yield to an increase of 9µm in diameter while mi-cropipette types I and III, respectively, showed an increase of 28µm and12 µm. The variations in bubble density number also depend on the typeof micropipette. When the pressure is increased by 1.5 bars, the densitynumber is reduced, respectively, by 0.9, 0.3 and 1.07 bubbles/mm for mi-cropipettes types I, II and III. The changes in the bubble pattern (size anddensity) relative to the gas pressure cannot be predicted independently of
Bubble pattern characteristics 27
the type of micropipette used.In the current experimental set-up, if the operator wants to select the
pressure as the main parameter by which to control the bubble diame-ter, the effects will be dominant for micropipettes that requires a low gaspressure threshold to generate bubbles. Thus, the gas pressure could beprogressively increased up to a level at which disturbances start appearing.
Liquid flow:
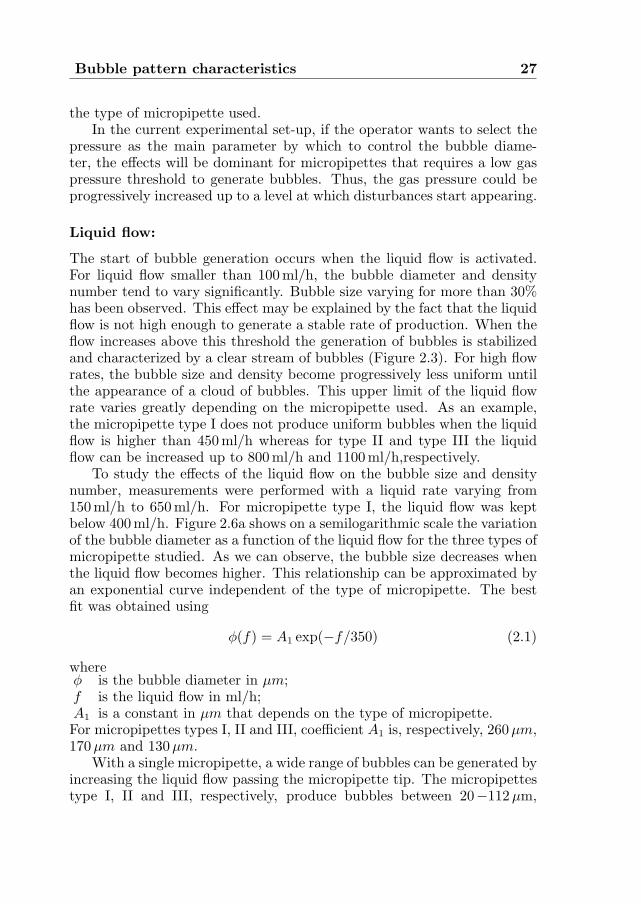
The start of bubble generation occurs when the liquid flow is activated.For liquid flow smaller than 100 ml/h, the bubble diameter and densitynumber tend to vary significantly. Bubble size varying for more than 30%has been observed. This effect may be explained by the fact that the liquidflow is not high enough to generate a stable rate of production. When theflow increases above this threshold the generation of bubbles is stabilizedand characterized by a clear stream of bubbles (Figure 2.3). For high flowrates, the bubble size and density become progressively less uniform untilthe appearance of a cloud of bubbles. This upper limit of the liquid flowrate varies greatly depending on the micropipette used. As an example,the micropipette type I does not produce uniform bubbles when the liquidflow is higher than 450 ml/h whereas for type II and type III the liquidflow can be increased up to 800ml/h and 1100ml/h,respectively.
To study the effects of the liquid flow on the bubble size and densitynumber, measurements were performed with a liquid rate varying from150ml/h to 650 ml/h. For micropipette type I, the liquid flow was keptbelow 400ml/h. Figure 2.6a shows on a semilogarithmic scale the variationof the bubble diameter as a function of the liquid flow for the three types ofmicropipette studied. As we can observe, the bubble size decreases whenthe liquid flow becomes higher. This relationship can be approximated byan exponential curve independent of the type of micropipette. The bestfit was obtained using
φ(f) = A1 exp(−f/350) (2.1)
whereφ is the bubble diameter in µm;f is the liquid flow in ml/h;A1 is a constant in µm that depends on the type of micropipette.For micropipettes types I, II and III, coefficient A1 is, respectively, 260µm,170µm and 130µm.
With a single micropipette, a wide range of bubbles can be generated byincreasing the liquid flow passing the micropipette tip. The micropipettestype I, II and III, respectively, produce bubbles between 20−112µm,
28 CHAPTER 2. Production of calibrated gaseous emboli
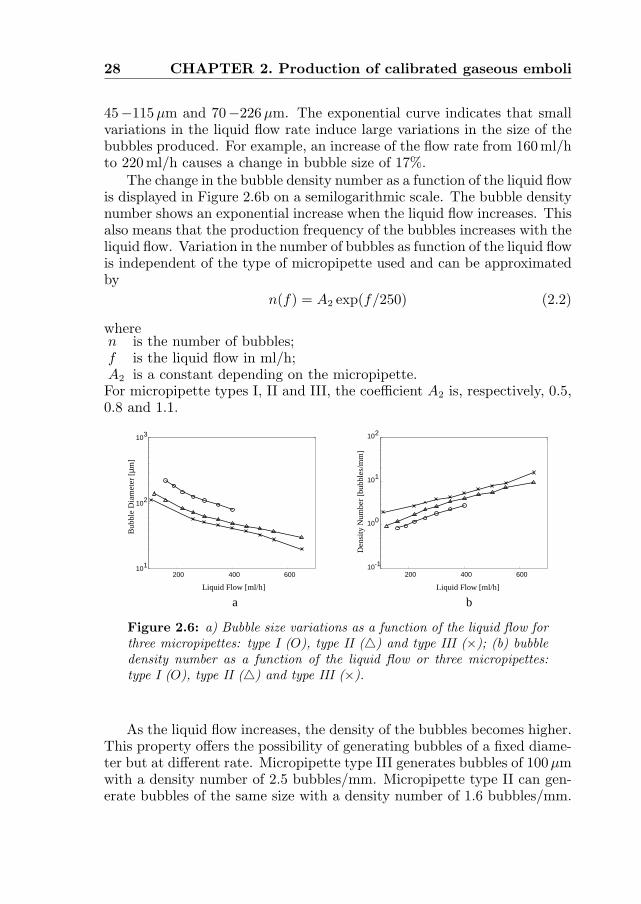
45−115µm and 70−226µm. The exponential curve indicates that smallvariations in the liquid flow rate induce large variations in the size of thebubbles produced. For example, an increase of the flow rate from 160 ml/hto 220 ml/h causes a change in bubble size of 17%.
The change in the bubble density number as a function of the liquid flowis displayed in Figure 2.6b on a semilogarithmic scale. The bubble densitynumber shows an exponential increase when the liquid flow increases. Thisalso means that the production frequency of the bubbles increases with theliquid flow. Variation in the number of bubbles as function of the liquid flowis independent of the type of micropipette used and can be approximatedby
n(f) = A2 exp(f/250) (2.2)
wheren is the number of bubbles;f is the liquid flow in ml/h;A2 is a constant depending on the micropipette.For micropipette types I, II and III, the coefficient A2 is, respectively, 0.5,0.8 and 1.1.
Liquid Flow [ml/h]
Den
sity
Num
ber
[bub
bles
/mm
]
200 400 60010-1
100
101
102
Liquid Flow [ml/h]
Bub
ble
Dia
met
er[µ
m]
200 400 600101
102
103
a b
Figure 2.6: a) Bubble size variations as a function of the liquid flow forthree micropipettes: type I (O), type II (4) and type III (×); (b) bubbledensity number as a function of the liquid flow or three micropipettes:type I (O), type II (4) and type III (×).
As the liquid flow increases, the density of the bubbles becomes higher.This property offers the possibility of generating bubbles of a fixed diame-ter but at different rate. Micropipette type III generates bubbles of 100µmwith a density number of 2.5 bubbles/mm. Micropipette type II can gen-erate bubbles of the same size with a density number of 1.6 bubbles/mm.
Bubble pattern characteristics 29
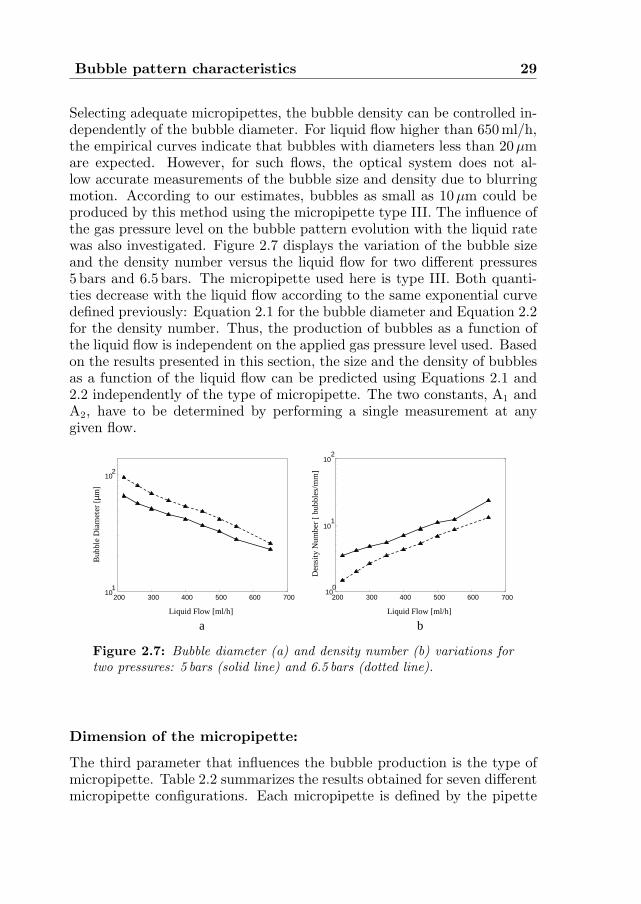
Selecting adequate micropipettes, the bubble density can be controlled in-dependently of the bubble diameter. For liquid flow higher than 650 ml/h,the empirical curves indicate that bubbles with diameters less than 20µmare expected. However, for such flows, the optical system does not al-low accurate measurements of the bubble size and density due to blurringmotion. According to our estimates, bubbles as small as 10µm could beproduced by this method using the micropipette type III. The influence ofthe gas pressure level on the bubble pattern evolution with the liquid ratewas also investigated. Figure 2.7 displays the variation of the bubble sizeand the density number versus the liquid flow for two different pressures5 bars and 6.5 bars. The micropipette used here is type III. Both quanti-ties decrease with the liquid flow according to the same exponential curvedefined previously: Equation 2.1 for the bubble diameter and Equation 2.2for the density number. Thus, the production of bubbles as a function ofthe liquid flow is independent on the applied gas pressure level used. Basedon the results presented in this section, the size and the density of bubblesas a function of the liquid flow can be predicted using Equations 2.1 and2.2 independently of the type of micropipette. The two constants, A1 andA2, have to be determined by performing a single measurement at anygiven flow.
200 300 400 500 600 70010
1
102
Liquid Flow [ml/h] Liquid Flow [ml/h]
Bub
ble
Dia
met
er [
µm]
200 300 400 500 600 70010
0
101
102
Den
sity
Num
ber
[bu
bble
s/m
m]
a b
Figure 2.7: Bubble diameter (a) and density number (b) variations fortwo pressures: 5 bars (solid line) and 6.5 bars (dotted line).
Dimension of the micropipette:
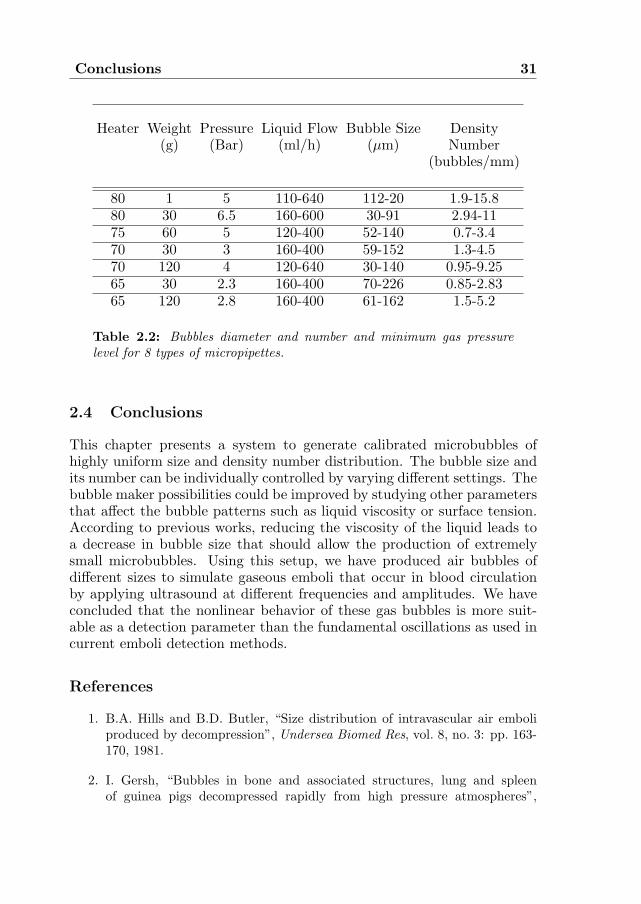
The third parameter that influences the bubble production is the type ofmicropipette. Table 2.2 summarizes the results obtained for seven differentmicropipette configurations. Each micropipette is defined by the pipette

30 CHAPTER 2. Production of calibrated gaseous emboli
puller settings (heater and weight). The minimal and maximal liquid flowrates used to generate bubbles are specified for each micropipette. De-pending on the dimensions of the micropipette, the gas pressure requiredto generate bubbles and the range of bubble sizes produced vary signifi-cantly. The size of the bubbles is directly correlated to the diameter ofthe micropipette: the larger the diameter, the larger the bubbles. How-ever, the gas pressure applied to the micropipette is also an importantparameter. It has been demonstrated previously that the size of the bub-ble increases with the applied gas pressure and the gas pressure required togenerate bubbles depends on the shape of the micropipette. Micropipetteswith the smallest diameters do not necessary generate the smallest bubblesize. As an example, we can compare the results obtained for micropipettetype III with a new micropipette referred as micropipette type IV. Thismicropipette was obtained with a heater level of 80 and a weight of 60 g.Its dimensions are: length 5.9 mm, curvature 1.5mm and diameter 0.8µm.For these two micropipettes, the minimal gas pressures required to generatebubbles are, respectively, 5 bars and 6.5 bars. Even though micropipettetype IV has a smaller diameter than micropipette type III, it appears thatthe bubbles generated by the two pipettes are almost identical. At a flowrate of 400ml/h, micropipette type IV produced bubbles of 44µm diam-eter while micropipette type III yielded bubbles of 42µm. This exampleillustrates the case in with the effect of the gas pressure on the bubblediameter cannot be compensated by a smaller tip.
The density of the produced bubbles cannot be assessed with regard tothe type of micropipette used. It was only observed that larger diametersproduced less dense populations, but no quantitative information could beextracted from the measurements. We considered the case of micropipettetypes III and IV. At a liquid rate of 400 ml/h, they produce almost iden-tical bubble diameters but the number of bubbles differs. The densitynumber is 7.4 bubbles/mm for micropipette type IV and 5.2 bubbles/mmfor micropipette type III. Therefore, the shape of the micropipette canstrongly affect the number of bubbles produced while there is negligibleeffect on the bubble diameters.
From Table 2.2, we can appreciate the different bubbles’ patterns. Thediameters range from 20µm up to 226µm. Different micropipettes canproduce the same bubble diameter at different liquid flows. If bubbles of100µm are required, five micropipettes can be selected: 75(60g), 70(120g),70(30g) 65(30g) and 65(120g). A difference will appear for the level ofbubble density. For these five micropipettes, the average density numberis, respectively, 1.1, 1.4, 1.6, 2.2 and 2.3 bubbles/mm.
Conclusions 31
Heater Weight Pressure Liquid Flow Bubble Size Density(g) (Bar) (ml/h) (µm) Number
(bubbles/mm)
80 1 5 110-640 112-20 1.9-15.880 30 6.5 160-600 30-91 2.94-1175 60 5 120-400 52-140 0.7-3.470 30 3 160-400 59-152 1.3-4.570 120 4 120-640 30-140 0.95-9.2565 30 2.3 160-400 70-226 0.85-2.8365 120 2.8 160-400 61-162 1.5-5.2
Table 2.2: Bubbles diameter and number and minimum gas pressurelevel for 8 types of micropipettes.
2.4 Conclusions
This chapter presents a system to generate calibrated microbubbles ofhighly uniform size and density number distribution. The bubble size andits number can be individually controlled by varying different settings. Thebubble maker possibilities could be improved by studying other parametersthat affect the bubble patterns such as liquid viscosity or surface tension.According to previous works, reducing the viscosity of the liquid leads toa decrease in bubble size that should allow the production of extremelysmall microbubbles. Using this setup, we have produced air bubbles ofdifferent sizes to simulate gaseous emboli that occur in blood circulationby applying ultrasound at different frequencies and amplitudes. We haveconcluded that the nonlinear behavior of these gas bubbles is more suit-able as a detection parameter than the fundamental oscillations as used incurrent emboli detection methods.
References
1. B.A. Hills and B.D. Butler, “Size distribution of intravascular air emboliproduced by decompression”, Undersea Biomed Res, vol. 8, no. 3: pp. 163-170, 1981.
2. I. Gersh, “Bubbles in bone and associated structures, lung and spleenof guinea pigs decompressed rapidly from high pressure atmospheres”,

32 CHAPTER 2. Production of calibrated gaseous emboli
J Cell Comp Physiol, vol. 26: pp. 101-117, 1945.
3. D. Georgiadis, M. Kaps, M. Siebler, M. Hill, M. Konig, J. Berg, M. Kahl,P. Zumker, B. Diehl, and E.N. Ringelstein, “Variability of Doppler mi-croembolic signal counts in patient with prosthetic cardiac valves”, Stroke,vol. 26, no. 3: pp. 439-443, 1995.
4. W. Mullges, D. Franke, W. Reents, and J. Babib-Ebell, “Brain microem-bolic counts during extracorporeal circulation depend on aortic cannulaposition”, Ultrasound Med Biol, vol. 27, no. 7: pp. 933.936, 2001.
5. D.L. Miller, “Ultrasonic detection of resonant cavitation bubbles in a flowtube by their second harmonic emissions”, Ultrasonics, vol. 21, no. 5:pp. 217-224, 1981.
6. B.M. Jensenn, M. Ekker, A.O. Brubakk, and A. Sira, “Method for produc-ing gas bubbles for use in air-embolism studies”, Med Biol Eng Comput,vol. 29, no. 1: pp. 104-108, 1991.
7. M. Kameda and Y. Matsumoto, “Nonlinear oscillation of a spherical gasbubble in acoustic fields”, J Acoust Soc Am, vol. 106, no. 6: pp. 3156-3166,1999.
8. S. Ramakrishnan, R. Kumar, and N.R. Kuloor, “Studies in bubble forma-tion: I- Bubbles formation under constant flow conditions”, Chem Eng Sci ,vol. 24, no.: pp. 731-474, 1969.
9. R.A.M. Al.-Hayes and R.H.S. Winterton, “Bubble diameter on detachmentin flowing liquids”, Int J Heat Mass Transf, vol. 24, no.: pp. 223-230, 1981.
10. H.N. Oguz and A. Prosperetti, “Dynamics of bubble growth and detach-ment from a needle”, J Fluid Mech, vol. 257, no.: pp. 111-145, 1993.
11. C. Ohl, “Generator for single bubbles of controllable size”, Rev Sci Instrum,vol. 72, no. 1: pp. 252-254, 2001.
12. R. Kumar and N.R. Kuloor, “The formation of bubbles and drops”,Adv Chem Engng, vol. 8, no. 1: pp. 256-368, 1970.
13. D. Grukle, N. Marsh, and B. Hills, “Experimental air embolism: measure-ment of microbubbles using the coulter counter”,Br J Exp Path, vol. 54,no. 6: pp. 684-691, 1973.
14. B. Hills and B. Butler, “A method of producing calibrated microbubblesfor air embolism studies”, J Appl Physiol, vol. 51, no. 2: pp. 524-528, 1981.

References 33
15. A. Ganan-Calvo and J. Gordillo, “Perfectly monodisperse microbubblingby capillary flow focusing”, Phys Rev Lett, vol. 87, no. 27: pp. 274501-1-274501-4, 2001.


Chapter 3Modelling of gaseous microemboli
in an ultrasound field
Abstract
The study of the bubble oscillations in an acoustic field is a fundamentalsubject to better understand physical phenomena such as acoustic cavitationor sonoluminescence. Many studies have been conducted to develop a the-oretical model that describes the radial motion of the bubble radius. Thesemodels have been widely investigated numerically or analytically and havebrought fruitful informations about the bubble behavior. The aim of thisstudy was to qualitatively and quantitatively compare the results obtainedwith optical recording of bubble vibrations and a theoretical model. Thebubble oscillations were optically recorded using the high-speed digital cam-era, BRANDARIS. The radius-time R(t) curve is directly computed from128 video frames with a high temporal and spatial resolution. Air bub-bles with a resting diameter ranging from 26µm up to 100µm were usedin the experiments. The ultrasound field consisted of an eight-cycle pulseat a frequency of 130 kHz generating an acoustic pressure between 10 kPaand 150 kPa. The time and the frequency response of the bubble radialmotion were compared to the Keller model. The comparison between theexperimental and the simulated time and frequency responses of the bubbleshows globally a good agreement both qualitatively and quantitatively andfor all the bubble sizes studied. The theoretical model correctly reproducedthe nonlinear features of the bubble oscillations. The results showed that
Based on the publication: “Modelling and optical measurements of the acousticbehavior of air bubbles’ by P. Palanchon, A. Bouakaz and N. de Jong. Submitted.
35

36 CHAPTER 3. Modelling of gaseous emboli
for low acoustic pressure levels, the amplitude of the bubble oscillationsat the fundamental and second harmonic frequency is maximal for an airbubble with a resting radius of 24µm, which corresponds to the theoreti-cal resonance size. Bubbles above the resonance size require much higheracoustic pressure to oscillate nonlinearly. In addition, optical recordingsshowing an onset of the bubble shape also referred to surface mode oscil-lations, were also observed at pressures as low as 37 kPa. In conclusion,the Keller model can be used to accurately predict the fundamental andharmonic behavior of gaseous microemboli.

Introduction 37
3.1 Introduction
Studying the oscillations of a bubble in an acoustic field is a fundamentalsubject for acoustic cavitation or sonoluminescence. The radius as a func-tion of time R(t) is the single variable involved in the description of thebubble dynamics. Since Lord Rayleigh1, many studies have been devotedto the development of a theoretical model that describes the radial motionof the bubble radius2−4. These models have been widely investigated nu-merically or analytically and they have brought fruitful informations aboutthe linear and nonlinear behavior of bubbles under ultrasound irradiation.Mainly, for low and moderate driving pressures, the bubble oscillations areperiodic and the bubble shape remains spherically symmetric. Dependingon the bubble initial radius and the transmitted frequency f0, the fre-quency response will include, beyond the main resonance, some nonlinearharmonic components at 2f0, 3f0, etc as well as subharmonic (f0/2) andultraharmonic (3/2f0, 5/2f0,...) components5−9. For higher acoustic pres-sure levels, the bubbles can undergo strong distortions from their initialspherical shape, named surface mode oscillations.
Experimental validation of the theory was mostly performed by indi-rect means such as the acoustic signal backscattered by the bubble ratherthan by a direct measurements of radius-time curves. Recently, few stud-ies involving high-speed photography or laser technique have been con-ducted to determine the variation of the bubble radius as a function of theacoustic parameters, such as the transmitted frequency and the acousticpressure. Holt and Crum10 used light scattering method to measure thetime-varying response of an oscillating levitated bubble with a initial radiusranging from 20µm up to 90µm. The R(t) curve was computed from thelight intensity scattered by the bubble. They compared the experimentalresults to a theoretical model derived by Prosperetti4 and revealed a dis-crepancy between the theoretical and experimental responses mainly at the2nd harmonic frequency. For higher acoustic pressures, the appearance ofsubharmonic component over a wide range of bubble sizes was suspected toarise from shape oscillation modes. However this technique did not provideany information about the bubble shape, which could explain the differ-ence with the theoretical value. Tian and colleagues11 performed opticalrecordings of the oscillations of a single bubble, using a high speed camerawith a frame rate of 16.7ms and ultrasound pulse at 16.3 kHz. Due to thelow frame rate, direct observations of the bubble pulsations were limitedbut the system was used to detect onset of the bubble shape. However,no comparison to any theoretical model was carried out. More recently,Kameda12 investigated the nonlinear oscillations of a gas bubble in therange of 100µm and 250µm in a pressure field with a frequency of 20 kHz.

38 CHAPTER 3. Modelling of gaseous emboli
The Radius-Time (RT) curves were constructed from the successive opticalpictures (obtained at a frame rate of 10ms) and compared to a theoreticalmodel including the effect of the thermo-fluid mechanics of the gas insidethe bubble.
This chapter presents an experimental and numerical investigation ofthe dynamics of a single air bubble in an ultrasound field. The primary aimof the study was to qualitatively and quantitatively compare the results ofa theoretical model to optical recordings. The purpose of such a compari-son is to validate the performances of the theoretical model in describingthe acoustic behavior of gaseous microemboli. The bubbles investigated inthis study had initial diameters ranging from 26µm up to 100µm, whichcorresponds roughly to the size of clinically encountered microemboli. Thebubble oscillations were optically recorded using a high speed digital cam-era. The radius-time curves were computed from a total of 128 successivevideo frames, which gives a total exposure time long enough to study rig-orously the bubble dynamics. The time and the frequency responses of thebubble radial motion were compared to the model developed by Keller3.Depending on the bubble initial size and the applied acoustic pressure,some bubbles were undergoing shape distortions and thus lost their spher-ical symmetry. These bubbles were discarded from the comparison studysince they did not satisfy the model’s assumptions. The appearance ofthese different surface modes (from mode 2 up to mode 5) is reported inthe last section of the chapter.
3.2 Theoretical model
Since Rayleigh1, many studies have been carried out to develop a theoret-ical model to describe the oscillations of gas bubbles. In this thesis, weselected the modified Keller equation3, derived from the Rayleigh-Plesset-Noltingk-Neppiras (RPPN) equation to describe the dynamic behavior ofa free gas bubble. The main difference with the RPPN model is in consid-ering the medium as slightly compressible.
The validity of this model is based on the following assumptions:
a) The bubble is surrounded by a compressible fluid of infiniteextent with a constant viscosity.b) The bubble radial motion remains spherically symmetricduring its oscillations.c) There is no rectified diffusion during the ultrasound expo-sure time.d) The wavelength is assumed to be much larger than thebubble diameter and only the motion of the bubble surface is

Theoretical model 39
d) The wavelength is assumed to be much larger than the bub-ble diameter and only the motion of the bubble surface is ofinterest.
e) The vapor pressure and the polytropic exponent remain con-stant during the expansion and contraction phases.
The expression of the differential equation of motion of the bubble radiusis given by:
(1−˙R(t)c
) ¨R(t)R(t)+32
˙R(t)2(1−
˙R(t)3c
) = (1+˙R(t)c
)P (t)
ρ+
R(t)ρc
˙P (t) (3.1)
P (t) = (PST−PV +2σ
R0
)(R0
R(t))3κ− 2σ
R(t)−δtωρR(t) ˙R(t)−PST +PV −PAC(t)
(3.2)where
R(t) is the instantaneous radius;
R(t) is the first time derivative of the instantaneous radius =velocity;
R(t) is the second time derivative of the instantaneous radius= acceleration;
R0 is the equilibrium radius;
ω is the angular frequency;
c is the sound velocity;
ρ is the density of the surrounding medium;
σ is the surface tension;
PST is the static pressure (ambient pressure);
δt is the total damping coefficient,
PV is the vapor pressure,
κ is the polytropic exponent,
PAC(t) is the time varying excitation acoustic pressure.
The total damping coefficient is defined as the sum of the damping con-stants due to the radiation (δrad), the viscosity of the surrounding medium(δvis) and the thermal conductivity (δth). Their expressions were given byMedwin13
δtot = δrad + δvis + δth (3.3)

40 CHAPTER 3. Modelling of gaseous emboli
µ is the viscosity of the surrounding medium;k is the wave number (2π/λ);fR is the resonance frequency of the bubble;d/b = 3(γ−1) where γ is the ratio of the heat capacity at constant pressureand constant volume.
The bubble resonance frequency was computed using the formula givenby Medwin13:
f2r =
12πR0
√3γbσP0
ρ(3.7)
whereP0 is the acoustic pressure level;b=1/κ, κ is the polytropic exponent.
The expression of the effective mass, the polytropic exponent and thesurface tension are given by Medwin13. Equation 3.1 was solved using thefourth order Runge-Kutta method implemented using Matlab Simulink(Matlab, Mathworks). A fixed step size was used. For the simulations, theinitial values at t = 0 are R = R0 and R=0.
3.3 Experimental setup
The experimental setup is shown in Figure 3.1. An electrical gated signalwas generated by an arbitrary waveform generator. The electrical signalwas amplified by a 50 dB linear power amplifier (2100L, ENI, NY, USA),and its amplitude could be adjusted by a separate attenuator from 0 to120 dB in steps of 1 dB (355C/D, HP, Palo Alto, CA). The peak nega-tive acoustic pressures were measured separately using a calibrated hy-drophone (Reson GmbH, Kiel, Germany). The amplified electrical signalwas then directed to an unfocused single element transducer (Matec Instru-ment Companies Inc, Northborough, USA). The transducer had a centerfrequency of 130 kHz and a total aperture of 31 mm. The transducer wasmounted in a water tank and positioned in such a way to produce acousticwaves directed perpendicularly to the bubble streamline, as shown in Fig-ure 3.2. The bubbles (represented by a needle on the drawing) are located4 cm away from the transducer surface. A microscope (BXM microscope,Olympus, the Netherlands) was positioned perpendicularly to the watertank, and projected images of the gaseous bubbles with a magnificationof 20 times on the digital camera. The optical observations were madeusing an ultra-fast digital camera, named BRANDARIS. The camera hasa time resolution of 40 ns (25 million frames per second) and can store upto 128 frames in every shot. With such a system real-time optical observa-tions of the bubble oscillations are possible with a very high temporal and

Experimental setup 41
Arbitrary waveformgenerator
PC system
HP variableattenuators
50 dB poweramplifier
Brandaris 128
Bubble streamline
Olympus BXM microscope
Transducer
Figure 3.1: Top view of the experimental setup.
spatial resolution. More detailed technical description of the camera andits working principle can be found in the website www.brandaris128.nl orin the publication by Chin et al14. The transmitted acoustic signal con-sisted of a burst of 8 cycles at 130 kHz center frequency giving thus atotal ultrasound scanning duration of approximately 46µs. The opticalframe rate used ranged from 1.1MHz to 1.25MHz corresponding to anoptical scanning duration between 102.4µs and 116.4 µs for a total of 128frames. Therefore, the total optical observation was always longer thanthe ultrasound exposure. The first frames of every optical recording werealways positioned before ultrasound insonification starts, so that the initialbubble size could be estimated. Typically, 5 frames were recorded beforeultrasound was launched. To observe the behavior of the microbubbles atdifferent amplitudes, the acoustic pressure at the location of the bubbleswas varied. The acoustic pressure used in these experiments ranged from10 kPa up to 150 kPa. The acoustic lateral beam profile of the transduceras measured at 4 cm for 130 kHz transmit frequency and had a beam widthat -6dB of 20 mm. Over mm distance (corresponding to vertical frame di-mension), we can assume that the bubble is submitted to identical pressurelevel independently of its position within the field of view of the optical sys-tem. Bubbles with different sizes were generated with the ‘bubble maker’.Deliberately, sizes below, above and at resonance were selected and used to
42 CHAPTER 3. Modelling of gaseous emboli
Brandaris
Microscope
Bubbles
Transducer
Figure 3.2: Optical arrangement.
validate the theoretical model for predicting microemboli interaction withultrasound.
3.4 Results and discussions
The diameter of the bubble is computed from the 128 frames for a givenrecording and a radius time R(t) curve is then constructed. The size ofthe bubble is calculated by detecting the bubble contour using an algo-rithm based on a Minimum Cost Analysis function. Figure 3.3 illustratesan example of the bubble oscillations. Few optical images of the bubblesat different stages are shown on top of the acoustic pressure wave. Thebubble has an initial radius of 48µm and the applied acoustic peak pres-sure was 20 kPa. We can clearly appreciate the expansion and contractionphases of the bubbles according to the pressure variations. The largestdiameter is obtained when the pressure wave reaches its rarefaction valuewhile the smallest diameter appears for the highest level of the pressurewave. The bubble oscillations were firstly investigated as a function of theresting diameter of the bubble. The amplitude of the bubble oscillationsis given by the quantity (Rmax − Rmin)/R0 and was measured for differ-ent bubble sizes undergoing identical ultrasonic scanning conditions. Theacoustic field is defined by a 8 cycles burst transmitting a frequency of130 kHz and generating an acoustic pressure of 20 kPa at the bubble loca-tion. The equilibrium bubble diameter extended from 26µm up to 60µm.
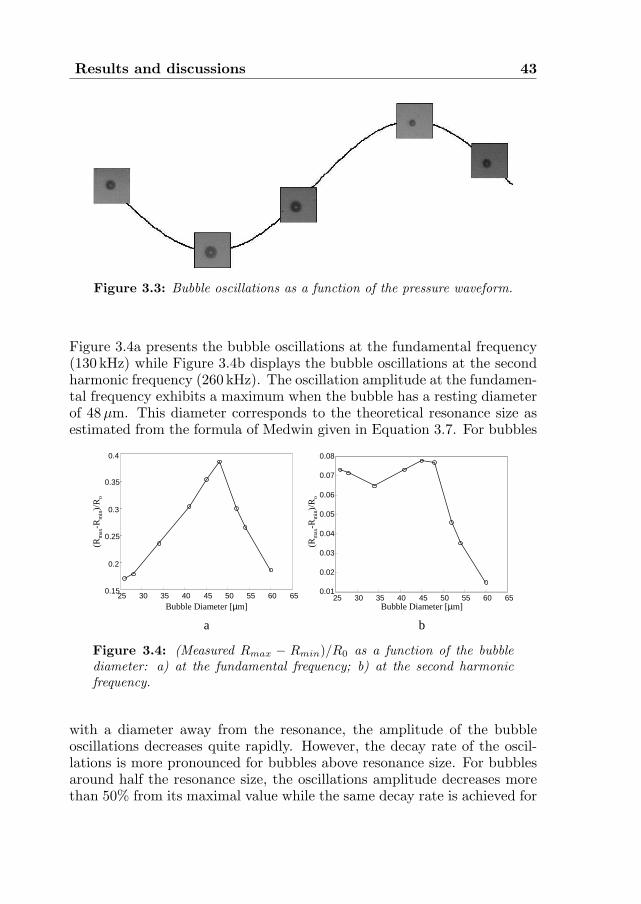
Results and discussions 43
Figure 3.3: Bubble oscillations as a function of the pressure waveform.
Figure 3.4a presents the bubble oscillations at the fundamental frequency(130 kHz) while Figure 3.4b displays the bubble oscillations at the secondharmonic frequency (260 kHz). The oscillation amplitude at the fundamen-tal frequency exhibits a maximum when the bubble has a resting diameterof 48µm. This diameter corresponds to the theoretical resonance size asestimated from the formula of Medwin given in Equation 3.7. For bubbles
25 30 35 40 45 50 55 60 650.01
0.02
0.03
0.04
0.05
0.06
0.07
0.08
25 30 35 40 45 50 55 60 650.15
0.2
0.25
0.3
0.35
0.4
Bubble Diameter [µm]
(Rm
ax-R
min
)/R
o
Bubble Diameter [µm]
(Rm
ax-R
min
)/R
o
a b
Figure 3.4: (Measured Rmax − Rmin)/R0 as a function of the bubblediameter: a) at the fundamental frequency; b) at the second harmonicfrequency.
with a diameter away from the resonance, the amplitude of the bubbleoscillations decreases quite rapidly. However, the decay rate of the oscil-lations is more pronounced for bubbles above resonance size. For bubblesaround half the resonance size, the oscillations amplitude decreases morethan 50% from its maximal value while the same decay rate is achieved for
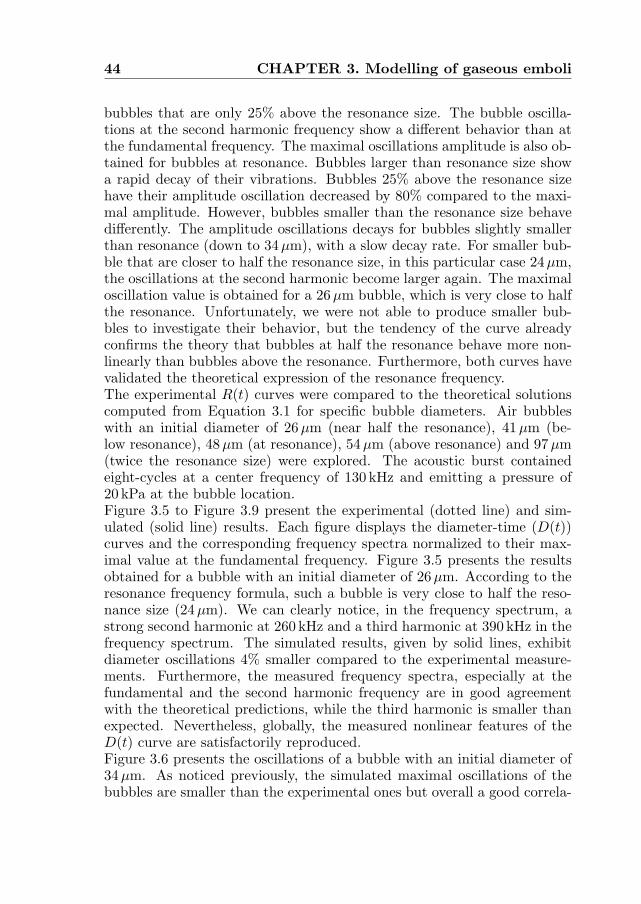
44 CHAPTER 3. Modelling of gaseous emboli
bubbles that are only 25% above the resonance size. The bubble oscilla-tions at the second harmonic frequency show a different behavior than atthe fundamental frequency. The maximal oscillations amplitude is also ob-tained for bubbles at resonance. Bubbles larger than resonance size showa rapid decay of their vibrations. Bubbles 25% above the resonance sizehave their amplitude oscillation decreased by 80% compared to the maxi-mal amplitude. However, bubbles smaller than the resonance size behavedifferently. The amplitude oscillations decays for bubbles slightly smallerthan resonance (down to 34µm), with a slow decay rate. For smaller bub-ble that are closer to half the resonance size, in this particular case 24µm,the oscillations at the second harmonic become larger again. The maximaloscillation value is obtained for a 26µm bubble, which is very close to halfthe resonance. Unfortunately, we were not able to produce smaller bub-bles to investigate their behavior, but the tendency of the curve alreadyconfirms the theory that bubbles at half the resonance behave more non-linearly than bubbles above the resonance. Furthermore, both curves havevalidated the theoretical expression of the resonance frequency.The experimental R(t) curves were compared to the theoretical solutionscomputed from Equation 3.1 for specific bubble diameters. Air bubbleswith an initial diameter of 26µm (near half the resonance), 41µm (be-low resonance), 48µm (at resonance), 54µm (above resonance) and 97µm(twice the resonance size) were explored. The acoustic burst containedeight-cycles at a center frequency of 130 kHz and emitting a pressure of20 kPa at the bubble location.Figure 3.5 to Figure 3.9 present the experimental (dotted line) and sim-ulated (solid line) results. Each figure displays the diameter-time (D(t))curves and the corresponding frequency spectra normalized to their max-imal value at the fundamental frequency. Figure 3.5 presents the resultsobtained for a bubble with an initial diameter of 26µm. According to theresonance frequency formula, such a bubble is very close to half the reso-nance size (24µm). We can clearly notice, in the frequency spectrum, astrong second harmonic at 260 kHz and a third harmonic at 390 kHz in thefrequency spectrum. The simulated results, given by solid lines, exhibitdiameter oscillations 4% smaller compared to the experimental measure-ments. Furthermore, the measured frequency spectra, especially at thefundamental and the second harmonic frequency are in good agreementwith the theoretical predictions, while the third harmonic is smaller thanexpected. Nevertheless, globally, the measured nonlinear features of theD(t) curve are satisfactorily reproduced.Figure 3.6 presents the oscillations of a bubble with an initial diameter of34 µm. As noticed previously, the simulated maximal oscillations of thebubbles are smaller than the experimental ones but overall a good correla-

Results and discussions 45
0 100 200 300 400 500-60
-50
-40
-30
-20
-10
0
0 20 40 60 80 100 12021
22
23
24
25
26
27
28
29
Time [µs] Frequency [kHz]
Bub
ble
Dia
met
er [
µm]
Nor
mal
ized
Am
plitu
de [
dB]
a b
Figure 3.5: Simulated (solid line) and measured (dotted line) D(t) curves(a) and frequency spectrum (b) of a bubble with a resting diameter of 26µminsonified at 130 kHz and 20 kPa.
tion is obtained. The frequency spectra also show a good agreement. It canalso be noticed that a 34µm bubble exhibits a lower number of nonlinearcomponents than the 26µm bubble. Figure 3.7 compares the theoreticalpredictions with the measurements for a resonant bubble of 48µm. Thesimulated results show slightly larger values than the experimental databut the difference is smaller than 10%. However, the theoretical frequencyresponse perfectly reproduces, both quantitatively and qualitatively, theexperimental linear and nonlinear behavior of resonant bubbles. The re-sults obtained with a bubble of 54µm are shown in Figure 3.8. The ex-perimental D(t) curve and the frequency spectrum are reproduced by thesimulations. The amplitude oscillations are lower than resonant bubble andthis feature is characterized by a lower number of harmonic componentsin the frequency spectrum: only a small second harmonic 22 dB below thefundamental is generated by this bubble.
Figure 3.9 shows the D(t) curve and the frequency response of a bubblewith a resting diameter of 93µm, which is very close to twice the resonancesize (96µm). For this particular configuration, the bubble was insonifiedwith a larger acoustic pressure level in order to induce the bubble intononlinear motion. The pressure level was 150 kPa. The D(t) curves mea-sured and simulated are in good agreement during the first eight cyclesof the oscillations. Afterwards, the measurements show that the bubblecontinues oscillating while the theoretical model exhibit a damping in theoscillations. The oscillations correspond to surface mode oscillations asobserved on the optical recording. Therefore, the frequency response was

46 CHAPTER 3. Modelling of gaseous emboli
0 20 40 60 80 100 12028
30
32
34
36
38
40
0 100 200 300 400 500-60
-50
-40
-30
-20
-10
0
Time [µs] Frequency [kHz]
Nor
mal
ized
Am
plitu
de [
dB]
a b
Bub
ble
Dia
met
er [
µm]
Figure 3.6: Simulated (solid line) and measured (dotted line) D(t) curves(a) and frequency spectrum (b) of a bubble with a resting diameter of34µm insonified at 130 kHz and 20 kPa.
0 20 40 60 80 100 12030
35
40
45
50
55
60
65 0
0 100 200 300 400 500 600-80
-70
-60
-50
-40
-30
-20
-10
Time [µs] Frequency [kHz]
Bub
ble
Dia
met
er [
µm]
Nor
mal
ized
Am
plitu
de [
dB]
a b
Figure 3.7: Simulated (solid line) and measured (dotted line) D(t) curves(a) and frequency spectrum (b) of a bubble with a resting diameter of48µm insonified at 130 kHz and 20 kPa.
computed from the D(t) curve corresponding to volume mode oscillationswhile the end of the curve was discarded. The frequency spectra exhibit astrong second harmonic and a subharmonic components. The theoreticalsecond harmonic agrees with the measurements while there is a discrep-ancy concerning the subharmonic frequency. Overall, the theoretical modeldeveloped by Keller gives a good agreement with the optical recordings ofthe bubble oscillations.
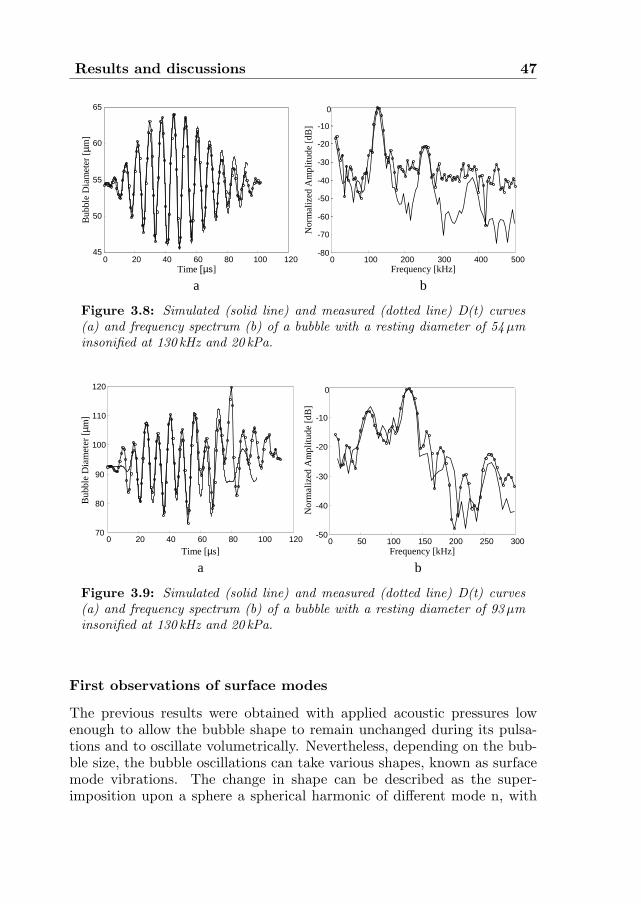
Results and discussions 47
0 20 40 60 80 100 12045
50
55
60
65
Time [µs]
Bub
ble
Dia
met
er [
µm]
a
0 100 200 300 400 500-80
-70
-60
-50
-40
-30
-20
-10
0
Frequency [kHz]
Nor
mal
ized
Am
plitu
de [
dB]
b
Figure 3.8: Simulated (solid line) and measured (dotted line) D(t) curves(a) and frequency spectrum (b) of a bubble with a resting diameter of 54µminsonified at 130 kHz and 20 kPa.
Bub
ble
Dia
met
er [
µm]
0 20 40 60 80 100 12070
80
90
100
110
120
Time [µs]
a
Nor
mal
ized
Am
plitu
de [
dB]
0 50 100 150 200 250 300-50
-40
-30
-20
-10
0
Frequency [kHz]
b
Figure 3.9: Simulated (solid line) and measured (dotted line) D(t) curves(a) and frequency spectrum (b) of a bubble with a resting diameter of 93µminsonified at 130 kHz and 20 kPa.
First observations of surface modes
The previous results were obtained with applied acoustic pressures lowenough to allow the bubble shape to remain unchanged during its pulsa-tions and to oscillate volumetrically. Nevertheless, depending on the bub-ble size, the bubble oscillations can take various shapes, known as surfacemode vibrations. The change in shape can be described as the super-imposition upon a sphere a spherical harmonic of different mode n, with
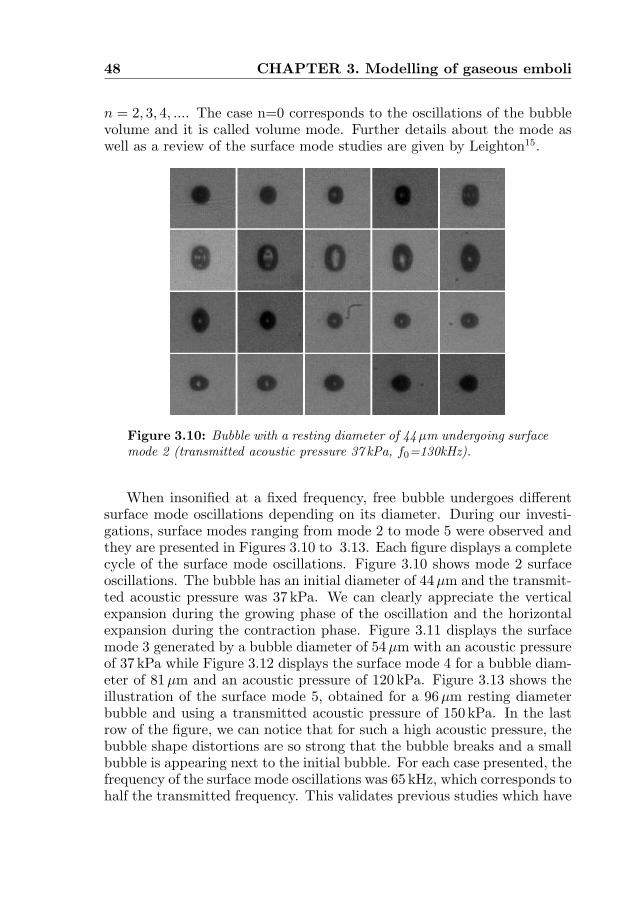
48 CHAPTER 3. Modelling of gaseous emboli
n = 2, 3, 4, .... The case n=0 corresponds to the oscillations of the bubblevolume and it is called volume mode. Further details about the mode aswell as a review of the surface mode studies are given by Leighton15.
Figure 3.10: Bubble with a resting diameter of 44µm undergoing surfacemode 2 (transmitted acoustic pressure 37 kPa, f0=130kHz).
When insonified at a fixed frequency, free bubble undergoes differentsurface mode oscillations depending on its diameter. During our investi-gations, surface modes ranging from mode 2 to mode 5 were observed andthey are presented in Figures 3.10 to 3.13. Each figure displays a completecycle of the surface mode oscillations. Figure 3.10 shows mode 2 surfaceoscillations. The bubble has an initial diameter of 44µm and the transmit-ted acoustic pressure was 37 kPa. We can clearly appreciate the verticalexpansion during the growing phase of the oscillation and the horizontalexpansion during the contraction phase. Figure 3.11 displays the surfacemode 3 generated by a bubble diameter of 54µm with an acoustic pressureof 37 kPa while Figure 3.12 displays the surface mode 4 for a bubble diam-eter of 81µm and an acoustic pressure of 120 kPa. Figure 3.13 shows theillustration of the surface mode 5, obtained for a 96µm resting diameterbubble and using a transmitted acoustic pressure of 150 kPa. In the lastrow of the figure, we can notice that for such a high acoustic pressure, thebubble shape distortions are so strong that the bubble breaks and a smallbubble is appearing next to the initial bubble. For each case presented, thefrequency of the surface mode oscillations was 65 kHz, which corresponds tohalf the transmitted frequency. This validates previous studies which have

Results and discussions 49
Figure 3.11: Bubble with an resting diameter of 54µm undergoing sur-face mode 3 (transmitted acoustic pressure 37 kPa, f0=130kHz).
Figure 3.12: Bubble with an resting diameter of 81µm undergoing sur-face mode 4 (transmitted acoustic pressure 120 kPa, f0=130kHz).
reported that bubble undergoing surface mode generated a subharmoniccomponent. Further investigations of the surface mode production need to

50 CHAPTER 3. Modelling of gaseous emboli
Figure 3.13: Bubble with an resting diameter of 93µm undergoing sur-face mode 5 (transmitted acoustic pressure 150 kPa, f0=130kHz).
be carried out in order to better understand its physical characteristics.
3.5 Conclusions
This chapter describes a numerical and experimental investigation of theoscillations of a single air bubble in response to an acoustic field. Theoptical system allows the recording of the bubble radial motion over a pe-riod of time longer than the ultrasound exposure. Therefore, the opticaldata represent a good basis to perform a quantitative and qualitative com-parison with the theory. The study of the oscillations as a function of thebubble size reveals a maximum for a bubble diameter of 48µm correspond-ing to the theoretical resonance size. The amplitude of the oscillations atthe second harmonic demonstrates that bubble around half the resonancesize generates a high number of nonlinear components as suggested by thetheory. The experimental data were compared to the theoretical modeldeveloped by Keller. There is a good qualitative and quantitative agree-ment between both, not only for the R(t) curves but also for the frequencyresponse. The most important discrepancy occurs for the frequency re-sponse of a bubble around twice the resonance size. Overall, this studydemonstrates the usefulness of the Keller model to predict the behavior ofthe bubbles and its use for emboli studies.

References 51
References
1. L. Rayleigh, “On the pressure developed in a liquid during collapse of aspherical cavity”, Philos Mag, vol. 34, no. 200: pp. 94, 1917.
2. B.E. Noltingk and E.A. Neppiras, “Cavitation produced by ultrasonics”,Proc Phys Soc B, vol. 63, no. 9: pp. 674-685., 1950.
3. J.B. Keller and M. Miksis, “Bubble oscillations of large amplitude”,J Acoust Soc Am, vol. 68, no. 2: pp. 628-633, 1980.
4. A. Prosperetti, L.A. Crum, and K.W. Commander, “Nonlinear bubble dy-namics”, J Acoust Soc Am, vol. 83, no. 2: pp. 502-514, 1988.
5. E.A. Neppiras, “Subharmonic and other low frequency emissions from bub-bles in sound-irradiated liquids”, J Acoust Soc Am, vol. 46, no.: pp. 587-601,1968.
6. B.C. Eatock and R.Y. Nishi, “Numerical studies of the spectrum of lowintensity ultrasound scattered by bubbles”, J Acoust Soc Am, vol. 77, no. 5:pp. 1692-1701, 1985.
7. A. Francescutto and R. Nabergoj, “Steady state oscillations of gasbubbles in liquids: explicit formulas for frequency response curves”,J Acoust Soc Am, vol. 73, no. 2: pp. 457-460, 1983.
8. W. Lauterborn, “Numerical investigation of nonlinear oscillations of gasbubbles in liquids”, J Acoust Soc Am, vol. 59, no. 2: pp. 283-293, 1976.
9. A. Prosperetti, “Nonlinear oscillations of gas bubbles in liquids: steadystate solutions”, J Acoust Soc Am, vol. 56, no. 3: pp. 878-885, 1974.
10. R.G. Holt and L.A. Crum, “Acoustically forced oscillations of air bubblesin water: Experimental results”, J Acoust Soc Am, vol. 91, no. 4: pp. 1924-1932, 1996.
11. Y. Tian, J.A. Ketterling, and R.E. Apfel, “Direct observation of microbub-ble oscillations”, J Acoust Soc Am, vol. 100, no. 6: pp. 3976-3978, 1996.
12. M. Kameda and Y. Matsumoto, “Non linear oscillation of a spherical gasbubble in acoustic fields”, J Acoust Soc Am, vol. 106, no. 6: pp. 3156-3166,1999.
13. H. Medwin, “Counting bubbles acoustically: a review”, Ultrasonics, vol. 15,no. 1: pp. 7-13, 1977.

52 CHAPTER 3. Modelling of gaseous emboli
14. C.T. Chin, C. Lancee, J. Borsboom, F. Mastik, M.E. Frijlink, N. de Jong,M. Versluis, and D. Lhose, “Brandaris 128: A digital 25 million frames persecond camera with 128 highly sensitive frames”, Rev Sci Instrum, vol. 74,no. 12: pp. 5026-5034, 2003.
15. T.G. Leighton, “The Acoustic Bubble”, London Academic Press Limited,1994.

Chapter4Harmonic emissions of gaseous
bubbles applied to microembolidetection
Abstract
In this chapter, a new technique based on the nonlinear oscillations of gasbubbles is applied to gaseous emboli detection, characterization and sizing.To simulate gaseous emboli, the experimental “bubble maker” described inChapter 2 was used to produce air bubbles of uniform diameters rangingfrom 19µm up to 200µm. The ultrasonic set-up consisted of low frequencytransducers operating at 130 kHz and 250 kHz and using low acoustic pres-sures (30 kPa and 55 kPa). The theoretical model evaluated in Chapter 3is used for comparison. Both experimental and theoretical results showedthat depending on the transmitted frequency and the bubbles’ sizes, higherharmonic components were produced in the frequency spectrum of the scat-tered echo. Non-resonating bubbles scatter either linearly when their sizesare far away from the resonance size or nonlinearly at the second or thirdharmonic frequency when their sizes become close to the resonance size.Only resonant bubbles or bubbles very close to the resonance size are ableto scatter at higher harmonic frequencies (fourth and fifth). This property
Based on the publication: “New technique for emboli detection and discrimina-tion based on nonlinear characteristics of gas bubbles” by P. Palanchon, A. Bouakaz,J.H. van Blankestein, J. Klein, N. Bom and N. de Jong, Ultrasound in Medicine and Bi-ology, vol. 27, no. 6: pp. 801-808, 2001.
53

54 CHAPTER 4. Harmonic emissions
is used to discriminate between resonating bubbles from other bubble sizes.The appearance of harmonic component in the frequency spectrum appearsas a valuable tool to differentiate gaseous emboli from solid emboli thatscatter only linearly.

Introduction 55
4.1 Introduction
Several ultrasonic methods have been utilized for microemboli detection.The most widely used is the Doppler. The ability of Doppler ultrasoundto detect emboli circulating in the blood stream was first described in thesixties1,2. When a moving particle (solid or gaseous) is passing through theDoppler sample volume, the impedance mismatch between the embolusand the surrounding medium leads to an increase in the received Dopplersignal. Such signals are defined as short duration, high intensity signals(HITS). Several in vitro and in vivo studies3−6 have been attempted to de-tect emboli and differentiate between gaseous and formed-element emboli.Different parameters have been used for detection, such as the emboli ve-locity, the time duration and the relative intensity increase of the Dopplersignal, expressed as the ratio of the maximal relative power amplitudewhen an embolus is present to the maximal relative power amplitude ofthe flowing blood without embolus. Such analysis of the Doppler signalscan provide some information about embolus characteristics and size inwell-controlled in-vitro experiments, but accurate characterization in clin-ical practice is not yet possible using current technology.
Ultrasonic methods based on ultrasound-bubble interaction may be-come an alternative approach for emboli detection. Theoretical descrip-tions and modelling of the interaction between ultrasound waves and gasbubbles have been investigated for many years7. Theory shows that, whenan ultrasound wave with relatively low acoustic amplitude hits a gas bub-ble, the bubble starts pulsating with symmetric expansion and contrac-tion phases. The vibrations are maximal when the transmitted frequency(f) is equal to the natural resonance frequency of the bubble. When thetransmitted acoustic amplitude is increased, the bubble vibrations becomeasymmetric. This asymmetry is characterized by the appearance of har-monics (2f, 3f), subharmonic (1/2f) and ultraharmonic (3/2f , 5/2f) com-ponents in the frequency spectrum of the scattered signal. This behaviorwas widely described in Chapter 3 with the help of optical recordings andtheory.
Investigations of detection techniques based on bubble resonance8,9 re-vealed that such a method was not ideal due to the fact that a signal ofresonant bubbles can be similar, or even smaller than the signal of muchlarger (non-resonating) bubbles, which can lead to ambiguities in sizingbubbles. Miller10,11 suggested the use of the second harmonic to detectresonant bubbles. His apparatus provided good results allowing discrimi-nation between resonating and larger bubbles. Nevertheless, such a devicewas only sensitive to resonant bubbles, leaving non-resonant bubbles un-detected. Eatock and Nishi12 have studied numerically the possibility of

56 CHAPTER 4. Harmonic emissions
detecting bubbles by the use of harmonics (second and third harmonic) andsubharmonics at low acoustic pressures. They used transducers operatingat 500 kHz and 1 MHz with amplitudes of 17 kPa and 54 kPa, and demon-strated that harmonic generation at low acoustic pressures required a driv-ing frequency being within 10% of the resonance frequency of the bubble ora low integer fraction (1/2, 1/3) of the resonance frequency. These meth-ods based on harmonic emissions are, however, accompanied by two mainlimitations: frequencies higher than 500 kHz were used, which correspondto resonating bubbles smaller than 12µm in diameter. Therefore, largerbubbles (during decompression, bubble size was estimated to range from20 µm to 200µm13) could not be detected. Moreover, low acoustic pressureswere required to obtain a good resolution in sizing the bubbles, meaningthat only bubbles very close to the resonance size could scatter at the sec-ond harmonic frequency and, thus, could be detected. Consequently, thesetechniques appear sensitive only to very specific bubble, especially bubblessmaller than 12µm, and so could not be exploited for emboli detection.
Newhouse and Shankar14 have developed a technique to size the bub-bles based on the double frequency method. Bubbles were simultaneouslyinsonated with a constant high frequency called imaging frequency (wi)and a lower variable frequency called pumping frequency (wp). Bubblesoscillations become nonlinear when the pump frequency is close to theresonance frequency of the bubbles. Consequently, when the sum and dif-ference frequency (wi±wp) exhibit a maximum, the value of the pumpingfrequency allow indirect estimation of the bubble’s size. Leighton et al.15applied the same method by including the subharmonic emissions. Thescattered signal at (wi±wp/2) appeared a more sensitive indicator to sizebubbles than the signal at (wi±wp). Accurate bubble sizes were obtainedbut an acoustic pressure threshold was required to obtain a fine resolutionand the signal could be correlated only to a single bubble. Furthermore,this method required a complex apparatus that may be quite difficult toadapt for in vivo microemboli detection.
The aim of the method proposed in this chapter, was to detect andcharacterize circulating gaseous emboli. The approach is based on the non-linear scattering properties of gas bubbles. According to theory, a drivingfrequency near the natural resonance frequency of the bubbles with a suf-ficient acoustic amplitude will induce nonlinear vibrations and, therefore,lead to second and higher harmonic scattering. When the driving fre-quency is chosen to be far away from the resonance, harmonics are hardlygenerated. Consequently, bubble detection based on harmonic emissionsrequires the use of transducers operating at frequencies close to the reso-nance frequencies of the bubbles under investigation. The transducer fre-quencies used in this study (hundreds of kilohertz, which are low frequen-

Simulations 57
cies compared to usual frequencies used in medical diagnostic applications)were selected to correspond to resonance sizes around 50µm and 25µm.Moreover, using low-frequency ultrasound waves minimizes considerablythe harmonic generation due to nonlinear propagation effects. Therefore,the harmonic components in the frequency spectrum of the scattered sig-nals can only be associated with nonlinear bubble vibrations and not withwave distortion. Solid emboli scatter linearly and their spectra exhibita peak only at the transmitted fundamental frequency. By monitoringthe harmonic emissions, gaseous emboli can be detected and discriminatedfrom solid particles. Size estimation is performed were higher harmoniccomponents (fourth or fifth harmonic) are generated.
4.2 Simulations
To study the dynamic behavior of the free gas bubble, a model developed byKeller is used as a theoretical basis. This model was extensively describedin Chapter 3 and the reader can refer to this chapter for further details.To compare the simulations and the experimental results, we assumedthat each bubble could be considered as an individual scatterer and thatmultiple scattering is negligible. Thus, the intensity of the scattered echoof N bubbles of similar size is given by the echo of one bubble multipliedby their number N16. It was also assumed that the flow velocity does notinterfere on the bubble response (the Keller model was developed for astatic bubble) since the flow velocity is low compared to the velocity ofsound.
The predicted scattered echo from the bubbles is determined usinga simplified relationship between the instantaneous radius of the bubbleradius-time curve, R(t), and the wall velocity, R(t). The radius-time curveis the solution of Equations 3.1 and 3.2 of the Keller model. When theassumption of a large oscillation amplitude is made but the Mach numberis small, the echo is proportional to the time derivative of R2R and is givenby the following formula17:
E(t) =ρ
z(R(t)2 ¨R(t) + 2R(t) ˙R(t)
2) (4.1)
where z represents the distance between the bubble and the transducer.In the simulations, the attenuation due to the propagation in the water
path was included and then the scattered echo was bandpass filtered us-ing the frequency response of the corresponding transmitting and receiv-ing transducers, which were measured separately. The first simulationswere run to better understand the behavior of the bubbles, depending ontheir size, the transmitted acoustic pressure and the emitted frequency.

58 CHAPTER 4. Harmonic emissions
For these simulations, the scattered echo was directly computed usingEquation 5.1. Figure 4.1 presents the normalized spectra of the predictedecho from a single bubble with a diameter of 48µm. The transmittedfrequency was 130 kHz (natural resonance frequency of the bubble) anddifferent acoustic pressures were used: 30 kPa, 15 kPa and 7.5 kPa. Thefigure illustrates the influence of the acoustic pressure on the generationof harmonics. At low pressure (7.5 kPa) only few harmonics are present inthe scattered spectrum, while increasing the acoustic pressure, harmoniccomponents increase in number and amplitude.
0 200 400 600 800-80
-60
-40
-20
0
Frequency [kHz]
Nor
mal
ized
Sca
tter
ed P
ower
[dB
]
Figure 4.1: Frequency spectra of the simulated backscattered echo fora bubble of 48µm insonified with a 130 kHz ultrasound wave for differ-ent acoustic pressures: solid line 7.5 kPa; dashed line 15 kPa; dotted line30 kPa.
Figure 4.2 shows that, for a given insonation frequency, the harmonicgeneration is also strongly correlated to the size of the bubble. The figureshows the fundamental, second, third and fourth harmonic componentsas a function of the bubble diameter for an ultrasound field of 130 kHz.The maximal level of each harmonic component (second, third and fourth)occurs at the resonance size (48µm diameter). A second peak amplitudeappears for half the resonance size (24µm diameter). For bubbles largerthan the resonance size, the harmonic levels decrease significantly. There-fore, the harmonic level can be an indicator of bubble size.
Table 4.1 presents the resonance frequency of different bubble sizes.The bubbles contain air inside and water is considered as the surroundingmedium. The resonance frequency was computed using the formula given

Measurements 59
24 32 40 48 56 62-40
-20
0
20
40
Diameter [µm]
Rel
ativ
e Sc
atte
red
Pow
er [
dB]
Third harmonic
Fourth harmonic
Second harmonic
Fundamental
Figure 4.2: Simulated fundamental, second, third and fourth harmonicscattered levels as a function of the bubble diameter using an ultrasoundwave of 30 kPa and 130 kHz.
by Medwin 18:
f2r =
SA
4π2mbβ (4.2)
whereSA is the stiffness of the bubble-liquid interface;m is the effective mass of the system;b=1/κ, κ is the polytropic exponent;β is the surface tension.The effective mass, the polytropic exponent and the surface tension coef-ficient were given in reference 18.
As shown in Table 4.1, the resonance frequency decreases when thebubble becomes larger. Therefore, it is necessary to operate at low fre-quencies (in the kHz range) to approach the resonance of gaseous emboliand maximize the harmonic production. Moreover, operating at low fre-quencies minimizes the generation of harmonics during the propagation ofthe ultrasound wave. Therefore, no contaminating harmonics due to thenonlinear propagation are produced in the scattered echo.
4.3 Measurements
A device was developed to produce different populations of calibrated mi-crobubbles (Chapter 2). By varying external parameters, we were able

60 CHAPTER 4. Harmonic emissions
Bubble Diameter(µm) Resonance frequency (kHz)10 61620 30330 20340 15350 12460 10380 78100 62120 52140 45160 39180 35200 32
Table 4.1: Theoretical resonance frequency as a function of the bubblediameter
to produce bubbles with diameters ranging from 19µm to 200µm. Animaging system, illustrated in Figure 4.3 was developed to measure thesize and the number of the produced bubbles. It is composed of a variablezoom microscope coupled to a CCD camera (SONY). A flash was used toobtain bubble images with a good contrast and free of motion blurring.Each frame was saved on a personal computer for latter measurements ofthe bubble diameters and numbers. The produced bubbles were found tohave a very narrow distribution (for example, the standard deviation for
CCDCamera
Flash
Zoom microscope
Computer
Transmitter
Receiver
Figure 4.3: Experimental imaging setup (top view).
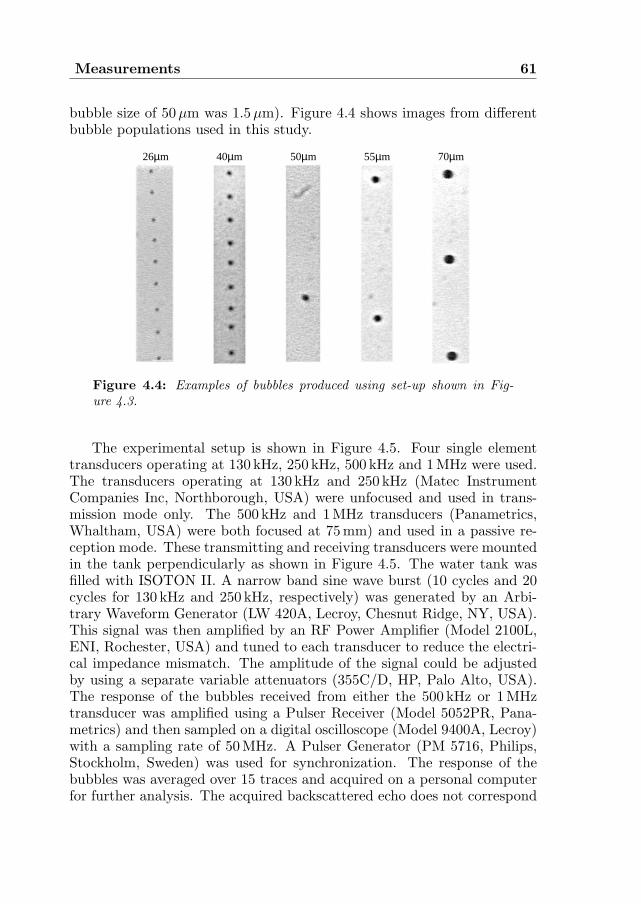
Measurements 61
bubble size of 50µm was 1.5µm). Figure 4.4 shows images from differentbubble populations used in this study.
40µm 70µm55µm50µm26µm
Figure 4.4: Examples of bubbles produced using set-up shown in Fig-ure 4.3.
The experimental setup is shown in Figure 4.5. Four single elementtransducers operating at 130 kHz, 250 kHz, 500 kHz and 1 MHz were used.The transducers operating at 130 kHz and 250 kHz (Matec InstrumentCompanies Inc, Northborough, USA) were unfocused and used in trans-mission mode only. The 500 kHz and 1MHz transducers (Panametrics,Whaltham, USA) were both focused at 75 mm) and used in a passive re-ception mode. These transmitting and receiving transducers were mountedin the tank perpendicularly as shown in Figure 4.5. The water tank wasfilled with ISOTON II. A narrow band sine wave burst (10 cycles and 20cycles for 130 kHz and 250 kHz, respectively) was generated by an Arbi-trary Waveform Generator (LW 420A, Lecroy, Chesnut Ridge, NY, USA).This signal was then amplified by an RF Power Amplifier (Model 2100L,ENI, Rochester, USA) and tuned to each transducer to reduce the electri-cal impedance mismatch. The amplitude of the signal could be adjustedby using a separate variable attenuators (355C/D, HP, Palo Alto, USA).The response of the bubbles received from either the 500 kHz or 1MHztransducer was amplified using a Pulser Receiver (Model 5052PR, Pana-metrics) and then sampled on a digital oscilloscope (Model 9400A, Lecroy)with a sampling rate of 50 MHz. A Pulser Generator (PM 5716, Philips,Stockholm, Sweden) was used for synchronization. The response of thebubbles was averaged over 15 traces and acquired on a personal computerfor further analysis. The acquired backscattered echo does not correspond

62 CHAPTER 4. Harmonic emissions
to the response of a single bubble, but to the number of bubbles presentin the ultrasound beam. This number varies according to the air pressureand the liquid flow used.
Function GeneratorPower amplifier ENI
Pulser generator
PulserReceiver
Oscilloscope
PC
water tankwater tank
AttenuatorTuning
Figure 4.5: Experimental acoustical setup.
4.4 Results
Experimental results were obtained using transducers of 130 kHz and250 kHz in transmission. The acoustic pressure generated at the regionof interest as measured with a hydrophone was 30 kPa for the 130 kHztransducer and 54 kPa for the 250 kHz transducer. These transmittedpressures correspond to the maximal amplitudes that could be applied tothe bubbles flowpath without inducing any disturbance. Higher pressuresgenerated strong radiation forces pushing the bubbles from their initialstream. Figure 4.6a shows an example of the acoustic pressure generatedby the 130 kHz transducer at a distance of 75 mm. The spectrum of thissignal is displayed in Figure 4.6b. We clearly see that the propagationof the ultrasound wave is only linear and that no harmonic componentswere generated during propagation. Figures 4.7a-f present the normalizedscattered power spectra measured using 130 kHz transducer in transmis-sion and 500 kHz transducer in reception for six different bubble sizes:80 µm, 62µm, 54µm, 48µm, 44µm and 35µm. The resonance frequen-cies of these bubbles are, respectively, 78 kHz, 100 kHz, 114 kHz, 128 kHz,140 kHz and 175 kHz (resonance frequencies were computed using Equa-tion 4.2). These spectra illustrate the behavior of the bubbles, dependingon their size. Bubbles with a diameter greater than 62µm behave linearlyand their scattered echoes exhibit a peak only at the transmitted funda-

Results 63
0 40 80 120 160 200-16
-8
0
8
16
0 200 400 600 800
-80
-60
-40
-20
0
Frequency [kHz]
Nor
mal
ized
Am
plit
ude[
dB]
Time [µs]
Pre
ssur
e[k
Pa]
a b
Figure 4.6: a) Acoustic pressure generated by the 130 kHz transducermeasured at a distance of 75mm; b) spectrum of the acoustic pressuresignal.
62 µm (fr= 100kHz) 54 µm (fr= 114kHz)
42 µm (fr= 146kHz)
Nor
mal
ized
Pow
er [
dB]
80 µm (fr= 78kHz)
Frequency [kHz]0 200 400 600 800
0a
-60
-40
-20
0 200 400 600 800
0b
-60
-40
-20
0 200 400 600 800
0e
-60
-40
-20
0 200 400 600 800
0c
-60
-40
-20
0 200 400 600 800
-60
-40
-20
0f
35 µm (fr= 175kHz)
Nor
mal
ized
Pow
er [
dB]
Nor
mal
ized
Pow
er [
dB]
Nor
mal
ized
Pow
er [
dB]
Nor
mal
ized
Pow
er [
dB]
Frequency [kHz]Frequency [kHz]
Frequency [kHz]Frequency [kHz]
-60
-40
-20
0 200 400 600 800
0d
48 µm (fr= 128kHz)
Nor
mal
ized
Pow
er [
dB]
Frequency [kHz]
Figure 4.7: Frequency spectra of scattered echoes for different bubblediameters insonified at 130 kHz: a) 80µm; b) 62µm; c) 54µm; d) 48µm;e) 42µm; f) 35µm.
mental frequency, as shown in Figure 4.7a for bubbles of 80µm. Whenthe resonance frequency of the bubbles approaches the transmitted fre-quency, harmonic components are more and more present in the spectrum(Figure 4.7b-f. A second harmonic component starts appearing for bub-
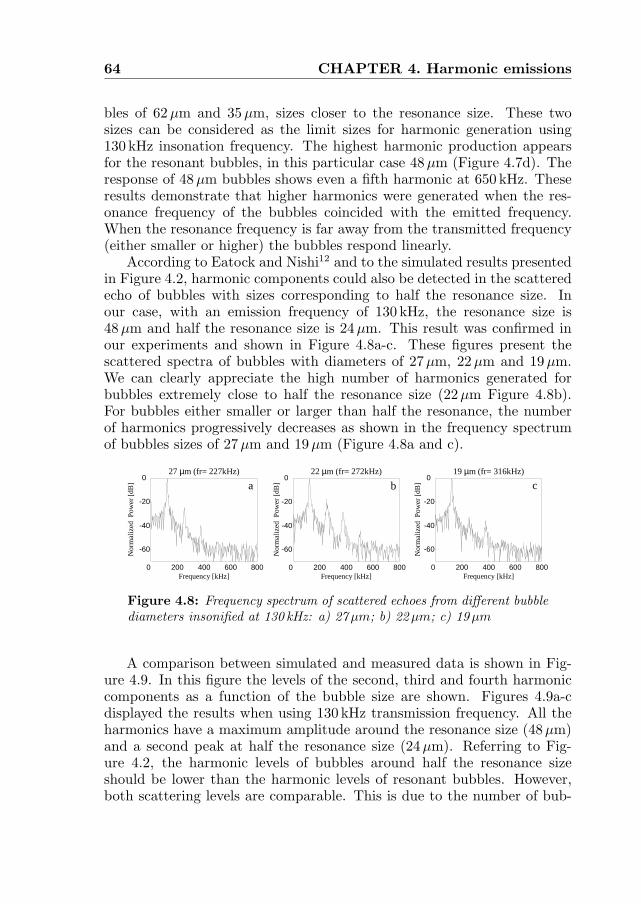
64 CHAPTER 4. Harmonic emissions
bles of 62µm and 35µm, sizes closer to the resonance size. These twosizes can be considered as the limit sizes for harmonic generation using130 kHz insonation frequency. The highest harmonic production appearsfor the resonant bubbles, in this particular case 48µm (Figure 4.7d). Theresponse of 48µm bubbles shows even a fifth harmonic at 650 kHz. Theseresults demonstrate that higher harmonics were generated when the res-onance frequency of the bubbles coincided with the emitted frequency.When the resonance frequency is far away from the transmitted frequency(either smaller or higher) the bubbles respond linearly.
According to Eatock and Nishi12 and to the simulated results presentedin Figure 4.2, harmonic components could also be detected in the scatteredecho of bubbles with sizes corresponding to half the resonance size. Inour case, with an emission frequency of 130 kHz, the resonance size is48 µm and half the resonance size is 24µm. This result was confirmed inour experiments and shown in Figure 4.8a-c. These figures present thescattered spectra of bubbles with diameters of 27µm, 22 µm and 19µm.We can clearly appreciate the high number of harmonics generated forbubbles extremely close to half the resonance size (22µm Figure 4.8b).For bubbles either smaller or larger than half the resonance, the numberof harmonics progressively decreases as shown in the frequency spectrumof bubbles sizes of 27µm and 19µm (Figure 4.8a and c).
0 200 400 600 800
-60
-40
-20
0
0 200 400 600 800
-60
-40
-20
0
0 200 400 600 800
-60
-40
-20
0
Frequency [kHz]
27 µm (fr= 227kHz) 22 µm (fr= 272kHz) 19 µm (fr= 316kHz)
a cb
Nor
mal
ized
Pow
er [
dB]
Frequency [kHz] Frequency [kHz]
Nor
mal
ized
Pow
er [
dB]
Nor
mal
ized
Pow
er [
dB]
Figure 4.8: Frequency spectrum of scattered echoes from different bubblediameters insonified at 130 kHz: a) 27µm; b) 22µm; c) 19µm
A comparison between simulated and measured data is shown in Fig-ure 4.9. In this figure the levels of the second, third and fourth harmoniccomponents as a function of the bubble size are shown. Figures 4.9a-cdisplayed the results when using 130 kHz transmission frequency. All theharmonics have a maximum amplitude around the resonance size (48µm)and a second peak at half the resonance size (24µm). Referring to Fig-ure 4.2, the harmonic levels of bubbles around half the resonance sizeshould be lower than the harmonic levels of resonant bubbles. However,both scattering levels are comparable. This is due to the number of bub-
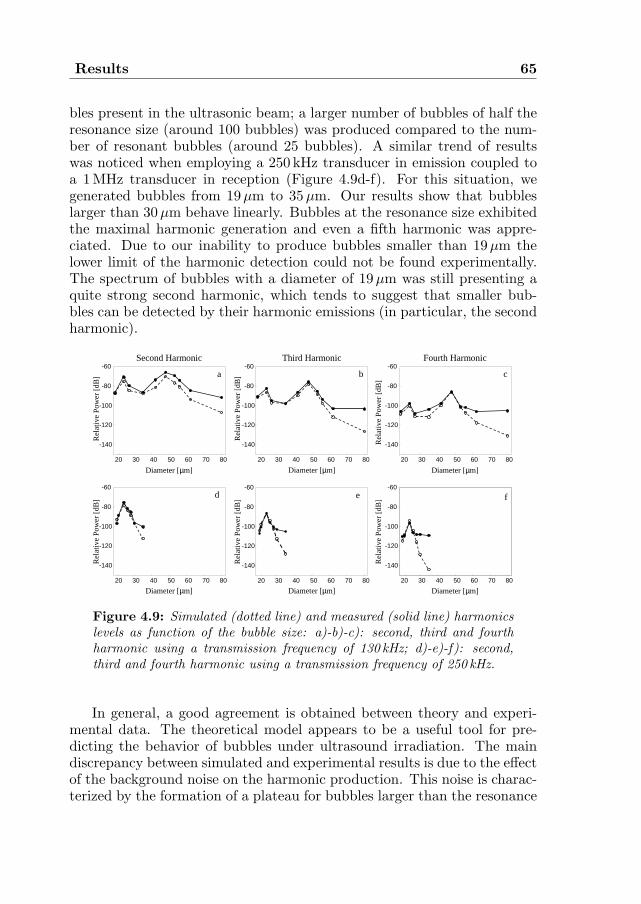
Results 65
bles present in the ultrasonic beam; a larger number of bubbles of half theresonance size (around 100 bubbles) was produced compared to the num-ber of resonant bubbles (around 25 bubbles). A similar trend of resultswas noticed when employing a 250 kHz transducer in emission coupled toa 1 MHz transducer in reception (Figure 4.9d-f). For this situation, wegenerated bubbles from 19µm to 35µm. Our results show that bubbleslarger than 30µm behave linearly. Bubbles at the resonance size exhibitedthe maximal harmonic generation and even a fifth harmonic was appre-ciated. Due to our inability to produce bubbles smaller than 19µm thelower limit of the harmonic detection could not be found experimentally.The spectrum of bubbles with a diameter of 19µm was still presenting aquite strong second harmonic, which tends to suggest that smaller bub-bles can be detected by their harmonic emissions (in particular, the secondharmonic).
20 30 40 50 60 70 80 20 30 40 50 60 70 8020 30 40 50 60 70 80
20 30 40 50 60 70 80 20 30 40 50 60 70 80 20 30 40 50 60 70 80
-140
-120
-100
-80
-60
-140
-120
-100
-80
-60
-140
-120
-100
-80
-60
-140
-120
-100
-80
-60
-140
-120
-100
-80
-60
-140
-120
-100
-80
-60
Diameter [µm]
Second Harmonic Third Harmonic Fourth Harmonic
a b
fe
c
d
Diameter [µm]
Diameter [µm]
Diameter [µm]
Diameter [µm]
Diameter [µm]
Rel
ativ
e P
ower
[dB
]
Rel
ativ
e P
ower
[dB
]
Rel
ativ
e P
ower
[dB
]
Rel
ativ
e P
ower
[dB
]
Rel
ativ
e P
ower
[dB
]
Rel
ativ
e P
ower
[dB
]
Figure 4.9: Simulated (dotted line) and measured (solid line) harmonicslevels as function of the bubble size: a)-b)-c): second, third and fourthharmonic using a transmission frequency of 130 kHz; d)-e)-f): second,third and fourth harmonic using a transmission frequency of 250 kHz.
In general, a good agreement is obtained between theory and experi-mental data. The theoretical model appears to be a useful tool for pre-dicting the behavior of bubbles under ultrasound irradiation. The maindiscrepancy between simulated and experimental results is due to the effectof the background noise on the harmonic production. This noise is charac-terized by the formation of a plateau for bubbles larger than the resonance

66 CHAPTER 4. Harmonic emissions
size. This plateau is particularly present in the third and fourth harmoniclevels and appears as a limitation to the detection of harmonic compo-nents. Some general comments can be made regarding the harmonic levelsas function of the embolus size independently of the transmitted frequency.The second harmonic levels (Figure 4.9a and d) exhibit a broad peak, re-vealing that a large range of bubble sizes can generate a second harmonic.For the third harmonic (Figure 4.9b and e) this peak is narrower due tothe fact that only fewer bubbles are able to scatter at the third harmonicfrequency. The fourth harmonic (Figure 4.9c and f) is generated only bybubbles very close to the resonance size and the fifth harmonic is producedexclusively by resonant bubbles. This demonstrates that higher harmonicsare more sensitive in sizing the bubbles. Therefore, we propose to use thelower harmonics (second or third) to indicate the presence of circulatingbubbles and higher harmonics (fourth or fifth) for size determination.
4.5 Conclusions
This chapter demonstrates that the nonlinear behavior of the bubbles (theformation of harmonic components in the frequency spectrum of the scat-tered echo) may be applicable for the detection and discrimination be-tween different bubble sizes. The use of low frequency transducers offerstwo main advantages. First, low frequencies generate negligible distortionsdue to nonlinear propagation. Therefore, any second harmonic containedin the received signals is only due to the nonlinear response of the bubblesand cannot be attributed to nonlinear propagation. Second, low frequen-cies are much closer to the resonance frequencies of gaseous emboli and,consequently, the acoustic pressure threshold needed to induce nonlinearvibrations of bubbles is reduced.
The technique proposed to detect and characterize circulating emboli isbased on the bubble’s harmonic scattering. The study of the fundamentalcomponent of the frequency spectrum was not included in this chapter.The backscattered echo at the fundamental frequency includes the contri-bution of all particles present in the ultrasound beam, regardless of sizeor nature (gaseous or solid). Thus, the fundamental component can onlybe correlated to the presence of moving particles in the flow, but cannotbe used to characterize them. Discrimination between solid and gaseousemboli is performed by monitoring the harmonic emissions: when the fre-quency spectrum of the backscattered echo exhibits a second (and higherharmonics) component, the particles can be identified as gas emboli be-cause solid particles scatter only linearly. The fourth or fifth harmonic isused to estimate the gaseous embolus size. The fifth harmonic appears

Conclusions 67
to be the most sensitive estimator: bubble size can be evaluated with amaximal deviation of ±2µm from resonating bubbles.
As in previous studies, the presented results show that ultrasonic meth-ods exploiting the nonlinearity of the bubbles are sensitive only to specificbubble populations. As an example, only bubble diameters ranging from30 µm to 19µm insonified at 250 kHz can generate a second harmonic com-ponent, and other bubble populations remain undetectable. Nevertheless,the use of two different transducers allows a detection of a larger inter-val of sizes: with 130 kHz and 250 kHz, bubbles from less than 19µm upto 62µm could be detected by selecting the second harmonic frequency.Larger bubbles behave linearly and cannot be identified as gaseous em-boli. Bubbles smaller than 19µm could not be generated. Thus, noneexperimental conclusion can be made concerning the lower limit of de-tectable bubbles with the current frequency selection. Resonating bubblescan be selectively detected using the fourth or fifth harmonic. Operatingat 130 kHz, bubble diameters of 48µm and 24µm scatter at the fourth andfifth harmonic frequencies. Operating at 250 kHz, only bubbles of 24µmshow high harmonic components in their response. Consequently the useof different driving frequencies presents the opportunity to detect a widerrange of bubble diameter and to discriminate between different bubblepopulations.
The present results demonstrate the feasibility of this technique foremboli detection, characterization and sizing. The occurrence of a secondharmonic in the frequency spectrum of the received echo allows the detec-tion of gaseous emboli and their distinction from other moving particles(particulate emboli). At this stage in our study, only bubbles generating atleast a second harmonic can be differentiated from solid particles. Otherbubbles (size not close enough to the resonance size) behave linearly andtheir frequency spectra would be identical to those of solid particles. Thus,lower frequencies should be adopted to detect bubbles larger than 62µmand higher frequencies should be selected to characterize bubbles on theorder of few micrometers.
A second orientation of our studies will be to develop a complete mul-tifrequency technique for the detection and differentiation of circulatinggaseous and solid emboli. The subharmonic emission from gaseous bubblesalso deserves further attention. Theory predicts that under certain condi-tions (frequency, excitation pulse, acoustic pressure), specific gas bubblescan scatter at half the transmitted frequency. This property could also beapplied to the detection and characterization of gaseous emboli.

68 CHAPTER 4. Harmonic emissions
References
1. W.G. Austen and D.H. Howry, “Ultrasound as a method to detect bubblesor particulate matter in the arterial line during cardiopulmonary bypass”,J Surg Res, vol. 5, no. 6: pp. 283-284, 1965.
2. M.P. Spencer, S.D. Campbell, J.L. Sealey, F.C. Henry, and J. Lindberg,“Experiments on decompression bubbles in the circulation using ultrasonicand electromagnetic flowmeter”, J Occup Med, vol. 11, no. 5: pp. 238-244,1969.
3. H. Markus, A. Loh, and M. Brown, “Detection of circulating cerebral emboliusing Doppler ultrasound in a sheep model”, J Neuro Sci, vol. 122, no. 1:pp. 117-124, 1994.
4. M.A. Moehring and J.R. Klepper, “Pulse Doppler ultrasound detec-tion, characterization and size estimation of emboli in flowing blood”,IEEE Trans Biomed Eng, vol. 41, no. 1: pp. 35-44, 1994.
5. D. Russell, R. Brucher, K.P. Madden, W.M. Clark, P.M. Sandset, andJ.A. Zivin, “The intensity of the Doppler signal caused by arterial embolidepends on embolus type and size”, Stroke, vol. 23, no. 1: pp. 158, 1992.
6. J.L. Smith, D.H. Evans, P.R.F. Bell, and A.R. Naylor, “A comparison offour methods for distinguishing Doppler signals from gaseous and particu-late emboli”, Stroke, vol. 29, no. 6: pp. 1133-1138, 1998.
7. T.G. Leighton, “The Acoustic Bubble”, London Academic Press Limited,1994.
8. W. Fairbank and M. Scully, “A new noninvasive technique for cardiacpressure measurement: resonant scattering of ultrasound from bubbles”,IEEE Trans Biom Eng, vol. 24, no. 2: pp. 107-110, 1977.
9. J.W. Horton and C.H. Wells, “Resonance ultrasonic measurements of mi-croscopic gas bubbles”, Aviat Space Environ Med, vol. 47, no. 7: pp. 777-787, 1976.
10. D.L. Miller, “Ultrasonic detection of resonant cavitation bubbles in a flowtube by their second harmonic emissions”, Ultrasonics, vol. 21, no. 5:pp. 217-224, 1981.
11. D.L. Miller, A.R. Williams, and D.R. Gross, “Characterization of cavita-tion in a flow-through exposure chamber by means of a resonant bubbledetector”, Ultrasonics, vol. 22, no. 5: pp. 224-230, 1984.
References 69
12. B.C. Eatock and R.Y. Nishi, “Numerical studies of the spectrum of lowintensity ultrasound scattered by bubbles”, J Acoust Soc Am, vol. 77, no. 5:pp. 1692-1701, 1985.
13. B. Hills, B. Kanani, and P. James, “Velocity of ultrasound as an indicatorof bubble content”, Undersea Biomed Res, vol. 10, no. 1: pp. 17-22, 1983.
14. V.L. Newhouse and P.M. Shankar, “Bubble sizing measurements using thenonlinear mixing of two frequencies”, J Acoust Soc Am, vol. 75, no. 5:pp. 1473-1477, 1984.
15. T. Leighton, R. Lingard, A. Walton, and J. Field, “Acoustic bubble sizingby combination of subharmonic emissions with imaging frequency”, Ultra-sonics, vol. 29, no. 4: pp. 319-323, 1991.
16. N. de Jong and L. Hoff, “Ultrasound scattering properties of albunex mi-crospheres”, Ultrasonics, vol. 31, no. 3: pp. 175-181, 1993.
17. P.A. Frost and E.Y. Harper, “Acoustic radiation from surfaces oscillatingat large amplitude and small Mach number”, J Acoust Soc Am, vol. 58,no. 2: pp. 318-325, 1975.
18. H. Medwin, “Counting bubbles acoustically: a review”, Ultrasonics, vol. 15,no. 1: pp. 7-13, 1977.


Chapter5Emboli characterization using
subharmonic and ultraharmonicemissions
Abstract
Emboli detection and characterization is of importance for different pa-tients, such as those undergoing carotid or cardiac surgery. The emboli oc-cur as particulate or gaseous matters. To select the appropriate treatmentand reduce the risk of embolism, it is essential to first detect, then classifyand, ultimately size the emboli. We propose in this chapter an approachto characterize and size the emboli based on their nonlinear properties.Gaseous emboli were produced by generating single and uniform air bub-bles. These bubbles had diameters ranging from 40µm to 120µm. Acous-tic measurements were carried out and special attention was devoted to thegeneration of subharmonic and first ultraharmonic components for gas bub-bles of different sizes and at different acoustic pressures. For the scanningfrequency and the applied acoustic pressures used in this study, only bubblesranging from 65µm up to 110µm are capable of generating a subharmonicand an ultraharmonic frequency components. However, gaseous emboli out-side this range behave differently. In conclusions, such an approach can beused to provide information needed to classify and size emboli.
Based on the publication: “Subharmonic and ultraharmonic emissions for embolidetection and characterization” by P. Palanchon, A. Bouakaz, J. Klein and N. de Jong,Ultrasound in Medicine and Biology, vol. 29, no. 3: pp. 417-425, 2003.
71

72 CHAPTER 5. Subharmonic emissions
5.1 Introduction
For several years, an increased interest has been devoted to the detectionand characterization of gas embolism within a variety of clinical areas.Trans-Cranial Doppler (TCD) is now recognized as a reliable tool for de-tecting the occurrence of cerebral microemboli. This ultrasonic techniqueis based on the appearance of high-intensity transient signals in the TCDwaveform as indicators of circulating emboli. Classifying and sizing em-boli is critical for determining the type and size of emboli causing themost important brain damage, for selecting patients who present a highrisk of stroke and, hence, for choosing the appropriate treatment (anti-coagulants, antiplatelets). Extensive studies and developments have beencarried out in a perspective to detect, characterize and possibly size cir-culating microemboli using TCD. These investigations have attributed toembolic signals different features (velocity, time duration, peak intensity,frequency content) that were extracted from the Doppler signals and an-alyzed as a function of their composition and size1−4. These methods didnot lead to convincing results with respect to characterization and/or siz-ing of microemboli. Therefore, non- Doppler techniques may appear asan attractive alternative that can provide additional information from em-bolic signals. Such methods are based on the analysis of the radiofrequency(RF) signals instead of the commonly used Doppler signals. This new fieldof research can take advantage from the extensive research carried out us-ing gas microbubbles. Indeed, for decades, many techniques have beenproposed in the literature to detect gas bubbles through their nonlinearbehavior5. These approaches were based on theoretical investigations aswell as experimental data. Theory predicts that under certain acoustic con-ditions (transmitted frequency, pressure, pulse duration), specific bubblesvibrate nonlinearly. This nonlinearity is characterized by the generationof harmonic (2f, 3f), subharmonic (f/2) and ultraharmonic (3f/2, 5f/2)components in the frequency spectrum of the scattered signal from the bub-ble. Approaches based on combined frequencies technique6 appeared as asensitive tool to size air bubbles. Leighton7 applied this technique experi-mentally by considering the nonlinear behavior of the bubbles. The bubblewas simultaneously insonated by two different frequencies: the ’imaging’frequency, wi, fixed and selected far from the resonance frequency of thebubble and the ’pumping’ frequency, wp. The pumping frequency wasscanned across a frequency band where the bubble resonance is expectedto lie. When the sum and difference component at the subharmonic fre-quency (wi±wp/2) was maximal, the value of the pumping frequency wasdefined as the resonance frequency of the bubble and the size was there-fore estimated. The main disadvantage of this technique comes from the

Introduction 73
complex apparatus required to acquire data. Three different ultrasonicelements were involved: one transducer and one loudspeaker for transmit-ting the ’imaging’ and the ’pumping’ frequency and one hydrophone todetect the echo backscattered by the bubbles. Furthermore, this methodcan be used only to size a single bubble at a time. It cannot be applied tothe detection of various bubble sizes simultaneously, as when a cluster ofbubbles is produced.
In Chapter 4, a new approach to detect gaseous emboli by taking ad-vantage of the higher harmonic components generated by the gaseous em-boli have been proposed. The gaseous bubbles were insonified with lowfrequency ultrasound waves between 130 kHz and 250 kHz. Depending ontheir size, the frequency spectrum of the scattered echo included someharmonic components. Based on experimental measurements and mod-elling, off-resonance bubbles oscillated only linearly while bubbles closeto the resonance size produced a second harmonic and higher harmoniccomponents. Therefore, using specific scanning frequencies, selective bub-ble sizes could be discriminated from other moving particles or bubbles.It is known from the literature that nonlinear oscillations of gas bubblescan create also components at the subharmonic (f/2) and ultraharmonic(3f/2) frequencies. Such components have been studied mainly throughnumerical investigations8−9. Eller10 and Neppiras11 studied theoreticallythe subharmonic and other low frequencies components generation. Theirresults emphasized the fact that an acoustic threshold is required to gener-ate subharmonic and ultraharmonic component. This threshold is minimalfor bubble diameters close to twice the resonance size of the transmittedfrequency while other bubble diameters can produce subharmonic and ul-traharmonic component but for much higher applied acoustic pressures.
In this chapter, we propose to detect and size circulating emboli usingthe subharmonic and the first ultraharmonic components. This approach,which is a non-Doppler technique, is based on RF signals scattered bythe embolus. By focusing on all these nonlinear components, detection ofgas emboli and its differentiation from solid particles become realizable.Moreover, the success of sizing different gas emboli increases. It is knownfrom the literature that solid particles do not scatter nonlinear frequencycomponents. In addition, even at high acoustic pressures, no subharmonicor ultraharmonic component can be generated from nonlinear propagationeffects. For that purpose, we have investigated the nonlinear behavior offlowing gas bubbles over a wide range of diameters: between 40µm and150µm. The bubbles were produced using an experimental bubble makerwhich allows to make bubbles with highly uniform sizes. The subharmonic(f/2) and first ultraharmonic (3f/2) generation phenomena are partic-ularly emphasized to better understand their physical properties. Their

74 CHAPTER 5. Subharmonic emissions
occurrence was studied as a function of the bubble sizes as well as thetransmitted acoustic pressures for a scanning frequency of 130 kHz. Theexperimental results have been compared to a simplified theoretical model,the Keller equation, commonly used to predict the behavior of free gasbubbles. Such frequency components are used to detect and size selectivebubble populations. We will demonstrate that with a single frequency,using properties of subharmonic, ultraharmonics and harmonics, bubblesaround the resonance size and around twice the resonance size can be de-tected from the surrounding medium. This property reduces the numberof frequencies required to characterize bubbles over a wide range of bubblesizes and increase further the confidence of the technique.
5.2 Methods
Theoretical Model
To study the dynamics of the free gas bubble, a model developed by Kelleris used as the theory. This model was extensively described in Chapter3 and the reader is asked to refer to this chapter for further details. Theradius-time solution R(t) of the Equations 3.1 and 3.2 was used as thetheoretical basis of this chapter. The predicted scattered echo from thebubbles is determined using a simplified relationship between the instan-taneous radius of the bubble R(t) and the wall velocity ˙R(t). When theassumption of a large displacement amplitude is made but the Mach num-ber is small, the echo is proportional to the time derivative of R2R and isgiven by the following formula12:
E(t) =ρ
z(R(t)2 ¨R(t) + 2R(t) ˙R(t)
2) (5.1)
where z represents the distance between the bubble and the transducer.
Experimental Setup
A “bubble maker”, based on the gas injection principle, was developed toproduce different populations of calibrated microbubbles (Chapter 2). Byvarying either the type of micropipette or the liquid velocity, bubbles withdiameters ranging from 40µm to 150µm were produced. These bubbleswere found to have a very narrow size distribution (90% lie within ±6µmaround the mean diameter). The “bubble maker” is directly connectedto the bottom of a water tank containing degassed water. A stream ofbubbles is allowed to rise freely in water as they are released from the

Methods 75
micropipette’s tip. An imaging system composed of a variable zoom mi-croscope (Scienscope, Chino, USA) coupled to a CCD camera (SONY) wasused to record images of the flowing bubbles. Imaging frames were savedon a personal computer for measurements of the bubble diameters andnumbers. The experimental acoustic setup is shown in Figure 5.1. A sin-gle element unfocused transducer operating at 130 kHz (Matec InstrumentCompanies Inc, Northborough, USA) with a nominal diameter of 31 mmwas used in transmission mode. A hydrophone, oriented at an angle of60 degrees to the direction of the insonating wave was used in a passivereception mode. The active element of the hydrophone had a diameterof 4 mm and its sensitivity remains constant over a frequency bandwidthfrom 40 kHz up to 1 MHz. The water tank was filled with degassed water.The stream of bubbles was positioned at a distance of 2 cm from the trans-ducer surface, which corresponds to the distance where maximal acousticpressure in the axial beam profile occurs. A narrow band sine wave burstof 30 cycles was generated by an arbitrary waveform generator (LW 420A,Lecroy, Chesnut Ridge, NY, USA). The pulse repetition rate was fixed at200ms. This signal was then amplified by a RF power amplifier (Model2100L, ENI, Rochester, USA) and tuned through a dedicated tuning circuitto the transmitting transducer. The amplitude of the transmitted signalcould be adjusted by using separate variable attenuators (355C/D, HP,Palo Alto, USA). Depending on the attenuator position, various acousticpressures were measured at the region of interest. The measured peak topeak pressure ranged from 110 kPa up to 410 kPa. The response of thebubbles received by the hydrophone was sampled on a digital oscilloscope(Model 9400A, Lecroy) with a sampling rate of 50 MHz. A Pulser Genera-tor (PM 5716, Philips, Stockholm, Sweden) was used for synchronization.The response of the bubbles was averaged over 10 successive traces andacquired on a Pentium III personal computer for further analysis. Thestream of bubbles produced is very uniform and the bubble distribution(size and spatial distribution) remains constant over the acquisition pe-riod. Therefore, for each pulse, we can consider that the same bubblepopulation is insonified. We assumed that each bubble contained in theultrasound beam could be considered as an individual scatterer and thatmultiple scattering is negligible. Thus, the intensity of the scattered echoof N bubbles of similar size is given by the echo of one bubble multiplied bytheir number N13. The acquired backscattered echo was hence divided bythe number of bubbles present over a distance of 1 mm around the centerof the ultrasound beam. Over this distance, the acoustic pressure remainsconstant and corresponds to the maximal pressure measured.

76 CHAPTER 5. Subharmonic emissions
Pulser generatorOscilloscopePC
Pulse Generator
Power amplifier ENI
Attenuator
Tuning
Hydrophone
Transducer
Bubbles
Figure 5.1: Experimental acoustical setup.
5.3 Results and Discussions
Figure 5.2 displays the frequency spectra of the backscattered signals frombubbles with six different sizes: 120µm, 105µm, 87µm, 75µm, 65µm and50 µm. The transmitted pressure was 310 kPa and the scanning frequency130 kHz. According to the resonance frequency formula (Equation 4.2),the corresponding resonance size is 48µm. Therefore, the bubble sizes cur-rently investigated are above and below twice the resonance size (96µm).For bubbles much larger than twice the resonance size as is the case for abubble around 120µm, the backscattered signal contains only the trans-mitted fundamental frequency component (Figure 5.2a). At this setting,such bubbles behave only linearly and do not generate subharmonic orultraharmonic components. However, a very mild second harmonic com-ponent is seen but is 50 dB lower than the fundamental component. Whenthe irradiated bubble is slightly smaller, in this particular case 105µm(Figure 5.2b, a small ultraharmonic component at 195 kHz emerges fromthe background noise. However, no subharmonic component is seen yetfor this size. This observation tends to suggest than the ultraharmoniccomponent can be generated by the bubble earlier than the subharmoniccomponent. For the bubbles with a diameter of 87µm), which is closeto twice the theoretical resonance size (Figure 5.2c), strong subharmonicand ultraharmonics (first and even second ultraharmonic) components canbe clearly appreciated in the frequency spectrum. The subharmonic andultraharmonic components are respectively 20 db and 30 db below the fun-damental. As the bubble sizes are getting smaller than twice the resonancesize, the levels of subharmonic and ultraharmonic components are progres-

Results and Discussions 77
sively decreasing until their disappearance in the background noise. Thisprocess can be observed in successive spectra of bubbles of 75µm, 65µmand 50µm (Figure 5.2d-f). However, a different tendency is observed forthe second harmonic component. Indeed, the largest bubble used here(120µm) shows a very tiny second harmonic energy. For bubble with asize close to twice the resonance size, a significant amount of second har-monic energy is generated and then we clearly notice a decrease in thesecond harmonic energy when the bubbles get smaller. The second har-monic level increases for the smallest bubble used here (50µm) that is veryclose to the resonance size (48µm). This nonlinear behavior tendency as
0 0 050 100 150 200 250 300 350 50 100 150 200 250 300 350 50 100 150 200 250 300 350
00
-60
-40
-20
0
-60
-40
-20
0
-60
-40
-20
0
-60
-40
-20
0
-60
-40
-20
0
050 100 150 200 250 300 35050 100 150 200 250 300 350 50 100 150 200 250 300 350
-60
-40
-20
0
a b c
d e f
Frequency [kHz] Frequency [kHz]Frequency [kHz]
Frequency [kHz] Frequency [kHz]Frequency [kHz]
Nor
mal
ized
Am
plit
ude
[dB
]N
orm
aliz
ed A
mpl
itud
e[d
B]
Nor
mal
ized
Am
plit
ude
[dB
]N
orm
aliz
ed A
mpl
itud
e[d
B]
Nor
mal
ized
Am
plit
ude
[dB
]N
orm
aliz
ed A
mpl
itud
e [d
B]
Figure 5.2: Measured frequency spectra of scattered echoes for differ-ent bubble diameters insonified at 130 kHz and 310 kPa: a) 120µm, b)105µm, c) 87µm, d) 75µm, e) 65µm and f) 50µm.
a function of the bubbles’ sizes was also noticed for the harmonic compo-nents at integer multiples of the fundamental frequency (2, 3, 4) as alreadydescribed in Chapter 4. The higher harmonic generation results showedthat solid emboli and off-resonance bubbles scatter only linearly and henceproduce echoes without harmonics. When the diameter of the bubbles isgetting closer to the resonant size, higher harmonics are progressively pro-duced (second and third harmonics) and for resonating bubbles, even afourth and a fifth harmonic could be measured. The results shown hereclearly demonstrate that bubble smaller than twice the resonance size canbe distinguished from bubble larger than twice the resonance size. The

78 CHAPTER 5. Subharmonic emissions
main difference is situated at the level of the second harmonic component.As an example, bubbles of 120µm (larger than twice the resonance size)show a very small peak at the second harmonic frequency, 260 kHz, whilebubbles of 65µm and 50µm (smaller than twice the resonance size butmuch close to the resonance size) scatter a significant energy at this fre-quency. Thus, even if no subharmonic and/or ultraharmonic componentsare detected in the scattered frequency spectrum, size discrimination canbe performed by selecting the generation of a second harmonic componentor even higher harmonics (3f, 4f).
Figure 5.3 shows, for the scanning frequency of 130 kHz, the sub-harmonic (at 65 kHz) and the first ultraharmonic (195 kHz) levels of thebackscattered signal as function of the bubble size for three different acous-tic pressures: 210 kPa (¤), 250 kPa (4) and 310 kPa (O). The bubble di-ameters range from 40µm up to 105µm. For acoustic pressures below210 kPa, no subharmonic component was detected for all the sizes. Thispressure corresponds to the minimal measured level required to gener-ate subharmonic and ultraharmonic for these bubble sizes when they areinsonified at 130 kHz. At a transmitted acoustic pressure of 210 kPa, amaximum energy is generated at the subharmonic frequency for bubblesaround 92µm as shown in Figure 5.3a. This size corresponds to twice theexperimental resonance size. For bubbles slightly larger or smaller than92 µm, the scattered subharmonic component decays rapidly and only bub-bles between 80µm and 98µm in diameter can still oscillate at half thetransmitted frequency. For bubbles below 80µm, the measured bubblelevel remains constant, which is equal to the noise level and the limiteddynamic range of the experimental set-up. When the applied pressure isincreased to 250 kPa, a wider range of bubble sizes produces a subharmoniccomponent (70µm and 105µm). However, we also observe that the max-imal subharmonic component occurs for a bubble size of 85µm, which isslightly smaller than twice the experimental resonance size (92µm). Again,for much smaller bubbles the subharmonic level remains constant. As thepressure increased to 310 kPa, the maximal peak is shifted to 80µm andthe subharmonic level becomes extremely wide: bubbles between 58µmup to 110µm generate a subharmonic component. The shift in size wheremaximal subharmonic generation occurs when the applied acoustic pres-sure increased might be attributed to a different resonance frequency. In-deed, to compute the resonance frequency, we used the expression given byMedwin14. This expression is derived using linear theory, and we believethat this formula is not valid anymore at these high acoustic pressures, andthe natural resonance frequency of a given bubble is slightly shifted to alower value. Lauterborn9 also mentioned such a shift for the ultraharmoniccomponent. He explained this phenomenon by considering that, at high
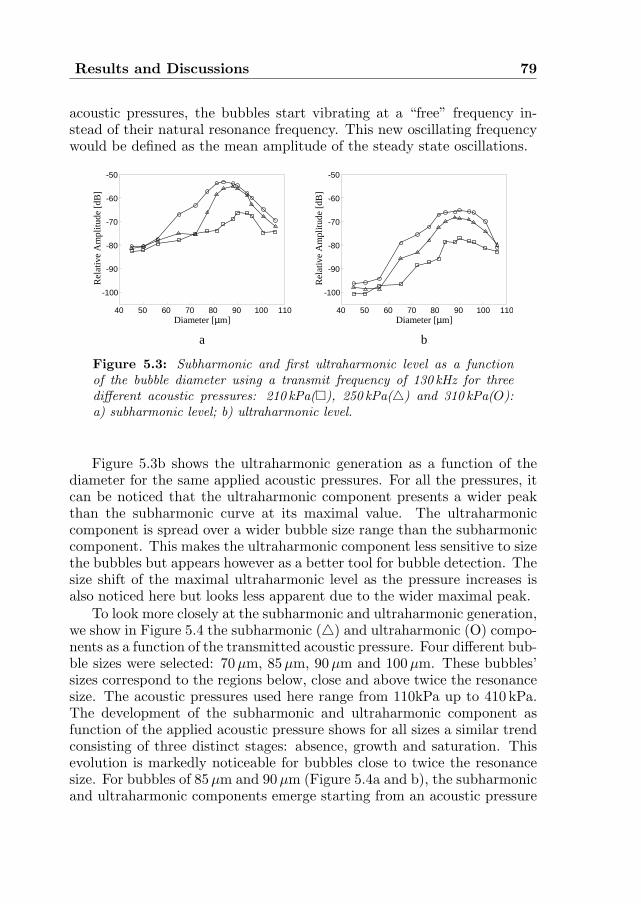
Results and Discussions 79
acoustic pressures, the bubbles start vibrating at a “free” frequency in-stead of their natural resonance frequency. This new oscillating frequencywould be defined as the mean amplitude of the steady state oscillations.
40 50 60 70 80 90 100 110
-100
-90
-80
-70
-60
-50
40 50 60 70 80 90 100 110
-100
-90
-80
-70
-60
-50
Diameter [µm]
Rel
ativ
e A
mpl
itude
[dB
]
a b
Diameter [µm]R
elat
ive
Am
plitu
de [
dB]
Figure 5.3: Subharmonic and first ultraharmonic level as a functionof the bubble diameter using a transmit frequency of 130 kHz for threedifferent acoustic pressures: 210 kPa(¤), 250 kPa(4) and 310 kPa(O):a) subharmonic level; b) ultraharmonic level.
Figure 5.3b shows the ultraharmonic generation as a function of thediameter for the same applied acoustic pressures. For all the pressures, itcan be noticed that the ultraharmonic component presents a wider peakthan the subharmonic curve at its maximal value. The ultraharmoniccomponent is spread over a wider bubble size range than the subharmoniccomponent. This makes the ultraharmonic component less sensitive to sizethe bubbles but appears however as a better tool for bubble detection. Thesize shift of the maximal ultraharmonic level as the pressure increases isalso noticed here but looks less apparent due to the wider maximal peak.
To look more closely at the subharmonic and ultraharmonic generation,we show in Figure 5.4 the subharmonic (4) and ultraharmonic (O) compo-nents as a function of the transmitted acoustic pressure. Four different bub-ble sizes were selected: 70µm, 85µm, 90µm and 100µm. These bubbles’sizes correspond to the regions below, close and above twice the resonancesize. The acoustic pressures used here range from 110kPa up to 410 kPa.The development of the subharmonic and ultraharmonic component asfunction of the applied acoustic pressure shows for all sizes a similar trendconsisting of three distinct stages: absence, growth and saturation. Thisevolution is markedly noticeable for bubbles close to twice the resonancesize. For bubbles of 85µm and 90µm (Figure 5.4a and b), the subharmonicand ultraharmonic components emerge starting from an acoustic pressure

80 CHAPTER 5. Subharmonic emissions
Rel
ativ
e A
mpl
itude
[dB
]
Acoustic Pressure [kPa]
Rel
ativ
e A
mpl
itude
[dB
]
Acoustic Pressure [kPa]
Rel
ativ
e A
mpl
itude
[dB
]
Acoustic Pressure [kPa]
Rel
ativ
e A
mpl
itude
[dB
]
Acoustic Pressure [kPa]
c
a b
d-100
-90
-80
-70
-60
-50
-100
-90
-80
-70
-60
-50
100 150 200 250 300 350 400 450 100 150 200 250 300 350 400 450-100
-90
-80
-70
-60
-50
100 150 200 250 300 350 400 450 100 150 200 250 300 350 400 450-100
-90
-80
-70
-60
-50
Figure 5.4: Subharmonic (4) and ultraharmonic (O) levels as a functionof the transmitted acoustic pressure using a scanning frequency of 130 kHz.Four different bubble sizes were studied: a) 85µm; b) 85µm; c) 70µmand d) 100µm.
around 210 kPa. Between 210 kPa and 250 kPa, both components growvery rapidly with an increase up to 20 dB. For much larger acoustic pres-sures, the saturation phase is reached and constant levels are maintained.For a bubble size smaller than twice the resonance size, in this particularcase a 70 µm bubble (Figure 5.4c), the subharmonic and ultraharmoniccomponents behave differently. The subharmonic level rapidly grows be-tween 210 kPa and 300 kPa above which the slope of growth is lower. Forthis size, we notice that the subharmonic component continues developingand up to the maximal pressure used here (410 kPa), no saturation phasehas appeared. This behavior can be used to explain the shift in size atwhich a maximum subharmonic generation occurs when the acoustic pres-sure increased. Comparison of panels a and b with panel c shows that bub-bles with size close to twice the resonance size exhibit a saturation phase forpressures above 300 kPa, while bubbles smaller than twice the resonancesize still show an increase in their subharmonic component. Consequently,while the subharmonic level remains constant for bubble of twice the res-
Results and Discussions 81
onance size, it continues to grow for smaller bubbles giving hence a muchbroader range of bubbles oscillating at the subharmonic frequency. Prob-ably, the saturation phase for smaller bubbles will be reached for acousticpressures higher than (40 kPa). In contrary to the subharmonic compo-nent, the ultraharmonic component of the70µm bubble seems to reach asaturation trend starting from pressures above 300 kPa. For bubbles largerthan twice the resonance size, 100µm (Figure 5.4d), the subharmonic com-ponent shows a linear growth between 180 kPa and 250 kPa. Such bubblesare quite far from twice the resonance size and only generate a small sub-harmonic component for high pressures. A saturation phase also occursfor very high pressures. The ultraharmonic component can also be decom-posed into a rapid growth phase and a saturation phase. Nevertheless, ithas to be noticed that the ultraharmonic component is becoming as strongas the subharmonic component in the saturation phase which means thatthe ultraharmonic can be generated in larger amounts compared to thesubharmonic. For all bubble sizes, the ultraharmonic component is gen-erated slightly earlier the subharmonic component. Lauterborn9 has alsodemonstrated theoretically that for bubbles larger than 20µm the gener-ation of first ultraharmonic component required lower acoustic pressurethreshold compared to the subharmonic generation.
Figure 5.5 displays the simulated subharmonic and ultraharmonic com-ponents as function of the bubble size. The acoustic pressures were selectedto correspond to the measured amplitudes: 210 kPa (¤), 250 kPa (4) and(310 kPa) (O). The simulated curves are given here for illustration pur-poses. At the lowest acoustic pressure, 210 kPa, the subharmonic com-ponent exhibits a narrow peak around a bubble size of 96µm. This sizecorresponds to twice the theoretical resonance size as computed from theMedwin14 formula. Experimentally, the maximal subharmonic componentwas occurring for a bubble size slightly smaller than 92µm. As the pressureincreases a size shift of the maximal subharmonic level and a broadeningaround twice the resonance size can be observed. For the highest pressure,the subharmonic component saturated over a wide range of bubble size.The same trends of results are also obtained for the first ultraharmoniccomponent. These results corroborate the experimental data.
Figure 5.6 shows the required acoustic pressure to generate a subhar-monic component at a frequency of 130 kHz as a function of the bubblediameter. Simulations are shown in solid line and measurement points aregiven in circles. The acoustic pressure has been normalized to the minimalrequired acoustic pressure for bubbles at twice the resonance size. Thetheoretical curve as a V-shape. Its vertex corresponds to the size that isable to produce a subharmonic for the lowest acoustic pressure, in thatcase 96µm. As the acoustic pressure increases, a wider range of bubble

82 CHAPTER 5. Subharmonic emissions
70 80 90 100 110-40
-20
0
20
40
70 80 90 100 110-40
-20
0
20
40
Diameter [µm]
Rel
ativ
e A
mpl
itude
[dB
]
Diameter [µm]
Rel
ativ
e A
mpl
itude
[dB
]
a b
Figure 5.5: Simulated subharmonic and first ultraharmonic level as afunction of the bubble diameter using a transmitting frequency of 130 kHzfor three different acoustic pressures: 210 kPa (¤), 250 kPa(4) and310 kPa(O): a) subharmonic level; b) ultraharmonic level.
50 60 70 80 90 100 110 120
1
1.4
1.8
2.2
2.6
Diameter [µm]
Aco
usti
c Pr
essu
re /
Thr
esho
ld
Figure 5.6: Subharmonic generation as a function of the bubble size andthe required acoustic pressure with a transmitting burst of 30 cycles at130 kHz: simulated curve (solid line); experimental measurements (O);extrapolation of the measurements (dashed line).
sizes could generate a subharmonic component. This result is confirmed byprevious studies. We can also appreciate that the cone is not symmetric:bubbles smaller than twice the resonance size can produce a subharmonicfor lower pressures than bubbles larger than twice the resonance size. Theexperimental points show a similar tendency. However with the instrumen-tation used in the set-up, it was not possible to use much lower excitationacoustic pressure without having a significant noise at the subharmonic

Conclusions 83
frequency. The extrapolation of the experimental points, presented by adashed line, shows however that the minimal acoustic pressure for subhar-monic generation occurs for a bubbles size of 93µm. As explained abovein this section, the difference might be due to an experimental resonancefrequency different from the computed one. Nevertheless, the asymmetryof the theoretical curve is also visible with the experimental data. Thesecurves show that gas emboli around 90µm generate a subharmonic compo-nent for all the applied pressures. Nevertheless, for bubbles below 70µm orlarger than 100µm require much higher pressures, at least twice the lowestpressure, to produce a subharmonic component with significant signal tonoise ratio. This characteristic can be exploited as a sizing parameter.
5.4 Conclusions
To date, the detection of circulating microemboli is performed using TCDinstruments. This technique exploits only the Doppler signal extracted atthe fundamental frequency component. The properties of the gas emboliat the scanning fundamental frequency resemble to a large extent to thoseof solid emboli. As a consequence, gas particle detection becomes cumber-some when only the transmitted frequency is used. As shown in this study,gas emboli have the property of splitting and redistributing the insonat-ing energy into different components in the scattered acoustic spectrum.When the acoustic pressure is high enough, gas bubbles produce compo-nents at higher frequency (second harmonic and higher), the subharmonicfrequency and the ultraharmonic frequency. These newly generated fre-quency components are intrinsic to gas emboli only and are not shown bysolid emboli. In addition their generation depend on the size of the gaseousemboli. When bubbles are scanned at 130 kHz and with a transmittedacoustic pressure of 310 kPa, only bubbles between 65µm and 110µm canscatter at the subharmonic or the ultraharmonic frequency. Bigger bubblesstill behave only linearly and their nature cannot be characterized. On theother side, smaller bubbles (less than 70µm in this particular case), donot generate a subharmonic or an ultraharmonic component but a secondharmonic component can be observed in the frequency spectrum. Thiscomponent is also a characteristic of the nonlinear behavior of the bub-bles. Overall, for a scanning frequency of 130 kHz, bubbles smaller than110µm can be detected from the surrounding medium and classified as agaseous embolus.
The sizing procedure includes two different steps. A gross estimationof the bubble size can be obtained directly via the detection of the sub-harmonic, the ultraharmonic or higher harmonic components. As demon-

84 CHAPTER 5. Subharmonic emissions
strated in this chapter, only bubbles around twice the resonance size gener-ate a subharmonic or an ultraharmonic component. Furthermore, bubblesclose to the resonance size generate a second or higher harmonic compo-nents. The range of detectable bubble diameters is strongly dependent onthe transmitted acoustic pressure. Higher the acoustic pressure is, widerthe bubble size range will be. On the other hand, the sensitivity of thesizing estimation will decrease. A more precise estimation of the bubblesize can be obtained by changing and adapting two different parameters:the frequency and the acoustic pressure. By changing them in an iterativeprocess, the bottom of the triangle from Figure 5.6 can be reached whichgive a very accurate estimation of the bubble diameter. Other scanningfrequency would be required to characterize larger bubbles. It is withinthis context that we suggest the use of subharmonic, ultraharmonic andhigher harmonics components to detect an embolus, characterize its natureand ultimately determine its size.
Some discrepancies were noticed between the experimental and simu-lated results presented in this study. The most important difference occursfor the estimation of twice the resonance size. It can be explained by thefact that the equation used to compute the natural resonance frequencyis not valid anymore in this situation. The level of the simulated subhar-monic and ultraharmonic component as a function of the bubble size differsfrom those observed experimentally. For the study of higher harmonic pro-duction, a very good correlation was found between the simulated and themeasured results that validated the theoretical model for describing thenonlinear behavior of the bubbles (see Chapters 3 and 4). It is thoughtthat Keller equation is not well suited for the study of the subharmonicand ultraharmonic generation at the scanning frequency used here.
References
1. C. Lucchesi, G. Darbellay, J. Ponard, J.M. Vesin, J. Krayenbuehl, G. De-vuyst, and G. Dietler, “Solid/gas and size classification via inductive ma-chine learning: results and whereabouts”, Cerevasc Dis, vol. 11(suppl 3):pp. 1-47, 2001.
2. E.O. Belcher, “Quantification of bubbles formed in animals and man duringdecompression”, IEEE Trans Biomed Eng, vol. 27, no. 6: pp. 330-338, 1980.
3. M.A. Moehring, “Fundamental concepts regarding sizing and discrimina-tion of air bubbles and red cell aggregates using pulse Doppler ultrasound”,Echocardiography, vol. 13, no. 5: pp. 567-571, 1996.

References 85
4. D. Russell and R. Brucher, “Discrimination of cerebral microemboli”,Cerevasc Dis, vol. 11(suppl3): pp. 4, 2001.
5. D.L. Miller, “Ultrasonic detection of resonant cavitation bubbles in a flowtube by their second harmonic emissions”, Ultrasonics, vol. 21, no. 5:pp. 217-224, 1981.
6. V.L. Newhouse and P.M. Shankar, “Bubble sizing measurements using thenonlinear mixing of two frequencies”, J Acoust Soc Am, vol. 75, no. 5:pp. 1473-1477, 1984.
7. T.G. Leighton, A.D. Phelps, D.G. Ramble, and D.A. Sharpe, “Comparisonof the ability of eight acoustic techniques to detect and size a single bubble”,Ultrasonics, vol. 34, no. 6: pp. 661-667, 1996.
8. A. Prosperetti, “Nonlinear oscillations of gas bubbles in liquids: transientsolutions and the connection between harmonic signal and cavitation”,J Acoust Soc Am, vol. 57, no. 4: pp. 810-821, 1975.
9. W. Lauterborn, “Numerical investigation of nonlinear oscillations of gasbubbles in liquids”, J Acoust Soc Am, vol. 59, no. 2: pp. 283-293, 1976.
10. A. Eller and H.G. Flynn, “Generation of subharmonics of order one-halfby bubbles in a sound field”, J Acoust Soc Am, vol. 46, no. 3: pp. 722-727,1968.
11. E.A. Neppiras, “Subharmonic and other low frequency emissions from bub-bles in sound-irradiated liquids”, J Acoust Soc Am, vol. 46, no. 3: pp. 587-601, 1968.
12. P.A. Frost and E.Y. Harper, “Acoustic radiation from surfaces oscillatingat large amplitude and small Mach number”, J Acoust Soc Am, vol. 58,no. 2: pp. 318-325, 1975.
13. N. de Jong and L. Hoff, “Ultrasound scattering properties of albunex mi-crospheres”, Ultrasonics, vol. 31, no. 3: pp. 175-181, 1993.
14. H. Medwin, “Counting bubbles acoustically: a review”, Ultrasonics, vol. 15,no. 1: pp. 7-13, 1977.


Chapter 6Emboli detection using new
transducer designs
87


Chapter 6ASingle frequency transducer
Abstract
A specific transducer design has been developed to detect and characterizegaseous emboli using their nonlinear properties. It is composed of separatetransmitting and receiving parts. The transmit part, consisting of a PZTmaterial, emits at a frequency of 500 kHz and can generate pressures up to410 kPa. On top of the transmit surface, a thin PVDF layer is glued andused for receiving frequencies from 250 kHz (f0/2) up to 2.5MHz (5f0). Inorder to evaluate this new design, ultrasonic measurements were carriedout with gas bubbles with diameters ranging from 10µm up to 90µm andsolid particles between 350µm and 550µm. The experimental results con-firmed our previous findings: gaseous emboli with a diameter close to theresonance size scatter significantly at higher harmonic components (fromthe 2nd harmonic up to the fifth) while bubbles with a diameter aroundtwice the resonance size produce a subharmonic and/or an ultraharmoniccomponent. Meanwhile, solid particles and bubble at other sizes behave onlylinearly and their scattered spectra appeared without any harmonics. Thestudy demonstrates the utility of this approach in using a single transducerto detect and characterize selective gaseous emboli from other particles us-ing their nonlinear behavior.
Based on the publication: “Emboli detection using a new transducer design” byP. Palanchon, A. Bouakaz, J. Klein and N. de Jong, Ultrasound in Medecine and Biology,vol. 30, no. 1: pp. 123-126, 2004.
89

90 CHAPTER 6A. Single frequency transducer
6A.1 Introduction
Since the past decade, many efforts have been made to develop techniquesthat could allow the detection of micro-embolic signals, their classificationas particulate or gaseous matter and, to a lesser extent, the estimation oftheir size. A reliable detection and characterization technique may havea number of important clinical applications, such as the adjustment ofmedical therapy according to the incidence of embolic signals. The com-monly used techniques to detect circulating emboli are based on Dopplerprocessing using Trans Cranial Doppler instruments. Embolic informa-tion may be extracted from the Doppler signal through the use of specificparameters1−3 or signal processing techniques4−6. Although approachesbased on TCD gave good results for the detection of circulating micro-emboli, none of them offers the possibility of characterizing and/or sizingthese moving scatterers with a sufficient sensitivity. In Chapter 3 andChapter 4, the nonlinear behavior of gaseous emboli has been suggested asa new direction of investigation. Under appropriate scanning conditions,a gaseous embolus may pulsate nonlinearly and the frequency spectrum ofthe backscattered signal will be characterized by the appearance, in ad-dition to a fundamental component (at the transmitted frequency f0), ofharmonic (2f0, 3f0), sub-harmonic (f0/2) or ultra-harmonic (3f0/2, 5f0/2)components. In this approach the Doppler signal has been discarded to thebenefit of the Radio Frequency (RF) signal. The RF signal is defined as thesignal directly backscattered by the embolus. The Doppler signal, as usedin TCD instrument, is only reconstructed from the fundamental frequencyof the scattered RF signal and the information contained at other frequencybandwidths, such as the nonlinear components, are filtered out either bythe transducer itself or by the Doppler processing. These nonlinear fre-quency components represent new and additional information generatedby the microembolus and therefore should be considered for investigation.
When the nonlinear components have to be considered as useful infor-mation, their reception will require a specific technology to detect themwith a sufficient sensitivity. First of all, it has been shown in Chapter 3that the bubbles need to be insonified at a frequency close to their own res-onance frequency to behave nonlinearly without transmitting considerableamount of acoustic power. Bubbles with diameters smaller or larger thanthe resonance size behave only linearly and do not scatter any harmon-ics. The resonance frequency of the bubbles being inversely proportionalthe bubble size, low-frequency technology has to be applied. As an exam-ple, a free air bubble with a diameter of 12µm has a resonance frequencyof 500 kHz. Furthermore, the detection of higher frequency componentsrequires a wide frequency band in reception: from the sub-harmonic fre-

Measurements and results 91
quency up to the fifth harmonic frequency. Indeed, if a transmitted fre-quency of 500 kHz is considered, the RF signal may contain information ina frequency range between 250 kHz and 2.5MHz. A single element trans-ducer, such as the one used with TCD instruments, cannot achieve sucha requirement due to its limited frequency band. A dedicated transducerdesign was developed to fulfill these technical conditions and is describedin this chapter.
6A.2 Measurements and results
6A.2.1 Transducer characteristics
To achieve maximal sensitivity in transmission and reception modes, thetransducer design investigated in this study is composed of separate trans-mitting and receiving capabilities. Two different materials have been se-lected from their own capacities to transmit and receive an ultrasound(US)signal. This prototype was designed in our laboratory and realized by SEA(Soquel, CA, USA). A picture is given in Figure 6A.1a. The aperture ofthe transmitting part is 16mm and it has an unfocused surface. Thetransmitting part consists of a lead zirconate titanate ceramic (PZT), ma-terial known for its high capabilities in transmission. The receiving partof the design consists of a layer of polyvinylidene fluoride (PVDF) with athickness of 400µm. The PVDF layer was glued on top of the transmittingpart. The PVDF material was chosen for its extremely good capabilities inpassive reception mode over a wide frequency band. The receiving part ofthis transducer presents a relatively constant detection level for frequenciesranging from 50 kHz up to 5 MHz. Figure 6A.1b shows the transmittingand receiving frequency responses of the transducer. The center frequencyis around 540 kHz and the bandwidth is 35% at −6 db. Figure 6A.2 showsthe acoustic profiles of the transducer in the axial direction (Figure 6A.2aand in the radial direction (Figure 6A.2b measured at 65mm. The trans-mitting pulse consisted of a burst of 10 cycles with a low drive level. Forthis transducer, the far field distance is 73 mm and the last axial maximumis reached around 20 mm. Beyond this depth, the acoustic pressure decaysdue to the divergence of the beam and at a distance of 40 mm (which cor-responds to our depth of investigations) the pressure has decayed by 2dB.The lateral profile given in Figure 6A.2b was measured at 65 mm to avoidnear field interferences. It shows a beam width of 8 mm at −3 dB level.This width is too wide for imaging purposes, but it is not a limitationfor our application. Side lobes are created at approximately 25 mm radialextent with a level of −16 dB relative to the main lobe level.

92 CHAPTER 6A. Single frequency transducer
a b
Frequency [MHz]
Nor
mal
ized
Am
plitu
de [
dB]
0 1 2 3 4 5-20
-15
-10
-5
0
5
Figure 6A.1: a) Picture of the prototype ; b) frequency response of thetransmitting part (solid line) and the receiving part (dotted line).
6A.2.2 Emboli investigation with the new transducer design
This transducer design has been tested for the detection and characteriza-tion of emboli through different sets of experiments. The embolic materialsconsisted of both gas bubbles and solid particles. The solid emboli weresimulated using Contour Embolization Particles (Boston Scientific, Fre-mont, CA, USA) with diameters between 350µm and 500µm. Variousbubbles populations were produced using a homemade bubble maker, al-lowing the generation of calibrated microbubbles7. Their diameters rangedfrom 10µm to 90µm. The stream of bubbles was positioned at a distanceof 40 mm from the transducer surface. The acoustical experimental setupwas composed of a sine wave burst generated by an Arbitrary WaveformGenerator (LW 420A, Lecroy, Chesnut Ridge, NY, USA). The pulse repe-tition time (PRT) was adjusted to 10 ms. The signal was then amplified bya RF Power Amplifier (Model 2100L, ENI, Rochester, MA, USA). The am-plitude of the transmitted signal could be adjusted with separate variableattenuators (355C/D, HP, Palo Alto, USA). The acoustic pressures at thelocation of the bubbles were measured using a needle hydrophone (ResonGmbH, Germany). They ranged from 110 kPa up to 410 kPa. The receivedsignal was sampled on a digital oscilloscope (Model 9400A, Lecroy) withsampling rate of 50 MHz. A Pulser Generator (PM 5716, Philips, Stock-holm, Sweden) was used for synchronization. The backscattered signal wasaveraged over 10 successive traces and acquired on a Pentium III personalcomputer for further analysis.The behavior of air bubbles with a diameter well above the resonance size

Measurements and Results 93
0 20 40 60 80 100-25
-23
-21
-19
-17
-15A
cous
tic
pres
sure
[dB
ref
1M
Pa]
Axial Distance [mm]
a
-40 -20 0 20 40-20
-16
-12
-8
-4
0
Radial Distance [mm]
Nor
mal
ized
Am
plitu
de [
dB]
b
Figure 6A.2: Measured acoustic beam profiles of the generated acousticfield. a) axial beam profile, b) lateral beam profile measured at 65mm.
(12 µm) was investigated. These bubbles have, respectively, a diameter of90 µm, 60µm and 35µm corresponding to resonance frequencies of 71 kHz,106 kHz and 178 kHz. A burst of 10 cycles with an acoustic pressure of150 kPa was applied to the stream of bubbles. The measured spectrum ofthe backscattered signal from the bubbles and received at the PVDF sur-face exhibits a peak only at the transmitted frequency, which means thatsuch bubbles behave only linearly. The scattering behavior is dependanton the bubble size: the larger the bubble, the higher the scattered powerwill be. Bubbles with a diameter larger than the resonance size can bedetected through an increase of the power of the RF signal at the trans-mitted frequency, but no information concerning the nature or the size ofthese emboli can be extracted from the radio frequency signals.Due to intrinsic limitations of our bubbles maker, a proper stream of uni-form bubbles with a diameter smaller than 30µm could not be obtainedand was replaced by a cloud of bubbles. These bubbles do not presenta uniform diameter but their distribution size is narrow enough to makesome conclusions regarding the results obtained with such a populationof bubbles. For the set of measurements, bubbles with a mean diameteraround the resonance size and twice the resonance size were investigated.Figure 6A.3a presents the frequency spectrum of the scattered signal frombubbles with a mean diameter of 12µm, which correspond to the res-onance size of the scanning frequency. The measured acoustic pressurewas 150 kPa at the bubbles’ location. Higher frequency components canclearly be identified: second, third, fourth and even a small fifth harmonic.Figure 6A.3b displays the scattered frequency spectrum from a cloud of

94 CHAPTER 6A. Single frequency transducer
bubbles with a mean diameter corresponding to twice the resonance sizeof (24µm). The transmit pulse had an acoustic pressure of 410 kPa andcontained 10 cycles. From the spectrum, subharmonic and ultraharmoniccomponents can clearly be observed. This is in accordance with the theorythat predicts a low acoustic pressure to generate subharmonic and ultra-harmonic component when the transmitting frequency is close to twice theresonance frequency of the insonified bubbles.
Frequency [MHz]0 0.5 1 1.5 2 2.5 3
-50
-40
-30
-20
-10
0
Nor
mal
ized
Am
plitu
de [
dB]
a b
0 0.5 1 1.5 2 2.5 3-70
-50
-30
-10
Nor
mal
ized
Am
plitu
de [
dB]
Frequency [MHz]
Figure 6A.3: a) Frequency spectrum of the signal backscattered by amixture of bubbles with diameters close to the resonance size; b) frequencyspectrum of the signal backscattered by a mixture of bubbles with diametersclose to twice the resonance.
The detection of solid emboli was carried out using an acoustical arrange-ment slightly different from the previous experiments. The new ultrasonictransducer was mounted in a water bath and generates a four-cycles burstat 150 kPa. Contour Embolization particles were used to simulate particu-late emboli at a concentration of 1mm3 diluted in 200 ml of water. Theseparticles were diluted in a small container at a distance of 70 mm fromthe transducer. As expected by theory (see Chapters 3 and 4), the solidparticles behave linearly and the frequency spectrum of the backscatteredsignals exhibited a peak only at the fundamental frequency.
6A.3 Discussions and conclusions
In this chapter, a new transducer design has been investigated for the de-tection and classification (gaseous or particulate matter) of micro-embolivia the nonlinear behavior of gas bubbles. The main advantage of this con-figuration is that optimal transmission and reception modes are achieved
Discussions and conclusions 95
with a single transducer. The detection of microemboli from the surround-ing medium and the production of nonlinear components require a highsensitivity in transmission. In addition, a wide frequency band in recep-tion allows the recording of frequency components that, until now, werediscarded in emboli studies. The preliminary results confirm the previousconclusions obtained with several transducers:
1) either gas bubbles or solid particles can be detected fromthe surrounding medium. Their scattering properties are di-rectly correlated to their size or their number as predicted bythe theory;2) air bubbles with a diameter close to the resonance size gen-erate higher harmonics (second up to the fifth);3) air bubbles with a diameter close to twice the resonance sizeexhibit a subharmonic and ultraharmonic component;4) a size estimation of the bubbles can be performed by look-ing to the type of nonlinear component produced: subharmonic(bubbles around 24µm) or higher harmonics (bubbles around12µm).
Overall, such a transducer appears very valuable for the detection, thecharacterization and the sizing of gaseous emboli. Similar design can alsobe adapted to detect and characterize emboli using TCD. Nevertheless,the current design presents some technical limitations: the most impor-tant one is the limited range of detectable bubble sizes due to a singletransmitted frequency. To increase the range of bubble diameters thatcan be characterized, a multi-frequency transducer should be developed.Each transmitted frequency will lead to the detection of bubble popula-tions around its resonance size and twice its resonance size. This approachis currently under investigation.


Chapter 6BMultifrequency frequency
transducer
Abstract
The classification of circulating microemboli as gaseous or particulate mat-ter is essential to establish the relevance of the detected embolic signals.Until now, Doppler techniques have failed to determine unambiguously thenature of circulating microemboli. Recently, we have introduced a newapproach based on the analysis of Radio Frequency (RF) signal and us-ing the nonlinear characteristics of gaseous bubbles to characterize emboli.The main limitation of these studies was the requirement of two separatetransducers for transmission and reception. This study presents a multi-frequency transducer with two independent transmitting elements and aseparate receiving part with a wide frequency band. The transmitting el-ements are positioned in a concentric design and cover a frequency bandbetween 100 kHz and 600 kHz. The receiving part consists of a PVDF layer.The new transducer has been tested in vitro using gaseous emboli. It couldcorrectly classify and size air emboli with diameters ranging from 10µm to105µm.
Based on the publication: “ Multifrequency transducer for microemboli classifica-tion and sizing” by P. Palanchon, A. Bouakaz, J. Klein and N. de Jong, Accepted forpublication in IEEE Transactions on Biomedical Engineering.
97

98 CHAPTER 6B. New transducer designs
6B.1 Introduction
In Chapter 6A, a new transducer design with adequate transmitting andreceiving capabilities was presented. This transducer was composed of atransmitting part, emitting at a center frequency of 500 kHz. On top of it,a layer of polyvinylidene fluoride (PVDF) was glued and used as a passivereceiver. Experimental measurements showed that such a configurationcould only characterize gaseous emboli with a diameter smaller than 35µm,whereas larger emboli could be correctly detected, but not discriminatedfrom particulate emboli. To overcome this limitation and increase themethod specificity by enlarging the range of detectable gaseous embolussizes, a multifrequency transducer, also named “Embolus Transducer”,was designed and constructed. It is based on a similar design as the singlefrequency transducer but contains two independent transmitting elements.They operate at center frequencies of 130 kHz and 360 kHz, respectively.The reception of the backscattered RF signal is achieved by a third element,characterized by a wide frequency band, located on the surface of thetransmitting part.
6B.2 Transducer design
The multifrequency transducer designed for microemboli harmonic classi-fication is displayed in Fig. 6B.1. It is composed of three separate andindependent elements: two elements are used in transmission and one inreception. The transmitting part consists of two concentric piezocompos-ite elements. The outer element operates at a center frequency of 130 kHzand the inner element operates at a center frequency of 360 kHz. Bothelements can be driven separately and can operate indifferently in trans-mission or in reception mode. A specific electronic tuning was includedto compensate for the impedance mismatch between the transmitters andthe external electronic devices. It consisted of inductances of 470µH forthe high frequency (HF) inner element and 1880µH for the low frequency(LF) outer element, mounted in series with each transmitting element. Amatching layer composed of epoxy (thickness λ/4 of each frequency) wasadded to the surface of these two elements to couple the transmitting partto the propagation medium and no backing was used. A schematic draw-ing displayed in Fig. 6B.1b, details the multifrequency transducer design.The inner element has a diameter of 20 mm and the width of the outerring is 3.7mm. The thickness of each element is, respectively, 5mm forthe high frequency inner element and 13 mm for the low frequency outerring. To avoid any interference and crosstalk between both elements, afiller was inserted between the two transmitters. The receiving part con-

Experimental setup 99
sists of a 110µm thick layer of polyvinylidene fluoride (PVDF) glued ontop of the matching layer and covers the complete transducer surface. Thetotal aperture of the transducer is 30mm.
13 mm
ba
5mm
30 mm3.7 mm
20 mm
PVDF110µm
LF elementHF element matchinglayer
absorbingfiller
Figure 6B.1: a) Photograph of the multifrequency transducer; b)transversal drawing of the transducer.
6B.3 Experimental setup
6B.3.1 Transducer characteristics measurements
To evaluate the ultrasonic capabilities of this transducer, beam profilesand sensitivity measurements were carried out. The pressure fields weredetected by a needle hydrophone with an active area of 4 mm in diameter(Reson GmbH, Kiel, Germany). A personal computer controlled the 3-Dmotion of the hydrophone and acquired the received data. The hydrophonewas attached to a x−y−z translation device (Time and Precision, Hamp-shire, UK), enabling it to be precisely positioned at specific points in thetransducer field. The movement of the translation stage was automati-cally controlled with a personal computer using a dedicated software. Thehydrophone output was connected, through a low-pass filter, to a digi-tal oscilloscope (Model 9400A, Lecroy). The captured pressure waveformswere digitized at a sampling rate of 100MHz, and then transferred to apersonal computer for further processing. The multifrequency band trans-ducer was driven by an ENI power amplifier (Model 2100L, ENI, MA,Rochester, USA), using a ten-cycle electrical signal delivered by an arbi-trary waveform generator (Model 332505, Agilent). A low excitation levelwas used to avoid distortions and to ascertain the effective aperture geom-etry of the source. The beam profile measurements were performed across

100 CHAPTER 6B. New transducer designs
the beam, in the lateral direction, for both transmitting elements. In addi-tion, the sensitivity as a function of the frequency was measured, for eachelement, at a distance of 40mm. The procedure consisted of transmittinga narrow frequency band burst and varying the frequency while keepingthe electrical driving level constant. The sensitivity was computed afternormalizing the received signal from the hydrophone to the hydrophonesensitivity. The frequency was swept, with steps of 10 kHz, from 10 kHzup to 800 kHz for the HF inner element, and from 10 kHz up to 300 kHzfor the LF outer element.
6B.3.2 Transducer evaluation
A block diagram, displayed in Fig. 6B.2, shows the experimental setup usedto test the performances of the multifrequency transducer. The transducerwas mounted in a water tank (30× 30× 20 cm). A narrow band sine waveburst (7 or 10 cycles) was generated by an arbitrary waveform generator(Model 332505, Agilent) with a pulse repetition time of 100 ms. Theelectrical signal was then amplified by an RF Power Amplifier (Model2100L, ENI, Rochester, USA) and its amplitude could be controlled byseparate variable attenuators (355C/D, HP, Palo Alto, CA, USA). Thescattered signal was received with the PVDF element. This signal waselectrically tuned using a wideband amplifier (Keithley Instrument) andfiltered with a pass-band filter to increase the signal to noise ratio. The RFsignal was then sampled on a digital oscilloscope (Model 9400A, Lecroy)with a sampling rate of 50 MHz. The response of the bubbles was averagedover 10 signals and acquired on a personal computer for further analysis.The generated acoustic pressures were separately measured at the locationsof the bubbles using a needle hydrophone, as described previously. Tosimulate gaseous emboli, calibrated and uniform air bubbles were generatedusing a “home-made” bubble maker7. The bubbles sizes could be externallycontrolled by the operator. Gaseous emboli with a diameter ranging from160µm down to 10µm were studied in this work. These bubbles had a verynarrow size distribution (92% lie within a ±4µm of the mean diameter)which guarantees similar diameters between all the insonified bubbles.
6B.4 Results and discussions
6B.4.1 Transducer characteristics:
Acoustic pressure measurements were performed for both the LF outerand the HF inner elements. They are presented in Table 6B.1. It wasshown in previous studies8,9 that these pressure levels are sufficient to
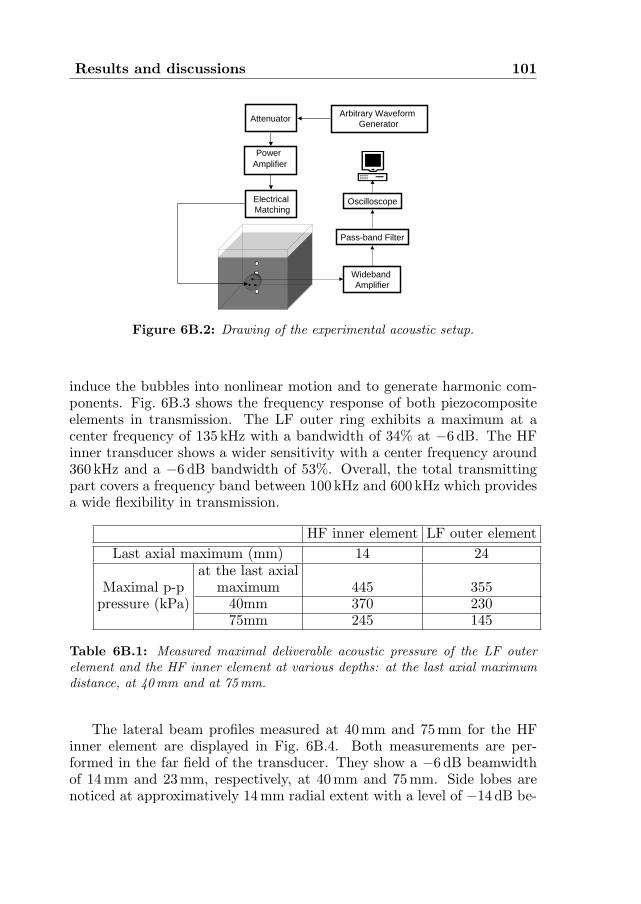
Results and discussions 101
Power Amplifier
Attenuator
ElectricalMatching
Arbitrary WaveformGenerator
PC
Wideband Amplifier
Pass-band Filter
Oscilloscope
Figure 6B.2: Drawing of the experimental acoustic setup.
induce the bubbles into nonlinear motion and to generate harmonic com-ponents. Fig. 6B.3 shows the frequency response of both piezocompositeelements in transmission. The LF outer ring exhibits a maximum at acenter frequency of 135 kHz with a bandwidth of 34% at −6 dB. The HFinner transducer shows a wider sensitivity with a center frequency around360 kHz and a −6 dB bandwidth of 53%. Overall, the total transmittingpart covers a frequency band between 100 kHz and 600 kHz which providesa wide flexibility in transmission.
HF inner element LF outer elementLast axial maximum (mm) 14 24
at the last axialMaximal p-p maximum 445 355
pressure (kPa) 40mm 370 23075mm 245 145
Table 6B.1: Measured maximal deliverable acoustic pressure of the LF outerelement and the HF inner element at various depths: at the last axial maximumdistance, at 40mm and at 75mm.
The lateral beam profiles measured at 40 mm and 75 mm for the HFinner element are displayed in Fig. 6B.4. Both measurements are per-formed in the far field of the transducer. They show a −6 dB beamwidthof 14mm and 23 mm, respectively, at 40 mm and 75mm. Side lobes arenoticed at approximatively 14mm radial extent with a level of −14 dB be-

102 CHAPTER 6B. New transducer designs
0 100 200 300 400 500 600 700 800-70
-60
-50
-40
-30
-20
-10
0
Frequency [kHz]
Nor
mal
ized
Am
plit
ude
[dB
]
Figure 6B.3: Measured sensitivity of the transmitting elements: HFinner element (O) and LF outer element (4).
low the main lobe level at 40 mm whereas a side lobe at a level of −17.5 dBis created at 24mm when the lateral profile is measured at 75 mm. Be-side measurements, simulations of the beam profile were carried out usingField program10. The predicted profile correlates well with the measuredprofile and all the measured features of the beam are well reproduced bythe simulations. The lateral beam profiles were also measured at 40 mmand 75mm for the LF outer ring and they are presented in Fig. 6B.5. At40 mm, the bandwidth at −6 dB is 18 mm but a strong side lobe appears at24 mm at a level of -10 dB below the main lobe due to the ring geometry.At larger depth (75 mm), the same tendency can be observed: side lobesare produced at 45mm with a level of −10 dB. The −6 dB beamwidth ofthe ring measures 35mm at this depth. Simulations were also carried outfor the ring transducer and good correlation is observed with the measure-ments. The measured beamwidths can be considered wide when comparedto the ones usually encountered in the medical field. Nevertheless, it is nota limitation for our application, since this transducer was not developedfor imaging purposes.
6B.4.2 Transducer evaluation for microemboli detection
The capabilities of the multifrequency band transducer were evaluatedfor the detection, the characterization and the sizing of gaseous emboli.Particulate emboli have not been studied on purpose. It was demonstratedin Chapter 6A, that particulate emboli are only leading to an increaseof the RF signal amplitude. The frequency spectrum of a solid embolusexhibits only a peak at the transmitted frequency independently on itssize and the acoustic settings used in our experiments. Therefore, the
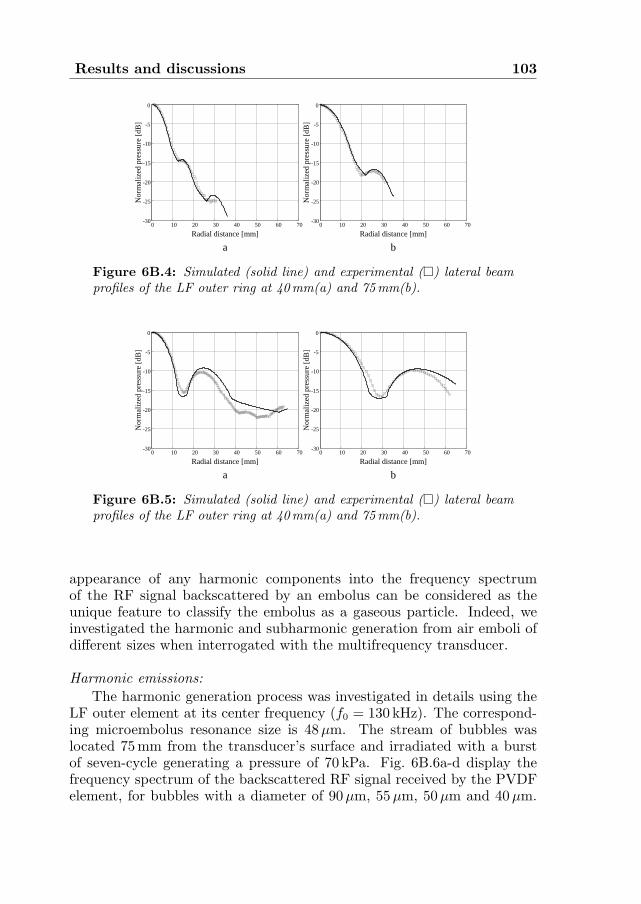
Results and discussions 103
0 10 20 30 40 50 60 70-30
-25
-20
-15
-10
-5
0
Radial distance [mm]
Nor
mal
ized
pre
ssur
e [d
B]
0 10 20 30 40 50 60 70-30
-25
-20
-15
-10
-5
0
Radial distance [mm]
Nor
mal
ized
pre
ssur
e [d
B]
a b
Figure 6B.4: Simulated (solid line) and experimental (¤) lateral beamprofiles of the LF outer ring at 40mm(a) and 75mm(b).
0 10 20 30 40 50 60 70-30
-25
-20
-15
-10
-5
0
Radial distance [mm]
Nor
mal
ized
pre
ssur
e [d
B]
0 10 20 30 40 50 60 70-30
-25
-20
-15
-10
-5
0
Radial distance [mm]
Nor
mal
ized
pre
ssur
e [d
B]
a b
Figure 6B.5: Simulated (solid line) and experimental (¤) lateral beamprofiles of the LF outer ring at 40mm(a) and 75mm(b).
appearance of any harmonic components into the frequency spectrumof the RF signal backscattered by an embolus can be considered as theunique feature to classify the embolus as a gaseous particle. Indeed, weinvestigated the harmonic and subharmonic generation from air emboli ofdifferent sizes when interrogated with the multifrequency transducer.
Harmonic emissions:The harmonic generation process was investigated in details using the
LF outer element at its center frequency (f0 = 130 kHz). The correspond-ing microembolus resonance size is 48µm. The stream of bubbles waslocated 75 mm from the transducer’s surface and irradiated with a burstof seven-cycle generating a pressure of 70 kPa. Fig. 6B.6a-d display thefrequency spectrum of the backscattered RF signal received by the PVDFelement, for bubbles with a diameter of 90µm, 55µm, 50µm and 40µm.

104 CHAPTER 6B. New transducer designs
On the upper right corner of each curve, the bubble diameter is indicatedby an arrow on the theoretical backscattered cross-section of an air bubblewhere the maximal cross-section occurs at the resonance size (D0).
f0 2f0 3f0 4f0 5f0
Nor
mal
ized
Am
plit
ude
[dB
]
Frequency f0
D0
-60
-50
-40
-30
-20
-10
0
-60
-50
-40
-30
-20
-10
0
Nor
mal
ized
Am
plit
ude
[dB
]
Frequency
f0 2f0 3f0 4f0 5f0
D0
a
c
-60
-50
-40
-30
-20
-10
0
-60
-50
-40
-30
-20
-10
0
f0 2f0 3f0 4f0 5f0
Nor
mal
ized
Am
plit
ude
[dB
]
Frequency
D0
f0 2f0 3f0 4f0 5f0
Nor
mal
ized
Am
plit
ude
[dB
]
Frequency
D0
d
b
Figure 6B.6: Simulated frequency spectra of the backscattered RF signalfor different gaseous embolus sizes: a) 90µm b) 55µm, c) 50µm and d)40µm. The LF outer ring is used as the transmitter.
For an air embolus much larger than the resonance size, in this partic-ular case 90µm (Fig. 6B.6a), the frequency spectrum of the backscatteredsignal exhibits only a peak at the transmitted frequency f0. Such largeair emboli behave linearly and hence cannot be distinguished from othermoving particles. When the bubble size gets closer to the resonance size,as shown in Fig. 6B.6b, the bubble starts vibrating nonlinearly and we canappreciate a second harmonic component 31 dB below the fundamental.Fig. 6B.6c presents the frequency spectrum of the scattered signal from abubble with a size of 50µm that can be assimilated to the resonance size.The spectrum clearly shows that resonant bubbles can generate a highnumber of harmonics: second (2f0), third (3f0) and fourth (4f0) harmonic

Results and discussions 105
components. When the bubble diameter becomes smaller than the reso-nance size, the number of harmonic components regressively decreases andfor a bubble of 40µm, only a second harmonic is generated. For these spe-cific scanning conditions (LF outer element, acoustic pressure of 70 kPa),gaseous emboli with a diameter between 60µm and 40µm generate a sec-ond harmonic component and, thus, can be correctly classified as gaseousmatter. When the acoustic pressure is increased up to its maximal value(145 kPa), the range of gaseous embolus sizes leading to the production ofa second harmonic component is extended from 30µm up to 75µm. Bub-bles’ sizes outside this range can be detected by looking at the increaseof backscattered signal power at the fundamental frequency (f0) but, theycannot be characterized as gaseous matter. The same observations werenoticed with the HF inner transmitting element (corresponding resonancesize: 17µm). The transmitted ultrasonic burst consisted of a 10 cyclespulse generating an acoustic pressure of 130 kPa at the bubble location,40mm from the transducer’s surface. The experimental results obtainedwith both elements are summarized in Table 6B.2.
Subharmonic and ultraharmonic emissionsThe nonlinear behavior of air bubbles leading to the formation of sub-
harmonic and ultraharmonic components was studied in detail in Chapter5. It was demonstrated that gaseous emboli with a diameter correspond-ing to twice the resonance size produce a subharmonic at low acousticpressure levels. In this section, we evaluate the subharmonic and ultra-harmonic generation capabilities of the embolus transducer using gaseousemboli with a resonance frequency close to half the transmitted frequency.The HF inner element was set in transmission and the PVDF element inreception mode. Fig. 6B.7 displays the levels of the subharmonic (f0/2)and the first ultraharmonic (3f0/2) components as a function of the bub-bles size. The ultrasound burst contained 10 cycles generating an acousticpressure of 165 kPa. The stream of bubbles was located 40 mm from thetransducer’s surface. The curves demonstrate that for a transmitted fre-quency of 360 kHz, a subharmonic component can be generated for bubbleswith a diameter ranging between 20µm and 45µm. A maximum responseof both the subharmonic and the ultraharmonic was found for a gaseousembolus of 32µm in diameter, which is slightly smaller than the theoreticalvalue. Such a behavior was reported in Chapter 5 and it was related toan inadequacy of the theoretical resonance frequency formula when highacoustic pressure levels are used.The same curve tendency can be observedwith the first ultraharmonic but the amplitude of this component is smallerthan the subharmonic component. We also notice that the ultraharmoniccomponent is spread over a wider bubble size range than the subharmoniccomponent amplitude.

106 CHAPTER 6B. New transducer designs
15 20 25 30 35 40 45 50-30
-26
-22
-18
-14
-10
Bubble diameter [µm]
Nor
mal
ized
Am
plit
ude
[dB
]
Figure 6B.7: Subharmonic (O) and first ultraharmonic (¤) level asa function of the embolus diameter using the HF inner element as thetransmitter.
Bubble sizes larger than 45µm have shown to behave linearly at thistransmitting frequency and do not generate nonlinear components. Atthe opposite, even though bubbles smaller than 20µm did not show anysubharmonic or ultraharmonic components at this acoustic pressure level,they could still reflect energy in the higher harmonic band (second har-monic and so on). Therefore, such bubbles can be correctly classified asgaseous emboli. The same trend of results was obtained when the LFouter element was used as the transmitter and they are summarized inTable 6B.2.
Sizing procedureThe multifrequency band transducer offers the possibility to character-
ize a wide range of gaseous emboli: from 10µm up to 105µm. Referringto Table 6B.2, each transmitting element can classify specific gaseous em-bolus size ranges. Typically, for each transmitted frequency, we noticethat bubbles around the resonance size generate higher harmonics whereasbubbles around twice the resonance size produce a subharmonic or an ul-traharmonic component. Therefore, the order of the nonlinear componentgenerated can be used to size the detected gaseous embolus. As an exam-ple, using the LF inner element as a transmitter, a gaseous embolus with adiameter between ±20µm around the resonance size generates higher har-monics and a gaseous embolus with a diameter of ±10µm around twice the

Conclusions 107
resonance size produces a subharmonic component. The sizing resolutioncan be improved by selectively receiving the higher harmonics (>2). Thenumber of harmonics increases as the embolus size gets closer to the reso-nance size. A third harmonic is only produced for bubbles very close to theresonance size whereas a fourth and fifth harmonic can only be generatedfor resonant bubbles.
Second harmonic Subharmonic
LF outer element 30− 75µm 85− 105µm
HF inner element 10− 30µm 22− 44µm
Table 6B.2: Gaseous emboli size range leading to the formation of asecond harmonic and subharmonic component as a function of the trans-mitting frequency: the LF outer element and the HF inner element.
6B.5 Conclusions
The multifrequency band transducer studied in this chapter appears tohave a promising potential to detect, classify and size gaseous microem-boli. The detection of circulating microemboli is achieved by detecting theincrease of the fundamental components as it is the case for conventionalTCD methods. The classification processing is based on the nonlinear be-havior of gaseous emboli: gaseous emboli can generate harmonics and/orsubharmonics whereas solid particles do not. Using both the second har-monic and the subharmonic as parameters to classify the detected emboli,gaseous bubbles with a diameter between 10µm and 105µm could be char-acterized as gaseous matter. The sizing procedure is based on the typeof generated nonlinear components: higher harmonics are generated bygaseous emboli with a diameter close to the resonance size whereas gaseousemboli with a diameter close to twice the resonance size are leading to sub-harmonic and ultraharmonic components. Typically, the accuracy of theapproach in estimating the embolus size is ±20µm. A finer estimationcan be realized for a limited bubble size range. Gaseous embolus with adiameter very close to the resonance (±4µm) can be discriminated fromother sizes by the production of a third and even a fourth harmonic intheir frequency response.
One of the disadvantages of such a transducer design is related to theside lobe levels created by the external ring element. These side lobe

108 CHAPTER 6B. New transducer designs
levels are higher than those generated by a circular transducer and canlimit the dynamic range of the transducer. However, this design presentsseveral advantages such as the wide frequency band allowing to transmitfrequencies between 100 kHz up to 600 kHz. Each element can be con-trolled separately and independently. Due to the wide frequency bandavailable simultaneously in transmission and reception mode, the perfor-mance of the multifrequency transducer could be valuably improved. Thelarge beamwidths allow a single embolus to be scanned by several discretefrequencies and, therefore, by sweeping the transmitted frequency over thecomplete frequency band (from 100 kHz up to 600 kHz), specific gaseousembolus size ranges could be selectively detected and sized. The mainadvantage of such an approach will be to enlarge the classifiable embolussize, especially for large bubbles. It is expected that a gaseous embolus of200µm generates nonlinear components when insonified by a frequency of100 kHz. In addition, such a transducer could be easily adapted to operatewith TCD systems.
An immediate clinical application of this embolus transducer could beto detect gaseous microemboli during cardiac surgery where it is knownthat a large number of gaseous emboli are produced. The transducer couldbe located on the extracorporeal circuit or directly on the carotid artery.Before going on clinical practice, few technical improvements of the trans-ducer design are currently under realization to improve its efficiency bothin transmission and in reception mode. In particular, a higher sensitivityof the LF outer element as well as a better signal to noise ratio would berequired for in vivo tests.
References
1. J.L. Smith, D.H. Evans, P.R.F. Bell, and A.R. Naylor, “A comparison offour methods for distinguishing Doppler signals from gaseous and particu-late emboli”, Stroke, vol. 29, no. 7: pp. 1133-1138, 1998.
2. H.S. Markus and M.M. Brown, “Differentiation between different patholog-ical cerebral embolic materials using Transcranial Doppler in an In-Vitromodel”, Stroke, vol. 24, no. 1: pp. 1-5, 1993.
3. D. Georgiadis, T.G. Mackay, A.W. Kelman, D.G. Grosset, D.J. Wheastley,and L. K.R., “Differentiation between gaseous and formed embolic materialsin Vivo: application in prosthetic heart valve patients”, Stroke, vol. 25, no.8: pp. 1559-1563, 1994.
4. G. Devuyst, G.A. Darbellay, J.M. Vesin, V. Kemeny, M. Ritter,D.W. Droste, C. Moline, J. Serena, R. Sztajzel, P. Ruchat, C. Lucchesi,

References 109
G. Dietler, E.B. Ringelstein, P.A. Despland, and J. Bogousslavsky, “Au-tomatic classification of HITS into artifacts or solid or gaseous emboli bya wavelet representation combined with dual gated TCD”, Stroke, vol. 32,no. 12: pp. 2803-2809, 2001.
5. G.A. Darbellay, G. Devuyst, J.M. Vesin, M. Ritter, D. Droste, C. Molina,J. Serena, R. Sztatjzel, T. Karapanayiotides, E.B. Ringelstein, C. Lucch-esi, J. Bogousslavsky, and P.A. Despland, “The classification of cerebralmicroemboli into gaseous bubbles and solid clots is not a piece of cake!!!”,Cerebrovas Dis, vol. 11 (Suppl 13): pp. 16, 2001.
6. D. Russell and R. Brucher, “Online automatic discrimination between solidand gaseous cerebral microemboli with the first multifrequency TranscranialDoppler”, Stroke, vol. 33, no. 8: pp. 1975-1980, 2002.
7. P. Palanchon, J. Klein, and N. de Jong, “Production of standardized airbubbles: application to embolism studies”, Rev Sci Instrum, vol. 74, no. 4:pp. 2558-2564, 2003.
8. P. Palanchon, A. Bouakaz, J.H. van Blankestein, J. Klein, N. Bom, andN. de Jong, “New technique for emboli detection and discrimination basedon nonlinear characteristics of gas bubbles”, Ultrasound Med Biol, vol. 27,no. 6: pp. 801-808, 2001.
9. P. Palanchon, A. Bouakaz, J. Klein, and N. de Jong, “Subharmonic andultraharmonic emissions for emboli detection and characterization”, Ultra-sound Med Biol, vol. 29, no. 3: pp. 417-425, 2003.
10. J.A. Jensen, “Field: a program for simulating ultrasound systems”, Ultra-sound Med Biol, vol. 34, no. 51: pp. 351-353, 1996.


Chapter 7Ultrasonic manipulation of a
gaseous embolus
Abstract
Previous studies dealing with contrast agent microbubbles have demon-strated that ultrasound (US) can signiflcantly in°uence the movement ofmicrobubbles. In this chapter, we investigate the in°uence of the acousticradiation force on individual gaseous emboli using high-speed photography.We emphasize the efiects of the US parameters (pulse length, acoustic pres-sure) on difierent bubble patterns and their consequences on the transla-tional motion of the bubbles. A stream of uniform air bubbles with diameterranging from 35 µm to 79 µm was generated and insonifled with a single USpulse emitted at a frequency of 130 kHz. The bubble sizes were chosen to beabove, below and at resonance. The peak acoustic pressures used in theseexperiments ranged from 40 kPa up to 120 kPa. The axial displacements ofthe bubbles produced by the action of the US pulse were optically recordedusing a high-speed camera at 1 kHz frame rate. The experimental resultswere compared to a simplifled force balance theoretical model including theaction of the primary radiation force and the °uid drag force. Althoughthe model is quite simple and does not take into account phenomena likebubble shape oscillations and added mass, the experimental flndings agreewith the theoretical predictions. The measured axial displacement increases
Based on the publication: “Optical observations of acoustical radiation force effectson individual air bubbles” by P. Palanchon, P. Tortoli, A. Bouakaz and N. de Jong,Accepted for publication in IEEE Transactions on Ultrasonics Ferroelectrics and Fre-quency Control.
111
112 CHAPTER 7. Ultrasonic manipulation of emboli
quasi-linearly with the burst length and the transmitted acoustic pressure.This displacement also varies with the size and the density of the air bub-bles, reaching a maximum at the resonance size of 48µm. The predicteddisplacement values differ by 15% from the measured data except for reso-nant bubbles where the displacement was overestimated by about 40%. Thisstudy demonstrates that even a single US pulse produces radiation forcesthat are strong enough to affect the bubble position.
Introduction 113
7.1 Introduction
To obtain the desired response to ultrasound (US) by microbubbles, itis necessary to know their reaction to the difierent forces they experienceduring insonation. Among these forces, the primary, or Bjerknes, radiationforce1 may play important roles. The efiect of radiation force may havebeen experienced in study dealing with microemboli detection. Smith etal.2 have reported that Doppler embolic signals from gaseous emboli oftendisplay regions of frequency modulations whereas signals originated fromsolid emboli never exhibits such a behavior. The reason of this suddenfrequency change was not really understood but it could be related to thedisplacement induced by the ultrasound waves.
A preliminary evaluation of radiation force efiects on microbubbles hasbeen reported by Dayton3, who optically observed that a streamline ofcontrast agents was pushed away from the insonifying transducer. Ex-perimental results have shown that when such translations are related tofull populations of contrast agents suspended in moving °uids, they mayyield to considerable distortions in the corresponding Doppler spectra4−5.A Doppler approach was used to indirectly validate a simple theoreticalmodel, in which the microbubbles movements are evaluated through thecombination of the primary US force with the drag force of the °uid inwhich they are suspended. Experimental spectra obtained by insonifyingfull populations of Levovist microbubbles were positively compared withthe spectra estimated according to such a model5. A similar, but moreaccurate model was developed in reference 6. This model, which includesthe added mass force and evaluates all the efiects of bubble oscillations,was compared to experiments performed on individual phospholipid shelledmicrobubbles.
The aim of this chapter was to establish the in°uence of radiationforces on the response of microemboli and therefore on the correspondingDoppler signal. The efiects of radiation forces associated to a single USpulse on a stream of individual gaseous emboli with a diameter rangingfrom 35 µm to 79 µm were evaluated qualitatively and quantitatively. Theaxial displacement was measured using a high-speed imaging system. Thein°uence of the acoustic parameters as well as of the size and the densityof the bubbles was investigated.

114 CHAPTER 7. Ultrasonic manipulation of emboli
7.2 Materials and methods
Experimental set-up
Power Amplifier
Pulse generator
Attenuator
ElectricalMatching
FunctionGenerator
Ultrasound/camera Synchronization
Kodak
Bubble maker
PC
Figure 7.1: Experimental setup.
The experimental setup is shown in Figure 7.1. A streamline of bub-bles was generated by a home made \bubble maker"7, allowing the pro-duction of calibrated and uniform air bubbles. The operator could inde-pendently control the size and the number of the generated bubbles byvarying the settings of this device. The bubble streamline was directedfrom the bottom to the top of the tank, as the bubbles are dragged bythe movement of the °ow generated by a gear pump. A single-element UStransducer was positioned to produce acoustic waves directed perpendicu-larly to the streamline. The imaging system was composed of a high-speedcamera (CR2000, Kodak) directly mounted on a long zoom microscope(Sciencescope, Chino, USA) and focused on the microbubbles. The framerate of the camera was flxed at 1 kHz. A constant light source providedthe necessary illumination for the recordings. The optical resolution of thissystem was 3 µm/pixel. The ultrasonic arrangement included a functiongenerator producing a single sinusoidal burst, coherent with the cameraframe synchronism and a radio-frequency power amplifler (Model 2100L,ENI, Rochester, MA, USA). A home made electrical matching circuit wasused to compensate the impedance mismatch between the US transducerand the electronics. The acoustic pressure produced by the transducer

Materials and methods 115
could be adjusted with appropriate attenuators and was separately mea-sured using a calibrated hydrophone (Reson GmbH, Kiel, Germany). Thetip of the needle was positioned in the optical fleld of view, so that the mea-sured acoustic pressure, ranging from 40 kPa to 120 kPa, corresponded tothe pressure applied to the bubbles. The images taken by the high-speedcamera were saved on a personal computer for analysis. The bubbles’characteristics (diameter and separation distance between two successivebubbles) as well as their displacements were computed using a MATLABprogram (The MATHWORKS, Natick, MA, USA).
Simulation model
The displacement of the bubbles is predicted using a simple theoreticalmodel similar to the one described by Tortoli4. It assumes that the bubbledisplacement is induced by the action of the primary radiation force andthe drag force of the °uid. The trajectory of the bubbles can be traced bysolving the following vector motion equation:
~FUS(t) + ~FD(t) = md~Vb(t)
dt(7.1)
where~FUS is the primary radiation force;~FD is the drag force;~Vb is the instantaneous bubble velocity;m is the bubble mass.
The expression of the primary radiation force is similar to the one de-scribed by Leighton8 and Dayton3. It assumes that the bubble diameter ismuch smaller than the acoustic wavelength, the bubble remains sphericallysymmetric during pressure changes and the acoustic waves are planar andparallel. When a single pulse is considered, the amplitude of the primaryradiation force is expressed by:
~FUS =PA
2D
2ρcf
δtotf0/f
[(f0/f)2 − 1]2 + (δtotf0/f)2(7.2)
wheref is the transmitted frequency,c is the US propagation speed,PA is the peak acoustic pressure,f0 is the resonance frequency,D is the equilibrium bubble diameter,ρ is the °uid density,δtot is the total damping coe–cient.

116 CHAPTER 7. Ultrasonic manipulation of emboli
The total damping coe–cient and the resonance frequency are deflned,respectively, by the Equations 3.3 and 3.7.
When an US pulse is applied to a moving bubble, it induces an acceler-ation of the bubble so that it is diverted from the °ow path. The difierencebetween the °uid and the bubble velocity yields to a drag force. Assumingthat the bubble remains spherical and the surrounding °uid is Newtonian,the drag force is deflned by the formula:
~FD = CDReπDνρ0
8( ~Vf − ~Vb) (7.3)
where~Vb is the instantaneous bubble velocity,~Vf is the °uid velocity,Re is the Reynolds number,CD is the drag coe–cient,ρ is the °uid density,ν is the °uid viscosity.Note that this equation does not include the efiects of bubble radial mo-tion in the translating bubbles. In practice, according to this model, it isexpected that each bubble is accelerated along the transducer (horizontal)axial direction until it reaches a steady velocity, Vb, such that the corre-sponding drag force, as described by Equation 3.3, perfectly balances theradiation force. This equilibrium condition is achieved quite rapidly3, andholds as long as the bubble is insonated by the US burst, i.e., for a time,TX , depending on the transmitted burst length. At the end of such timeinterval, the displacement turns out to be: d = VbTX (and is thus pro-portional to the number of transmitted cycles). Afterwards, the bubble isdragged again along the (vertical) direction of the °uid °ow. Equation 7.1was solved numerically using a simple Euler one-step method.
7.3 Results and discussions
The translation of the bubbles in the wave propagation direction was inves-tigated following two difierent approaches. In a flrst set of measurements,the in°uence of US parameters such as the pulse length and the peakacoustic pressure was studied for speciflc bubble diameters. Secondly, thedisplacement induced by the radiation force was examined as a function ofthe bubbles’ diameter and density (deflned by the separation distance be-tween two successive bubbles). Air bubbles with diameter between 35 µmto 79 µm were studied. Their rising velocity (i.e., the °uid velocity) wasranging from 200 µm/ms to 290 µm/ms. Figure 7.2 shows an example of

Results and discussions 117
the translational displacement produced by a single acoustic pulse com-posed of 10 cycles and generating an acoustic pressure of 110 kPa. Threesubsequent frames spaced 1 ms apart (one taken before and two after theUS pulse transmission) are overlapped in the same picture. The restingdiameter of the bubbles was 48 µm. Xinitial represents the position of thebubbles before insoniflcation and ¢ is the measured displacement. It canbe observed that the bubble is displaced to the right by an amount of about165 µm and has moved up about 250 µm. The horizontal translation is con-sistent with the prediction of the model, while the vertical movement ofthe bubble is associated to the drag force of the °uid.
Figure 7.2: Superposition of 3 consecutive frames showing the displace-ment of a 48µm bubble induced by a ten-cycle US pulse emitting 110 kPaat 130 kHz : before the US burst and after the US burst. The verticaldisplacement corresponds to the 260µm/ms fluid velocity.
Figure 7.3 displays the measured displacement as a function of thepulse length. The number of cycles ranged from 5 to 30 cycles. The di-ameter of the bubbles was 48 µm and the acoustic pressure was set to54 kPa. As expected from theory, the displacement increases linearly withthe number of cycles. Figure 7.4 displays the in°uence of the transmittedacoustic pressure on three difierent bubble sizes: 62 µm (4), 55 µm (¤)and 48 µm (O). The bubbles were insonifled with a 10-cycle burst and thedistance between two successive bubbles was kept around 1 mm. In allcases, according to the theoretical model, the combined action of radiationand drag force should produce a displacement that varies quasi-linearlywith the acoustic pressure. This linear dependency between the displace-ment and the acoustic pressure can be noticed for the three bubble sizes,although in the case of a resonant bubble 48 µm, the growing rate difiers

118 CHAPTER 7. Ultrasonic manipulation of emboli
at low and high acoustic pressure levels. We can also observe that eachcurve exhibits a difierent slope. As the bubble is closer to the resonancesize 48 µm, the measured displacement increases with acoustic pressure ata much faster rate. While the three bubble diameters experience quitesimilar displacements at low pressure, the difierence is dominant at highpressure levels. For instance, the difierence between translations of 48 µmand 62 µm bubbles is only 10 µm at 48 kPa, but reaches 170 µm at 120 kPa.
0 5 10 15 20 25 30 3520
40
60
80
100
120
Number of cycles
Dis
plac
emen
t [µm
]
Figure 7.3: Measured displacements for 48µm bubbles as a function ofthe pulse length.
80 100 120 140 160 180 200 220 2400
50
100
150
200
250
300
Acoustic Pressure [kPa]
Dis
plac
emen
t [µm
]
Figure 7.4: Measured displacements as a function of the transmit-ted acoustic pressure for three different bubble diameters: 48µm(O),55µm(¤) and 62µm(4).

Results and discussions 119
In a second set of experiments, the in°uence of the bubble density hasbeen investigated by exploiting the ’bubble maker’ capability of generatingbubbles with various mutual distances. Figure 7.5a-c show 48 µm bubbleswith three difierent distributions, corresponding to separation distancesaround (a) 200 µm, (b) 350 µm and (c) 900 µm, respectively. The dis-placement measured for each distribution, is displayed in Figure 7.5d as afunction of the bubble diameter. The US burst consisted of 10 cycles witha peak acoustic pressure of 54 kPa. We can flrst observe that the changein the measured displacement depends on the bubble size. Each curve ex-hibits a maximum for a bubble diameter of 48 µm, which corresponds tothe resonance size for a transmit frequency of 130 kHz. When the bubblesare smaller or larger than the resonance size, the displacement rapidly de-creases. It can also be noticed that the measured displacement is highlydependent on the density of the bubbles.
ca b d
Bubble Diameter [µm]
Dis
plac
emen
t [µm
]
30 35 40 45 50 55 60 65 70 75 800
20
40
60
80
100
Figure 7.5: Bubble patterns with separation distances between two suc-cessive bubbles of: a) 200µm, b) 350µm and c) 900µm; d) bubble dis-placements as function of diameter for three different separation distancesbetween two successive bubbles: 900µm(O), 350µm(¤) and 200µm(∗).
When the separation distance between two successive bubbles de-creases, the displacement induced by the US pulse is considerably reduced.The efiect is dominant for bubbles around the resonance size while the dif-ference becomes smaller for bubbles larger or smaller than the resonancesize. In the case of resonant bubbles, the displacement is reduced by 56%when the separation distance between two bubbles goes down from 900 µmto 350 µm and by 70% when the separation distance is reduced to 200 µm.As the separation distance decreases, the displacement for bubbles larger

120 CHAPTER 7. Ultrasonic manipulation of emboli
than the resonance size exhibits a smaller decay. Considering the smallestdistance between the bubbles, the displacement for bubbles of 53 µm and75 µm decays only by a factor of 2 while this decay reaches a factor of 4 forthe largest separation distance. This set of measurements underlines thefact that there is a strong interaction between the bubbles when they arecloser to each other. Only for a large separation distance (e.g.:> 900 µm),each bubble can be considered as an independent scatterer. When thenumber of bubbles increases, each bubble interferes with its neighboringbubbles. This interaction is mainly in°uenced by the secondary radiationforce resulting from the pulsating bubbles. The secondary radiation forcebetween bubbles arises when a pulsating bubble is radiating a pressurefleld acting on a second bubble. When bubbles with a similar diameterare considered, the secondary radiation force results in an attractive force.Therefore, it may conduct to a bubble streamline more resistant to theprimary radiation force. An example of the efiect of the secondary radia-tion force is given in Figure 7.6. The resting radius of the bubbles is 53 µmand the separation distance is 170 µm, as shown in Figure 7.6a. When asingle pulse with an acoustic pressure of 110 kPa is applied to the bubbles,the bubbles °ow pattern is disturbed and the bubbles are become closeras visible in Figure 7.6b.
a b
Figure 7.6: Example of the secondary radiation force effect on a stream-line of microbubbles:a) before the US burst, b) after the US burst.
The measured displacement was compared to the displacement com-puted from the theoretical model as a function of the bubble size. Fig-ure 7.7 shows the simulated (O) and experimental displacements (♦) as

Results and discussions 121
a function of the bubble diameter. Since the theoretical model considersthe behavior of a single bubble, the largest separation distance betweenthe bubbles was used in these experiments. A burst of 10 cycles with apressure of 54 kPa was applied to the bubbles. Both curves present thesame tendency: a maximal displacement is observed at the resonance size.For bubbles far above the resonance size, the theoretical model agrees quitewell with the experiments. The difierence between measured and predicteddisplacements is about 15%. Larger discrepancy can be observed aroundthe resonance size, where the simulations overestimated the measurementsby about 40%.
Bubble Diameter [µm]
Dis
plac
emen
t [µm
]
35 40 45 50 55 60 65 70 75 800
50
100
150
Figure 7.7: Comparison between computed (O) and measured (♦) bubbledisplacements at 55 kPa with a separation distance of 900µm as a functionof bubble diameter.
The discrepancy between theory and measurements for resonant bub-bles might be ascribed partly to measurement uncertainties and partlyto an inadequate theoretical description of the bubble oscillations. Dueto the strongly resonant behavior of the bubbles, a possible small difier-ence between the measured and the actual bubble size can dramaticallyin°uence the results. Such problem was limited, although not totally elim-inated, by changing the bubble diameter until a maximal displacementcould be observed. Moreover, resonating free air bubbles experience verystrong nonlinear expansions and contractions, while the model considers aflxed (resting) radius for the drag force and ignores possible contributionof added mass force, which is known to be relevant for highly nonlinear

122 CHAPTER 7. Ultrasonic manipulation of emboli
Figure 7.8: Oscillations of a bubble with 44µm diameter observed withthe Brandaris 128. a)-b)-c) nonlinear bubble pulsations; d)-e)-f) non-spherical bubble vibrations.
oscillations10. The discrepancies between measurements and model predic-tions become more evident at higher pressures. The model in fact assumesthat the bubble remains spherical under ultrasonic irradiation. However,for resonant bubbles, and relatively high pressures, such assumption isno more valid. This flnding was demonstrated using the ultra fast digi-tal camera and some data are presented in Chapter 3. As an example,the oscillations induced by a 60 kPa pressure wave on a bubble of 44 µmresting radius were recorded at frame rate of 1.5 MHz and are displayedin Figure 7.8. The flgure shows various frames taken during a single 6cycles insonation burst. First three frames show the bubble at rest (Fig-ure 7.8a), at maximal compression (Figure 7.8b) and at maximal expansion(Figure 7.8c). Figure 7.8d-f, taken during later insonation cycles, displayclearly non-spherical oscillations of the bubbles. The efiect was reversibleand after the passage of the US burst, the bubbles recovered their initialdiameter and shape Such images conflrm that, even at a relatively lowacoustic pressure, the bubble shape does not remain spherical anymoreand new surface vibration modes are generated.

Conclusions 123
7.4 Conclusions
In this chapter, the efiects of the acoustic radiation force on the bubbletranslation were investigated as a function of the bubble characteristicsand the US parameters. As expected by theory, the bubble displacementincreases linearly with both the burst length and the transmitted acousticpressure. The displacement is strongly correlated to the bubble diameteras well as to the separation distance between two bubbles. It has beendemonstrated that, independently of the US settings, bubbles at theresonance size lead to a maximal displacement while other bubble sizesproduce lower but non-negligible displacements. The density of thebubbles also afiects considerably the measured displacement. For highbubble concentration, the displacement induced by the US force stronglydecreases. This may be related to the efiect of secondary radiation force,which seems to have a limiting efiect similar to that of the drag force.The theoretical model here shows a good overall agreement with theexperiments, both qualitatively and quantitatively. Only around theresonance size, the simulations appreciably overestimate the displacement.This is probably due to the fact that the model neglects the bubble sizeoscillations that are relevant in the case of large free air bubbles likethose used in this work. At relatively high pressure levels, the behaviorof free air bubbles is quite complex, as observed with an ultra fastdigital camera, and therefore the simplifled theoretical model may be notaccurate enough. A more complex model including the efiect of bubbleoscillations on the drag force as well the added mass force would be moresuitable in this regime. Overall, this study has demonstrated that evena single US pulse may disturb considerably a °ow path of individual airbubbles and consequently its shape and its response.
References
1. V.F.K. Bjerknes, \Fields of force", New York: Columbia University Press,1906.
2. J.L. Smith, D.H. Evans, and A.R. Naylor, \Analysis of the frequency mod-ulation present in Doppler ultrasound signals may allow difierentiationbetween particulate and gaseous cerebral emboli", Ultrasound Med Biol,vol. 23, no. 5: pp. 727-734, 1997.
3. P.A. Dayton, K.E. Morgan, A.L. Klibanov, G. Brandenburger,K.R. Nightingale, and K.W. Ferrara, \A preliminary evaluation of the ef-
124 CHAPTER 7. Ultrasonic manipulation of emboli
fects of primary and secondary radiation forces on acoustic contrast agents",IEEE Trans Ultrason Ferr Freq Con, vol. 44, no. 6: pp. 1264-1277, 1997.
4. P. Tortoli, M. Pratesi, and V. Michelassi, \Doppler spectra from contrastagents crossing an ultrasound fleld", IEEE Trans Ultrason Ferr Freq Con,vol. 47, no. 3: pp. 716-726, 2000.
5. P. Tortoli, V. Michelassi, M. Corsi, R. D., and Y. Takeushi, \On the in-teraction between ultrasound and contrast agents during Doppler investi-gations", Ultrasound Med Biol, vol. 27, no. 9: pp. 1265-1273, 2001.
6. P.A. Dayton, J.S. Allen, and K.W. Ferrara, \The magnitude of radiationforce on ultrasound contrast agents", J Acoust Soc Am, vol. 112, no. 5:pp. 2183-2192, 2002.
7. P. Palanchon, J. Klein, and N. de Jong, \Production of standardized airbubbles: application to embolism studies", Rev Sci Instrum, vol. 74, no. 4:pp. 2558-2564, 2003.
8. T.G. Leighton, \The Acoustic Bubble", London Academic Press Limited,1994.
9. H. Medwin, \Counting bubbles acoustically: a review", Ultrasonics, vol. 15,no. 1: pp. 7-13, 1977.
10. T.J. Matula, \Bubble levitation and translation under single bubble sono-luminescence conditions", J Acoust Soc Am, vol. 114, no. 2: pp. 775-781,2003.
11. C.T. Chin, C. Lance, J. Borsboom, F. Mastik, M.E. Frijlink, N. de Jong,M. Verslluis, and D. Lhose, \Brandaris 128: a digital 25 million frames persecond camera with 128 highly sensitive frames", Rev Sci Instrum, vol. 74,no. 12: pp. 5026-5034, 2003.

Chapter 8Summary and conclusions
125

126 CHAPTER 8. Summary and conclusions
8.1 Introduction
The ultrasound community has experienced dramatic technical advancesover the last decades, such as blood flow measurements with elabo-rate Doppler techniques or real time three-dimensional imaging with 2-Dphased array transducers. This was partly ascribed to the advantages ofultrasound over other diagnostic modalities, including its low cost, real-time character and safety.One of these recent ultrasound technologies is Transcranial Doppler(TCD). TCD is a non-invasive ultrasound method used to assess blood flowvelocity in the major basal intracranial arteries on a real time basis. Sincethe early 60’s, experimental studies have been carried out to evaluate theability of TCD to detect, quantify and classify intracranial emboli. Manyresearch centers have investigated the appearance of high intensity tran-sient signals in the TCD waveform as indicators of circulating microemboli,in a wide variety of clinical areas: cardiac and carotid surgery1,2, followingprosthetic heart valve insertion3, cerebral angiography4, atrial fibrillation5
and decompression sickness6. Many reports have emphasized the abilityof TCD, combined to sophisticated signal processing techniques, to iden-tify microemboli in the brain circulation. Unfortunately, this technologypresents some limitations to distinguish between emboli and artefacts7−11
and more importantly to determine the embolus composition12−14. There-fore, the accuracy and clinical significance of the TCD technique for emboliclassification has not yet been scientifically established. Further researchis currently undergoing to implement an on-line automated embolus de-tection and classification method in clinical routine15−17.
8.2 Nonlinear scattering
This thesis has investigated a novel approach to detect, quantify and clas-sify microemboli using ultrasound. It was demonstrated through variousexperimental and theoretical studies that the acoustic signatures of gasparticles, solid particles and tissues are different from each other. The firstdifference between these scattering structures occurs at the main transmit(fundamental) frequency, basis of TCD emboli detection methods. Eventhough the scattering capability of a gaseous embolus is usually strongerthan solid particulate, their discrimination based on their responses atthe fundamental frequency is very delicate. The main difference betweenscattering properties of solid and gaseous emboli occurs in their nonlinearregime, known as harmonics. Gaseous emboli due to their extremely highcompressibility can enter into natural resonance scattering ultrasound en-ergy not only at the fundamental frequency but also at harmonics of the

Nonlinear scattering 127
fundamental frequency 2f0, 3f0, etc. Beside these harmonic frequencies,subharmonic (1/2f0) and ultraharmonic (3/2f0, 5/2f0, etc) componentsmight also be generated. All these nonlinear frequency components canonly be attributed to gas particles and cannot be generated by solid em-boli. Moreover, harmonic frequency generation depends not only on thetransmitted frequency and acoustic pressure, but also on the size of thegaseous embolus. This size-harmonic relationship gives a real opportunityto size gaseous emboli using harmonic ultrasound.
Chapter 2 describes in details a technical device to generate control-lable gas microbubbles, used to simulate gaseous emboli. Such a deviceis of extreme importance to conduct acoustic measurements and elaboratenew ultrasonic methods to detect and classify microemboli. The “bubblemaker” relies on a glass micropipette connected to an air pressure source.The bubbles are carried away by a liquid flowpath crossing the micropipettetip. By adjusting the settings of the device, air bubbles can be producedwith various sizes and densities. Typically the size of generated microbub-bles ranges from 10µm to 300µm, a size within the same range as clinicallyencountered emboli sizes.
Chapter 3 evaluates a theoretical model based on a modified Rayleigh-Plesset equation that predicts the dynamics and acoustic response of agaseous embolus. To do so, a high speed camera (BRANDARIS128) wasused to observe the oscillations of individual gaseous embolus under ultra-sound insonification. The experimental findings were compared to theoret-ical predictions and showed satisfactory agreements. The model is henceused to assess the acoustic properties of gaseous emboli and serves as thetheoretical basis to investigate the performances of a new detection andclassification method.
Chapter 4 demonstrates that gaseous emboli exposed to low frequencytransmission signals generate second and higher harmonics depending ontheir initial diameter. Solid emboli do not oscillate and reflect the acousticenergy passively at the transmitted fundamental frequency. Therefore anyharmonic component detected in the scattered emboli signal indicates thepresence of gaseous emboli and discards the presence of solid emboli. Mea-surements and simulations showed that the generation of higher harmonicfrequencies (2nd, 3rd, 4th, 5th) is ascribed to gaseous emboli with sizes closeto the resonance size where the highest harmonic component is associatedonly with resonant gaseous emboli. Based on these findings, it is suggestedto use the second harmonic to attest the presence of gaseous emboli andthe higher harmonics to give indication of their size. With the frequenciesused in our experimental setup (130 kHz and 250 kHz), only gaseous em-boli with a diameter between 19µm and 62µm were detected. In order toenlarge the range of detectable emboli sizes, it was proposed, in Chapter
128 CHAPTER 8. Summary and conclusions
5, to focus on the subharmonic and the first ultraharmonic components.These frequency components occur at 1/2f0 and 3/2f0, and are exclusivelygenerated by gaseous emboli with a size close to twice the resonance size,widening by that the range of detectable bubble diameters. By performingin-vitro acoustic experiments and modelling, it was established that theseharmonic components are very sensitive to the size of the gaseous embolus.With selective reception of subharmonic and ultraharmonic, emboli witha diameter ranging from 65µm to 110µm could be detected at frequenciesof 65 kHz and 195 kHz using an ultrasound waveform of 130 kHz in trans-mission. As a conclusion the combination of second and higher harmonics,subharmonic and ultraharmonic, gaseous microemboli with size extendingfrom 19µm to 110µm can be correctly classified and sized.
8.3 Embolus transducer
This new harmonic classification approach requires an ultrasound technol-ogy different from the current TCD detection systems. Simulations andmeasurements showed that frequencies used in transmission should be closeto the resonance frequency of clinically known gaseous emboli, and thusshould be much lower than frequencies conventionally used in the medi-cal field. TCD transducers operate in the MHz range (2− 2.5MHz) and,hence, cannot generate the required acoustic energy at this low frequencyband. Second, received frequencies within the harmonic band also differfrom TCD received frequencies. Last, the frequency bandwidth of receivedsignal (including various harmonic components) is wider and cannot becovered by current TCD transducer technology. All these requirementshave instigated the use of a new generation of emboli transducers. The“Embolus Transducer” should be able to transmit in the low frequencyband and receive multiple high frequencies over a wide frequency band.
Chapter 6 of the thesis describes two transducer designs where the sec-ond prototype can be considered as an improved version of the first one.Basically, the new transducer for emboli detection and classification is com-posed of 2 transmit elements, where both elements have different centerfrequency. The prototype has center frequencies of 130 kHz and 360 kHz.In order to receive subharmonic, harmonics and ultraharmonic of gaseousemboli, the receive transducer should operate with a high sensitivity overa wide frequency band: from 50 kHz up to a few MHz. With currentlyavailable transducer technology, PVDF based elements represent a judi-cious choice. A layer of PVDF was added on top of both transmittingelements and used in receive mode only. The performances of this trans-ducer for emboli detection and classification were assessed in an in vitro
Ultrasound manipulation of a gaseous embolus 129
setup. Although the tests are preliminary, the obtained results demon-strate the feasibility of this novel harmonic approach combined with thenew emboli transducer in detecting, classifying and sizing a wide range ofgaseous emboli.
8.4 Ultrasound manipulation of a gaseous embolus
In the last Chapter of the thesis, the mechanical influences of ultrasoundwaves on flowing gaseous microbubbles were investigated experimentally.The purpose of this study was to establish any direct influence of ultra-sound waves on the movement and behavior of the microbubbles and bythat on their Doppler response. The interaction between ultrasound wavesand flowing microbubbles was recorded optically and showed that strongradiation forces are applied on the microbubbles deforming by that theirinitial trajectory. In addition, it was observed that with adequate ultra-sonic interrogation conditions, the microbubbles undergo strong distortionand fragmentation. Although demonstrated in a controlled experimentalenvironment, such a consequence can be used to destroy or break a gaseousembolus into smaller fragments, reducing or eliminating by that its clinicalconsequences.
8.5 General discussion and future directions
Embolus transducer: Current TCD transducers were designed to as-sess blood flow velocity and therefore were optimized for this task. Thepreliminary in vitro results appear promising and thus encourage to con-tinue further developments of the Embolus Transducer. Although it wastested with a method based on RF signal processing, it could also operatein a Doppler-like mode to take benefit of the advantages of both meth-ods. The nonlinear properties of gaseous microemboli are not exploited incurrent TCD processing. Our conviction is that they bring real opportuni-ties for microemboli classification and should be also used in combinationwith Doppler processing to improve the detection and discrimination rate.The emboli transducer operating at low frequency (less than 500 kHz) maypresent some advantages over the common TCD probes, resulting in a bet-ter microembolic signal detection. The signal to background noise ratio isexpected to increase when lower frequencies are used in transmission. Fur-thermore, lower frequencies lead to a better skull penetration, improvingby that the identification of the cerebral arteries. Previous studies usinga 1 MHz TCD probe demonstrated the improvement of the embolic signaldetection18 as well as the reduction of patient presenting absent or insuf-
130 CHAPTER 8. Summary and conclusions
ficient temporal bone windows19. The current emboli transducer designstill requires further improvements. The preliminary results have shownsome limitations in both transmission and reception modes. For instance,the low frequency outer element generates insufficient acoustic pressures,which reduces the generation of the subharmonic component. Further-more, the electronics used to match the impedance between the differentelements of the transducer and the experimental instrumentation conductto a decrease of the signal to noise ratio, reducing the detection sensitivity.Technical improvements are currently under realization.
Harmonic emboli classification and sizing: The literature reportsmany studies describing new processing strategies used to detect and clas-sify gaseous and solid microparticles using TCD techniques. The radio-frequency information has been filtered out and only Doppler informationis remaining. Nonlinear properties of gaseous emboli could be exploitedin this area and combined to some sophisticated signal analysis to providemore efficient methods of emboli detection and classification. This thesispresents the basis of a classification and sizing system based on harmonicultrasound. The classification part is based on the appearance of nonlinearcomponents into the frequency spectrum of the backscattered RF signaland is directly correlated to the presence of a gaseous embolus. Meanwhile,the sizing procedure is performed by selective harmonic component type:higher harmonics (from the 2nd harmonic) are correlated to gaseous emboliwith a diameter close to the resonance diameter of the insonated frequency.Subharmonic and/or ultraharmonic give evidence of gaseous emboli with adiameter close to twice the resonance diameter of the insonated frequency.This approach offers the possibility to estimate gaseous emboli diameterswith a deviation of ±20µm.
Future directions: The immediate extension of the work presented inthis thesis include the study of an improved version of the emboli trans-ducer in animal experiments as well as in clinical situations. The embolustransducer could be used either in extracorporeal circuits or directly ap-plied on the carotid artery. A TCD instrument may be used conjointlyto ensure the correct positioning of the transducer in respect to the bloodflow as well as to validate the emboli detection performed by the embolitransducer.A second approach of the embolism problem would be to exploit the di-rect action of the ultrasound burst on a gaseous embolus. As reported inChapters 3 and 7, under specific ultrasound scanning conditions, gaseousemboli are undergoing strong shape distortions and they can even breakapart. This property can be used to destroy gaseous emboli. Further in-

References 131
vestigations are required to specify the ideal ultrasonic conditions in termsof frequency, acoustic pressure, burst length and pulse repetition rate.The results presented in this thesis show that an eight-cycles single bursttransmitted at frequency of 130 kHz is sufficient to break microbubbles be-tween 80µm and 225µm into smaller bubble fragments, rendering themless harmful.
References
1. W. Pugsley, L. Klinger, C. Paschalis, T. Treasure, M. Harrison, and S. New-man, “The impact of microemboli during cardiopulmonary bypass on neu-ropsychological functioning”, Stroke, vol. 25, no. 7: pp. 1393-1399, 1994.
2. R.G.A. Ackerstaff, C. Jansen, and F.L. Moll, “Carotid endarterectomy andintraoperative emboli detection”, Echocardiography, vol. 13, no. 5: pp. 543-550, 1996.
3. D. Georgiadis, D. Grosset, A. Kelman, A. Faichney, and K.R. Lees, “Preva-lence and characteristics of intracranial microemboli signals in patients withdifferent types of prosthetic cardiac valves”, Stroke, vol. 25, no. 11: pp. 587-592, 1994.
4. H.S. Markus, A. Loh, D. Israel, T. Buckenham, A. Clifton, andM.M. Brown, “Microscopic air embolism during cerebral angiography andstrategies for its avoidance”, The Lancet, vol. 341, no.: pp. 784-787, 1993.
5. C.H. Tegeler, L.P. Hitchings, M. Eicke, J. Leighton, R.K. Fredericks,T.R. Downes, D.A. Stump, and G.L. Burke, “Microemboli detection instroke associated with atrial fibrillation”, J Cardiovasc Tech, vol. 9: pp. 283-284, 1990.
6. B.A. Hills and B.D. Butler, “Size distribution of intravascular air emboliproduced by decompression”, Undersea Biomed Res, vol. 8, no. 3: pp. 163-170, 1981.
7. J. Molloy and H.S. Markus, “Multigated Doppler ultrasound in the de-tection of emboli in a flow model and emboli signals in patients”, Stroke,vol. 27, no. 9: pp. 1548-1552, 1996.
8. E.V. van Zuilen, W.H. Mess, C. Jansen, I. van Der Twell, J. van Gijn, andR.G.A. Ackerstaff, “Automatic embolus detection compared with humanexperts”, Stroke, vol. 27, no. 10: pp. 1840-1843, 1996.
9. M. Cullinane, G. Reid, R. Dittrich, Z. Kaposzta, R.G.A. Ackerstaff,V. Babikian, D.W. Droste, D. Grosset, M. Siebler, L. Valton, and

132 CHAPTER 8. Summary and conclusions
H.S. Markus, “Evaluation of new online automated embolic signal detec-tion algorithm including comparison with panel of international experts”,Stroke, vol. 31, no. 6: pp. 1335-1341, 2000.
10. L. Fan, D. Evans, and A. Naylor, “Automated embolus identification usinga rule-based expert system”, Ultrasound Med Biol, vol. 27, no. 8: pp. 1065-1077, 2001.
11. N. Aydin, S. Padayache, and H.S. Markus, “The use of the wavelet trans-form to describe embolic signals”, Ultrasound Med Biol, vol. 6, no.: pp. 953-958, 1999.
12. G. Devuyst, G.A. Darbellay, J.M. Vesin, V. Kemeny, M. Ritter,D.W. Droste, C. Moline, J. Serena, R. Sztajzel, P. Ruchat, C. Lucchesi,G. Dietler, E.B. Ringelstein, P.A. Despland, and J. Bogousslavsky, “Au-tomatic classification of HITS into artifacts or solid or gaseous emboli bya wavelet representation combined with dual gated TCD”, Stroke, vol. 32,no. 12: pp. 2803-2809, 2001.
13. D. Russell and R. Brucher, “Online automatic discrimination between solidand gaseous cerebral microemboli with the first multifrequency TranscranialDoppler”, Stroke, vol. 33, no. 8: pp. 1975-1980, 2002.
14. J.L. Smith, D.H. Evans, P.R.F. Bell, and A.R. Naylor, “A comparison offour methods for distinguishing Doppler signals from gaseous and particu-late emboli”, Stroke, vol. 29, no. 7: pp. 1133-1138, 1998.
15. M. Cullinane, Z. Kaposzta, S. Reihill, and H.S. Markus, “Online automateddetection of cerebral embolic signals from a variety of embolic sources”,Ultrasound Med Biol, vol. 28, no. 10, pp. 1271-1277, 2002.
16. A.G. Munts, W.H. Mess, E.F. Bruggemans, L. Walda, and R.G.A. Ack-erstaff, “Feasibility and reliability of on-line automated microemboli de-tection after carotid endarterectomy. A Transcranial Doppler study”,Eur J Vasc Endovasc Surg, vol. 25, no. 3, pp. 262-266, 2003.
17. L. Fan, D.H. Evans, A.R. Naylor, and P. Tortoli, “Real-time identificationand archiving of micro-embolic Doppler signals using a knowledge-basedDSP system”, Med Biol Eng Comput, vol. 42, no. 2, pp. 193-200, 2004.
18. M. Cullinane and S.H. Markus, “Evaluation of 1 MHz transducer for Tran-scranial Doppler ultrasound including embolic signal detection”, Ultra-sound Med Biol, vol. 27, no. 6: pp. 785-800, 2001.
19. C. Klotzsch, O. Popescu, and P. Berlit, “A new 1 MHz probe for Tran-scranial Doppler sonography in patients with inadequate temporal bonewindows”, Ultrasound Med Biol, vol. 24, no. 1: pp. 101-103, 1998.

Samenvatting
Medisch ultrageluid heeft de laatste tientallen jaren grote vooruitganggeboekt als gevolg van technische vernieuwingen. Voorbeelden hiervan zijnhoogfrequent toepassingen en het meten van de snelheid van bloed doormiddel van geavanceerde Doppler technieken. Een van deze techniekendie grote vooruitgang heeft geboekt is Transcranile Doppler (TCD). TCDis een niet-invasieve methode om de bloedstroom in de hersenarterin temeten. Dit gebeurt “real-time”. Verschillende studies hebben sinds be-gin jaren zestig TCD gebruikt om embolin in de hersenen te detecteren,te kwantificeren en te classificeren. Een tijdelijke, maar zeer explicieteverhoging van het TCD-signaal werd gebruikt als indicator voor embolin.Deze embolin kunnen ontstaan na een kunstklep- of carotis-operatie, na-dat een angioscan van de hersenen is gemaakt, bij atriumfibrilatie of bijdiepzee duiken. Talrijke artikelen beschrijven het gebruik van TCD, in-clusief het gebruik van geavanceerde signaal bewerking, om embolin in dehersenen te identificeren. Toch heeft het gebruik van deze techniek eentweetal serieuze beperkingen. Enerzijds om embolin te onderscheiden vanartifacts (signaalveranderingen die lijken op een embolie, maar die geenembolie blijkt te zijn) en te bepalen of een embolie een gasbel is of dat hetbestaat uit een vetbolletje, geklonterd bloed of ander materiaal (deeltjes-embolie).Dit proefschrift beschrijft een nieuwe methode om embolin te klassificerenen te kwantificeren m.b.v. ultrageluid. Theoretische studies en exper-imenten, beschreven in dit proefschrift hebben aangetoond dat de ultra-geluidseigenschappen van gasembolin verschilt met die van vaste deeltjes endat van weefsel. Dit is reeds het geval voor de reflecties van fundamentelefrequentie, die feitelijk de basis is voor het TCD-signaal. De intensiteitvan de reflectie van een gasembolie is gewoonlijk veel hoger van die vaneen deeltjesembolie, maar desalniettemin blijft een techniek gebaseerd op
133
134 Samenvatting
dit intensiteit-verschil zeer delicaat. Het belangrijkste verschil tussen gas-en een deeltjesembolie is hun lineaire gedrag als ze aangestraald wordendoor ultrageluid, resulterend in boventonen (harmonische) in de reflec-tie. Gasembolin, onder invloed van ultrageluid, vertonen bovendien eenresonant gedrag, vergelijkbaar met een massa-veer systeem. De compress-ibiliteit van het gas in de bel is dan het analagon voor de veerconstante.De vloeistof rondom de bel is analagon voor de massa. Zo’n systeem triltnaast de fundamentele ook in zijn harmonische (2f0, 3f0, etc...), maar ookop de subharmonische (1/2f0) en ultraharmonische (3/2f0, 5/2f0, etc...).Deeltjesembolin vertonen al. deze harmonische en subharmonische niet.De amplitude van deze harmonische, in geval van een gasembolie hangtniet alleen af van de uitgestraalde frequentie en amplitude van het ultra-geluid, maar ook van de grootte van de gasembolie. Het gebruik van dezeafhankelijkheid (harmonische en grootte) is een ideale mogelijkheid om degrootte van gasembolin m.b.v. ultrageluid op te meten.Hoofdstuk 2 beschrijft in detail het apparaat waarmee microbellen, dievergelijkbaar zijn met de gasembolin kunnen worden gemaakt. Zo’n ap-paraat is uiterst belangrijk daar hiermee op een gecontroleerde en repro-duceerbare wijze studies kunnen worden uitgevoerd om gasembolin te klas-sificeren. De bellenmaker bestaat uit een micropipet waardoor lucht meteen instelbare druk wordt geblazen. Langs het uiteinde van de micropipetstroomt water en deze neemt de luchtbel die aan het einde van de pipetontstaat mee in de vloeistofstroom. Door de luchtdruk en de snelheid vanhet water te variren kunnen bellen van verschillende grootte en concen-tratie gemaakt worden. Op deze manier kunnen belgrootte tussen de 10en 300µmm worden gemaakt. Dit is dezelfde range als die van de gasem-bolin die in de klinische praktijk voorkomen.In hoofdstuk 3 wordt een theoretisch model gepresenteerd dat is gebaseerdop de Rayleigh-Plesset vergelijking. Met dit model is het dynamisch gedragen daarbij het ultrageluidveld van een gasembolie te berekenen als het doorultrageluid wordt aangestraald. De experimenten zijn in goede overeen-stemming met de theoretische resultaten. Het theoretische model is ge-bruikt om de akoestische eigenschappen van gasembolin te voorspellen enom nieuwe detectie en klassificatie strategien te testen.In hoofdstuk 4 wordt aangetoond dat gasembolin, afhankelijk van hungrootte, en aangestraald met laagfrequentie ultrageluid, 2nd en hogere har-monische afstralen. Deeltjes-embolin vertonen geen volumetrillingen, zoalsgasembolin en reflecteren (terugstralen) hierdoor alleen maar de funda-mentele, ingestraalde frequentie. Dus, harmonische componenten in hetgereflecteerde signaal geeft de aanwezigheid aan van gasembolin en sluithierbij deeltjesembolin uit. Metingen en simulaties tonen aan dat hogereharmonische (2nd, 3rd, 4th, 5th) veroorzaakt worden door gasembolin met

135
een grootte dichtbij de resonantie grootte. M.a.w. de hogere harmonischecomponenten treden alleen op voor resonante bellen. De 2nd harmonischekan gebruikt worden om de aanwezigheid van bellen aan te tonen en dehogere harmonische om de grootte te bepalen. Doordat in de experimenten130 kHz en 250 kHz werd gebruikt konden alleen maar embolin tussen 19en 62 µm worden opgemeten.Om een groter bereik te kunnen meten, wordt in hoofdstuk 5 de methodeuitgebreid naar de sub- en ultraharmonische. Dit zijn de componenten op1/2f0 en 3/2f0 en worden alleen afgestraald door bellen die een groottehebben gelijk aan tweemaal de resonatiegrootte. Zowel de experimenten,als het theoretische model bevestigen dat de sub- en ultraharmonische eenzeer goede indicator is voor de belgrootte. Gasembolin varirend van 65en 110µm konden worden gemeten m.b.v. de sub- en ultraharmonische,zijnde 65 en 195 kHz indien een aanstraalfrequentie wordt gebruikt van130 kHz. Dus als de sub- en ultraharmonische in combinatie met de tweedeen hogere harmonische wordt toegepast, dan kunnen gasembolin, varirendvan 19-110µm worden opgemeten. Deze nieuwe methode van detecterenen klassificeren kan niet met een huidige TCD-machine, maar vereist eencompleet nieuw systeem. Zowel de simulaties als de experimenten latenzien dat de ingestraalde ultrageluidfrequentie nabij de resonatiefrequen-tie (100 - 500 kHz) van de gasembolin moet liggen. Dit houdt aanzienlijklagere frequenties in dan normaal worden gebruikt in de medisch ultra-geluid diagnostiek. TCD-transducers hebben een frequentie van 2MHz enzijn derhalve niet geschikt om ultrageluid uit te zenden met frequentiestussen de 100 en 500 kHz. Verder kunnen de harmonische frequenties ookniet worden ontvangen door een TCD-transducer en bovendien is de band-breedte van een TCD te beperkt om alle harmonische berhaupt te kunnenontvangen. Een ideale transducer voor emboliedetectie moet derhalve ver-schillende frequenties uitzenden in de 100 kHz range en is in ontvangstgevoelig voor de harmonische.Hoofdstuk 6 beschrijft 2 nieuwe ”embolie-transducers” waarbij de tweedeeen verbeterde versie is van de eerste. De nieuwe transducer bestaat uit2 ringen, waarbij de binnenring een frequentie heeft van 360 kHz en debuitenring van 130 kHz. Deze 2 ringen worden gebruikt in zenden. Inontvangst dienen zowel de sub-, als ook de ultra- en higherharmonischte worden ontvangen. Dit betekent een frequentieband tussen 50 kHz en1MHz en het gebruik van PVDF-materiaal is dan een logische en gerecht-vaardigde keuze. Een PVDF-laag is bovenop de 2 ringen gemonteerd enwordt als ontvanger gebruikt. Deze nieuwe transducer is in vitro getest.Alhoewel de resultaten nog een voorlopig karakter hebben, tonen deze welde potentie aan om met n transducer een grote variteit aan gasembolin tekunnen detecteren en te classificeren.

136 Samenvatting
In het laatste hoofdstuk wordt de stralingsdruk die de bellen ondervindenexperimenteel bestudeerd. Deze stralingsdruk veroorzaakt een verplaats-ing van de bellen die van invloed kunnen zijn op het Doppler signaal.Optische opnamen m.b.v. een lange-afstands microscoop en een snellecamera tonen aan dat deze verplaatsing significant is en dat hierdoor hetbellentraject verstoord wordt.
Dankwoord
A Ph. D. thesis is linked to only one author but it could not have beendone without the contribution of many people.
Prof. J. Klein, as one of my promotors, I really thank you for you sup-port as a clinician to better harmonize my research with the clinical field.Your enthusiasm about this ‘technical’ project was extremely encouraging.
Prof N. de Jong, you have always guided my research with constructiveadvices and judicious comments. Thanks for giving me the opportunity toobtain a Ph. D. in such a world-famous lab. I hope I was able to catchsome of your scientific skills in default of the Dutch language.
Prof. K. Bom and Prof. van der Steen, I am very honored to graduatefrom your lab. Working with you was inspiring. I am grateful for yourconstant encouragement and interest to this challenging project.
Dr. Piero Tortoli, it was a pleasure to discuss about Doppler and bub-bles and I enjoyed working with you. Ammiro altrettanto le vostre com-petenze scientifiche che le vostre grande qualita umane.
Charles Lancee, it is always very compelling to talk with you abouteverything but also transducers. Your contribution to the design of theembolus transducer was very helpful.
Jan Honkoop, I greatly acknowledge your support for solving all theelectronic troubles. Thanks for your time and your patience for explainingelectronics. I hope you won’t be so anxious anymore when I start solderingagain.
Leo Bekkering and Wim van Alphen, thanks for all the technical de-velopments. Special thanks to Leo for all the extra work you and for thesenice ‘Ph. D. studentproof’ devices you built. Cees Pakvis, thanks for help-ing in setting up the Brandaris camera experiments and for the wonderfuldrawings you made for this thesis. I would be pleased to be one of yoursponsors for the coming “Tour de France”.
137

138 Dankwoord
Writing a thesis in a language that is not your mother tongue is notan easy task. So, my sincere thanks go to Dave Goertz, Charles Lanc¶eeand Ayache Bouakaz for spending extra time reviewing the chapters of thisthesis. Special thanks to Michiel Postema and Fons Laan for their help insolving my incessant LATEX troubles.
I sincerely thank Mieke Pruijsten for her assistance in preparing myPh. D. o–cial documents and Riekje Daane for her unconditional cheer-fulness and contagious giggles. I do not forget the help of Corrie Eeftingwhen I started my Ph. D..
Martijn Frijlink, Marco Voormolen, Egon Merks, Antoinette ten Have,Roland van Lindt, Ester Vlaanderen, also named the \Expecho Bulls",sure you will never win the volley ball tournament but you are deflni-tively the best working team of Erasmus. Fritz Mastik, thanks for yourhelp in flxing the software problems and you will always be welcomefor a glass of ‘Calvados’. Radj Baldewsing (de autochtone maar nietde allochtone), sorry for disappointing you when you learned that I wasa \simple" Ph. D. student and not a postdoc. I also thank the restof the Exp Echo colleagues for sustaining an enjoyable working atmo-sphere, Boudewijn Krenning, Annemieke van Wamel, Johannes Schaar,Jerome Borsboom, Frans van Egmond, Esther Leung, Paul van Meer,Erik Droog and Marcia Emmer.
I would not forget Peter and Barbara, I hope you are used now tothe Swiss \Patee"; Mar¶‡a en Ferm¶‡n, muchas gracias por vuestra amistad;St¶ephane et Tine, un Rasteau vous attend au frais.
I would like to thank my \French Girls Connection" of Rotterdam:Odile, Zhajia, Florence, Marie, Marilyn and Faiza. Thanks for your friend-ship and for the nice French atmosphere that helped me to survive in theNetherlands!
I also thank all my friends in France, who supported me during thistime away.
Un grand merci µa toute ma famille et plus sp¶ecialement µa Katia pouravoir pollu¶e r¶eguliµerement ma mailbox et µa mamy pour m’avoir tenue aucourant des petits \potins" familiaux durant ces ann¶ees d’exil. Je d¶edieaussi cette thµese µa mes parents qui ont toujours soutenu mes choix et m’ontconstamment encourag¶ee durant ces longues ann¶ees d’¶etudes. Je ne sauraisoublier la grande qualit¶e de leur service de livraison µa domicile.
Special afiection to my sweet boy, Enzo, for waking me up every morn-ing at 6.00 am, singing your favorite song and for teaching me how lifecould be easy: eating banana and watching the Teletubbies.
Finally, Ayache. This thesis could not have been made without yoursupport during all these years. I will try to resume my feelings with thesefew words: \Achkourouka aala kouli e’ssaaada ellati djalabta fl hayati".

Curriculum Vitæ
Peggy Palanchon was born on April 9, 1973 in Rosny-Sous-Bois, France.She completed her high school education in 1991 at Lycee Andre Boullocheat Livry-Gargan, France. The same year she started her study at the Uni-versity Pierre et Marie Curie (Paris VI) where she obtained her Masterin Mechanics and Physics in 1996. In 1997, she completed her educa-tional program at the Institut National des Sciences Appliquees (INSA) inLyon, France where she obtained a Diplome d’Etudes Approfondies (DEA)at the department of Acoustics. Her graduation project was carried outat the laboratory CREATIS (Centre de Recherche et d’Applications enTraıtement de l’Image et du Signal). From November 1997 to February1999, she worked at the Whitaker Center, headed by Prof. K.K. Shung,Pennsylvania University, State College, USA. Her research project con-sisted of modelling and fabricating novel transducers for medical applica-tions and particularly Doppler applications. Her research focused on theconception of the Diffracting-Grating transducer, which was developed inclose collaboration with the industrial company EchoCath Inc., Prince-town, USA. In March 1999, she started a new project at the ExperimentalEchocardiography, headed by Prof. dr. ir. N. Bom. The idea was to developa simple ultrasonic device to measure non-invasively the volume of urinarybladder. In July 1999, she started a Ph. D. at Erasmus Medical Center,conjointly with the Anesthesiology Department, at the Laboratory of Ex-perimental Echocardiography under the supervision of Prof. dr. ir. J. Kleinand Prof. dr. ir. N. de Jong. Her Ph. D. research focused on the develop-ment of a new method using ultrasound to detect and characterize gaseousand solid microemboli.
139


List of publications
Peer reviewed international journals
• P. Palanchon, A. Bouakaz, J.H. van Blankestein, J. Klein, N. Bomand N. de Jong, “New Technique for emboli detection and discrim-ination based on nonlinear characteristics of gas bubbles”, Ultra-sound Med Biol, vol. 27, no. 6: pp. 801-808, 2001
• P. Palanchon, A. Bouakaz, J. Klein and N. de Jong, “Subharmonicand ultraharmonic emissions for emboli detection and characteriza-tion”, Ultrasound Med Biol, vol. 29, no. 3: pp.417-425, 2003
• P. Palanchon, J. Klein and N. de Jong, “Production of standard-ized air bubbles: application to embolism studies”, Rev Sci Instrum,vol. 74, no. 4: pp. 2558-2564, 2003
• P. Palanchon, A. Bouakaz, J. Klein and N. de Jong, “Emboli detec-tion using a new transducer design”, Ultrasound Med Biol, vol. 30,no. 1: pp. 123-126, 2004.
• P. Palanchon, D. Van Loon, N. Bom and C.H. Bangma, “Bladdervolume measurements with a limited number of fixed sound beams”,Ultrasound Med Biol, vol. 30, no. 3: pp. 289-294, 2004.
• P. Palanchon, P. Tortoli, A. Bouakaz and N. de Jong, “Optical obser-vations of acoustical radiation force effects on individual air bubbles”,Accepted for publication in IEEE Trans Ultrason Ferr Freq Con,2004.
• P. Palanchon, A. Bouakaz, J. Klein and N. de Jong, “Multifrequencytransducer for microemboli classification and sizing”, Accepted forpublication in IEEE Trans Biomed Eng, 2004.
141

142 Publications
• P. Palanchon, A. Bouakaz, J. Klein and N. de Jong, “Modellingand optical measurements of the acoustic behavior of air bubbles’,Submitted.
Conference proceedings
• D. Vilkomerson, T. Chilipka, M. Delamere, P. Lopath, P. Palan-chon and K.K. Shung, “Clinical blood flow measurements usingdiffraction-grating transducers”, IEEE Ultrasonics Symposium Pro-ceedings, vol. 2: pp. 1501-1508, 1998.
• P. Palanchon, D. Vilkomerson, T. Chilipka and K.K. Shung, “Im-proved diffracting grating transducers”, SPIE Proceedings Medi-cal Imaging, vol. 3664: pp. 155-160, 1999.
• P. Palanchon, H. Meeder, N. de Jong, J. Klein and N. Bom, “Embolidetection and discrimination using harmonic imaging”, IEEE Ultra-sonics Symposium Proceedings, vol. 2, pp. 1497-1500, 2000.
• P. Palanchon, A. Bouakaz, J. Klein and N. de Jong, “Gaseous em-boli detection through subharmonic and ultraharmonic emissions”,IEEE Ultrasonics Symposium Proceedings, vol. 2: pp. 1904-1907,2002.
• P. Palanchon, P. Tortoli, A. Bouakaz and N. de Jong, “Observationsof radiation forces effects on individual air bubbles with high-speedphotography”, IEEE Ultrasonics Symposium Proceedings, 2003.
• P. Palanchon, A. Bouakaz and N. de Jong, “Air bubble oscillationsin an ultrasound field: theoretical and optical results”, IEEE Ultra-sonics Symposium Proceedings, 2004.
• P. Palanchon, A. Bouakaz, J. Klein and N. de Jong, “A new mul-tifrequency transducer for microemboli detection”, IEEE Ultrason-ics Symposium Proceedings, 2004.
• M. Versluis, P. Palanchon, D. Goertz, S. van der Meer,C.T. Chin,D. Lohse and N. de Jong, “Microbubbles surface mode”, IEEE Ul-trasonics Symposium Proceedings, 2004.

Conference abstracts 143
Conference abstracts
• D. Vilkomerson, T. Chilipka, P. Lopath, P. Palanchon andK.K. Shung, “Clinical blood flow measurements using diffraction-grating transducers”, IEEE Ultrasonics Symposium, 1998.
• P. Palanchon, D. Vilkomerson, T. Chilipka and K.K. Shung, “Im-proved diffracting grating transducers”, SPIE, San Diego, CA, USA,1999.
• P. Palanchon, H. Meeder, N. de Jong, J. Klein and N. Bom, “Embolidetection and discrimination using harmonic imaging”, IEEE Ultra-sonics Symposium, Porto Rico, 2000.
• P. Palanchon, J. Klein, N. Bom and N. de Jong, “Air bubbles detec-tion and sizing method using higher harmonics”, 6th European Sym-posium on Ultrasound Contrast Imaging, Rotterdam, The Nether-lands, 2001.
• P. Palanchon, J. Klein, N. Bom and N. de Jong, “Nonlinear responseof gaseous emboli for clinical application”, Euroecho, Nice, France,2001.
• P. Palanchon, A. Bouakaz, J. Klein, N. Bom and N. de Jong, “Embolicharacterization using ultrasonic harmonic scattering”, 6th Meet-ing of the European Society of Neurosonology and Cerebral Hemody-namics, Lisbon, Portugal, 2001.
• P. Palanchon, A. Bouakaz, J. Klein and N. de Jong, “New ultra-sonic transducer for characterization of micro emboli”, 7th Meet-ing of the European Society of Neurosonology and Cerebral Hemo-dynamics, Bern, Switzerland, 2002.
• P. Palanchon, A. Bouakaz, J. Klein and N. de Jong, “Gaseous em-boli detection through subharmonic and ultraharmonic emissions”,IEEE Ultrasonics Symposium, Munich, Germany, 2002.
• P. Palanchon, A. Bouakaz, J. Klein and N. de Jong, “A new ultra-sonic transducer design for detection and classification of microem-boli”, Ultrasonics Symposium, Grenada, Spain, 2003.
• P. Palanchon, A. Bouakaz, J. Klein and N. de Jong, “Nonlinearbubbles properties applied to emboli detection and discrimination”,5th World Congress on Ultrasonics, Paris, France, 2003.

144 Publications
• P. Palanchon, P. Tortoli, A. Bouakaz and N. de Jong, “Observationsof radiation forces effects on individual air bubbles with high-speedphotography”, IEEE Ultrasonics Symposium, Hawaii, USA, 2003.
• M. Versluis, S. van der Meer, D. Lohse, C.T. Ching, D. Goertz,P. Palanchon and N. de Jong, “Surface modes of ultrasound contrastagents”, 9th European Symposium on Ultrasound Contrast Imaging,Rotterdam, The Netherlands, 2004.
• P. Palanchon, A. Bouakaz, J. Klein and N. de Jong, “Multifrequencytransducer for emboli classification”, 9th Meeting of the European So-ciety of Neurosonology and Cerebral Hemodynamics, Wetzlar, Ger-many, 2004.
• P. Palanchon, A. Bouakaz and N. de Jong, “Air bubble oscillationsin an ultrasound field: theoretical and optical results”, IEEE Ultra-sonics Symposium, Montreal, Canada, 2004.
• P. Palanchon, A. Bouakaz, J. Klein and N. de Jong, “A new mul-tifrequency transducer for microemboli detection”, IEEE Ultrason-ics Symposium, Montreal, Canada, 2004.
• M. Versluis, P. Palanchon, D. Goertz, S. van der Meer, C.T. Chin,D. Lohse and N. de Jong, “Microbubbles surface modes”, IEEE Ul-trasonics Symposium, Montreal, Canada, 2004.


Related Documents