1 Ultrasound assessment of fetal cardiac function and risk of adverse obstetric and neonatal outcomes in term fetuses MD (Res) Thesis Dr Gowrishankar Paramasivam CID number: 00681826 Department of Surgery and Cancer Imperial College London -U.K Supervisors: - Professor Phillip Bennett Professor Sailesh Kumar Declaration of originality I declare that this thesis is my original work. I have appropriately referenced where other’s work has been used in my thesis. Copyright declaration “The copyright of this thesis rests with the author and is made available under a Creative Commons Attribution, Non-commercial, No derivatives license. Researchers are free to copy, distribute or transmit the thesis on the condition that they attribute it, they do not use it for commercial purposes and that they do not alter, transform or build upon it. For any reuse or redistribution, researchers must make clear to others about the license terms of this work”

Welcome message from author
This document is posted to help you gain knowledge. Please leave a comment to let me know what you think about it! Share it to your friends and learn new things together.
Transcript

1
Ultrasound assessment of fetal cardiac function and risk of adverse obstetric
and neonatal outcomes in term fetuses
MD (Res) Thesis
Dr Gowrishankar Paramasivam
CID number: 00681826
Department of Surgery and Cancer
Imperial College
London -U.K
Supervisors: - Professor Phillip Bennett
Professor Sailesh Kumar
Declaration of originality
I declare that this thesis is my original work. I have appropriately referenced where other’s
work has been used in my thesis.
Copyright declaration
“The copyright of this thesis rests with the author and is made available under a Creative
Commons Attribution, Non-commercial, No derivatives license. Researchers are free to copy,
distribute or transmit the thesis on the condition that they attribute it, they do not use it for
commercial purposes and that they do not alter, transform or build upon it. For any reuse or
redistribution, researchers must make clear to others about the license terms of this work”

2
ABSTRACT
Aim: To measure the fetal cardiac output prior to labour and assess the risk of adverse
obstetric and neonatal outcome in singleton pregnancies with appropriately grown for
gestational age (AGA) fetuses at term.
Methods: This was a prospective observational study conducted at Queen Charlotte’s and
Chelsea Hospital, London UK. Fetal cardiac output and fetal cerebro-placental ratio (CPR)
was measured within 72 hours before birth in 200 nulliparous women having singleton
pregnancies with AGA fetuses. Scan details were not available to the clinicians and delivery
was managed per the local protocol and guidelines. Obstetric and neonatal outcomes were
obtained from case notes and were correlated with the ultrasound findings.
Results: Delivery was vaginal in 129 (64.5%) cases and by caesarean section in 71 (35.5%),
including 34 (17.0%) for fetal distress and 37 (18.5%) for failure to progress. Fetuses
delivered by caesarean section for fetal distress, compared to the remaining fetuses, had a
lower median left cardiac output (152.3 vs. 191.7 mL/min/kg; p=0.003), higher difference in
the median ratio between the right to left cardiac output (1.925 vs. 1.340; p=0.002) and
lower CPR (1.222 vs. 1.607; p<0.0001). In screening for emergency caesarean section for
fetal distress, for a 10% false positive rate, the detection rate with the ratio of the right to
the left cardiac output was higher that with the left cardiac output (41% vs. 29%) and with
the CPR (41% vs. 27%). Similarly, the positive predictive value for the ratio of right to left
cardiac output (45%) was higher than for left cardiac output (37%) and for the CPR (35%).
Conclusion: In AGA fetuses at term that develop intrapartum distress, there is evidence of
prelabour redistribution of the cardiac output. The ratio of the right to the left cardiac
output is superior to the left cardiac output and CPR in predicting intrapartum fetal distress.
Such assessments may be useful in stratifying patients for intensity of monitoring during
labour.

3
ACKNOWLEDGEMENTS
I am grateful to my supervisors, Professors Phillip Bennett and Sailesh Kumar, for their
invaluable help and guidance in my research.
I wish to thank the doctors and midwifes in the Department of Obstetrics at Queen
Charlotte’s and Chelsea Hospital for their immense help in recruiting patients and
supporting my research. My special thanks go out to Dr Tom Prior, for his invaluable help
and suggestions during my period of study.
I thank my parents who guided me to take up this noble profession. My wife, the silver
lining of every cloud in my life, has provided her unwavering support and encouragement
during my study; and my children who have accepted the importance of advancing in my
studies even if this was at the expense of time spent with them.

4
STATEMENT OF CANDIDATE CONTRIBUTION
I generated the hypothesis for the studies in this thesis together with my supervisors
Professors Phillip Bennett and Sailesh Kumar. I developed the study design and
methodology with the assistance from my supervisors. I undertook all the ultrasound
assessments, data collection, statistical analysis and wrote this thesis.

5
CONTENTS
Chapter 1 Introduction and literature review 12
1.1 Placental development and fetoplacental circulation:
Impact on fetal growth 14
1.2 Intra partum hypoxia and neural injury 15
1.3 Antenatal and intrapartum assessment of fetal well-being 17
1.4 Role of ultrasound to monitor growth and fetal well-being 20
1.5 Amniotic fluid volume 26
1.6 Meconium stained liquor 28
1.7 Doppler ultrasound in assessment of fetal well-being 29
1.8 Fetal cardiac function 40
1.9 Summary 46
Chapter 2 Methods 47
2.1 Introduction 47
2.2 Aim 47
2.3 Hypothesis 47
2.4 Methods 48
2.5 Ultrasound assessment 49
2.6 Fetal cardiac function 52
2.7 Diastolic function 52
2.8 Systolic function 54
2.9 Left ventricular myocardial performance index (LV-MPI) 56
Chapter 3 Pilot study 58
3.1 Introduction 58
3.2 Aims 58
3.3 Materials and Methods 59
3.4 Results 60
3.5 Discussion 65

6
Chapter 4 Pre-labour assessment of fetal cardiac function 68
4.1 Introduction 68
4.2 Aims 68
4.3 Hypothesis 69
4.4 Methods 69
4.5 Analysis of data 70
4.6 Results 71
4.7 Maternal demographics and ultrasound parameters 75
4.8 Cerebro -placental ratio (CPR) or Cerebro -umbilical ratio (C-U ratio) 78
4.9 Fetal cardiac function 82
4.10 Summary of fetal cardiac function 118
4.11 Amniotic fluid index (AFI) 119
4.12 Deepest vertical pool of liquor (DVP) 120
4.13 Intrapartum monitoring 122
4.14 Neonatal outcomes 124
4.15 Estimated fetal weight (EFW) and outcome 128
Chapter 5 Cardiac functional parameters, cerebroplacental ratio and risk of
adverse obstetric and neonatal outcomes 132
5.1 Maternal demographics and mode of delivery 132
5.2 Maternal demographics and ultrasound parameters 135
5.3 Ethnicity and ultrasound parameters 136
5.4 Cerebro -placental ratio (CPR) 138
5.5 Fetal cardiac functional parameters 140
5.6 Intrapartum and neonatal outcomes 152
Chapter 6 Fetal cardiac function and cerebroplacental ratio in the prediction
of adverse intrapartum outcome 159
6.1 Performance of screening in prediction of intrapartum fetal distress at term 159

7
Chapter 7 Conclusions 163
7.1 Strengths and limitations 163
7.2 Conclusions 167
7.3 Potential clinical application and further research 169
REFERENCES 176
PERMISSIONS 187
APPENDICES 198
ABBREVIATIONS 203
8
FIGURES
Figure 1.1: Hypoxic ischemic injury 16
Figure 1.2: Doppler indices 30
Figure 1.3: Umbilical artery waveform 31
Figure 1.4: Umbilical artery Pi 32
Figure 1.5: Umbilical artery Doppler abnormalities 33
Figure 1.6: Middle cerebral artery Doppler 34
Figure 1.7: Middle cerebral artery pulsatility index per gestation 35
Figure 1.8: Cerebroplacental ratio per gestation 37
Figure 1.9: Ductus venosus waveform 39
Figure 1.10: Right cardiac output across gestation 42
Figure 1.11: Left cardiac output across gestation 43
Figure 2.1: 2D Fetal cardiac Doppler-Diastolic function 53
Figure 2.2: 2D Fetal cardiac Doppler-Systolic function 55
Figure 2.3: 2D Fetal cardiac Doppler-MPI 57
Figure 4.1: Flow chart of recruitment 71
Figure 4.2: Maternal age and ultrasound parameters 75
Figure 4.3: BMI and ultrasound parameters 76
Figure 4.4: Gestational age and ultrasound parameters 77
Figure 4.5: CPR distribution 79
Figure 4.6: CPR centile and mode of delivery 81
Figure 4.7: RV stroke volume distribution 85
Figure 4.8: Right cardiac output distribution 88
Figure 4.9: Distribution of Ejection time at Aorta 91
Figure 4.10: Distribution of velocity time integral at Aorta 93
Figure 4.11: Distribution of LV stroke volume 95
Figure 4.12: LV stroke volume centile and M.O.D 97
Figure 4.13: Distribution of LCO/mL/min/kg 99
Figure 4.14: LCO centiles and M.O.D 101
Figure 4.15: Distribution of the difference between RV and LV stroke volume 103
Figure 4.16: Difference between RV and LV stroke volume per centile and M.O.D 105

9
Figure 4.17: Distribution of difference between RCO and LCO 106
Figure 4.18: Difference between RCO and LCO by centile and M.O.D 108
Figure 4.19: Ratio of RCO to LCO by centile and M.O.D 111
Figure 4.20: Correlation between RCO and LCO ratio with CPR and EFW 112
Figure 4.21: ROC curve to predict CS for fetal distress by ratio of the RCO to LCO 113
Figure 4.22: Distribution of CCO/mL/min/kg 114
Figure 4.23: Distribution of LV-MPI 116
Figure 4.24: Meconium-stained liquor and M.O.D 123
Figure 4.25: Correlation between estimated and actual birth weight 130
Figure 5.01: Correlation between VTI Aorta and LV stroke volume 143
Figure 5.02: Factors affecting Stroke volume 148
Figure 6.01: Prediction of CS-fetal distress by LCO, CPR and RCO to LCO ratio 160
Figure 6.02: PPV for CS-fetal distress by LCO, CPR and RCO to LCO ratio 161

10
TABLES
Table 1.1: NICE guidelines for electronic fetal heart rate monitoring interpretation 18
Table 1.2: Cardiac function parameters 45
Table 3.1: Maternal demographics, ethnicity and onset of labour 61
Table 3.2: Indication and M.O.D 62
Table 3.3: Fetal Doppler and M.O.D 62
Table 3.4: Fetal cardiac function parameters and M.O.D 64
Table 3.5: Inter and Intra observer variability 65
Table 4.1: Maternal demographics, ethnicity and onset of labour 72
Table 4.2: Indication and M.O.D 73
Table 4.3: Maternal demographics, ethnicity and M.O.D 73
Table 4.4: Ethnicity and important ultrasound parameters 78
Table 4.5: Relation between UA Pi, MCA Pi, CPR and M.O.D 78
Table 4.6: Descriptive statistics of CPR 79
Table 4.7: Dunn’s multiple comparison tests – CPR 80
Table 4.8: Fetal cardiac function assessment and M.O.D 83
Table 4.9: Descriptive statistics of RV Stroke volume 86
Table 4.10: Dunn’s multiple comparison tests – RV stroke volume 86
Table 4.11: Descriptive statistics of RCO/mL/min/kg 88
Table 4.12: Dunn’s multiple comparison tests – RCO/mL/min/kg 89
Table 4.13: Descriptive statistics of Ejection time at Aorta 92
Table 4.14: Dunn’s multiple comparison tests – Ejection time at Aorta 92
Table 4.15: Descriptive statistics of VTI Aorta 94
Table 4.16: Dunn’s multiple comparison tests – VTI Aorta 94
Table 4.17: Descriptive statistics of LV Stoke volume 96
Table 4.18: Dunn’s multiple comparison tests – LV Stroke volume 96
Table 4.19: M.O.D and LV stroke volume by centile 97
Table 4.20: Descriptive statistics of LCO/mL/min/kg 99
Table 4.21: Dunn’s multiple comparison tests – LCO/mL/min/kg 100
Table 4.22: M.O.D and LCO/mL/min/kg by centile 101

11
Table 4.23: Difference between RV and LV stroke volume 104
Table 4.24: Dunn’s multiple comparison tests – RV and LV stroke volume difference 104
Table 4.25: M.O.D and difference between RV and LV stroke volume by centile 106
Table 4.26: Descriptive statistics of difference between RCO and LCO 107
Table 4.27: Dunn’s multiple comparison tests – Difference between RCO and LCO 107
Table 4.28: Difference between RCO and LCO by centile and M.O.D 109
Table 4.29: Descriptive statistics of ratio of RCO to LCO 110
Table 4.30: Dunn’s multiple comparison tests – ratio of RCO to LCO 110
Table 4.31: Ratio of RCO to LCO by centile and M.O.D 111
Table 4.32: Descriptive statistics of CCO/mL/min/kg 115
Table 4.33: Dunn’s multiple comparison tests of CCO/mL/min/kg 115
Table 4.34: Descriptive statistics of LV-MPI 117
Table 4.35: Dunn’s multiple comparison tests of LV-MPI 117
Table 4.36: Descriptive statistics of AFI 119
Table 4.37: Dunn’s multiple comparison tests of AFI 119
Table 4.38: Descriptive statistics of DVP 120
Table 4.39: Dunn’s multiple comparison tests of DVP 121
Table 4.40: Comparison of CTG with important ultrasound parameters 122
Table 4.41: APGAR score and delivery outcomes 124
Table 4.42: Cord pH and mode of delivery 125
Table 4.43: Arterial pH and delivery outcome 126
Table 4.44: Indication and M.O.D by centiles of the arterial pH 126
Table 4.45: Base excess -descriptive statistics 127
Table 4.46: Dunn’s multiple comparison tests of base excess 127
Table 4.47: Descriptive statistics of EFW and M.O.D 128
Table 4.48: Dunn’s multiple comparison tests of EFW 129
Table 4.49: Difference between EFW and actual birth weight 130
Table 5.01: Correlation of Maternal demographics and ultrasound parameters 135
Table 7.01: Relative risk and likelihood ratios in prediction of CS for fetal distress 167
12
Chapter 1 Introduction and literature review
In pregnancies with some degree of uteroplacental insufficiency the fetus may either be
small for gestational age (SGA) or it may be appropriate for gestational age (AGA) but with
reduced nutritional and energy reserves leading to intrapartum compromise and neonatal
complications.(1) Although the traditional methods of antenatal monitoring, such as
measurement of symphysis-fundal height, or even routine ultrasound examination in the
third trimester may to varying degrees identify SGA fetuses, these methods cannot detect
compromised AGA fetuses.
Most neonatal neurological injuries predate labour; however, intrapartum hypoxia is also
associated with a significant risk of asphyxia and asphyxia-related morbidity and mortality.
Most of the malpractice claims analyses suggest that a large proportion may be
preventable.(2) There is a growing epidemic of medical malpractice litigation around the
world. Donn et al. in his article, describing the medico legal implications of hypoxic ischemic
injury concluded that brain damaged infants are among the costliest medical lawsuits in the
United States with an average indemnity claim of around half a million dollars. It is alleged
that extended period of intrapartum asphyxia may be associated with these events resulting
in long-term morbidities such as cerebral palsy and neurodevelopmental delay; however, it
is not possible to clearly establish a link between the duration of Intrapartum asphyxia and
the risk of abnormal neurodevelopmental outcome and mental handicap.(3)
Intrapartum hypoxia/ischemia occurs in around 8–28% of pregnancies,(4) but the majority of
them usually have an uneventful outcome. The majority (65%) of children diagnosed with

13
cerebral palsy (CP) are born at term and the incidence of CP has not declined in the past 30
years despite advances in intrapartum care.(5) It still remains as one of the leading causes of
childhood disability with a significant risk of neurodevelopmental delay and mental
handicap.(6)
Cerebral palsy has been monitored in western Sweden for more than 50 years, which
showed a stable incidence of 2 per 1000 live births although; the prevalence is much higher
in babies born before 26 weeks. Himmelmann et al. analysed the birth period from 2003 to
2006 in western Sweden and observed similar findings of CP when compared to earlier
studies and found that hemiplegia was the most common type (44%) of CP followed by
Diplegia (29%). They also noted that 46% of CP in their population group were due to
perinatal causes and 36% of the cases were associated with neonatal causes.(6)
While there is significant progress and improvement in the quality of antenatal, intrapartum
and new-born care, cases of hypoxic-ischemic injury have not decreased. A systematic
review on electronic fetal heart rate monitoring that included 37000 pregnancies from 13
trials concluded that electronic fetal heart rate monitoring assessment during intrapartum
period resulted in a significant increase in the caesarean section and instrumental vaginal
delivery rates with no significant difference in the CP rates.(7) It is still not clear why some of
the AGA fetuses at term do not tolerate labour despite antenatal and intrapartum
surveillance.

14
1.1 Placental development and fetoplacental circulation – Impact on fetal growth
Placental development begins in the first week after fertilisation when implantation is
initiated and involves the syncytiotrophoblast, cytotrophoblast, extraembryonic mesoderm
and the uterine (endometrial layer) tissues. Shortly after the blastocyst contacts the uterine
wall, the syncytiotrophoblast invades and erodes the maternal tissue which then forms
lacunae by the 9th day. By the 12th day, these lakes fill with maternal blood as the
syncytiotrophoblast erodes through uterine blood vessels. Placental villi begin to form by
day 13, which consists of a layer of syncytiotrophoblast and a core of cytotrophoblast and
protrude into the lacunae assisting in placental development.(8) Blood vessels from the
embryo continue to grow while the trophoblast continues its vascular invasion into the
uterine wall. The trophoblast cells continue to develop into more placental villi into which
the fetal capillaries grow to establish the fetal-maternal circulation.
Defective modelling of the spiral arteries is associated with an adverse obstetric outcome
resulting in fetal growth restriction and pre-eclampsia.(9) The histological changes which
occur in the placenta complicated by pre-eclampsia include increased number of syncytial
knots, areas of fibrinoid necrosis, proliferation of the media of the vessel wall with areas of
calcification and hyalinization.
Odibo et al. analysed the morphometric analysis of placenta and observed that reduced
volume and surface area of the terminal and intermediate villi were seen in pregnancies
complicated by SGA and pre-eclampsia.(10) Although defective placentation is associated
with abnormal outcome, the degree of abnormalities in deep placentation was found to be
different in the clinical presentations in pregnancies complicated by SGA and pre-eclampsia.
Kovo et al. in their study observed that in pregnancies affected by pre–eclampsia there is

15
defective maternal vascular supply lesions while in those with SGA fetuses there is evidence
of defective fetal vascular supply lesions.(11)
1.2 Intrapartum hypoxia and neural injury
Raised intra-uterine pressure during labour also reduces the uterine blood flow velocity by
up to 60% resulting in intrapartum fetal compromise.(12) These changes are more observed
in nulliparous women compared to multiparous women. The fetus responds to the reduced
volume of blood by redistributing to the vital organs, particularly the brain to prevent
cerebral hypoxemia, commonly referred to as “brain sparing effect”. These changes are
commonly seen in SGA fetuses.
Hypoxic ischemic injury (HII) to the brain frequently results in death or profound long-term
disability. Reduced cerebral blood flow results in brain ischemia due to cerebral hypoxemia
(Figure 1.1). Cerebral hypoxemia results in the conversion of oxidative phosphorylation to
anaerobic metabolism. This causes rapid depletion of adenosine triphosphate (ATP)
resulting in lactate accumulation within the cells eventually causing loss of normal cell
membrane function. This process triggers depolarization of presynaptic neuronal cell
membranes causing a massive release of glutamate, which binds to N-methyl d-aspartate
(NMDA) receptors. Activation of the NMDA receptors causes an influx of calcium ions,
triggering several cytotoxic processes and resulting in mitochondrial injury. This results in
further loss of ATP production and energy depletion causing apoptosis. The severity of brain
injury depends on the gestation at which the insult had occurred, the degree of brain
maturity and the duration of the abuse with severe changes occurring in preterm neonates
when compared to term fetuses.(13)

16
Figure 1.1: Hypoxic ischemic injury. Taken from--Huang BY, Castillo M. Hypoxic-Ischemic Brain Injury: Imaging Findings from Birth to Adulthood. RadioGraphics 2008; 28: 417-39.
The pattern of brain injury varies depending on gestation and the degree of involvement.
This includes hypoxic-ischemic injury, intraventricular haemorrhage, periventricular
leukomalacia or delayed white matter injury which could then progress to post-anoxic
leukoencephalopathy.
The hypoxic-ischemic injury continues to be one of the leading causes of death and a
significant degree of neurodevelopment disability in term neonates. The earliest changes
are visualised within the deep grey matter affecting predominantly the thalamus, putamen,
hippocampus, dorsal brain stem and lateral geniculate nuclei which contain the highest
concentration of NMDA receptors that are susceptible to maximum injury. The reminder of
the cerebral cortex is usually spared unless there is prolonged insult to the brain.
Periventricular leukomalacia, referred to as white matter injury of prematurity, occurs,
especially in preterm infants. The prevalence of injury is inversely related to the gestation
with severe preterm babies being more affected when compared to the term infants. The

17
injury is related principally to the white matter region of the brain which appears to be less
perfused compared to rest of the brain resulting in lesions adjacent to the cerebral lateral
ventricles and foramen of Monro. The neurological injury results in visual impairment and
motor impairment causing spastic diplegia.(13)
1.3 Antenatal and intrapartum assessment of fetal well-being
The earliest evidence of fetal monitoring was in 1818 when Francois–Isaac Mayor of Geneva
reported that the fetal heart rate was audibly different from the maternal pulse by applying
the ear directly to the mother's abdomen. In 1827, Ferguson was the first physician in the
British Isles to describe the fetal heart sounds. The methods of fetal auscultation and
monitoring have significantly improved over the years due to improvement in modern
technology and invention, and we have now progressed from fetal stethoscope to electronic
fetal heart rate monitoring; however, the addition of diagnostic ultrasound with Doppler
applications has made a significant contribution to the current management of clinical
obstetrics.
Electronic fetal heart rate monitoring or commonly known as Cardiotocography (CTG) is a
technical way of recording the fetal heartbeat and the uterine contractions in the third
trimester. It is used to monitor fetal wellbeing and identify fetal distress which is
represented by abnormal tracing and therefore requires active management in labour.
Electronic fetal heart rate monitoring analysis and interpretation is a description of uterine
activity (contractions), baseline fetal heart rate, baseline fetal heart rate variability,
presence of accelerations and periodic or episodic decelerations. Electronic fetal heart rate
monitoring analysis and interpretation is performed in the U.K according to the NICE
guidelines on intrapartum care (Table 1.1).(14)

18
Category Definition
Normal All four features fall in the reassuring category
Suspicious One feature is in the non-reassuring category but the other three are reassuring
Pathological >2 feature in the non-reassuring category or <1 in abnormal categories
Feature Baseline (bpm) Variability
(bpm)
Decelerations Accelerations
Reassuring 110-160 >5 None Present
Non-
reassuring
100-109
161-180
< 5 or >40 to
<90 minutes
1.Early decelerations
2.Variable decelerations
3.Single prolonged
deceleration up to 3 minutes
The absence of
accelerations with an
otherwise normal CTG
are of uncertain
significance
Abnormal <100
>180
Sinusoidal
pattern ≥ 10 min
<5 for ≥ 90
minutes
1.Atypical variable
decelerations
2.Late decelerations
3.Single prolonged
4.Single, prolonged
decelerations >3 minutes
The absence of
accelerations with an
otherwise normal CTG
are of uncertain
significance
Table 1.1: NICE guidelines for electronic fetal heart rate monitoring interpretation
Ananth et al. published results of a retrospective study of more than 55 million non-
anomalous live births of fetuses between 24 to 44 weeks of gestation over a period of 15
years (1990 - 2004). They observed that use of electronic fetal monitoring was modestly
associated with a decline in neonatal mortality especially at preterm gestations.(15) Despite
published guidelines by FIGO and NICE there is still a wide variation in inter and
intraobserver variability in interpretation of the electronic fetal heart rate monitoring which
could result in the sub-optimal management leading to various medico – legal claims.(16) A
systematic review by Alfirevic et al. on the effectiveness of continuous electronic fetal
monitoring during labour showed a reduction in neonatal seizures; however, there were no

19
significant differences in cerebral palsy, infant mortality rate or other standard measures of
neonatal well – being.(7) Similarly, a Cochrane review on fetal echocardiogram during labour
showed no significant difference to birth by caesarean section, the rate of severe metabolic
acidosis or the number of babies with neonatal encephalopathy.(17)
Fetal blood sampling (FBS) from the fetal scalp is used as an adjunctive diagnostic test when
abnormal electronic fetal heart rate monitoring is noted to quantify fetal hypoxemia or
academia. Studies have shown that FBS with a pH of less than 7.20 has a higher specificity
than a pathological electronic fetal heart rate monitoring to predict low APGAR score at 1
minute.(18) Although FBS is a useful additional investigation in the evaluation of intrapartum
hypoxia, it is still an invasive procedure which could be technically challenging at times, and
is not possible to obtain sample in all the cases.
A systematic review by East et al. in 2010 on fetal blood sampling observed that successful
fetal blood sample on the first attempt could only be achieved in around 80% of the cases.(19)
The average time from procedure to obtain the results after FBS was reported to be around
18 minutes which could delay the crucial time in delivery of a previously distressed fetus
posing a greater risk to intrapartum hypoxia. Furthermore, there was also a high risk of
sample contamination due to the complexity of the procedure affecting the accuracy of the
results.(19)
The NICE guidelines recommend the use of FBS in the presence of a pathological heart trace
unless there is clear evidence of acute fetal compromise or in cases of suspected fetal
acidosis before contemplating an assisted birth for an abnormal heart trace. Although FBS is
a useful adjunctive test following an abnormal trace, there is no evidence to show that FBS
can improve neonatal outcome or reduce the incidence of caesarean section rates for fetal
compromise.(18)

20
Fetal pulse oximetry was introduced in the late 1980's hoping that it would assist in the
intrapartum management and identify fetuses that are at risk of fetal hypoxia following a
non – reassuring electronic fetal heart rate monitoring tracing. Fetal pulse oximetry is
performed by using a probe that rests on the fetal head which is held either by suction or
clip while the head is still within the maternal pelvis. It can also be positioned over the fetal
cheek or against the fetal temporal bone or to lie on the fetal back. The sensors measure
the proportion of the fetal haemoglobin, which is used to calculate the percentage of
oxygen saturation. Lower oxygen saturation readings can occur with reduced arterial
perfusion suggestive of fetal acidosis. Typical normal values range between 58 to 68%.
Values less than 30% are considered significant and warrant intervention ranging from a
change in maternal posture to emergency delivery by caesarean section.(20)
Systematic review studies by East et al. in 2007 reported no significant difference in the
overall caesarean section rates among the group of fetuses that were monitored with fetal
oximetry when compared with the group those not monitored.(21) Recent systematic review
in 2014 performed by the same study group concluded that the addition of fetal pulse
oximetry did not reduce overall caesarean section rates suggesting that fetal pulse oximetry
does not contribute to overall clinical practice.(22)
1.4 Role of ultrasound to monitor growth and fetal well-being
History of ultrasound
Evidence suggest that the use of ultrasound in medicine began during or shortly after the
second world war although initial discoveries in ultrasound date back as early as 1794 by
Lazaro Spallanzani when analysing the spatial orientation of the bats observed that there
was another mechanism in addition to the visual -ophthalmic system. In 1826 Jean –Daniel
21
Colladon, could determine the speed of sound in water. Many researchers by then were
working towards defining the fundamental physics of sound vibrations and its properties of
transmission, propagation and refraction. However, in 1877, Lord Rayleigh described sound
wave as a mathematical equation thus forming the basis of future practical work in
acoustics.(23)
Pierre Curie and Jacques Curie in 1880 discovered that individual rare earth crystals like lead
zirconate titanate can resonate when subjected to vibration by electrical stimulation or
mechanical stress. This is called the piezo–electric effect which formed the basis in evolution
of high-frequency echo-sounding techniques.(24)The medical use of ultrasound began in
1920's when it was mostly therapeutic due to its initial thermal and disruptive effects noted
in animal tissue experiments.
Langevin et al. in the initial studies indicated that pain could be induced in the hand when
placed in a water insonated with high-intensity ultrasound. This technique progressively
evolved to be used in neurosurgical applications when its thermal effects were used to
destroy parts of the basal ganglia and the frontal lobe to alleviate pain in patients suffering
from carcinomatosis. Ultrasound has also been used in physical and rehabilitation medicine
in 1953 in the treatment of rheumatoid arthritis and Meniere's disease.
The work of Ian Donald in 1956 resulted in the significant transfer of ultrasound technology
into clinical practice. His findings of the Investigation of abdominal masses by pulsed
ultrasound in 1958 is still considered the most important paper ever published in medical
ultrasound.(25) His first invention and follow up work by many researchers have thus paved
the way for modern medical imaging resulting in significant developments in the ultrasound
technology starting from the basic ‘A' mode static scanner to the present real-time
imaging.(26)

22
The principle component of the ultrasound equipment is the ultrasound transducer or the
probe, which has a series of piezo –electric crystals that function both as transmitter and
receiver. Ultrasound equipment uses frequency range above 20,000 Hz that is not audible to
the human ear. The frequencies used in medical ultrasound can vary between 2MHz to
18MHz depending upon its clinical use. It is known that higher ultrasound frequency has a
lower penetration with improved resolution while lower frequencies have greater
penetration with a compromise on the image resolution. There are selections of probes
available with different frequencies to choose for appropriate application in modern clinical
practice.
Doppler ultrasound
The principle of Doppler ultrasonography is based on the “Doppler effect” proposed by the
Austrian physicist Christian Doppler in 1842. It is defined as the “change in the apparent
frequency of a wave as the observer and source move towards or away from each other”.
To explain this phenomenon, it is common to observe that the frequency of the ambulance
siren is more audible as the vehicle approaches towards the observer rather than away from
the observer. The emitted frequency from the ambulance siren is the same; however, when
the ambulance approaches towards the observer, the sound waves have a shorter
wavelength and higher frequency, making it more audible. While the ambulance is away
from the observer, the emitted sound waves will have a longer wavelength and lower
frequency making it less loud. This principle of Doppler shift has been used in diagnostic
imaging to study the movement of blood flow within the blood vessels. In Obstetrics, it is
particularly used to investigate changes that occur in the feto–placental and utero –
placental circulation.(27)
23
Safety of Ultrasound
Ultrasound has now been in the clinical practice for over 40 years and is the safest imaging
modality in pregnancy. Unlike X-rays or CT scans that use ionising radiation, ultrasound
technology uses sound waves which are non –ionising for image acquisition. It was not long
after its clinical applications that concerns were raised regarding its safety in pregnancy due
to the properties of heating and cavitation and its effects while using in the first trimester.
Absorption of ultrasound energy into bone and soft tissue produces heat, which is measured
by the thermal index. Thermal index is defined as a measure of an ultrasound beam’s
thermal bioeffects. Thermal index represents the ratio of the power used in relation to the
power required to raise the temperature by 10 C.
The World Federation of Ultrasound in medicine and biology stated that “a diagnostic
exposure that produces a maximum in situ temperature of 1.50C above normal physiological
level might be used without reservations on thermal grounds”. They also stated that “a
diagnostic procedure that elevates embryonic and fetal in situ temperature above 410 C for
5 minutes should be considered potentially hazardous”.(28) Research on animal studies by
Zhu et al. showed that using diagnostic levels of colour Doppler in pregnant rats did not
affect the DNA content in any phase of the cell cycle confirming its safety in the first
trimester.(29) Most of the present-day ultrasound machines are enabled with a safety
feature to manually set the thermal index to 1 so that it automatically shuts down the
equipment if the thermal index is raised above 1 degree. There have not been any published
studies explaining the safety of ultrasound performed at early gestation, so it would be
prudent to avoid using Doppler studies during early pregnancy to prevent risk to the
developing fetus.

24
Cavitation is another property of ultrasound resulting in gaseous bubble formation when
there is an air–water interface. The collapse of these bubbles releases heat into the adjacent
tissues that may disrupt the cell membrane. Cavitation is not a primary concern in
mammalian tissues because for the most part; there is no air–water interface that is needed
for cavitation to occur.
Long-term effect of prenatal ultrasound
Despite its clinical use in Obstetrics for over 40 years, there has always been a concern
about the risks of its usage in pregnancy relating to fetal growth, mental development,
congenital malformations or chromosomal aberrations. However, there has not been any
published reports citing concerns on the long-term adverse following its clinical application.
Torloni et al. in 2009 performed a WHO systematic review and meta-analysis on the safety
of ultrasonography in pregnancy and concluded that ultrasonography in pregnancy
appeared to be safe and was not associated with adverse maternal or perinatal outcome. It
was also not associated with increased risk of malignancy in childhood, subnormal
intelligence or mental illness. However, some of the studies in the analysis showed a weak
association between exposure to ultrasonography and left-handedness.(30)
Despite the safety of ultrasound in clinical practice, we are still unaware of the long-term
outcomes. Safety and departmental guidelines must therefore be strictly adhered when
performing ultrasound examination at any gestation; with emphasis on keeping the
mechanical and thermal index at optimum levels and the appropriate use of fetal Doppler. It
is good practice adhering to the ALARA (As Low As Reasonably Achievable) principle, which
would also apply to the ultrasound examinations like any other imaging investigation.

25
Obstetric ultrasound – from conception to delivery
Obstetric ultrasound is an essential complementary tool in modern obstetric practice, and
widely used across all gestations from conception to delivery. The use of ultrasound begins
as early as 4 - 5 week’s post-conception to confirm the pregnancy location, calculate the
period of gestation and to confirm the presence of fetal pole and cardiac activity. Follow-up
scans are performed in the first trimester for calculation of the gestational age by the
crown-rump length of the fetus (CRL) and to complete the fetal risk assessment for
aneuploidy. Second-trimester scans are usually performed between 18 to 22 weeks to check
for fetal biometry, assessment for fetal abnormalities and soft markers for fetal aneuploidy,
cervical screening and evaluation of uterine artery Doppler. Third-trimester scans are
performed to check for fetal growth, placental localisation, amniotic fluid volume, and the
estimated fetal weight to formalise the delivery plan.(31)
Doppler evaluation of uteroplacental and fetoplacental circulation is performed in addition
to the routine scans for fetuses at risk of developing growth restriction to assist in the
clinical management. Ultrasound is also being used in post-dated pregnancies and in fetuses
before induction of labour to confirm the fetal presentation, placental location and amniotic
fluid volume to assist in further clinical management. The markers for fetal wellbeing
include checking the fetal biometry against growth charts for gestation, amniotic fluid
volume and Doppler ultrasound in fetuses to exclude fetal growth restriction. (32)
There are different formulae and nomograms available to calculate the fetal weight using
the biometry measurements. The most commonly used are the Hadlock formula which
could predict the fetal weight with a mean error of 10 -15 % in most of the cases. Estimation
of the fetal weight is important to classify fetuses whether they are appropriately grown,

26
macrosomic, small for gestation (SGA) or FGR. This is important as it would alter the
management of pregnancy depending on the cause.(33)
SGA fetuses describe a population of fetuses with the estimated fetal weight below the 10th
centile or severe if they are below the 3rd centile for the gestation. It is important to note
that FGR fetuses are not synonymous with SGA fetuses in which the reduction in fetal
weight is associated with abnormal Doppler changes. There is enough evidence to suggest
that FGR fetuses have an increased risk of adverse perinatal and intrapartum outcome
compared to appropriately grown fetuses.(34)
Early-onset FGR has a distinct pattern of disease evolution that usually manifest in the 1st or
2nd trimester due to abnormal placentation. Early-onset FGR is primarily due to a vascular
disease of the placenta and can be associated with pre-eclampsia. Late onset FGR manifests
around 32 weeks or later due to suboptimal placental function. In late onset IUGR, the
umbilical artery Doppler findings are normal in contrast to early onset FGR fetuses; however,
there is abnormal middle cerebral artery Doppler and altered cerebro-placental ratio due to
cerebral hypoxemia.
While growth restricted fetuses are identified by potential markers of fetal well-being, there
appears to be a small group of AGA fetuses at term with a sub-optimal placental function
that tolerate labour poorly. It's currently not possible to identify these fetuses at risk of
adverse intrapartum outcome.(35)
1.5 Amniotic fluid volume
Amniotic fluid serves several important functions in the normal development of the embryo
and the fetus. It acts as a cushion for the fetus against physical trauma and helps in the
mobility of the fetus within the uterus during its growth and development. It also provides a

27
thermally stable environment during intrauterine life. Amniotic fluid is also useful in the
normal development of the respiratory, gastrointestinal and the musculoskeletal system of
the fetus.
During early gestation, the chorion –amnion acts as a sieve allowing free passage of water,
solutes and electrolytes constituting the amniotic fluid. Diffusion occurs through the
embryonic skin derived from the epiblast of the b-laminar embryonic disc which occurs
during the mid to late first trimester. In the latter half of the gestation, fetal kidney and
lungs are the primary sources of production with fetal urine constituting the main source of
amniotic fluid. There is a steady increase in the amniotic fluid volume, starting as little as 1
ml at seven weeks to 25 ml at ten weeks and 60 ml at twelve weeks. The amniotic fluid
volume then reaches a maximum (630-817 ml) at mid-trimester and remains through until
39 weeks and then begins to decline due to reduced urine production and reduced placental
function.(36)
Manning and Platt suggested the importance of reduced amniotic fluid in growth restricted
fetus indicating that poor placental function was associated with reduced liquor volume.(37)
In 1980, the same research group used the maximum vertical pool measurement (MVP) in
the calculation of fetal biophysical score assessment for fetal well-being.(38) MVP less than 2
cm was considered as oligohydramnios and MVP greater than 8 cm was considered
polyhydramnios. Chamberlain et al. in 1984 performed a retrospective analysis and
concluded that MVP less than 1 cm was associated with FGR in 78.8 to 89.6% reflecting poor
placental function as a cause for reduced liquor volume.(39) Hypoxemia resulting from a poor
placental function in FGR fetuses can cause redistribution of the cardiac output resulting in
poor renal perfusion explaining the oligohydramnios in these fetuses.

28
Post-term fetuses have increased morbidity with increased risk of meconium aspiration,
fetal post maturity, and fetal death. The cause remains unclear although the likely
explanation would be due to reduced renal perfusion as explained before. Bar-Hava et al.
looked at post-term pregnancies with oligohydramnios to observe if they differed in their
umbilical, middle cerebral and renal blood flow distribution when compared with a control
population of fetuses with normal amniotic fluid volume. They observed that there was no
significant difference when matched for the blood flow; however, fetuses with
oligohydramnios had low birth weights compared with control group concluding that
oligohydramnios was associated with low birth weight rather than renal perfusion.(40)
Follow-up studies by Selam et al. however, disagreed with the previous findings as their
group observed that oligohydramnios in post-term pregnancies is associated with an arterial
distribution of fetal blood flow typical of brain sparing effect evidenced by decreased
resistance in the middle cerebral artery and the fetal IVC.(41)
1.6 Meconium stained liquor
Pregnancies complicated with meconium stained liquor are at risk of adverse outcome. The
amniotic fluid is a relatively clear yellow coloured liquid until later in gestation when it
becomes more turbid due to the shedding of fetal cells and the vernix. Meconium is the
earliest stool of a mammalian infant. It is mainly composed of materials ingested by the
intrauterine fetus. It is rarely passed into the amniotic fluid before 34 week's gestation
which relates to fetal maturity.
There is controversial evidence to suggest that meconium stained liquor is indicative of
intrapartum hypoxia. Numerous studies have shown that passage of meconium is a sign of
fetal maturity reflecting a normal physiological event. Animal experiments have suggested

29
that passage of meconium is physiological and occurs in term fetuses which increased with
advanced gestation.(42) Meconium stained amniotic fluid (MSAF) in the presence of normal
electronic fetal heart rate monitoring is reassuring with no significant risk of adverse
outcome(43) however, meconium stained liquor associated with oligohydramnios and
abnormal electronic fetal heart rate monitoring in a fetus are suggestive of adverse
outcome.
The most important complication of MSAF is meconium aspiration syndrome, which occurs
in 5% of fetuses that have meconium stained liquor. It is a cause for concern as meconium-
stained amniotic fluid is associated with a mortality rate of about 2.5% in the developed
world and up to 35% in the developing countries.(44)
Aspiration of meconium stained amniotic fluid results in chemical pneumonitis and may
progress to persistent pulmonary hypertension.(44) Study by Beligere et al. observed a
significant risk of neurodevelopmental delay in children affected by meconium aspiration
syndrome even though they responded well to conventional ventilator support.(45) Similarly,
preterm fetuses and SGA fetuses with meconium stained liquor are associated with
additional adverse pregnancy outcomes when compared with appropriately grown term
fetuses.(46)
1.7 Doppler ultrasound in assessment of fetal well-being
Doppler ultrasound in clinical practice relies on the movement of red blood corpuscles
within the blood stream. When an ultrasound beam with a specific frequency is used to
insonate a blood vessel, the reflected frequency is directly proportional to the speed with
which the red blood cells are moving within that vessel and is represented as a waveform
for interpretation.

30
The size of the Doppler signal is directly proportional to the velocity of the blood and the
frequency of the ultrasound beam. The frequency shift is also largely dependent on the
angle of insonation of the ultrasound beam with the maximum output obtained when the
sound beam is parallel to the flow.(47, 48)
The common Doppler indices that are used in the clinical practice are (Figure 1.2):
1. Pulsatility Index (Pi) = Peak systolic flow velocity – Trough diastolic flow velocity / Mean
blood flow velocity. This is the most commonly used index because it gives a broader
range of values for analysis and also a series of waveform shapes when there is no end
diastolic flow.(47)
2. Resistive index (Ri) = Peak systolic flow velocity – Trough diastolic velocity / Peak
systolic flow velocity
3. Systolic –Diastolic ratio (S/D ratio) = Peak systolic flow velocity / Trough diastolic
velocity
Figure 1.2: Doppler indices

31
Umbilical artery
The umbilical artery was the first vessel to be assessed by Doppler velocimetry. The
umbilical artery has a characteristic waveform (saw tooth appearance) with systolic and
diastolic components reflecting the cardiac cycle (Figure 1.3). Sampling is usually performed
at either the fetal end or the placental end of the cord insertion, although impedance
indices are noted to be higher close to the fetal cord insertion.(49)
Figure 1.3: Umbilical artery waveform
With advancing gestation, there is a steady progressive decline, in the end diastolic velocity
resulting in decreased pulsatility indices (Figure 1.4).(50) There are no noticeable diurnal
changes in pregnancy that may affect the umbilical artery blood flow; however, the blood
flow decreases with fetal expiration, and therefore it is preferable to obtain the velocity
assessment during fetal quiescence.
32
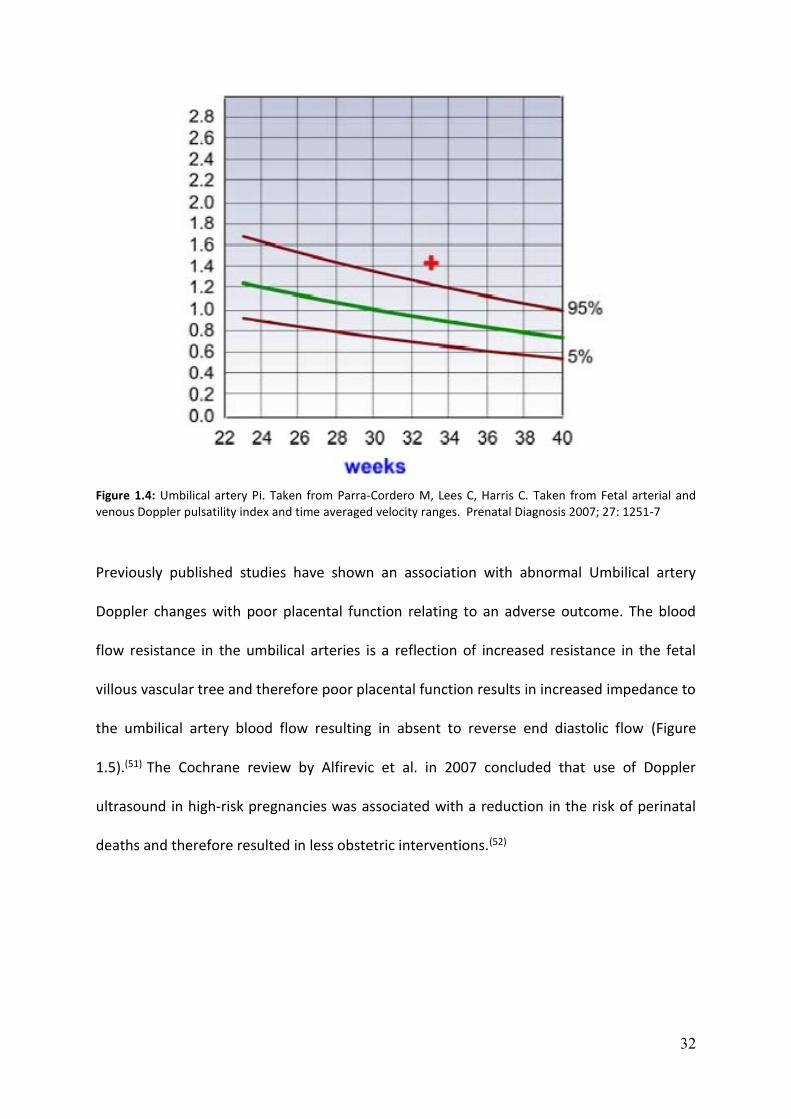
Figure 1.4: Umbilical artery Pi. Taken from Parra-Cordero M, Lees C, Harris C. Taken from Fetal arterial and venous Doppler pulsatility index and time averaged velocity ranges. Prenatal Diagnosis 2007; 27: 1251-7
Previously published studies have shown an association with abnormal Umbilical artery
Doppler changes with poor placental function relating to an adverse outcome. The blood
flow resistance in the umbilical arteries is a reflection of increased resistance in the fetal
villous vascular tree and therefore poor placental function results in increased impedance to
the umbilical artery blood flow resulting in absent to reverse end diastolic flow (Figure
1.5).(51) The Cochrane review by Alfirevic et al. in 2007 concluded that use of Doppler
ultrasound in high-risk pregnancies was associated with a reduction in the risk of perinatal
deaths and therefore resulted in less obstetric interventions.(52)
33
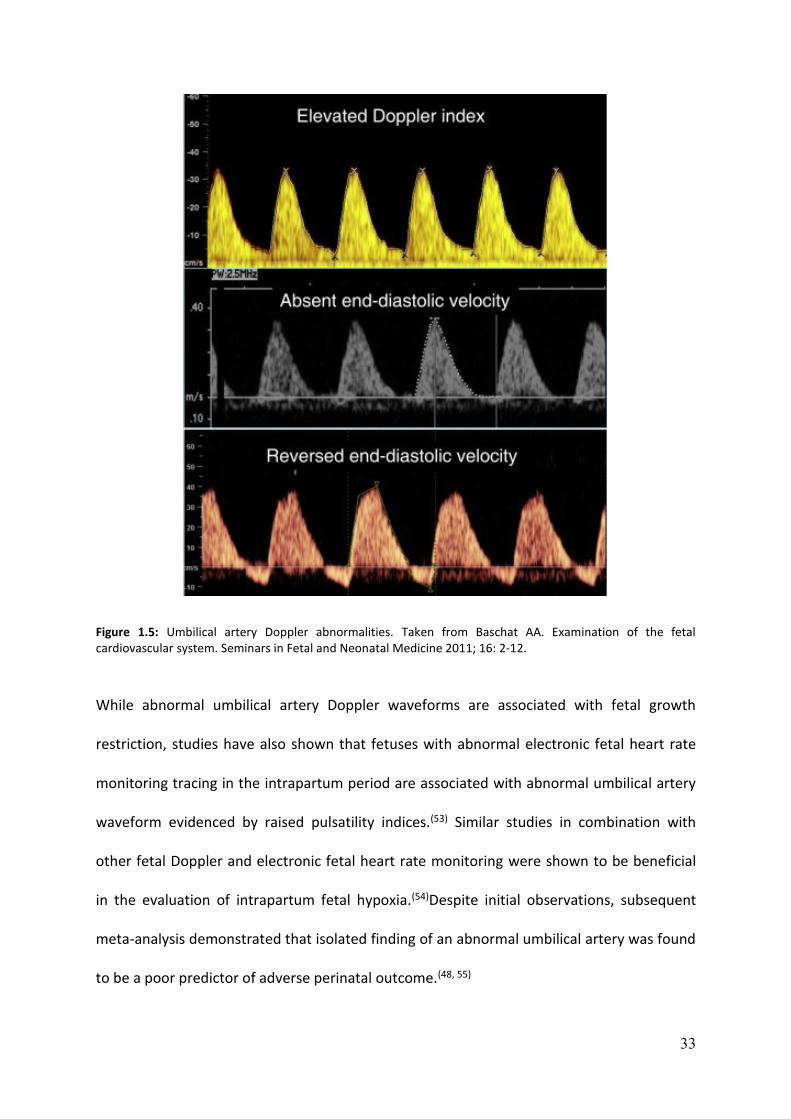
Figure 1.5: Umbilical artery Doppler abnormalities. Taken from Baschat AA. Examination of the fetal cardiovascular system. Seminars in Fetal and Neonatal Medicine 2011; 16: 2-12.
While abnormal umbilical artery Doppler waveforms are associated with fetal growth
restriction, studies have also shown that fetuses with abnormal electronic fetal heart rate
monitoring tracing in the intrapartum period are associated with abnormal umbilical artery
waveform evidenced by raised pulsatility indices.(53) Similar studies in combination with
other fetal Doppler and electronic fetal heart rate monitoring were shown to be beneficial
in the evaluation of intrapartum fetal hypoxia.(54)Despite initial observations, subsequent
meta-analysis demonstrated that isolated finding of an abnormal umbilical artery was found
to be a poor predictor of adverse perinatal outcome.(48, 55)

34
Middle cerebral artery
Published studies have demonstrated the changes in Middle cerebral artery (MCA) Doppler
flow and the role of brain sparing in the prediction of adverse outcomes in fetal growth
restriction.(56) The MCA is the vessel of choice in intracranial Doppler assessment due to its
ideal anatomical location which allows the Doppler beam to insonate the vessel close to the
angle of zero degrees (Figure 1.6). There are also studies which have looked at the sampling
site of the vessel, and it is best preferred to sample the MCA proximal to its origin from the
internal carotid artery to decrease inter and intra-observer variability.(57) The MCA Pi usually
peaks from 22 weeks onwards up to until 28 weeks and then continues to show a gradual
decline towards term (Figure 1.8).(58) Growth-restricted fetuses had a decreased pulsatility
index of the MCA due to increased cerebral perfusion (Figure 1.7). Many studies support
that reduced MCA Pi is associated with an adverse perinatal outcome.(59, 60)
Figure 1.6: Middle cerebral artery Doppler. Taken from Baschat AA et al. Examination of the fetal cardiovascular system. Seminars in Fetal and Neonatal Medicine 2011; 16: 2-12.

35
Figure 1.7: Middle cerebral artery pulsatility index per gestation. Taken from Parra-Cordero M, Lees C, Missfelder-Lobos H, Seed P, Harris C. Fetal arterial and venous Doppler pulsatility index and time averaged velocity ranges. Prenat Diagn 2007; 27: 1251-7.
Cerebro-Placental ratio (CPR)
During fetal hypoxemia, there is an increase in the blood supply to the brain, myocardium
and the adrenal glands at the expense of reduced perfusion of the kidneys, gastrointestinal
tract and the lower extremities. This phenomenon called as ‘cerebral redistribution' or
‘brain sparing effect' was reported earlier in animal studies by Thornburg et al. in 1991.(61)
Wladimiroff et al. examined the cerebral and umbilical artery Doppler in normal and
growth-restricted fetuses and found that fetuses with growth restriction showed a raised Pi
in the umbilical artery and reduced index values in the internal carotid artery suggesting the
presence of ‘brain sparing effect'.(62)
Cerebroplacental ratio (CPR), which is the ratio of Pi in the MCA to that in the umbilical
artery, reflects both the placental status and the fetal response. The CPR was first reported
36
by Arbeille et al. that fetuses complicated by growth restriction or hypertension had a CPR <
1 compared to appropriately grown fetuses which had a CPR >1.(63) Several studies have
been published since then supporting the usefulness of CPR and it association in predicting
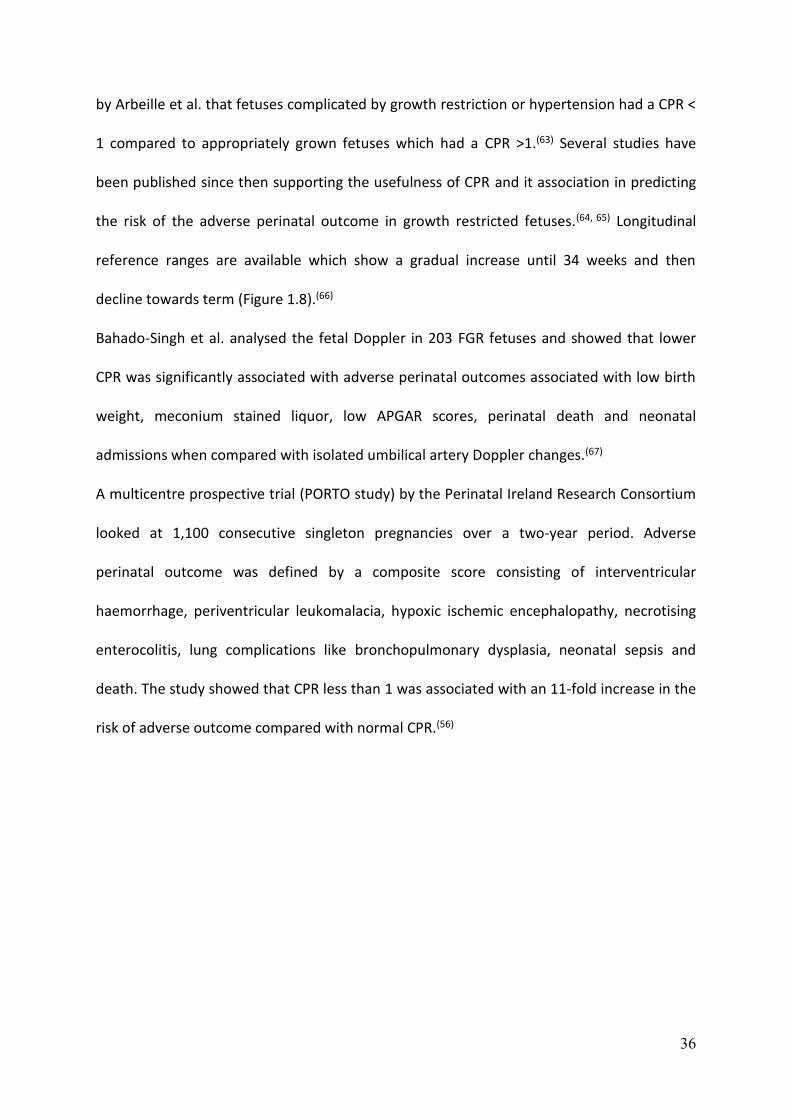
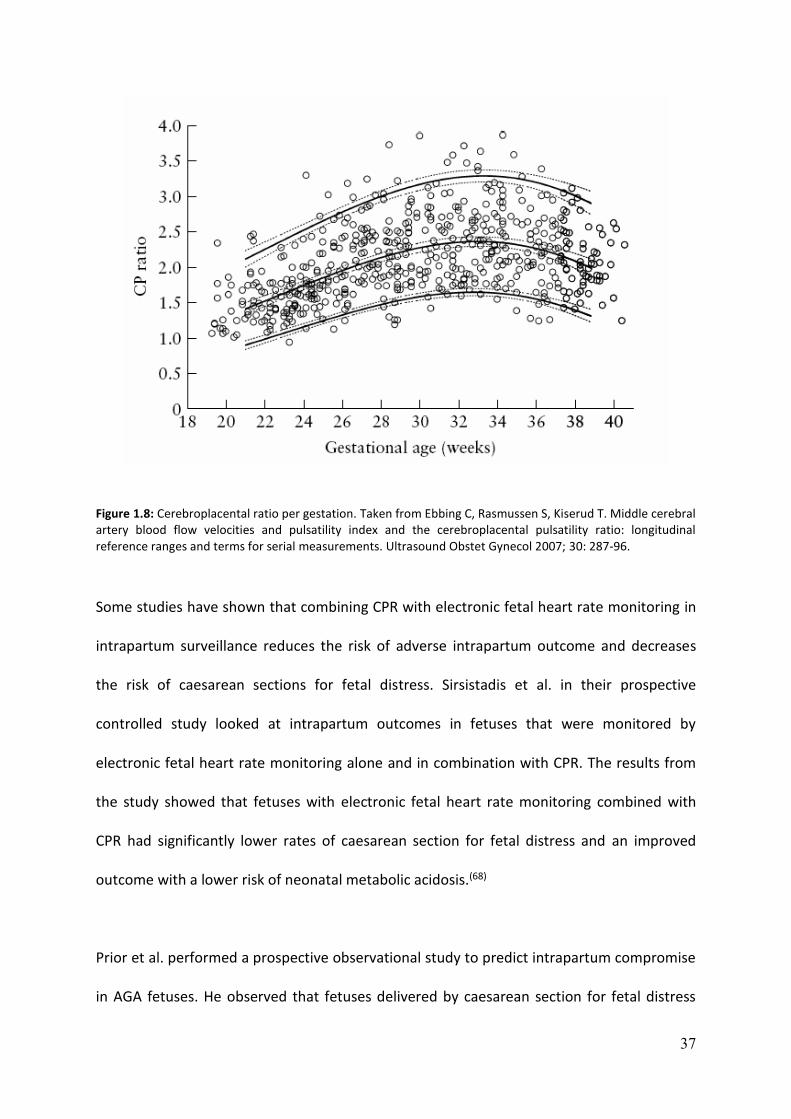
the risk of the adverse perinatal outcome in growth restricted fetuses.(64, 65) Longitudinal
reference ranges are available which show a gradual increase until 34 weeks and then
decline towards term (Figure 1.8).(66)
Bahado-Singh et al. analysed the fetal Doppler in 203 FGR fetuses and showed that lower
CPR was significantly associated with adverse perinatal outcomes associated with low birth
weight, meconium stained liquor, low APGAR scores, perinatal death and neonatal
admissions when compared with isolated umbilical artery Doppler changes.(67)
A multicentre prospective trial (PORTO study) by the Perinatal Ireland Research Consortium
looked at 1,100 consecutive singleton pregnancies over a two-year period. Adverse
perinatal outcome was defined by a composite score consisting of interventricular
haemorrhage, periventricular leukomalacia, hypoxic ischemic encephalopathy, necrotising
enterocolitis, lung complications like bronchopulmonary dysplasia, neonatal sepsis and
death. The study showed that CPR less than 1 was associated with an 11-fold increase in the
risk of adverse outcome compared with normal CPR.(56)
37
Figure 1.8: Cerebroplacental ratio per gestation. Taken from Ebbing C, Rasmussen S, Kiserud T. Middle cerebral artery blood flow velocities and pulsatility index and the cerebroplacental pulsatility ratio: longitudinal reference ranges and terms for serial measurements. Ultrasound Obstet Gynecol 2007; 30: 287-96.
Some studies have shown that combining CPR with electronic fetal heart rate monitoring in
intrapartum surveillance reduces the risk of adverse intrapartum outcome and decreases
the risk of caesarean sections for fetal distress. Sirsistadis et al. in their prospective
controlled study looked at intrapartum outcomes in fetuses that were monitored by
electronic fetal heart rate monitoring alone and in combination with CPR. The results from
the study showed that fetuses with electronic fetal heart rate monitoring combined with
CPR had significantly lower rates of caesarean section for fetal distress and an improved
outcome with a lower risk of neonatal metabolic acidosis.(68)
Prior et al. performed a prospective observational study to predict intrapartum compromise
in AGA fetuses. He observed that fetuses delivered by caesarean section for fetal distress
38
had significantly lower CPR than those born by spontaneous delivery. Fetuses with CPR <10th
centile had a six-fold increased risk to be delivered by caesarean section while fetuses with
CPR >90th centile appeared protective of caesarean section for fetal distress.(69)
Ductus venosus
The venous vasculature in the fetus is primarily responsible in shunting significant amount
of oxygenated blood from the umbilical vein to the heart. The fetal liver along with the
venous vasculature consisting of the umbilical and portal veins, ductus venosus, hepatic vein
and the inferior vena cava play an import role in contributing to the pre-load to the heart.
The Ductus venosus (DV) is unique as it shunts a considerable amount of oxygenated blood
from the umbilical – portal system through the inferior vena cava to the right atrium. The
diameter of the DV is approximately 1/3rd of the umbilical vein. It courses posteriorly and
steeply in a cephalad direction as the original orientation of the umbilical vein and enters
the IVC in a venous vestibule below the diaphragm. The velocity of blood increases as it
passes through the DV due to its course and the narrow lumen.(70) It is estimated that in
normal fetuses, around 20-30% of the oxygenated blood bypasses the hepatic circulation
through the ductus venosus to reach to the right atrium.(26, 71) However, this could increase
up to 60% in fetal hypoxemia and growth restricted fetuses.(70)
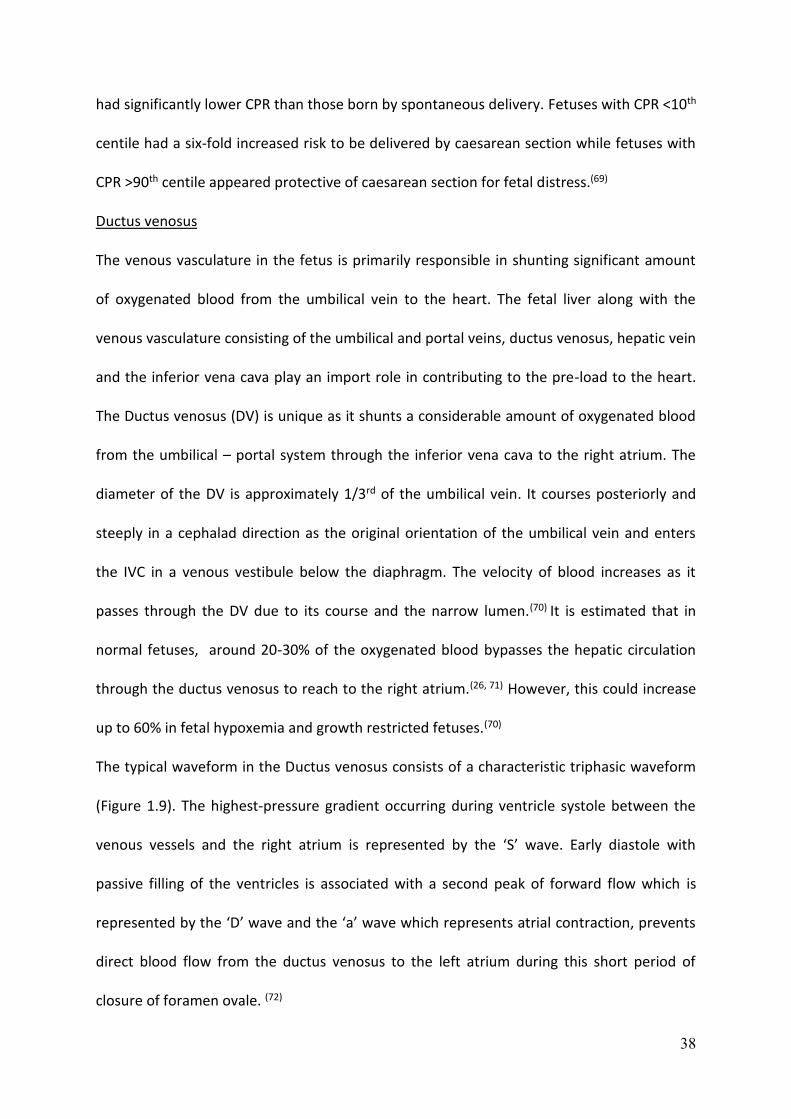
The typical waveform in the Ductus venosus consists of a characteristic triphasic waveform
(Figure 1.9). The highest-pressure gradient occurring during ventricle systole between the
venous vessels and the right atrium is represented by the ‘S’ wave. Early diastole with
passive filling of the ventricles is associated with a second peak of forward flow which is
represented by the ‘D’ wave and the ‘a’ wave which represents atrial contraction, prevents
direct blood flow from the ductus venosus to the left atrium during this short period of
closure of foramen ovale. (72)

39
Figure 1.9: Ductus venosus waveform. Taken from Baschat AA. Examination of the fetal cardiovascular system. Seminars in Fetal and Neonatal Medicine 2011; 16: 2-12.
Many studies have shown abnormal ductus venosus flow in association with chromosomal
abnormalities, cardiac defects and adverse perinatal outcome.(73-75) Maiz et al. looked at the
combined data from eight studies and observed that abnormal DV blood flow was
associated with 87% of fetuses with cardiac defects, suggesting the use of DV as a secondary
marker in risk assessment of fetuses with raised nuchal translucency.(74, 76, 77)
Abnormal umbilical artery waveform evidenced by absent or reverse end-diastolic flow
represent an increased fetal-placental resistance. This is secondary to abnormal placental
villous vasculature resulting in poor nutritional transfer across the placenta in FGR fetuses.
Abnormal DV waveform account for a late vascular response in FGR fetuses resulting in
absent or reverse ‘a' wave. Further fetal compromise results in impaired cardiac pre-load
and afterload due to dysfunctional myocardium resulting in severe adverse perinatal
outcome including stillbirth.(72)

40
1.8 Fetal cardiac function
The importance of fetal echocardiography in diagnosing structural cardiac defects in utero is
well known. More recent research has allowed the prenatal cardiac function to be assessed
accurately.(78) Cardiovascular adaptations in utero secondary to placental insufficiency can
lead to altered fetal programming which persists in the form of subclinical cardiac and
vascular dysfunction and cardiac remodelling in neonates and children.(79) There is
substantial evidence that programming of adult cardiovascular disease begins prenatally
and fetal cardiac assessment can identify fetuses at risk of adverse perinatal outcome and
long-term cardiovascular dysfunction.(80)
Cardiac output and blood flow to the fetus in animal models suggest a right ventricular
dominance in the fetus compared to the postnatal life, and the reported ratio of right to left
cardiac output ranged from 1 to 1.5.(81) In the fetal lambs, the biventricular cardiac output in
the second half of pregnancy is approximately 450 mL/min/kg. Of this, about 60-65% of the
cardiac output is ejected by the right ventricle, and 35-40% is ejected by the left ventricle
thus giving a ratio of right to the left cardiac output of 1.5 o 1.85.(81) This cardiac ratio
changes postnatally with an increase in the left cardiac output to 240/mL/min/kg within the
first 2 hours and then stabilises to approximately 190 mL/min/kg. This decreases the left to
right shunt from 62 ml/min/kg to about 14 mL/min/kg.(81)
Studies in animal models have demonstrated changes in the fetal cardiac function in hypoxic
conditions and those with fetal growth restriction.(82) Chronic hypoxia induces adaptive
changes to the fetus in utero. These include erythropoiesis to increase oxygen transport,
angiogenesis in muscle to reduce oxygen diffusion distance, increase catecholamine release
and metabolic changes at a cellular level. Herrera et al. studied the cardiac effects of chronic
41
fetal hypoxia in rats that were independent of changes in nutrition in pregnancy. 30
pregnant rats in each group were housed under normoxic (21% oxygen) and hypoxic
conditions (13% oxygen) from Day 6 to Day 20 of the pregnancy. Pups that were housed
under hypoxic conditions showed a 176% increment in aortic wall thickness and a 170%
increment in the wall to lumen ratio of the fetal aorta when compared to the pups that
were kept under normoxic conditions.(83)(84) Pulgar et al. also observed that mild chronic
hypoxia induced by repeated cord occlusion in sheep showed a detrimental effect on fetal
cardiovascular and neurological outcomes.(85)
Tchirikov et al. measured the cardiac output and blood flow redistribution in fetal sheep
models subjected to hypoxia. He observed a significant reduction the values of p02, fetal pH
and base excess in hypoxic fetuses and a significant increase in the proportion of blood
passing through the ductus venosus in hypoxic fetuses resulting in the reduction in the
placental fraction of cardiac output and the right to left heart ratio.(86) Kiserud et al.
subsequently observed similar results when measuring the cardiac output in fetuses with
intrauterine growth restriction. They found that although the overall cardiac output was
maintained, the placental fraction of blood flow was lower due to increased fetal demands
resulting in increased recirculation of fetal blood flow.(87)
Following animal experiments, there have been studies on the application of conventional
and modern ultrasound techniques to measure fetal cardiac function with longitudinal
reference ranges in fetuses across the gestation. Mielke et al. performed a cross-sectional
study using 2D and Doppler echocardiography in 222 normal singleton fetuses from 13 to 41
week’s gestation (Figure 1.10 and 1.11).(81) The median biventricular cardiac output was
estimated to be 425 mL/min/kg with a clear right heart dominance evidenced by the right
cardiac output contributing to 59% to the total cardiac output. They had also observed that

42
the pulmonary flow to cardiac output was higher when compared to the lamb models. The
average normal cardiac output between 18-41 weeks gestation was about 425 /mL/min/kg
with one-third of the fetal combined cardiac output (CCO) being distributed to the placenta
in most of the second half of the pregnancy.(81)
The most significant change in the precordial veins when cardiac dysfunction occurs is
reflected as reversal or absence of ‘a' wave in the DV. It has been shown that reversed or
absent ‘a' wave is associated with a 63% risk of fetal and neonatal death.(88) Makikallio et al.
have shown that fetuses with elevated levels of markers of myocardial dysfunction
(Troponin or N –Terminal pro –atrial natriuretic peptide) also had abnormal Pulsatility index
of the ductus venosus and the IVC.(89)
Figure 1.10: Right cardiac output across gestation. Taken from G Mielke et al. Cardiac output and central distribution of blood flow in the human fetus. Circulation 2001; 103: 1662-1668.

43
Figure 1.11: Left cardiac output across gestation. Taken from G Mielke et al. Cardiac output and central distribution of blood flow in the human fetus. Circulation 2001; 103: 1662-1668.
Although early onset FGR confers a significant risk of perinatal mortality and morbidity,
constitutionally small fetuses have been considered to have a good prognosis.(90) However,
recent evidence suggests that a proportion of these fetuses that represent late onset fetal
growth restriction beyond 32 weeks also have a mild degree of placental insufficiency that is
not reflected on routine umbilical artery Doppler screening. These babies are at risk of
adverse neurodevelopment and cardiovascular disease in adult life.(91-93)
It is also shown that around 30% of late-onset SGA fetuses with normal umbilical artery
Doppler have increased myocardial perfusion indices suggesting that compromised cardiac
function.(94, 95)

44
M-Mode Echocardiography is the study of the two-dimensional motion of all structures
along the line of the ultrasound beam. This technique is primarily used to record both atrial
and ventricular activity to check for conduction and diagnose atrioventricular block. At late
gestation, shadows from adjacent structures and the ribs result in acoustic shadowing
leading to poor heart tracing and inconsistencies in obtaining the measurements. For these
reasons, we decided not to include the M-Mode assessment in the study of fetal cardiac
function in our studies.
Fetal echocardiographic assessment is routinely performed using 2D ultrasound with
Doppler. New techniques for assessment of fetal cardiac function, including the
spatiotemporal image correlation (STIC), tissue Doppler imaging and speckle tracking may
not be suitable for routine clinical application due to the complexity of the techniques and
the skill required to learn and reproduce with minimal inter and intra-observer variability. In
addition, the reproducibility of using 2D Doppler was better compared to using STIC. (78,96)
The table below illustrates the standard cardiac functional assessments performed by fetal
echocardiography in clinical practice (Table 1.2). For simplicity and if this would make a
difference to the clinical practice, we decided to use the standard 2D fetal echo assessment
of cardiac output in our study.

45
Cardiac functional parameters Definition Technique
Systolic Function
Cardiac output SV x Heart Rate 2D, Doppler, STIC
Systolic annular peak velocity Speed of movement of AV valve in systole Spectral or Colour TDI
Myocardial strain and strain rate Amount and speed of deformation of myocardial segment
Colour TDI or2D speckle tracking
Diastolic Function
Precordial vein blood flow patterns Pattern of blood flow during atrial contraction
Conventional Doppler
E/A Ratio Ratio between early and late ventricular filling velocity
Conventional Doppler
Diastolic annular peak velocity Speed of movement of AV valve at the beginning of and late Diastole
Spectral or Colour TDI
Isovolumetric relaxation time (IRT) Conventional or Spectral Doppler/ Colour TDI
Global Cardiac function
Myocardial performance index ICT + IRT / ET Conventional Doppler or spectral / Colour TDI
STIC – Spatiotemporal image correlation, TDI – Tissue Doppler imaging, IRT – Isovolumetric relaxation time, ICT – Isovolumetric contraction time, MPI – Myocardial performance index, SV – stroke volume, EDV –End diastolic volume, ET – Ejection time
Table 1.2: Cardiac function parameters. Taken from Crispi F et al. Fetal cardiac function: Technical considerations and potential research and clinical applications. Fetal diagnosis and Therapy 2012; 32: 47-64.

46
1.9 Summary
Global hypoxic-ischemic injury to the brain remains a significant cause of mortality and
severe morbidity. Significant improvements in antenatal care management and intrapartum
fetal monitoring has not shown to significantly reduce adverse perinatal outcome for the
last 50 years. Many studies have shown that the current methods of intrapartum monitoring
lack specificity with a high rate of inter-observer variability. These observations could result
in inaccuracies in the diagnosis of intrapartum fetal distress leading to an increased rate of
emergency caesarean sections. Systematic reviews using the combination of various
intrapartum assessment techniques to electronic fetal heart rate monitoring has failed to
show a reduction in caesarean section for fetal distress.
Numerous publications in the past have indicated that addition of intrapartum ultrasound
with fetal Doppler in combination with electronic fetal heart rate monitoring have proved to
improve detection of fetuses that tolerate poorly in-utero. Prior et al. from our research
group has shown that low CPR less than the 10th centile in AGA foetuses at term is
significantly associated with adverse intrapartum outcome.(69)
Studies have also been published on the assessment of cardiac function in fetuses at risk of
compromise due to maternal or fetal causes. However, there had not been any previously
published research in the evaluation of cardiac function of AGA fetuses at term. This is the
first study that has considered measuring the fetal cardiac function before labour in AGA
fetuses and comparing with the obstetric and neonatal outcome.

47
Chapter 2 Methods
2.1 Introduction
Previously published studies have measured the fetal cardiac function in normal and hypoxic
fetuses across the gestation; however, this is the first study that has measured fetal cardiac
output in appropriately grown term singleton fetuses in nulliparous women before labour. It
is also known from previously published studies that there is a change in the fetal cardiac
output in fetuses with chronic hypoxemia and growth restriction in utero; however, there
has not been reported studies that considered the feasibility to conduct assessment of
cardiac output in AGA fetuses at term to identify fetuses at risk of adverse obstetric and
neonatal outcome.
2.2 Aim
To measure fetal cardiac output and fetal Doppler (Cerebroplacental ratio) in singleton AGA
fetuses at term in nulliparous women before labour.
2.3 Hypothesis
Fetuses that require emergency caesarean section for intrapartum fetal distress will have
poor cardiac function and low CPR than fetuses who do not. Reliable identification of
fetuses at risk of adverse intrapartum events will assist in the management of these fetuses
during labour.

48
2.4 Methods
This prospective observational study was conducted at Queen Charlotte's and Chelsea
Hospital, London U.K between March 2013 and February 2015. Leaflets describing the study
were provided to pregnant women attending their routine antenatal clinic and midwifery
appointments. Study leaflets were also displayed at the antenatal clinic, antenatal ward,
delivery suite and in the day assessment unit to facilitate recruitment.
Pregnant women who agreed to participate in this study and met the inclusion criteria were
given a copy of the study information sheet (Appendix A). They were given sufficient time to
read the information and to discuss the study with the researcher. Participants who agreed
to the study were then asked to sign the consent form to be included in the research
(Appendix B).
The inclusion criteria were nulliparous women with AGA term singleton fetuses (37-42
weeks inclusive gestation) who were either in early labour or had induction of labour.
Exclusion criteria included cervical dilatation more than 4 cm, pre-eclampsia, maternal
diseases like diabetes, hypertension, diagnosis of fetal growth restriction, fetal anomaly,
chromosomal or genetic abnormality, evidence of congenital fetal infections or maternal
age less than 16 years. All women recruited to the study were delivered within 72 hours.
Ethical approval for this study was granted by the London Research Ethics Committee (Ref
no: REC 10/H0718/26).
Ultrasound examination of the fetal biometry and fetal weight estimation was performed by
calculation of the bi-parietal diameter, head circumference, abdominal circumference and
the femur length. The amniotic fluid volume and the deepest pool of liquor were also
measured as part of the study. Estimated fetal weight was then calculated using the Hadlock

49
formula.(97) Fetal Doppler indices of the umbilical artery and middle cerebral artery were
measured, and the cerebro-placental ratio (CPR) was calculated by dividing the middle
cerebral artery pulsatility index by the umbilical artery pulsatility index.
The fetal cardiac function was measured by conventional 2D and Doppler ultrasound. We
performed the assessment of the systolic and diastolic function of the ventricles and the
flow velocity across the inflow and the outflow tracts of the heart. The results obtained
were then used to calculate the stroke volume, cardiac output and the myocardial perfusion
index.
2.5 Ultrasound assessment
Fetal biometry
The 2D fetal ultrasound and Doppler examination was performed with GE Voluson-E8
ultrasound machine with 4-8 MHz probe (GE Medical Systems, Zipf, Austria and
Buckinghamshire, HP8 4SP, U.K)
Fetal biometry was performed according to guidelines published by the international society
of obstetrics and gynaecology.(98, 99) The fetal presentation was confirmed by ultrasound
examination to ensure that fetuses with cephalic presentation were included in the study
population. Pregnant mother was positioned in a semi supine position rather than left
lateral decubitus position. The head rest was elevated to an angle of 45 degrees to prevent
aorto-caval compression. Studies have shown that this position is associated with minimal
changes in the cardiac output when compared to the lying position.(100)

50
The biparietal diameter and the head circumference were measured after obtaining an axial
sectional plane of the fetal head in the trans-thalamic plane with the falx in the midline. The
biparietal diameter was then calculated by placement of the calliper from the outer table to
the inner table of the fetal calvarium. For the head circumference, elliptical trace method
was used to determine the outer perimeter of the calvarium excluding the soft tissue of the
scalp.
The fetal abdominal circumference was measured by elliptical trace method at the level of
the skin line after obtaining a transverse section of the fetal abdomen at the level of the
junction of the umbilical vein with portal sinus and fetal stomach in the field of view. Femur
length was measured after obtaining a long axis of the bone with the angle of insonation
perpendicular to the shaft of the bone. The callipers were placed along the long axis of the
bone between the metaphysis excluding the femoral epiphysis and the cartilage.
Amniotic fluid volume index and the single deepest pool of liquor was calculated by dividing
the maternal abdomen into four quadrants by an imaginary line drawn across the umbilicus
and another perpendicular from the symphysis pubis below to the xiphoid process above.
Longitudinal measurement of the maximum vertical pool of amniotic fluid was identified
and measured avoiding fetal parts or the umbilical cord in the field of view.
Doppler ultrasound
Doppler indices of the Umbilical artery and middle cerebral artery of the fetus were
obtained before assessment of the fetal cardiac function. The fetal Doppler assessment was
performed according to the standardised published guidelines (27) regarding the technique
and waveform analysis using appropriate pulse repetition frequency and wall motion filter

51
for the vessel under examination. The angle of insonation was kept close to zero degrees at
all times if possible for Doppler evaluation; however, in the assessment of the middle
cerebral artery Doppler, the angle correction was kept to zero degrees at all times.(27) High
pass filter was activated in the machine to limit the noise from vessel wall movement. At
least 5 consecutive waveforms were obtained in a single examination which was repeated
three times for assessment of each vessel. Indices were calculated using automated
software installed in the equipment to prevent errors by manual tracing method and the
mean value was used for data analysis.
Umbilical artery Doppler assessment was performed in the free loop since most of the
published literature with the reference ranges are obtained by free loop examination.(101, 102)
There is a variation in the flow velocity with higher values are seen closer to the fetal cord
insertion. However, it was difficult to assess the Doppler flow close to the fetal cord
insertion at later gestation due to the poor acoustic window and limited views due to the
fetal position.
Middle cerebral artery Doppler was performed after obtaining an axial section of the fetal
brain to visualise the sphenoid wings and the thalami. Colour Doppler is then used to
identify the circle of Willis, and the middle cerebral artery was sampled at the proximal third
according to the criteria in published guidelines.(27)Minimal pressure was obtained while
obtaining the measurements of the MCA Doppler to avoid excessive compression to the
fetal head while obtaining the readings.

52
2.6 Fetal cardiac function
The following systolic and diastolic cardiac functional parameters were measured for
our study.
Diastolic function
a) E/A ratio
Systolic Function
a) Assessment of outflow tracts
b) Stroke volume (SV), Right, left and combined cardiac output
Left ventricular myocardial performance index – assessment of global cardiac function
2.7 Diastolic function
E/A Ratio
The E/A ratio is performed with spectral Doppler through the atrioventricular valves with
the heart either in a posterior or an anterior apical projection (Figure 2.1). The
interventricular septum is aligned at zero degrees with the Doppler beam before obtaining
the measurement, and the angle of insonation is kept below 20 degrees to get the
waveform. The Doppler gate is placed just below the A-V valves and set to 2-3 mm to avoid
contamination with artefacts resulting from wall motion and outflow tracts. The pulse
repetition frequency (PRF) is adjusted so that the waveform occupies at least 75% of the
scale. Three to five symmetrical waveforms were obtained, and the average measurement
was taken for analysis.(103)
The first component of the waveform is the ‘E’ wave related to the process of myocardial
relaxation followed by the second wave (A wave) that represents atrial contraction during
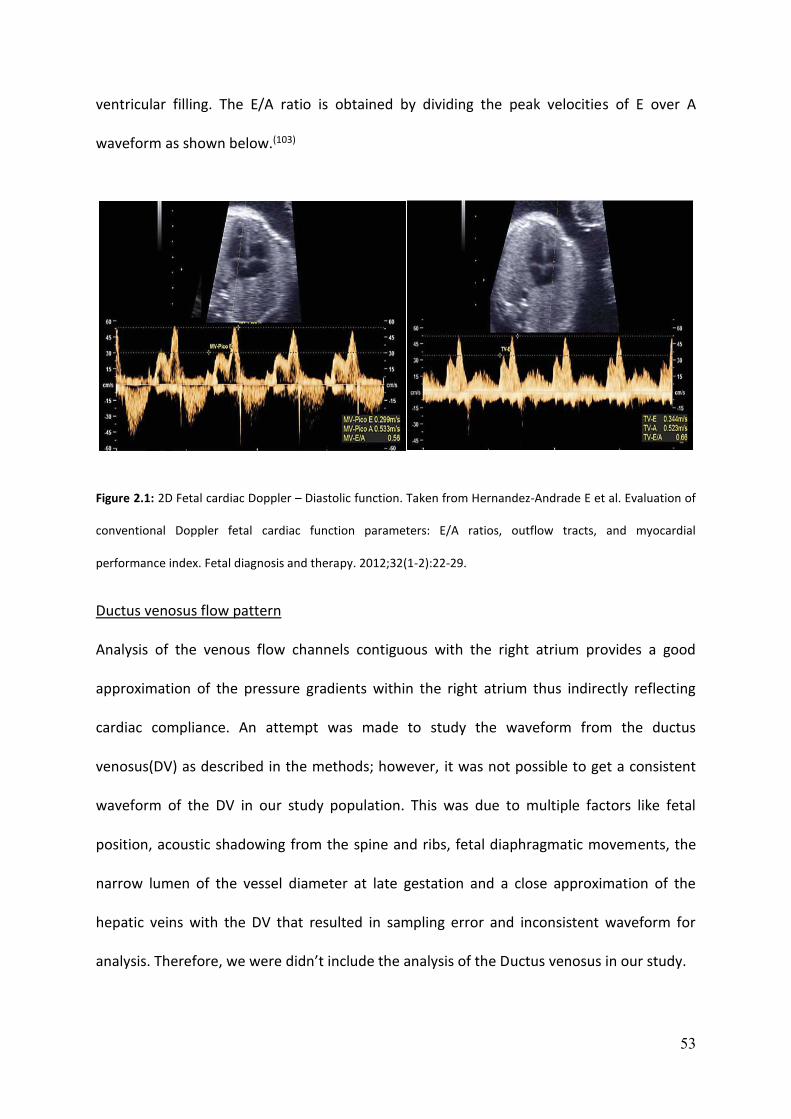
53
ventricular filling. The E/A ratio is obtained by dividing the peak velocities of E over A
waveform as shown below.(103)
Figure 2.1: 2D Fetal cardiac Doppler – Diastolic function. Taken from Hernandez-Andrade E et al. Evaluation of
conventional Doppler fetal cardiac function parameters: E/A ratios, outflow tracts, and myocardial
performance index. Fetal diagnosis and therapy. 2012;32(1-2):22-29.
Ductus venosus flow pattern
Analysis of the venous flow channels contiguous with the right atrium provides a good
approximation of the pressure gradients within the right atrium thus indirectly reflecting
cardiac compliance. An attempt was made to study the waveform from the ductus
venosus(DV) as described in the methods; however, it was not possible to get a consistent
waveform of the DV in our study population. This was due to multiple factors like fetal
position, acoustic shadowing from the spine and ribs, fetal diaphragmatic movements, the
narrow lumen of the vessel diameter at late gestation and a close approximation of the
hepatic veins with the DV that resulted in sampling error and inconsistent waveform for
analysis. Therefore, we were didn’t include the analysis of the Ductus venosus in our study.

54
2.8 Systolic function
Assessment of outflow tracts, Right, left and combined cardiac output
Systolic function of the heart is measured by recording the velocity of blood ejected by the
ventricles, which would allow estimation of stroke volume and the cardiac output (Figure
2.2). Differential cardiac output assessment provides valuable information regarding blood
flow to different regions in the fetus. Measurements of aortic flow reflect changes in the left
ventricle and pulmonary arterial flow reflect that of the right ventricle.(104)
The aortic outflow tract is evaluated on a long axis of the left ventricle. This view is obtained
from an apical 4-chamber view with the transducer turned slightly towards the right
shoulder of the fetus. This technique exposes the aorta as a single vessel in continuity with
the interventricular septum. The pulmonary artery is evaluated either in a short or long axis
view of the right ventricle. The short axis is obtained from the 4-chamber view by rotating
the transducer to the fetal left side; the long axis is achieved by slightly displacing the
transducer from the four chambers towards the fetal head. The angle of insonation is kept
close to zero as possible during Doppler acquisition to obtain the best readings.(103)
The peak systolic velocity, velocity time integral and ejection time is obtained as shown in
the shown in the figure below to calculate the stroke volume, ejection fraction and the
cardiac output.(103)

55
Figure 2.2: 2D Fetal cardiac Doppler-Systolic function. Taken from Hernandez-Andrade E et al. Evaluation of
conventional Doppler fetal cardiac function parameters: E/A ratios, outflow tracts, and myocardial
performance index. Fetal diagnosis and therapy. 2012;32(1-2):22-29.
For assessment of the cardiac output, it is important to measure the valve area and the
velocity time integral of the aortic and the pulmonary valve respectively to obtain the stroke
volume which then multiplied by the heart rate to obtain the cardiac output.
The valve area is calculated by using the formula πr2 or (3.14 x valve diameter/2)2. The
velocity time integral for the aortic and pulmonary valve is calculated by manually tracing
the Doppler signal on the corresponding waveform that provides the ejection velocity,
ejection time, heart rate and the velocity time integral of the corresponding valve. Stroke
volume of the left and the right ventricle is calculated by multiplying the velocity time
integral by the valve area of the aortic and the pulmonary valve respectively. Cardiac output
of the respective ventricles is obtained by multiplying the stroke volume and the heart rate.
56
The weight adjusted cardiac output (mL/min/kg) of the right and left side is calculated by
dividing the corresponding cardiac output by the estimated fetal weight and the combined
cardiac output is the sum of both ventricular outputs.
2.9 Left Ventricular Myocardial Performance Index (LV - MPI)
The left ventricular myocardial performance index is obtained with a cross-sectional view of
the fetal thorax in the apical projection showing a good 4-chamber view (Figure 2.3). The
Doppler gate is then placed to include both the lateral wall of the ascending aorta, and the
mitral valve where the clicks correspond to the opening and closing of the valves are clearly
seen. The sample volume should be 2-4 mm, and the gain is optimised so that the valve
clicks are visualised and appear more echogenic than the E/A wave and aortic
waveforms.(103)
The E/A waveform and the aortic waveform should remain visible always during the process,
and the sweep velocity is set to maximum. The E/A waveform is displayed as a positive flow.
Isovolumetric contraction time (ICT), Isovolumetric relaxation time (IRT) and Ejection time
(ET) are calculated as described in the figure below. The cursor is placed just before the
echo of each valve click with care to avoid overlapping with the echogenic reflection from
the valve.(103) The myocardial performance index is obtained by the adding the isovolumetric
contraction(ICT) and relaxation(IRT) time divided by the ejection time(ET) of the left
ventricle
(LV.MPI = ICT + IRT / ET). Each cardiac parameter was recorded three times, and a mean of
the values was used for analysis.

57
Figure 2.3: 2D Fetal cardiac Doppler -MPI. Taken from Hernandez-Andrade E et al. Evaluation of conventional
Doppler fetal cardiac function parameters: E/A ratios, outflow tracts, and myocardial performance index. Fetal
diagnosis and therapy. 2012;32(1-2):22-29.
The right ventricular MPI can also be obtained in a similar way as the left ventricle by
analysis of the waveforms at the tricuspid and pulmonary artery valves; however due to
their different anatomical configuration; they cannot be captured simultaneously for
waveform analysis. Due to the above limitations, assessment of right ventricular MPI is less
frequently used in clinical practice; therefore, we did not perform the assessment of right
ventricular MPI in our methodology.(105)
All data generated from this study were initially entered to a storage database (Microsoft
Excel – 2013) and subsequently transferred to statistical analysis software (Graph Pad Prism
version 6.03, Graph Pad Software Inc, La Jolla, CA 92037 United States of America) for
further analysis.

58
Chapter 3 – Pilot study
3.1 Introduction
There have not been previously published studies measuring the fetal cardiac output in
appropriate for gestational age fetuses at term prior to labour. We therefore could not
obtain data required for power calculation for our study. It was also intended to evaluate if
this study was feasible to be performed prior to active labour.
Prior et al.(69)from our unit had published his data on the assessment of intrapartum hypoxia
by measurement of the cerebroplacental ratio before labour by performing a similar pilot
study since there had not been previously published reports to generate a sample size. We
therefore decided to recruit similar numbers based on the lack of evidence to obtain the
data for analysis and perform a power calculation for a larger study.
3.2 Aims
1 To measure fetal cardiac function and fetal Doppler (cerebroplacental ratio) in
appropriate for gestational age singleton fetuses at term before labour in nulliparous
women.
2 To generate the mean and standard deviation for cardiac functional parameters
from the data to perform power calculation and calculate a sample size to achieve a
statistical power of >0.80.

59
3.3 Materials and Methods
135 patients were recruited to this prospective observational pilot study at Queen
Charlotte's and Chelsea Hospital, London U. K for nine months from March 2013 until
November 2013. Leaflets describing the study were provided to pregnant women attending
their routine antenatal clinic and midwifery appointments. Study leaflets were also
displayed at the antenatal clinic, antenatal ward, delivery suite and in the day assessment
unit to facilitate recruitment.
Pregnant women who agreed to participate in this study and met the inclusion criteria were
given a copy of the study information sheet (Appendix A). They were given sufficient time to
read the information and to discuss the study with the researcher. Participants agreed to
the study were then asked to sign the consent form to be included in the research
(Appendix B).
The inclusion criteria were nulliparous women with appropriately grown normal term
singleton fetuses (37-42 weeks inclusive gestation) who were either in early labour or had
induction of labour. Exclusion criteria included cervical dilatation more than 4 cm, pre-
eclampsia, maternal diseases like diabetes, hypertension, diagnosis of fetal growth
restriction, fetal anomaly, chromosomal or genetic abnormality, evidence of congenital fetal
infections or maternal age less than 16 years. All women recruited to the study were
delivered within 72 hours. Ethical approval for this study was granted by the London
Research Ethics Committee (Ref no: REC 10/H0718/26).

60
3.4 Results
The patient’s demographic information (Table 3.1) were recorded in the Appendix C before
starting the examination.
The entire ultrasound assessment was completed in about 30 to 45 minutes depending on
the fetal position and the availability of adequate views for assessment. Data obtained from
this study was not made available to the clinicians responsible for the patient’s intrapartum
care and labour was managed as per local protocols and guidelines. All data were initially
stored on the ultrasound machine’s hard drive and subsequently downloaded to an external
hard drive for off-line analysis.
Intrapartum and neonatal outcome were collected from the patients and baby case medical
records. Intrapartum evaluation included details of electronic fetal heart rate monitoring,
fetal blood sampling, meconium stained liquor and intrapartum pyrexia (Table3.1). Delivery
details included the indication and mode of delivery. Immediate puerperal complications
that occurred within the first 48 hours were also recorded.
Neonatal outcome details were obtained from neonatal electronic and clinical case records.
Information about birth weight, APGAR score, cord pH, base deficit and admission if any
were recorded for analysis.
All data generated from this study were entered to a storage database (Microsoft Excel –
2013) and subsequently transferred to statistical analysis software (Graph Pad Prism version
6.03, Graph Pad Software Inc, La Jolla, CA 92037 United States of America) for further
analysis.

61
The primary outcome of this pilot study was to measure the cardiac output in fetuses before
labour and to record the mean and standard deviation of each parameter to enable
accurate power calculation.
For analysis, fetuses were grouped per indication and the mode of delivery into the
following five categories.
1. Spontaneous vaginal delivery (SVD)
2. Emergency caesarean section for intrapartum fetal distress (CS-FD)
3. Emergency caesarean section for prolonged second stage of labour(CS-FTP)
4. Instrumental delivery for intrapartum fetal distress (Ins -FD)
5. Instrumental delivery for prolonged second stage of labour(Ins-FTP)
Maternal demographics
Patient Demographics n =135
Age (median and range) 31 (21-47)
BMI (median and range) kg/m2 25 (18-43)
Smoker 5/135 (3.7%)
Partner as a smoker 23/135 (17%)
Ethnicity
Caucasian 97/135 (72%)
Asian 23/135 (16.8%)
Afro-Caribbean 12/135 (9%)
Other 3/135 (2%)
Onset of labour
Spontaneous 10/135 (7.5%)
Induction of labour 125/135 (92.5%)
Table 3.1: Maternal demographics, ethnicity and onset of labour
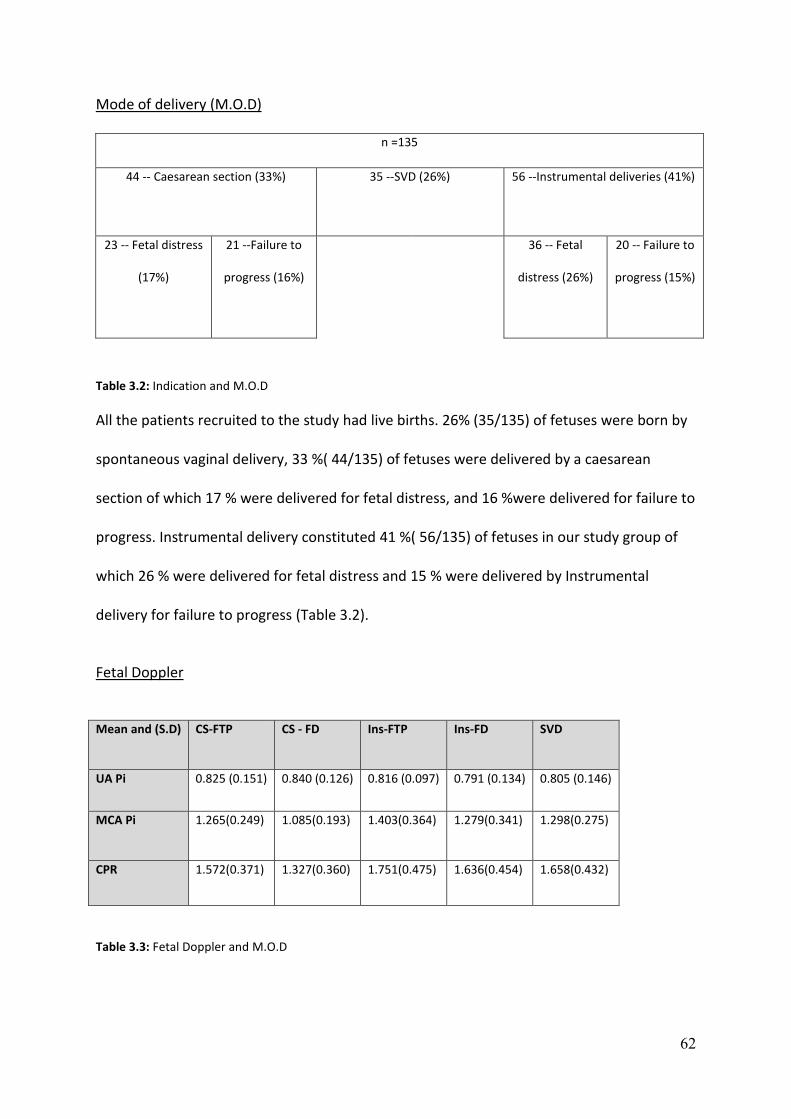
62
Mode of delivery (M.O.D)
n =135
44 -- Caesarean section (33%) 35 --SVD (26%) 56 --Instrumental deliveries (41%)
23 -- Fetal distress
(17%)
21 --Failure to
progress (16%)
36 -- Fetal
distress (26%)
20 -- Failure to
progress (15%)
Table 3.2: Indication and M.O.D
All the patients recruited to the study had live births. 26% (35/135) of fetuses were born by
spontaneous vaginal delivery, 33 %( 44/135) of fetuses were delivered by a caesarean
section of which 17 % were delivered for fetal distress, and 16 %were delivered for failure to
progress. Instrumental delivery constituted 41 %( 56/135) of fetuses in our study group of
which 26 % were delivered for fetal distress and 15 % were delivered by Instrumental
delivery for failure to progress (Table 3.2).
Fetal Doppler
Mean and (S.D) CS-FTP CS - FD
Ins-FTP Ins-FD SVD
UA Pi 0.825 (0.151) 0.840 (0.126) 0.816 (0.097) 0.791 (0.134) 0.805 (0.146)
MCA Pi 1.265(0.249) 1.085(0.193) 1.403(0.364)
1.279(0.341) 1.298(0.275)
CPR 1.572(0.371) 1.327(0.360) 1.751(0.475) 1.636(0.454) 1.658(0.432)
Table 3.3: Fetal Doppler and M.O.D

63
Fetal cardiac function
The following systolic and diastolic cardiac function parameters were performed, and results
were analysed and summarised in the table below.
1. Diastolic cardiac function
E/A ratio across the mitral and tricuspid valve
2. Systolic Function
Ejection velocity across the aortic and pulmonary valve
Ejection time across the aortic and pulmonary valve
velocity time integral (VTI) across the aortic and pulmonary valve
Left and right ventricular Stroke volume (SV)
Right cardiac output
Left cardiac output
Combined cardiac output
3. Left Ventricular Myocardial performance index (LV-MPI)

64
Mean and standard deviation (S.D) CS-FTP CS - FD
Ins-FTP Ins-FD SVD
Diastolic function
E/A ratio at Mitral valve 0.81 (0.067) 0.80 (0.088) 0.82 (0.072)
0.81 (0.095) 0.83 (0.089)
E/A ratio at Tricuspid valve 0.78 (0.080) 0.82 (0.092) 0.81 (0.088) 0.82 (0.068) 0.82 (0.071)
Systolic Function
Ejection velocity at the aortic valve 0.775 (0.122) 0.706 (0.127) 0.745 (0.147) 0.778 (0.125) 0.704 (0.106)
Ejection time at aortic valve 0.167 (0.014) 0.156 (0.012) 0.165 (0.012) 0.162 (0.009) 0.160 (0.009)
VTI at aortic valve 0.123 (0.030) 0.099 (0.019) 0.110 (0.029) 0.113 (0.026) 0.102 (0.022)
Ejection velocity -Pulmonary valve 0.713 (0.138) 0.736 (0.149) 0.715 (0.111) 0.703 (0.138) 0.660 (0.115)
Ejection time - Pulmonary valve 0.168 (0.013) 0.168 (0.017) 0.168 (0.016) 0.169 (0.013) 0.166 (0.013)
VTI at pulmonary valve 0.113 (0.026) 0.116 (0.030) 0.111 (0.021) 0.109 (0.023) 0.104 (0.023)
RV –Stroke volume 7.98 (2.42) 8.23 (3.42) 8.07 (2.59) 7.53 (2.57) 7.36 (2.72)
LV – Stroke volume 6.23 (1.85) 4.66 (0.99) 5.80 (2.03) 5.57 (1.76) 5.02 (1.71)
RV -LV difference 1.75 (1.99) 3.57 (3.35) 2.78 (3.51) 1.66 (1.65) 2.33 (2.09)
RCO/mL/min/kg 298.8 (83.55) 301.6 (111.7) 311.6 (105) 297.5 (94.09) 291 (99.68)
LCO/mL/min/kg 229.4 (60.81) 171.5 (30.77) 212.7 (81.87) 228.1 (71.12) 198 (63.87)
CCO/mL/min/kg 528.2 (126.7) 473.1 (121.6) 524.3 (148.1) 525.6 (153.8) 489 (144.5)
LV-MPI 0.60 (0.084) 0.59 (0.070) 0.60 (0.072) 0.60 (0.069) 0.62 (0.068)
Table 3.4: Fetal cardiac function parameters and M.O.D
Inter and Intra –Observer variability
Inter and Intra-observer variability was expressed as correlation coefficients. Fetal Cardiac
function and Doppler measurements were repeated after 15 minutes in a cohort of thirty
patients to assess intra-observer variability (Table 3.5). Similarly, for assessment of inter-
observer variability, the measurements were repeated by another operator in a cohort of 30
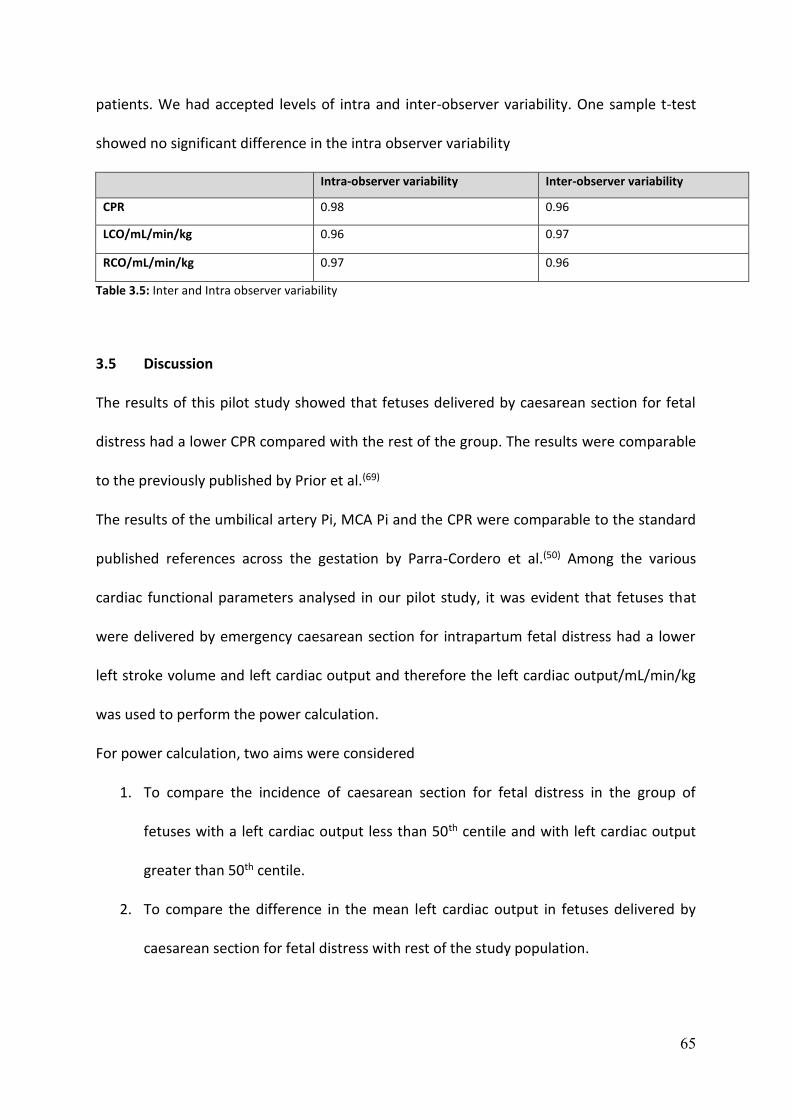
65
patients. We had accepted levels of intra and inter-observer variability. One sample t-test
showed no significant difference in the intra observer variability
Intra-observer variability Inter-observer variability
CPR 0.98 0.96
LCO/mL/min/kg 0.96 0.97
RCO/mL/min/kg 0.97 0.96
Table 3.5: Inter and Intra observer variability
3.5 Discussion
The results of this pilot study showed that fetuses delivered by caesarean section for fetal
distress had a lower CPR compared with the rest of the group. The results were comparable
to the previously published by Prior et al.(69)
The results of the umbilical artery Pi, MCA Pi and the CPR were comparable to the standard
published references across the gestation by Parra-Cordero et al.(50) Among the various
cardiac functional parameters analysed in our pilot study, it was evident that fetuses that
were delivered by emergency caesarean section for intrapartum fetal distress had a lower
left stroke volume and left cardiac output and therefore the left cardiac output/mL/min/kg
was used to perform the power calculation.
For power calculation, two aims were considered
1. To compare the incidence of caesarean section for fetal distress in the group of
fetuses with a left cardiac output less than 50th centile and with left cardiac output
greater than 50th centile.
2. To compare the difference in the mean left cardiac output in fetuses delivered by
caesarean section for fetal distress with rest of the study population.
66
Power calculation was performed to achieve a statistical significance of 0.05 by two-tailed T-
Test analysis.
We observed in our pilot study that the incidence of emergency caesarean section for fetal
distress was higher in the group of fetuses with LCO/ml/min/kg less than the 50th centile
(20/68 =29%) when compared with fetuses that had LCO/ml/min/kg greater than the 50th
centile (3/67=4%).
To compare the incidence of caesarean section for fetal distress in the group of fetuses with
the left cardiac output less than 50th centile with fetuses of left cardiac output greater than
the 50th centile, we required a sample size of 67 patients in each group to achieve a power
of 0.8 to reject the null hypothesis. Similarly, to determine a difference in the mean left
cardiac output/min/kg between fetuses delivered by caesarean section for fetal distress
with all other fetuses we required a sample size of 50 patients (25 in each group) to achieve
a power of 0.8 and reject the null hypothesis.
There have not been previously published studies on fetal cardiac function assessment
before labour. The studies available were either performed at earlier gestation or were
limited up to until 41 weeks gestation.(106) Mielke et al. in 2001 performed a prospective
study in 222 fetuses from 13 to 41 weeks gestation and published standard reference ranges
for the cardiac function.(81) They observed that the reference range values were seen to
increase exponentially with advancing gestation.
The median combined cardiac output and left cardiac outputs were 425 mL/min/kg and
179mL/min/kg respectively. The median ratio to the right and the left cardiac output was
1.42. The median ratio of the right cardiac output to the combined cardiac output was 0.59
and median ratio of the left cardiac output to the combined cardiac output was 0.41. This
ratio was not seen to increase exponentially with gestational age.(81)

67
The values of the right, left and the combined cardiac output obtained from our initial pilot
study data were similar and comparable to the values obtained from this study.(81) Although
the initial data from the pilot study was powered to compare the incidence of caesarean
section for fetal distress with the left cardiac output <50th centile, and further to the
recommendations by the reviewers, we decided to increase the recruitment up to 200 that
may help to perform further subgroup analysis.

68
Chapter 4 --Pre-labour assessment of fetal cardiac function
4.1 Introduction
From the results of pilot study, it was evident that to compare the incidence of caesarean
section for fetal distress in those fetuses with left cardiac output <50th centile with fetuses
of left cardiac output>50th centile; we required a sample size of 67 patients in each group to
achieve a power of 0.8 to reject the null hypothesis. Similarly, to determine a difference in
the mean left cardiac output/min/kg between patients delivered by caesarean section for
fetal distress with all other fetuses, we require a sample size of 50 patients (25 in each
group) to achieve a power of 0.8 and reject the null hypothesis. Further to our initial
recruitment and suggestions by the reviewers of the project, it was agreed to increase the
total number of recruited patients to 200 to perform further subgroup analysis and also to
find if other cardiac parameters could become significant by recruiting additional numbers.
4.2 Aims
1. 2D Ultrasound measurement of fetal cardiac function and fetal Doppler
(Cerebroplacental ratio) in AGA singleton fetuses at term in nulliparous women
before labour and correlate with risk of adverse intrapartum and neonatal outcome.
2. To identify the ideal cardiac ultrasound parameter in the prediction of intrapartum
fetal distress.

69
4.3 Hypothesis
1. Fetuses that require emergency caesarean section for intrapartum fetal distress
will have poor cardiac function and low CPR. Reliable identification of fetuses at
risk of adverse intrapartum events will allow risk stratification and appropriate
management of these pregnancies during labour.
4.4 Methods
This is a prospective observational study conducted at Queen Charlotte's and Chelsea
Hospital, London, UK over a period of 15 months from November 2013 to February 2015.
We recruited 200 nulliparous women with appropriately grown term singleton fetuses to
participate in this study. All the study participants were given written information about the
procedure followed by written consent to be recruited into the study as explained in
chapter 2(Methods). Once consent was obtained all the recruited participants in the study
underwent ultrasound assessment as described in the methods section of chapter
2(Methods).
The obstetric staffs were blinded to the ultrasound findings, and labour was managed per
the local departmental guidelines. The intrapartum and neonatal outcome data were
recorded from hospital case notes, electronic databases and correlated with the ultrasound
findings.
The primary outcome was to identify the mode of delivery and to check for presence or
absence of intrapartum fetal distress in our study population. We also considered secondary
outcomes that include electronic fetal heart rate monitoring findings classified according to
the NICE guidelines(107), presence or absence of meconium stained liquor, the neonatal
outcomes which include APGAR score, cord blood pH, base excess at delivery and the
70
neonatal case records to check for neonatal admissions. APGAR score of less than 7 at one
or five minutes, cord blood pH less than 7.20 and base excess less than - 8.0 were defined as
adverse outcome according to the intrapartum guidelines used in the U.K.(108) (109)
4.5 Analysis of Data
The primary data from our study were initially transferred to Microsoft Excel 2013(Microsoft
Systems, Redmond, WA, U.S.A) and subsequent statistical analysis was performed using
Graph Pad Prism version 6.03(Graph Pad Software Inc. La Jolla, CA 92037 USA) and SPSS
version 19(SPSS Inc., Cary NC).
Distribution of the data was evaluated using D' Agostino -Pearson normality test with a
value less than 0.05 suggestive of a non -normal distribution.
Data in this study are represented in the format appropriate to the statistical analysis and
distribution of the data. Non-Gaussian distribution is represented as median and
interquartile range while normal distribution is represented as mean and standard deviation
in our analysis. A probability value less than 0.05 was considered statistically significant.
Data analysis were performed using one-way ANOVA (analysis of variance) as there were
more than three variables and independent sample t-tests were used for normal
distribution of the data. Kruskal -Wallis and Mann-Whitney U significance testing was used
in analysis of non -normal distribution of data. Dunn's multiple comparison tests were used
to find if there was a significant difference in the mean rank difference between the study
groups. Chi square tests and relative risk calculator was used for comparing proportions
between the study groups. Receptor operative characteristics (ROC) curves were
constructed to test the predictive value where appropriate to establish optimal levels of
sensitivity and specificity. Since this study was designed to identify ultrasound parameters of
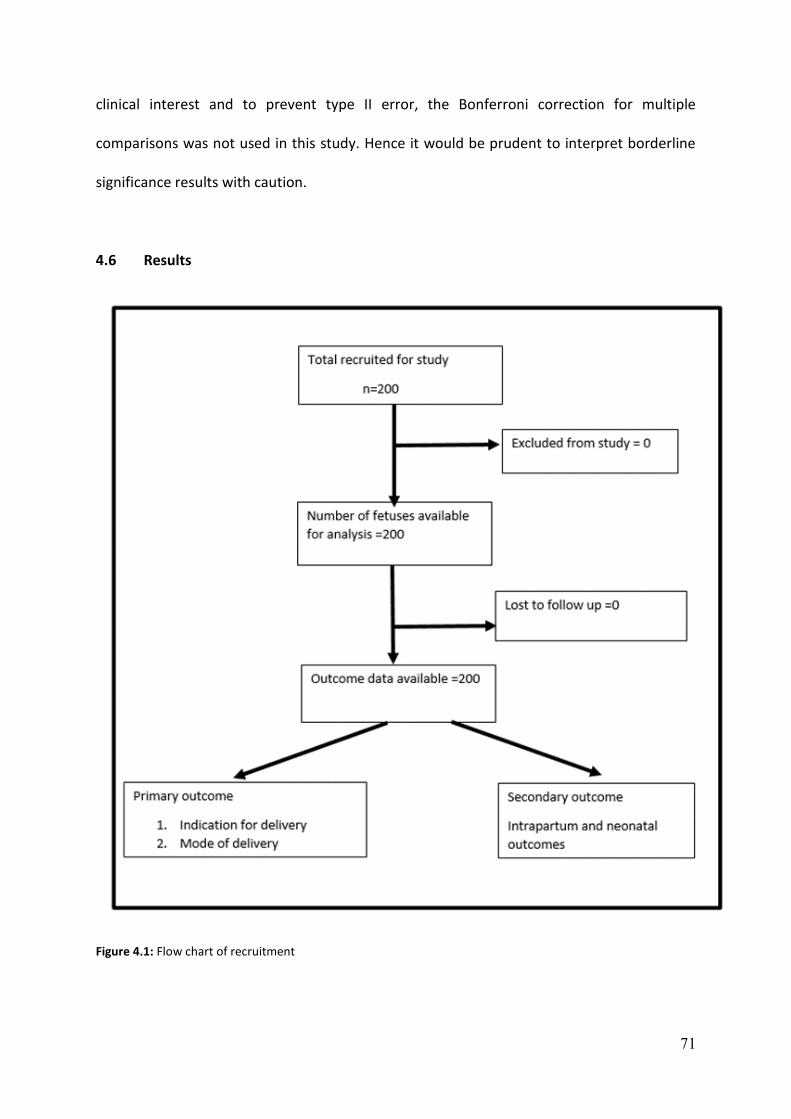
71
clinical interest and to prevent type II error, the Bonferroni correction for multiple
comparisons was not used in this study. Hence it would be prudent to interpret borderline
significance results with caution.
4.6 Results
Figure 4.1: Flow chart of recruitment

72
Maternal Demographics
The following details were obtained from the obstetric case notes of the patients recruited
to our study (Table 4.1).
Patient Demographics n =200
Age (median and range) 32 (16-45)
BMI (median and range) Kg/m2 25 (18-43)
Smoker 11/200 (5.5%)
Partner as a smoker 44/200 (22%)
Ethnicity
Caucasian 139/200 (69.5%)
Asian 31/200 (15.5%)
Afro-Caribbean 21/200 (10.5%)
Other 9/200 (4.5%)
Onset of labour
Spontaneous or early stage of labour 42/200 (21%)
Induction of labour
158/200(79%)
Table 4.1: Maternal demographics, ethnicity and onset of labour

73
Indication and M.O.D
n =200
Caesarean section
71 (35.5%)
Spontaneous vaginal delivery 50
(25%)
Instrumental deliveries
79 (39.5%)
Fetal distress
34 (17%)
Failure to progress
37 (18.5%)
Fetal distress
46 (23%)
Failure to
progress
33 (16.5%)
Table 4.2: Indication and M.O.D
Maternal demographics, ethnicity and mode of delivery
Mean and S. D CS –FTP CS – FD Ins- FTP Ins –FD SVD p /X2
Maternal age
33.2 (4.99) 32.4 (6.12) 31.4 (4.56) 33.6 (6.62) 31.4 (5.70) 0.314
Maternal BMI 26.47 (4.48) 26.20 (4.65) 25.55 (4.50) 25.48 (3.73) 25.52 (5.29) 0.730
Median G. A 41 (38.42 to 41.71)
41.42 (39 to 42)
41.14 (37 to 41.71)
40.71 (37.42 to 42)
40.85 (37.14 to 42)
0.059
Ethnicity and M.O. D
Caucasian 20 (10%) 21 (10.5%) 24 (12%) 35 (17.5%) 39 (19.5%) 0.65
Asian 8 (4%) 4 (2%) 4 (2%) 8 (4%) 7 (3.5%) 0.80
Afro -Caribbean 7 (3.5%) 6 (3%) 3 (1.5%) 2 (1%) 2 (1%) 0.10
Other 2 (1%) 2 (1%) 2 (1%) 2(1%) 2 (1%) 0.92
Table 4.3: Maternal demographics, ethnicity and M.O.D

74
All the patients in our study gave birth to live singleton infants. The time interval between
the ultrasound assessment and delivery was within 72 hours as specified in the protocol.
The onset of labour was spontaneous in 21 %( 42/200) of the study population while 79%
(158/200) of women had induction of labour in our study group.
Caucasian women constituted 69.5 %( 139/200) of the mothers in our study group followed
by 15.5 %( 31/20) of Asian women. Afro-Caribbean represented 10.5% (20/200), and other
mixed ethnic origin accounted for 4.5% (9/200) in our study population.
Of the study cohort, 35.5% (71/200) of women were delivered by emergency caesarean
section of which 17% of fetuses were delivered by emergency caesarean section for fetal
distress, and 18.5% were delivered by emergency caesarean section for failure to progress.
Instrumental delivery constituted 39.5% (79/200) of women in our study group of which 23%
of fetuses were delivered for fetal distress and 16.5% of fetuses for failure to progress.
Spontaneous vaginal delivery constituted 25% (50/200) of women in our study group.
There was no significant difference between maternal age, BMI, ethnicity and the mean
gestational age in fetuses when grouped per the indication and the mode of delivery.
The relationship between maternal demographics and ethnicity were also correlated with
ultrasound parameters to observe if they affected the ultrasound markers of well-being.
Pearson correlation coefficient was used to observe if there was a correlation between
maternal demographics (Maternal age, BMI and G.A) against EFW,AFI, CPR, LCO, RCO, CCO
and the ratio of the right to left cardiac output.
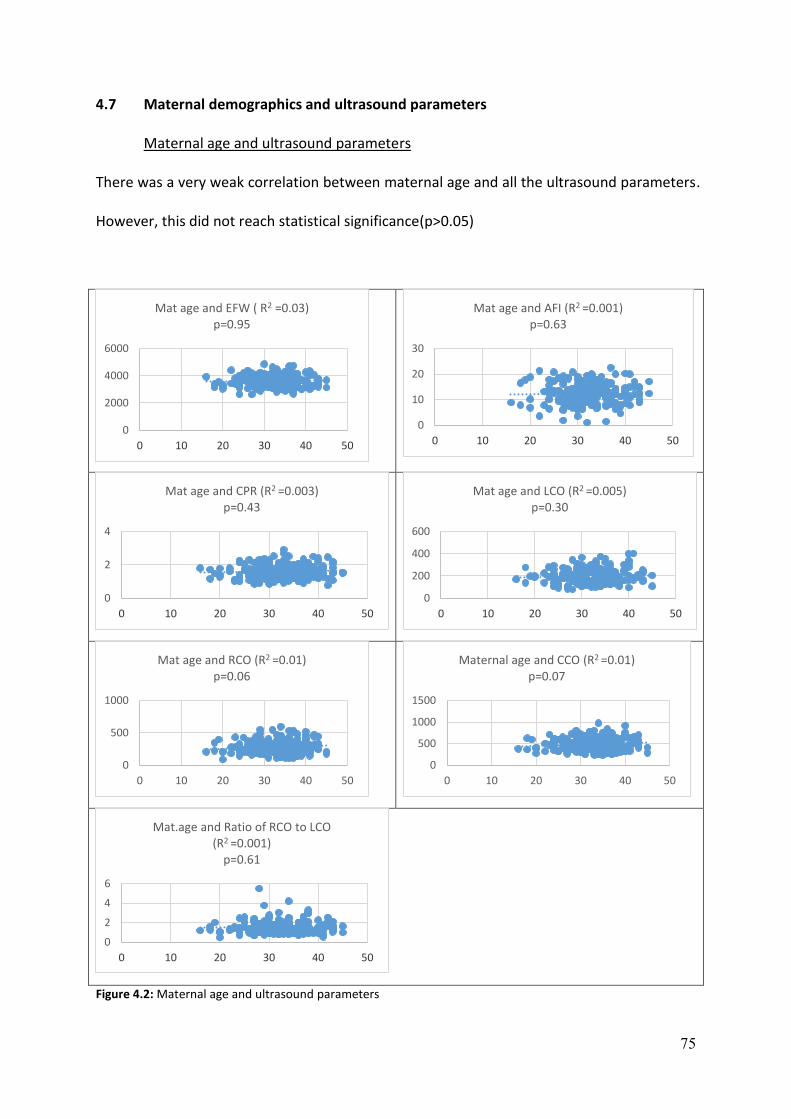
75
4.7 Maternal demographics and ultrasound parameters
Maternal age and ultrasound parameters
There was a very weak correlation between maternal age and all the ultrasound parameters.
However, this did not reach statistical significance(p>0.05)
Figure 4.2: Maternal age and ultrasound parameters
0
2000
4000
6000
0 10 20 30 40 50
Mat age and EFW ( R2 =0.03)p=0.95
0
10
20
30
0 10 20 30 40 50
Mat age and AFI (R2 =0.001)p=0.63
0
2
4
0 10 20 30 40 50
Mat age and CPR (R2 =0.003)p=0.43
0
200
400
600
0 10 20 30 40 50
Mat age and LCO (R2 =0.005)p=0.30
0
500
1000
0 10 20 30 40 50
Mat age and RCO (R2 =0.01)p=0.06
0
500
1000
1500
0 10 20 30 40 50
Maternal age and CCO (R2 =0.01)p=0.07
0
2
4
6
0 10 20 30 40 50
Mat.age and Ratio of RCO to LCO (R2 =0.001)
p=0.61

76
Maternal BMI and ultrasound parameters
Negative correlation was seen between the BMI and all the ultrasound parameters except
EFW that showed a very weak positive correlation (R2=0.003). However, this did not reach
statistical significance (p>0.05).
Figure 4.3: BMI and ultrasound parameters
0
5000
10000
0 10 20 30 40 50
Mat.BMI and EFW (R2 =0.003)p=0.40
0
20
40
0 10 20 30 40 50
BMI and AFI (R2 = - 0.006)p=0.27
0
2
4
0 10 20 30 40 50
BMI and CPR (R2 = - 0.01)p=0.06
0
500
0 10 20 30 40 50
BMI and LCO (R2 = - 0.0005)p=0.75
0
500
1000
0 10 20 30 40 50
BMI and RCO (R2 = - 0.01)p=0.05
0
1000
2000
0 10 20 30 40 50
BMI and CCO (R2 = - 0.01)p=0.12
0
10
0 10 20 30 40 50
BMI and Ratio of RCO to LCO (R2 = - 0.12)
p=0.08

77
Gestational age and ultrasound parameters
Positive correlation was noted between the gestational age and the EFW (R2=0.20) while
other parameters had a weak negative correlation (R2=<0.1). However, this did not reach
statistical significance (p>0.05).
Figure 4.4: Gestational age and ultrasound parameters
0
2000
4000
6000
36 38 40 42 44
Gestation and EFW (R2 = 0.20)p=0.45
0
10
20
30
36 38 40 42 44
Gestation and AFI (R2 = - 0.04)p=0.06
0
1
2
3
4
36 38 40 42 44
Gestation and CPR (R2 = - 0.001)p=0.43
0
200
400
600
36 38 40 42 44
GA and LCO (R2 = - 0.001)p=0.62
0
200
400
600
800
36 38 40 42 44
GA and RCO (R2 = 0.003)p=0.42
0
500
1000
1500
36 38 40 42 44
GA and CCO (R2 = 0.02)p=0.74
0
2
4
6
36 38 40 42 44
G.A and Ratio of RCO to LCO(R2 = 0.08)p=0.21
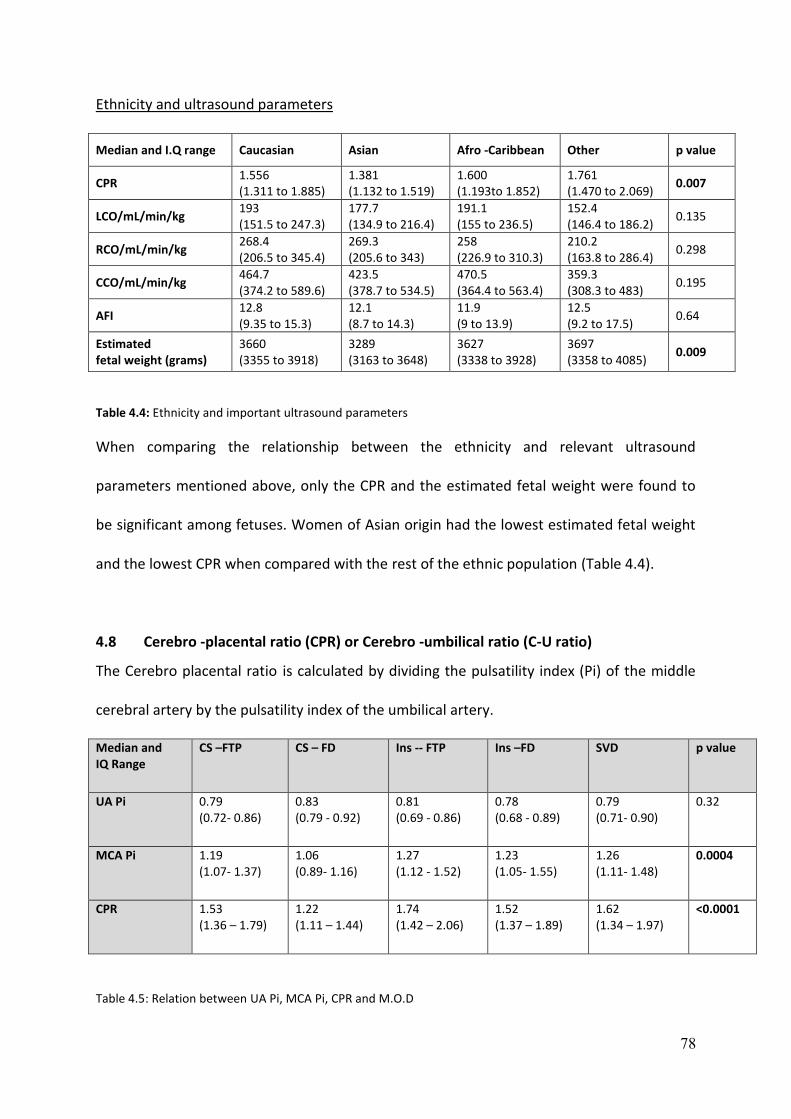
78
Ethnicity and ultrasound parameters
Median and I.Q range Caucasian Asian Afro -Caribbean Other p value
CPR 1.556 (1.311 to 1.885)
1.381 (1.132 to 1.519)
1.600 (1.193to 1.852)
1.761 (1.470 to 2.069)
0.007
LCO/mL/min/kg 193 (151.5 to 247.3)
177.7 (134.9 to 216.4)
191.1 (155 to 236.5)
152.4 (146.4 to 186.2)
0.135
RCO/mL/min/kg 268.4 (206.5 to 345.4)
269.3 (205.6 to 343)
258 (226.9 to 310.3)
210.2 (163.8 to 286.4)
0.298
CCO/mL/min/kg 464.7 (374.2 to 589.6)
423.5 (378.7 to 534.5)
470.5 (364.4 to 563.4)
359.3 (308.3 to 483)
0.195
AFI 12.8 (9.35 to 15.3)
12.1 (8.7 to 14.3)
11.9 (9 to 13.9)
12.5 (9.2 to 17.5)
0.64
Estimated fetal weight (grams)
3660 (3355 to 3918)
3289 (3163 to 3648)
3627 (3338 to 3928)
3697 (3358 to 4085)
0.009
Table 4.4: Ethnicity and important ultrasound parameters
When comparing the relationship between the ethnicity and relevant ultrasound
parameters mentioned above, only the CPR and the estimated fetal weight were found to
be significant among fetuses. Women of Asian origin had the lowest estimated fetal weight
and the lowest CPR when compared with the rest of the ethnic population (Table 4.4).
4.8 Cerebro -placental ratio (CPR) or Cerebro -umbilical ratio (C-U ratio)
The Cerebro placental ratio is calculated by dividing the pulsatility index (Pi) of the middle
cerebral artery by the pulsatility index of the umbilical artery.
Median and IQ Range
CS –FTP CS – FD Ins -- FTP Ins –FD SVD p value
UA Pi 0.79 (0.72- 0.86)
0.83 (0.79 - 0.92)
0.81 (0.69 - 0.86)
0.78 (0.68 - 0.89)
0.79 (0.71- 0.90)
0.32
MCA Pi 1.19 (1.07- 1.37)
1.06 (0.89- 1.16)
1.27 (1.12 - 1.52)
1.23 (1.05- 1.55)
1.26 (1.11- 1.48)
0.0004
CPR 1.53 (1.36 – 1.79)
1.22 (1.11 – 1.44)
1.74 (1.42 – 2.06)
1.52 (1.37 – 1.89)
1.62 (1.34 – 1.97)
<0.0001
Table 4.5: Relation between UA Pi, MCA Pi, CPR and M.O.D

79
The CPR was measured in all the fetuses in our study population. The median CPR was
1.532(range 0.77 to 2.89). The median 10th centile value of CPR was 1.008, and the 90th
centile was 2.29. The CPR had a non-Gaussian distribution in our study population
(Skewness =0.03, kurtosis = 0.49, D’agostino-Pearson test of normality p = <0.001)
Figure 4.5: CPR distribution
Descriptive statistics
CS –FTP CS –FD Ins – FTP Ins – FD SVD
n = 200 37 34 33 46 50
Minimum 0.8857 0.8660 1.061 0.8478 0.7755
25% Percentile 1.369 1.113 1.425 1.374 1.342
Median 1.532 1.222 1.740 1.527 1.629
75% Percentile 1.799 1.442 2.069 1.892 1.975
Maximum 2.511 1.775 2.895 2.694 2.350
Mean 1.586 1.266 1.739 1.622 1.649
Std. Deviation 0.3652 0.2363 0.4349 0.4223 0.3818
Std. Error of Mean 0.06004 0.04053 0.07571 0.06226 0.05399
Lower 95% CI 1.465 1.184 1.585 1.496 1.541
Upper 95% CI 1.708 1.349 1.893 1.747 1.758
Mean ranks 102.4 52.29 122.8 104.8 113.2
Table 4.6: Descriptive statistics of CPR
0
2
4
6
8
10
12
14
16
18
20
0.5
0.6
0.7
0.8
0.9 1
1.1
1.2
1.3
1.4
1.5
1.6
1.7
1.8
1.9 2
2.1
2.2
2.3
2.4
2.5
2.6
2.7
2.8
2.9 3
CPR

80
Dunn's multiple comparison tests
Mean rank difference Significant? Summary
CS-FTP vs. CS-FD 50.07 Yes Significant
CS-FTP vs. Ins-FTP -20.39 No Not significant
CS-FTP vs. Ins-FD -2.461 No Not significant
CS-FTP vs. SVD -10.87 No Not significant
CS-FD vs. Ins-FTP -70.46 Yes Significant
CS-FD vs. Ins-FD -52.53 Yes Significant
CS-FD vs. SVD -60.94 Yes Significant
Ins-FTP vs. Ins-FD 17.93 No Not significant
Ins-FTP vs. SVD 9.528 No Not significant
Ins-FD vs. SVD -8.404 No Not significant
Table 4.7: Dunn's multiple comparison tests – CPR
There was a significant difference in the CPR, when fetuses were classified per the indication
and the mode of delivery (p = < 0.0001).
The lowest median CPR was recorded in fetuses that were delivered by emergency
caesarean section for fetal distress (1.222, IQR=1.113 to 1.442) and the highest median CPR
was recorded in fetuses delivered by instrumental delivery for failure to progress (1.740,
IQR=1.425 to 2.069).
Dunn's multiple comparisons tests showed a difference in the mean ranks between fetuses
delivered by emergency caesarean section for fetal distress when compared with fetuses
delivered by caesarean section for failure to progress, spontaneous vaginal delivery and
Instrumental delivery for fetal distress and failure to progress (Table 4.6 and 4.7).
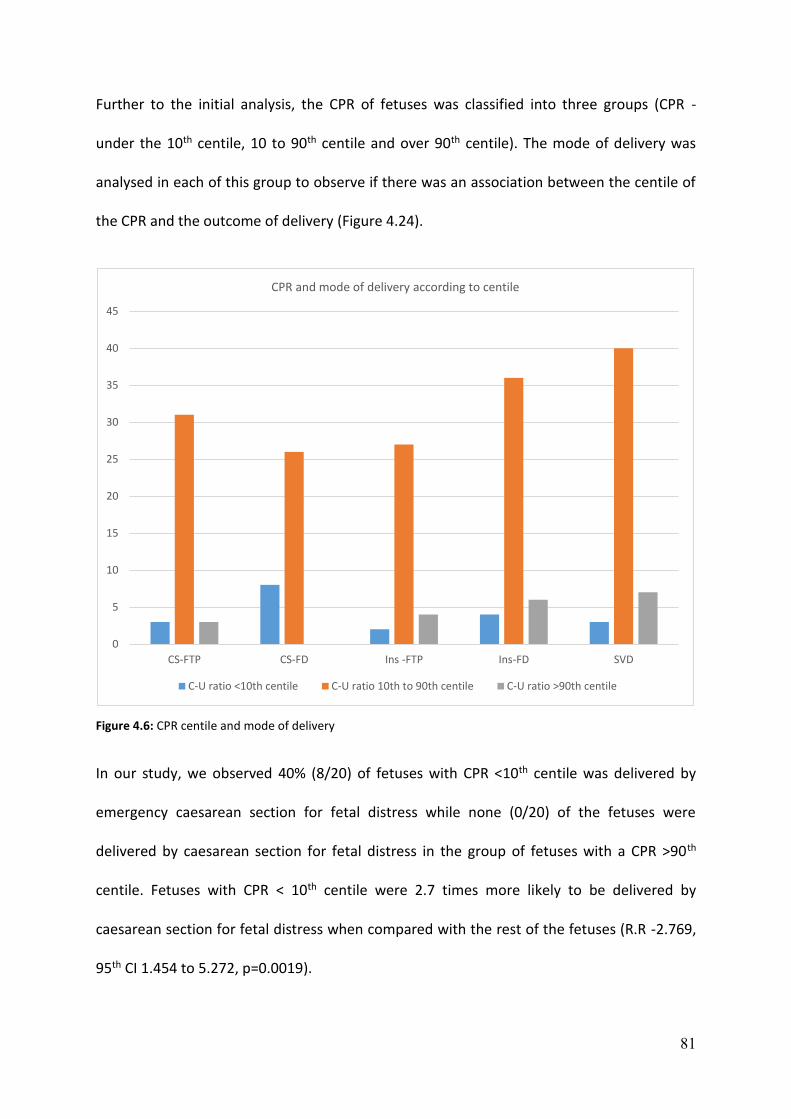
81
Further to the initial analysis, the CPR of fetuses was classified into three groups (CPR -
under the 10th centile, 10 to 90th centile and over 90th centile). The mode of delivery was
analysed in each of this group to observe if there was an association between the centile of
the CPR and the outcome of delivery (Figure 4.24).
Figure 4.6: CPR centile and mode of delivery
In our study, we observed 40% (8/20) of fetuses with CPR <10th centile was delivered by
emergency caesarean section for fetal distress while none (0/20) of the fetuses were
delivered by caesarean section for fetal distress in the group of fetuses with a CPR >90th
centile. Fetuses with CPR < 10th centile were 2.7 times more likely to be delivered by
caesarean section for fetal distress when compared with the rest of the fetuses (R.R -2.769,
95th CI 1.454 to 5.272, p=0.0019).
0
5
10
15
20
25
30
35
40
45
CS-FTP CS-FD Ins -FTP Ins-FD SVD
CPR and mode of delivery according to centile
C-U ratio <10th centile C-U ratio 10th to 90th centile C-U ratio >90th centile

82
There were no fetuses in the group of CPR greater than the 90th centile that had caesarean
section for fetal distress suggesting that fetuses with CPR greater than the 90th centile were
protective of caesarean section for fetal distress (Negative predictive value (NPV) -100%).
These above results were comparable to the previous study by Prior et al.(69)
We did not find any significant difference in the maternal age, BMI, gestational age and the
ethnicity when the CPR of the fetuses was grouped per the different centiles (<10th centile,
10-90th centile and greater than 90th centile).
4.9 Fetal cardiac function
The following systolic and diastolic cardiac function parameters were measured in our study
population (Table 14) and the median and interquartile range are represented in the table
below.

83
Median, (IQR) CS – FTP CS – FD Ins -- FTP Ins --FD SVD p value
Diastolic function
E/A ratio Mitral valve
0.81 (0.77 – 0.84)
0.81 (0.75 – 0.87)
0.82 (0.76 – 0.88)
0.82 (0.76 – 0.88)
0.82 (0.76 – 0.87)
0.80
E/A ratio Tricuspid valve
0.79 (0.75 - 0.84)
0.79 (0.77 – 0.86)
0.84 (0.76 – 0.87)
0.82 (0.79 – 0.86)
0.81 (0.75 – 0.86)
0.14
Left heart function Systolic Function
Heart rate at Aorta 136 (129 -144)
137 (132 - 144)
135 (130 - 143)
139 (134 - 148)
141 (130 - 146)
0.406
Aortic valve diameter 7.85 (7.30 – 8.27)
7.90 (7.40 – 8.40)
8.00 (7.30 – 8.80)
7.70 (7.00 – 8.32)
8.10 (7.30 – 8.60)
0.608
Aortic valve area 48.37 (41.83– 53.75)
48.99 (42.98-55.38)
50.24 (41.83-60.79)
46.54 (38.46–54.40)
51.50 (41.83–51.50)
0.656
Ejection velocity aortic valve
0.805 (0.672-0.897)
0.720 (0.610-0.820)
0.760 (0.680-0.850)
0.790 (0.680-0.850)
0.700 (0.650-0.820)
0.078
Ejection time aortic valve
0.164 (0.156-0.175)
0.156 (0.145-0.160)
0.164 (0.160-0.173)
0.164 (0.156-0.169)
0.160 (0.156-0.168)
0.0005
VTI at aortic valve 0.100 (0.090-0.135)
0.090 (0.070-0.100)
0.100 (0.080-0.120)
0.110 (0.097-0.130)
0.100 (0.080-0.112)
< 0.0001
LV – Stroke volume 5.460 (4.132-6.860)
4.019 (3.411-5.407)
4.753 (4.086-6.247)
5.116 (4.272-6.418)
4.684 (3.893-6.127)
0.028
LCO 191.1 (149.9-251.4)
152.3 (124.3-192.9)
174.4 (150.3-230.7)
204.9 (169.7-256.4)
196.4 (148-232.5)
0.003
Right heart function Systolic Function
Heart rate 140 (133-144) 140 (132- 146) 136 (132- 142) 140(132- 146) 138(134- 144) 0.463
Diameter Pulmonary valve
9.55 (8.60- 9.87)
9.50 (8.80- 10.10)
9.40 (8.50- 10.35)
9.05 (8.17- 10.13)
9.30 (8.55- 10.10)
0.762
Pulmonary valve area
71.59 (58.05- 76.55)
70.84 (60.79- 80.07)
69.36 (56.72- 84.09)
64.29 (52.46- 80.47)
67.89 (57.38- 80.07)
0.762
Ejection velocity Pulmonary. valve
0.660 (0.600- 0.832)
0.740 (0.620- 0.810)
0.700 (0.560- 0.770)
0.660 (0.600-0.750)
0.660 (0.580- 0.740)
0.462
Ejection time at pulmonary valve
0.167 (0.160-0.178)
0.169 (0.158- 0.182)
0.164 (0.160- 0.179)
0.166 (0.158- 0.178)
0.164 (0.160- 0.169)
0.674
VTI pulmonary valve
0.108 (0.090- 0.120)
0.110 (0.090- 0.120)
0.110 (0.080- 0.125)
0.105 (0.090- 0.120)
0.100 (0.080- 0.110)
0.429
RV –Stroke volume 6.659 (5.506- 9.001)
7.495 (6.238- 9.156)
7.084 (5.627- 7.997)
6.916 (5.253- 8.808)
6.346 (5.265- 8.252)
0.560
RCO 259.6 (196.5- 336.0)
273.6 (221.4- 322.0)
233.0 (208.3- 311.2)
279.4 (203.2- 349.7)
262.2 (207.8- 344.8)
0.887
CCO/mL/min/kg 449 (373- 595.5)
426.5 (362.2- 520.0)
448.7 (365.9- 566.9)
483.0 (387.8- 594.9)
445.6 (391.9- 547.6)
0.700
Difference RV -LV stroke volume
1.250 (0.220- 3.276)
3.025 (1.960- 4.574)
2.036 (0.494- 3.892)
1.373 (0.240- 2.692)
1.789 (0.980- 2.931)
0.0113
Difference RCO and LCO
46.17 (12.57- 117.3)
121.6 (74.98- 174.6)
78.42 (18.38- 146.2)
56.02 (14.49- 113.2)
68.25 (28.40- 121.1)
0.0158
Percentage of RCO/mL/min/kg
57.4 (51.1- 61.1)
65.8 (58.4-70.8)
58.6 (52.2- 64.8)
55.6 (51.4- 60.9)
57.6 (52.2- 63.4)
0.0019
Percentage of LCO/mL/min/kg
42.6 (38.8- 48.8)
34.2 (29.1- 41.6)
41.4 (35.1- 47.7)
44.4 (39.0- 48.5)
42.4 (36.5- 47.7)
0.0019
Ratio of RCO to LCO 1.34 (1.04- 1.57)
1.92 (1.40- 2.42)
1.41 (1.09- 1.84)
1.25 (1.06- 1.56)
1.35 (1.09- 1.73)
0.0019
LV -MPI 0.645 (0.570- 0.670)
0.620 (0.580- 0.660)
0.610 (0.570- 0.650)
0.610 (0.550- 0.650)
0.650 (0.590- 0.700)
0.126
Table 4.8: Fetal cardiac function assessment and M.O.D
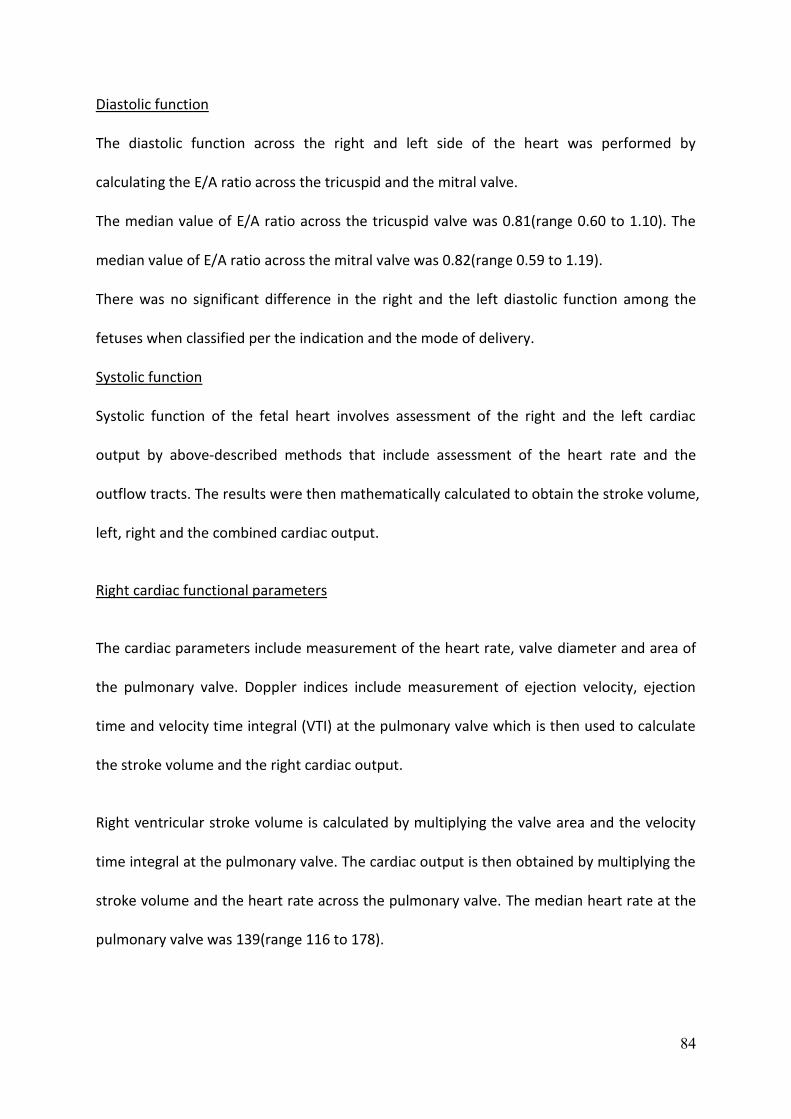
84
Diastolic function
The diastolic function across the right and left side of the heart was performed by
calculating the E/A ratio across the tricuspid and the mitral valve.
The median value of E/A ratio across the tricuspid valve was 0.81(range 0.60 to 1.10). The
median value of E/A ratio across the mitral valve was 0.82(range 0.59 to 1.19).
There was no significant difference in the right and the left diastolic function among the
fetuses when classified per the indication and the mode of delivery.
Systolic function
Systolic function of the fetal heart involves assessment of the right and the left cardiac
output by above-described methods that include assessment of the heart rate and the
outflow tracts. The results were then mathematically calculated to obtain the stroke volume,
left, right and the combined cardiac output.
Right cardiac functional parameters
The cardiac parameters include measurement of the heart rate, valve diameter and area of
the pulmonary valve. Doppler indices include measurement of ejection velocity, ejection
time and velocity time integral (VTI) at the pulmonary valve which is then used to calculate
the stroke volume and the right cardiac output.
Right ventricular stroke volume is calculated by multiplying the valve area and the velocity
time integral at the pulmonary valve. The cardiac output is then obtained by multiplying the
stroke volume and the heart rate across the pulmonary valve. The median heart rate at the
pulmonary valve was 139(range 116 to 178).

85
Right ventricular stroke volume
Stroke volume (SV) is the difference between the end diastolic volume (EDV) and the end
systolic volume (ESV). The right ventricular stroke volume is obtained by multiplying the
velocity time integral of the pulmonary valve with the valve area of the pulmonary valve.
The right ventricular stroke volume was measured in all the fetuses in our study population.
The median right ventricular stroke volume was 6.98 mL (range 2.05 to 17.23 mL). The right
ventricular stroke volume had a non-normal distribution (skewness = 1.00, kurtosis =1.63,
D’agostino-Pearson test of normality p = <0.001).
Figure 4.7: RV stroke volume distribution
0
5
10
15
20
25
30
1.5 2
2.5 3
3.5 4
4.5 5
5.5 6
6.5 7
7.5 8
8.5 9
9.5 10
10
.5 11
11
.5 12
12
.5 13
13
.5 14
14
.5 15
15
.5 16
16
.5 17
17
.5 18
RV -Stroke volume
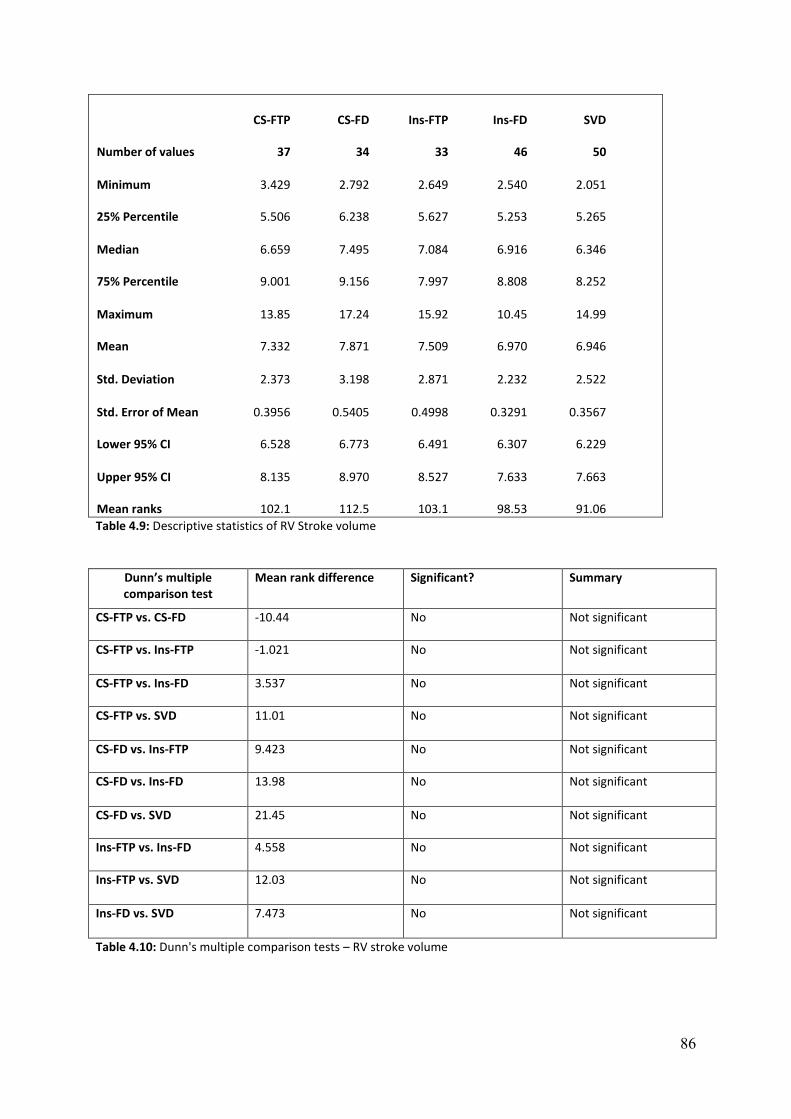
86
CS-FTP CS-FD Ins-FTP Ins-FD SVD
Number of values 37 34 33 46 50
Minimum 3.429 2.792 2.649 2.540 2.051
25% Percentile 5.506 6.238 5.627 5.253 5.265
Median 6.659 7.495 7.084 6.916 6.346
75% Percentile 9.001 9.156 7.997 8.808 8.252
Maximum 13.85 17.24 15.92 10.45 14.99
Mean 7.332 7.871 7.509 6.970 6.946
Std. Deviation 2.373 3.198 2.871 2.232 2.522
Std. Error of Mean 0.3956 0.5405 0.4998 0.3291 0.3567
Lower 95% CI 6.528 6.773 6.491 6.307 6.229
Upper 95% CI 8.135 8.970 8.527 7.633 7.663
Mean ranks 102.1 112.5 103.1 98.53 91.06
Table 4.9: Descriptive statistics of RV Stroke volume
Dunn’s multiple comparison test
Mean rank difference Significant? Summary
CS-FTP vs. CS-FD -10.44 No Not significant
CS-FTP vs. Ins-FTP -1.021 No Not significant
CS-FTP vs. Ins-FD 3.537 No Not significant
CS-FTP vs. SVD 11.01 No Not significant
CS-FD vs. Ins-FTP 9.423 No Not significant
CS-FD vs. Ins-FD 13.98 No Not significant
CS-FD vs. SVD 21.45 No Not significant
Ins-FTP vs. Ins-FD 4.558 No Not significant
Ins-FTP vs. SVD 12.03 No Not significant
Ins-FD vs. SVD 7.473 No Not significant
Table 4.10: Dunn's multiple comparison tests – RV stroke volume
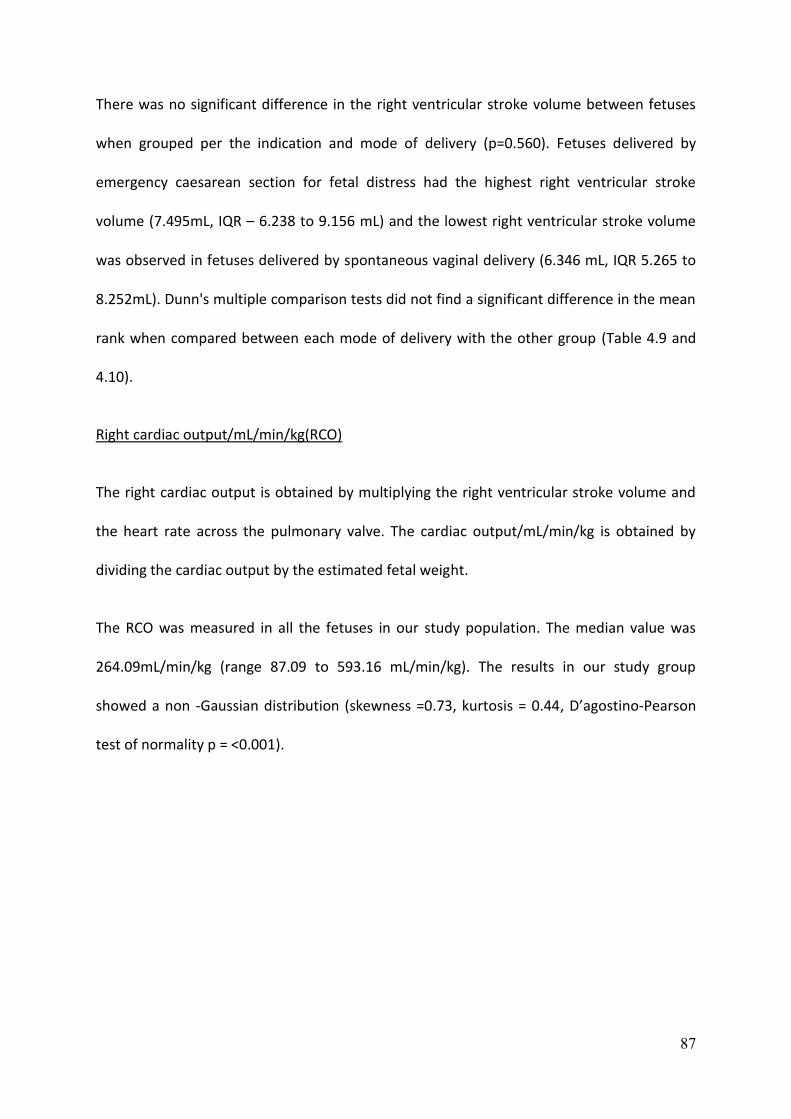
87
There was no significant difference in the right ventricular stroke volume between fetuses
when grouped per the indication and mode of delivery (p=0.560). Fetuses delivered by
emergency caesarean section for fetal distress had the highest right ventricular stroke
volume (7.495mL, IQR – 6.238 to 9.156 mL) and the lowest right ventricular stroke volume
was observed in fetuses delivered by spontaneous vaginal delivery (6.346 mL, IQR 5.265 to
8.252mL). Dunn's multiple comparison tests did not find a significant difference in the mean
rank when compared between each mode of delivery with the other group (Table 4.9 and
4.10).
Right cardiac output/mL/min/kg(RCO)
The right cardiac output is obtained by multiplying the right ventricular stroke volume and
the heart rate across the pulmonary valve. The cardiac output/mL/min/kg is obtained by
dividing the cardiac output by the estimated fetal weight.
The RCO was measured in all the fetuses in our study population. The median value was
264.09mL/min/kg (range 87.09 to 593.16 mL/min/kg). The results in our study group
showed a non -Gaussian distribution (skewness =0.73, kurtosis = 0.44, D’agostino-Pearson
test of normality p = <0.001).
88
Figure 4.8: Right cardiac output distribution
CS-FTP CS-FD Ins-FTP Ins-FD SVD
Number of values 37 34 33 46 50
Minimum 125.9 111.6 108.2 114.5 87.10
25% Percentile 196.5 221.4 208.3 203.2 207.8
Median 259.6 273.6 233.0 279.4 262.2
75% Percentile 336.0 322.0 311.2 349.7 344.8
Maximum 469.4 544.9 593.2 514.3 529.7
Mean 273.4 293.7 271.7 281.8 276.2
Std. Deviation 86.84 113.0 100.7 94.68 94.21
Std. Error of Mean 14.47 19.10 17.54 13.96 13.32
Lower 95% CI 244.0 254.9 235.9 253.7 249.5
Upper 95% CI 302.8 332.6 307.4 309.9 303.0
Mean ranks 97.00 107.6 94.67 103.5 99.18
Table 4.11: Descriptive statistics of RCO/mL/min/kg
0
5
10
15
20
25
50 80 110 140 170 200 230 260 290 320 350 380 410 440 470 500 530 560 590 620
RCO/mL/min/kg

89
Dunn’s multiple comparison test
Mean rank difference Significant? Summary
CS-FTP vs. CS-FD -10.60 No Not significant
CS-FTP vs. Ins-FTP 2.333 No Not significant
CS-FTP vs. Ins-FD -6.457 No Not significant
CS-FTP vs. SVD -2.180 No Not significant
CS-FD vs. Ins-FTP 12.93 No Not significant
CS-FD vs. Ins-FD 4.143 No Not significant
CS-FD vs. SVD 8.420 No Not significant
Ins-FTP vs. Ins-FD -8.790 No Not significant
Ins-FTP vs. SVD -4.513 No Not significant
Ins-FD vs. SVD 4.277 No Not significant
Table 4.12: Dunn's multiple comparison tests – RCO/mL/min/kg
There was no significant difference in the RCO between fetuses when grouped per the
indication and the mode of delivery (p= 0.887). The highest median RCO was noted in
fetuses delivered by instrumental delivery for fetal distress (279.4 mL/min/kg, IQR 203.2 to
349.7 mL/min/kg). The lowest median RCO was observed in fetuses delivered by
instrumental delivery for failure to progress (233.0 mL/min/kg, IQR 208.3 to 311.2
mL/min/kg). Dunn's multiple comparisons tests did not find a significant difference in the
mean rank when compared between each mode of delivery with the other group (Table
4.11 and 4.12).
When maternal demographics were assessed to determine the relation to the RCO, we
observed that maternal age and the gestational age had a weak positive correlation with the
right cardiac output; however, this did not reach statistical significance.

90
Left cardiac functional parameters
The left cardiac parameters include measurement of fetal heart rate, valve diameter and
area of the aortic valve. Doppler indices include ejection velocity, ejection time and velocity
time integral (VTI) of the aortic valve which is then used to calculate the stroke volume and
the left cardiac output.
Stroke volume is calculated by multiplying the valve area and the velocity time integral. The
cardiac output is obtained by multiplying the stroke volume and the heart rate across the
aortic valve.
The median heart rate at the aortic valve was 138 (range 116 to 166).
We observed that left cardiac functional parameters were found to be significantly different
between the fetuses when grouped per the indication and the mode of delivery.
The parameters that were statistically significant are the ejection time at the aortic valve,
velocity time integral at aortic valve, left ventricular stroke volume and the left cardiac
output/mL/min/kg and would be discussed in detail.

91
Ejection time at aortic valve
The ejection time is defined as the time of ejection of blood from the left ventricle beginning
with aortic valve opening and ending with aortic valve closure measured in milliseconds.
Ejection time at aortic valve was measured in all our patients which showed a non-normal
distribution in our study population (skewness =0.25, Kurtosis =0.989, D’agostino-Pearson
test of normality p = <0.001). The median value of ejection time at aortic valve was 0.164
milliseconds (range -0.133 to 0.204 milliseconds)
Figure 4.9: Distribution of Ejection time at Aorta
0
10
20
30
40
50
60
70
Aorta -Ejection time
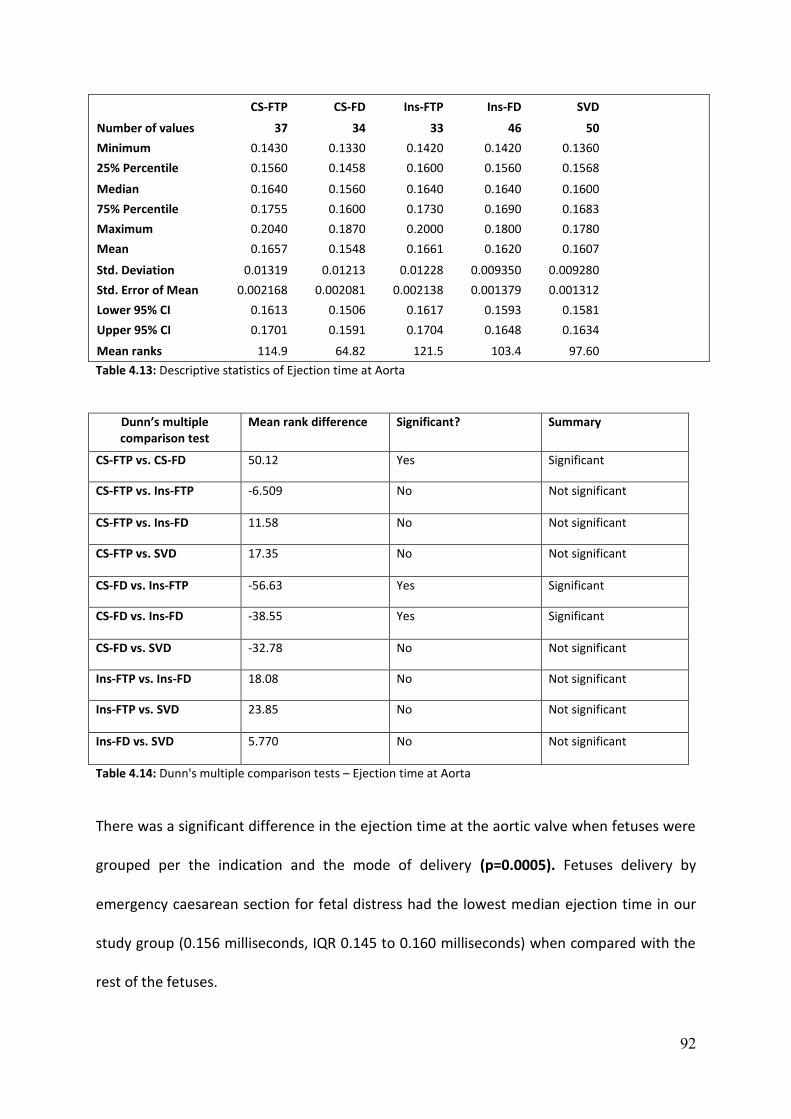
92
CS-FTP CS-FD Ins-FTP Ins-FD SVD
Number of values 37 34 33 46 50
Minimum 0.1430 0.1330 0.1420 0.1420 0.1360
25% Percentile 0.1560 0.1458 0.1600 0.1560 0.1568
Median 0.1640 0.1560 0.1640 0.1640 0.1600
75% Percentile 0.1755 0.1600 0.1730 0.1690 0.1683
Maximum 0.2040 0.1870 0.2000 0.1800 0.1780
Mean 0.1657 0.1548 0.1661 0.1620 0.1607
Std. Deviation 0.01319 0.01213 0.01228 0.009350 0.009280
Std. Error of Mean 0.002168 0.002081 0.002138 0.001379 0.001312
Lower 95% CI 0.1613 0.1506 0.1617 0.1593 0.1581
Upper 95% CI 0.1701 0.1591 0.1704 0.1648 0.1634
Mean ranks 114.9 64.82 121.5 103.4 97.60
Table 4.13: Descriptive statistics of Ejection time at Aorta
Dunn’s multiple comparison test
Mean rank difference Significant? Summary
CS-FTP vs. CS-FD 50.12 Yes Significant
CS-FTP vs. Ins-FTP -6.509 No Not significant
CS-FTP vs. Ins-FD 11.58 No Not significant
CS-FTP vs. SVD 17.35 No Not significant
CS-FD vs. Ins-FTP -56.63 Yes Significant
CS-FD vs. Ins-FD -38.55 Yes Significant
CS-FD vs. SVD -32.78 No Not significant
Ins-FTP vs. Ins-FD 18.08 No Not significant
Ins-FTP vs. SVD 23.85 No Not significant
Ins-FD vs. SVD 5.770 No Not significant
Table 4.14: Dunn's multiple comparison tests – Ejection time at Aorta
There was a significant difference in the ejection time at the aortic valve when fetuses were
grouped per the indication and the mode of delivery (p=0.0005). Fetuses delivery by
emergency caesarean section for fetal distress had the lowest median ejection time in our
study group (0.156 milliseconds, IQR 0.145 to 0.160 milliseconds) when compared with the
rest of the fetuses.

93
Dunn's multiple comparisons tests showed a significant difference in the mean ranks
between fetuses delivered by caesarean section for fetal distress when compared with a
caesarean section for failure to progress, instrumental delivery for failure to progress and
instrumental delivery for fetal distress (Table 4.13 and 4.14).
Velocity time integral at aortic valve (VTI -Aorta)
Velocity time integral is calculated by manually tracing the Doppler signal of the aortic
velocity waveform as described in the methods section. Velocity time integral is then
multiplied by the valve area of the aorta to obtain the stroke volume of the left ventricle.
The velocity time integral was measured in all the fetuses. The median value of the VTI -
aorta was 0.1 (Range 0.05 to 0.18). The values showed a non-normal distribution (skewness
=0.59, Kurtosis =0.08, D’agostino-Pearson test of normality p = <0.001).
Figure 4.10: Distribution of velocity time integral at Aorta

94
CS-FTP CS-FD Ins-FTP Ins-FD SVD
Number of values 37 34 33 46 50
Minimum 0.0600 0.0600 0.0500 0.0700 0.0600
25% Percentile 0.0900 0.0700 0.0800 0.0975 0.0800
Median 0.1000 0.0900 0.1000 0.1100 0.1000
75% Percentile 0.1350 0.1000 0.1200 0.1300 0.1125
Maximum 0.1800 0.1200 0.1700 0.1700 0.1600
Mean 0.1130 0.08618 0.1037 0.1113 0.0996
Std. Deviation 0.02943 0.01615 0.02895 0.02363 0.02147
Std. Error of Mean 0.004838 0.002769 0.005039 0.003484 0.003037
Lower 95% CI 0.1032 0.08054 0.09347 0.1043 0.09350
Upper 95% CI 0.1228 0.09181 0.1140 0.1183 0.1057
Mean ranks 119.0 61.53 100.7 121.9 93.43
Table 4.15: Descriptive statistics of VTI Aorta
Dunn’s multiple comparison test
Mean rank difference Significant? Summary
CS-FTP vs. CS-FD 57.48 Yes Significant
CS-FTP vs. Ins-FTP 18.30 No Not significant
CS-FTP vs. Ins-FD -2.932 No Not significant
CS-FTP vs. SVD 25.58 No Not significant
CS-FD vs. Ins-FTP -39.18 No Not significant
CS-FD vs. Ins-FD -60.42 Yes Significant
CS-FD vs. SVD -31.90 No Not significant
Ins-FTP vs. Ins-FD -21.23 No Not significant
Ins-FTP vs. SVD 7.282 No Not significant
Ins-FD vs. SVD 28.52 No Not significant
Table 4.16: Dunn's multiple comparison tests – VTI Aorta
There was a significant difference in the velocity time integral at the aortic valve when
fetuses were grouped per the indication and the mode of delivery (p=<0.0001). Fetuses
delivery by emergency caesarean section for fetal distress had the lowest median velocity
time integral (0.090, IQR 0.070 to 0.100) when compared with the rest of the fetuses in our
study population.
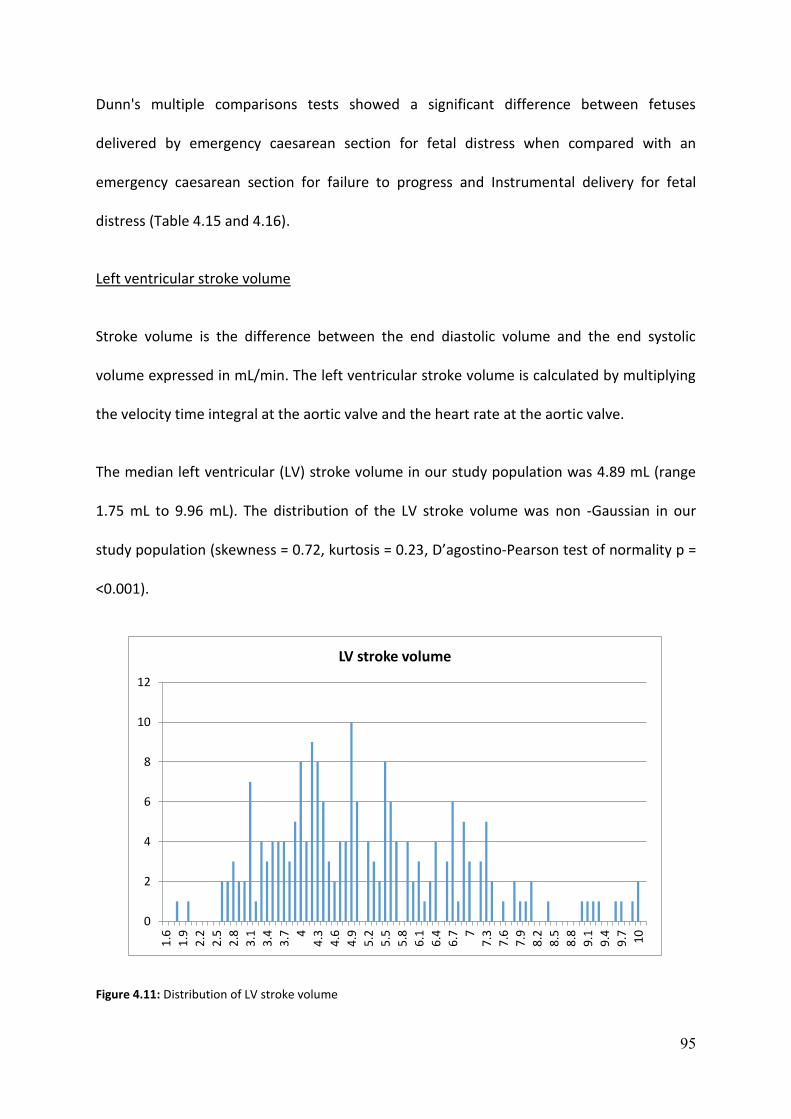
95
Dunn's multiple comparisons tests showed a significant difference between fetuses
delivered by emergency caesarean section for fetal distress when compared with an
emergency caesarean section for failure to progress and Instrumental delivery for fetal
distress (Table 4.15 and 4.16).
Left ventricular stroke volume
Stroke volume is the difference between the end diastolic volume and the end systolic
volume expressed in mL/min. The left ventricular stroke volume is calculated by multiplying
the velocity time integral at the aortic valve and the heart rate at the aortic valve.
The median left ventricular (LV) stroke volume in our study population was 4.89 mL (range
1.75 mL to 9.96 mL). The distribution of the LV stroke volume was non -Gaussian in our
study population (skewness = 0.72, kurtosis = 0.23, D’agostino-Pearson test of normality p =
<0.001).
Figure 4.11: Distribution of LV stroke volume
0
2
4
6
8
10
12
1.6
1.9
2.2
2.5
2.8
3.1
3.4
3.7 4
4.3
4.6
4.9
5.2
5.5
5.8
6.1
6.4
6.7 7
7.3
7.6
7.9
8.2
8.5
8.8
9.1
9.4
9.7 10
LV stroke volume

96
CS-FTP CS-FD Ins-FTP Ins-FD SVD
Number of values 37 34 33 46 50
Minimum 2.720 1.752 2.704 2.732 2.572
25% Percentile 4.132 3.411 4.086 4.272 3.893
Median 5.460 4.019 4.753 5.116 4.684
75% Percentile 6.860 5.407 6.247 6.418 6.127
Maximum 9.966 7.234 9.947 9.505 9.602
Mean 5.532 4.348 5.235 5.347 5.069
Std. Deviation 1.759 1.415 1.810 1.676 1.625
Std. Error of Mean 0.2891 0.2426 0.3151 0.2472 0.2298
Lower 95% CI 4.946 3.854 4.593 4.849 4.607
Upper 95% CI 6.119 4.841 5.877 5.845 5.531
Mean ranks 114.8 73.59 102.3 109.5 98.76
Table 4.17: Descriptive statistics of LV Stoke volume
Dunn’s multiple comparison test
Mean rank difference Significant? Summary
CS-FTP vs. CS-FD 41.22 Yes Significant
CS-FTP vs. Ins-FTP 12.54 No Not significant
CS-FTP vs. Ins-FD 5.311 No Not significant
CS-FTP vs. SVD 16.05 No Not significant
CS-FD vs. Ins-FTP -28.68 No Not significant
CS-FD vs. Ins-FD -35.91 No Not significant
CS-FD vs. SVD -25.17 No Not significant
Ins-FTP vs. Ins-FD -7.227 No Not significant
Ins-FTP vs. SVD 3.513 No Not significant
Ins-FD vs. SVD 10.74 No Not significant
Table 4.18: Dunn's multiple comparison tests – LV Stroke volume
Statistically significant differences were observed in the LV stroke volume when fetuses
were grouped per the indication and mode of delivery (p=0.0289). Fetuses delivered by
emergency caesarean section for fetal distress had the lowest median LV stroke volume
(4.019mL, IQR 3.411 to 5.407 mL) while fetuses delivered by caesarean section for failure to
progress had the highest median LV stroke volume (5.460mL, IQR 4.132 to 6.860 mL).

97
Dunn's multiple comparisons tests showed significant mean rank difference between
fetuses delivered by emergency caesarean section for fetal distress compared with fetuses
delivered by emergency caesarean section for failure to progress (Table 4.17 and 4.18)
The fetuses in our study population were then divided into three groups per the centiles (LV
stroke volume under the 10th centile, 10 to 90th centile and over 90th centile). The delivery
outcome data were further analysed to observe if there was an association between the
centiles of LV stroke volume and the outcome of delivery.
Figure 4.12: LV stroke volume centile and M.O.D
LV stroke volume CS -FTP CS-FD Ins –FTP Ins – FD SVD
< 10th centile (n=20) 2 6 3 5 4
10-90th centile(n=160) 31 28 25 35 41
>90th centile(n=20) 5 0 5 6 4
Table 4.19: M.O.D and LV stroke volume by centile

98
30% of fetuses (6/20) with LV stroke volume under the 10th centile was delivered by
caesarean section for fetal distress while none of the fetuses (0/20) was delivered by
caesarean section for fetal compromise in the group of LV stroke volume that was greater
than the 90th centile (Table 4.19).
Fetuses with Left ventricular (LV) stroke volume less than the 10th centile were 1.9 times
more likely to be delivered by caesarean section for fetal distress when compared with the
rest of the fetuses (R.R 1.928, 95th CI 0.910 to 4.087, p=0.086).
However, we did not have any fetuses with LV stroke volume greater than the 90th centile
that were delivered by caesarean section for fetal suggesting that fetuses with LV stroke
volume greater than the 90th centile were protective of caesarean section for fetal distress
(NPV -100%).
Left cardiac output/mL/min/kg (LCO)
The left cardiac output is obtained by multiplying the left ventricular stroke volume and the
heart rate across the aortic valve. The cardiac output/mL/min/kg is obtained by dividing the
cardiac output by the estimated fetal weight.
The LCO was measured in all the fetuses in our study population. The median value was
187.44mL/min/kg (range 79.24 to 401.84 mL/min/kg). The results in our study group
showed a non -Gaussian distribution (skewness =0.72, kurtosis = 0.30, D’agostino-Pearson
test of normality p = <0.001).
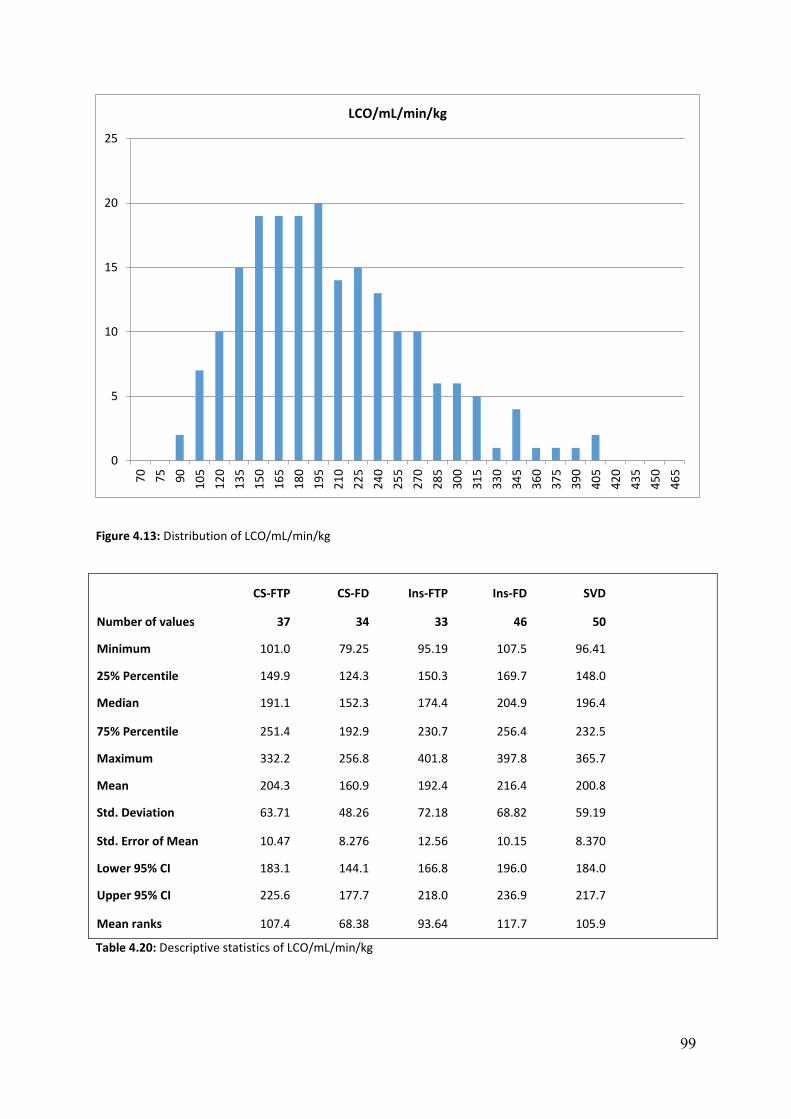
99
Figure 4.13: Distribution of LCO/mL/min/kg
CS-FTP CS-FD Ins-FTP Ins-FD SVD
Number of values 37 34 33 46 50
Minimum 101.0 79.25 95.19 107.5 96.41
25% Percentile 149.9 124.3 150.3 169.7 148.0
Median 191.1 152.3 174.4 204.9 196.4
75% Percentile 251.4 192.9 230.7 256.4 232.5
Maximum 332.2 256.8 401.8 397.8 365.7
Mean 204.3 160.9 192.4 216.4 200.8
Std. Deviation 63.71 48.26 72.18 68.82 59.19
Std. Error of Mean 10.47 8.276 12.56 10.15 8.370
Lower 95% CI 183.1 144.1 166.8 196.0 184.0
Upper 95% CI 225.6 177.7 218.0 236.9 217.7
Mean ranks 107.4 68.38 93.64 117.7 105.9
Table 4.20: Descriptive statistics of LCO/mL/min/kg
0
5
10
15
20
257
0
75
90
10
5
12
0
13
5
15
0
16
5
18
0
19
5
21
0
22
5
24
0
25
5
27
0
28
5
30
0
31
5
33
0
34
5
36
0
37
5
39
0
40
5
42
0
43
5
45
0
46
5
LCO/mL/min/kg

100
Dunn’s multiple comparison test
Mean rank difference Significant? Summary
CS-FTP vs. CS-FD 39.02 Yes Significant
CS-FTP vs. Ins-FTP 13.77 No Not significant
CS-FTP vs. Ins-FD -10.33 No Not significant
CS-FTP vs. SVD 1.505 No Not significant
CS-FD vs. Ins-FTP -25.25 No Not significant
CS-FD vs. Ins-FD -49.36 Yes Significant
CS-FD vs. SVD -37.52 Yes Significant
Ins-FTP vs. Ins-FD -24.10 No Not significant
Ins-FTP vs. SVD -12.26 No Not significant
Ins-FD vs. SVD 11.84 No Not significant
Table 4.21: Dunn's multiple comparison tests – LCO/mL/min/kg
Statistically, significant difference in the LCO was observed in the fetuses when classified per
the indication and the mode of delivery (p=0.003). Fetuses delivered by emergency
caesarean section for fetal distress had the lowest median LCO while fetuses that were
delivered by instrumental delivery for fetal distress had the highest median LCO (204.9
mL/min/kg, IQR 169.7 to 256.4 mL/min/kg). Dunn’s multiple comparison tests showed a
significant mean rank difference in fetuses delivered by caesarean section for fetal distress
when compared with fetuses delivered by caesarean section for failure to progress, fetuses
delivered by instrumental delivery for fetal distress and fetuses with normal vaginal delivery
(Table 4.20 and 4.21).
The incidence of caesarean section for fetal distress was higher (25/100 =25%) in the fetuses
which had LCO <50th centile when compared with fetuses that had LCO >50th centile
(9/100=9%). Fetuses with LCO less than 50th centile were around three times more likely to
be delivered by emergency caesarean section for fetal distress when compared with fetuses

101
with LCO greater than the 50th centile. Our results correlated with observations from the
initial pilot study.
Further to the initial analysis, we divided the fetuses into three groups (Figure 4.32) per the
centiles (LCO under the 10th centile, 10 to 90th centile and over the 90th centile). The mode
of delivery was then analysed in the groups to observe if there was an association between
the centiles of LCO/mL/min/kg and the mode of delivery.
Figure 4.14: LCO centiles and M.O.D
LCO/mL/min/kg CS -FTP CS-FD Ins –FTP Ins – FD SVD
< 10th centile (n=20) 2 8 4 4 2
10-90th centile(n=160) 30 26 26 34 44
>90th centile(n=20) 5 0 3 8 4
Table 4.22: M.O.D and LCO/mL/min/kg by centile
0
5
10
15
20
25
30
35
40
45
50
CS-FTP CS-FD Ins-FTP Ins-FD SVD
LCO/mL/min/kg and mode of delivery according to centile
<10th centile 10-90th centile >90th centile

102
We observed 40% (8/20) of fetuses with LCO <10th centile was delivered by emergency
caesarean section for fetal distress. It was interesting to observe that none of the fetuses
was delivered by caesarean section for fetal distress with LCO above the 90th centile (Table
4.22).
Fetuses with LCO < 10th centile were 2.7 times more likely to be delivered by caesarean
section for fetal distress when compared with the rest of the fetuses (R.R -2.769, 95th CI
1.454 to 5.272, p=0.0019). We did not find any fetuses with LCO greater than the 90th
centile to be delivered by caesarean section for fetal distress suggesting that fetuses with
LCO greater than the 90th centile were protective of caesarean section for fetal distress
(Negative predictive value 100%). We also did not find any significant difference in the
maternal age, BMI, gestational age and the ethnicity when the left cardiac output of the
fetuses was grouped per the different centiles (<10th centile, 10-90th centile and greater
than 90th centile).
We then performed a Binary logistic regression with the Caesarean section for fetal distress
as the dependent variable which adjusts for the influence of the potentially confounding
variable. The left cardiac output remained significant even when the cerebro -placental ratio
was included in the model suggesting that they are independent predictors for caesarean
section for fetal distress. For the same reason, there was not a strong linear correlation
between the LCO and the CPR.
Difference between Right and left ventricular stroke volume
From our initial analysis, it was evident that although the right ventricular stroke volume
was not significantly different, the right ventricular stroke volume was higher in fetuses
delivered by emergency caesarean section for fetal distress compared with the rest of the

103
group. We, therefore, decided to analyse if there was a difference between the right and
the left ventricular stroke volume if fetuses were grouped per the indication and the mode
of delivery.
The difference between the right and the left ventricular stroke volume was measured in all
the fetuses in our study population. The median value of the difference between the RV and
LV stroke volume was 1.93 mL (range -4.28 mL to 12.57 mL). The distribution was non -
Gaussian in our study group (skewness =1.02, kurtosis =2.82, D’agostino-Pearson test of
normality p = <0.001)
Figure 4.15: Distribution of the difference between RV and LV stroke volume
0
5
10
15
20
25
-10 -9 -8 -7 -6 -5 -4 -3 -2 -1 0 1 2 3 4 5 6 7 8 9 10 11 12 13
Difference between RV and LV stroke volume

104
CS-FTP CS-FD Ins-FTP Ins-FD SVD
Number of values 37 34 33 46 50
Minimum -2.348 -0.6690 -4.280 -1.374 -3.173
25% Percentile 0.2205 1.960 0.4943 0.2408 0.9800
Median 1.250 3.025 2.036 1.373 1.789
75% Percentile 3.276 4.574 3.892 2.692 2.931
Maximum 5.551 12.21 12.57 6.076 7.780
Mean 1.703 3.644 2.274 1.623 1.877
Std. Deviation 1.838 3.018 3.034 1.783 2.166
Std. Error of Mean 0.3022 0.5177 0.5281 0.2629 0.3063
Lower 95% CI 1.090 2.591 1.198 1.094 1.262
Upper 95% CI 2.316 4.697 3.350 2.153 2.493
Mean ranks 91.73 130.7 104.2 86.91 96.54
Table 4.23: Difference between RV and LV stroke volume
Dunn’s multiple comparison test
Mean rank difference Significant? Summary
CS-FTP vs. CS-FD -38.95 Yes Significant
CS-FTP vs. Ins-FTP -12.45 No Not significant
CS-FTP vs. Ins-FD 4.817 No Not significant
CS-FTP vs. SVD -4.810 No Not significant
CS-FD vs. Ins-FTP 26.49 No Not significant
CS-FD vs. Ins-FD 43.76 Yes Significant
CS-FD vs. SVD 34.14 No Not significant
Ins-FTP vs. Ins-FD 17.27 No Not significant
Ins-FTP vs. SVD 7.642 No Not significant
Ins-FD vs. SVD -9.627 No Not significant
Table 4.24: Dunn's multiple comparison tests –RV and LV stroke volume difference

105
Statistically, a significant difference between RV and LV stroke volume was observed
between the fetuses when grouped per the indication and the mode of delivery (p=0.011).
Fetuses delivered by emergency caesarean section for fetal distress had the highest
difference between the RV and LV stroke volume (3.025 mL, IQR 1.960 to 4.574 mL). The
lowest difference was observed in fetuses delivered by caesarean section for failure to
progress (1.250 mL, IQR 0.220 to 3.276 mL). Dunn’s multiple comparison tests showed a
significant mean rank difference in fetuses delivered by caesarean section for fetal distress
when compared with fetuses delivered by caesarean section for failure to progress and
fetuses delivered by instrumental delivery for fetal distress (Table 4.23 and 4.24).
Further to the initial analysis, the fetuses per the centiles were divided into three groups per
the centiles (difference between RV and LV stroke volume under the 10th centile, 10 to 90th
centile and over 90th centile). The mode of delivery was then analysed in this groups to
observe if there was an association between the difference in the stroke volume and the
outcome of delivery (Figure 4.34).
Figure 4.16: Difference between RV and LV stroke volume per centile and M.O.D
0
5
10
15
20
25
30
35
40
45
CS-FTP CS-FD Ins-FTP Ins-FD SVD
Difference between RV and LV stroke volume according to centile and M.O.D
<10th centile 10-90th centile >90th centile

106
Difference between RV and LV stroke volume
CS -FTP CS-FD Ins –FTP Ins – FD SVD
< 10th centile (n=20) 4 3 4 3 6
10-90th centile(n=160) 31 24 25 40 40
>90th centile(n=20) 2 7 4 3 4
Table 4.25: M.O.D and difference between RV and LV stroke volume by centile
There was a significant difference between the right and the left ventricular stroke volume
among fetuses grouped per the centile (p=0.011). Fetuses with the highest difference were
2.3 times more likely to be delivered by caesarean section for fetal distress (Table 4.25)
compared to the rest of the fetuses (R.R =2.33, 95th CI =1.169 TO 4.657, p=0.0163)
Difference between right and left cardiac output/mL/min/kg
From our initial analysis, we observed that fetuses delivered by caesarean section for fetal
distress had significantly lower left cardiac output and a high right cardiac output when
compared with rest of the fetuses. We, therefore, decided to find if there was a significant
difference between the right and the left cardiac output in fetuses when grouped per the
indication and the mode of delivery.
Figure 4.17: Distribution of difference between RCO and LCO
0
5
10
15
20
25
-200 -160 -120 -80 -40 0 40 80 120 160 200 240 280 320 360 400
Difference between RCO and LCO/mL/min/kg

107
The difference between the RCO and LCO /mL/min/kg was measured in all the fetuses in our
study population. The median value was 70.53 mL/min/kg (range -176 mL/min/kg to 399
mL/min/kg). The results of our study showed a non -Gaussian distribution (skewness =0.67,
kurtosis = 1.15, D’agostino-Pearson test of normality p = <0.001).
CS-FTP CS-FD Ins-FTP Ins-FD SVD
Number of values 37 34 33 46 50
Minimum -83.37 -34.12 -176.3 -59.92 -104.8
25% Percentile 12.57 74.98 18.38 14.49 28.40
Median 46.17 121.6 78.42 56.02 68.25
75% Percentile 117.3 174.6 146.2 113.2 121.1
Maximum 213.5 399.0 351.0 245.7 281.4
Mean 65.62 137.2 79.28 65.37 75.39
Std. Deviation 67.18 109.2 102.1 67.74 87.01
Std. Error of Mean 11.04 18.73 17.78 9.988 12.31
Lower 95% CI 43.22 99.05 43.07 45.25 50.66
Upper 95% CI 88.02 175.3 115.5 85.49 100.1
Mean ranks 90.81 130.8 100.8 89.39 97.12
Table 4.26: Descriptive statistics of difference between RCO and LCO
Dunn’s multiple comparison test
Mean rank difference Significant? Summary
CS-FTP vs. CS-FD -39.98 Yes Significant
CS-FTP vs. Ins-FTP -9.947 No Not significant
CS-FTP vs. Ins-FD 1.420 No Not significant
CS-FTP vs. SVD -6.309 No Not significant
CS-FD vs. Ins-FTP 30.04 No Not significant
CS-FD vs. Ins-FD 41.40 Yes Significant
CS-FD vs. SVD 33.67 No Not significant
Ins-FTP vs. Ins-FD 11.37 No Not significant
Ins-FTP vs. SVD 3.368 No Not significant
Ins-FD vs. SVD -7.729 No Not significant
Table 4.27: Dunn's multiple comparison tests – Difference between RCO and LCO
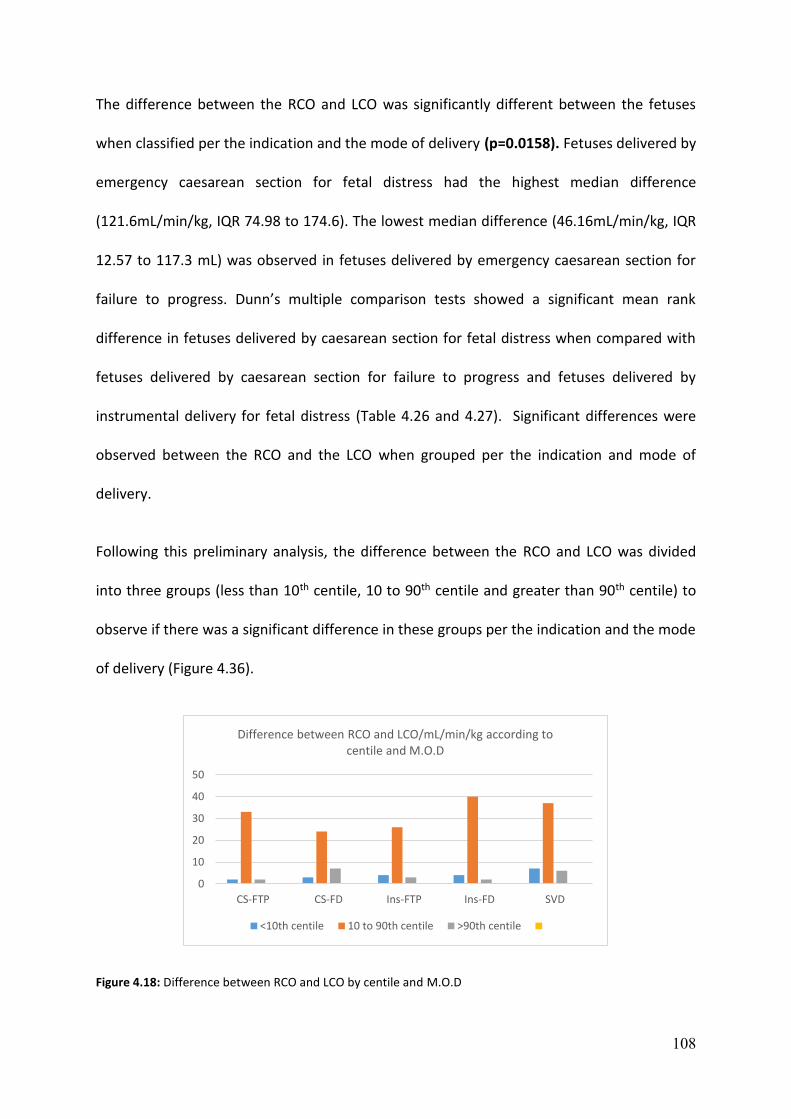
108
The difference between the RCO and LCO was significantly different between the fetuses
when classified per the indication and the mode of delivery (p=0.0158). Fetuses delivered by
emergency caesarean section for fetal distress had the highest median difference
(121.6mL/min/kg, IQR 74.98 to 174.6). The lowest median difference (46.16mL/min/kg, IQR
12.57 to 117.3 mL) was observed in fetuses delivered by emergency caesarean section for
failure to progress. Dunn’s multiple comparison tests showed a significant mean rank
difference in fetuses delivered by caesarean section for fetal distress when compared with
fetuses delivered by caesarean section for failure to progress and fetuses delivered by
instrumental delivery for fetal distress (Table 4.26 and 4.27). Significant differences were
observed between the RCO and the LCO when grouped per the indication and mode of
delivery.
Following this preliminary analysis, the difference between the RCO and LCO was divided
into three groups (less than 10th centile, 10 to 90th centile and greater than 90th centile) to
observe if there was a significant difference in these groups per the indication and the mode
of delivery (Figure 4.36).
Figure 4.18: Difference between RCO and LCO by centile and M.O.D
0
10
20
30
40
50
CS-FTP CS-FD Ins-FTP Ins-FD SVD
Difference between RCO and LCO/mL/min/kg according to centile and M.O.D
<10th centile 10 to 90th centile >90th centile

109
Difference between RCO and LCO
CS -FTP CS-FD Ins –FTP Ins – FD SVD
< 10th centile (n=20) 2 3 4 4 7
10-90th centile(n=160) 33 24 26 40 37
>90th centile(n=20) 2 7 3 2 6
Table 4.28: Difference between RCO and LCO by centile and M.O.D
Fetuses with the highest difference between the RCO and LCO were 2.3 times more likely to
be delivered by caesarean section for fetal distress (Table 4.28) compared to the rest of the
fetuses (R.R =2.33, 95th CI =1.169 to 4.657, p=0.0163).
Ratio of right to left cardiac output/mL/min/kg
There have been studies reporting a right ventricular dominance in fetal life compared to
postnatal life, and the reported ratio of right to left cardiac output ranged from 1 to 1.5.(81)
We observed a significant difference in the right to left cardiac output in our study and
therefore decided to see if there was a difference in the ratio of the right to left cardiac
output.
The median ratio of the right to left cardiac output/mL/min/kg was 1.40 (range 0.45 to 5.49).
The distribution was non -Gaussian in our study population (skewness =1.15, kurtosis =1.77,
D’agostino-Pearson test of normality p = <0.001).
The ratio of the RCO to LCO was statistically significant when fetuses were classified by the
indication and the mode of delivery (p=0.0019).

110
CS-FTP CS-FD Ins-FTP Ins -FD SVD
Number of values 37 34 33 46 50
Minimum 0.6814 0.8102 0.5612 0.7065 0.4538
25% Percentile 1.048 1.404 1.095 1.061 1.096
Median 1.350 1.925 1.419 1.252 1.359
75% Percentile 1.573 2.426 1.849 1.564 1.735
Maximum 2.574 5.493 4.212 3.275 2.928
Mean 1.368 1.981 1.543 1.349 1.438
Std. Deviation 0.3957 0.9229 0.7173 0.4467 0.5033
Std. Error of Mean 0.06505 0.1583 0.1249 0.06586 0.07118
Lower 95% CI 1.236 1.658 1.289 1.216 1.295
Upper 95% CI 1.500 2.303 1.797 1.481 1.581
Mean ranks 90.51 135.8 101.7 85.52 96.86
Table 4.29: Descriptive statistics of ratio of RCO to LCO
Dunn’s multiple comparison test
Mean rank difference Significant? Summary
CS-FTP vs. CS-FD -45.28 Yes Significant
CS-FTP vs. Ins-FTP -11.21 No Not significant
CS-FTP vs. Ins-FD 4.992 No Not significant
CS-FTP vs. SVD -6.346 No Not significant
CS-FD vs. Ins-FTP 34.07 No Not significant
CS-FD vs. Ins-FD 50.27 Yes Significant
CS-FD vs. SVD 38.93 Yes Significant
Ins-FTP vs. Ins-FD 16.21 No Not significant
Ins-FTP vs. SVD 4.867 No Not significant
Ins-FD vs. SVD -11.34 No Not significant
Table 4.30: Dunn's multiple comparison tests – ratio of RCO to LCO
Fetuses delivered by emergency caesarean section for fetal distress had the highest median
ratio (1.92, IQR 1.40 to 2.42) while fetuses delivered by instrumental delivery for fetal
distress had the lowest median ratio (1.25, IQR 1.06 to 1.56). Dunn’s multiple comparison
tests showed significant mean rank difference in fetuses delivered by caesarean section for
fetal distress when compared with fetuses delivered by emergency caesarean section for
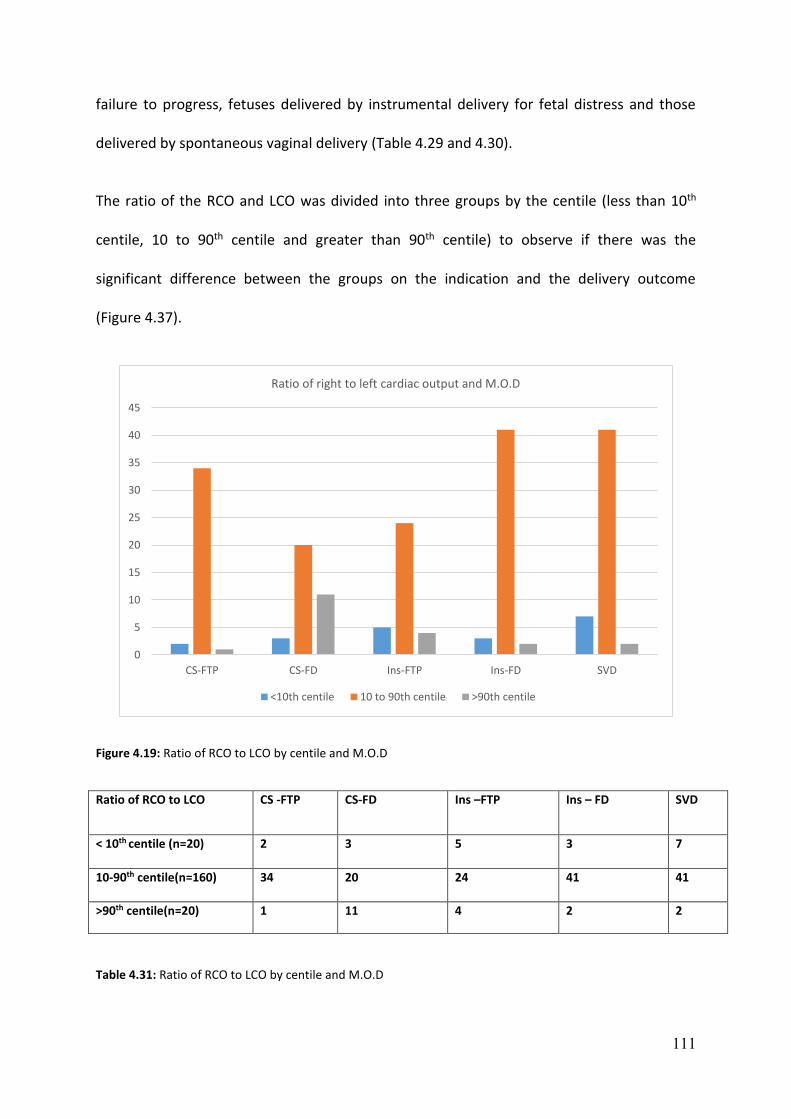
111
failure to progress, fetuses delivered by instrumental delivery for fetal distress and those
delivered by spontaneous vaginal delivery (Table 4.29 and 4.30).
The ratio of the RCO and LCO was divided into three groups by the centile (less than 10th
centile, 10 to 90th centile and greater than 90th centile) to observe if there was the
significant difference between the groups on the indication and the delivery outcome
(Figure 4.37).
Figure 4.19: Ratio of RCO to LCO by centile and M.O.D
Ratio of RCO to LCO CS -FTP CS-FD Ins –FTP Ins – FD SVD
< 10th centile (n=20) 2 3 5 3 7
10-90th centile(n=160) 34 20 24 41 41
>90th centile(n=20) 1 11 4 2 2
Table 4.31: Ratio of RCO to LCO by centile and M.O.D
0
5
10
15
20
25
30
35
40
45
CS-FTP CS-FD Ins-FTP Ins-FD SVD
Ratio of right to left cardiac output and M.O.D
<10th centile 10 to 90th centile >90th centile
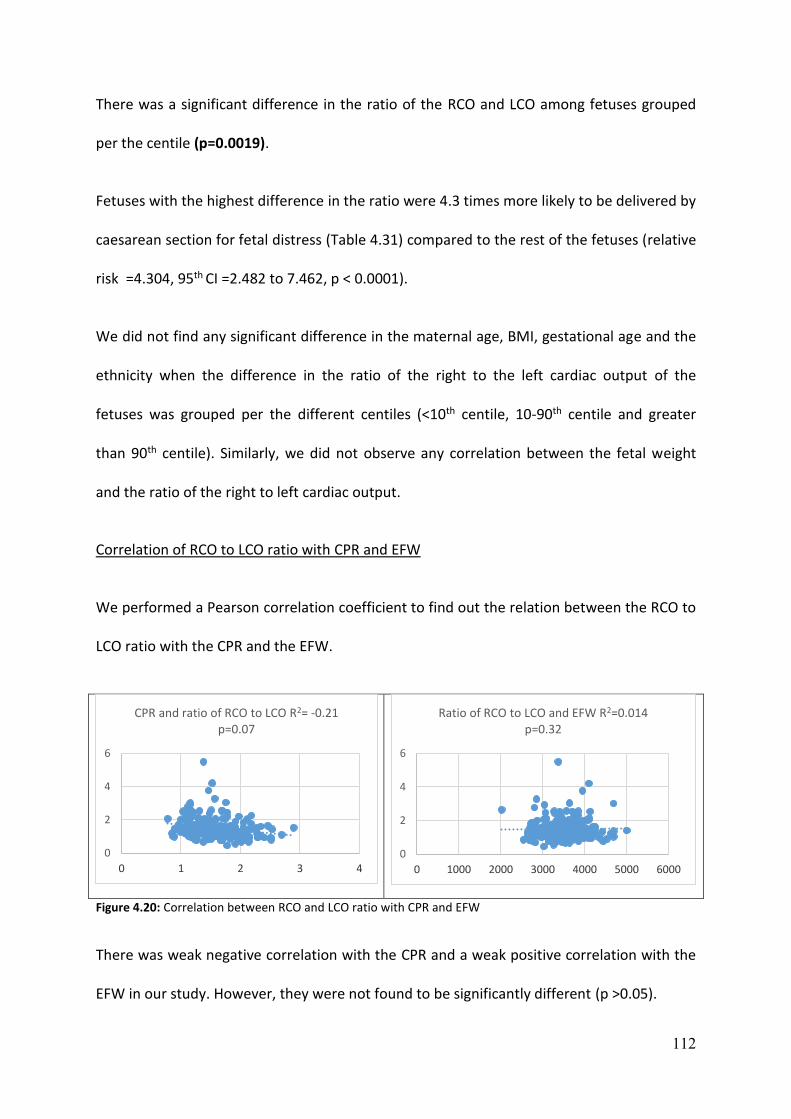
112
There was a significant difference in the ratio of the RCO and LCO among fetuses grouped
per the centile (p=0.0019).
Fetuses with the highest difference in the ratio were 4.3 times more likely to be delivered by
caesarean section for fetal distress (Table 4.31) compared to the rest of the fetuses (relative
risk =4.304, 95th CI =2.482 to 7.462, p < 0.0001).
We did not find any significant difference in the maternal age, BMI, gestational age and the
ethnicity when the difference in the ratio of the right to the left cardiac output of the
fetuses was grouped per the different centiles (<10th centile, 10-90th centile and greater
than 90th centile). Similarly, we did not observe any correlation between the fetal weight
and the ratio of the right to left cardiac output.
Correlation of RCO to LCO ratio with CPR and EFW
We performed a Pearson correlation coefficient to find out the relation between the RCO to
LCO ratio with the CPR and the EFW.
Figure 4.20: Correlation between RCO and LCO ratio with CPR and EFW
There was weak negative correlation with the CPR and a weak positive correlation with the
EFW in our study. However, they were not found to be significantly different (p >0.05).
0
2
4
6
0 1 2 3 4
CPR and ratio of RCO to LCO R2= -0.21p=0.07
0
2
4
6
0 1000 2000 3000 4000 5000 6000
Ratio of RCO to LCO and EFW R2=0.014p=0.32

113
Binary logistic regression was performed with the caesarean section for fetal distress as the
dependent variable which adjusts for the influence of the potential confounding variable.
The CPR and the ratio of the right to left cardiac output remained significant even when
both are included in the model (p=<0.0001 and 0.001 respectively) suggesting that they are
independent predictors of caesarean section for fetal distress (Odds ratio – 0.057 and 2.820
respectively)
We also constructed a receiver operating characteristic curve( ROC) curve to check the
sensitivity of the ratio of the RCO and LCO to predict fetuses that were delivered by
emergency caesarean section for fetal distress and is represented below (Figure 4.40). The
area under the curve(AUC) was found to be 0.709 (confidence interval = 0.603 to 0.814)
Figure 4.21: ROC curve to predict CS for fetal distress by ratio of the RCO to LCO

114
Combined cardiac output /mL/min/kg (CCO)
The overall fetal cardiac output is calculated by adding the right and left cardiac output
respectively.
Figure 4.22: Distribution of CCO/mL/min/kg
The CCO/mL/min/kg was measured in all the fetuses in our study population. The median
value was 457 ml/min/kg (range 233 ml to 968 ml/min/kg). The results in our study group
showed a non -Gaussian distribution (skewness =0.73, kurtosis = 0.40, D’agostino-Pearson
test of normality p = <0.001).
0
5
10
15
20
25
20
0
22
5
25
0
27
5
30
0
32
5
35
0
37
5
40
0
42
5
45
0
47
5
50
0
52
5
55
0
57
5
60
0
62
5
65
0
67
5
70
0
72
5
75
0
77
5
80
0
82
5
85
0
87
5
90
0
92
5
95
0
97
5
10
00
CCO/mL/min/kg

115
CS-FTP CS-FD Ins-FTP Ins-FD SVD
Number of values 36 35 33 46 50
Minimum 259.8 239.2 233.5 248.8 277.7
25% Percentile 373.0 362.2 365.9 387.8 391.9
Median 449.1 426.5 448.7 483.0 445.6
75% Percentile 595.5 520.0 566.9 594.9 547.6
Maximum 801.6 779.7 968.6 912.1 834.9
Mean 479.0 454.6 464.0 498.2 477.1
Std. Deviation 137.3 133.6 142.4 151.0 131.1
Std. Error of Mean 22.88 22.58 24.79 22.27 18.54
Lower 95% CI 432.6 408.7 413.5 453.4 439.8
Upper 95% CI 525.5 500.4 514.5 543.1 514.3
Mean ranks 102.4 92.06 94.00 108.9 101.6
Table 4.32: Descriptive statistics of CCO/mL/min/kg
Dunn’s multiple comparison test
Mean rank difference Significant? Summary
CS-FTP vs. CS-FD 10.30 No Not significant
CS-FTP vs. Ins-FTP 8.361 No Not significant
CS-FTP vs. Ins-FD -6.574 No Not significant
CS-FTP vs. SVD 0.761 No Not significant
CS-FD vs. Ins-FTP -1.943 No Not significant
CS-FD vs. Ins-FD -16.68 No Not significant
CS-FD vs. SVD -9.543 No Not significant
Ins-FTP vs. Ins-FD -14.93 No Not significant
Ins-FTP vs. SVD -7.600 No Not significant
Ins-FD vs. SVD 7.335 No Not significant
Table 4.33: Dunn's multiple comparison tests of CCO/mL/min/kg
There was no significant difference in the CCO/mL/min/kg between fetuses when grouped
per the indication and the mode of delivery (p=0.70). The highest median CCO/mL/min/kg
(483.0 mL/min/kg, IQR 387.8 to 594.9 mL/min/kg) was noted in fetuses delivered by
Instrumental delivery for fetal distress. The lowest median CCO/mL/min/kg (426.5
mL/min/kg, IQR 362.2 to 520 mL/min/kg) was measured in fetuses delivered by emergency
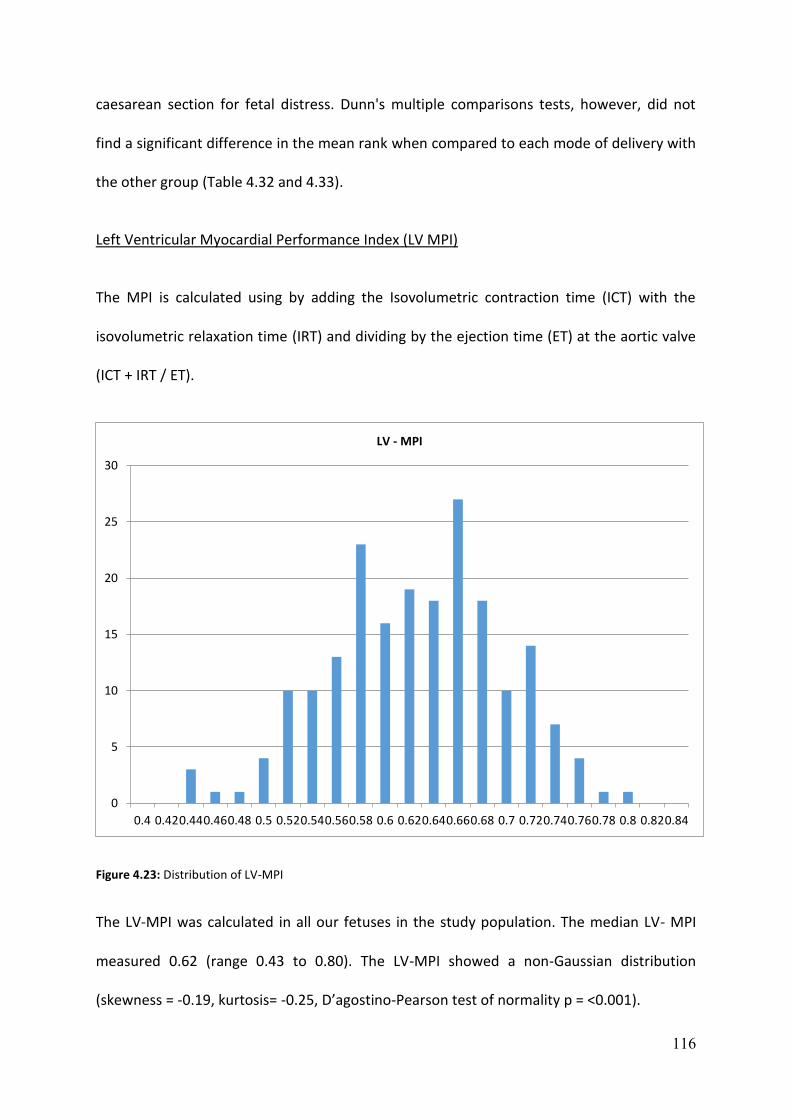
116
caesarean section for fetal distress. Dunn's multiple comparisons tests, however, did not
find a significant difference in the mean rank when compared to each mode of delivery with
the other group (Table 4.32 and 4.33).
Left Ventricular Myocardial Performance Index (LV MPI)
The MPI is calculated using by adding the Isovolumetric contraction time (ICT) with the
isovolumetric relaxation time (IRT) and dividing by the ejection time (ET) at the aortic valve
(ICT + IRT / ET).
Figure 4.23: Distribution of LV-MPI
The LV-MPI was calculated in all our fetuses in the study population. The median LV- MPI
measured 0.62 (range 0.43 to 0.80). The LV-MPI showed a non-Gaussian distribution
(skewness = -0.19, kurtosis= -0.25, D’agostino-Pearson test of normality p = <0.001).
0
5
10
15
20
25
30
0.4 0.420.440.460.48 0.5 0.520.540.560.58 0.6 0.620.640.660.68 0.7 0.720.740.760.78 0.8 0.820.84
LV - MPI
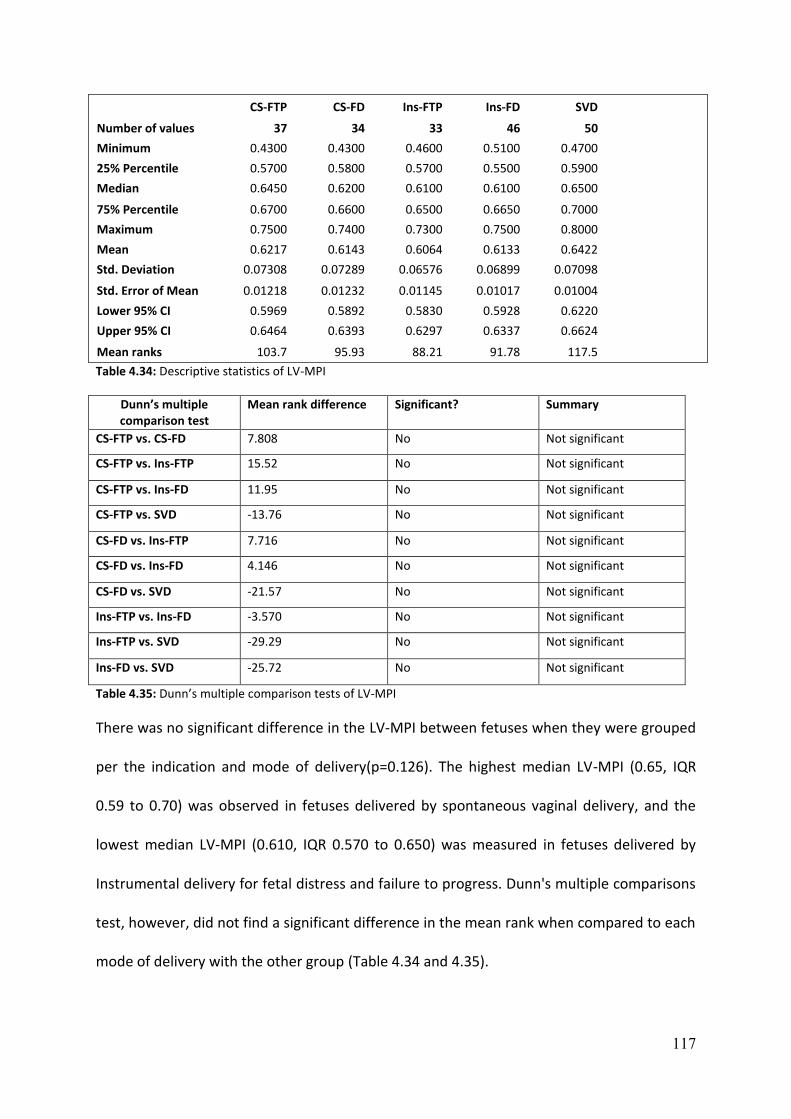
117
CS-FTP CS-FD Ins-FTP Ins-FD SVD
Number of values 37 34 33 46 50
Minimum 0.4300 0.4300 0.4600 0.5100 0.4700
25% Percentile 0.5700 0.5800 0.5700 0.5500 0.5900
Median 0.6450 0.6200 0.6100 0.6100 0.6500
75% Percentile 0.6700 0.6600 0.6500 0.6650 0.7000
Maximum 0.7500 0.7400 0.7300 0.7500 0.8000
Mean 0.6217 0.6143 0.6064 0.6133 0.6422
Std. Deviation 0.07308 0.07289 0.06576 0.06899 0.07098
Std. Error of Mean 0.01218 0.01232 0.01145 0.01017 0.01004
Lower 95% CI 0.5969 0.5892 0.5830 0.5928 0.6220
Upper 95% CI 0.6464 0.6393 0.6297 0.6337 0.6624
Mean ranks 103.7 95.93 88.21 91.78 117.5
Table 4.34: Descriptive statistics of LV-MPI
Dunn’s multiple comparison test
Mean rank difference Significant? Summary
CS-FTP vs. CS-FD 7.808 No Not significant
CS-FTP vs. Ins-FTP 15.52 No Not significant
CS-FTP vs. Ins-FD 11.95 No Not significant
CS-FTP vs. SVD -13.76 No Not significant
CS-FD vs. Ins-FTP 7.716 No Not significant
CS-FD vs. Ins-FD 4.146 No Not significant
CS-FD vs. SVD -21.57 No Not significant
Ins-FTP vs. Ins-FD -3.570 No Not significant
Ins-FTP vs. SVD -29.29 No Not significant
Ins-FD vs. SVD -25.72 No Not significant
Table 4.35: Dunn’s multiple comparison tests of LV-MPI
There was no significant difference in the LV-MPI between fetuses when they were grouped
per the indication and mode of delivery(p=0.126). The highest median LV-MPI (0.65, IQR
0.59 to 0.70) was observed in fetuses delivered by spontaneous vaginal delivery, and the
lowest median LV-MPI (0.610, IQR 0.570 to 0.650) was measured in fetuses delivered by
Instrumental delivery for fetal distress and failure to progress. Dunn's multiple comparisons
test, however, did not find a significant difference in the mean rank when compared to each
mode of delivery with the other group (Table 4.34 and 4.35).

118
4.10 Summary of fetal cardiac function
Diastolic function: There was no significant difference in the diastolic function when
fetuses were grouped per the indication and the mode of delivery
Systolic function:
Right cardiac output: The right cardiac function was not significantly different between the
fetuses when grouped per the indication and the mode of delivery.
Left cardiac output: There was a significant difference in the left cardiac function in
fetuses delivered by emergency caesarean section for fetal distress when compared with
the rest of the fetuses.
Fetuses delivered by emergency caesarean section for fetal distress had lower left
ventricular stroke volume and left cardiac output/mL/min/kg. There was no significant
difference in the combined cardiac output in fetuses when classified per the indication and
the mode of delivery. Fetuses delivered by emergency caesarean section for fetal distress
had the highest difference between the right and left ventricular stroke volume, the highest
difference between the right and left cardiac output/mL/min/kg and the highest difference
in ratio between the right and left cardiac output.
Left ventricular Myocardial Performance Index (LV-MPI)
There was no significant difference observed in the LV-MPI when fetuses were grouped per
the indication and the mode of delivery.
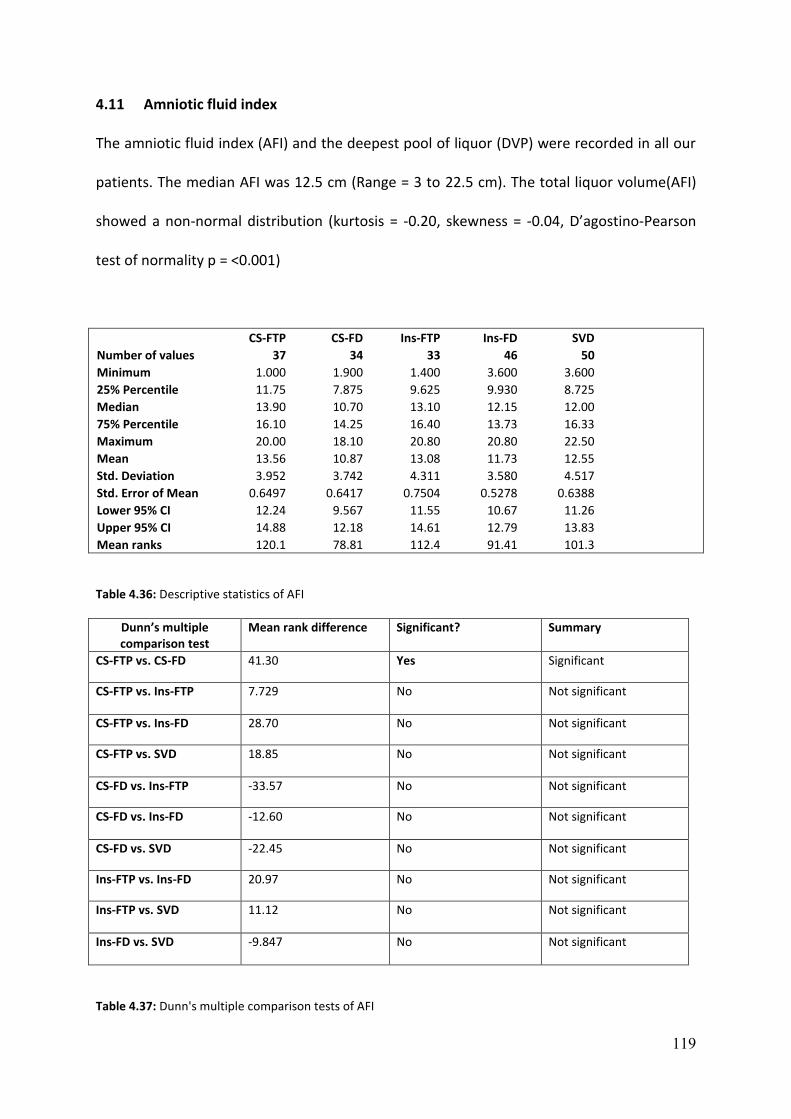
119
4.11 Amniotic fluid index
The amniotic fluid index (AFI) and the deepest pool of liquor (DVP) were recorded in all our
patients. The median AFI was 12.5 cm (Range = 3 to 22.5 cm). The total liquor volume(AFI)
showed a non-normal distribution (kurtosis = -0.20, skewness = -0.04, D’agostino-Pearson
test of normality p = <0.001)
CS-FTP CS-FD Ins-FTP Ins-FD SVD
Number of values 37 34 33 46 50
Minimum 1.000 1.900 1.400 3.600 3.600
25% Percentile 11.75 7.875 9.625 9.930 8.725
Median 13.90 10.70 13.10 12.15 12.00
75% Percentile 16.10 14.25 16.40 13.73 16.33
Maximum 20.00 18.10 20.80 20.80 22.50
Mean 13.56 10.87 13.08 11.73 12.55
Std. Deviation 3.952 3.742 4.311 3.580 4.517
Std. Error of Mean 0.6497 0.6417 0.7504 0.5278 0.6388
Lower 95% CI 12.24 9.567 11.55 10.67 11.26
Upper 95% CI 14.88 12.18 14.61 12.79 13.83
Mean ranks 120.1 78.81 112.4 91.41 101.3
Table 4.36: Descriptive statistics of AFI
Dunn’s multiple comparison test
Mean rank difference Significant? Summary
CS-FTP vs. CS-FD 41.30 Yes Significant
CS-FTP vs. Ins-FTP 7.729 No Not significant
CS-FTP vs. Ins-FD 28.70 No Not significant
CS-FTP vs. SVD 18.85 No Not significant
CS-FD vs. Ins-FTP -33.57 No Not significant
CS-FD vs. Ins-FD -12.60 No Not significant
CS-FD vs. SVD -22.45 No Not significant
Ins-FTP vs. Ins-FD 20.97 No Not significant
Ins-FTP vs. SVD 11.12 No Not significant
Ins-FD vs. SVD -9.847 No Not significant
Table 4.37: Dunn's multiple comparison tests of AFI
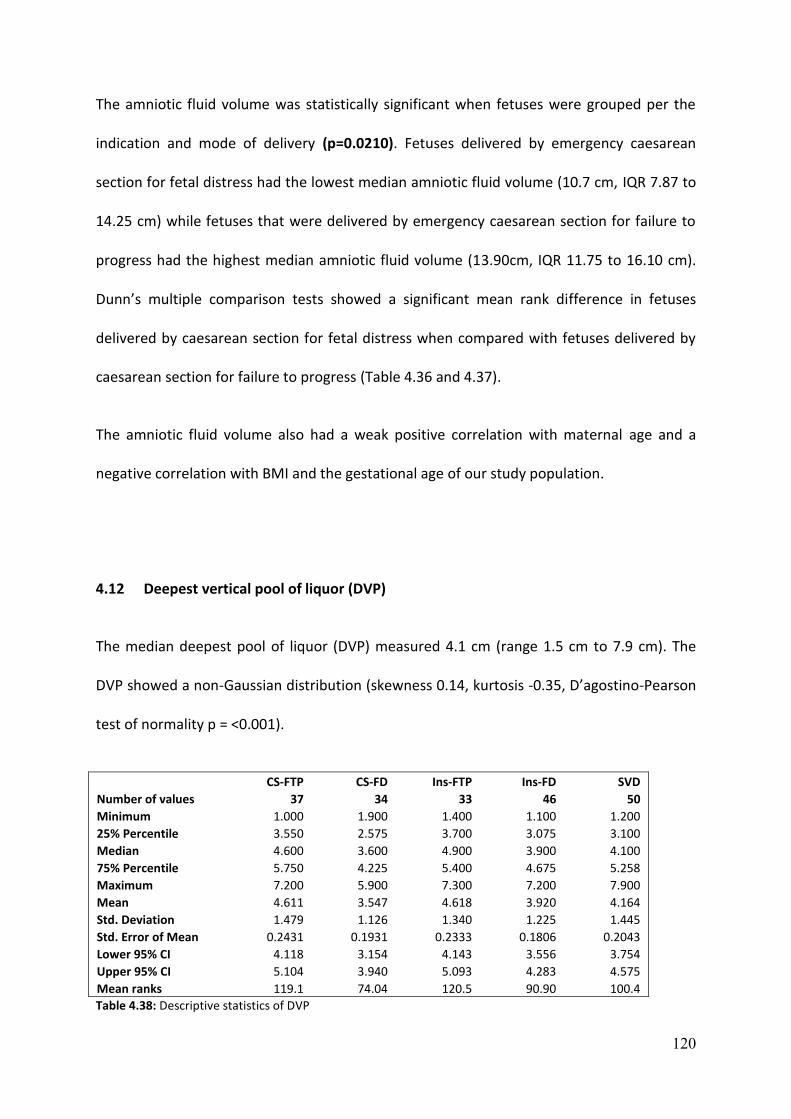
120
The amniotic fluid volume was statistically significant when fetuses were grouped per the
indication and mode of delivery (p=0.0210). Fetuses delivered by emergency caesarean
section for fetal distress had the lowest median amniotic fluid volume (10.7 cm, IQR 7.87 to
14.25 cm) while fetuses that were delivered by emergency caesarean section for failure to
progress had the highest median amniotic fluid volume (13.90cm, IQR 11.75 to 16.10 cm).
Dunn’s multiple comparison tests showed a significant mean rank difference in fetuses
delivered by caesarean section for fetal distress when compared with fetuses delivered by
caesarean section for failure to progress (Table 4.36 and 4.37).
The amniotic fluid volume also had a weak positive correlation with maternal age and a
negative correlation with BMI and the gestational age of our study population.
4.12 Deepest vertical pool of liquor (DVP)
The median deepest pool of liquor (DVP) measured 4.1 cm (range 1.5 cm to 7.9 cm). The
DVP showed a non-Gaussian distribution (skewness 0.14, kurtosis -0.35, D’agostino-Pearson
test of normality p = <0.001).
CS-FTP CS-FD Ins-FTP Ins-FD SVD
Number of values 37 34 33 46 50
Minimum 1.000 1.900 1.400 1.100 1.200
25% Percentile 3.550 2.575 3.700 3.075 3.100
Median 4.600 3.600 4.900 3.900 4.100
75% Percentile 5.750 4.225 5.400 4.675 5.258
Maximum 7.200 5.900 7.300 7.200 7.900
Mean 4.611 3.547 4.618 3.920 4.164
Std. Deviation 1.479 1.126 1.340 1.225 1.445
Std. Error of Mean 0.2431 0.1931 0.2333 0.1806 0.2043
Lower 95% CI 4.118 3.154 4.143 3.556 3.754
Upper 95% CI 5.104 3.940 5.093 4.283 4.575
Mean ranks 119.1 74.04 120.5 90.90 100.4
Table 4.38: Descriptive statistics of DVP
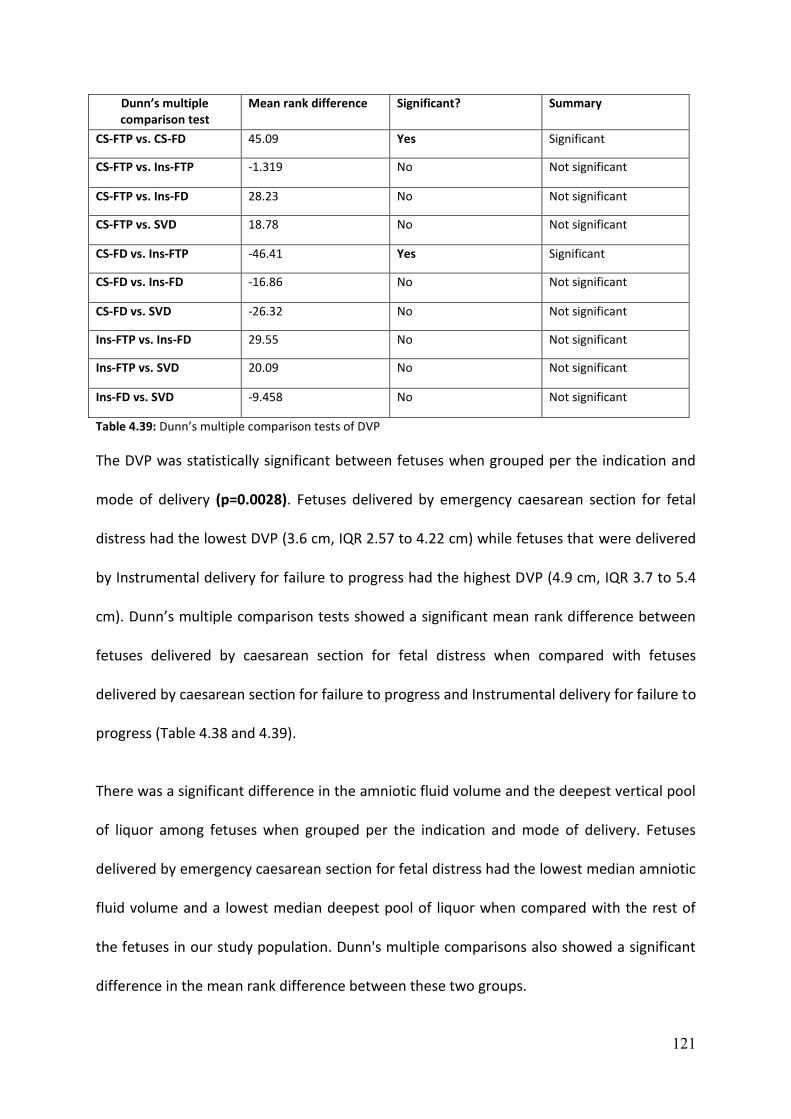
121
Dunn’s multiple comparison test
Mean rank difference Significant? Summary
CS-FTP vs. CS-FD 45.09 Yes Significant
CS-FTP vs. Ins-FTP -1.319 No Not significant
CS-FTP vs. Ins-FD 28.23 No Not significant
CS-FTP vs. SVD 18.78 No Not significant
CS-FD vs. Ins-FTP -46.41 Yes Significant
CS-FD vs. Ins-FD -16.86 No Not significant
CS-FD vs. SVD -26.32 No Not significant
Ins-FTP vs. Ins-FD 29.55 No Not significant
Ins-FTP vs. SVD 20.09 No Not significant
Ins-FD vs. SVD -9.458 No Not significant
Table 4.39: Dunn’s multiple comparison tests of DVP
The DVP was statistically significant between fetuses when grouped per the indication and
mode of delivery (p=0.0028). Fetuses delivered by emergency caesarean section for fetal
distress had the lowest DVP (3.6 cm, IQR 2.57 to 4.22 cm) while fetuses that were delivered
by Instrumental delivery for failure to progress had the highest DVP (4.9 cm, IQR 3.7 to 5.4
cm). Dunn’s multiple comparison tests showed a significant mean rank difference between
fetuses delivered by caesarean section for fetal distress when compared with fetuses
delivered by caesarean section for failure to progress and Instrumental delivery for failure to
progress (Table 4.38 and 4.39).
There was a significant difference in the amniotic fluid volume and the deepest vertical pool
of liquor among fetuses when grouped per the indication and mode of delivery. Fetuses
delivered by emergency caesarean section for fetal distress had the lowest median amniotic
fluid volume and a lowest median deepest pool of liquor when compared with the rest of
the fetuses in our study population. Dunn's multiple comparisons also showed a significant
difference in the mean rank difference between these two groups.

122
4.13 Intrapartum monitoring
Intrapartum monitoring consists of assessment of electronic fetal heart rate monitoring(CTG)
to identify the presence or absence of meconium stained liquor.
Electronic fetal heart rate monitoring (CTG)
Electronic fetal heart rate monitoring analysis was performed in all our patients enrolled in
our study and was classified as normal or pathological per the NICE guidelines. 80 patients
were classified as having pathological electronic fetal heart rate monitoring and 120
patients were classified to have non-pathological electronic fetal heart rate monitoring
tracings in our study population.
The fetuses were grouped into two categories (pathological or non-pathological), and
median values of the relevant parameters (CPR, LCO/ml/min/kg and the ratio of the right to
left cardiac output) were analysed in these fetuses (Table 4.40).
CPR (Median and range) LCO/ml/min/kg (Median and range)
Ratio of RCO to LCO (Median and range)
Non-Pathological CTG (n= 120)
1.649 (0.77 to 2.89) 188.30(95.19 to 401) 1.38(0.45 to 4.21)
Pathological CTG (n=80)
1.434(0.84 to 2.69) 184.98(79.24 to 397) 1.43(0.70 to 5.49)
Table 4.40: Comparison of CTG with important Doppler parameters
From the above table, it is evident that fetuses delivered for pathological electronic fetal
heart rate monitoring tracings had a lower cerebroplacental ratio, lower left cardiac
output/mL/min/kg and a higher ratio of the right to left cardiac output when compared with
the fetuses delivered by non-pathological electronic fetal heart rate monitoring. These
results were however not statistically significant.
Sub group analysis showed increased number of fetuses in the pathological electronic fetal
heart rate monitoring group that were delivered by emergency caesarean section for fetal

123
distress. These fetuses had lower CPR, LCO less than the 10th centile and a higher ratio (>90th
centile) of the right to the left cardiac output. On the contrary, fetuses with higher CPR and
the Left cardiac output greater than the 90th centile in the pathological electronic fetal heart
rate monitoring group appeared protective for caesarean section for fetal distress.
Meconium stained liquor
Assessment of the colour of the amniotic fluid at delivery was recorded in all the fetuses
enrolled in our study population. Meconium stained liquor was observed in 18 cases (9%)
with a normal appearance in 182 cases (91%). There was no significant difference when
compared with maternal demographics, fetal weight and ethnicity although it was more
commonly associated in fetuses with advanced gestation in 72% (13/18) of fetuses that
were delivered between 41to42 week’s gestation.
Fetuses with meconium stained amniotic fluid were then sub-grouped per the indication
and mode of delivery further analysis.
Figure 4.24: Meconium-stained liquor and M.O.D
0
1
2
3
4
5
6
7
CS-FTP CS-FD Ins-FTP Ins-FD SVD
Meconium and MOD

124
We observed that the highest number of fetuses with meconium stained liquor were
delivered by caesarean section for fetal distress (33%) when compared with the rest of the
study population. However, the results were not statistically significant (Figure 55).
Critical ultrasound parameters like CPR and the LCO/ml/min/kg were then analysed after
grouping the fetuses per the centile measurements to observe if there were any significant
differences between the groups.
Fetuses delivered by emergency caesarean section for fetal distress with meconium stained
liquor were found to be higher in the group of fetuses with CPR and the LCO <10th centile.
None of the fetuses had meconium stained liquor in the group of fetuses with CPR and LCO
over 90th centile that was delivered for the same indication suggesting higher CPR and LCO
were protective against fetuses with abnormalities in liquor. Since the numbers were small,
they did not undergo further statistical analysis.
4.14 Neonatal outcomes
Neonatal outcome details were obtained from the postnatal and neonatal case records. The
findings included APGAR scores, cord blood gases, actual birth weight and history of
neonatal complications and admissions.
APGAR score
Mean (S.D) CS-FTP CS-FD Ins-FTP Ins-FD SVD p value
1 min 8.16 (1.81) 8.28 (1.82) 8.54 (1.09) 8.32 (1.53) 8.64 (0.94) 0.97
5 min 9.63 (0.83) 9.34(1.71) 9.57 (0.79) 9.71(0.72) 9.82(0.43) 0.64
10 min 9.88(0.39) 9.77(0.84) 9.84(0.56) 9.95(0.20) 10(0) 0.27
Table 4.41: APGAR score and delivery outcomes

125
The records of APGAR score were obtained from the neonatal case notes and compared
amongst fetuses classified per the indication and mode of delivery.
There was no significant difference in the mean APGAR score at 1, 5 and 10 minutes
amongst the fetuses in our study group (Table 4.41). Fetuses delivered by emergency
caesarean section for fetal distress had comparatively low APGAR score at 5 minutes when
compared with rest of the group although the results did not reach statistical significance.
Similarly, there was no significant association between the APGAR scores and the relevant
cardiac functional parameters when fetuses were grouped per the indication and the mode
of delivery. There were no cases in our study population that were either admitted to the
neonatal unit or had developed complications before discharge.
pH (arterial and venous)
The arterial and venous pH was measured in all the fetuses in our study population, and the
mean values are tabulated below. There was no significant difference between the mean
arterial and venous pH when fetuses were grouped per the indication and the mode of
delivery (Table 4.42). Most of the fetuses delivered in our study group had the mean arterial
pH in between 7.2 to 7.3. There was no significant difference in the pH values when fetuses
were grouped per the indication and mode of delivery.
Mean (S. D) CS-FTP CS—FD Ins-FTP Ins-FD SVD p value
Arterial pH 7.23(0.08) 7.21(0.09) 7.24(0.06) 7.20(0.06) 7.20(0.16) 0.11
Venous pH 7.25(0.08) 7.24(0.07) 7.28(0.06) 7.26(0.07) 7.25(0.06) 0.21
Table 4.42: Cord pH and mode of delivery
We classified the fetuses per the indication and mode of delivery in the fetuses with arterial
pH less than 7.2 and greater than 7.2 to analyse outcomes. Similarly, we also grouped the

126
fetuses per the centiles of the arterial pH (<10th, 10-90th and >90th) and observed the
indication and the mode of delivery.
Arterial pH CS-FTP CS-FD Ins-FTP Ins-FD SVD Total
<7.2 10 13 5 18 20 66
>7.2 27 21 28 28 30 134
Total 37 34 33 46 50 200
Table 4.43: Arterial pH and delivery outcome
Arterial pH (mean) CS -FTP CS-FD Ins –FTP Ins – FD SVD
< 10th centile (n=20), mean value = 7.01 2 6 3 5 4
10-90th centile(n=160), mean value = 7.22 30 28 25 35 41
>90th centile(n=20), mean value = 7.36 5 0 5 6 5
Table 4.44: Indication and M.O.D by centiles of the arterial pH
We observed that 20 %( 13/66) of fetuses with arterial pH in <7.2 were delivered by
caesarean section for fetal distress while only 15.6 %( 21/134) of fetuses were delivered in
the group with an arterial pH greater than 7.2.
Similarly, 30% of fetuses were delivered by emergency caesarean section for fetal distress in
the group of fetuses with arterial pH less than the 10th centile while none of the fetuses
were delivered for the same reason in the group of fetuses with arterial pH greater than the
90th centile (Table 4.43 and 4.44). These results were not statistically significant and hence
did not undergo further statistical analysis.
Base excess
The base excess was measured in all the fetuses in our study population with a median
value of -6.5(range between -6.5 to -16). There was non-normal distribution in our study
population (skewness =0.72, kurtosis =2.87, D’agostino-Pearson test of normality p =
<0.001).

127
CS-FTP CS-FD Ins-FTP Ins-FD SVD
Number of values 37 34 33 46 50
Minimum -16.00 -12.00 -9.800 -10.90 -10.40
25% Percentile -6.350 -7.925 -6.550 -9.525 -8.300
Median -5.100 -6.350 -6.200 -7.100 -7.200
75% Percentile -2.300 -4.125 -4.300 -5.600 -6.250
Maximum 1.700 -0.6000 -0.6000 6.700 -3.500
Mean -4.516 -5.841 -5.670 -7.043 -7.220
Std. Deviation 3.218 2.691 1.859 3.027 1.529
Std. Error of Mean 0.5290 0.4614 0.3236 0.4463 0.2163
Lower 95% CI -5.589 -6.780 -6.329 -7.942 -7.655
Upper 95% CI -3.443 -4.902 -5.011 -6.144 -6.785
Mean ranks 139.2 108.3 118.5 77.28 76.00
Table 4.45: Base excess -descriptive statistics
Dunn’s multiple comparison test
Mean rank difference Significant? Summary
CS-FTP vs. CS-FD 33.23 No Significant
CS-FTP vs. Ins-FTP 22.02 No Not significant
CS-FTP vs. Ins-FD 67.47 Yes Not significant
CS-FTP vs. SVD 68.95 Yes Not significant
CS-FD vs. Ins-FTP -11.20 No Not significant
CS-FD vs. Ins-FD 34.25 No Not significant
CS-FD vs. SVD 35.72 No Not significant
Ins-FTP vs. Ins-FD 45.45 Yes Not significant
Ins-FTP vs. SVD 46.92 Yes Not significant
Ins-FD vs. SVD 1.475 No Not significant
Table 4.46: Dunn’s multiple comparison tests of base excess
The base excess was statistically significant when fetuses were grouped per the indication
and the mode of delivery (p<0.0001). The highest median base excess (-4.65, IQR -6.37 to -
2.30) was seen in fetuses delivered by caesarean section for failure to progress while fetuses
delivered by spontaneous vaginal delivery had the lowest median base excess (-7.220, IQR -
8.30 to -6.35).

128
Dunn’s multiple comparison tests showed a significant mean rank difference in fetuses
delivered by caesarean section for failure to progress with spontaneous vaginal delivery and
instrumental delivery for fetal distress. Differences in the mean ranks were also observed
between instrumental delivery for failure to progress and instrumental delivery for fetal
distress and spontaneous vaginal delivery (Table 4.45 and 4.46).
4.15 Estimated fetal weight (EFW) and outcome
Estimated fetal weight was calculated by the Hadlock formula using the Biparietal diameter,
Head circumference, abdominal circumference and the femur length in all our fetuses. The
median estimated fetal weight was 3629 grams (range 2626 to 4856 grams). The results in
our study population showed a non- Gaussian distribution (skewness 0.25,
Kurtosis = -0.017, D’agostino-Pearson test of normality p = <0.001).
CS-FTP CS-FD Ins-FTP Ins-FD SVD
Number of values 36 35 33 46 50
Minimum 3070 3045 3098 2886 2626
25% Percentile 3446 3397 3336 3155 3262
Median 3705 3651 3764 3480 3531
75% Percentile 3960 4047 4005 3739 3822
Maximum 4396 4713 4856 4356 4401
Mean 3719 3737 3755 3472 3512
Std. Deviation 324.1 448.3 432.3 378.5 420.8
Std. Error of Mean 54.02 75.78 75.26 55.81 59.51
Lower 95% CI 3609 3583 3602 3360 3392
Upper 95% CI 3829 3891 3909 3585 3632
Mean ranks 116.8 113.4 116.6 78.89 88.93
Table 4.47: Descriptive statistics of EFW and M.O.D
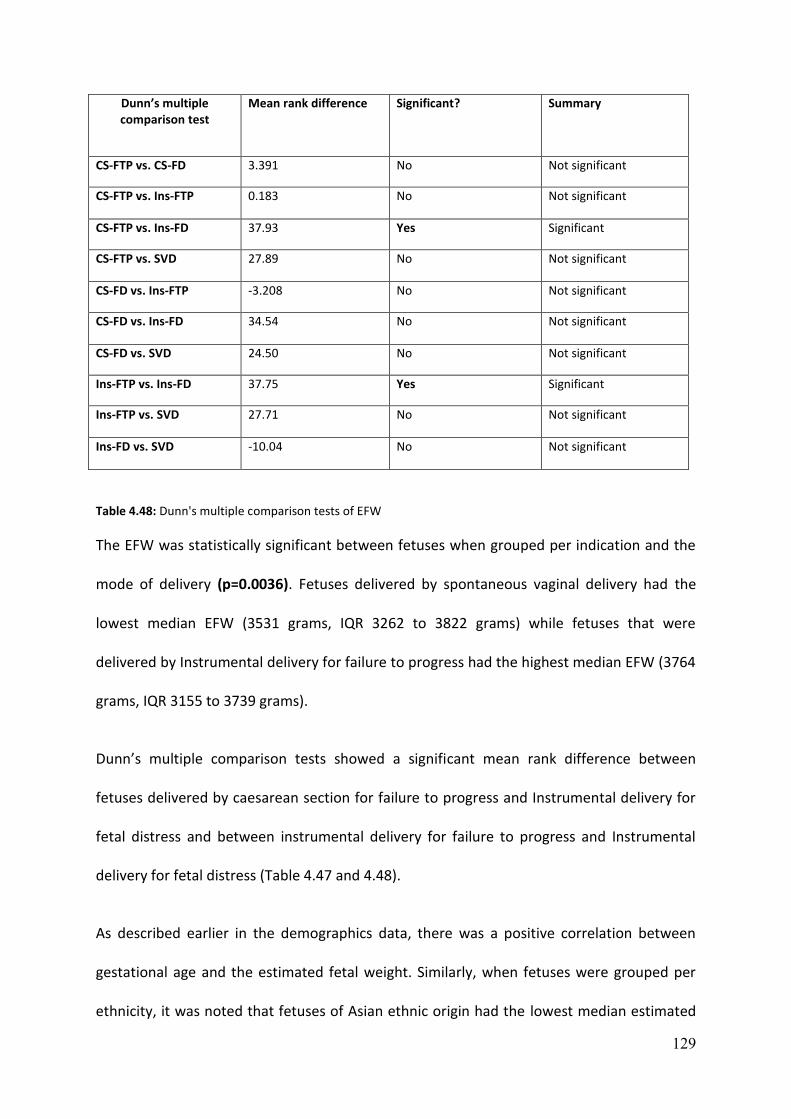
129
Dunn’s multiple comparison test
Mean rank difference Significant? Summary
CS-FTP vs. CS-FD 3.391 No Not significant
CS-FTP vs. Ins-FTP 0.183 No Not significant
CS-FTP vs. Ins-FD 37.93 Yes Significant
CS-FTP vs. SVD 27.89 No Not significant
CS-FD vs. Ins-FTP -3.208 No Not significant
CS-FD vs. Ins-FD 34.54 No Not significant
CS-FD vs. SVD 24.50 No Not significant
Ins-FTP vs. Ins-FD 37.75 Yes Significant
Ins-FTP vs. SVD 27.71 No Not significant
Ins-FD vs. SVD -10.04 No Not significant
Table 4.48: Dunn's multiple comparison tests of EFW
The EFW was statistically significant between fetuses when grouped per indication and the
mode of delivery (p=0.0036). Fetuses delivered by spontaneous vaginal delivery had the
lowest median EFW (3531 grams, IQR 3262 to 3822 grams) while fetuses that were
delivered by Instrumental delivery for failure to progress had the highest median EFW (3764
grams, IQR 3155 to 3739 grams).
Dunn’s multiple comparison tests showed a significant mean rank difference between
fetuses delivered by caesarean section for failure to progress and Instrumental delivery for
fetal distress and between instrumental delivery for failure to progress and Instrumental
delivery for fetal distress (Table 4.47 and 4.48).
As described earlier in the demographics data, there was a positive correlation between
gestational age and the estimated fetal weight. Similarly, when fetuses were grouped per
ethnicity, it was noted that fetuses of Asian ethnic origin had the lowest median estimated

130
fetal weight (3289 grams, IQR 3163 to 3648 grams) when compared to the other ethnic
groups and was statistically significant (p=0.009).
Difference between the estimated fetal weight and actual fetal weight
The estimated fetal weight (EFW) was initially calculated using the Hadlock formula (BPD,
HC, AC and FL) and was compared to the actual birth weight (ABW) at delivery.
CS -FTP CS-FD Ins –FTP Ins – FD SVD
Median and IQR(grams) 108 (-130 to 318)
200 (-25 to 413)
70 (-99.5 to 290)
58.5 (-124 to 247)
108 (-47 to 268)
Median Percentage of difference
3.3 % (-3.4 to 9.1)
5.5% ( -0.6 to 10.6)
1.7% (-2.7 to 8.2)
1.8% (-3.4 to 8)
2.9% (-1.4 to 8.2)
Table 4.49: Difference between EFW and actual birth weight
Figure 4.25: Correlation between estimated and actual birth weight
0
1000
2000
3000
4000
5000
6000
0 1000 2000 3000 4000 5000 6000
EFW and Actual birth weight R2=0.83p=0.85

131
The lowest median difference between fetal weights (58 grams, IQR -124 to 247 grams) was
observed in fetuses delivered by instrumental delivery for fetal distress (Table 4.49). The
highest median difference in fetal weight was seen in fetuses delivered by emergency
caesarean section for fetal distress (200 grams, IQR -25 to 413 grams). There was a strong
positive correlation (R2 =0.83) between the estimated birth weight and the actual birth
weight. The mean absolute error difference in the fetal weight was 110 grams, and the
mean percentage of error was 3.68% in our study population which are within the
acceptable range of normal variation. Similarly, Pearson correlation analysis did not show a
significant positive correlation between the EFW and important ultrasound parameters (CPR,
Left cardiac output, right cardiac output, combined cardiac output and the ratio of the right
to left cardiac output ratio).

132
Chapter 5 -- Cardiac functional parameters, cerebroplacental ratio and risk of
adverse obstetric and neonatal outcomes
This study was performed to identify if Prelabour cardiac function and cerebroplacental
ratio prior to active labour could predict the risk of adverse intrapartum and neonatal
outcome in appropriately grown term singleton pregnancies.
We recruited 200 nulliparous women with appropriately grown term fetuses for our study.
Our results demonstrated that there was a significant difference in the fetal cardiac function
and the cerebroplacental ratio when fetuses were grouped per the indication and the mode
of delivery. We also observed that fetuses delivered by emergency caesarean section for
fetal distress had a significant difference in the fetal cardiac function and the
cerebroplacental when compared with the rest of the fetuses.
5.1 Maternal demographics and mode of delivery
Most of our study population (69.5%) consisted of Caucasian mothers, followed by Asian
women (15.5%) and the remaining by African, Afro-Caribbean and mixed ethnic groups. The
difference reflects the perceptions of medical research across different ethnic groups as
there is a much wider acceptance to research among the Caucasian population when
compared with other ethnic groups. Women with non-English background had difficulties in
understanding the patient information leaflet and the research methodology and hence
were not able to actively participate in the study.
There was no significant difference in the maternal age, BMI and the mean gestational week
at delivery when fetuses were grouped per the indication and mode of delivery.

133
The median gestation age at delivery in our study population was 41 weeks and one day
(range 40+5 to 41+3 weeks). The lowest mean gestational age at delivery was observed in
the spontaneous vaginal delivery group and the highest mean gestational age at delivery
was observed in fetuses delivered by emergency caesarean section for fetal distress.
However, the absolute difference in the mean gestational age at delivery between the
fetuses was very small (five days) which is less likely to influence the outcome.
There are published reports of increased rate of caesarean section for fetal distress in
women of advanced maternal age.(110) however, we could not find a significant difference in
our study due to relatively small numbers recruited for our project.
Fetuses delivered by emergency caesarean section in our study constituted for
35.5%( 71/200) of the total population out of which 18.5% of fetuses (34/71) were delivered
for fetal distress, and 17 % (37/71) were delivered for failure to progress.
The rate of caesarean section was found to be slightly higher in our study group when
compared to the national average of 26.2% of which 13.2% contributed for elective
caesarean sections, and 13% contributed towards emergency caesarean sections.(111)
About one in four children (25%) born in the U.K are delivered by caesarean section.
However, there are regional differences between District Hospitals and tertiary maternity
units. The tertiary maternity units report a slightly increased rate of caesarean sections
when compared to other hospitals due to the complexity of the cases referred to them.
Recent publications on the outcome following induction of labour have also shown
conflicting results. While reviews of observational studies showed an increase in caesarean
section, consideration of the postdates and term pre-labour rupture of membrane trials
suggested either no difference or a reduction in risk.(112)
134
Nippitta et.al performed a population-based cohort study to observe the variation in
hospital caesarean section rates and obstetric outcome among nulliparous women at term.
The team followed 67239 nulliparous women and found 7.3% had a Prelabour caesarean
section, 58% of mothers laboured spontaneously and 35% of them were induced(IOL). The
overall caesarean section rates were 28.1%; however, women with IOL were twice likely to
have intrapartum caesarean section compared with women with a spontaneous onset of
labour (34% vs. 15.5%). The published evidence summarised that differences in clinical
practice and prediction of intrapartum hypoxia were substantial contributors to variation in
intrapartum caesarean section rates.(113)
We compared our data with the caesarean section rates among nulliparous women in our
hospital those were in spontaneous or induced beyond 37 weeks. 10.5% of nulliparous
women in spontaneous labour had an emergency caesarean section, while 29% of the
women had an emergency caesarean section following induction of labour. We were not
able to obtain further details regarding the indication for caesarean section in these women
i.e. if it was either for fetal distress or failure to progress. Similarly, we were also not able to
get information about intact or ruptured membranes before induction was commenced in
these women which would explain the difference in the caesarean section rates.
All the women recruited in our study population in the induction of labour group had intact
membranes. This could also explain the slightly increased risk of caesarean section from our
study when compared with results from our hospital. Previously published studies have
shown that there is a significant increase in caesarean section rates in nulliparous women,
compared to multiparous women due to increased duration of labour and also with higher
intrauterine pressure in nulliparous women when compared to multiparous women.(110, 114)

135
Nine out of ten women recruited in our study (90.5% - 181/200) had induction of labour.
This variation in sample size may have also have contributed to the slight increase in
caesarean section rates in our study. This difference could become less observed when
equal numbers of women in spontaneous labour are also recruited in prospective future
studies to eliminate selection bias.
5.2 Maternal demographics and ultrasound parameters
Ultrasound parameters were analysed alongside the maternal demographics in our study to
observe correlation between them (Table 5.01). The maternal demographics included
maternal age, BMI and the gestation age at delivery
EFW AFI CPR LCO RCO CCO RCO to LCO Ratio
Maternal age Weak positive
Weak positive
Weak positive
Weak positive
Weak positive
Weak positive
Weak positive
Maternal BMI Weak positive
Weak negative
Weak negative
Weak negative
Weak negative
Weak negative
Weak negative
Gestational age
Weak positive
Weak negative
Weak negative
Weak negative
Weak negative
Weak negative
Weak positive
Table 5.01: Correlation of Maternal demographics and ultrasound parameters
We observed a weak positive correlation between the maternal age and the important
ultrasound parameters in our study. Maternal BMI and gestational age showed a weak
positive correlation with the estimated fetal weight while other parameters showed a weak
negative correlation. The ratio of the right to the left cardiac output showed a weak positive
correlation with the maternal age and the gestational age; however, the values were not
statistically significant (p=>0.05).

136
Women of Asian origin had the lowest estimated fetal weight while the highest estimated
fetal weight was observed in the fetuses born to Caucasian mothers. Published studies have
shown significant differences in birth weight born to women of Asian origin compared to
other ethnic groups suggesting an underlying genetic component is responsible for lower
birth weight rather than under nutrition in these mothers.(115, 116)
Wells et al. in their study found that there was a significant difference between the birth
weights of children born to Caucasian couples when compared with Asian couples. Similar
differences were also observed between couples of mixed ethnic backgrounds suggesting
that maternal and paternal ethnicity contributed to the difference in the fetal growth.(117)
Similarly, another large study by Zipursky et al. examined 692,301 live births of different
ethnic origins in Canada and observed that paternal and maternal ethnic background
influence new-born weight.(118) Fetuses are expected to significantly gain weight in the last
trimester especially after 32 weeks, and various growth charts have shown a gradual
increase in the growth velocity pattern. This pattern was reflected in our study showing a
positive correlation between the estimated fetal weight and the gestation at delivery.
5.3 Ethnicity and ultrasound parameters
Maternal ethnicity was compared against important ultrasound parameters (CPR, fetal
cardiac output, amniotic fluid volume and estimated fetal weight) to check if they varied
significantly between different ethnic populations.
Apart from CPR and the estimated fetal weight, none of the other parameters were found to
be significantly different between the various ethnic groups. As discussed earlier, the fetal
weight was found to be significantly different among the ethnic groups.

137
The CPR was found to be significantly different among the various ethnic groups with the
highest ratio observed in the Caucasian and mixed ethnic groups, and the lowest ratio was
seen in the Asian mothers.
Akolekar et al. observed the effects of maternal characteristics that influenced the fetal
Doppler findings in the assessment of fetal well-being.(119) His study demonstrated a
significant decrease in the pulsatility index of the middle cerebral artery at third trimester
and was found to be particularly lower in women of East Asian origin.
Spencer et.al measured free Beta hCG and PAPP-A as part of first-trimester screening for
combined screening test and observed that differences in the median PAPP-A and Beta hCG
existed amongst Afro-Caribbean, South Asian and Chinese women that resulted in a
difference in the screen-positive rates.(120) Pregnancy-associated plasma protein A (PAPP-A)
produced by the placenta aids in maintaining adequate fetal growth. Studies have shown
that low PAPP–A levels in the first trimester can be associated with abnormal placentation
which could result in an adverse outcome regarding fetal growth and well-being.(121)
The Royal College of Obstetricians and Gynaecologists (RCOG-UK, Green-top Guideline
No .31) have published guidelines on the investigation and the management of the small for
gestational age fetus. The guidelines suggest that a low level of PAPP-A (less than 0.415
MoM) is considered a major risk factor for delivery of a small for gestational age fetus.(122)
However, Kumar et al. in his observational study found that B hcG and PAPP-A measured in
the first trimester were not predictive of intrapartum compromise in AGA fetuses.(123) We
analysed our data and did not find any fetus with low PAPP-A values in our study population.
138
5.4 Cerebro placental ratio (CPR)
The CPR was measured in all the patients enrolled in our study population. The median CPR
was 1.53, and the range was between 0.77 and 2.89. The median 10th centile value of CPR
was 1.008, and the median 90th centile was 2.29. The CPR had a non -Gaussian distribution
in our study population (Skewness =0.03, kurtosis =0.49). There have also been publications
using the umbilical- cerebral ratio (U/C ratio) and the vertebro-umbilical ratio in the
assessment of fetal hypoxia. (124)
Umbilical -cerebral ratio has been previously reported as a better predictor of placental
dysfunction in fetuses with fetal growth restriction with chronic hypoxia resulting in adverse
neonatal outcome including neurodevelopmental impairment when compared to the
cerebro placental ratio.(124) (125)However most of the published studies are regarding the
cerebro placental ratio. Our study population consisted of appropriate for gestational age
fetuses at term and the number of cases with severe placental dysfunction is likely to be low.
Hence using the U/C ratio may be of less benefit in our research scenario and therefore we
used the calculation of cerebroplacental ratio in our study population.
Wladimiroff et al. in 1987 measured the pulsatility index (Pi) of the umbilical artery, middle
cerebral artery and cerebro -umbilical ratio in 156 normal and 42 fetuses with intrauterine
growth restriction. He observed a gradual fall in values of CPR with advanced gestation in
the normal fetuses. Fetuses with growth restriction with brain sparing effect showed a
raised Pi in the umbilical artery and low Pi of the middle cerebral artery resulting in a
reduced cerebro placental ratio.(62) These values were significantly different when compared
with normally grown fetuses.
Our study showed a significant difference (p=<0.0001) in the CPR between fetuses when
grouped per the indication and mode of delivery. Fetuses that were delivered by emergency

139
caesarean section had the lowest CPR among the rest of the fetuses delivered by other
modes of delivery. Significant mean rank differences were observed between the fetuses
delivered by emergency caesarean section for fetal distress when compared with fetuses
delivered by caesarean section for failure to progress, spontaneous vaginal delivery and
Instrumental delivery for fetal distress and failure to progress.
Significant differences were also observed when fetuses were classified by the CPR per the
centiles (<10th centile, 10-90th centile and >90th centile). 40% (8/20) of fetuses with CPR
<10th centile was delivered by emergency caesarean section for fetal distress while none
(0/20) of fetuses were delivered by caesarean section for fetal distress in the group of
fetuses with CPR >90th centile (Negative predictive value-100%). CPR<10th centile were 2.7
times more likely to be delivered by emergency caesarean section for fetal distress when
compared to the rest of the fetuses.
CPR is an important finding used in the management of fetal growth restriction at late
gestation. Many published studies have shown its importance in identifying fetuses that are
at risk of fetal compromise.(54, 68, 126-128) Ropacka et al. observed 148 women in
uncomplicated pregnancies between 40-42 weeks. The fetuses were divided into two
groups for analysis of the intrapartum and neonatal outcomes based on presence or the
absence of brain sparing effect. They observed that abnormal CPR was identified in 62.3% of
cases with brain sparing effect while only 19% of fetuses in the control group showed
abnormal CPR. Abnormal CPR also showed the highest sensitivity in the prediction of both
the intrapartum (abnormal FHR in 74% of cases) and risk of the adverse neonatal outcome
(87.8%) suggesting that the CPR showed the highest sensitivity in prediction of fetal heart
rate abnormalities and adverse neonatal outcome in uncomplicated pregnancies.(129)

140
Twomey et al. showed that CPR less than one between 30 to 34 weeks had a greater risk of
an emergency caesarean section for fetal distress (33.3%), and adverse perinatal outcomes.
This observation was also strongly associated with low birth weight babies.(130)
Our results correlate with previously published reports suggesting low CPR can predict the
risk of intrapartum fetal distress in AGA fetuses at term. We also observed that high CPR
was found to be protective for emergency caesarean section in the same cohort.
5.5 Fetal cardiac functional parameters
The fetal heart circulation is different to the adult where two circulations efficiently run in
parallel with two shunts (ductus arteriosus and the foramen ovale) connecting them. It is
also different to the adults that fetal oxygenation occurs at the placenta and not at the fetal
lungs. Despite the low partial pressure of oxygen in fetal circulation, the fetus is still able to
maintain oxygen delivery to its tissues due to the presence of fetal haemoglobin and high
combined ventricular output.(131)
There had been many studies on animal models describing the fetal cardiac circulation and
the response of cardiac function to fetal hypoxia.(82, 83, 85-87, 132)The combined biventricular
cardiac output is approximately 450mL/kg/min at birth of which 60-65% is ejected by the
right ventricle and the remaining 35-40% is ejected by the left ventricle. The ratio of the
right to left cardiac output is 1.5:1 since the right ventricle is the dominant systemic
ventricle during fetal life.
The fetal heart rate at the aorta and pulmonary valve appeared similar with the median
heart rate measuring 138 at the aorta and 139 beats per minute at the pulmonary artery
respectively. Fetal heart rate is higher at earlier gestations and gradually decline to 155
beats per minute and stays at around 140 beats per minute beyond 30 weeks. Our results

141
correlated with the standard reference range across the gestation published in the
literature.(81)
There was no difference in the diastolic function when fetuses were grouped per indication
and the mode of delivery. However, significant difference in the systolic function was
observed in these fetuses. Fetuses delivered by emergency caesarean section for fetal
distress had lower left cardiac systolic function indices (ejection time at aortic valve, velocity
time integral at aortic valve, left ventricular stroke volume and left cardiac
output/mL/min/kg) when compared with the rest of the fetuses.
There was no significant difference in the right ventricular systolic function between fetuses
when grouped per the indication and mode of delivery. However, significant differences in
the ratio of the right to left stroke volume and the right to left cardiac output was observed
in fetuses delivered by caesarean section for fetal distress. While there was no change in the
overall combined cardiac output, there was a shift in the individual ventricular output
suggesting redistribution between ventricles while still maintaining the overall cardiac
output.
The important cardiac function indices that were significantly different among the fetuses
when grouped per the indication and mode of delivery are listed below.
1 Ejection time at the aortic valve
2 Velocity time integral at aortic valve
3 Left ventricular stroke volume
4 Left cardiac output/mL/min/kg
5 Difference between right and left ventricular stroke volume
6 Difference between right and left cardiac output/mL/min/kg
7 Ratio of right to left cardiac output/mL/min/kg

142
Ejection time at aortic valve
Ejection time at the aortic valve is when blood is ejected from the left ventricle beginning
with the opening of the aortic valve and ending with the closure of the aortic valve
measured in milliseconds. Fetuses delivered by emergency caesarean section had the lowest
median ejection time (0.156, IQR 0.145 to 0.160) when compared with the rest of the
fetuses and was statistically significant (p=0.0005).
Dunn's multiple comparisons test showed a significant difference between fetuses delivered
by caesarean section for fetal distress when compared with the caesarean section for failure
to progress, instrumental delivery for failure to progress and instrumental delivery for fetal
distress.
The ejection time is analysed in paediatric and adult cardiology in the evaluation of patients
with various cardiovascular disorders. In an average individual, ejection time varied
inversely with the heart rate and directly with the stroke volume. Prolongation of the
ejection relative to stroke volume was observed in patients with aortic insufficiency.(133) We
observed a weak, but positive correlation between the ejection time and the left ventricular
stroke volume (R2=0.05) which is expected as a normal observation in fetuses.
Velocity time integral at Aortic valve
Measurement of the velocity time integral in 2D fetal echocardiography is an important
parameter to calculate the stroke volume. It is obtained by manually tracing the Doppler
signal of the aortic or the pulmonary valve and then multiplied by the corresponding valve
area to get the stroke volume of the ventricles respectively.

143
Our study showed a significant difference in the velocity time integral at the aortic valve
when fetuses were grouped per the indication and mode of delivery (p=<0.0001). Fetuses
delivery by emergency caesarean section for fetal distress had the lowest median velocity
time integral value in our study group (0.090, IQR 0.070to 0.100). Dunn's multiple
comparisons test showed a significant difference between fetuses delivered by emergency
caesarean section for fetal distress when compared with emergency caesarean section for
failure to progress and instrumental delivery for fetal distress.
The cardiac output is calculated on 2D ultrasound by multiplying the stroke volume with the
heart rate. The LVOT diameter closely approximates a circle in shape and undergoes
minimal change during ventricular systole and diastole and is therefore assumed to be a
constant. Stroke volume is calculated by multiplying the velocity time integral and the valve
area. If the LVOT diameter is assumed constant, the velocity time integral (VTI) should be
directly proportional to the stroke volume which means that an increase in the VTI is
associated with an increase in the stroke volume. We observed this finding in our data
analysis (Figure 5.01) evidenced by a moderate positive correlation between the VTI and the
stroke volume of the left ventricle (R2=0.487) as described in the figure below.
Figure 5.01: Correlation between VTI Aorta and LV stroke volume
0
0.05
0.1
0.15
0.2
0 2 4 6 8 10 12
Correlation between VTI Aorta and LV stroke volume (R2=0.487)

144
Left ventricular stroke volume
Stroke volume is the difference between the end diastolic volume and the end systolic
volume expressed in mL. It defines the amount of blood pumped from the left ventricle per
beat.
Statistically, a significant difference was observed in the LV stroke volume in our study when
fetuses were grouped per the indication and mode of delivery (p=0.0289). Fetuses delivered
by emergency caesarean section for fetal distress had the lowest median LV stroke volume
(4.019mL, IQR 3.411 to 5.407) while fetuses delivered by caesarean section for failure to
progress had the highest median LV stroke volume (5.460mL, IQR 4.132 to 6.860 mL) with
significant mean rank difference between fetuses delivered by emergency caesarean section
for fetal distress when compared with fetuses delivered by emergency caesarean section for
failure to progress. Fetuses with LV stroke volume <10th centile was twice more likely to be
delivered by caesarean section for fetal distress while fetuses with LV stroke volume greater
than the 90th centile were protective of caesarean section for fetal distress.
Left cardiac output/mL/min/kg (LCO)
The left cardiac output is obtained by multiplying the left ventricular stroke volume and the
heart rate across the aortic valve. The cardiac output/mL/min/kg is obtained by dividing the
cardiac output by the estimated fetal weight. Statistically significant variation in the LCO was
observed in the fetuses when classified per the mode of delivery (p=0.003). Fetuses
delivered by emergency caesarean section for fetal distress had the lowest median LCO
(152.3 mL/min/kg, IQR 124.3 to 192.9 mL/min/kg) while fetuses that were delivered by

145
instrumental delivery for fetal distress had the highest median LCO (204.9 mL/min/kg, IQR
169.7 to 256.4 mL/min/kg).
Fetuses were grouped by the centiles (<10th centile, 10-90th centile and >90th centile) and
the mode of delivery was analysed in our study. 40% (8/20) of fetuses with LCO <10th centile
was delivered by emergency caesarean section for fetal distress while none of (0/20) of
fetuses were delivered by caesarean section for fetal distress in the group of fetuses with
LCO >90th centile (Negative predictive value-100%).
Fetuses with LCO <10th centile were 2.7 times more likely to be delivered by caesarean
section for fetal distress when compared with fetuses with LCO >90th centile.
Binary logistic regression was performed with caesarean section as the dependent variable
which adjusts for the influence of the potentially confounding variable. We observed that
left cardiac output remained significant even when the cerebroplacental ratio was included
in the model suggesting that they are independent predictors for caesarean section for fetal
distress. For the same reason, there was not a strong linear correlation between the
LCO/mL/min/kg and the CPR.
Difference between Right and Left ventricular stroke volume
Statistically significant difference between RV and LV stroke volume was observed between
the fetuses when classified per the indication and the mode of delivery (p=0.011). Fetuses
delivered by emergency caesarean section for fetal distress had the highest median
difference between the RV and LV stroke volume (3.025 mL/min, IQR 1.960 to 4.574
mL/min). Fetuses with higher difference (>90th centile) were 2.3 times more likely to be
delivered by emergency caesarean section for fetal distress.
146
Difference between RCO and LCO/mL/min/kg
The difference between the right and the left cardiac output /mL/min/kg was measured in
all the fetuses in our study population. The median value was 70.53 mL/min/kg (range -176
mL/min/kg to 399 mL/min/kg). The difference between the right and left cardiac output was
significantly different between the fetuses when classified per the indication and mode of
delivery (p=0.0158). Fetuses delivered by emergency caesarean section for fetal distress had
the highest median difference (121.6mL/min/kg, IQR 74.98 to 174.6 mL/min/kg). The lowest
median difference (46.17 mL/min/kg, IQR 12.57 to 117.3 mL/min/kg) was found in fetuses
delivered by emergency caesarean section for failure to progress. We observed 15% (3/20)
of fetuses were delivered by emergency caesarean section for fetal distress < 10th centile
while 35% (7/20) of fetuses were delivered by caesarean section for fetal distress in the
group of >90th centile suggesting that fetuses with the highest difference were 2.3 times
more likely to be delivered by emergency caesarean section for fetal distress compared to
the rest of the fetuses in our study.
Ratio of right to left cardiac output/mL/min/kg
Studies in animal models suggest a right ventricular dominance in fetal life compared to
postnatal life which was also evident in our study. The median ratio of the right to left
cardiac output/mL/min/kg in our study was 1.4: 1 that was comparable to previously
published data. We observed a significant difference in the ratio of the right to the left
cardiac output among our fetuses when classified per the indication and the mode of
delivery (p=0.0019). Fetuses delivered by caesarean section for fetal distress had the highest
median ratio (1.925, IQR 1.048 to 1.573) while fetuses delivered by instrumental delivery for
fetal distress had the lowest median ratio (1.252, IQR 1.061 to 1.561).
147
We also observed a significant difference in the delivery outcome when fetuses were
grouped per the centiles (10th centile, 10-90th centile and >90th centile). 15% (3/20) of
fetuses were delivered by emergency caesarean section for fetal distress in the group with
ratio less than 10th centile while 55% (11/20) of fetuses were delivered by caesarean section
for fetal distress in the group with ratio greater than 90th centile. Fetuses with higher ratio
difference (greater than the 90th centile) were 4.3 times more likely to be delivered by
caesarean section for fetal distress when compared with rest of the fetuses.
Binary logistic regression with the caesarean section for fetal distress as the dependent
variable which adjusts for the influence of the potential confounding variable was
performed. The CPR and the ratio of the right to left cardiac output remained significant
even when both are included in the model (p=<0.0001 and 0.001 respectively) suggesting
that they are independent predictors of caesarean section for fetal distress (Odds ratio –
0.057 and 2.820 respectively).
We also constructed a receiver operating characteristic curve( ROC) curve to check the
sensitivity of the ratio of the right to left cardiac output to predict fetuses that were
delivered by emergency caesarean section for fetal distress. The area under the curve(AUC)
was found to be 0.709 (confidence interval = 0.603 to 0.814).
The principle component in the assessment of the cardiac output is the stroke volume which
is defined as the amount of blood ejected by the heart in a single contraction. Ventricular
stroke volume is the difference between the end diastolic volume (EDV) and the end systolic
volume (ESV).

148
End-diastolic volume (EDV) is the volume of the blood in the ventricle before the onset of
ventricular ejection. End-systolic volume (ESV) is the remaining volume of blood in the
ventricle after ventricular ejection. The difference between these two could affect the
stroke volume. For example, an increase in the EDV increases the stroke volume, while an
increase in ESV reduces the stroke volume. The three principle mechanisms that regulate
the EDV, ESV and the stroke volume are cardiac preload, afterload and myocardial
contractility (Figure 5.02).
Figure 5.02: Factors affecting Stroke volume
Cardiac afterload is defined as to the pressure against which the cardiac muscle fibres can
shorten. The cardiac preload is the end diastolic volume before ventricular contraction.
Cardiac preload increase with exercise, increased sympathetic tone, and increased venous
return to the heart resulting in an increased stroke volume.
In the adult heart, beat to beat variation in the amount of blood pumped by the ventricles is
determined by the amount of blood returning to the heart. By the Frank-Starling mechanism,
the stroke volume of the heart increases in response to an increase in end diastolic volume

149
resulting in an increased preload. This increase in the volume causes stretching of the
ventricular wall resulting in much forceful contraction to eject the blood even when all other
factors remain constant. However, in contrast to the adult heart, the fetal heart has little
functional reserve. Weil et.al studied the pressure volume relationship of the fetal heart in
lambs by increasing the ventricular preload while maintaining the afterload. They observed
that left ventricular end diastolic pressure and the peak systolic pressure increased in
proportion to the preload suggesting that mechanism of Frank starling effect. This study also
concluded that cardiac preload plays an important, but limited function in cardiac
reserve.(134) Kirkpatrick et.al performed similar studies in fetal lambs and observed a
significant association between the stroke volume and left ventricular shortening suggesting
that frank starling mechanism is operative and effective within physiological conditions.(135)
There are published studies that have looked at the effects on cardiac function in chronic
hypoxemic fetuses as part of the assessment of fetal growth restriction or pregnancies with
placental dysfunction.(136, 137)
Cardiac flow is significantly influenced by changes in vascular flow to the fetus and placenta
that affect the stroke volume. In fetuses with chronic hypoxia, there is a decrease in the left
ventricular afterload secondary to cerebral vasodilatation and an increase in the right
ventricular afterload due to increased placental vascular resistance.
Fetal hypoxemia results in adaptive changes in the fetus that include erythropoiesis to
increase oxygen transport, angiogenesis in muscle to reduce oxygen diffusion distance,
increase catecholamine release and metabolic changes at a cellular level. The fetal heart

150
also reacts to damage differently from the adult heart by responding with cardiac myocyte
proliferation in addition to ventricular hypertrophy.(138)
Longitudinal studies have suggested that in growth restricted fetuses, the cardiac output
gradually declined to indicate a progressive worsening of the cardiac function. It is
important to understand that these changes occur gradually over a period when the fetal
heart undergoes adaptive response to the hypoxic environment.
Alonso et.al(137) examined the right ventricular function in fetal sheep following long-term
hypoxemia by infusing nitrogen gas into the maternal trachea. Six cases were housed under
hypoxic conditions while another six cases were housed in a non-hypoxemic environment as
controls. The right ventricular stroke volume and cardiac output were measured in all the
cases for two weeks with electromagnetic flow probe placed in the pulmonary artery by
intravascular catheters. Cardiac preload was assessed by volume infusion of 5%
(weight/volume) dextrose, and afterload was studied by administering methoxamine (alpha
adrenergic agonist). In hypoxic fetuses, the right ventricular output and stroke volume were
not seen to be affected during the first two days but then reduced to 30% on day three.
Hypoxic fetuses also showed an increase in the fetal arterial pressure by 20% and the
haemoglobin concentration by approximately 30% with minimal changes in the heart rate.
There was no change in the cardiac enzyme levels in both the groups. The researchers also
found that the fetal heart in both the groups always worked on the plateau of its function
curve at any given afterload with right ventricular output remaining constant.
The study concluded that in fetuses with prolonged hypoxemia, right ventricular function
showed a triphasic response. There is an initial primary maintenance phase during 1 to 3

151
days followed by a reduced output that lasts up to 7 days and recovery occurs by the end of
two weeks. This study showed that fetal cardiac function was not found to be affected
during the first 48 hours of hypoxemia as there was no significant difference in the atrial
pressure and the fetal heart rate. Besides, circulating catecholamine during short-term
hypoxia could maintain cardiac function by direct inotropic stimulation. The hypoxic fetuses
after two weeks achieved a new steady state to be able to pump against increased afterload
resulting from the polycythaemia and elevated arterial pressure.(139)
The results of the fetal cardiac output to short-term fetal hypoxemia appear variable
depending on the severity and duration of the insult. Adachi et al(140) reported changes in
the fetal cardiac function during short-term hypoxemia by an increase in the stroke volume
and raised cardiac output in spite of associated bradycardia. Similar study by Cohn et.al(141)
in lamb fetuses showed a difference in the cardiac output depending on moderate or severe
hypoxemia. Fetuses with moderate hypoxemia showed no significant change in cardiac
output while decreased cardiac output was observed in fetuses exposed to severe
hypoxemia.
This is the first study that has considered the measurement of fetal cardiac output prior to
labour in appropriate for gestational age fetuses at term. While we found no significant
change in the overall cardiac output, there was clearly a dominance of the right cardiac
output compared to the left in fetuses delivered by emergency caesarean section for fetal
distress while maintaining the overall cardiac output. We know from previous studies that
fetuses normally exhibit a right heart dominance prior to delivery which then converts to
left ventricular dominance after birth. We could therefore hypothesise that babies that
show transition from right to left ventricular dominance and those who show the healthiest

152
transition are likely to withstand labour the best. However, fetuses with significant right
ventricular dominance with reduced left ventricular dominance during labour may show
difficulty in adaptation and these are the babies that respond worse to the stress of the
labour and have a higher incidence of developing intrapartum fetal distress.
The observations in our study could therefore be attributed to the failure of adaptation of
the fetus to changes in the physiological activity of the fetal heart in response to
intrapartum fetal distress rather than due to direct consequence of hypoxic changes that
occur during labour resulting in increased incidence of emergency caesarean section for
fetal distress.
5.6 Intrapartum and neonatal outcomes
Electronic fetal heart rate monitoring and outcome
This study was not powered to analyse the intrapartum and neonatal outcomes. However,
we present our analysis on the findings we observed in our study. We had 80 patients that
were classified as having pathological electronic fetal heart rate monitoring tracing in our
study population. We observed that fetuses delivered with pathological electronic fetal
heart rate monitoring tracings also had a lower CPR, lower LCO and a higher ratio of the
right to left cardiac output when compared with rest of the fetuses. Sub group analysis
showed increased number of fetuses in the pathological electronic fetal heart rate
monitoring group that were delivered by emergency caesarean section for fetal distress.
These fetuses had lower CPR, LCO less than the 10th centile and a higher ratio (>90th centile)
153
of the right to the left cardiac output. On the contrary, fetuses with higher CPR and the Left
cardiac output greater than the 90th centile in the pathological electronic fetal heart rate
monitoring group appeared protective for caesarean section for fetal distress.
Prediction of intrapartum fetal hypoxia still appears challenging despite improvements in
the assessment of the fetus during labour. Despite standard published guidelines, there is
still a wide variation of inter and intra observer variability in the interpretation of
intrapartum fetal distress leading to sub-optimal management and complications resulting
in medico-legal claims.(16) Systematic reviews on continuous electronic fetal heart rate
monitoring for intrapartum fetal assessment have failed to show significant difference in
cerebral palsy rate, infant mortality rate or other standard measures of neonatal well-
being.(7) Sirsistadis et al. in his prospective controlled study looked at intrapartum outcomes
in fetuses that were monitored by electronic fetal heart rate monitoring alone and in
combination with CPR. They observed that electronic fetal heart rate monitoring together
with CPR showed a lower risk of neonatal metabolic acidosis and had significantly lower
rates of caesarean section for fetal distress and improved outcome rather when used in
isolation.(68)
Our findings correlate with the previously published reports; however, we also observed
that fetuses delivered by emergency caesarean section for fetal distress following abnormal
electronic fetal heart rate monitoring also had a reduced left cardiac output suggesting that
underlying reduced cardiac function in these fetuses predispose them to subsequent risk of
intrapartum fetal distress.

154
Amniotic fluid volume
Measurement of the deepest pool of liquor and the amniotic fluid index is part of routine
assessment of fetal well-being. Previously published studies have shown that reduced
amniotic fluid volume is seen in growth restricted fetuses secondary to poor placental
function and reduced renal perfusion secondary to cerebral hypoxemia (37, 39, 142) although
Kushtagi et al. (52) in their study concluded that amniotic fluid index is not a reliable
screening test to predict intrapartum fetal compromise. Post-term fetuses have increased
morbidity due to increased risk of meconium aspiration, fetal post maturity syndrome and
fetal death. Amniotic fluid gradually decreases with advanced gestation nearing term with a
further decline after 40 weeks. Many theories have been proposed for this observation. The
most common belief is that placental insufficiency in post-term fetuses results in cerebral
redistribution leading to impaired renal perfusion resulting in oligohydramnios. However,
Bar-Hava et al. showed that there is increased secondary renal absorption rather than
impaired renal perfusion resulting in reduced liquor volume in post-term fetuses.(40) Clinical
practitioners equally use the amniotic fluid index and the deepest vertical pool of liquor in
the assessment of amniotic fluid volume and abnormalities in either of them is considered
to be associated with adverse intrapartum outcome.
Our results showed that fetuses delivered by emergency caesarean section for fetal distress
had the lowest amniotic fluid volume index and the lowest deepest vertical pool of liquor.
This was statistically significant (p=0.02) when fetuses were grouped per the indication and
mode of delivery. The results suggest that even in the cohort of normally grown term
fetuses, sub-optimal placental function may cause reduced amniotic fluid volume and be
associated with adverse intrapartum outcome.

155
Meconium stained liquor was observed in 18 cases in our study group with no significant
difference when compared with maternal demographics, fetal weight and ethnicity. We
observed meconium stained liquor was more associated in fetuses with advanced gestation
beyond 41 weeks. Since the numbers were small, they did not undergo significant statistical
analysis; however, interesting findings were observed in the fetuses that had meconium
stained liquor.
Among the fetuses with meconium stained liquor, 33 %( 6/18) were delivered by emergency
caesarean section for fetal distress. Further analysis was performed after sub-classifying the
fetuses per the centile measurements based on relevant cardiac functional parameters.
We observed that fetuses delivered by emergency caesarean section for fetal distress with
meconium stained liquor also had a low CPR and the LCO < 10th centile. None of the fetuses
was delivered for the same reason in the group of fetuses of measurements above the 90th
centile.
Intrauterine passage of fetal bowel contents occurs in around 8 to 20% of term pregnancies.
There is an increased association of meconium-stained liquor in post-term pregnancies and
in fetuses with intrauterine hypoxia for which the mechanism is poorly understood.
Meconium-stained amniotic fluid has been associated with an increased risk for operative
delivery and adverse perinatal outcome.(143-145)
Hiersch et al(146) performed a retrospective cohort study of women with meconium-stained
amniotic fluid in low-risk pregnancies that were delivered between 37 to 41+6 week's
gestation. They observed that 10.9% of their population were diagnosed with meconium
stained liquor. When matched with controls, the incidence of meconium-stained liquor was

156
increased in primiparous women, fetuses with advanced gestation and following induction
of labour. Meconium stained liquor was also increased in fetuses with non-reassuring heart
trace and in fetuses delivered by caesarean section. These fetuses were also found to be at
greater risk for respiratory distress and short-term neonatal morbidity.
Our study findings correlate with previously published reports. We have observed that
abnormal fetal Doppler and cardiac function in fetuses in addition to meconium stained
liquor can be associated with adverse intrapartum outcome resulting in caesarean section
for fetal distress.
Neonatal outcomes
This study was not powered to detect differences in the neonatal outcome. We did not find
a significant difference in the mean APGAR score at 1, 5 and 10 minutes in our study
population; however, fetuses delivered by emergency caesarean section for fetal distress
had comparatively low APGAR scores at 5 minutes when compared with the rest of the
fetuses. Similarly, there was no significant association between the APGAR scores and the
important cardiac functional parameters when fetuses were grouped per the indication and
the mode of delivery.
We did not observe significant differences in the mean arterial and venous pH when fetuses
were classified per the indication and mode of delivery. Most the fetuses that were
delivered in our study population had a mean pH between 7.2 and 7.3. However, when the
arterial pH was grouped per the centile, we observed that arterial pH above the 90th centile
was protective for fetal distress.

157
Arterial pH less than seven was observed in 3 fetuses (caesarean section for failure to
progress (1), caesarean section for fetal distress (1) and spontaneous vaginal delivery (1).
Further analysis of these cases showed no significant correlation to the gestational age,
estimated fetal weight, CPR or the left cardiac output when compared with rest of the
fetuses that were either delivered for similar reasons. The fetus with a low arterial pH that
was delivered by vaginal delivery also had a lower fetal weight (3321 vs. 3512 grams), higher
CPR (1.77 vs. 1.64) and was delivered at earlier gestation (37+5 vs. 40+6) when compared
with rest of the fetuses in the spontaneous vaginal delivery group.
Similarly, there were no neonatal admissions for the fetuses that were delivered with cord
pH less than 7. Low arterial pH <7 have been observed in fetuses with an adverse neonatal
outcome. However, these parameters by itself are poor identifiers of intrapartum
compromise as they reflect the neonatal condition at delivery rather than the time of
intrapartum insult to the fetus.
Results of the base excess were obtained from the neonatal case noted for all our fetuses.
The base excess was statistically significant when fetuses were grouped per the indication
and mode of delivery (p<0.0001). Fetuses delivered by caesarean section for failure to
progress had the highest median base excess (-4.65, IQR -6.37 to -2.30) while fetuses that
were delivered by spontaneous vaginal delivery had the lowest median base excess (-7.220,
IQR -8.30 to -6.35).
Blood supply to the fetus is challenged to its maximum during the intrapartum period when
maternal oxygenation is compromised, maternal perfusion to the placenta is reduced and
the oxygenated blood flowing from the placenta to the fetus is impeded resulting in cerebral

158
redistribution. Further reduction in fetal oxygenated blood flow results in activation of the
anaerobic pathway with accumulation of lactic acid resulting in metabolic acidosis. Although
low arterial pH <7 and base excess greater than -12 are associated with adverse neonatal
outcome, these parameters only reflect the neonatal condition at delivery rather than the
time of intrapartum insult to the fetus.(147)
Estimated fetal weight and obstetric outcome
Estimated fetal weight was recorded in all the fetuses in our study population before labour
and was correlated with postnatal weight obtained from the neonatal case records. The
median estimated fetal weight was 3629 grams (range 2626 to 4856 grams). The estimated
fetal weight was significantly different (p=0.003) when fetuses were classified per the
indication and the mode of delivery. The lowest median fetal weight was recorded in fetuses
delivered by spontaneous vaginal delivery (3531 grams, IQR 3262 to 3822 grams) and the
highest median fetal weight was recorded in fetuses that were delivered by instrumental
delivery for failure to progress (3764 grams, IQR 3336 to 4005 grams). Significant mean rank
differences in fetal weight were observed between fetuses delivered by caesarean section
for failure to progress and Instrumental delivery for fetal distress and between instrumental
delivery for failure to progress and Instrumental delivery for fetal distress. There was a
strong positive correlation (R2 =0.83) between the estimated birth weight and the actual
birth weight. The mean absolute error difference in the fetal weight was 110 grams, and the
mean percentage of error was 3.68% which is within the acceptable range of average values
as documented in many studies.(148, 149) There was no correlation observed between the
fetal weight and the cardiac parameters (LCO and ratio of the RCO to LCO).

159
Chapter 6 – Fetal cardiac function and cerebroplacental ratio in the
prediction of adverse intrapartum outcome
6.1 Performance of screening in prediction of intrapartum fetal distress at term
Following the findings from our data analysis, we looked at the performance of screening
methods in the prediction of fetal distress at term by assessment of the fetal cardiac output
and to compare with the cerebro placental ratio. Amongst the cardiac functional
parameters, the most significant differences were observed in the left cardiac output and
the ratio of the right to the left cardiac output when fetuses were grouped per the
indication and the mode of delivery. We, therefore, decided to use the two parameters
along with CPR to compare the detection rate and the positive predictive value of these
parameters in the prediction of intrapartum fetal distress at term in appropriate for
gestational age fetuses.
Detection rate of intrapartum fetal distress at term
To look at the performance of screening in the prediction of intrapartum fetal distress, we
grouped the fetuses and took the 10th or the 90th centile of the different cut-offs of the
fetuses that did not have caesarean section for fetal distress (Figure 6.01).
The 90th centile cut-off for the RCO to LCO ratio was ≥2.05. The 10th centile cut-off for the
CPR was≤1.13 and the 10th centile cut-off for the LCO/mL/min/kg was ≤128mL min/kg.
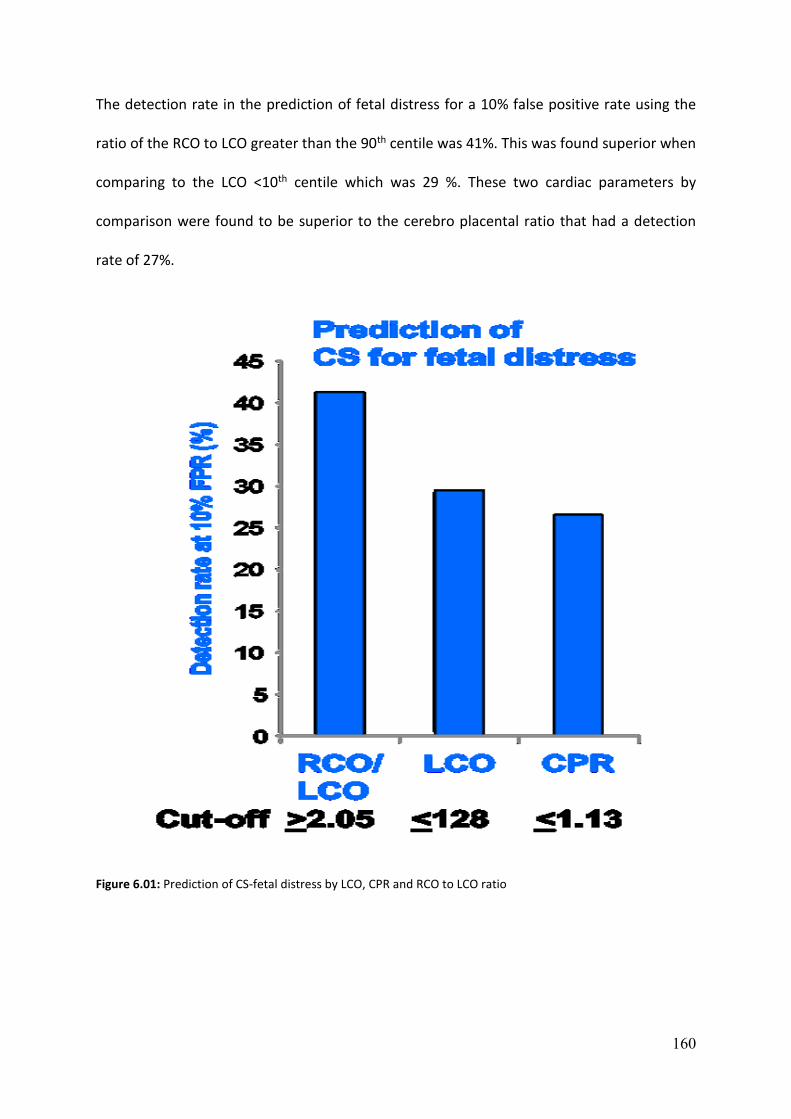
160
The detection rate in the prediction of fetal distress for a 10% false positive rate using the
ratio of the RCO to LCO greater than the 90th centile was 41%. This was found superior when
comparing to the LCO <10th centile which was 29 %. These two cardiac parameters by
comparison were found to be superior to the cerebro placental ratio that had a detection
rate of 27%.
Figure 6.01: Prediction of CS-fetal distress by LCO, CPR and RCO to LCO ratio

161
Positive predictive value in the prediction of intrapartum fetal distress
We also analysed our data to look at the positive predictive value of the important cardiac
parameters in comparison with cerebroplacental ratio in the prediction of intrapartum fetal
distress (Figure 6.02).
The positive predictive value in prediction of intrapartum fetal distress by using the ratio of
RCO to LCO was 45%. This value was higher when compared to the LCO which had a
detection rate of 37% and by comparison was found to be superior to the cerebroplacental
ratio with a detection rate of 35%.
Figure 6.02: PPV for CS-fetal distress by LCO, CPR and RCO to LCO ratio
32%
33%
34%
35%
36%
37%
38%
39%
40%
41%
42%
Ratio of RCO toLCO>90th centile
LCO/mL/min/kg <10th centile
CPR <10th centile
Positive predictive value (PPV)

162
Logistic regression analysis
We then performed a Binary logistic regression with the Caesarean section for fetal distress
as the dependent variable which adjusts for the influence of the potentially confounding
variable. The LCO remained significant even when the CPR was included in the model
suggesting that they are independent predictors for caesarean section for fetal distress. For
the same reason, there was not a strong linear correlation between the LCO and the CPR.
Similarly, we also performed a binary logistic regression with the caesarean section for fetal
distress as the dependent variable which adjusts for the influence of the potential
confounding variable. The CPR and the ratio of the RCO to LCO remained significant even
when both are included in the model (p=<0.0001 and 0.001 respectively) suggesting that
they are independent predictors of caesarean section for fetal distress (Odds ratio – 0.057
and 2.820 respectively). For the same reason, there was not a strong linear correlation
between the CPR and the ratio of the right to left cardiac output.
We constructed a receiver operating characteristic curve( ROC) curve to check the sensitivity
of the ratio of the RCO to LCO to predict fetuses that were delivered by emergency
caesarean section for fetal distress . The area under the curve(AUC) was found to be 0.709
(confidence interval = 0.603 to 0.814).

163
Chapter 7 – Conclusions
7.1 Strengths and limitations
Despite significant improvements in intrapartum assessment of fetuses during labour, the
prediction of intrapartum fetal distress remains a challenge in modern obstetrics
management. Diagnosis of intrapartum fetal distress is usually made by a combination of
clinical findings and electronic fetal heart rate monitoring abnormalities. Many studies and
systematic reviews on continuous intrapartum fetal monitoring have failed to show
significant difference in standard measures of neonatal well-being. The combination of four
systematic reviews comparing electronic fetal heart rate monitoring with pulse oximetry
and isolated electronic fetal heart rate monitoring analysis showed no difference in the
overall caesarean section rates (22)
Visser et al. in 2015 published the FIGO consensus guidelines on intrapartum fetal
monitoring. The study group looked at the combination of adjunctive technologies in
addition to electronic fetal heart rate monitoring to assess fetal oxygenation to reduce the
false positive cases resulting in unnecessary fetal interventions. The study concluded that
there was still much uncertainty regarding the use of different adjunctive technologies in
intrapartum fetal monitoring. The guidelines also suggest that in order to improve the
intrapartum fetal monitoring is to learn and understand the pathophysiology of the fetal
response following reduced oxygenation during labour.(150)

164
Studies that have included fetal Doppler in addition to electronic fetal heart rate monitoring
have shown to be more predictive of adverse intrapartum outcome rather than using
electronic fetal heart rate monitoring in isolation.(129) Our study has shown that assessment
of fetal cardiac function in AGA fetuses at term in addition to the fetal Doppler could
identify fetuses at risk of intrapartum fetal distress.
Fetal echocardiographic assessment is routinely performed using 2D echo with Doppler.
There have been significant improvements in the assessment of fetal cardiac function by
modern techniques alongside M mode, conventional 2D echo and Doppler ultrasound. The
newer modern cardiac assessment techniques are not practically suitable for day to day
clinical application due to the complexity of the techniques and the skill required to learn
and reproduce with minimal inter and intra-observer variability.(96)
Previous publications have shown that although 3D and 4D ultrasound techniques are
reliable than standard 2D and Doppler assessment for calculating the stroke volume and
cardiac output(151-153); However, there are many disadvantages in the implementation of this
method as a choice for screening due to the following reasons.
The newer 3D and 4D imaging methods involve complex post processing technology that is
not available with standard ultrasound equipment in day to day clinical practice. It may also
require a longer period of learning as every clinician or sonographer is not competent in
performing 3D ultrasound in routine clinical practice. 3D ultrasound can also be technically
challenging at late gestation due to fetal breathing movements which may compromise
image quality. Finally, it is important to note that the clinical expertise to post process and
review images from these new imaging modalities is not available in every clinical setting.

165
While 2D fetal echo and Doppler evaluation require additional skills and training, integrating
these additional examinations should be relatively easy to the existing clinical practice since
most of the doctors and sonographers are familiar with routine assessment of the fetal
heart as part of the fetal anomaly screening programme. Given the technical limitations and
complexity of the assessment of cardiac function by the newer imaging methods, it is
probably wiser to use the simplest and most validated techniques and gain experience with
these techniques for clinical assessment and can be implemented on a large scale screening
if found to be effective.(154)The whole examination was completed in 30-45 minutes which
would roughly be the time required to perform a routine obstetric scan suggesting the
convenience of using this technique in a regular clinical setting
All the scans in our study were conducted by an experienced single operator, and each
measurement was taken three times with the average of the measurements used in analysis.
The technique and measurements were performed per the standard published guidelines
thereby eliminating examination bias.
Analysis of the venous flow channels contiguous with the right atrium provide a good
approximation of the pressure gradients within the right atrium thus indirectly reflecting
cardiac compliance. An attempt was made to study the waveform from the Ductus
venosus(DV) as described in the methods earlier. However, it was not possible to consistent
wave form for analysis in all our population in the pilot study. This was due to multiple
factors like fetal position, acoustic shadowing from the spine and ribs obstructing the view
of the ductus on axial and sagittal planes, fetal diaphragmatic movements resulting in poor
sampling in addition to the narrow lumen of the vessel diameter at late gestation. The
hepatic veins near the ductus venosus also led to inadequate sampling leading resulting in
166
an incorrect waveform for analysis. Hence for the above reasons we could not include the
Ductus venosus analysis in our study.
Induction of labour constituted 79% of our recruited population, and the remaining 21% of
the women recruited were in spontaneous or early labour. Despite information of the study
available to patients, most of the women interested in participating in the study had either
progressed into active labour before recruitment and hence could not be enrolled into our
study. This study was performed by a single operator, and it was not possible to recruit the
patients, who arrived in early labour to triage during different times of the day and night.
Observational studies have supported the argument that induction of labour increases the
rate of caesarean sections, whereas reviews of post-date pregnancies and term prelabour
rupture of membranes suggest either no difference or reduction in the risk of caesarean
section. Wood et al.(112)performed a systematic review and meta-analysis of trials in women
with intact membranes. They reviewed 37 RCT’s of which 27 were trials of uncomplicated
pregnancies at 37-42 week’s gestation. The authors concluded that a policy of induction was
associated with a reduction in the risk of caesarean section compared with expectant
management (O.R =0.83, 95th CI 0.76 to 0.92).
A critical aspect of any new intervention or investigation is the acceptability of the
technique to patients. However, we observed very high rate of patient acceptance for
ultrasound examination before labour. Patients find an additional ultrasound examination
before delivery as an enjoyable and reassuring experience because additional scans are
currently not offered to low-risk pregnant women on the NHS antenatal screening
programme. The few patients who declined to participate in the study prior to enrolment

167
have cited reasons as being uncomfortable due to pain from active contractions or
unwillingness to undergo examination by a male doctor for religious/ethical reasons. These
issues are unlikely to persist if multiple operators can be trained to perform the study to
translate the evidence from research towards clinical practice.
7.2 Conclusions
This study was aimed to measure the fetal cardiac output before the onset of active labour
and to correlate with obstetric and neonatal outcome. This study is also the first study to
measure fetal cardiac function in AGA term fetuses before active labour in nulliparous
women.
Positive predictive parameters Relative risk Positive LR
CPR <10th centile 2.7 3.25
LCO/ml/min/kg <10th centile 2.7 3.25
Ratio of RCO to LCO >90th centile 4.3 5.97
Table 7.01: Relative risk and likelihood ratios in prediction of CS for fetal distress
Results from the Doppler study of cerebro placental ratio showed that fetuses delivered by
emergency caesarean section for fetal distress had a significantly low CPR compared to the
rest of the fetuses(p<0.0001). Fetuses with CPR less than 10th centile were 2.7 times more
likely to be delivered by caesarean section for fetal distress when compared to the rest of
the fetuses (Table 7.01). Fetuses with CPR >90th centile was protective for fetal distress
(NPV-100%).

168
The results of our study have shown that pre-labour assessment of cardiac function in
appropriately grown term singleton fetuses can identify fetuses at risk of subsequent
intrapartum fetal distress.
In fetuses that develop intrapartum fetal distress in utero, we observed a difference in the
prelabour cardiac function.
There was no difference in the diastolic function of the heart in these fetuses; however
significant differences were observed in the systolic function. The left cardiac output and
the difference between the right and left cardiac output were significantly different when
fetuses were grouped per the indication and mode of delivery. Fetuses with left cardiac
output < 10th centile were 2.7 times more likely to be delivered by caesarean section for
fetal distress when compared to the rest of the fetuses. However, fetuses with LCO >90th
centile appeared to be protective for caesarean section for fetal distress (NPV-100%).
Significant difference in the ratio of the right to the left cardiac output was also observed in
fetuses that were delivered by emergency caesarean section for fetal distress.
While there was no change in the overall cardiac output, fetuses delivered by caesarean
section for fetal distress had the highest ratio difference between the right and the left
cardiac output when compared with rest of the fetuses(p=0.0019). Fetuses with highest
ratio difference >90th centile were 4.3 times more likely to be delivered by emergency
caesarean section for fetal distress when compared with rest of the fetuses in our study
population.
169
The ratio of the right to the left cardiac output was also found to be superior in the
prediction of intrapartum distress when compared to the left cardiac output and the
cerebro placental ratio.
The detection rate in the prediction of fetal distress for a 10% false positive rate using the
ratio of the RCO to LCO >90th centile was 41%. This was higher when compared to the LCO
less than 10th centile (29 %) which was higher than the CPR with a detection rate of 27%.
The positive predictive value in prediction of intrapartum fetal distress by using the ratio of
RCO to LCO was 45%. This was higher when compared to the LCO<10th centile that had a
detection rate of 37% and by comparison was found to be superior to the CPR <10th centile
with a detection rate of 35%.
Results from the binary logistic regression that adjusts for the influence of the potentially
confounding variables showed the LCO and the ratio of the RCO to LCO remained significant
even when the CPR was included in the model suggesting that they are independent
predictors for caesarean section for fetal distress. For the same reason, there was not a
strong linear correlation between the CPR and the LCO and between the CPR and the ratio
of the right to the left cardiac output.
7.3 Potential clinical application and further research
Despite significant advances in intrapartum fetal monitoring, there has not been a
significant decrease in the overall rate of caesarean sections for the past three decades. One
in 4 babies (25%) is currently delivered by caesarean section making it the most commonly

170
performed operation in the world. There is a wide variation in the caesarean section rates
across the countries and continents around the world with numbers as little as 2% to as high
as 50%. (155, 156) Luz Gibbons et al. in their world health report published in the year 2010
obtained data from 137 countries performing caesarean sections. The results from the data
showed that 54 countries had caesarean section rates below 10%, whereas 69 countries had
shown rates above 15%. Around 10%(14) of the countries had caesarean rates between 10
to 15%.(157)The cost of global excess due to these procedures was estimated approximately
2.32 billion U.S Dollars, while the expense of the global need for caesarean section
approximated a modest amount of 432 million U.S Dollars.
There is an inverse relation between the caesarean section rates and the maternal and
infant mortality rates. However, the caesarean section above a certain limit have not shown
to provide additional benefit while some studies have shown that higher caesarean section
rates could be linked to negative consequences in maternal and child health.(157) Molina et al.
in 2015 published her results after examining the relationship between population level
caesarean delivery rates compared with maternal and neonatal mortality in 194 WHO
member states. The results showed that national caesarean delivery rates of up to
approximately 19 per 100 live births were associated with a lower maternal or neonatal
mortality among the member states.(158)
Caesarean section is being considered as one of the safety operative procedures although
it's not without the risk of surgical complications and adverse outcome. Liu et al. compared
spontaneous vaginal delivery with elective caesarean sections and found that caesarean
section had three times higher risk of severe maternal morbidity compared to spontaneous
vaginal delivery. This included major complicates like cardiac arrest, venous
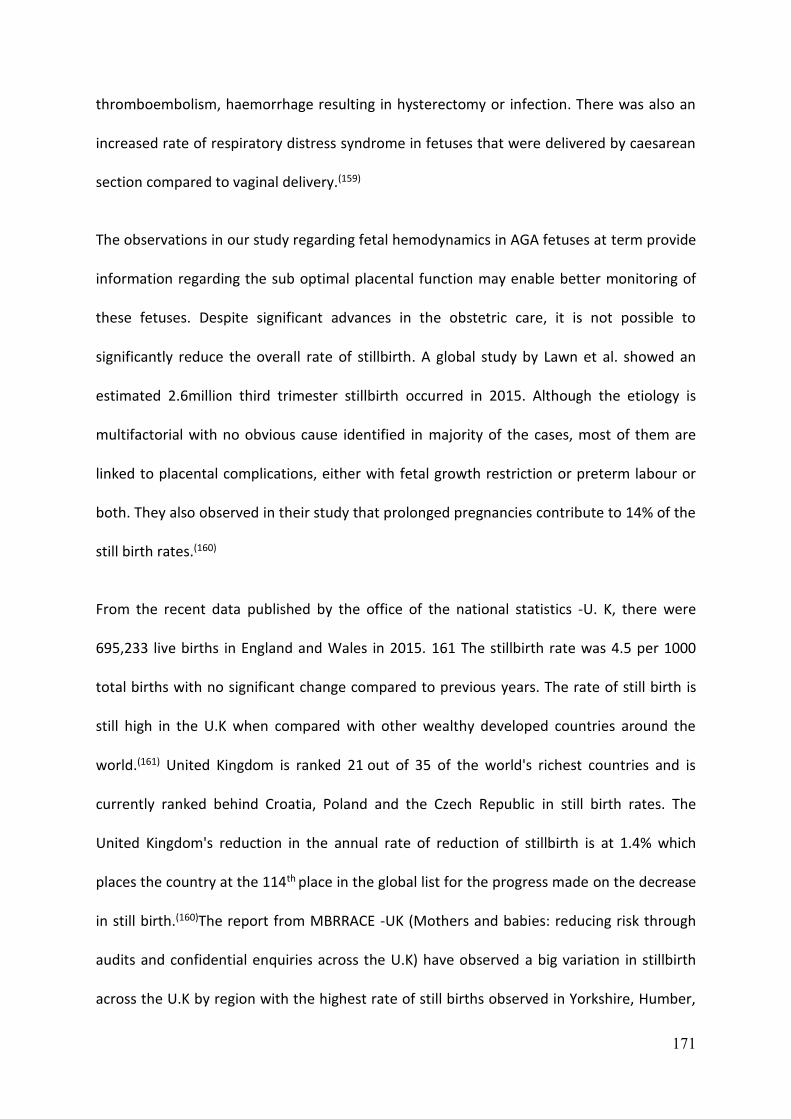
171
thromboembolism, haemorrhage resulting in hysterectomy or infection. There was also an
increased rate of respiratory distress syndrome in fetuses that were delivered by caesarean
section compared to vaginal delivery.(159)
The observations in our study regarding fetal hemodynamics in AGA fetuses at term provide
information regarding the sub optimal placental function may enable better monitoring of
these fetuses. Despite significant advances in the obstetric care, it is not possible to
significantly reduce the overall rate of stillbirth. A global study by Lawn et al. showed an
estimated 2.6million third trimester stillbirth occurred in 2015. Although the etiology is
multifactorial with no obvious cause identified in majority of the cases, most of them are
linked to placental complications, either with fetal growth restriction or preterm labour or
both. They also observed in their study that prolonged pregnancies contribute to 14% of the
still birth rates.(160)
From the recent data published by the office of the national statistics -U. K, there were
695,233 live births in England and Wales in 2015. 161 The stillbirth rate was 4.5 per 1000
total births with no significant change compared to previous years. The rate of still birth is
still high in the U.K when compared with other wealthy developed countries around the
world.(161) United Kingdom is ranked 21 out of 35 of the world's richest countries and is
currently ranked behind Croatia, Poland and the Czech Republic in still birth rates. The
United Kingdom's reduction in the annual rate of reduction of stillbirth is at 1.4% which
places the country at the 114th place in the global list for the progress made on the decrease
in still birth.(160)The report from MBRRACE -UK (Mothers and babies: reducing risk through
audits and confidential enquiries across the U.K) have observed a big variation in stillbirth
across the U.K by region with the highest rate of still births observed in Yorkshire, Humber,
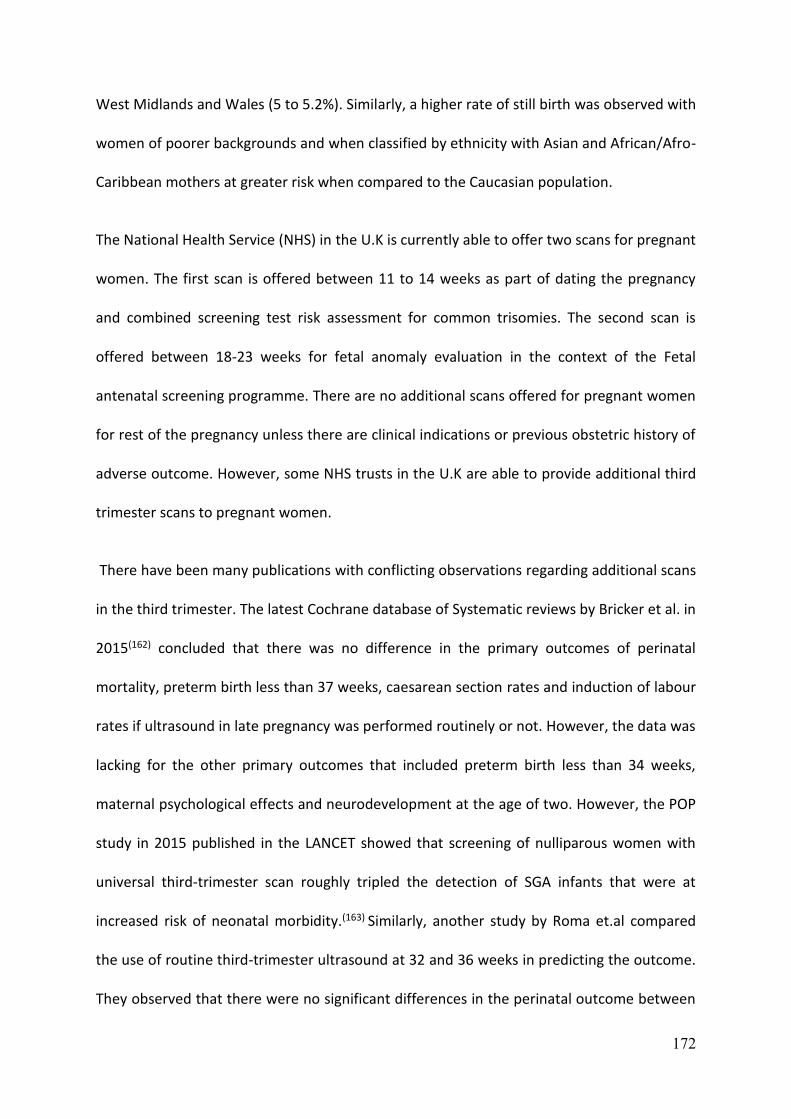
172
West Midlands and Wales (5 to 5.2%). Similarly, a higher rate of still birth was observed with
women of poorer backgrounds and when classified by ethnicity with Asian and African/Afro-
Caribbean mothers at greater risk when compared to the Caucasian population.
The National Health Service (NHS) in the U.K is currently able to offer two scans for pregnant
women. The first scan is offered between 11 to 14 weeks as part of dating the pregnancy
and combined screening test risk assessment for common trisomies. The second scan is
offered between 18-23 weeks for fetal anomaly evaluation in the context of the Fetal
antenatal screening programme. There are no additional scans offered for pregnant women
for rest of the pregnancy unless there are clinical indications or previous obstetric history of
adverse outcome. However, some NHS trusts in the U.K are able to provide additional third
trimester scans to pregnant women.
There have been many publications with conflicting observations regarding additional scans
in the third trimester. The latest Cochrane database of Systematic reviews by Bricker et al. in
2015(162) concluded that there was no difference in the primary outcomes of perinatal
mortality, preterm birth less than 37 weeks, caesarean section rates and induction of labour
rates if ultrasound in late pregnancy was performed routinely or not. However, the data was
lacking for the other primary outcomes that included preterm birth less than 34 weeks,
maternal psychological effects and neurodevelopment at the age of two. However, the POP
study in 2015 published in the LANCET showed that screening of nulliparous women with
universal third-trimester scan roughly tripled the detection of SGA infants that were at
increased risk of neonatal morbidity.(163) Similarly, another study by Roma et.al compared
the use of routine third-trimester ultrasound at 32 and 36 weeks in predicting the outcome.
They observed that there were no significant differences in the perinatal outcome between
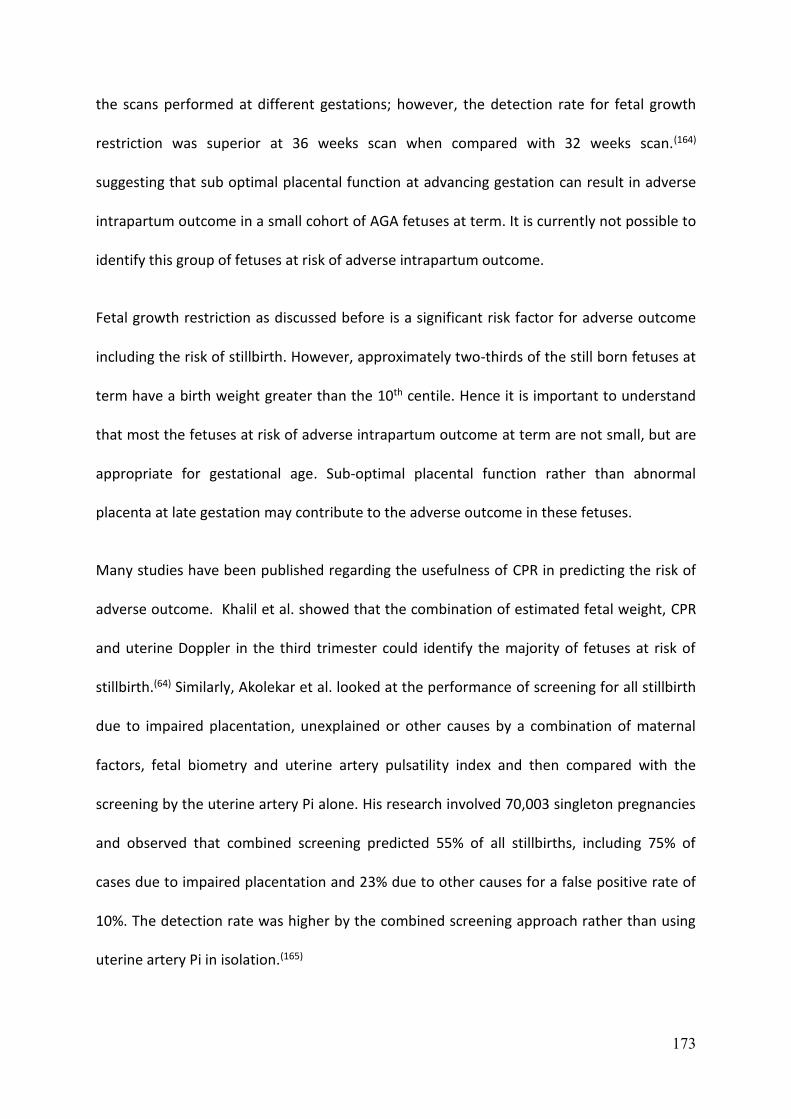
173
the scans performed at different gestations; however, the detection rate for fetal growth
restriction was superior at 36 weeks scan when compared with 32 weeks scan.(164)
suggesting that sub optimal placental function at advancing gestation can result in adverse
intrapartum outcome in a small cohort of AGA fetuses at term. It is currently not possible to
identify this group of fetuses at risk of adverse intrapartum outcome.
Fetal growth restriction as discussed before is a significant risk factor for adverse outcome
including the risk of stillbirth. However, approximately two-thirds of the still born fetuses at
term have a birth weight greater than the 10th centile. Hence it is important to understand
that most the fetuses at risk of adverse intrapartum outcome at term are not small, but are
appropriate for gestational age. Sub-optimal placental function rather than abnormal
placenta at late gestation may contribute to the adverse outcome in these fetuses.
Many studies have been published regarding the usefulness of CPR in predicting the risk of
adverse outcome. Khalil et al. showed that the combination of estimated fetal weight, CPR
and uterine Doppler in the third trimester could identify the majority of fetuses at risk of
stillbirth.(64) Similarly, Akolekar et al. looked at the performance of screening for all stillbirth
due to impaired placentation, unexplained or other causes by a combination of maternal
factors, fetal biometry and uterine artery pulsatility index and then compared with the
screening by the uterine artery Pi alone. His research involved 70,003 singleton pregnancies
and observed that combined screening predicted 55% of all stillbirths, including 75% of
cases due to impaired placentation and 23% due to other causes for a false positive rate of
10%. The detection rate was higher by the combined screening approach rather than using
uterine artery Pi in isolation.(165)
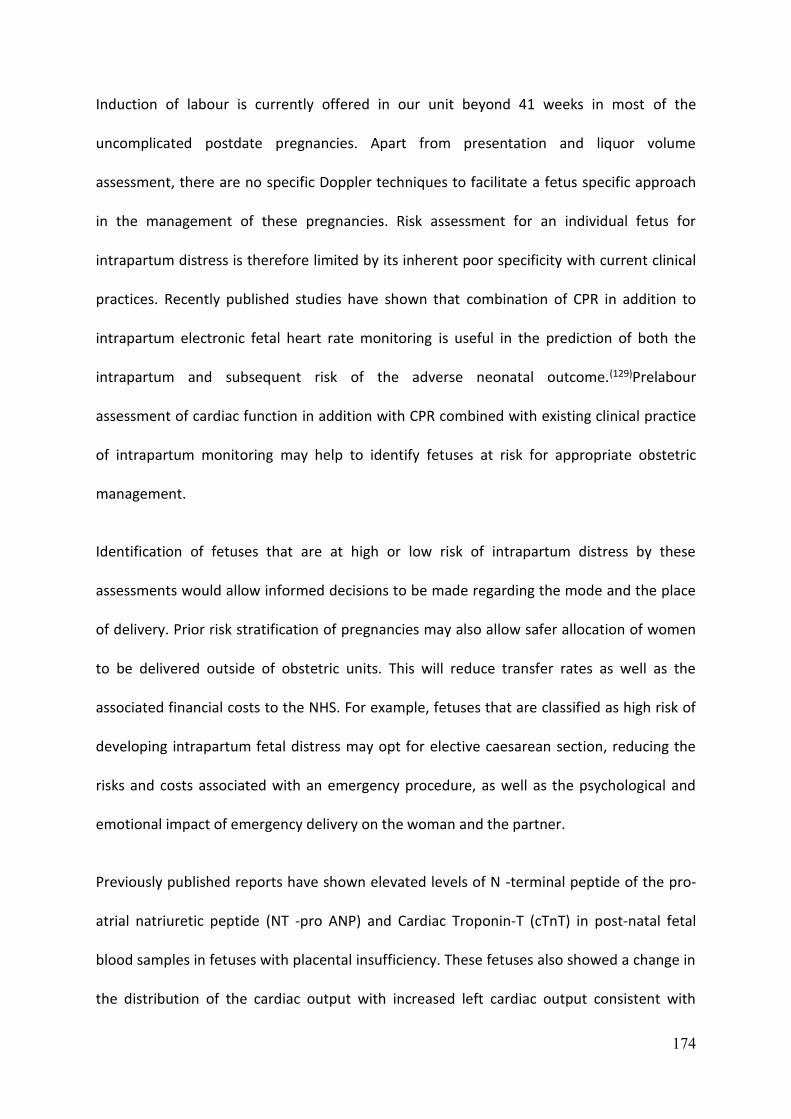
174
Induction of labour is currently offered in our unit beyond 41 weeks in most of the
uncomplicated postdate pregnancies. Apart from presentation and liquor volume
assessment, there are no specific Doppler techniques to facilitate a fetus specific approach
in the management of these pregnancies. Risk assessment for an individual fetus for
intrapartum distress is therefore limited by its inherent poor specificity with current clinical
practices. Recently published studies have shown that combination of CPR in addition to
intrapartum electronic fetal heart rate monitoring is useful in the prediction of both the
intrapartum and subsequent risk of the adverse neonatal outcome.(129)Prelabour
assessment of cardiac function in addition with CPR combined with existing clinical practice
of intrapartum monitoring may help to identify fetuses at risk for appropriate obstetric
management.
Identification of fetuses that are at high or low risk of intrapartum distress by these
assessments would allow informed decisions to be made regarding the mode and the place
of delivery. Prior risk stratification of pregnancies may also allow safer allocation of women
to be delivered outside of obstetric units. This will reduce transfer rates as well as the
associated financial costs to the NHS. For example, fetuses that are classified as high risk of
developing intrapartum fetal distress may opt for elective caesarean section, reducing the
risks and costs associated with an emergency procedure, as well as the psychological and
emotional impact of emergency delivery on the woman and the partner.
Previously published reports have shown elevated levels of N -terminal peptide of the pro-
atrial natriuretic peptide (NT -pro ANP) and Cardiac Troponin-T (cTnT) in post-natal fetal
blood samples in fetuses with placental insufficiency. These fetuses also showed a change in
the distribution of the cardiac output with increased left cardiac output consistent with

175
chronic hypoxemia.(89) Similarly, another prospective cross-sectional study by Girsen et
al.(166) looked at 42 fetuses with growth restriction that had Doppler assessment of
cardiovascular hemodynamics within seven days before delivery. Fetuses with severe
growth restriction and abnormal umbilical and DV Doppler showed significantly increased
NT -pro ANP levels. These fetuses also showed a change in distribution of the cardiac output
consistent with chronic hypoxemia.
Our results have shown that prelabour assessment of cardiac function in addition to the CPR
in AGA fetuses at term can identify fetuses at risk of subsequent intrapartum fetal distress.
While the overall cardiac output was maintained, there was a significant difference in the
ratio of the right to the left cardiac output in fetuses that were delivered by emergency
caesarean section for fetal distress. Further investigation of this technique using randomised
controlled trials would be essential before considering its application in clinical practice.

176
References
1. Engineer N, Kumar S. Perinatal variables and neonatal outcomes in severely growth restricted preterm fetuses. Acta Obstet Gynecol Scand. 2010;89: 1174-81. 2. Jonsson M, Nordén-Lindeberg S, Östlund I et al. Metabolic acidosis at birth and suboptimal care – illustration of the gap between knowledge and clinical practice.BJOG. 2009;116: 1453-60. 3. Donn SM, Chiswick ML, Fanaroff JM. Medico-legal implications of hypoxic–ischemic birth injury. Semin Fetal Neonatal Med. 2014;19: 317-21. 4. Hagberg B, Hagberg G, Beckung E et al. Changing panorama of cerebral palsy in Sweden. VIII. Prevalence and origin in the birth year period 1991–94. Acta Paediatr. 2001;90: 271-7. 5. Kumar S, Paterson-Brown S. Obstetric aspects of hypoxic ischemic encephalopathy. Early Hum Dev. 2010;86: 339-44. 6. Himmelmann K, Uvebrant P. The panorama of cerebral palsy in Sweden. XI. Changing patterns in the birth-year period 2003–2006. Acta Paediatr. 2014;103: 618-24. 7. Alfirevic Z, Devane D, Gyte GM. Continuous cardiotocography (CTG) as a form of electronic fetal monitoring (EFM) for fetal assessment during labour. Cochrane Database Syst Rev. 2013;5: CD006066. 8. Sadler TW. Langman's essential medical embryology 2005, Lippincott Williams and Wilkins. 9. Kaufmann P, Black S, Huppertz B. Endovascular trophoblast invasion: implications for the pathogenesis of intrauterine growth retardation and preeclampsia. Biol Reprod. 2003;69: 1-7. 10. Odibo AO, Zhong Y, Longtine M et al. First-trimester serum analytes, biophysical tests and the association with pathological morphometry in the placenta of pregnancies with preeclampsia and fetal growth restriction. Placenta. 2011;32: 333-8. 11. Kovo M, Schreiber L, Ben-Haroush A et al. The placental component in early-onset and late-onset preeclampsia in relation to fetal growth restriction. Prenat Diagn. 2012;32: 632-7. 12. Janbu T, Nesheim BI. Uterine artery blood velocities during contractions in pregnancy and labour related to intrauterine pressure. Br J Obstet Gynaecol. 1987;94: 1150-5. 13. Huang BY, Castillo M. Hypoxic-Ischemic Brain Injury: imaging findings from birth to adulthood. RadioGraphics. 2008;28: 417-39. 14. NICE Guidelines UK -- Intrapartum care 2014. www.nice.org.uk/guidance 15. Ananth CV, Chauhan SP, Chen HY et al. Electronic fetal monitoring in the United States: temporal trends and adverse perinatal outcomes. Obstet Gynecol. 2013;121: 927-33. 16. Williams B, Arulkumaran S. Cardiotocography and medicolegal issues. Best Pract Res Clin Obstet Gynaecol. 2004;18: 457-66.

177
17. Neilson JP. Fetal electrocardiogram (ECG) for fetal monitoring during labour. Cochrane Database Syst Rev. 2013; 5:CD000116. 18. Mahendru AA, Lees CC. Is intrapartum fetal blood sampling a gold standard diagnostic tool for fetal distress? Eur J Obstet Gynecol Reprod Biol. 2011;156: 137-9. 19. East CE, Leader LR, Sheehan P et al. Intrapartum fetal scalp lactate sampling for fetal assessment in the presence of a non-reassuring fetal heart rate trace. Cochrane Database Syst Rev. 2010;17: CD006174 . 20. Kuhnert M. Guidelines for the use of fetal pulse oximetry during labour and delivery. Prenat Neonatal Med. 1998;3: 432–3. 21. East CE, Chan FY, Colditz PB et al. Fetal pulse oximetry for fetal assessment in labour. Cochrane Database Syst Rev. 2007;18: CD004075. 22. East CE, Begg L, Colditz PB et al. Fetal pulse oximetry for fetal assessment in labour. Cochrane Database Syst Rev. 2014;10: CD004075. 23. Woo J et al. A short History of the development of Ultrasound in Obstetrics and Gynecology www.ob-ultrasound.net/history. 24. Curie. J.P. C. Développement par pression de l'é'lectricite polaire dans les cristaux hémièdres à faces inclinées. Acad Sci (Paris) 91:294. 25. Donald I, MacVicar J, Brown, TG. Investigation of abdominal masses by pulsed ultrasound. Lancet. 1958;1: 1188-1195. 26. Donald I. Clinical applications of ultrasonic techniques in obstetrical and gynaecological diagnosis. J Obstet Gynaecol Br Emp. 1962;69: 1036. 27. Bhide, Acharya G, Bilardo CM et al. ISUOG Practice Guidelines: use of Doppler ultrasonography in obstetrics. Ultrasound Obstet Gynecol. 2013;41: 233-9. 28. WFUMB Symposium on Safety of Ultrasound in Medicine.Conclusions and recommendation on thermal and non-thermal mechanisms for biological effects of ultrasound. World Federation for Ultrasound in Medicine and Biology. Ultrasound Med Biol. 1998;24: S1-58. 29. Zhu J, Lin J, Zhu Z et al. Effects of diagnostic levels of colour Doppler ultrasound energy on the cell cycle of newborn rats. J Ultrasound Med. 1999;18: 257-60. 30. Torloni MR, Vedmedovska N, Merialdi M et al. Safety of ultrasonography in pregnancy: WHO systematic review of the literature and meta-analysis. Ultrasound Obstet Gynecol. 2009;33: 599-608. 31. Bakker M, Pajkrt E, Bilardo CM. Increased nuchal translucency with normal karyotype and anomaly scan: What next? Best Pract Res Clin Obstet Gynaecol. 2014;28: 355-66. 32. Callen P.W Ultrasonography in Obstetrics and Gynaeclogy. 5th Edition;2008, Saunders Elsevier.

178
33. Ben-Haroush A, Yogev Y, Bar J et al. Accuracy of sonographically estimated fetal weight in 840 women with different pregnancy complications prior to induction of labor. Ultrasound Obstet Gynecol. 2004;23: 172-6. 34. Damodaram M, Story L, Kulinskaya E et al. Early adverse perinatal complications in preterm growth-restricted fetuses. Aust N Z J Obstet Gynaecol. 2011;51: 204-9. 35. Danielian PJ, Allman AC, Steer PJ. Is obstetric and neonatal outcome worse in fetuses who fail to reach their own growth potential? . Br J Obstet Gynaecol. 1992;99: 452-4. 36. Brace RA, Wolf EJ. Normal amniotic fluid volume changes throughout pregnancy. Am J Obstet Gynecol. 1989;161: 382-8. 37. Manning FA, Hill LM, Platt LD. Qualitative amniotic fluid volume determination by ultrasound: antepartum detection of intrauterine growth retardation. Am J Obstet Gynecol. 1981;139: 254-8. 38. Manning FA, Platt LD, Sipos L. Antepartum fetal evaluation: Development of a fetal biophysical profile. Am J Obstet Gynecol. 1980; 136: 787-95. 39. Chamberlain PF, Manning FA, Morrison I et al. Ultrasound evaluation of amniotic fluid volume.I. The relationship of marginal and decreased amniotic fluid volumes to perinatal outcome. Am J Obstet Gynecol. 1984;150: 245-9. 40. Bar-Hava I, Divon MY, Sardo M. Is oligohydramnios in posteterm pregnancy associated with redistribution of cerebral blood flow? Am J Obstet Gynecol. 1995;173: 519-22. 41. Selam B, Koksal R, Ozcan T. Fetal arterial and venous Doppler parameters in the interpretation of oligohydramnios in postterm pregnancies. Ultrasound Obstet Gynecol. 2000;15: 403-6. 42. Ciftci AO, Tanyel FC, Ercan MT et al. In utero defecation by the normal fetus: a radionuclide study in the rabbit. J Pediatr Surg.1996;31: 1409–12. 43. Steer PJ, Eigbe F, Lissauer TJ et al. Interrelationships among abnormal cardiotocograms in labor, meconium staining of the amniotic fluid, arterial cord blood pH, and Apgar scores. Obstet Gynecol. 1989;74: 715-21. 44. Dargaville PA, Copnell B. The epidemiology of meconium aspiration syndrome: incidence, risk factors, therapies, and outcome. Pediatrics. 2006;117: 1712–21. 45. Beligere N, Rao R. Neurodevelopmental outcome of infants with meconium aspiration syndrome: report of a study and literature review. J Perinatol. 2008;28: S93-101. 46. Pariente G, Peles C, Perri ZH et al. Meconium-stained amniotic fluid - risk factors and immediate perinatal outcomes among SGA infants. J Matern Fetal Neonatal Med. 2015;28: 1064-7. 47. Nicolaides KH. Placental and fetal Doppler: The Parthenon Publishing Group; 2000. 48. Abuhamad AZ. The Role of Doppler ultrasound in Obstetrics. Ultrasonography in Obstetrics and Gynaecology 2008; 5th editon Saunders Elsevier: pages 794 -807.

179
49. Lees C, Albaiges G, Deane C et al. Assessment of umbilical arterial and venous flow using color Doppler. Ultrasound Obstet Gynecol.1999;14: 250-5. 50. Parra-Cordero M, Lees C, Missfelder-Lobos H et al. Fetal arterial and venous Doppler pulsatility index and time averaged velocity ranges. Prenatal Diagn.2007;27: 1251-7. 51. Baschat AA. Examination of the fetal cardiovascular system. Semin Fetal Neonatal Med 2011;16 :2-12. 52. Alfirevic Z, Stampalija T, Gyte GM. Fetal and umbilical Doppler ultrasound in high-risk pregnancies. Cochrane Database Syst Rev 2010;20: CD007529. 53. Ogunyemi D, Stanley R, Lynch C et al. Umbilical artery velocimetry in predicting perinatal outcome with intrapartum fetal distress. Obstet Gynecol. 1992;80: 377-80. 54. Siristatidis C, Salamalekis E, Kassanos D et al. Evaluation of fetal intrapartum hypoxia by middle cerebral and umbilical artery Doppler velocimetry with simultaneous cardiotocography and pulse oximetry. Arch Gynecol Obstet. 2004;270: 265-70. 55. Farrell T Chien PF, Gordon A. Intrapartum umbilical artery Doppler velocimetry as a predictor of adverse perinatal outcome: a systematic review. Br J Obstet Gynaecol. 1999;106: 783-92. 56. Flood K, Unterscheider J, Daly S et al. The role of brain sparing in the prediction of adverse outcomes in intrauterine growth restriction: results of the multicenter PORTO Study. Am J Obstet Gynecol. 2014;211: 288.e1-5. 57. Schenone MH, Mari G. The MCA Doppler and its role in the evaluation of fetal anemia and fetal growth restriction. Clin Perinatol. 2011;38: 83-102. 58. Harman CR, Baschat AA. Comprehensive assessment of fetal wellbeing: which Doppler tests should be performed? Curr Opin Obstet Gynecol . 2003;15: 147-57. 59. Mari G, Deter RL. Middle cerebral artery flow velocity waveforms in normal and small-for-gestational-age fetuses. Am J Obstet Gynecol. 1992;166: 1262-70. 60. Mari G, Hanif F. Fetal Doppler: Umbilical Artery, Middle Cerebral Artery, and Venous System. Semin Perinatol. 2008;32: 253-7. 61. Thornburg KL. Fetal response to intrauterine stress. Ciba Found Symp.1991;156: 17-29. 62. Wladimiroff JW, vd Wijngaard JA, Degani S et al. Cerebral and umbilical arterial blood flow velocity waveforms in normal and growth-retarded pregnancies. Obstet Gynecol. 1987;69: 705-9. 63. Arbeille P RA, Berson M, Patat F et al. Exploration of the fetal cerebral flow by duplex Doppler linear array system in normal and pathological pregnancies. Ultrasound Med Biol. 1987;13: 329-37. 64. Khalil A, Thilaganathan B. Role of uteroplacental and fetal Doppler in identifying fetal growth restriction at term. Best Pract Res Clin Obstet Gynaecol. 2017;38: 38-47.

180
65. Dunn L, Sherrell H, Kumar S. Review: Systematic review of the utility of the fetal cerebroplacental ratio measured at term for the prediction of adverse perinatal outcome. Placenta. 2017;S0143-4004: 30149-2. 66. Ebbing C, Rasmussen S, Kiserud T. Middle cerebral artery blood flow velocities and pulsatility index and the cerebroplacental pulsatility ratio: longitudinal reference ranges and terms for serial measurements. Ultrasound Obstet Gynecol. 2007;30: 287-96. 67. Bahado-Singh RO, Kovanci E, Jeffres A et al. The Doppler cerebroplacental ratio and perinatal outcome in intrauterine growth restriction. Am J Obstet Gynecol. 1999;180: 750-6. 68. Siristatidis C, Kassanos D, Salamalekis G et al. Cardiotocography alone versus cardiotocography plus Doppler evaluation of the fetal middle cerebral and umbilical artery for intrapartum fetal monitoring: a Greek prospective controlled trial. J Matern Fetal Neonatal Med. 2012;25: 1183-7. 69. Prior T, Mullins E, Bennett P et al. Prediction of intrapartum fetal compromise using the cerebroumbilical ratio: a prospective observational study. Am J Obstet Gynecol. 2013;208: 124 e1-6. 70. Tchirikov M, Rybakowski C, Hüneke B et al. Blood flow through the ductus venosus in singleton and multifetal pregnancies and in fetuses with intrauterine growth retardation. Am J Obstet Gynecol .1998;178: 943-9. 71. Tchirikov M, Schröder HJ, Hecher K. Ductus venosus shunting in the fetal venous circulation: regulatory mechanisms, diagnostic methods and medical importance. Ultrasound Obstet Gynecol 2006;27: 452-61. 72. Baschat AA. Ductus venosus Doppler for fetal surveillance in high-risk pregnancies. Clin Obstet Gynecol 2010;53: 858-68. 73. Matias A, Gomes C, Flack N et al. Screening for chromosomal abnormalities at 10–14 weeks: the role of ductus venosus blood flow. Ultrasound Obstet Gynecol. 1998;12: 380–384. 74. Maiz N, Plasencia W, Dagklis T et al. Ductus venosus Doppler in fetuses with cardiac defects and increased nuchal translucency thickness. Ultrasound Obstet Gynecol. 2008;31: 256–260. 75. Martınez JM, Comas M, Borrell A et al. Abnormal first-trimester ductus venosus blood flow: a marker of cardiac defects in fetuses with normal karyotype and nuchal translucency. Ultrasound Obstet Gynecol. 2010;35: 267–272. 76. Borrell A, Grande M, Bennasar M et al. First-trimester detection of major cardiac defects with the use of ductus venosus blood flow. Ultrasound Obstet Gynecol. 2013;42: 51-7. 77. Maiz N, Nicolaides KH. Ductus venosus in the first trimester:contribution to screening of chromosomal, cardiac defects and monochorionic twin complications. Fetal Diagn Ther.2010;28: 65–71. 78. Crispi F, Gratacós E. Fetal cardiac function: Technical considerations and potential research and clinical applications. Fetal Diagn Ther. 2012;32: 47-64.

181
79. Crispi F, Figueras F, Cruz-Lemini M et al. Cardiovascular programming in children born small for gestational age and relationship with prenatal signs of severity. Am J Obstet Gynecol. 2012;207: 121. e1-9. 80. Crispi F, Hernandez-Andrade E, Pelsers MM et al. Cardiac dysfunction and cell damage across clinical stages of severity in growth-restricted fetuses. Am J Obstet Gynecol 2008;199: 254.e1-8 81. Mielke G, Benda N. Cardiac output and central distribution of blood flow in the human fetus. Circulation. 2001;103: 1662-8. 82. Holzmann M, Cnattingius S, Nordström L. Lactate production as a response to intrapartum hypoxia in the growth-restricted fetus. BJOG. 2012;119: 1265-9. 83. Herrera EA, Camm EJ, Cross CM et al. Morphological and functional alterations in the aorta of the chronically hypoxic fetal rat. J Vasc Res. 2012: 50–8. 84. Herrera EA, Pulgar VM, Riquelme RA et al. High-altitude chronic hypoxia during gestation and after birth modifies cardiovascular responses in newborn sheep. Am J Physiol Regul Integr Comp Physiol. 2007;292: 2234-40. 85. Pulgar VM, Zhang J, Massmann GA et al. Mild chronic hypoxia modifies the fetal sheep neural and cardiovascular responses to repeated umbilical cord occlusion. Brain Res.2007;1176: 18-26. 86. Tchirikov M, Strohner M, Scholz A. Cardiac output and blood flow volume redistribution during acute maternal hypoxia in fetal sheep. J Perinat Med.2010;38: 387-92. 87. Kiserud T, Ebbing C, Kessler J et al. Fetal cardiac output, distribution to the placenta and impact of placental compromise. Ultrasound Obstet Gynecol . 2006;28: 126-36. 88. Hecher K, Campbell S, Doyle P et al. Assessment of fetal compromise by Doppler ultrasound investigation of the fetal circulation. Arterial, intracardiac and venous blood flow velocity studies. Circulation. 1995;91: 129-38. 89. Makikallio K, Vuolteenaho O, Jouppila P et al. Ultrasonographic and biochemical markers of human fetal cardiac dysfunction in placental insufficiency. Circulation. 2002;105: 2058-63. 90. Soothill PW, Bobrow CS, Holmes R et al. Small for gestational age is not a diagnosis. Ultrasound Obstet Gynecol.1999;13: 225-8. 91. Eixarch E, Meler E, Iraola A et al. Neurodevelopmental outcome in 2-year-old infants who were small-for-gestational age term fetuses with cerebral blood flow redistribution. Ultrasound Obstet Gynecol. 2008;32: 894-9. 92. Illa M, Coloma JL, Eixarch E et al. Growth deficit in term small-for-gestational fetuses with normal umbilical artery Doppler is associated with adverse outcome. J Perinat Med. 2009;37: 48-52. 93. Figueras F, Oros D, Cruz-Martinez R et al. Neurobehavior in Term, Small-for-Gestational Age Infants With Normal Placental Function. Pediatrics. 2009;124: e934-e41.

182
94. Cruz-Martinez R, Figueras F, Hernandez-Andrade E et al. Changes in myocardial performance index and aortic isthmus and ductus venosus Doppler in term, small-for-gestational age fetuses with normal umbilical artery pulsatility index. Ultrasound Obstet Gynecol. 2011;38: 400-5. 95. Comas M, Crispi F, Cruz-Martinez R et al. Tissue Doppler echocardiographic markers of cardiac dysfunction in small-for-gestational age fetuses. Am J Obstet Gynecol . 2011;205: 57.e1-.e6. 96. Parasuraman R. Comparison of the reproducibility of 2D doppler and 3D STIC in the measurement of fetal cardiac output. Open J Obstet Gynecol. 2011;1: 163-167. 97. Hadlock FP. Sonographic estimation of fetal age and weight. Radiol Clin North Am. 1990;28: 39 -44. 98. Snijders RJ, Nicolaides KH et al. Fetal biometry at 14-40 weeks gestation. Ultrasound Obstet Gynecol. 1994;4: 34-48. 99. Chitty LS, Altman DG. Charts of fetal size : limb bones. BJOG. 2002;109: 919-29. 100. Andrews PJ, Ackerman WE, Juneja MM. Aorto caval compression in the sitting and lateral decubitus positions during extradural catheterplacement in the parturient. Can J Anaesth. 1993;40: 320-4. 101. Maulik D, Yarlagadda P, Downing G. Doppler velocimetry in Obstetrics. Obstet Gynaecol Clin North Am. 1990;17: 163-86. 102. Bewley S, Campbell S, Cooper D. Uteroplacental Doppler flow velocity waveforms in the second trimester. Br J Obstet Gynaecol. 1989;96: 1040-6. 103. Hernandez-Andrade E, Benavides-Serralde JA, Cruz-Martinez R et al. Evaluation of conventional Doppler fetal cardiac function parameters: E/A ratios, outflow tracts, and myocardial performance index. Fetal Diagn Ther. 2012;32: 22-9. 104. DeVore GR. Assessing fetal cardiac ventricular function. Semin Fetal Neonatal Med. 2005;10: 515-41. 105. Ghawi H, Gendi S, Mallula K et al. Fetal Left and Right Ventricle Myocardial Performance Index: Defining Normal Values for the Second and Third Trimesters—Single Tertiary Center Experience. Pediatr Cardiol. 2013;34: 1808-15. 106. De Smedt MC, Visser GH, Meijboom EJ. Fetal cardiac output estimated by Doppler echocardiography during mid- and late gestation. Am J Cardiol. 1987;60: 338-42. 107. NICE. Clinical guideline 55: Intrapartum care. 2007: www.nice.org.uk/guidance/cg5. 108. NICE Guideline 55: Intrapartum care. 2007: 109. Garite TJ, Dildy GA, McNamara H et al. A multicenter controlled trial of fetal pulse oximetry in the intrapartum management of nonreassuring fetal heart rate patterns. Am J Obstet Gynecol. 2000;183: 1049-58.

183
110. Ludford I, Scheil W, Tucker G et al. Pregnancy outcomes for nulliparous women of advanced maternal age in South Australia, 1998–2008. Aust N Z J Obstet Gynaecol. 2012;52: 235-41. 111. Compendium of Maternity Statistics England,April 2015; Health and Social Care Information Centre. www.hscic.gov.uk/pubs/compmaternity. 112. Wood S, Cooper S, Ross S. Does induction of labour increase the risk of caesarean section? A
systematic review and meta-analysis of trials in women with intact membranes. BJOG. 2014;121: 674-85. 113. Nippita TA, Lee YY, Patterson JA et al. Variation in hospital caesarean section rates and obstetric outcomes among nulliparae at term: a population-based cohort study.BJOG.2015;122: 702-11. 114. Arulkumaran S, Gibb DM, Lun KC et al. The effect of parity on uterine activity in labour. Br J Obstet Gynaecol.1984;91: 843-8. 115. Davies DP, Senior N, Cole G et al. Size at birth of Asian and White Caucasian babies born in Leicester: implications for obstetric and paediatric practices. Early Hum Dev. 1982;6: 257-63. 116. Carberry AE, Gordon A, Bond DM et al. Customised versus population-based growth charts as a screening tool for detecting small for gestational age infants in low-risk pregnant women. Cochrane Database Syst Rev.2014;16: CD008549. 117. Wells JC, Sharp G, Steer PJ et al. Paternal and Maternal Influences on Differences in Birth Weight between Europeans and Indians Born in the UK. PloS One. 2013;8: e61116. 118. Zipursky AR, Park AL, Urquia ML et al. Influence of paternal and maternal ethnicity and ethnic enclaves on newborn weight. J Epidemiol Community Health. 2014;68: 942-949. 119. Akolekar R, Sarno L, Wright A et al. Fetal middle cerebral artery and umbilical artery pulsatility index: effects of maternal characteristics and medical history. Ultrasound Obstet Gynecol . 2015;45: 402-8. 120. Spencer K, Heath V, El-Sheikhah A et al. Ethnicity and the need for correction of biochemical and ultrasound markers of chromosomal anomalies in the first trimester: a study of Oriental, Asian and Afro-Caribbean populations. Prenat Diagn.2005;25: 365-9. 121. Quattrocchi T, Baviera G, Pochiero T et al. Maternal Serum PAPP-A as an Early Marker of Obstetric Complications? Fetal Diagn Ther.2015;37: 33-6. 122. Small-for-Gestational Age Fetus, Investigation and Management(Green top Guideline No.31). RCOG -UK, February 2013 www.rcog.org.uk/en/guidelines-research-services/guidelines/gtg31. 123. Prior T, Mullins E, Bennett P et al. Are 1st-trimester beta-human chorionic gonadotrophin and pregnancy-associated plasma protein A levels predictive of intrapartum fetal compromise in a selected normal population? Aust N Z J Obstet Gynaecol. 2014;54: 600-1. 124. To WW, Chan AM, Mok KM. Use of umbilical-cerebral Doppler ratios in predicting fetal growth restriction in near-term fetuses. Aust N Z J Obstet Gynaecol. 2005;45: 130-6.

184
125. Van Wassenaer-Leemhuis AG, Marlow N, Lees C, Wolf H; TRUFFLE investigators. The association of neonatal morbidity with long-term neurological outcome in infants who were growth restricted and preterm at birth: secondary analyses from TRUFFLE (Trial of Randomized Umbilical and Fetal Flow in Europe). BJOG. 2017;10: 1111/1471-0528. 126. Kassanos D, Siristatidis C, Vitoratos N et al. The clinical significance of Doppler findings in fetal middle cerebral artery during labor. Eur J Obstet Gynecol Reprod Biol. 2003;109: 45-50. 127. Habek D, Hodek B, Herman R et al. Fetal Biophysical Profile and Cerebro-Umbilical Ratio in Assessment of Perinatal Outcome in Growth-Restricted Fetuses. Fetal Diagn Ther.2003;18: 12-6. 128. DeVore GR. The importance of the cerebroplacental ratio in the evaluation of fetal well-being in SGA and AGA fetuses. Am J Obstet Gynecol. 2015;213: 5-15. 129. Ropacka-Lesiak M, Korbelak T, Świder-Musielak J et al. Cerebroplacental ratio in prediction of adverse perinatal outcome and fetal heart rate disturbances in uncomplicated pregnancy at 40 weeks and beyond. Arch Med Sci. 2015;11: 142-8. 130. Twomey S, Flatley C, Kumar S. The association between a low cerebro-umbilical ratio at 30-34 weeks gestation, increased intrapartum operative intervention and adverse perinatal outcomes. Eur J Obstet Gynecol Reprod Biol. 2016;203: 89-93. 131. Murphy PJ. The fetal circulation. Continuing Education in Anaesthesia, Critical Care & Pain. 2005;5: 107-12. 132. Herrera EA, Camm EJ, Cross CM et al. Morphological and functional alterations in the aorta of the chronically hypoxic fetal rat. J Vasc Res. 2012;49: 50-8. 133. Weissler AM, Peeler RG, Roehll WH Jr. Relationship between LVET, stroke volume and heart rate in normal individuals and patients with cardiovascular disease. Am Heart J.1961;62: 367-78. 134. Weil SR, Russo PA, Heckman JL. Pressure-volume relationship of the fetal lamb heart. Ann Thorac Surg. 1993;55: 470-5. 135. Kirkpatrick SE, Pitlick PT, Naliboff J et al. Frank-Starling relationship as an important determinant of fetal cardiac output. Am J Physiol.1976;231: 495-500. 136. Reller MD, Morton MJ, Thornburg KL. Right ventricular function in the hypoxemic fetal sheep. J Dev Physiol. 1986;8: 159-166. 137. Alonso JG, Okai T, Longo LD et al. Cardiac function during long-term hypoxemia in fetal sheep. Am J Physiol.1989;257: H581-H589. 138. Gilbert RD. Effects of afterload and baro receptors on cardiac function in fetal sheep. JDevPhysiol. 1982;4: 299 -309. 139. Alonso JG, Okai T, Longo LD, Gilbert RD . Cardiac function during long term hypoxemia in fetal sheep. Am J Physiol.1989; 257: h581-9. 140. Adachi H, Strauss W, Ochi H et al. The effect of hypoxia on the regional distribution of cardiac output in the dog. Circ Res. 1976;39: 314-319.

185
141. Cohn HE, Piasecki GJ, Jackson BT. The effect of fetal heart rate on cardiovascular function during hypoxemia. Am J Obstet Gynecol.1980;138: 1190-9. 142. Manning FA, Platt LD, Sipos L. Antepartum fetal evaluation: development of a fetal biophysical profile. Am J Obstet Gynecol.1980; 136: 787-95. 143. Lee KA, Mi Lee S, Jin Yang H et al. The frequency of meconium-stained amniotic fluid increases as a function of the duration of labor. J Matern Fetal Neonatal Med. 2011;24: 880-885. 144. Berkus MD, Langer O, Samueloff A et al. Meconium-stained amniotic fluid: increased risk for adverse neonatal outcome. Obstet Gynecol. 1994;84: 115-120. 145. Becker S, Solomayer E, Dogan C et al. Meconium-stained amniotic fluid-perinatal outcome and obstetrical management in a low-risk suburban population. Eur J Obstet Gynecol Reprod Biol. 2007;132: 46-50. 146. Hiersch L, Krispin E, Aviram A et al. Effect of Meconium-Stained Amniotic Fluid on Perinatal Complications in Low-Risk Pregnancies at Term. Am J Perinatol. 2016;33: 378-384. 147. Malin GL, Morris RK, Khan KS. Strength of association between umbilical cord pH and perinatal and longterm outcomes: systematic review and meta-analysis BMJ.2010;13: 340: c1471. 148. Colman A, Maharaj D, Hutton J et al. Reliability of ultrasound estimation of fetal weight in term singleton pregnancies. . N Z Med J.2006;119: U2146. 149. Scioscia M, Vimercati A, Ceci O et al. Estimation of birth weight by two-dimensional ultrasonography: a critical appraisal of its accuracy. Obstet Gynecol. 2008;111: 57-65. 150. Visser GH, Ayres-de-Campos; FIGO Intrapartum Fetal Monitoring Expert Consensus Panel. FIGO consensus guidelines on intrapartum fetal monitoring:Adjunctive technologies. Int J Gynaecol Obstet. 2015;131: 25-29. 151. Rizzo G, Capponi A, Cavicchioni O et al. Fetal cardiac stroke volume determination by four-dimensional ultrasound with spatio-temporal image correlation compared with two-dimensional and Doppler ultrasonography. Prenat Diagn. 2007;27: 1147-50. 152. Molina FS, Faro C, Sotiriadis A et al. Heart stroke volume and cardiac output by four-dimensional ultrasound in normal fetuses. Ultrasound Obstet Gynecol. 2008;32: 181-7. 153. Simioni C, Nardozza LM, Araujo Júnior E et al. Heart stroke volume, cardiac output, and ejection fraction in 265 normal fetus in the second half of gestation assessed by 4D ultrasound using spatio-temporal image correlation. J Matern Fetal Neonatal Med. 2011;24: 1159-67. 154. Gardiner HM. Foetal cardiac function: assessing new technologies. Cardiol Young 2014;24: 26-35. 155. Villar J, Valladares E, Wojdyla D et al. Caesarean delivery rates and pregnancy outcomes: the 2005 WHO global survey on maternal and perinatal health in Latin America. Lancet. 2006;367: 1819-29.

186
156. Althabe F, Sosa C, Belizán JM et al. Cesarean Section Rates and Maternal and Neonatal Mortality in Low-, Medium-, and High-Income Countries: An Ecological Study. Birth. 2006;33: 270-7. 157. Gibbons L. The Global Numbers and Costs of Additionally Needed and Unnecessary Caesarean Sections Performed per Year: Overuse as a Barrier to Universal Coverage. World Health Report (2010) Background Paper, 30. 158. Molina G, Weiser TG, Lipsitz SR et al. Relationship Between Cesarean Delivery Rate and Maternal and Neonatal Mortality. JAMA . 2015;314: 2263-70. 159. Liu S, Liston RM, Joseph KS et al. Maternal mortality and severe morbidity associated with low-risk planned cesarean delivery versus planned vaginal delivery at term. CMAJ. 2007;176: 455-60. 160. Lawn JE, Blencowe H, Waiswa P et al. Stillbirths: rates, risk factors, and acceleration towards 2030. Lancet. 2016;387: 587-603. 161. Birth characteristics in England and Wales 2014. www.gov.uk/government/characteristics-of-birth-1-england-and-wales-2014. 162. Bricker L, Medley N, Pratt JJ. Routine ultrasound in late pregnancy (after 24 weeks' gestation). Cochrane Database Syst Rev. 2015;29: CD 001451. 163. Sovio U, White IR, Dacey A et al. Screening for fetal growth restriction with universal third trimester ultrasonography in nulliparous women in the Pregnancy Outcome Prediction (POP) study: a prospective cohort study. Lancet. 2015;386: 2089–2097. 164. Roma E, Arnau A, Berdala R et al. Ultrasound screening for fetal growth restriction at 36 vs 32 weeks' gestation: a randomized trial (ROUTE). Ultrasound Obstet Gynecol.2015; 46: 391-7. 165. Akolekar R, Tokunaka M, Ortega N et al. Prediction of stillbirth from maternal factors, fetal biometry and uterine artery Doppler at 19–24 weeks. Ultrasound Obstet Gynecol.2016; 48: 624-30. 166. Girsen A, Ala-Kopsala M, Mäkikallio K et al. Cardiovascular hemodynamics and umbilical artery N-terminal peptide of proB-type natriuretic peptide in human fetuses with growth restriction. Ultrasound Obstet Gynecol. 2007;29: 296-303.

187
Permissions for using figures and tables

188

189

190

191

192

193

194

195

196

197
From: Rights and Permissions <[email protected]>
Date: 29 January 2017 at 10:46:17 GMT
To: "[email protected]" <[email protected]>
Subject: AW: Requested Karger Material
Dear Dr. Paramasivam, Thank you for your email. As to your request, I am pleased to inform you that permission is granted to
use Table 1 from the article
Fetal Cardiac Function: Technical Considerations and Potential Research and Clinical Applications Crispi F. · Gratacós E. Fetal Diagn Ther 2012;32:47–64 (DOI:10.1159/000338003) to be included in your PhD thesis entitled "Ultrasound assessment of fetal cardiac function and risk of adverse obstetric and neonatal outcomes in term fetuses", provided that proper credit will be given to the original source and that S. Karger AG, Basel will be mentioned.
Please note that this is a non-exclusive permission, hence any further use, edition, translation or
distribution, either in print or electronically, requires written permission again as this permission is
valid for the above mentioned purpose only.
This permission applies only to copyrighted content that S. Karger AG owns, and not to copyrighted
content from other sources. If any material in our work appears with credit to another source, you
must also obtain permission from the original source cited in our work. All content reproduced from
copyrighted material owned by S. Karger AG remains the sole and exclusive property of S. Karger AG.
The right to grant permission to a third party is reserved solely by S. Karger AG.
Thank you for your understanding and cooperation.
Hopefully, I have been of assistance to you with the above.
Yours sincerely,
Silvia Glücklich
Rights Manager
S. Karger AG, Medical and Scientific Publishers, Allschwilerstrasse 10, 4009 Basel, Switzerland
t +41 61 306 14 75, f +41 61 306 12 34, www.karger.com

198
APPENDICES Appendix A: Information sheet for volunteers Study title: “Ultrasound assessment of fetal cardiac function and risk of adverse obstetric and neonatal outcomes in term fetuses." Invitation to take part You are invited to participate in a research study. Before you decide, it is important for you to understand why the research is being done and what it will involve. Please take the time to read the following information. Ask us if there is anything that is not clear or if you would like more information. What is the purpose of this study? Blood flow to baby’s organs is known to change during periods of stress. These changes are particularly marked in small fetuses. Some babies become stressed during labour. We want to determine if ultrasound assessment of blood flow in the umbilical artery, brain and to the heart at the start of labour are predictive of obstetric and neonatal complications. If we have a way of identifying babies likely to become distressed in labour, it will help us better manage these pregnancies and hopefully improve the outcome for these babies. Why have I been chosen? You have been selected because you are in early labour or are likely to go into labour within 48 -72 hours. Do I have to take part? It is up to you to decide whether to participate. If you do, you will be asked to sign a consent form. If you choose not to, you will continue to receive standard management and will not affect the care you receive during the pregnancy. What will happen to me if I take part? If you decide to participate, you will be given this information sheet to keep, and we will ask you to sign a consent form. We will then perform a short ultrasound scan of your baby (lasting around 15-20 minutes). We will measure the size of your baby, amniotic fluid volume, blood flow in various vessels and fetal cardiac output. Once this is done your labour will be managed in the usual manner. The information obtained from the ultrasound scan will not be available to either the doctors or midwives looking after you. We would also take a drop of blood from your baby’s heel (heel prick test) within the first 24 hours after birth. This method of taking blood from a baby is very safe and is used routinely. You may be contacted following delivery regarding the development of the baby. All babies born to mothers recruited in this study will have heel prick samples performed at 24 hours of life to obtain dried blood spots for later analysis. Are there any side effects of obstetric ultrasound? There are no published serious side effects with antenatal ultrasound.

199
What are the possible benefits of taking part? There are no immediate benefits to you from taking part. However, the information gathered from this study may be of benefit for other pregnancies. Will my participation in this study kept confidentially? The information obtained from your study is covered by the Data Protection Act. The digital information is protected by software and hardware barrier, and the records are handled in the same way as hospital records. We also seek permission to include clinical details about your pregnancy in the study, for instance, your gestation and medical history. Who is organising the research? The Centre for Fetal Care at Queen Charlotte’s and Chelsea Hospital, Imperial College Healthcare Trust is organising this research. Who has reviewed this study? This study has been reviewed by the principal investigator and his collaborators. The London Research Ethics Committee has approved this research. What if something goes wrong? In the unlikely event of suffering adverse effects because of your participation in the study, you will be compensated through the Imperial College London's "No-fault Compensation scheme." What will happen to the results of the research study? The results from this study may be published in the medical literature. No patient's names or identifiable data will be included in the publication. Contact for Further Information Dr Gowri Paramasivam Clinical Research Fellow Centre for Fetal Care, Queen Charlotte’s and Chelsea Hospital Du Cane Road, London –W12 0HS Phone: 0208 3833998, Fax: 0208 3833507 Email: [email protected] Dr Sailesh Kumar Senior Lecturer/Consultant in Maternal and Fetal Medicine Centre for Fetal Care, Queen Charlotte’s and Chelsea Hospital Email: [email protected] Prof Phillip Bennett Consultant in Obstetrics Queen Charlotte’s and Chelsea Hospital Phone: 0208 3833998, Fax: 0208 3833507 Email: [email protected]

200
Appendix B Patient Consent form for inclusion in UA/MCA ratio and Fetal cardiac function assessment study. I …………………………………. have read the attached information sheet regarding the study
“Ultrasound assessment of fetal cardiac function and risk of adverse obstetric and neonatal
outcomes in term fetuses” and I would like to participate.
Signed Patient______________________________ Date______________________ Person taking Consent__________________ Date______________________

201
Appendix C Fetal Doppler/ Fetal cardiac function study Maternal Demographics Hospital Number__________ DOB___________
Age____________ Ethnicity_________ BMI____________ Smoker YES/NO Partner Yes/No Weight in Labour_______ Parity__________ Previous SB/IUGR______ Booking BP____ Raised BP in pregnancy___ Pre-existing medical condition ___________________________ Date of booking Scan ___________________________ Labour Details Spontaneous labour YES/NO Induction YES/NO If Yes Indication ___________________________ Gestation at IOL/onset of labour ____________ Membranes: Intact/Ruptured At ROM Liquor: CLEAR/MECI/MECII/MECIII Cervical Dilatation at time of USS ___________ Electronic fetal heart rate monitoring pre-labour YES/NO If Yes describe _________________________ Mode of Delivery: SVD/Forceps/Vacuum/Em.LSCS If instrumental/Em.LSCS why _____________________________ Intrapartum Hypertension YES/NO Meconium during labour YES/NO Intra-partum Pyrexia YES/NO Intrapartum Antibiotics YES/NO Associated Fetal Tachycardia YES/NO If Yes BR Rate_____________ Electronic fetal heart rate monitoring abnormalities YES/NO If yes describe___________________________________________________ FBS YES/NO Number_________ Results________________ Intrapartum haemorrhage YES/NO Intrapartum USS details Date of Scan____________
BPD HC AC
FL AFI DVP
EFW
Fetal Doppler Indices
Umbilical artery 1 2 3 MCA 1 2 3
PI PI

202
Cerebro Placental Ratio (CPR) = (MCA Pi /Umbilical artery Pi)
MCA Pi UA Pi CPR
MCA Pi UA Pi CPR
MCA Pi UA Pi CPR
Fetal Cardiac Function
Cardiac parameters 1 2 3
ICT
IRT
ET
MPI = ICT + IRT / ET
E/A Ratio Mitral valve
E/A Ratio Tricuspid valve
1 2 3 1 2 3
Heart rate at Aorta Heart rate at Pulmonary artery
Valve diameter Valve diameter
Valve area Valve area
Aortic Ejection velocity Pulmonary Ejection velocity
Aortic Ejection Time Pulmonary Ejection Time
VTI - Aorta VTI - Pulmonary artery
LV Stroke volume RV Stroke volume
Cardiac output (SV x HR) Cardiac output (SV x HR)
LCO/mL/min/kg RCO/mL/min/kg
Labour Outcome Date of Delivery __________ Gestation at delivery _______ Birth Weight__________ Apgar score: ____at 1m_____at 5min ______at 10 min_______ Cord Gases: pH_____ BE ______ Admission to NNU YES/NO Reason for admission ________________
Length of stay ________________ Ventilation ________________ Sepsis ________________ NEC ________________
Cranial USS/MRI ______________ Other complications ______________

203
Abbreviations FGR Fetal growth restriction
HII Hypoxic ischemic injury
ATP adenosine triphosphate
NMDA N-methyl d-aspartate
CTG Cardiotocography
bpm beats per minute
FHR Fetal heart rate
NICE National Institute for Health and Care Excellence
FBS Fetal blood sampling
ALARA As Low As Reasonably Achievable
SGA small for gestation age
MVP maximum vertical pool measurement
AFI Amniotic fluid index
MSAF Meconium stained amniotic fluid
Pi Pulsatility index
PSV Peak systolic velocity
MCA Pi Middle cerebral artery Pulsatility index
UA Pi Umbilical artery Pulsatility index
DV Ductus venosus
CPR Cerebroplacental ratio
C-U ratio cerebro-umbilical ratio
SV Stroke volume
LCO Left cardiac output
RCO Right cardiac output
CCO Combined cardiac output
MPI Myocardial performance index
EV Ejection velocity
ET Ejection time
VTI Velocity time integral
CS-FTP Emergency caesarean section for prolonged second stage of labour
CS-FD Emergency caesarean section for intrapartum fetal distress
Ins -FTP Instrumental delivery for prolonged second stage of labour
Ins -FD Instrumental delivery for intrapartum fetal distress
SVD Spontaneous vaginal delivery
M.O. D Mode of delivery
EFW Estimated fetal weight
ABW Actual birth weight
AFI Amniotic fluid index
DVP Deepest vertical pool
S.D Standard deviation
IQR Inter Quartile range
C.I Confidence interval
p value Probability value

204
Related Documents