ULTRASOUND ANALYSIS OF DIAPHRAGM KINETICS AND THE DIAGNOSIS OF AIRWAY OBSTRUCTION: THE ROLE OF THE M-MODE INDEX OF OBSTRUCTION1 ALESSANDRO ZANFORLIN,* ANDREA SMARGIASSI,y RICCARDO INCHINGOLO,y ALESSANDRO DI MARCO BERARDINO,y SALVATORE VALENTE,y and EMILIO RAMAZZINA* *Muldisciplinary Medicine Unit, General Hospital ‘‘San Luca,’’ Trecenta (Rovigo), Rovigo, Italy; and y Pulmonary Medicine Department, University Hospital ‘‘A. Gemelli,’’ Universit_a Cattolica del Sacro Cuore, Rome, Italy Abstract—Diaphragm motion in forced expiration can be analyzed using M-mode ultrasound in an anterior subcostal approach. Maximum expiratory diaphragmatic excursion (EDE Max ) and forced expiratory diaphragmatic excursion in the first second (FEDE 1 ) are considered the physiopathological analogues of vital capacity (VC) and forced expiratory volume in the first second (FEV 1 ). As the FEV 1 /VC % ratio is used as a marker of obstruction, our aim was to determine if the ratio FEDE 1 /EDE Max (M -mode index of obstruction [M IO]) differs between healthy subjects and patients with airway obstruction. One hundred twenty-four outpatients were examined by diaphragm ultrasound after spirometry. The MIO, expressed as the mean ± standard deviation (range), was 87.08 ± 6.64 (72.84–100) in the healthy group (N 5 61) and 67.09 ± 12.49 (33.33–91.30) in the group with obstructed airways (N 5 63). The difference between the two groups was significant (p , 0.0001), and MIO was significantly correlated with FEV 1 /VC (p , 0.0001). A M IO ,77 was identified as a possibile cutoff for suspecting an obstructive spirometric pattern with a 95.5% positive predictive value. The MIO can be interpreted as a speed index of diaphragmatic relaxation that seems to be slower in obstructed patients and could be used to screen for obstructed airway diseases. (E-mail: [email protected]) Key Words: Diaphragm, Ultrasound, Airway obstruction, Chronic obstructive pulmonary disease, Spirometry. INTRODUCTION The study of the diaphragm is a constantly evolving application of ultrasound. In transparietal longitudinal scan (in the presence of pleural effusions or in a zone in apposition to the rib cage), the diaphragm appears to be comprise three layers: a hypoechoic central layer bordered by two hyperechoic layers representing the interfaces of pleura and peritoneum (Ayoub et al. 1997a; Matamis et al. 2013). Some authors (Boussuges et al. 2009; Cohen et al. 1994a; Epelman et al. 2005; Gerscovich et al. 2001; Houston et al. 1992, 1994, 1995; Testa et al. 2011), although with different approaches, describe diaphragm visualization in a transhepatic scan using M-mode by directing the ultrasound beam perpendicular to the diaphragmatic dome (Fig. 1a). With this approach, the diaphragm appears as a thick hyperechoic line; the three layers are often not visible because the distance from the probe reduces the definition of the image. In this scan, the diaphragm becomes strongly hyperechoic because it represents the interface between liver and ventilated lung (Fig. 1b). However, this approach allows us to examine only the right hemidiaphragm (thanks to a good acoustic window provided by the liver); the left dome is often not accessible to ultrasound because of the presence of air in the bowel and stomach (Boussuges et al. 2009). Diaphragm movements can be measured by Mmode, a function that provides analysis of the trend of a vertical line of a B-mode scan as a function of time; in particular, we can examine diaphragmatic excursion as a function of time. During inspiration, the diaphragm descends, moving closer to the probe; during expiration, it rises, moving away from the probe. In the ultrasound M-mode representation, the diaphragm descends in expiration and rises in inspiration (Fig. 1b). In spontaneous breathing, it is possible to measure resting diaphragm excursion; when the patient breathes with forced inspiratory and expiratory maneuvers, it is possible to measure maximal diaphragmatic excursion. These data can be used to identify reduced diaphragm motility secondary to surgical procedures or neuromuscular diseases (Cohen et al. 1994b; Dorffner et al. 1998; Lloyd et al. 2006; McCauley and Labib 1984; Scillia et al. 2004; Wilcox and Pardy 1989). Previous studies have reported mean values of diaphragmatic excursion from 42 6 16 to 79 6 13 mm in forced breathing and from 11 6 4 to 21 6 6 mm in spontaneous breathing (Ayoub et al. 1997b, 2001; Boussuges et al. 2009; Cohen et al. 1994a; Harris et al. 1983; Houston et al. 1992, 1994, 1995; Kantarci et al. 2004; Scott et al. 2006; Targhetta et al. 1995). Some authors have reported a difference in mean values for diaphragmatic excursion between males and females (Boussuges et al. 2009; Kantarci et al. 2004).

Welcome message from author
This document is posted to help you gain knowledge. Please leave a comment to let me know what you think about it! Share it to your friends and learn new things together.
Transcript

ULTRASOUND ANALYSIS OF DIAPHRAGM KINETICS AND THE DIAGNOSIS OF
AIRWAY OBSTRUCTION: THE ROLE OF THE M-MODE INDEX OF
OBSTRUCTION1
ALESSANDRO ZANFORLIN,* ANDREA SMARGIASSI,y RICCARDO INCHINGOLO,y
ALESSANDRO DI MARCO BERARDINO,y SALVATORE VALENTE,y and EMILIO RAMAZZINA*
*Muldisciplinary Medicine Unit, General Hospital ‘‘San Luca,’’ Trecenta (Rovigo), Rovigo, Italy; and y Pulmonary Medicine
Department, University Hospital ‘‘A. Gemelli,’’ Universit_a Cattolica del Sacro Cuore, Rome, Italy
Abstract—Diaphragm motion in forced expiration can be analyzed using M-mode ultrasound in an anterior subcostal approach. Maximum expiratory diaphragmatic excursion (EDE Max ) and forced expiratory diaphragmatic excursion in the first second (FEDE 1 ) are considered the physiopathological analogues of vital capacity (VC) and forced expiratory volume in the first second (FEV 1 ). As the FEV 1 /VC % ratio is used as a marker of obstruction, our aim was to determine if the ratio FEDE 1 /EDE Max (M-mode index of obstruction [MIO]) differs between healthy subjects and patients with airway obstruction. One hundred twenty-four outpatients were examined by diaphragm ultrasound after spirometry. The MIO, expressed as the mean ± standard deviation (range), was 87.08 ± 6.64 (72.84–100) in the healthy group (N 5 61) and 67.09 ± 12.49 (33.33–91.30) in the group with obstructed airways (N 5 63). The difference between the two groups was significant (p , 0.0001), and MIO was significantly correlated with FEV 1 /VC (p , 0.0001). A MIO ,77 was identified as a possibile cutoff for suspecting an obstructive spirometric pattern with a 95.5% positive predictive value. The MIO can be interpreted as a speed index of diaphragmatic relaxation that seems to be slower in obstructed patients and could be used to screen for obstructed airway diseases. (E-mail: [email protected])
Key Words: Diaphragm, Ultrasound, Airway obstruction, Chronic obstructive pulmonary disease, Spirometry.
INTRODUCTION
The study of the diaphragm is a constantly evolving application of ultrasound. In transparietal longitudinal scan (in the presence of pleural effusions or in a zone in apposition to the rib cage), the diaphragm appears to be comprise three layers: a hypoechoic central layer bordered by two hyperechoic layers representing the interfaces of pleura and peritoneum (Ayoub et al. 1997a; Matamis et al. 2013). Some authors (Boussuges et al. 2009; Cohen et al. 1994a; Epelman et al. 2005; Gerscovich et al. 2001; Houston et al. 1992, 1994, 1995; Testa et al. 2011), although with different approaches, describe diaphragm visualization in a transhepatic scan using M-mode by directing the ultrasound beam perpendicular to the diaphragmatic dome (Fig. 1a). With this approach, the diaphragm appears as a thick hyperechoic line; the three layers are often not visible because the distance from the probe reduces the definition of the image. In this scan, the diaphragm becomes strongly hyperechoic because it represents the interface between liver and ventilated lung (Fig. 1b). However, this approach allows us to examine only the right hemidiaphragm (thanks to a good acoustic window provided by the liver); the left dome is often not accessible to ultrasound because of the presence of air in the bowel and stomach (Boussuges et al. 2009). Diaphragm movements can be measured by Mmode, a function that provides analysis of the trend of a vertical line of a B-mode scan as a function of time; in particular, we can examine diaphragmatic excursion as a function of time. During inspiration, the diaphragm descends, moving closer to the probe; during expiration, it rises, moving away from the probe. In the ultrasound M-mode representation, the diaphragm descends in expiration and rises in inspiration (Fig. 1b). In spontaneous breathing, it is possible to measure resting diaphragm excursion; when the patient breathes with forced inspiratory and expiratory maneuvers, it is possible to measure maximal diaphragmatic excursion. These data can be used to identify reduced diaphragm motility secondary to surgical procedures or neuromuscular diseases (Cohen et al. 1994b; Dorffner et al. 1998; Lloyd et al. 2006; McCauley and Labib 1984; Scillia et al. 2004; Wilcox and Pardy 1989). Previous studies have reported mean values of diaphragmatic excursion from 42 6 16 to 79 6 13 mm in forced breathing and from 11 6 4 to 21 6 6 mm in spontaneous breathing (Ayoub et al. 1997b, 2001; Boussuges et al. 2009; Cohen et al. 1994a; Harris et al. 1983; Houston et al. 1992, 1994, 1995; Kantarci et al. 2004; Scott et al. 2006; Targhetta et al. 1995). Some authors have reported a difference in mean values for diaphragmatic excursion between males and females (Boussuges et al. 2009; Kantarci et al. 2004).

Fig. 2. (a) M-Mode representation of a forced expiration in a healthy subject (3 5 maximum expiratory diaphragmatic excursion [EDE Max ], 1 5 forced expiratory diaphragmatic excursion [FEDE 1 ]). (b) Spirometric volume/time curve.
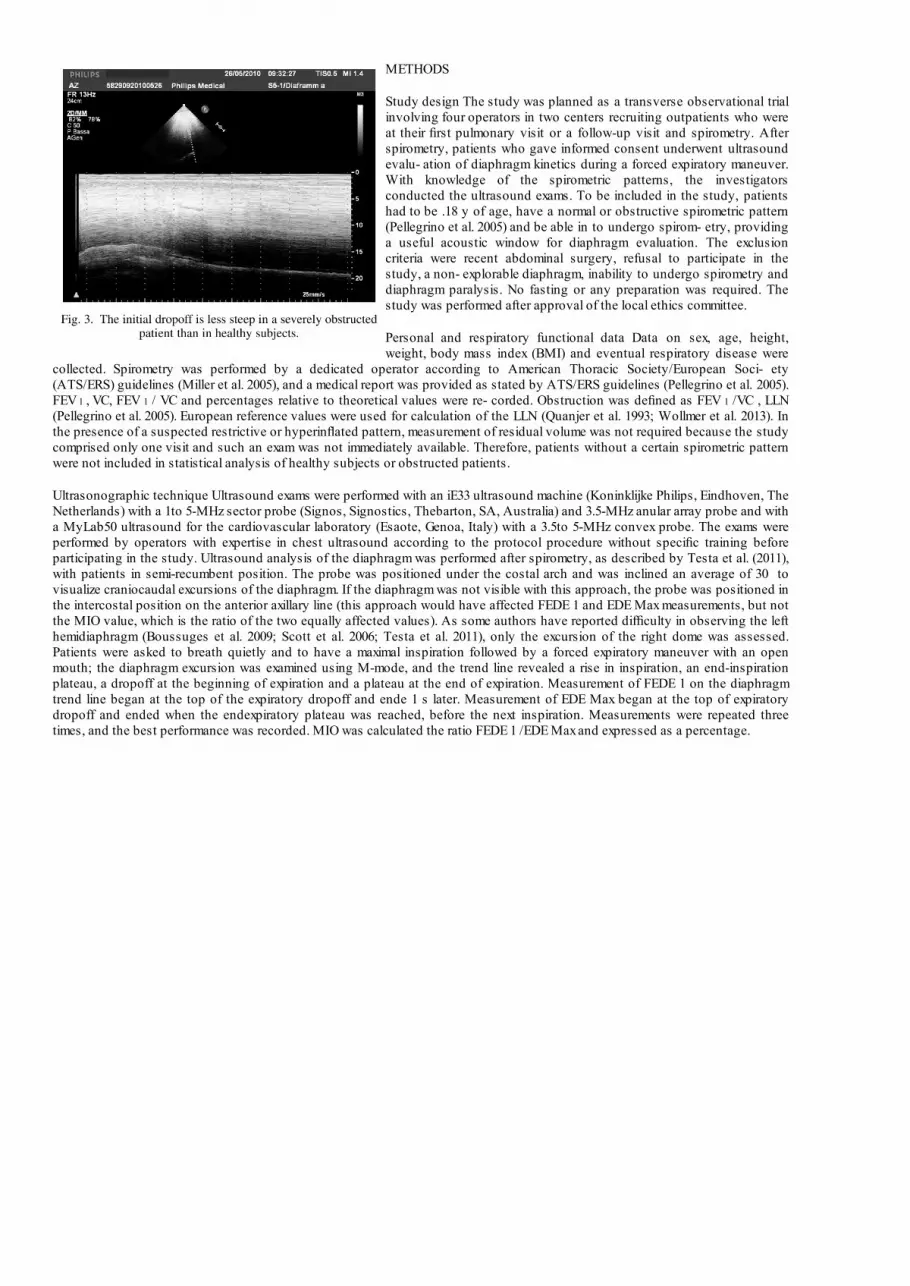
The M-mode representation of a forced expiratory maneuver (after a maximal inspiration) is characterized by an initial dropoff followed by a plateau in maximum expiration. Its strong similarity to the volume/time curve obtained in spirometry can be observed (Fig. 2). Analysis of this spirometric curve allows us to measure the forced expiratory volume in the first second (FEV 1 ) and vital capacity (VC) and to calculate the FEV 1 /VC ratio. Spirometry has universally been recognized as the gold standard for diagnosis of obstructive lung diseases: a FEV 1 /VC ratio lower than the lower limit of normal (LLN) compared with the theorethical value (calculated on the basis of anthropometric parameters) is indicative of airway obstruction (Pellegrino et al. 2005). Our preliminary observations of diaphragmatic excursion in M-mode (Philips iE33, S5-1 probe 2.5 MHz) during forced expiration in healthy volunteers and patients affected by obstructive airway disease indicated that the initial dropoff in expiration was steeper in healthy subjects than in those with obstructed airway disease (Fig. 3), suggesting that diaphragmatic excursion could be delayed by airway obstruction and air trapping, as reported by other authors (Dos Santos Yamaguti et al. 2008). In the ultrasound representation of diaphragm motion during a forced expiratory maneuver, it is possible to identify and measure the physiopathological analogues of FEV 1 and VC, respectively the forced expiratory diaphragm excursion in the first second (FEDE 1 ) and the maximal expiratory diaphragm excursion (EDE Max ); the FEDE 1 /EDE Max ratio (M-mode index of obstruction [MIO]) represents the percentage of diaphragmatic excursion in the first second compared with total excursion. We tried to determine if MIO is a ‘‘speed index’’ of diaphragm relaxation that could be affected by airway obstruction. This index is simple to measure and can be reproduced with any ultrasound machine equipped with M-mode.
METHODS
Study design The study was planned as a transverse observational trial involving four operators in two centers recruiting outpatients who were at their first pulmonary visit or a follow-up visit and spirometry. After spirometry, patients who gave informed consent underwent ultrasound evalu- ation of diaphragm kinetics during a forced expiratory maneuver. With knowledge of the spirometric patterns, the investigators conducted the ultrasound exams. To be included in the study, patients had to be .18 y of age, have a normal or obstructive spirometric pattern (Pellegrino et al. 2005) and be able in to undergo spirom- etry, providing a useful acoustic window for diaphragm evaluation. The exclusion criteria were recent abdominal surgery, refusal to participate in the study, a non- explorable diaphragm, inability to undergo spirometry and diaphragm paralysis. No fasting or any preparation was required. The study was performed after approval of the local ethics committee.
Personal and respiratory functional data Data on sex, age, height, weight, body mass index (BMI) and eventual respiratory disease were
collected. Spirometry was performed by a dedicated operator according to American Thoracic Society/European Soci- ety (ATS/ERS) guidelines (Miller et al. 2005), and a medical report was provided as stated by ATS/ERS guidelines (Pellegrino et al. 2005). FEV 1 , VC, FEV 1 / VC and percentages relative to theoretical values were re- corded. Obstruction was defined as FEV 1 /VC , LLN (Pellegrino et al. 2005). European reference values were used for calculation of the LLN (Quanjer et al. 1993; Wollmer et al. 2013). In the presence of a suspected restrictive or hyperinflated pattern, measurement of residual volume was not required because the study comprised only one visit and such an exam was not immediately available. Therefore, patients without a certain spirometric pattern were not included in statistical analysis of healthy subjects or obstructed patients.
Ultrasonographic technique Ultrasound exams were performed with an iE33 ultrasound machine (Koninklijke Philips, Eindhoven, The Netherlands) with a 1to 5-MHz sector probe (Signos, Signostics, Thebarton, SA, Australia) and 3.5-MHz anular array probe and with a MyLab50 ultrasound for the cardiovascular laboratory (Esaote, Genoa, Italy) with a 3.5to 5-MHz convex probe. The exams were performed by operators with expertise in chest ultrasound according to the protocol procedure without specific training before participating in the study. Ultrasound analysis of the diaphragm was performed after spirometry, as described by Testa et al. (2011), with patients in semi-recumbent position. The probe was positioned under the costal arch and was inclined an average of 30 to visualize craniocaudal excursions of the diaphragm. If the diaphragm was not visible with this approach, the probe was positioned in the intercostal position on the anterior axillary line (this approach would have affected FEDE 1 and EDE Max measurements, but not the MIO value, which is the ratio of the two equally affected values). As some authors have reported difficulty in observing the left hemidiaphragm (Boussuges et al. 2009; Scott et al. 2006; Testa et al. 2011), only the excursion of the right dome was assessed. Patients were asked to breath quietly and to have a maximal inspiration followed by a forced expiratory maneuver with an open mouth; the diaphragm excursion was examined using M-mode, and the trend line revealed a rise in inspiration, an end-inspiration plateau, a dropoff at the beginning of expiration and a plateau at the end of expiration. Measurement of FEDE 1 on the diaphragm trend line began at the top of the expiratory dropoff and ende 1 s later. Measurement of EDE Max began at the top of expiratory dropoff and ended when the endexpiratory plateau was reached, before the next inspiration. Measurements were repeated three times, and the best performance was recorded. MIO was calculated the ratio FEDE 1 /EDE Max and expressed as a percentage.

Statistical analysis Data obtained from the study were collected and descriptive statistics were analyzed with Office 2011 (Mi- crosoft, Redmond, WA, USA) and Prism 5 (GraphPad Software, La Jolla, CA, USA). Anthropometric and func- tional data and ultrasound measures and ratios are reported as means 6 standard deviations. Two-tailed un- paired Student t-tests were performed to compare values between the healthy and obstructed groups, between males and females, and between the two centers. Linear correlation was performed to study the relationship between MIO and FEV 1 /VC and between age and spiro- metric and ultrasonographic parameters. A p-value , 0.05 was considered indicative of statistical significance. The accuracy of the test was assessed with receiver oper- ating curve analysis and the threshold value identified with Youden’s index.
RESULTS
One hundred twenty-seven patients were enrolled in the study. Three patients (1 female and 2 males) did not meet the inclusion criteria, as no useful acoustic window was available because of severe obesity and abdominal meteorism. One hundred twenty-four met inclusion criteria: 61 patients with normal spirometry (35 males, 26 females) and 63 patients with airway obstruction (45 males, 18 females) according to ATS/ERS criteria (Pellegrino et al. 2005). Forty-two patients with airway obstruction were affected by chronic obstructive pulmo- nary disease, and 21 were affected by asthma. In the healthy group, age was 53 6 16.41 y, BMI was 26.79 6 5.44 kg/m 2 , FEV 1 was 3.28 6 1.04 L (mean 111% of predicted normal), VC was 4.16 6 1.16 L (mean 114% of predicted normal value) and FEV 1 /VC was 78.02 6 5.96 (mean 99.8% of predicted normal). In the group with obstructed airway disease, age was 67 6 15.11 y, BMI was 26.91 6 4.67 kg/m 2 , FEV 1 2.06 6 1.89 L (mean 78.2% of predicted normal), VC 3.55 6 1.21 L (mean 102.5% of predicted normal value) and FEV 1 /VC was 56.73 6 11.74 (mean 75.1% of pre- dicted normal). In all patients, ultrasound evaluation of the dia- phragm during the forced expiration maneuver was performed in less than 10 min without discomfort of the patients, allowing measurement of FEDE 1 and EDE Max
(Fig. 4). FEDE 1 was 5.64 6 1.22 cm in the healthy group versus 4.11 6 1.26 cm in the group with obstructed airway disease (p , 0.0001); EDE Max was 6.48 6 1.31 and 6.19 6 1.67 cm, respectively (p 5 NS); and MIO was 87.08 6 6.64 and 67.09 6 12.49, respectively (p , 0.0001). Analysis of the
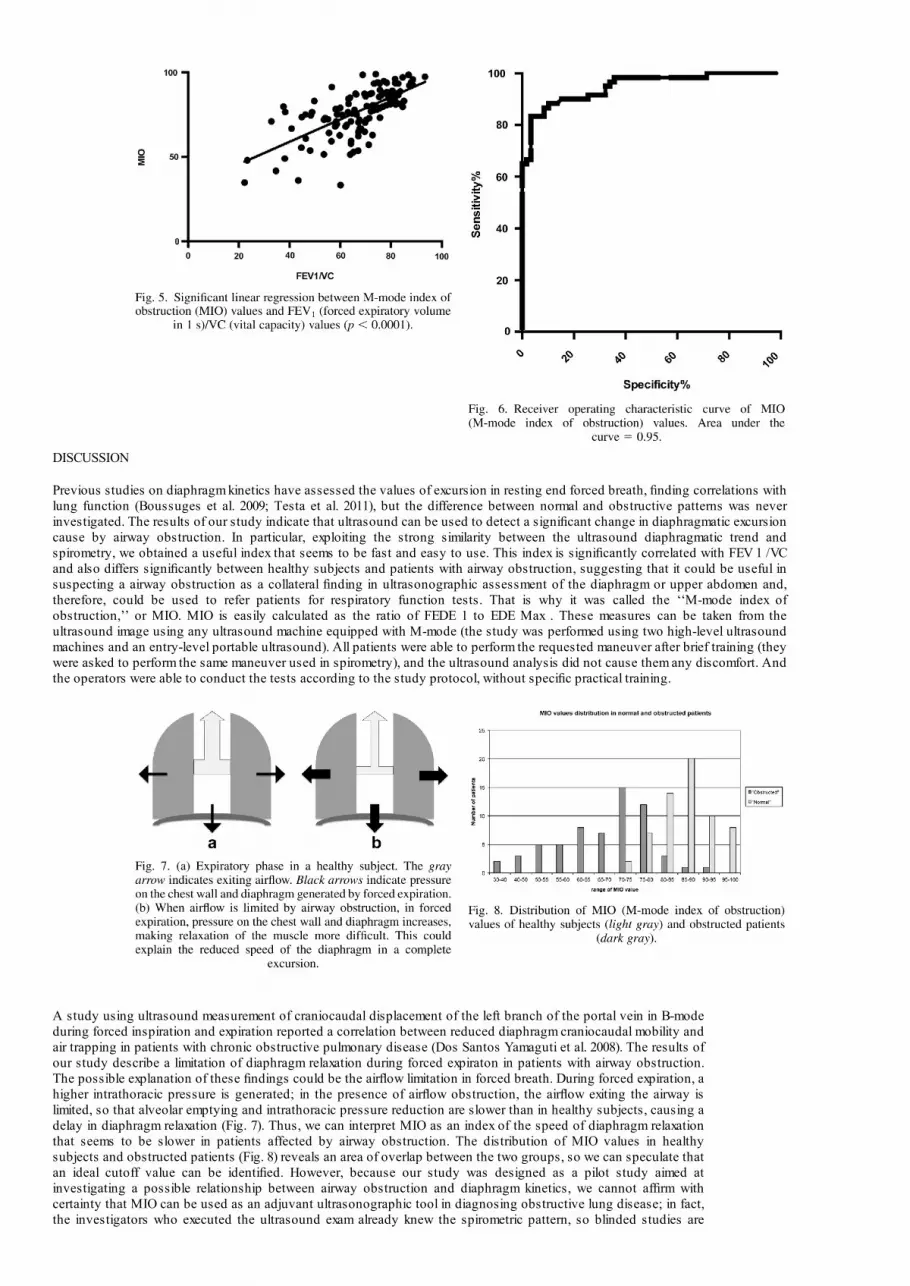
correspondence between MIO and FEV 1 /VC values revealed a significant linear regression (p , 0.0001, r 2 5 0.44) (Fig. 5). FEDE 1 , EDE Max and MIO values did not statistically significantly differ between females and males in the two groups except for EDE Max
value in the healthy group, which was higher in males than in females (males: 6.83 6 1.37 vs. females: 6 6 1.06; p , 0.05). Data from the two participating centers were homogenous and did not differ significantly. The comparison of age between the two groups revealed a significant difference (healthy group: 53 6 16.41 vs. group with obstructed airway disease: 67 6 15.11). Considering all patients included in the study, age had a signficant negative correlation with FEDE 1 (p , 0.0001), EDE Max (p , 0.05), MIO (p , 0.0001) and FEV 1 /VC (p , 0.0001). In the group with obstructed airway disease, age had a significant negative correlation with FEDE1 (p , 0.05) and FEV 1 /VC (p , 0.001), but no significant relationship with EDE Max (p 5 ns) or MIO (p 5 ns). In the healthy group, age had a significant negative correlation with MIO (p , 0.05) and FEV 1 /VC (p , 0.0001), but not with FEDE 1 (p 5 ns) and EDE Max (p 5 ns). The negative correlation between age and MIO and the significant difference in age between the two groups could affect the difference in mean MIO values between the two groups. To exclude the possible effect of age on the significant difference in MIO between the healthy subjects and obstructed patients, we excluded healthy subjects younger than the standard deviation of the mean age of the obstructed group (52 y), yielding a subgroup of 33 patients with mean age similar to that of the obstructed group (healthy group with adjusted age mean: 66 6 7 vs obstructed group: 67 6 15; p 5 ns). When MIO values of the patients with obstructed airway disease and MIO values of healthy subjects with adjusted age are compared, the difference remains statistically significant (p , 0.0001). To evaluate the accuracy of the test, receiver operating curve analysis was performed yielding an area under the curve of 0.95 (p , 0.0001) (Fig. 6); using Youden’s index, we identified a MIO , 77 as a possible threshold, with a sensitivity of 83.33%, specificity of 96.61%, positive predictive value of 95.5% and negative predictive value of 73.7%.
DISCUSSION
Previous studies on diaphragm kinetics have assessed the values of excursion in resting end forced breath, finding correlations with lung function (Boussuges et al. 2009; Testa et al. 2011), but the difference between normal and obstructive patterns was never investigated. The results of our study indicate that ultrasound can be used to detect a significant change in diaphragmatic excursion cause by airway obstruction. In particular, exploiting the strong similarity between the ultrasound diaphragmatic trend and spirometry, we obtained a useful index that seems to be fast and easy to use. This index is significantly correlated with FEV 1 /VC and also differs significantly between healthy subjects and patients with airway obstruction, suggesting that it could be useful in suspecting a airway obstruction as a collateral finding in ultrasonographic assessment of the diaphragm or upper abdomen and, therefore, could be used to refer patients for respiratory function tests. That is why it was called the ‘‘M-mode index of obstruction,’’ or MIO. MIO is easily calculated as the ratio of FEDE 1 to EDE Max . These measures can be taken from the ultrasound image using any ultrasound machine equipped with M-mode (the study was performed using two high-level ultrasound machines and an entry-level portable ultrasound). All patients were able to perform the requested maneuver after brief training (they were asked to perform the same maneuver used in spirometry), and the ultrasound analysis did not cause them any discomfort. And the operators were able to conduct the tests according to the study protocol, without specific practical training.
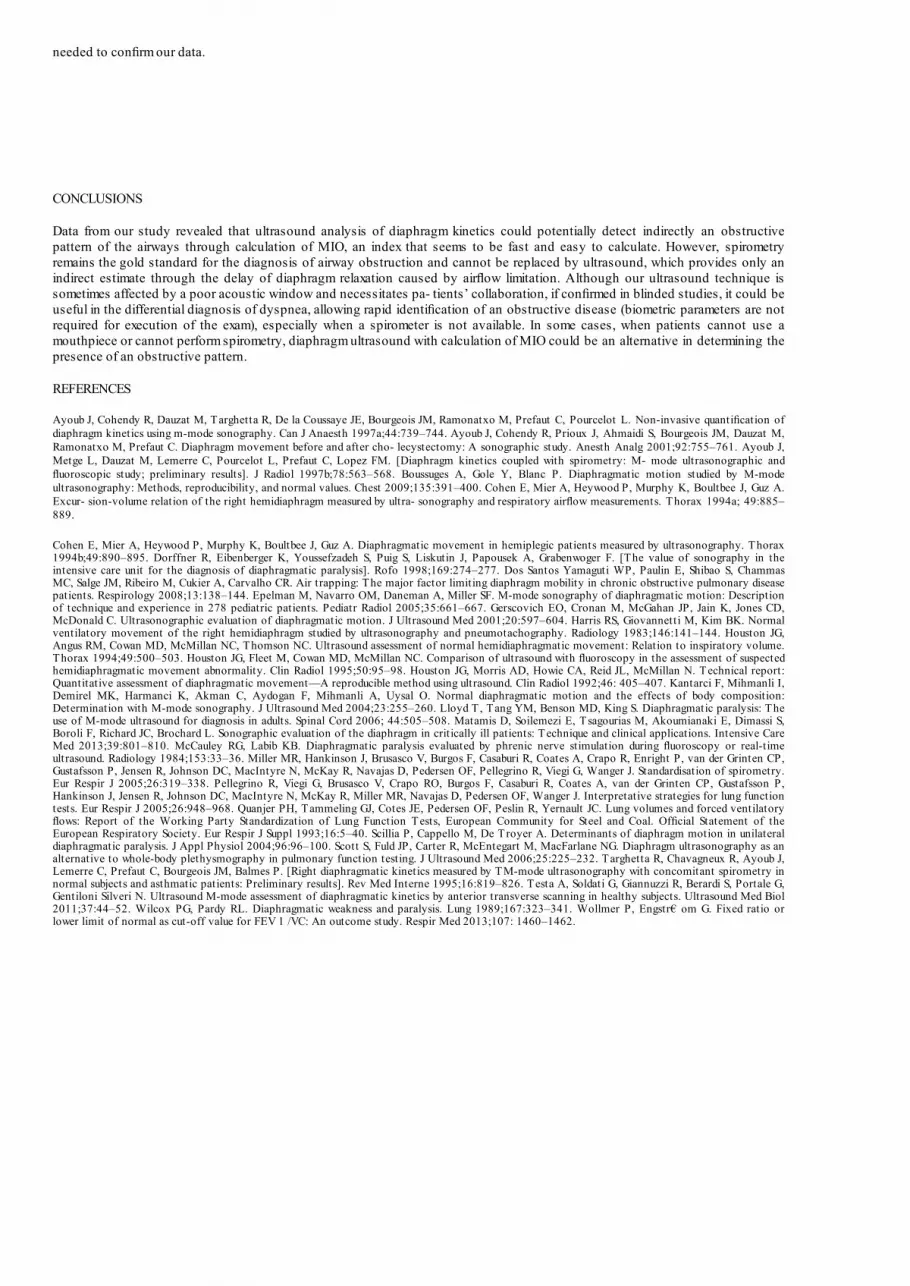
A study using ultrasound measurement of craniocaudal displacement of the left branch of the portal vein in B-mode during forced inspiration and expiration reported a correlation between reduced diaphragm craniocaudal mobility and air trapping in patients with chronic obstructive pulmonary disease (Dos Santos Yamaguti et al. 2008). The results of our study describe a limitation of diaphragm relaxation during forced expiraton in patients with airway obstruction. The possible explanation of these findings could be the airflow limitation in forced breath. During forced expiration, a higher intrathoracic pressure is generated; in the presence of airflow obstruction, the airflow exiting the airway is limited, so that alveolar emptying and intrathoracic pressure reduction are slower than in healthy subjects, causing a delay in diaphragm relaxation (Fig. 7). Thus, we can interpret MIO as an index of the speed of diaphragm relaxation that seems to be slower in patients affected by airway obstruction. The distribution of MIO values in healthy subjects and obstructed patients (Fig. 8) reveals an area of overlap between the two groups, so we can speculate that an ideal cutoff value can be identified. However, because our study was designed as a pilot study aimed at investigating a possible relationship between airway obstruction and diaphragm kinetics, we cannot affirm with certainty that MIO can be used as an adjuvant ultrasonographic tool in diagnosing obstructive lung disease; in fact, the investigators who executed the ultrasound exam already knew the spirometric pattern, so blinded studies are
needed to confirm our data.
CONCLUSIONS
Data from our study revealed that ultrasound analysis of diaphragm kinetics could potentially detect indirectly an obstructive pattern of the airways through calculation of MIO, an index that seems to be fast and easy to calculate. However, spirometry remains the gold standard for the diagnosis of airway obstruction and cannot be replaced by ultrasound, which provides only an indirect estimate through the delay of diaphragm relaxation caused by airflow limitation. Although our ultrasound technique is sometimes affected by a poor acoustic window and necessitates pa- tients’ collaboration, if confirmed in blinded studies, it could be useful in the differential diagnosis of dyspnea, allowing rapid identification of an obstructive disease (biometric parameters are not required for execution of the exam), especially when a spirometer is not available. In some cases, when patients cannot use a mouthpiece or cannot perform spirometry, diaphragm ultrasound with calculation of MIO could be an alternative in determining the presence of an obstructive pattern.
REFERENCES
Ayoub J, Cohendy R, Dauzat M, Targhetta R, De la Coussaye JE, Bourgeois JM, Ramonatxo M, Prefaut C, Pourcelot L. Non-invasive quantification of diaphragm kinetics using m-mode sonography. Can J Anaesth 1997a;44:739–744. Ayoub J, Cohendy R, Prioux J, Ahmaidi S, Bourgeois JM, Dauzat M, Ramonatxo M, Prefaut C. Diaphragm movement before and after cho- lecystectomy: A sonographic study. Anesth Analg 2001;92:755–761. Ayoub J, Metge L, Dauzat M, Lemerre C, Pourcelot L, Prefaut C, Lopez FM. [Diaphragm kinetics coupled with spirometry: M- mode ultrasonographic and fluoroscopic study; preliminary results]. J Radiol 1997b;78:563–568. Boussuges A, Gole Y, Blanc P. Diaphragmatic motion studied by M-mode ultrasonography: Methods, reproducibility, and normal values. Chest 2009;135:391–400. Cohen E, Mier A, Heywood P, Murphy K, Boultbee J, Guz A. Excur- sion-volume relation of the right hemidiaphragm measured by ultra- sonography and respiratory airflow measurements. Thorax 1994a; 49:885–889.
Cohen E, Mier A, Heywood P, Murphy K, Boultbee J, Guz A. Diaphragmatic movement in hemiplegic patients measured by ultrasonography. Thorax 1994b;49:890–895. Dorffner R, Eibenberger K, Youssefzadeh S, Puig S, Liskutin J, Papousek A, Grabenwoger F. [The value of sonography in the intensive care unit for the diagnosis of diaphragmatic paralysis]. Rofo 1998;169:274–277. Dos Santos Yamaguti WP, Paulin E, Shibao S, Chammas MC, Salge JM, Ribeiro M, Cukier A, Carvalho CR. Air trapping: The major factor limiting diaphragm mobility in chronic obstructive pulmonary disease patients. Respirology 2008;13:138–144. Epelman M, Navarro OM, Daneman A, Miller SF. M-mode sonography of diaphragmatic motion: Description of technique and experience in 278 pediatric patients. Pediatr Radiol 2005;35:661–667. Gerscovich EO, Cronan M, McGahan JP, Jain K, Jones CD, McDonald C. Ultrasonographic evaluation of diaphragmatic motion. J Ultrasound Med 2001;20:597–604. Harris RS, Giovannetti M, Kim BK. Normal ventilatory movement of the right hemidiaphragm studied by ultrasonography and pneumotachography. Radiology 1983;146:141–144. Houston JG, Angus RM, Cowan MD, McMillan NC, Thomson NC. Ultrasound assessment of normal hemidiaphragmatic movement: Relation to inspiratory volume. Thorax 1994;49:500–503. Houston JG, Fleet M, Cowan MD, McMillan NC. Comparison of ultrasound with fluoroscopy in the assessment of suspected hemidiaphragmatic movement abnormality. Clin Radiol 1995;50:95–98. Houston JG, Morris AD, Howie CA, Reid JL, McMillan N. Technical report: Quantitative assessment of diaphragmatic movement—A reproducible method using ultrasound. Clin Radiol 1992;46: 405–407. Kantarci F, Mihmanli I, Demirel MK, Harmanci K, Akman C, Aydogan F, Mihmanli A, Uysal O. Normal diaphragmatic motion and the effects of body composition: Determination with M-mode sonography. J Ultrasound Med 2004;23:255–260. Lloyd T , Tang YM, Benson MD, King S. Diaphragmatic paralysis: The use of M-mode ultrasound for diagnosis in adults. Spinal Cord 2006; 44:505–508. Matamis D, Soilemezi E, Tsagourias M, Akoumianaki E, Dimassi S, Boroli F, Richard JC, Brochard L. Sonographic evaluation of the diaphragm in critically ill patients: Technique and clinical applications. Intensive Care Med 2013;39:801–810. McCauley RG, Labib KB. Diaphragmatic paralysis evaluated by phrenic nerve stimulation during fluoroscopy or real-time ultrasound. Radiology 1984;153:33–36. Miller MR, Hankinson J, Brusasco V, Burgos F, Casaburi R, Coates A, Crapo R, Enright P, van der Grinten CP, Gustafsson P, Jensen R, Johnson DC, MacIntyre N, McKay R, Navajas D, Pedersen OF, Pellegrino R, Viegi G, Wanger J. Standardisation of spirometry. Eur Respir J 2005;26:319–338. Pellegrino R, Viegi G, Brusasco V, Crapo RO, Burgos F, Casaburi R, Coates A, van der Grinten CP, Gustafsson P, Hankinson J, Jensen R, Johnson DC, MacIntyre N, McKay R, Miller MR, Navajas D, Pedersen OF, Wanger J. Interpretative strategies for lung function tests. Eur Respir J 2005;26:948–968. Quanjer PH, Tammeling GJ, Cotes JE, Pedersen OF, Peslin R, Yernault JC. Lung volumes and forced ventilatory flows: Report of the Working Party Standardization of Lung Function Tests, European Community for Steel and Coal. Official Statement of the European Respiratory Society. Eur Respir J Suppl 1993;16:5–40. Scillia P, Cappello M, De Troyer A. Determinants of diaphragm motion in unilateral diaphragmatic paralysis. J Appl Physiol 2004;96:96–100. Scott S, Fuld JP, Carter R, McEntegart M, MacFarlane NG. Diaphragm ultrasonography as an alternative to whole-body plethysmography in pulmonary function testing. J Ultrasound Med 2006;25:225–232. Targhetta R, Chavagneux R, Ayoub J, Lemerre C, Prefaut C, Bourgeois JM, Balmes P. [Right diaphragmatic kinetics measured by TM-mode ultrasonography with concomitant spirometry in normal subjects and asthmatic patients: Preliminary results]. Rev Med Interne 1995;16:819–826. Testa A, Soldati G, Giannuzzi R, Berardi S, Portale G, Gentiloni Silveri N. Ultrasound M-mode assessment of diaphragmatic kinetics by anterior transverse scanning in healthy subjects. Ultrasound Med Biol 2011;37:44–52. Wilcox PG, Pardy RL. Diaphragmatic weakness and paralysis. Lung 1989;167:323–341. Wollmer P, Engstr€ om G. Fixed ratio or lower limit of normal as cut-off value for FEV 1 /VC: An outcome study. Respir Med 2013;107: 1460–1462.
Related Documents