Journal of Neuroscience Methods 154 (2006) 161–174 Ultrafast random-access scanning in two-photon microscopy using acousto-optic deflectors R. Salom´ e a,1 , Y. Kremer a,1 , S. Dieudonn´ e a , J.-F. L´ eger a , O. Krichevsky c , C. Wyart a , D. Chatenay b , L. Bourdieu a,∗ a Laboratoire de Neurobiologie Mol´ eculaire et Cellulaire, UMR CNRS 8544, Ecole Normale Sup´ erieure, D´ epartement de Biologie, 46 rue d’Ulm, 75005 Paris, France b Laboratoire de Physique Statistique, UMR CNRS 8550, Ecole Normale Sup´ erieure, D´ epartement de Physique, 24 rue Lhomond, 75005 Paris, France c Physics Department, Ben-Gurion University, P.O.B. 653, Beer-Sheva 84105, Israel Received 26 August 2005; received in revised form 10 December 2005; accepted 10 December 2005 Abstract Two-photon scanning microscopy (TPSM) is a powerful tool for imaging deep inside living tissues with sub-cellular resolution. The temporal resolution of TPSM is however strongly limited by the galvanometric mirrors used to steer the laser beam. Fast physiological events can therefore only be followed by scanning repeatedly a single line within the field of view. Because acousto-optic deflectors (AODs) are non-mechanical devices, they allow access at any point within the field of view on a microsecond time scale and are therefore excellent candidates to improve the temporal resolution of TPSM. However, the use of AOD-based scanners with femtosecond pulses raises several technical difficulties. In this paper, we describe an all-digital TPSM setup based on two crossed AODs. It includes in particular an acousto-optic modulator (AOM) placed at 45 ◦ with respect to the AODs to pre-compensate for the large spatial distortions of femtosecond pulses occurring in the AODs, in order to optimize the spatial resolution and the fluorescence excitation. Our setup allows recording from freely selectable point-of-interest at high speed (1 kHz). By maximizing the time spent on points of interest, random-access TPSM (RA-TPSM) constitutes a promising method for multiunit recordings with millisecond resolution in biological tissues. © 2005 Elsevier B.V. All rights reserved. Keywords: Two-photon scanning microscopy (TPSM); Random-access two-photon scanning microscopy (RA-TPSM); Ultrafast scanning; Acousto-optical deflectors (AODs); Temporal pre-compensation; Spatial pre-compensation; Calcium imaging; Multiunit recording 1. Introduction In two-photon scanning microscopes (TPSM), high optical resolution of a thick scattering fluorescently labeled sample is achieved through the use of non-linear two-photon absorption from an infrared femtosecond pulsed laser (Denk et al., 1995; Zipfel et al., 2003). As the probability of a two-photon transition is a square function of photon density, excitation and fluores- cent emission occur only in a small volume at the focus of a high numerical aperture objective. The emitted light is mea- sured by a photosensitive device without descanning. Scanning the laser beam in two orthogonal in-plane directions X and Y ∗ Corresponding author. Tel.: +33 1 44 32 37 34; fax: +33 1 44 32 38 87. E-mail address: [email protected] (L. Bourdieu). 1 These authors contributed equally to this work. provides an optical section of the fluorescence intensity distri- bution. Images result from the subsequent spatial reconstruction of the distribution in time of the fluorescence intensity. Flu- orescently labeled neurons can be imaged by this method in acute brain slices and in living animals (Denk et al., 1995; Yuste et al., 2000; Helmchen and Denk, 2002; Helmchen and Waters, 2002). Scanning relies on galvanometric mirrors provid- ing accurate scans of large amplitude, but frames are acquired at a few Hz and usually need to be averaged to get images with a useful signal to noise ratio: each point of a frame (500 × 500 pixels) acquired at 1 Hz is illuminated only 4 s. Video-rate scanning is possible with a resonant galvanometer (Tsien and Bacskai, 1995; Fan et al., 1999), but again averaging of frames is usually necessary. Other promising possibilities are multifo- cal imaging (Straub et al., 2000) and scanning-less microscopy using temporal focusing (Oron et al., 2005), but the collec- tion of scattered photons on an image detector results in a 0165-0270/$ – see front matter © 2005 Elsevier B.V. All rights reserved. doi:10.1016/j.jneumeth.2005.12.010

Welcome message from author
This document is posted to help you gain knowledge. Please leave a comment to let me know what you think about it! Share it to your friends and learn new things together.
Transcript

Journal of Neuroscience Methods 154 (2006) 161–174
Ultrafast random-access scanning in two-photon microscopyusing acousto-optic deflectors
R. Salome a,1, Y. Kremer a,1, S. Dieudonne a, J.-F. Leger a, O. Krichevsky c,C. Wyart a, D. Chatenay b, L. Bourdieu a,∗
a Laboratoire de Neurobiologie Moleculaire et Cellulaire, UMR CNRS 8544, Ecole Normale Superieure,Departement de Biologie, 46 rue d’Ulm, 75005 Paris, France
b Laboratoire de Physique Statistique, UMR CNRS 8550, Ecole Normale Superieure, Departement de Physique, 24 rue Lhomond, 75005 Paris, Francec Physics Department, Ben-Gurion University, P.O.B. 653, Beer-Sheva 84105, Israel
Received 26 August 2005; received in revised form 10 December 2005; accepted 10 December 2005
Abstract
Two-photon scanning microscopy (TPSM) is a powerful tool for imaging deep inside living tissues with sub-cellular resolution. The temporalresolution of TPSM is however strongly limited by the galvanometric mirrors used to steer the laser beam. Fast physiological events can thereforeodtp4tmm©
K(
1
rafZichst
0d
nly be followed by scanning repeatedly a single line within the field of view. Because acousto-optic deflectors (AODs) are non-mechanicalevices, they allow access at any point within the field of view on a microsecond time scale and are therefore excellent candidates to improvehe temporal resolution of TPSM. However, the use of AOD-based scanners with femtosecond pulses raises several technical difficulties. In thisaper, we describe an all-digital TPSM setup based on two crossed AODs. It includes in particular an acousto-optic modulator (AOM) placed at5◦ with respect to the AODs to pre-compensate for the large spatial distortions of femtosecond pulses occurring in the AODs, in order to optimizehe spatial resolution and the fluorescence excitation. Our setup allows recording from freely selectable point-of-interest at high speed (1 kHz). By
aximizing the time spent on points of interest, random-access TPSM (RA-TPSM) constitutes a promising method for multiunit recordings withillisecond resolution in biological tissues.2005 Elsevier B.V. All rights reserved.
eywords: Two-photon scanning microscopy (TPSM); Random-access two-photon scanning microscopy (RA-TPSM); Ultrafast scanning; Acousto-optical deflectorsAODs); Temporal pre-compensation; Spatial pre-compensation; Calcium imaging; Multiunit recording
. Introduction
In two-photon scanning microscopes (TPSM), high opticalesolution of a thick scattering fluorescently labeled sample ischieved through the use of non-linear two-photon absorptionrom an infrared femtosecond pulsed laser (Denk et al., 1995;ipfel et al., 2003). As the probability of a two-photon transition
s a square function of photon density, excitation and fluores-ent emission occur only in a small volume at the focus of aigh numerical aperture objective. The emitted light is mea-ured by a photosensitive device without descanning. Scanninghe laser beam in two orthogonal in-plane directions X and Y
∗ Corresponding author. Tel.: +33 1 44 32 37 34; fax: +33 1 44 32 38 87.E-mail address: [email protected] (L. Bourdieu).
1 These authors contributed equally to this work.
provides an optical section of the fluorescence intensity distri-bution. Images result from the subsequent spatial reconstructionof the distribution in time of the fluorescence intensity. Flu-orescently labeled neurons can be imaged by this method inacute brain slices and in living animals (Denk et al., 1995;Yuste et al., 2000; Helmchen and Denk, 2002; Helmchen andWaters, 2002). Scanning relies on galvanometric mirrors provid-ing accurate scans of large amplitude, but frames are acquiredat a few Hz and usually need to be averaged to get images with auseful signal to noise ratio: each point of a frame (500 × 500pixels) acquired at 1 Hz is illuminated only 4 �s. Video-ratescanning is possible with a resonant galvanometer (Tsien andBacskai, 1995; Fan et al., 1999), but again averaging of framesis usually necessary. Other promising possibilities are multifo-cal imaging (Straub et al., 2000) and scanning-less microscopyusing temporal focusing (Oron et al., 2005), but the collec-tion of scattered photons on an image detector results in a
165-0270/$ – see front matter © 2005 Elsevier B.V. All rights reserved.oi:10.1016/j.jneumeth.2005.12.010

162 R. Salome et al. / Journal of Neuroscience Methods 154 (2006) 161–174
loss of spatial resolution. Finally, single line scan (Denk etal., 1995) is the most convenient method to follow physiologi-cal processes on timescales of few milliseconds, but limits theobservation to biological objects transected by the same singleline.
In principle, the optical measurement of time-dependent pro-cesses would not involve making images at all. Measurementsare only of interest at the few locations where the image planeintersects the biological objects of interest and where maximumtime should be spent to collect as many photons as possible.Fast physiological processes like action-potential-evoked cal-cium transients in the somata of multiple neurons or calciumentries in many neuritic compartments of a single neuron couldbe recorded optimally with only tens of points scattered in thefield of view, each one being sampled at 1 kHz. This cannotbe achieved with standard galvanometers since about 1 ms isrequired to stabilize them in a new position. Scanning a set ofpoints within a plane at high speed is possible with two orthogo-nal acousto-optic deflectors (AODs). In an AOD, a propagatingultrasonic wave establishes a grating that diffracts a laser beamat a precise angle which can be changed within a few microsec-onds (Yariv, 1997). AODs have been used in a single photonmicroscope (Bullen et al., 1997; Bullen and Saggau, 1999).Combining scans with AODs and two-photon fluorescence exci-tation raises, however, some specific difficulties (Denk et al.,1995; Lechleiter et al., 2002; Iyer et al., 2003; Roorda et al.,2oddftaobfuadttfi(g
btsu2rmpetoA
potential-evoked calcium transients in cell somata of neurons inculture are monitored.
2. Methods
2.1. All-digital two-photon microscope with galvanometricscan
Our experiments were performed on a home-made two-photon scanning upright microscope. The optical setup is shownin Fig. 1. Excitation was produced by a tunable titanium-sapphirelaser (Tsunami, Spectra Physics, USA). Experiments were per-formed at 840 and at 900 nm. For standard two-photon imaging,the beam was scanned with a pair of galvanometric mirrorsimaged on the rear pupil of the objective by an afocal tele-scope T2 (magnification T2 = 3). We used a resonant scanner(8 kHz CRS, GSI Luminosics, Germany) in the X-direction anda closed-loop scanner (M2ST with Minisax driver board, GSILuminosics, Germany) for the Y-direction, so that video ratescanning was obtained. Most of the experiments were performedwith the Zeiss IR-Achroplan 40× water immersion objective(numerical aperture (NA) 0.8), which has a focal length offobj = 4.125 mm. With this objective, the galvanometric scan-ners provided a field of view of 220 �m. We also used, whenspecified, the Olympus XLUMPlanFl 20×, NA 0.95, wateri6eml
Fstao(Mmdis 1.67 �s.
004). Light sources for two-photon microscopy are femtosec-nd pulsed lasers (∼100 fs), which have a rather large spectralispersion δλ (∼12 nm FWHM at 900 nm). The group velocityispersion (Yariv, 1997) of the material used in an AOD there-ore increases the duration of the pulse. The spatial coherence ofhe laser beam is also reduced since the diffraction spatially sep-rates the wavelengths. This last feature reduces the resolutionf an AOD (Iyer et al., 2003), i.e. the number of points which cane scanned. The use of AODs in TPSM is therefore not straight-orward. Recently, a single axis AOD has been used to achieveltrafast scans in one direction (Lechleiter et al., 2002; Iyer etl., 2003; Roorda et al., 2004). Setups based on a pair of highlyispersive prisms (Fork, 1984) were used to pre-compensate forhe temporal broadening. The spatial dispersion introduced byhe single axis AOD was also compensated, at the center of theeld of view, using an additional dispersive element like a prismLechleiter et al., 2002; Roorda et al., 2004) or a diffractionrating (Iyer et al., 2003).
We describe the implementation of a two-dimensional AOD-ased scanner in a two-photon microscope. Compensation ofemporal and spatial distortions is implemented. In particularpatial compensation is obtained with an acousto-optic mod-lator (AOM) placed at 45◦ with respect to the AODs (Ngoi,001). Deep imaging in turbid samples with large fields of viewequires the use of these pre-compensation setups that restore theicroscope resolution, optimize the pulse duration at the focal
oint of the objective and therefore maximize the fluorescencemission. A simple model is presented, that allows quantita-ive analysis of temporal and spatial distortions and the futureptimization of AOD-based two-photon scanning microscopes.n example of ultrafast scanning is presented, in which action-
mmersion objective (fobj = 9 mm) and the Zeiss Plan Neofluar3×, NA 1.25, oil immersion objective (fobj = 2.62 mm). Thepifluorescence was collected onto a photon-counting photo-ultiplier (Hamamatsu, H7421-40) by imaging with an aspheric
ens the objective rear pupil on the photodetector (Fig. 1). Photon
ig. 1. Setup of the digital two-photon scanning microscope. The two scanningystems (acousto-optic deflectors and galvanometers) are shown as well as theemporal (a pair of prisms) and spatial (AOM at 45◦ with respect to the AODsxis) pre-compensation setups. GP, glass plate; SP, spectrometer; AOD, acousto-ptic deflectors; AOM, acousto-optic modulator; T1 and T2, afocal telescopesmagnifications T1 = 1, T2 = 3); scanning mirrors, mirrors on galvanometers;
1 and M2, mirrors; DM, dichroic mirror; AL, aspheric lens; PMT, photo-ultiplier tube. Inset: Measure of the commutation time of the acousto-optic
eflector between two angles (�) and two amplitudes (©). The acquisition time

R. Salome et al. / Journal of Neuroscience Methods 154 (2006) 161–174 163
counting mode (Wier et al., 2000) allows a higher signal to noiseratio at low fluorescence levels, and thus a weaker illumina-tion, reducing photo-damage. The objective was mounted on amotorized translation stage (426, actuator VP25AA, ESP300controller, accuracy 0.1 �m, Newport, USA) to achieve 3Dscanning. We developed acquisition software with Labview(National Instruments, USA). Scanners were controlled with amultifunction digital/analog board (National Instruments, PCI-16E4). Image acquisition was performed in an all-digital mode,by counting the TTL pulses provided by the photo-multiplierwith a DSP board (ADR128-C6X, Ateme, France), which hada configurable internal clock up to 10 MHz.
2.2. Acousto-optic deflectors
An acousto-optic deflection system composed of two AODscrossed at 90◦ (DTS-XY-250, A&A, France) was inserted intoour two-photon microscope (Fig. 1). AODs were made ofTeO2 used in slow-shear acoustic wave mode (acoustic veloc-ity v = 650 m/s). Two different AOD scanners were used inthis paper. Experiments without spatial pre-compensation wereperformed with a scanner optimized at 900 nm, with a centralfrequency F0 = 80 MHz. Experiments with spatial compensa-tion were achieved with a scanner optimized at 840 nm witha central frequency F0 = 100 MHz; an additional AOM wasadded to these two AODs for spatial pre-compensation (seebtalAcplaoilTocilil2
(Aromtvfso
(Yariv, 1997):
θ = λF
ν(1)
where ν is the sound velocity. The maximum scan amplitude�θmax is proportional to the acoustic bandwidth �F:
�θmax = λ�F
ν∼ 44 mrad = 2.5◦ (2)
This amplitude is intermediate between the large angulardeflection of galvanometric mirrors and the scanning range ofacousto-optic deflectors in longitudinal mode or of standardpiezoelectric mirrors. The field of view (FOV) obtained in theobject plane depends on the magnification T of the telescopeused to image the AODs onto the objective rear pupil:
FOV = fobj�θmax
T∼ 60 mm (3)
The angles of deviation corresponding to the in-plane direc-tions X and Y are defined by the frequencies FX and FY ofthe ultrasonic waves in each AOD. Both frequencies are con-trolled digitally with a fast output board (NI, PCI-DIO-32HS).The intensity of the diffracted beam was controlled by changingthe amplitude of the ultrasonic waves. To record the fluores-cwncimafuairwcoomd(
2d
p(aPc(c
elow). Besides the difference in the central frequency and inhe optimum wavelength, both scanners were identical (material,perture, thickness) and could be used over a range of wave-engths (at least ±70 nm) as required for broadband lasers. TheODs were imaged onto the scanning mirrors by a second afo-al telescope T1 (magnification T1 = 1) and on the objective rearupil with a total magnification T = T1·T2 = 3. We used a col-imated beam at the AODs with a diameter Dbeam
AOD (measuredt 1/e2) of about 1.5–2 mm, smaller than the optical aperturef each AOD (4.2 mm). This allows maximum transmission inntensity and a very fast commutation time tc, since this variesinearly with the beam diameter (see below). The magnification
was chosen to significantly underfill the rear pupil of the 40×bjective (diameter 6.6 mm) and to obtain an effective numeri-al aperture of about 0.5–0.6. Deep imaging in scattering tissues indeed theoretically more easily achieved with NA slightlyower than 0.7 (Dunn et al., 2000), because oblique rays travel-ng a longer path are strongly scattered. Experimentally, NA asow as 0.5 have been used at large depths of imaging (Theer et al.,003).
We measured a large transmission (>60%) of the AODsA&A specification: at least 70% per AOD and 50% for twoODs). Such transmission was measured over a frequency
ange �F of 30–35 MHz, depending on the fine alignmentf the AODs. Within this acousto-optic bandwidth, the trans-ission varied by less than 10% with a shape characteris-
ic of the anisotropic interaction in shear mode. The field ofiew corresponding to this bandwidth can be calculated asollows. For an AOD in the Bragg configuration, the relation-hip between the diffraction angle θ(λ) of the incident lightf wavelength λ and the ultrasonic frequency F is given, by
ence in a set of user-defined (in number and position) points,e used a counter acquisition board (NI, PCI-6602) synchro-ized with the digital board. For each point, the illumination wasontrolled in duration (from 10 �s up to seconds) as well as inntensity (to optimize in each point the signal to noise ratio while
inimizing photo-bleaching and photo-damage). The softwarellows for standard imaging by performing TV like scans andor sampling a set of user-selected points at very high rate. Wesed a fast photodiode to measure the commutation times inmplitude and in frequency of the AOD. The commutation timen amplitude was measured by focusing the laser in a fluo-escein solution, by switching the amplitude of the ultrasonicaves from zero to maximum and by measuring the resulting
hange in fluorescence. The commutation time in deflection wasbtained similarly by switching the AODs between two anglesf diffraction corresponding to different transmitted powers. Weeasured the same commutation time tc in amplitude and in
eflection of about 2.5 �s in our setup (Fig. 1 inset) as expectedtc = Dbeam
AOD/v ∼ 2.5 �s).
.3. Characterization of the temporal and spatialistortions in the acousto-optic deflectors
We characterized the time broadening of the femtosecondulses in the AODs, that was due to the group velocity dispersionGVD) of TeO2. Pulse duration was measured with a home-madeuto-correlator (courtesy of O. Cregut, IPCMS, Strasbourg).ulse duration tp was calculated from the FWHM of the auto-orrelation function tac using a Gaussian shape approximationtac = 1.41tp). A classical temporal pre-compensation systemonsisting of a double pass within a set of two SF10 Brewster

164 R. Salome et al. / Journal of Neuroscience Methods 154 (2006) 161–174
prisms (Fork, 1984) was inserted in the optical setup to introducea controlled amount of negative linear chirp. The negative GVDintroduced by this setup (GVDprisms) was estimated by measur-ing the time broadening of the pulses for several inter-prismsdistances (GVDprisms = −100 ± 15 fs2/cm). We used the two-photon-excited fluorescence from an FITC solution to adjustthe inter-prism distance which compensated for the GVD of thewhole optical setup including the objective, in order to obtainan optimum pulse duration in the sample.
The spatial distortion of the laser pulse in the AODs wascharacterized by measuring its effect on the radial and axial res-olutions of the microscope (see below). Pre-compensation of thisspatial distortion was achieved with an acousto-optic modulator(AA.MTS.141, A&A). The AOM was placed at 45◦ with respectto the axis of the AOD. It was carefully aligned to maximize itstransmission (>80%). The frequency in the AOM was optimizedexperimentally to obtain a perfect spatial compensation at thecenter of the field of view and minimal distortions on its edge.
2.4. Resolution of the microscope
Images of sub-resolution beads, obtained with the AODs,gave access to the radial resolution of the microscope, definedas the full width at half maximum (FWHM) of the fluorescenceintensity profile. The radial resolution was measured for beadsat different positions in the field of view and, by this means,asvoawsd
2e
mtasaoisa
2
g((tB
temperature and rinsed for 10 min. Individual action potentialsgave about 5% of fluorescence variation (Smetters et al., 1999;Peterlin et al., 2000). Experiments were performed at 900 nmwith an incident power of 5 mW.
3. Results
3.1. Temporal distortion of the laser pulses in the AODsand its pre-compensation
3.1.1. BackgroundDue to its high acousto-optic figure of merit, the slow-shear
acoustic wave mode of our AODs offers a much higher diffrac-tion efficiency and a larger acousto-optic bandwidth than thelongitudinal mode (Iyer et al., 2003). Since two AODs arerequired for scanning an image and since power limits the imag-ing depth in turbid samples, slow-shear mode TeO2 AODs arerequired in two-photon microscopy. However, when ultrashortpulses travel a length L through a highly dispersive material suchas TeO2 of index of refraction n(ω), their duration is increasedsince each spectral component ω accumulates different amountsof phase φ(ω) = n(ω)Lω/c. The broadening is related to the groupdelay dispersion (GDD, unit of fs2), which is the second deriva-tive of the phase with respect to the frequency (GDD = φ′′(ω)).The material is characterized by the group delay dispersion peru ′′ut
G
Gaa
t
3
lblffadbta1dTbt
s a function of the ultrasonic frequencies in the AODs. Theame result was obtained by acquiring images with the gal-anometers for different fixed frequencies in the AODs. A stackf images at different axial positions Z (step of 0.5 �m) gaveccess to the axial resolution. At each Z, the maximum intensityas determined and the axial intensity profile deduced. A Gaus-
ian expression was fitted to radial and axial intensity profiles toetermine the radial and axial resolutions.
.5. Characterization of the two-photon fluorescencexcitation
We checked how the two-photon fluorescence excitation wasodified by the AODs, as a function of the depth of imaging in a
urbid sample. We compared, using pulses of the same durationnd power at the sample, the decrease of the fluorescence inten-ity with the AODs and without the AODs on the optical path asfunction of the depth of imaging in a homogeneous solutionf latex beads (1 �m diameter, 2.5% in volume in H2O/D2O),n which fluorescein was added at a concentration of 1 mM. Thecattering length of the suspension was of the order of 100 �mt 900 nm.
.6. Calcium imaging of cell cultures
Pyramidal neurons from rat hippocampus were grown onlass substrates according to a protocol derived from BankerGoslin and Banker, 1991) described in detail elsewhereWyart et al., 2002). Cultures were loaded with 2.5 �M ofhe membrane-permeant acetoxymethyl ester of Oregon-Greenapta-1 (Molecular Probes, Kd ∼ 170 nM) for 20 min at room
nit of length, the group velocity dispersion (GVD = φ (ω)/L,nit of fs2/cm), which is related to the first and second deriva-ives of its index of refraction as:
VD (ω) = 2n′ (ω)
c+ ωn′′ (ω)
c=(
λ3
2πc2
)n′′(λ) (4)
As a consequence, a transform-limited laser pulse with aaussian envelope and of initial duration tin is broadened, bydispersive element of total group delay dispersion L·GVD, tofinal duration tout, given by:
out = tin ·
√√√√1 +(
4 ln 2 · L · GVD
t2in
)2
(5)
.1.2. Pulse broadening and GDD of the AODsWe measured the temporal auto-correlation function of the
aser beam at different points in the microscope, in particularefore and after the AODs. The shorter the wavelength, thearger the time broadening expected, since the GVD decreasesor increasing wavelengths. Experiments were therefore per-ormed at 840 nm, with a pulse width of 9 ± 0.5 nm. AssumingGaussian envelope for the pulse (i.e. the product of the pulseuration (FWHM) by its frequency width (FWHM), the timeandwidth product (TBP), is equal to 0.441), it correspondedo a pulse duration in the oscillator of 115 ± 8 fs (Fig. 2A). Theuto-correlation function just before the AODs had a FWHM of84 ± 15 fs corresponding for a Gaussian envelope to a timeuration of 130 ± 10 fs (Fig. 2A). This slight increase (to aBP of 0.5) might be due to the GVD encountered on theeam path and to some amount of uncompensated GVD inhe cavity. Pulse duration after the AODs increased markedly

R. Salome et al. / Journal of Neuroscience Methods 154 (2006) 161–174 165
Fig. 2. Temporal dispersion of the laser pulses and its pre-compensation. All experiments were performed at 840 nm with a pulse width of 9 nm. (A) Laser pulseduration (FWHM) at different positions: (1) theoretical value in the laser cavity for a transform-limited pulse with a Gaussian envelope; (2) measured at the exit ofthe laser; (3) measured after the AODs; (4) measured after the AODs and with temporal pre-compensation; (5) estimation of the pulse duration at the focus of the40× objective without any temporal pre-compensation. (B) Pre-compensation of the laser pulse broadening in the AODs. (C) Pre-compensation of the laser pulsebroadening in the microscope for the Olympus XLUMPlanFl 20× objective ((�) and dotted line) and the Zeiss IR-Achroplan 40× objective ((�) and solid line) andthe Zeiss Plan 63× objective objective ((�) and dotted line). The dashed line indicates the pulse duration as a function of the inter-prism distance after the AODs(B). (D) Group velocity dispersion: (1) of the AODs estimated from the pulse temporal broadening; (2) of the AODs calculated from the AOD optical characteristics;(3) of the AODs estimated from the temporal pre-compensation curve (B); (4) of the Zeiss IR-Achroplan 40× objective; (5) of the Olympus XLUMPlanFl 20×objective; (6) of the Zeiss Plan 63× objective; (7) of the whole microscope.
to 495 ± 15 fs (Fig. 2A). Using Eq. (5), we can estimate theGDD in the AODs responsible for this large time broadening:17,500 ± 4900 fs2 (Fig. 2D). We can compare this value to theexpected one knowing the physical size and the acousto-opticcharacteristics of our AODs and the GVD of TeO2. TeO2 has anordinary (no) and an extraordinary (ne) index of refraction. Thevalue of the latter one depends on the angle of incidence withrespect to the crystal optical axis. The GVD for each index ofrefraction can be computed using Eq. (4) and using the Sellmeirequation at the incidence used in the AODs (A&A, personalcommunication):
n2o = 1 + 3.7088λ2
λ2 − 0.038575; n2
e = 1 + 3.7302λ2
λ2 − 0.037667(6)
We obtained the GVD along the ordinary axis of 4720, 4320and 3800 fs2/cm and along the extraordinary axis of 4840, 4430and 3890 fs2/cm at 840, 900 and 1000 nm, respectively. The laserpulse in each AOD typically travels 4 mm along the extraor-dinary axis, is diffracted and finally travels 11 mm along theordinary axis. Therefore, the GDD is of the order of 14,300 fs2
(Fig. 2D), in agreement with that estimated above. It is muchlarger than the GDD of a TPSM (a few 100 to a few 1000 fs2)(Soeller and Cannell, 1996; Muller et al., 1998).
3.1.3. Pre-compensation of pulse broadeningAn optical setup has to be inserted into the optical path to pro-
vide negative GDD equal in absolute value to the positive GDDof the whole microscope including the AODs. Negative GDDcan be obtained from devices providing angular dispersion, suchas prisms, gratings, deformable mirrors or from dielectric mir-rors with negative chirp. We used a standard pre-compensationsetup consisting of a double pass through a pair of prisms (Fork,1984). It provides an amount of negative group delay dispersionproportional to the inter-prism distance Lp and can thus be finelytuned:
GDDprisms = −(
2λ3
πc2
)Lpn
′2p (λ) (7)
where np is the index of refraction of the prisms. It was possi-ble to adjust the inter-prism distance so that the pulse duration

166 R. Salome et al. / Journal of Neuroscience Methods 154 (2006) 161–174
showed a marked minimum. At the minimum, the duration of thepulses after the AODs was 120 ± 10 fs for an inter-prism distanceof 110 ± 5 cm (Fig. 2B) (TBP = 0.459, very close from a Gaus-sian transform-limited pulse). It is possible to compensate bythis method for the positive chirp introduced by the AODs. Thelarge inter-prism distance fits easily on a standard optical table(the size of the pre-compensation setup is about half the inter-prism distance, i.e. a few tens of centimeters). Finally, knowingthe negative GVD introduced by our setup (100 ± 15 fs2/cm,see Section 2), we can get a third estimate of the positiveGDD introduced by the AODs, of the order 11,000 ± 2200 fs2
(see Fig. 2D), in acceptable agreement with the two previousestimates.
It is also possible to evaluate if third order dispersion (TOD)might play a role in pulse temporal distortion. The TOD is thethird derivative of the phase (φ′′′(ω), unit of fs3). The temporalshape of pulses after the AODs, either without or with tempo-ral compensation did not exhibit the typical asymmetric shapelinked to TOD; after temporal pre-compensation, the TBP wasalso very close to that of a Gaussian transform-limited pulse.The value of the TOD in the AODs can be computed from Eq.(6) and from the definition of the TOD:
TOD = φ′′′(ω) = −(
λ4
4π2c3
)(3n′′(λ) + λn′′′(λ)) (8)
oadoGt
snaewwcpt26ersct
tlr
F
where f is the laser pulse rate, τ the pulse duration and P0 isthe average laser power. Therefore, the fluorescence emissionis reduced by the same factor and higher laser intensities areneeded. The pre-compensation setup introduces a loss in laserpower of∼20% using prisms at Brewster angle and highly reflec-tive dielectric broadband mirrors. At low imaging depth laserpower is not a limitation for imaging. The use of short pulsesis still advantageous, since it allows, for a same signal to noiseratio, to reduce the heating of the tissue and the photo-bleaching.At larger depth of imaging, the available laser power limits actu-ally the maximum depth of imaging zmax, which scales as:
zmax ∼ l(ex)s ln
(γP0
√1
fτ
)(10)
where l(ex)s is the scattering length for the excitation light in the
tissue, γ = √η2ϕ(zmax)/P(zmax), η2 the fluorescence quantum
efficiency under two-photon excitation, φ(z) the fluorescencecollection efficiency and P(z) is the required average excitationpower at the focal plane (Oheim et al., 2001; Theer et al., 2003).Therefore, despite the loss of 20% in the excitation power, it isworth using a temporal compensation setup in order to obtainpulses four to five times shorter.
3d
3
TiAlt(tlAAaTta
N
wi�
�
Using this equation, the TOD in the AODs is of the orderf 8700 fs3. The TOD is a third order correction of the phaseccumulation when the pulse (duration �t) travels through aispersive medium. Its contribution, which scales as TOD/�t3, isnly about 0.5% of the contribution of the GDD, which scales asDD/�t2, and can be neglected. It seems therefore not necessary
o envisage the use of an additional setup for TOD compensation.To compensate for the GDD of the rest of the micro-
cope including the objective, we used the fluorescence sig-al from a concentrated solution of fluorescein as a temporaluto-correlation measurement for a delay equal to zero. Forach objective used (see Fig. 2C), the inter-prism distanceas increased appropriately with respect to the position usedith the AODs. We found that this adjustment could signifi-
antly increase the amount of fluorescence collected. From theositions of the prisms, we estimated the GDD of each objec-ive. Whereas the GDD for the Zeiss 40× and the Olympus0× objectives were rather low, a few 100 fs2/cm, the Zeiss3× objective introduced significantly more GDD (Fig. 2D), asxpected for an objective including more corrections of aber-ations and in agreement with previous auto-correlation mea-urements (Muller et al., 1998). Finally, without temporal pre-ompensation, pulses would have been broadened to 520 fs byhe AODs and the 40× objective (Fig. 2A).
The fact that ultrashort laser pulses are broadened in dura-ion by a large numerical factor (∼4–5) in the AODs is a majorimitation for in vivo imaging, since the fluorescence emissionates F scales as (Oheim et al., 2001):
∝ P20
fτ(9)
.2. A two-photon microscope based on acousto-opticeflectors without spatial pre-compensation
.2.1. BackgroundThe second difficulty in implementing AODs as scanners in
PSM is the spatial dispersion of the polychromatic laser pulsesnduced by the diffraction of light in the AODs. For a singleOD in the Bragg configuration, the diffraction angle θ(λ) is
inked to the ultrasonic frequency F by Eq. (1) (θ = λF/ν) andhe scan amplitude �θmax to the acoustic bandwidth �F by Eq.2) (�θmax(λ) = λ�F/ν). The resolution of an AOD is defined ashe number N of distinct spots achievable. For monochromaticight, the resolution is limited by the diameter of the beam at theOD (Dbeam
AOD), which here was smaller that the aperture of theOD (see Section 2) and which defines the diffraction-limitedngular spread �θdiff of the laser beam after the AOD: for aEM00 laser beam, �θdiff(λ) = (4/π)λ/Dbeam
AOD. Since in TPSMhe resolution is improved by a factor
√2 due to the non-linear
bsorption of two photons, one obtains:
diff = √2�θmax(λ)
�θdiff(λ)= √
2(π
4
)Dbeam
AOD�F
ν(11)
In our case, Ndiff ∼ 110. However, a femtosecond pulse ofavelength λ0, duration δτ and spectral width δλ ∼ 0.441λ2
0/cδτ,s diffracted at an angle θ given by Eq. (1), with an angular spreadθdisp of the order of:
θdisp(δλ) ∼ δλ · F
ν. (12)

R. Salome et al. / Journal of Neuroscience Methods 154 (2006) 161–174 167
For a 110 fs pulse at 900 nm (δλ ∼ 8 nm), �θdisp is of theorder of 1 mrad. The resolution of an AOD is in this case:
N(λ0, δλ) =√
2�θmax(λ0)√�θ2
disp(δλ) + �θ2diff(λ0)
(13)
N(900 nm, 8 nm) is ∼52. Whereas the resolution of an AODused with a monochromatic laser is only limited by the beamdiameter at the AOD (and has an upper limit which is the AODaperture), the resolution with a femtosecond pulse laser is limitedmainly by the spatial dispersion of the beam in the AOD.
In the microscope, each position X in the field of view corre-sponds to a distinct angle θ of the AODs:
X = fobjθ
T= fobjλ0
F
Tν(14)
The spatial dispersion introduced by the AODs reduces theradial resolution wr of the microscope, defined as the FWHMof the squared intensity point spread function (IPSF2). It corre-sponds to the dimension of the image of a sub-resolution bead. Inthe absence of AODs, the intensity and squared intensity profilesare:
I(X, Y ) = It4 ln 2
w2πexp
{−4 ln 2
(X2 + Y2
w2
)};
I
( ) { ( )}
w
wiAoes
I
d
X
ab
I
Integrating Eq. (18) over λ, one obtains the intensity pro-file Iλ0
1AOD(X, δλ) corresponding to the summation of all thediffraction-limited spots due to each wavelength of the fem-tosecond pulse:
Iλ01AOD(X, δλ) = It
√4 ln 2
π(w2 + (Ffobjδλ/vT )2)
× exp
{−4 ln 2
(X − X(λ0))2
w2 + (Ffobjδλ/vT )2
}(19)
The resolution of the microscope is obtained from the func-tion Iλ0
1AOD2(X, δλ). The image of a sub-resolution bead will
therefore be an ellipse stretched along the X direction, with itssmall axis ws
1AODand its long axis wl1AOD given by:
ws1AOD = wr and wl
1AOD =√
w2r + 1
2
(δλFfobj
vT
)2
=√
w2r + 1
2
(δλ(x + x0)
λ
)2
(20)
where x = λ(F − F0)fobj/vT is the point in the field of viewcorresponding to the frequency F in the AOD (x = 0 at the centerof the field of view), F0 is the central frequency of the acousto-optic bandwidth and x0 = λF0fobj/vT .
The fluorescence intensity is proportional to the squaredintensity Iλ0
1AOD2(X, δλ) and inversely proportional to the pulse
duration (Eq. (9)). The spatial separation of the wavelengths atthe objective focal plane corresponds to a spectral narrowingat any given point. In the temporal domain, it corresponds toan increase of the pulse duration, and to a smaller fluorescenceyield. Using Eqs. (17), (18) and (20), the narrower spectral widthof the pulse δλ1AOD and its longer duration δt1AOD (with respectto the duration δt when all the wavelengths are spatially super-posed) can be computed:
δλ1AOD =(
wr
wl1AOD
)δλ (21)
δt1AOD =(
wl1AOD
wr
)δt (22)
Taking into account both the spatial and the temporal distor-tions, the loss of fluorescence can be computed for an objectwhose dimension L is (i) larger than the laser beam waist asIF
1AOD(δλ)
IF1AOD(0)
=∫
dXI21AOD(X,δλ)∫
dXI21AOD(X,0)
δtδt1AOD
and (ii) smaller than the beam
waist asIF
1AOD(δλ)
IF1AOD(0)
= I21AOD(X(λ0),δλ)
I21AOD(X(λ0),0)
δtδt1AOD
:
IF1AOD(δλ)
IF1AOD(0)
= w2r
w2r + 1/2(Ffobjδλ/vT )2
=(
wr
wl1AOD
)2
, for L � wl1AOD (23a)
2(X, Y ) = I2t
2 ln 2
w2r π
2
exp −4 ln 2X2 + Y2
w2r
;
r = w√2
(15)
here w is the FWHM of the intensity and It is the pulse totalntensity. wr is of the order of 0.5 �m. In the presence of a singleOD along X, the diffraction-limited spot is spread along Xver a typical distance �Xdisp ∼ fobj�θdisp/T ∼ fobjδλF/Tν. Thisffect can be calculated exactly as follows by using a Gaussianpectral intensity profile for the pulse:
(λ) = It
δλ
√4 ln 2
πexp
{−4 ln 2
(λ − λ0
δλ
)2}
(16)
Each wavelength λ of intensity I(λ)dλ is focused as aiffraction-limited spot centered on a position X(λ) given by:
(λ) − X(λ0) = Ffobj
vT(λ − λ0) (17)
nd whose spatial distribution of intensity I1AOD (X, λ, δλ) cane computed using Eqs. (16) and (17):
1AOD(X, λ, δλ) = I(λ) dλ
√4 ln 2
πw2
× exp
{−4 ln 2
(X − X(λ)
w
)2}
= It4 ln 2
πδλw
× exp
{−4 ln 2
[(X − X(λ)
w
)2
+(
λ − λ0
δλ
)2]}
(18)
168 R. Salome et al. / Journal of Neuroscience Methods 154 (2006) 161–174
IF1AOD(δλ)
IF1AOD(0)
= w3r
(w2r + 1/2(Ffobjδλ/vT )2)
3/2
=(
wr
wl1AOD
)3
, for L wl1AOD (23b)
In our case, two crossed AODs along the orthogonal direc-tions X and Y are used at frequencies FX and FY. The IPSF2 isthen an ellipse oriented along an angle θAOD, with a small axisws
2AOD and a long axis ωl2AOD given by:
θAOD = arctan
(FY
FX
), ws
2AOD = wr, wl2AOD
=
√√√√√w2r + 1
2
⎛⎝δλ
√F2
X + F2Yfobj
vT
⎞⎠
2
=
√√√√√w2r + 1
2
⎛⎝δλ(
√x2 + y2 +
√x2
0 + y20)
λ
⎞⎠
2
(24a)
where (x, y) = (λ(FX − F0)fobj/vT, λ(FY − F0)fobj/vT ) isthe point corresponding to the frequencies (FX, FY) (x = y = 0aF
θ
w
t
nraas
(25b) to choose the telescope T such that the microscope resolu-tion and the two-photon fluorescence excitation are reasonablyreduced. In the following, we show that this is achieved usingour experimental conditions.
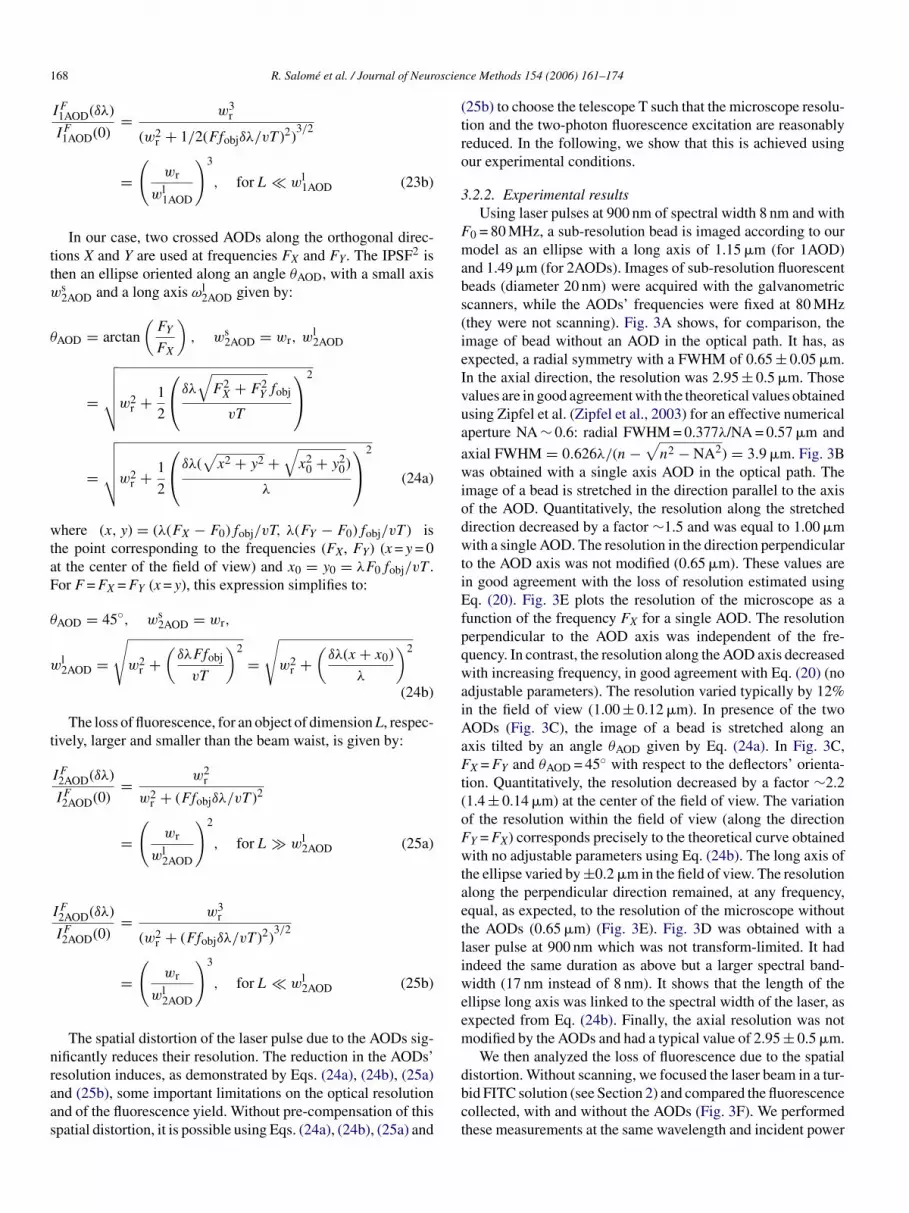
3.2.2. Experimental resultsUsing laser pulses at 900 nm of spectral width 8 nm and with
F0 = 80 MHz, a sub-resolution bead is imaged according to ourmodel as an ellipse with a long axis of 1.15 �m (for 1AOD)and 1.49 �m (for 2AODs). Images of sub-resolution fluorescentbeads (diameter 20 nm) were acquired with the galvanometricscanners, while the AODs’ frequencies were fixed at 80 MHz(they were not scanning). Fig. 3A shows, for comparison, theimage of bead without an AOD in the optical path. It has, asexpected, a radial symmetry with a FWHM of 0.65 ± 0.05 �m.In the axial direction, the resolution was 2.95 ± 0.5 �m. Thosevalues are in good agreement with the theoretical values obtainedusing Zipfel et al. (Zipfel et al., 2003) for an effective numericalaperture NA ∼ 0.6: radial FWHM = 0.377λ/NA = 0.57 �m and
axial FWHM = 0.626λ/(n −√
n2 − NA2) = 3.9 �m. Fig. 3Bwas obtained with a single axis AOD in the optical path. Theimage of a bead is stretched in the direction parallel to the axisof the AOD. Quantitatively, the resolution along the stretcheddirection decreased by a factor ∼1.5 and was equal to 1.00 �mwith a single AOD. The resolution in the direction perpendicularto the AOD axis was not modified (0.65 �m). These values areiEfpqwaiAaFt(oFwtaetliweem
dbct
t the center of the field of view) and x0 = y0 = λF0fobj/vT .or F = FX = FY (x = y), this expression simplifies to:
AOD = 45◦, ws2AOD = wr,
l2AOD =
√w2
r +(
δλFfobj
vT
)2
=√
w2r +
(δλ(x + x0)
λ
)2
(24b)
The loss of fluorescence, for an object of dimension L, respec-ively, larger and smaller than the beam waist, is given by:
IF2AOD(δλ)
IF2AOD(0)
= w2r
w2r + (Ffobjδλ/vT )2
=(
wr
wl2AOD
)2
, for L � wl2AOD (25a)
IF2AOD(δλ)
IF2AOD(0)
= w3r
(w2r + (Ffobjδλ/vT )2)
3/2
=(
wr
wl2AOD
)3
, for L wl2AOD (25b)
The spatial distortion of the laser pulse due to the AODs sig-ificantly reduces their resolution. The reduction in the AODs’esolution induces, as demonstrated by Eqs. (24a), (24b), (25a)nd (25b), some important limitations on the optical resolutionnd of the fluorescence yield. Without pre-compensation of thispatial distortion, it is possible using Eqs. (24a), (24b), (25a) and
n good agreement with the loss of resolution estimated usingq. (20). Fig. 3E plots the resolution of the microscope as a
unction of the frequency FX for a single AOD. The resolutionerpendicular to the AOD axis was independent of the fre-uency. In contrast, the resolution along the AOD axis decreasedith increasing frequency, in good agreement with Eq. (20) (no
djustable parameters). The resolution varied typically by 12%n the field of view (1.00 ± 0.12 �m). In presence of the twoODs (Fig. 3C), the image of a bead is stretched along anxis tilted by an angle θAOD given by Eq. (24a). In Fig. 3C,X = FY and θAOD = 45◦ with respect to the deflectors’ orienta-
ion. Quantitatively, the resolution decreased by a factor ∼2.21.4 ± 0.14 �m) at the center of the field of view. The variationf the resolution within the field of view (along the directionY = FX) corresponds precisely to the theoretical curve obtainedith no adjustable parameters using Eq. (24b). The long axis of
he ellipse varied by ±0.2 �m in the field of view. The resolutionlong the perpendicular direction remained, at any frequency,qual, as expected, to the resolution of the microscope withouthe AODs (0.65 �m) (Fig. 3E). Fig. 3D was obtained with aaser pulse at 900 nm which was not transform-limited. It hadndeed the same duration as above but a larger spectral band-idth (17 nm instead of 8 nm). It shows that the length of the
llipse long axis was linked to the spectral width of the laser, asxpected from Eq. (24b). Finally, the axial resolution was notodified by the AODs and had a typical value of 2.95 ± 0.5 �m.We then analyzed the loss of fluorescence due to the spatial
istortion. Without scanning, we focused the laser beam in a tur-id FITC solution (see Section 2) and compared the fluorescenceollected, with and without the AODs (Fig. 3F). We performedhese measurements at the same wavelength and incident power

R. Salome et al. / Journal of Neuroscience Methods 154 (2006) 161–174 169
Fig. 3. Implementation of AODs without spatial compensation in a two-photon microscope. All experiments were performed at 900 nm with a pulse width of 8 nm(except when explicitly mentioned). (A–D): 10 �m × 10 �m images (sum of 100 frames obtained at video rate with the galvanometric scanners) of a 20 nm fluorescentbead. The scale bar is 2 �m: (A) without AOD on the optical path; (B) with a single AOD along the horizontal direction X (FX = 80 MHz); (C) in the presence of2AODs (FX = FY = 80 MHz); (D) in the presence of 2AODs (FX = FY = 80 MHz) for a pulse width of ∼17 nm; (E) radial resolution of the microscope in the presenceof a single axis AOD along X as a function of the ultrasonic frequency FX and in the presence of the 2AODs as a function of the ultrasonic frequency F = FX = FY. (©)1AOD, resolution along Y. (�) 1AOD, resolution along X. (�) 2AODs, resolution along the small axis of the ellipse (direction FX = −FY). (�) 2AODs, resolutionalong the long axis of the ellipse (direction FX = FY). Solid line: resolution without AOD: 0.65 �m. Dotted line: resolution along X for 1AOD using Eq. (20) of the text,with δλ = 8 nm, wr = 0.65 �m and F0 = 80 MHz. Dashed line: resolution along the long axis of the ellipse for 2AODs using Eq. (24b), with δ� = 8 nm, wr = 0.65 �mand F0 = 80 MHz. (F) Fluorescence intensities (at the same laser power at the back aperture of the microscope and for the optimum temporal pre-compensation) as afunction of the depth in a solution of latex beads (1 �m in diameter, 2.5% in volume, in H2O/D2O stained with fluorescein) with the AODs (�) and without AODs(�). Inset: Evolution of the relative fluorescence intensities (the fluorescence intensity normalized by the fluorescence intensity at the surface of the sample), as afunction of the imaging depth.
in the sample and without saturating the fluorescence emission.Pre-compensation of the temporal distortion was optimized ineach case. In the presence of the AODs, the fluorescence emis-sion was of the order of one half of the intensity observed withoutthe AODs. Both curves were fitted to an exponential with a lengthscale of ∼90 �m. The difference in intensity can be attributedto the spatial distortion. The insert in Fig. 3F shows the fluo-
rescence normalized by the one at the top of the sample. As thetwo curves fold together, it demonstrates that AODs reduce thedepth of imaging in a turbid sample only because of the reduc-tion in laser power and in spatial resolution. Therefore, withoutspatial pre-compensation, AODs can be used in TPSM, but withsevere constraints on the field of view to prevent a too large lossof resolution.

170 R. Salome et al. / Journal of Neuroscience Methods 154 (2006) 161–174
3.3. A two-photon microscope based on acousto-opticdeflectors with spatial pre-compensation
3.3.1. BackgroundAn additional dispersive element must be used to suppress
the angular dispersion of the wavelengths due to the AODs.As such a setup introduces a fixed amount of dispersion, it canonly compensate perfectly for the distortion at the center of thefield of view. It can be placed before the AODs as a spatial pre-compensation setup. Different dispersive elements have beenused to compensate for the distortion introduced by only a singleAOD, e.g. prisms (Lechleiter et al., 2002; Roorda et al., 2004)and gratings (Iyer et al., 2003). To compensate for the largerdispersion due to two crossed AODs, the use of an AOM as aprism with an adjustable apex angle was proposed in the field oflaser metallurgy (Ngoi, 2001). We used an AOM placed at 45◦with respect to the two axes of the AODs (Fig. 4A) and choseappropriately the propagation direction and the frequency of theultrasonic wave in the AOM, which propagates in the oppositedirection with respect to the sum of the two waves in the AODs(Fig. 4A). In order to compensate for the spatial distortion atthe center of the field of view (FX = FY = F0), its frequency wasfixed at a value FAOM given by:
FAOM = F0 ·√
2 (26)
cgcclcF
w
Fig. 4. The pre-compensation of the spatial distortion of the laser pulse. Allthe experiments were performed at 840 nm with a pulse width of 9 nm. (A)Scheme showing how the AOM was inserted at 45◦ before the two AODs. Thepropagation direction of the ultrasonic waves in each AOD is indicated by arrows.(B) Radial resolution of the microscope, after the pre-compensation of the spatialdistortion, as a function of the ultrasonic frequency F = FX = FY. Empty circle(©): resolution along the small axis of the ellipse (direction FX = −FY). Blacksquare (�): resolution along the long axis of the ellipse (direction FX = FY). Solidline: resolution without AOD (0.72 �m). Dashed line: theoretical resolutionafter pre-compensation using Eq. (27) of the text, with δλ = 9 nm and wr =0.65 �m. Dashed-dotted line: theoretical resolution in the same configurationbut without spatial pre-compensation using Eq. (24b), with δλ = 9 nm and wr =0.65 �m. The axial resolution is ∼2.95 �m. (C) 16 �m × 16 �m images of 20 nmin diameter fluorescent beads scanned with the AODs. Left: with the Zeiss 40×objective. Right: with the Olympus 20× objective. (D) Images of Oregon greenbapta-1 AM labeled hippocampal neurons in culture scanned with the AODs.Left: 60 �m × 60 �m field of view obtained with the Zeiss 40× objective. Right:130 �m × 130 �m field of view obtained with the Olympus 20× objective.
This solution offers the possibility to change the amount ofompensation in the AOM as a function of the wavelength, toet a tunable scanner. The pre-compensation is perfect at theenter of the field of view and partial at points far from theenter. On the diagonal (FX = FY = F), the resolution along theong (wl,c
2AOD) and small (ws,c2AOD) axis and the loss in fluores-
ence (IF,c2AOD(δλ)/IF,c
2AOD(0)) can be estimated by replacing F by− F0 (x + x0 by x) in Eqs. (24a), (24b), (25a) and (25b).
l,c2AOD =
√w2
r +(
δλ(F − F0)fobj
vT
)2
=√
w2r +
(δλx
λ
)2
, ws,c2AOD = wr (27)
IF,c2AOD(δλ)
IF,c2AOD(0)
= w2r
w2r + (δλ(F − F0)fobj/vT )2
=(
wr
wl,c2AOD
)2
, for L � wl,c2AOD (28a)
IF,c2AOD(δλ)
IF,c2AOD(0)
= w3r
(w2r + (δλ(F − F0)fobj/vT )2)
3/2
=(
wr
wl,c2AOD
)3
, for L wl,c2AOD (28b)

R. Salome et al. / Journal of Neuroscience Methods 154 (2006) 161–174 171
3.3.2. Experimental resultsThe resolution of the compensated microscope is shown on
Fig. 4B. The resolution along the small axis was independent ofthe frequency as expected and was equal to 0.72 ± 0.05 �m.It corresponds to an effective numerical aperture in this setof experiments of ∼0.45. As a result of the spatial pre-compensation, the resolution along the stretched direction wasclose from the diffraction-limited resolution over the wholefrequency range. At the center of the field of view, the spa-tial distortion was fully compensated, while a residual dis-tortion was observed for points near the edge. Experimentalmeasurements of this distortion were in excellent agreementwith the theoretical curve (dashed line: Eq. (27), the distor-tion was 15% larger than the theoretical one). The resolution inthe same conditions without spatial pre-compensation is drawnon the Fig. 4B (dashed-dotted line): the pre-compensation hasimproved the resolution by a factor of almost 3, and thus thetwo-photon fluorescence excitation by a factor 27, using Eq.(28b). Fig. 4C shows typical images of 20 nm fluorescent beadsscanned with the AODs, using the 40× objective (left) and the20× objective (right). Note in both cases the circular shapeof the images of the beads, which are diffraction-limited, as
compared to Fig. 3B–D. The resolution of the image with theobjective 20× has only a 1 �m resolution since the effectivenumerical aperture for this objective in this setup was of theorder of 0.3: no image could be obtained without spatial pre-compensation in this case! Images shown in Fig. 4D are scanswith AODs of Oregon Green Bapta-1 AM labeled neurons inculture (see Section 2). The field of view is 60 �m (40×, left)and 130 �m (20×, right). Fine details are clearly observable.Finally, the AOM introduced the same amount of GVD aseach AOD (∼7000 fs2). The total GVD of the AOM-2AODsscanner is ∼21,000 fs2 and was pre-compensated by adjust-ing the inter-prism distance in the temporal pre-compensationsetup.
3.4. Optical recordings of action-potential-evoked calciumtransients in pyramidal neuron somata
To demonstrate that recordings over a long period of timeat multiple sites and at high acquisition rate can be achievedwith AODs, we studied hippocampal neurons in culture. After 2weeks in vitro, these cultures were spontaneously active (Wyartet al., 2002). To estimate optically the time of action potential
Feiozb
ig. 5. Examples of ultrafast calcium imaging of spontaneous action potentials inxperiments were performed with the Zeiss 40× objective at 900 nm with a pulse wimages of neurons labeled with Oregon green bapta-1 AM, obtained with the galvanof 0.1 kHz. (A2–C2) The relative variation (�F/F) of the fluorescence intensity (F) iooms of, respectively, (A2), (B2) and (C2). Long recordings are very stable whereasursts can be visualized by this type of recording.
cultured hippocampal neurons labeled with Oregon green bapta-1 AM. Alldth of 10 nm; spatial compensation was not used. (A1–C1): 140 �m × 140 �mmeters. Points indicated by crosses on each image are scanned at a frequency
s plotted as a function of time. (A3 and A4), (B3 and B4) and (C3 and C4) arezooms indicated that bursts of action potentials as well individual spikes within

172 R. Salome et al. / Journal of Neuroscience Methods 154 (2006) 161–174
emission in several cells, we monitored the calcium transientsin their cell bodies. These somatic calcium transients mea-sured with high affinity dyes have a time to peak of 5–50 msfollowing the action potential and a relaxation time of 1–5 s(Smetters et al., 1999). We scanned three to five neurons withthe AODs (Fig. 5). It shows that calcium transients can bedetected simultaneously in each cell. The calcium transientshad a time to peak of typically 10–15 ms in most cases and adecay time of about 1–2 s, as expected. Taking into accountthis time to peak of the transients, we choose a samplingrate of 0.1 kHz (even though much higher rate can be usedin our setup) in order to follow the transients in each neu-ron with a maximum signal to noise ratio. Each neuron wastherefore illuminated for a time depending on the number ofscanned neurons for 10/3 = 3.3 ms (Fig. 5A2–A4), 10/4 = 2.5 ms(Fig. 5B2–B4) and 10/5 = 2 ms (Fig. 5B2–B4). Less than 5 �swas necessary to move between each point and the amount oflight lost during the move was negligible (typically 5 �s/2 ms= 0.25%).
Measurements could be achieved over a long period of time,which is a striking feature (Fig. 5A2, B2 and C2). The opti-cal recordings lasted for minutes (5 min in the cases shown)with almost no photo-bleaching in certain cases (Fig. 5A2and C2), despite the fact that the laser was focused at eachrecording point for a third of the total time, i.e. a fewmillisecond. Therefore, very long recordings without majorccidtfrtwco√oootttn
4
bodcpdp2
was compensated using an SF11 prism (Lechleiter et al., 2002),an SF10 prism (Roorda et al., 2004) or a diffraction grating(Iyer et al., 2003). In this paper, we extend these works to a realtwo-dimensional AOD-based scanner introducing much largertemporal and spatial dispersions. Whereas temporal compen-sation of the GDD was also obtained using pairs of prisms, thespatial dispersion was compensated using an AOM placed at 45◦with respect to the AODs. This latter solution allows fine tun-ing of the spatial compensation and the design of a wavelengthtunable scanner. This paper describes for the first time a two-dimensional AOD-based scanner with compensation of bothspatial and temporal distortions. Its performances are stronglysupported by a simple model, which facilitates the future designof two-photon AOD-scanning microscopes fitted to the user’sneed in term of spatial resolution, field of view or depth ofpenetration.
The angular spread after the AODs dramatically decreasestheir resolution and strongly limits the field of view. For anuncompensated microscope, the maximum field of view FOVmaxusing Eqs. (24a), (24b), (25a) and (25b) is:
wl2AOD = γwr,
IF2AOD(δλ)
IF2AOD(0)
= 1
γ2 (L > wl2AOD) or
IF2AOD(δλ)
IF (0)= 1
γ3 (L < wl2AOD) ⇔ FOVmax
0LtprcrncdiAoepaTasdvsibflid
ell damage were possible, even though the beam was notontinuously scanned at different locations, as in standardmaging. The possibility to scan a few points is thereforeemonstrated. Moreover, using the AODs also as modula-ors, it was possible to adjust the laser power independentlyor each point to optimize the photon count rate and toeduce photo-toxicity. In our experiments, an average pho-on count rate of 500 kHz–1 MHz was used for each cellhen the laser was focused on the cell body. The typical
ount per neuron and per time step (2–3.3 ms) was of therder of 1000–3000, respectively. The photon noise was of1000 = 33 to ∼ √
3000 = 55 and corresponded to 3.3–2%f the signal. Successive bursts of activity consisting of seriesf transients separated by a few hundred milliseconds werebserved in all recordings. A signal variation of 5–10% perransient was measured, which was larger than the experimen-al noise. The high acquisition rate enabled the observationhat most of the transients are highly synchronous between theeurons.
. Discussion
It has been believed for a long time that AODs could note used in TPSM. The main concerns were the angular spreadf the pulsed laser after an AOD and the increase of the pulseuration. Recent studies have however shown that a single AODould be introduced into a two-photon scanning microscope toerform fast scanning in one direction. The temporal dispersionue to the single axis AOD was compensated using a doubleass through a pair of prisms (Lechleiter et al., 2002; Iyer et al.,003; Roorda et al., 2004). The spatial dispersion of the AOD
2AOD
=√
γ2 − 1wrλ
δλ
�F
F0 + �F/2(29)
For γ = 2, this corresponds to a FOVmax of 45 �m (wr =.65 nm, δλ = 8 nm, λ = 900 nm, �F = 35 MHz, F0 = 80 MHz).arger values of � are not acceptable in most cases. This is
he simple way to implement AOD-based scanners in two-hoton microscopy, but it may only be useful for in vitro studiesequiring reduced fields of view. Deep imaging requires theompensation of the large spatial distortion for optimal fluo-escence excitation. We have presented in this paper a tech-ical solution based on an AOM to fully compensate at theenter of the field of view for the spatial distortion intro-uced by a pair of AODs. At the center of the field of view,t provides, by the proper adjustment of the frequency in theOM, a perfect correction to the loss of resolution and of flu-rescence yield. This latter effect arises both from a spatialffect (restored diffraction-limited focusing) and from a tem-oral effect (restored optimal temporal pulse shape). The over-ll transmission of an AOM-AODs scanner is about 40–50%.herefore, using a commercial laser source, hundreds of mWre available at the objective back aperture. At low depth incattering tissues, as in thin slices, the loss of fluorescenceue to remaining spatial distortion on the edge of the field ofiew can be compensated by increasing the illumination inten-ity. At higher depth, such as in in vivo studies, when theres no more laser power available, the loss in fluorescence cane compensated by increasing the time spent in points whereuorescence is lower. Spatial pre-compensation also allows
maging wider fields of view. After compensation, the residualistortion on the edges eventually limits the maximum field of

R. Salome et al. / Journal of Neuroscience Methods 154 (2006) 161–174 173
view:
wl,c2AOD = γwr,
IF,c2AOD(δλ)
IF,c2AOD(0)
= 1
γ2 (L > wl,c2AOD) or
IF,c2AOD(δλ)
IF,c2AOD(0)
= 1
γ3 (L < wl,c2AOD)
⇔ FOVmax = 2√
γ2 − 1wrλ
δλ(30)
For γ = 2, the maximum field of view is about 220 �m, usinga telescope of magnification T = 0.82 (λ = 840 nm, δλ = 9 nm,wr = 0.7 nm). This will require large AODs with a clear apertureof 11 mm. Recent studies have shown that custom AODs of 9 mmcan be provided (Iyer et al., 2003). Our supplier can also providecustom AODs with apertures up to 13 mm. Spatial compensationusing an AOM offers the possibility of imaging large fields ofview, as is very often required in physiological studies. Finally,let us note that Eq. (30) shows that even larger fields of viewmight be obtained by the use of lasers with smaller spectralbandwidth (and longer pulses).
AODs offer the unique possibility of achieving extremelyfast scanning of a set of points. The laser beam can be movedbetween points within 3–5 �s with our system. This could not beachieved with galvanometers which usually require 1 ms for astep. Moreover, galvanometers have some amount of positionalntdtutftascmcototto
sdaora
A
f
ing us his auto-correlator. This work has been supported by a“Human Frontier Science Foundation” research grant, by the“Ministere de la Recherche et de l’Enseignement Superieure”(Actions Concertees Incitatives Jeunes Chercheurs 1999), theCNRS (Programme Physique et Chimie du Vivant 1997, Pro-grammes Ultimatech 1997 and 1998), the SPM department ofCNRS (Projet jeune chercheur 1999, ATIP jeune chercheur2002), the French-Israeli Collaboration Program Arc en ciel2001/02 and the TMR Marie Curie Research Training Grant.
References
Bullen A, Saggau P. High-speed, random-access fluorescence microscopy:II. Fast quantitative measurements with voltage-sensitive dyes. Biophys J1999;76:2272–87.
Bullen A, Patel SS, Saggau P. High-speed, random-access fluorescencemicroscopy: I. High-resolution optical recording with voltage-sensitivedyes and ion indicators. Biophys J 1997;73:477–91.
Denk W, Piston DW, Webb WW. Two-photon molecular excitation in laser-scanning microscopy. In: Pawley JB, editor. Handbook of biologicalconfocal microscopy. New York: Plenum; 1995. p. 445–58.
Dunn AK, Wallace VP, Coleno M, Berns MW, Tromberg BJ. Influence ofoptical properties on two-photon fluorescence imaging in turbid samples.Appl Opt 2000;39:1194–201.
Fan GY, Fujisaki H, Miyawaki A, Tsay RK, Tsien RY, Ellisman MH. Video-rate scanning two-photon excitation fluorescence microscopy and ratioimaging with cameleons. Biophys J 1999;76:2412–20.
Fork MGordon. Negative dispersion using pairs of prisms. Opt Lett
G
H
H
I
L
M
N
O
O
P
R
S
S
S
T
oise, of the order of several tens of �rad, which also limitsheir accuracy for this type of scanning. Such positional noiseoes not exist in the AODs, which are therefore perfectly fittedo scanning individual points. Our software allows choosing aser-defined number of points of interest for acquisition rates upo a few kHz. The number of points is ultimately limited by twoactors. The first limitation is the commutation time betweenwo points. The use of larger AODs will increase this time tobout 20 �s for a 13 mm in diameter AODs scanner, which istill very fast. The second limitation is the number of photons Nollected per point of interest. As the photon noise (N1/2) is theain noise, it defines the smallest signal change (1/N1/2) that
an be then detected at that rate. We have shown that these typesf scans can be used to record action-potential-evoked calciumransients in a set of neurons. A high signal to noise ratio isbtained and long recordings can be achieved. The possibilityo optimize the illumination for each point, in order to maximizehe signal to noise ratio with a minimum photobleaching, is alsof particular interest.
We have demonstrated that the use of AODs as scanningystem is possible in TPSM. Full compensation of the spatialispersion can be achieved using an additional AOM. It restoresn optimal resolution and two-photon excitation at the centerf field of view with minimal distortion on its edge. Opticalecordings of electrical activity of neuronal networks in slicesnd in vivo could take great advantage of this type of scanning.
cknowledgments
We thank Anne Feltz, Jens Eilers and Luca Guidoni forruitful discussions. We are grateful to Olivier Cregut for lend-
1984;9:150–2.oslin K, Banker G. Rat hippocampal neurons in low density culture. In:
Banker G, Goslin K, editors. Culturing nerve cells. Cambridge: MITPress; 1991. p. 251–81.
elmchen F, Denk W. New developments in multiphoton microscopy. CurrOpin Neurobiol 2002;12:593–601.
elmchen F, Waters J. Ca2+ imaging in the mammalian brain in vivo. Eur JPharmacol 2002;447:119–29.
yer V, Losavio BE, Saggau P. Compensation of spatial and temporal disper-sion for acousto-optic multiphoton laser-scanning microscopy. J BiomedOpt 2003;8:460–71.
echleiter JD, Lin DT, Sieneart I. Multi-photon laser scanning microscopyusing an acoustic optical deflector. Biophys J 2002;83:2292–9.
uller M, Squier J, Wolleschensky R, Simon U, Brakenhoff GJ. Dispersionpre-compensation of 15 femtosecond optical pulses for high-numerical-aperture objectives. J Microsc 1998;191:141–50.
goi. Angular dispersion compensation for acousto-optic devices used forultrashort-pulsed laser micromachining. Opt Expr 2001;9:200–6.
heim M, Beaurepaire E, Chaigneau E, Mertz J, Charpak S. Two-photonmicroscopy in brain tissue: parameters influencing the imaging depth. JNeurosci Methods 2001;111:29–37.
ron D, Tal E, Silberberg Y. Scanningless depth-resolved microscopy. OptExpr 2005;13:1468–76.
eterlin ZA, Kozloski J, Mao BQ, Tsiola A, Yuste R. Optical probingof neuronal circuits with calcium indicators. Proc Natl Acad Sci USA2000;97:3619–24.
oorda RD, Hohl TM, Toledo-Crow R, Miesenbock G. Video-rate nonlinearmicroscopy of neuronal membrane dynamics with genetically encodedprobes. J Neurophysiol 2004;92:609–21.
metters D, Majewska A, Yuste R. Detecting action potentials in neuronalpopulations with calcium imaging. Methods 1999;18:215–21.
oeller C, Cannell MB. Construction of a two-photon microscope and opti-misation of illumination pulse duration. Pflugers Arch 1996;432:555–61.
traub M, Lodemann P, Holroyd P, Jahn R, Hell SW. Live cell imaging bymultifocal multiphoton microscopy. Eur J Cell Biol 2000;79:726–34.
heer P, Hasan MT, Denk W. Two-photon imaging to a depth of 1000 micronin living brains by use of a Ti:Al2O3 regenerative amplifier. Opt Lett2003;28:1022–4.

174 R. Salome et al. / Journal of Neuroscience Methods 154 (2006) 161–174
Tsien RY, Bacskai BJ. Video-rate confocal microscopy. In: Pawley JB, editor.Handbook of biological confocal microscopy. New York: Plenum; 1995.p. 459–78.
Wier WG, Balke CW, Michael JA, Mauban JR. A custom confocal andtwo-photon digital laser scanning microscope. Am J Physiol Heart CircPhysiol 2000;278:H2150–6.
Wyart C, Ybert C, Bourdieu L, Herr C, Prinz C, Chatenay D. Con-strained synaptic connectivity in functional mammalian neuronal net-
works grown on patterned surfaces. J Neurosci Methods 2002;117:123–31.
Yariv A. Optical electronics in modern communications. Oxford: OxfordUniversity Press; 1997.
Yuste R, Lanni F, Konnerth A. Imaging neurons: a laboratory manual. ColdSpring Harbor: Cold Spring Harbor Laboratory Press; 2000.
Zipfel WR, Williams RM, Webb WW. Nonlinear magic: multiphotonmicroscopy in the biosciences. Nat Biotechnol 2003;21:1369–77.
Related Documents