Drug and Alcohol Dependence 132 (2013) 352–361 Contents lists available at SciVerse ScienceDirect Drug and Alcohol Dependence j ourna l ho me p age: www.elsevier.com/locate/drugalcdep Ultra-rapid screening for substance-use disorders: The Alcohol, Smoking and Substance Involvement Screening Test (ASSIST-Lite) Robert Ali a,* , Sonali Meena b , Brian Eastwood c,d , Ian Richards a , John Marsden c,d a Discipline of Pharmacology, School of Medical Sciences, University of Adelaide, Australia b WHO Collaborating Centre for the Treatment of Drug and Alcohol Problems, Discipline of Pharmacology, School of Medical Sciences, University of Adelaide, Australia c Addictions Department, Institute of Psychiatry, King’s College London, United Kingdom d Drugs and Alcohol, Health and Wellbeing Directorate, Public Health, England a r t i c l e i n f o Article history: Received 22 December 2012 Received in revised form 26 February 2013 Accepted 4 March 2013 Available online 3 April 2013 Keywords: Alcohol, Smoking and Substance Involvement Screening Test ASSIST-Lite Alcohol, tobacco, cannabis, stimulant, sedative, opioid, substance use disorder Substance dependence Screening a b s t r a c t Background: The Alcohol, Smoking and Substance Involvement Screening Test (ASSIST 3.0; index test) is a structured interview for alcohol, tobacco, cannabis, stimulants, sedatives and opioid use disorders in general medical settings. Perceived administration time deters routine use. This study releases a short- form: the ASSIST-Lite. Methods: Diagnostic accuracy study among 2082 adults recruited from general medical (70%) and spe- cialist mental health/addiction treatment services (22%). Current DSM-IV substance dependence (MINI International Neuropsychiatric Interview) and moderate–severe tobacco dependence (Fagerstrom Nico- tine Dependence Test) were reference standards. Exploratory factor and item-response theory models re-calibrated ordinal test items. Items for the ASSIST-Lite were selected by diagnostic accuracy evaluation (area under the receiver-operating characteristic [AUC] curve [≤0.7]), sensitivity, specificity, positive and negative predictive values [PVP, NVP], kappa, likelihood ratios [LR+, LR-], and clinical utility index [CU+, CU-]). Results: For each substance an item pair was selected (AUC [0.8–1.0], sensitivity [0.8–1.0], specificity [0.7–0.8], PVP [0.8–1.0], NVP [0.7–1.0], kappa [0.5–0.9], LR+ [2.5–5.9], LR- [0.0–0.2], CU+ [0.7–0.9], and CU- [0.5–0.8]). Gender, age and recruitment setting (specialist mental health versus general medical) did not moderate accuracy, with the exception of opioids (AUC <0.7, participants ≥59 years). Male opioid users had more severe substance involvement scores that females (differential item functioning analysis, P = 0.00). There was no evidence of differential accuracy between countries (AUC range, 0.8–1.0). Conclusion: The ASSIST-Lite is an ultra-rapid screener which has been optimised for general medical settings. Optionally, a criterion question can be added to capture hazardous drinking, and to capture use of another type of mood-altering substance. Crown Copyright © 2013 Published by Elsevier Ireland Ltd. All rights reserved. 1. Introduction Psychoactive substance use is one of the global leading causes of preventable morbidity and mortality (World Health Organization [WHO], 2010). Alcohol, tobacco and illicit drug use account for 4.4%, 3.7% and 0.9% respectively of disability-adjusted life years (WHO, 2008). In 2010, 2 billion people drank alcohol, 1.3 billion smoked tobacco, and up to 224 million people used cannabis (WHO, 2002; Supplementary material can be found by accessing the online version of this paper. Please see Appendix A for the ASSIST-Lite questionnaire on page XX in this article. * Corresponding author at: Medical School North, Discipline of Pharmacology, School of Medical Sciences, University of Adelaide, South Australia 5005, Australia. Tel.: +61 8 83638683; fax: +61 8 8124 1492. E-mail address: [email protected] (R. Ali). UNODC, 2012). Amphetamine-type stimulants (ATS; including 3,4-methylenedioxy-N-methylamphetamine, ecstasy) and cocaine are used by 73 million people, and 36 million people use illicit opioids (WHO, 2009). Non-medical use of prescription stimulants, sedatives and opioids is an established or emerging problem for many countries, including the USA and Australia (World Drug Report, 2012). Front-line healthcare professionals can play a key role in the detection and prevention of hazardous alcohol consumption, smok- ing and substance-related problems (Madras et al., 2009). In 1997, the WHO initiated a project to develop a culturally neutral screening test covering the use of major classes of psychoactive substance. A group of substance use disorders (SUD) researchers from Australia, Brazil, India, Israel, the Palestinian Territories, Puerto Rico, the United Kingdom (UK) and Zimbabwe (coordi- nated by a USA research centre) created an initial version of 0376-8716/$ – see front matter. Crown Copyright © 2013 Published by Elsevier Ireland Ltd. All rights reserved. http://dx.doi.org/10.1016/j.drugalcdep.2013.03.001

Welcome message from author
This document is posted to help you gain knowledge. Please leave a comment to let me know what you think about it! Share it to your friends and learn new things together.
Transcript
Drug and Alcohol Dependence 132 (2013) 352– 361
Contents lists available at SciVerse ScienceDirect
Drug and Alcohol Dependence
j ourna l ho me p age: www.elsev ier .com/ locate /drugalcdep
Ultra-rapid screening for substance-use disorders: The Alcohol,Smoking and Substance Involvement Screening Test (ASSIST-Lite)!
Robert Alia,!, Sonali Meenab, Brian Eastwoodc,d, Ian Richardsa, John Marsdenc,d
a Discipline of Pharmacology, School of Medical Sciences, University of Adelaide, Australiab WHO Collaborating Centre for the Treatment of Drug and Alcohol Problems, Discipline of Pharmacology, School of Medical Sciences, University ofAdelaide, Australiac Addictions Department, Institute of Psychiatry, King’s College London, United Kingdomd Drugs and Alcohol, Health and Wellbeing Directorate, Public Health, England
a r t i c l e i n f o
Article history:Received 22 December 2012Received in revised form 26 February 2013Accepted 4 March 2013Available online 3 April 2013
Keywords:Alcohol, Smoking and SubstanceInvolvement Screening TestASSIST-LiteAlcohol, tobacco, cannabis, stimulant,sedative, opioid, substance use disorderSubstance dependenceScreening
a b s t r a c t
Background: The Alcohol, Smoking and Substance Involvement Screening Test (ASSIST 3.0; index test) isa structured interview for alcohol, tobacco, cannabis, stimulants, sedatives and opioid use disorders ingeneral medical settings. Perceived administration time deters routine use. This study releases a short-form: the ASSIST-Lite.Methods: Diagnostic accuracy study among 2082 adults recruited from general medical (70%) and spe-cialist mental health/addiction treatment services (22%). Current DSM-IV substance dependence (MINIInternational Neuropsychiatric Interview) and moderate–severe tobacco dependence (Fagerstrom Nico-tine Dependence Test) were reference standards. Exploratory factor and item-response theory modelsre-calibrated ordinal test items. Items for the ASSIST-Lite were selected by diagnostic accuracy evaluation(area under the receiver-operating characteristic [AUC] curve ["0.7]), sensitivity, specificity, positive andnegative predictive values [PVP, NVP], kappa, likelihood ratios [LR+, LR#], and clinical utility index [CU+,CU#]).Results: For each substance an item pair was selected (AUC [0.8–1.0], sensitivity [0.8–1.0], specificity[0.7–0.8], PVP [0.8–1.0], NVP [0.7–1.0], kappa [0.5–0.9], LR+ [2.5–5.9], LR# [0.0–0.2], CU+ [0.7–0.9], andCU# [0.5–0.8]). Gender, age and recruitment setting (specialist mental health versus general medical)did not moderate accuracy, with the exception of opioids (AUC <0.7, participants $59 years). Male opioidusers had more severe substance involvement scores that females (differential item functioning analysis,P = 0.00). There was no evidence of differential accuracy between countries (AUC range, 0.8–1.0).Conclusion: The ASSIST-Lite is an ultra-rapid screener which has been optimised for general medicalsettings. Optionally, a criterion question can be added to capture hazardous drinking, and to capture useof another type of mood-altering substance.
Crown Copyright © 2013 Published by Elsevier Ireland Ltd. All rights reserved.
1. Introduction
Psychoactive substance use is one of the global leading causes ofpreventable morbidity and mortality (World Health Organization[WHO], 2010). Alcohol, tobacco and illicit drug use account for 4.4%,3.7% and 0.9% respectively of disability-adjusted life years (WHO,2008). In 2010, 2 billion people drank alcohol, 1.3 billion smokedtobacco, and up to 224 million people used cannabis (WHO, 2002;
! Supplementary material can be found by accessing the online version of thispaper. Please see Appendix A for the ASSIST-Lite questionnaire on page XX in thisarticle.
! Corresponding author at: Medical School North, Discipline of Pharmacology,School of Medical Sciences, University of Adelaide, South Australia 5005, Australia.Tel.: +61 8 83638683; fax: +61 8 8124 1492.
E-mail address: [email protected] (R. Ali).
UNODC, 2012). Amphetamine-type stimulants (ATS; including3,4-methylenedioxy-N-methylamphetamine, ecstasy) and cocaineare used by 73 million people, and 36 million people use illicitopioids (WHO, 2009). Non-medical use of prescription stimulants,sedatives and opioids is an established or emerging problem formany countries, including the USA and Australia (World DrugReport, 2012).
Front-line healthcare professionals can play a key role in thedetection and prevention of hazardous alcohol consumption, smok-ing and substance-related problems (Madras et al., 2009). In1997, the WHO initiated a project to develop a culturally neutralscreening test covering the use of major classes of psychoactivesubstance. A group of substance use disorders (SUD) researchersfrom Australia, Brazil, India, Israel, the Palestinian Territories,Puerto Rico, the United Kingdom (UK) and Zimbabwe (coordi-nated by a USA research centre) created an initial version of
0376-8716/$ – see front matter. Crown Copyright © 2013 Published by Elsevier Ireland Ltd. All rights reserved.http://dx.doi.org/10.1016/j.drugalcdep.2013.03.001
R. Ali et al. / Drug and Alcohol Dependence 132 (2013) 352– 361 353
the Alcohol, Smoking and Substance Involvement Screening Test(ASSIST) for alcohol, tobacco, cannabis, ATS, cocaine, sedatives(tranquillisers and anxiolytics), opioids (illicit heroin and pain med-ications), hallucinogens, volatile inhalants and other drugs. ASSIST2 was released with a common set of items for each substanceshown to be internally consistent (alpha range 0.73–0.92) andinter-rater reliable (three-day, kappa range 0.61–0.78; WHO ASSISTWorking Group, 2002).
In 2006, a multi-centre study (Australia, Brazil, India, UK,Thailand, the USA and Zimbabwe) recruited a sample of adults($18 years) from general medical clinics (office-based primarycare physicians, hospital services, sexually health clinics, and com-munity health centres) and specialist mental health/addictionstreatment clinics (one-third intentionally recruited from thesespecialist services to capture higher SUD severity) to evaluateconstruct, concurrent, discriminative and criterion validity char-acteristics (Humeniuk et al., 2008; Sample 1 in the present study).Trained interviewers sampled hair for drug toxicology testing tovalidate self-report, administered the ASSIST interview and severalquestionnaires (including the Alcohol Use Disorders IdentificationTest [AUDIT]), the MINI International Neuropsychiatric Interviewfor DSM-IV [MINI Plus; Sheehan et al., 1998], and the Revised Fager-strom Tolerance Questionnaire [RTQ; Tate and Schmitz, 1993]). Anindependent clinical evaluation was then used to confirm depend-ence diagnoses. Version 3.0 was released with refinements toitem scoring and recommendations for interventions (Humeniuket al., 2003). Evidence for the predictive validity of score-treatmentmatching was secured from a randomised controlled trial of a briefmotivational intervention for moderate severity SUD in generalmedical settings in Australia, Brazil, India and the USA (Humeniuket al., 2012; Sample 2 in the present study). Finally, an indepen-dent, multi-centre study at the University of Adelaide (coordinatedby authors R.A. and J.M) evaluated a truncated version of ASSIST3.0 embedded in a lifestyle (diet and exercise) screening inter-view in general medical services in Australia, China, India, SouthKorea and Thailand, and included the MINI clinical interview forSUD and the Fagerstrom Nicotine Dependence Test (FTND) as ref-erence standards administered by 2–3 trained interviewers in eachcentre (recruitment between 08/2011 and 02/2012; Sample 3 inthe present study).
The ASSIST has, therefore, been evaluated in a range of Westernand Eastern cultures by the development team. Implementationresources are available (Humeniuk et al., 2003, 2010a,b) and theinstrument has attracted independent validation research in France(Khan et al., 2011) and in specific populations (young people withfirst-episode psychosis [Hides et al., 2009], and pregnancy [Hothamet al., in press]). The US National Institute on Drug Abuse has alsoincluded a modified version of ASSIST 3.0 in the NIDA-MED initia-tive (NIDA, 2009).
However, translating the ASSIST into routine use in healthservices has proved problematic. SUD are not systematicallyscreened, diagnosed or treated in general medical settings, andtime constraints on staff appear to be the main barrier (Banta andMontgomery, 2007; Smith et al., 2010). Perceived lengthy admin-istration of the ASSIST (around 15 min) has deterred its use (Mdegeand Lang, 2011). The development of a new short-form is clearlyrequired.
Short-forms are a natural development for many clinical andresearch screening instruments. For example, three items on alco-hol consumption from the ten-item AUDIT are more diagnosticallyaccurate for alcohol dependence than the full test (Bush et al.,1998). In a hospital study, Smith and his colleagues asked patients:“How many times in the past year have you used an illegal drug orused a prescription medication for non-medical reasons?” (‘non-medical’ defined as using “for instance because of the experienceor feeling it caused”; Smith et al., 2010). The affirmative response
was 100% sensitive and 74% specific for the detection of a currentSUD. However, ultra-rapid screening goals have not always beensuccessful. For example, the Two-Item Conjoint Screen (TICS)asks respondents: “In the last year, have you ever drunk or useddrugs more than you meant to?; and “Have you felt you wanted orneeded to cut down on your drinking or drug use in the last year?”.The TICS is highly specific but insensitive for SUD (99% and 45%,respectively; Lee et al., 2011).
Nevertheless, if accuracy is evidenced, brief screening testssubstantially reduce administrative burden on the patient and clin-ician. Accordingly, the goal of the present study was to develop anultra-rapid version of ASSIST 3.0 to screen for substance use-relatedproblems in the past three months. The aim was to create a newversion ensuring diagnostic accuracy, simple completion and testscores with no marked evidence of bias across gender, age and gen-eral and specialist mental health settings. We combined ATS andcocaine into a generic class (stimulants) for economy and logicallinkage, and our clinical and research experience led to the replace-ment of ordinal rating scales with simple binary format (Yes/No)questions thereby removing the need for show cards and explana-tions of response anchors.
Following the Standards for Reporting of Diagnostic Accuracyguideline (Bossuyt et al., 2003), this study developed the ASSIST-Lite.
2. Methods
2.1. Question structure (test methods)
The question structure for the ASSIST 3.0 is as follows (capitalised labels for itemnames used herein for economy):
Q1. Have you ever used [each of 10 substance classes/types]?Then, for the past three months, for each substance used:
Q2. How often have you used? (FREQUENCY)Q3. How often have you had a strong desire or urge to use? (URGE)Q4. How often has this caused health, social, legal or financial problems? (HEALTH)Q5. How often have you failed to do what was normally expected of you becauseof? (ROLE)Q6. Has someone expressed concern about your use? (CONCERN)Q7. Have you tried to control, cut down or stop using, but failed in that attempt?(CONTROL)Q8. Have you ever used a non-medical substance by injection? (Yes/No).
Questions 2–5 use the following ordinal (Likert-type) response scale: Never,Once or twice only, Monthly, Weekly, or Daily/Almost daily (scored 0–4). Questions6 and 7 are binary format items, as follows: Never; Yes, but not in the past threemonths; or Yes, in the past three months (scored 0,1, 2).
Question five is not asked for tobacco, since smoking is not considered likely tocause role responsibility difficulties. A Substance Specific Involvement (SSI) score isobtained by summing item weights for Q2–7. Our aim was also to preserve the SSIscore product to inform and evaluate behavioural interventions (envisaged to be atest item pair as the logical minimum).
While preparing for the University of Adelaide study, we assessed the alcohol,tobacco and cannabis items from Sample 2 against the two reference standards andremoved the following items with AUC <0.71: alcohol (HEALTH, ROLE, both 0.69);tobacco (HEALTH, 0.60), and cannabis (HEALTH, ROLE, both 0.70). Limited data forinhalants (used by 31 participants from three countries) and hallucinogens (usedby 47 participants from two countries) prevented evaluation, so these substanceswere also dropped. Three new items were included for the present analysis whichhad been recorded for the Sample 1 and 3 studies: we adapted an item on hazardousdrinking from AUDIT (consumption of six or more drinks on a single occasion in thepast three months; response Yes/No, coded 1/0; DRINK). For tobacco we includedtime to first cigarette (FIRST) and number of cigarettes smoked per day (CPD). ForFIRST, the RTQ and FTND variables used slightly different response anchors, so wecategorised the item to indicate whether the respondent smoked their first cigarettewithin 30 min after waking since this has been shown to point to more severedependence (Diaz et al., 2005). CPD used the original response categories.
2.2. Study samples (participants)
This study pooled all available project data for the ASSIST 3.0 (the indextest) gathered for the three samples (Sample 1: psychometric development, Sam-ple 2: brief intervention trial and Sample 3: lifestyle evaluation [n = 2082]; 69.6%recruited from general medical settings and 21.8% recruited from specialist mental

354 R. Ali et al. / Drug and Alcohol Dependence 132 (2013) 352– 361
Table 1Pooled demographic, recruitment setting and past three month substance characteristics by country (n = 2082).
Characteristic Australia Brazil China India Korea Thailand UK USA Zimbabwe Total
Number of participants 383 312 73 373 50 226 149 366 150 2082Sample contributed to analysis 1,2,3 1,2 3 1,2,3 3 1,3 1 1,2 1Demographics
No. (%) male 215 (56.1) 226 (72.4) 38 (52.1) 367 (98.4) 20 (40.0) 178 (78.8) 100 (67.1) 173 (47.3) 113 (75.3) 1.430 (68.5)Mean age (SD; range 18–62 years) 29.4 (9.1.) 32.1 (9.3) 27.3 (3.6) 31.9 (8.1) 26.0 (3.3) 27.9 (7.6) 31.6 (8.9) 31.4 (9.3) 30.9 (8.0) 30.5 (8.7)
Recruitment settingGeneral medical 266 (69.5) 252 (80.8) 64 (87.7) 219 (58.7) 50 (100) 147 (65.0) 99 (66.4) 318 (86.9) 34 (22.7) 1449 (69.6)Specialist mental health/addiction 67 (17.5) 58 (18.6) 9 (12.3) 101 (27.1) – 78 (34.5) 50 (33.6) 48 (13.1) 43 (28.7) 454 (21.8)Other 50 (13.1) 2 (0.6) – 53 (14.2) – – – – 73 (48.7) 179 (8.6)
Use in past three months: No. (%)Alcohol 331 (93.7) 243 (77.9) 61 (83.6) 265 (71.0) 50 (100.0) 137 (60.6) 127 (85.2) 298 (81.4) 145 (96.7) 1657 (80.8)Tobacco 268 (73.1) 210 (67.3) 26 (35.6) 341 (91.4) 19 (38.0) 167 (73.9) 98 (65.8) 265 (72.4) 84 (56.0) 1478 (72.0)Cannabis 247 (70.0) 171 (54.8) 1 (1.4) 175 (46.9) – 18 (8.0) 74 (49.7) 231 (63.1) 36 (24.0) 953 (46.4)Stimulants 223 (63.2) 80 (25.6) 7 (9.6) – – 68 (30.0) 54 (36.2) 138 (37.7) 1 (0.7) 571 (27.8)Inhalants 24 (6.8) 4 (1.3) – – – – – 3 (0.8) – 31 (1.5)Sedatives 71 (20.1) 13 (4.2) – 48 (12.9) – 28 (12.4) 26 (17.4) 41 (11.2) 1 (0.7) 228 (11.1)Hallucinogens 38 (10.76) – – – – – – 9 (2.5) – 47 (2.3)Opioids 81 (22.9) 1 (0.3) 3 (4.1) 136 (36.5) – 38 (16.8) 40 (26.8) 51 (13.9) – 350 (17.1)
health/addiction treatment clinics). Overarching and clinical site-level institutionalreview board (research ethics) clearances were secured. Informed, consenting adultparticipants ($18 years) reported use of one or more of six psychoactive substances(alcohol, tobacco, cannabis, stimulants, sedatives and opioids) in the past threemonths. All were judged to have no behavioural or medical conditions preclud-ing research involvement. Table 1 shows the demographic, study setting and pastthee month substance use characteristics for the sample.
2.3. Sample characteristics and statistical power
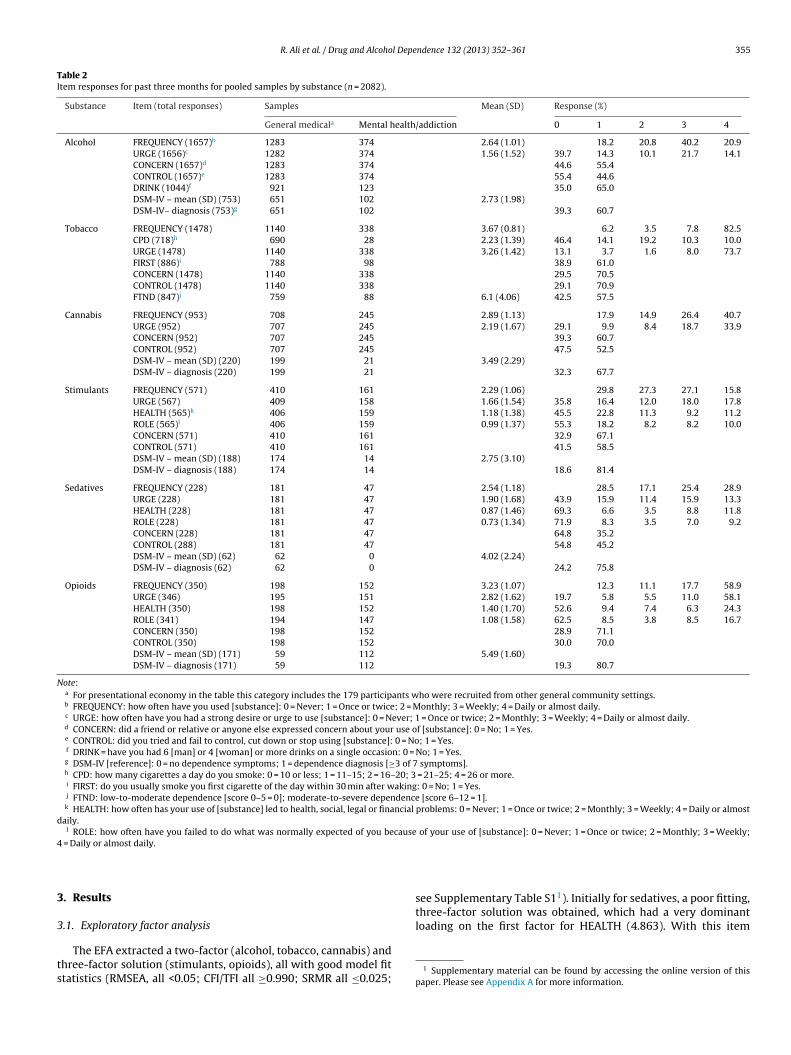
Table 2 displays the prevalence of responses to each item on the ASSIST 3.0by substance and the positive dependence classifications. There are no precise rec-ommendations for a minimum sample size to derive accurate test statistics andparameter estimates in factor analysis and IRT models, but 200 cases is usuallyconsidered sufficient (Flora and Curran, 2004), with adequate model solutions arelikely to result from data with at least five participants per variable. In this study,sample sizes and participants-to-variables ratios ranged from 228 and 38:1 (seda-tives) to 1657 and 331:1 (alcohol). Rates of missing observations were either zero(tobacco and sedatives) or less than 0.5% (alcohol, cannabis, stimulants and opi-oids). Variations in observations mainly reflected whether the variable was includedin a particular study sample (as noted in the text). We considered dividing thepooled sample randomly to form an instrument development and internal validationdatasets (a 70:30 split is usual for this purpose; e.g. Harrell et al., 1996; Marsdenet al., 2012). However, sample splitting risked statistical power for some substancesand, as with the previous developmental studies of the instrument (WHO ASSISTWorking Group, 2002; Humeniuk et al., 2003), the analysis was done using pooleddata prior to sensitivity evaluation.
2.4. Statistical methods
The analysis was done in Mplus (version 7; exploratory factor analysis [EFA],item-response theory [IRT] and Multiple Indicators Multiple Causes [MIMIC]models), and STATA (release 12; diagnostic accuracy and test bias evaluations),implemented in parallel for each substance in a three-stage, advance specified,statistical analysis plan, as follows:
2.4.1. Exploratory factor analysis. First, EFA determined the factorial validity ofeach set of candidate test items for a unidimensional SUD severity construct. Witha mix of ordinal and binary items, a weighted least squares estimator for meanand variance (WLSMV) was used for data modelling. Criteria for absolute modelfit indices were as follows: root-mean-square error of approximation (RMSEA,with 90% confidence interval [CI], values <0.05 and <0.05–0.08 indicating good andacceptable fit, respectively; standardised root-mean-square residual [SRMR, lowervalues, ranging from 0 to 1], and Comparative and Tucker–Lewis Fit Indices [CFI/TFI;>0.95]) (Browne and Cudeck, 1993; Hu and Bentler, 1999). The number of extractedfactors was also determined heuristically by inspection of eigenvalue plots foreach factor (Scree test, Cattell, 1966). Each EFA was run using a geomin rotation,with item-factor loadings >0.300 indicating factor definition (Ferguson and Cox,1993).
2.4.2. Item response theory analysis. In the second-stage, for each set of unidimen-sional SUD severity construct indicators, IRT analyses informed whether ordinalitems could be re-calibrated to a binary response (Yes/No) while preserving (orincreasing) information and discrimination (Stout, 1990). Discrimination (b), sever-ity (a), and item characteristic curves (ICC) were computed using Samejima’s
graded-response model to identify an optimal cut-off along the scale (Samejima,1969). Each set of subsequent binary items was evaluated by a two-parameterlogistic (2PL) model (Embretson and Reise, 2000). A lower Aikaike’s InformationCriterion [AIC] indicated successful model improvement (Raykov and Marcoulides,2006; Ruscio and Roche, 2012).
2.4.3. Diagnostic accuracy estimates. In the final stage, the diagnostic accuracy andpotential bias of the index test were evaluated using the two reference standards,as follows:
(1) MINI-Plus clinical interview for DSM-IV SUD (recoded in Samples 1 and 3; zerodependence symptoms, coded 0; $3 of seven dependence symptoms clusteredin the past year coded 1 (American Psychiatric Association, 2000). The DSM-IV‘abuse’ items were not used given evidence that these items may not indicatelower SUD severity (Langenbucher et al., 2004; Saha et al., 2006).
(2) RTQ (recorded in Sample 1) and FTND (recorded in Sample 3; combined andlabelled FTND for economy, herein) median split coded to distinguish betweenlow–moderate and moderate–severe tobacco dependence (0–5, coded 0; 6–12,coded 1, respectively).
The following diagnostic accuracy statistics were calculated (with 95% confi-dence intervals) from the true positive (TP), false negative (FN), false positive (FP)and true negative (TN) rates, as follows:
• Sensitivity and specificity (sensitivity: proportion of TPs correctly identified by thetest [TP/TP + FN]; specificity: proportion of TNs correctly identified [TN/FP + TN]);
• Area under the receiver operating characteristic curve (AUC; Hanley and McNeil,1982: the probability, given one TP and TN that the former will score higher on thetest), with a criterion for AUC set at $0.71 indicating at least better than acceptableaccuracy (Terwee et al., 2007).
• Positive and negative predictive value (PPV: proportion with a positive test,correctly diagnosed [TP/TP + FP]; NPV: proportion with a positive test, correctlydiagnosed [TN/TN + FN]);
• Likelihood ratios for the positive and negative test (LR+ and LR#: the ratios ofthe probability of dependence to the probability of not being dependent dividedby the odds of the underlying prevalence) (LR+: sensitivity/1-specificity; LR#:1-sensitivity/specificity);
• Positive and negative clinical utility index (CUI+ and CUI#: the product of sensi-tivity and PPV and specificity and NPV, respectively to assess clinically relevantaccuracy), with greater emphasis placed on CUI+ (for case-finding) and overallutility ([CUI+] + [CUI#]) used as the selection criterion in the event of a choiceamong items (Mitchell, 2012);
• Chance-corrected index of agreement between the test and reference standard(with kappa $0.61 considered ‘good’; Landis and Koch, 1977).
2.4.4. Assessment of potential test bias. Potential test score bias was assessed by pro-bit maximum likelihood regression (STATA procedure rocreg), adjusted by gender,age (years) and setting. Differential item functioning (DIF) comparisons of the finaltest items was done in Mplus using a Multiple Indicators Multiple Causes [MIMIC]factor analysis with age and gender as covariates. Where there were available data,we computed ROC curves for each country (not shown for economy).
R. Ali et al. / Drug and Alcohol Dependence 132 (2013) 352– 361 355
Table 2Item responses for past three months for pooled samples by substance (n = 2082).
Substance Item (total responses) Samples Mean (SD) Response (%)
General medicala Mental health/addiction 0 1 2 3 4
Alcohol FREQUENCY (1657)b 1283 374 2.64 (1.01) 18.2 20.8 40.2 20.9URGE (1656)c 1282 374 1.56 (1.52) 39.7 14.3 10.1 21.7 14.1CONCERN (1657)d 1283 374 44.6 55.4CONTROL (1657)e 1283 374 55.4 44.6DRINK (1044)f 921 123 35.0 65.0DSM-IV – mean (SD) (753) 651 102 2.73 (1.98)DSM-IV– diagnosis (753)g 651 102 39.3 60.7
Tobacco FREQUENCY (1478) 1140 338 3.67 (0.81) 6.2 3.5 7.8 82.5CPD (718)h 690 28 2.23 (1.39) 46.4 14.1 19.2 10.3 10.0URGE (1478) 1140 338 3.26 (1.42) 13.1 3.7 1.6 8.0 73.7FIRST (886)i 788 98 38.9 61.0CONCERN (1478) 1140 338 29.5 70.5CONTROL (1478) 1140 338 29.1 70.9FTND (847)j 759 88 6.1 (4.06) 42.5 57.5
Cannabis FREQUENCY (953) 708 245 2.89 (1.13) 17.9 14.9 26.4 40.7URGE (952) 707 245 2.19 (1.67) 29.1 9.9 8.4 18.7 33.9CONCERN (952) 707 245 39.3 60.7CONTROL (952) 707 245 47.5 52.5DSM-IV – mean (SD) (220) 199 21 3.49 (2.29)DSM-IV – diagnosis (220) 199 21 32.3 67.7
Stimulants FREQUENCY (571) 410 161 2.29 (1.06) 29.8 27.3 27.1 15.8URGE (567) 409 158 1.66 (1.54) 35.8 16.4 12.0 18.0 17.8HEALTH (565)k 406 159 1.18 (1.38) 45.5 22.8 11.3 9.2 11.2ROLE (565)l 406 159 0.99 (1.37) 55.3 18.2 8.2 8.2 10.0CONCERN (571) 410 161 32.9 67.1CONTROL (571) 410 161 41.5 58.5DSM-IV – mean (SD) (188) 174 14 2.75 (3.10)DSM-IV – diagnosis (188) 174 14 18.6 81.4
Sedatives FREQUENCY (228) 181 47 2.54 (1.18) 28.5 17.1 25.4 28.9URGE (228) 181 47 1.90 (1.68) 43.9 15.9 11.4 15.9 13.3HEALTH (228) 181 47 0.87 (1.46) 69.3 6.6 3.5 8.8 11.8ROLE (228) 181 47 0.73 (1.34) 71.9 8.3 3.5 7.0 9.2CONCERN (228) 181 47 64.8 35.2CONTROL (288) 181 47 54.8 45.2DSM-IV – mean (SD) (62) 62 0 4.02 (2.24)DSM-IV – diagnosis (62) 62 0 24.2 75.8
Opioids FREQUENCY (350) 198 152 3.23 (1.07) 12.3 11.1 17.7 58.9URGE (346) 195 151 2.82 (1.62) 19.7 5.8 5.5 11.0 58.1HEALTH (350) 198 152 1.40 (1.70) 52.6 9.4 7.4 6.3 24.3ROLE (341) 194 147 1.08 (1.58) 62.5 8.5 3.8 8.5 16.7CONCERN (350) 198 152 28.9 71.1CONTROL (350) 198 152 30.0 70.0DSM-IV – mean (SD) (171) 59 112 5.49 (1.60)DSM-IV – diagnosis (171) 59 112 19.3 80.7
Note:a For presentational economy in the table this category includes the 179 participants who were recruited from other general community settings.b FREQUENCY: how often have you used [substance]: 0 = Never; 1 = Once or twice; 2 = Monthly; 3 = Weekly; 4 = Daily or almost daily.c URGE: how often have you had a strong desire or urge to use [substance]: 0 = Never; 1 = Once or twice; 2 = Monthly; 3 = Weekly; 4 = Daily or almost daily.d CONCERN: did a friend or relative or anyone else expressed concern about your use of [substance]: 0 = No; 1 = Yes.e CONTROL: did you tried and fail to control, cut down or stop using [substance]: 0 = No; 1 = Yes.f DRINK = have you had 6 [man] or 4 [woman] or more drinks on a single occasion: 0 = No; 1 = Yes.g DSM-IV [reference]: 0 = no dependence symptoms; 1 = dependence diagnosis [$3 of 7 symptoms].h CPD: how many cigarettes a day do you smoke: 0 = 10 or less; 1 = 11–15; 2 = 16–20; 3 = 21–25; 4 = 26 or more.i FIRST: do you usually smoke you first cigarette of the day within 30 min after waking: 0 = No; 1 = Yes.j FTND: low-to-moderate dependence [score 0–5 = 0]; moderate-to-severe dependence [score 6–12 = 1].k HEALTH: how often has your use of [substance] led to health, social, legal or financial problems: 0 = Never; 1 = Once or twice; 2 = Monthly; 3 = Weekly; 4 = Daily or almost
daily.l ROLE: how often have you failed to do what was normally expected of you because of your use of [substance]: 0 = Never; 1 = Once or twice; 2 = Monthly; 3 = Weekly;
4 = Daily or almost daily.
3. Results
3.1. Exploratory factor analysis
The EFA extracted a two-factor (alcohol, tobacco, cannabis) andthree-factor solution (stimulants, opioids), all with good model fitstatistics (RMSEA, all <0.05; CFI/TFI all $0.990; SRMR all "0.025;
see Supplementary Table S11). Initially for sedatives, a poor fitting,three-factor solution was obtained, which had a very dominantloading on the first factor for HEALTH (4.863). With this item
1 Supplementary material can be found by accessing the online version of thispaper. Please see Appendix A for more information.
356 R. Ali et al. / Drug and Alcohol Dependence 132 (2013) 352– 361
Table 3Graded response and two-parameter logistic IRT models for each substance severity trait.
Substance Item Graded response model 2PL model
a SE b1 b2 b3 b4 AIC a SE b AIC
Alcohol FREQUENCY 1.00 0.00 #1.80 #0.57 1.61 13,994.846 3.08 0.55 #0.63 4823.304URGE 1.82 0.14 #0.66 0.23 0.89a 2.77 2.77 0.42 0.42CONCERN 2.51 0.29 #0.40 0.71 1.14 #0.64CONTROL 2.12 0.20 0.39 0.94 0.17 #0.18DRINK 1.08 0.10 #0.61 1.18 0.19 0.28
Tobacco FREQUENCY 6.09 1.26 #9.78 #8.32 #6.00c 8381.516 9.03 1.68 #0.62 5874.225CPD 1.76 0.19 #0.25 0.64d 2.02 3.12 2.19 0.22 #0.21URGE 3.41 0.32 #4.46 #3.89 #3.66 #2.53c 4.28 0.77 #0.36FIRST 1.73 0.17 #0.82 0.71 0.09 #0.28CONCERN 0.78 0.09 #0.98 0.36 0.09 #2.39
Cannabis FREQUENCY 2.56 0.26 #2.79 #1.37 0.72c 7156.812 2.12 0.28 0.31 4720.462URGE 5.00 1.35 #3.09 #1.81 #0.63a 2.15 8.12 0.18 #0.06CONCERN 0.75 0.10 #0.49 0.98 0.15 #0.12CONTROL 0.94 0.10 #0.13 0.83 0.15 #0.60
Stimulant FREQUENCY 2.03 0.19 #1.41 0.38a 2.69 6777.510 1.18 0.19 #0.97 3666.330URGE 2.28 0.23 #1.11 0.01 0.91a 2.62 1.91 0.29 0.54HEALTH 2.56 0.25 #0.47 1.24e 2.44 3.84 1.81 0.24 #0.26ROLE 2.95 0.32 0.36b 2.22 3.35 5.01 2.46 0.37 0.14CONCERN 1.52 0.21 #1.01 2.00 0.27 #0.54CONTROL 1.48 0.19 #0.50 1.66 0.21 #0.20
Sedative FREQUENCY 2.32 0.34 #1.47 #0.81 1.73c 2056.399 2.75 0.66 0.79 1226.740URGE 4.65 1.61 #1.74 0.06 1.01a 3.36 3.95 1.49 0.29ROLE 1.33 0.25 1.33b 1.92 2.22 3.03 1.28 0.28 1.08CONCERN 1.74 0.42 1.09 2.20 0.67 0.57CONTROL 1.24 0.25 0.37 1.58 0.35 0.30
Opioid FREQUENCY 1.82 0.40 #2.87 #1.72 #0.50c 3674.652 2.53 0.55 #0.26 2300.988URGE 3.34 1.06 #3.15 #2.38 #1.73 #0.64c 6.14 3.44 #0.19HEALTH 1.88 0.45 0.08 0.66 1.20a 1.73 2.14 0.44 0.65ROLE 2.20 0.35 0.83b 1.46 1.80 2.69 1.28 0.27 0.53CONCERN 2.00 0.35 #1.44 1.44 0.29 #0.86CONTROL 1.54 0.29 #1.19 1.24 0.26 #0.88
Note:AIC, Aikaike’s Information Criterion; IRT item parameter estimates (a = discrimination, b = threshold) were generated via Samejima graded response model and 2PL IRT withordinal scaled items rescaled as binary items at the emboldened b response category as follows:
a Weekly or more often.b Once or more often.c Daily or almost daily.d Usually smokes more than 10 cigarettes smoked on most days.e Monthly or more often.
removed, a single factor solution was obtained with acceptablefit (RAMSEA = 0.063). For all substances, the retained items loadedon the first factor (eigenvalue range, 2.42–3.81). SupplementaryTable S2 shows the item-factor loadings for each substance. Therewas a consistent pattern of positive loadings on this first factor(all $0.303), with the exception of CONTROL for tobacco (0.181),which was removed at this point. We noted that the two removeditems via EFA step had an AUC which fell below the criterion onthe reference standard: HEALTH for sedatives (0.61), CONTROL fortobacco (0.53).
3.2. Item-response theory models
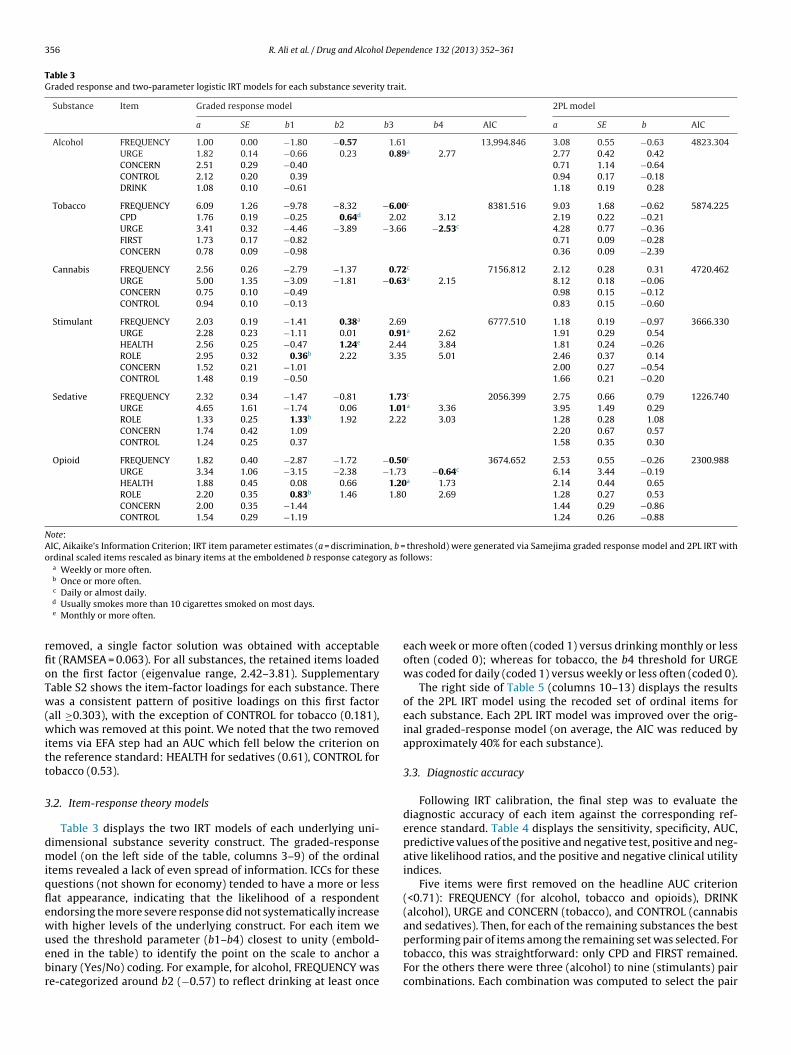
Table 3 displays the two IRT models of each underlying uni-dimensional substance severity construct. The graded-responsemodel (on the left side of the table, columns 3–9) of the ordinalitems revealed a lack of even spread of information. ICCs for thesequestions (not shown for economy) tended to have a more or lessflat appearance, indicating that the likelihood of a respondentendorsing the more severe response did not systematically increasewith higher levels of the underlying construct. For each item weused the threshold parameter (b1–b4) closest to unity (embold-ened in the table) to identify the point on the scale to anchor abinary (Yes/No) coding. For example, for alcohol, FREQUENCY wasre-categorized around b2 (#0.57) to reflect drinking at least once
each week or more often (coded 1) versus drinking monthly or lessoften (coded 0); whereas for tobacco, the b4 threshold for URGEwas coded for daily (coded 1) versus weekly or less often (coded 0).
The right side of Table 5 (columns 10–13) displays the resultsof the 2PL IRT model using the recoded set of ordinal items foreach substance. Each 2PL IRT model was improved over the orig-inal graded-response model (on average, the AIC was reduced byapproximately 40% for each substance).
3.3. Diagnostic accuracy
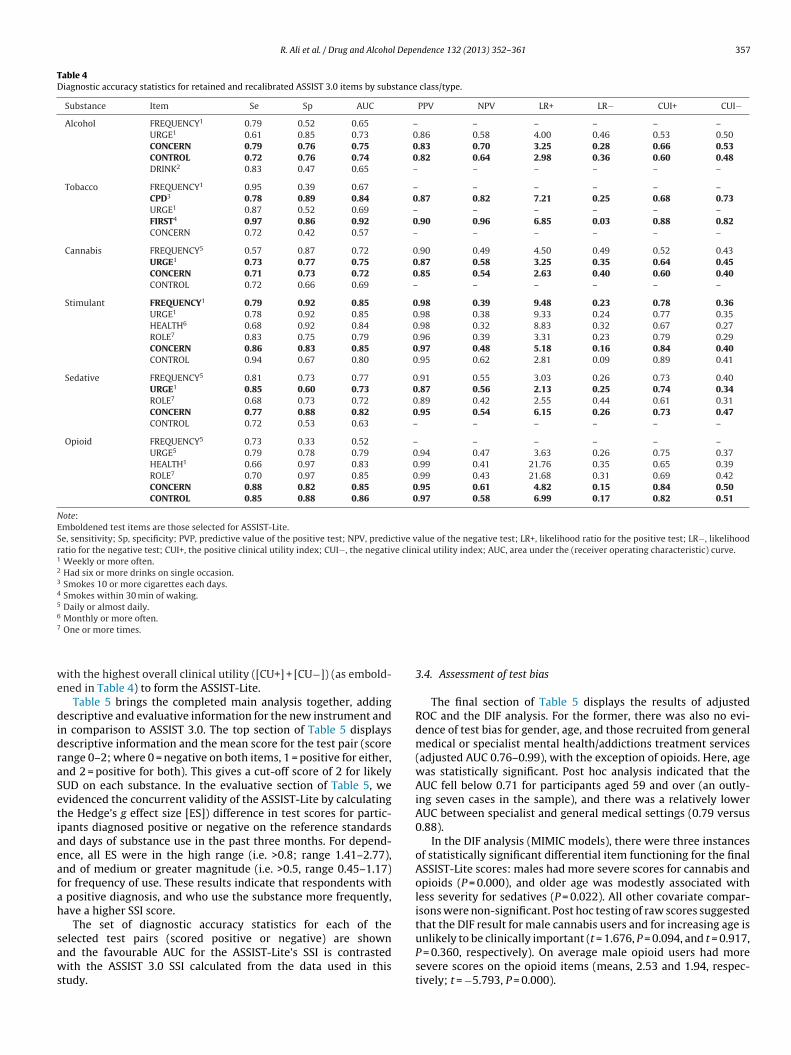
Following IRT calibration, the final step was to evaluate thediagnostic accuracy of each item against the corresponding ref-erence standard. Table 4 displays the sensitivity, specificity, AUC,predictive values of the positive and negative test, positive and neg-ative likelihood ratios, and the positive and negative clinical utilityindices.
Five items were first removed on the headline AUC criterion(<0.71): FREQUENCY (for alcohol, tobacco and opioids), DRINK(alcohol), URGE and CONCERN (tobacco), and CONTROL (cannabisand sedatives). Then, for each of the remaining substances the bestperforming pair of items among the remaining set was selected. Fortobacco, this was straightforward: only CPD and FIRST remained.For the others there were three (alcohol) to nine (stimulants) paircombinations. Each combination was computed to select the pair
R. Ali et al. / Drug and Alcohol Dependence 132 (2013) 352– 361 357
Table 4Diagnostic accuracy statistics for retained and recalibrated ASSIST 3.0 items by substance class/type.
Substance Item Se Sp AUC PPV NPV LR+ LR# CUI+ CUI#
Alcohol FREQUENCY1 0.79 0.52 0.65 – – – – – –URGE1 0.61 0.85 0.73 0.86 0.58 4.00 0.46 0.53 0.50CONCERN 0.79 0.76 0.75 0.83 0.70 3.25 0.28 0.66 0.53CONTROL 0.72 0.76 0.74 0.82 0.64 2.98 0.36 0.60 0.48DRINK2 0.83 0.47 0.65 – – – – – –
Tobacco FREQUENCY1 0.95 0.39 0.67 – – – – – –CPD3 0.78 0.89 0.84 0.87 0.82 7.21 0.25 0.68 0.73URGE1 0.87 0.52 0.69 – – – – – –FIRST4 0.97 0.86 0.92 0.90 0.96 6.85 0.03 0.88 0.82CONCERN 0.72 0.42 0.57 – – – – – –
Cannabis FREQUENCY5 0.57 0.87 0.72 0.90 0.49 4.50 0.49 0.52 0.43URGE1 0.73 0.77 0.75 0.87 0.58 3.25 0.35 0.64 0.45CONCERN 0.71 0.73 0.72 0.85 0.54 2.63 0.40 0.60 0.40CONTROL 0.72 0.66 0.69 – – – – – –
Stimulant FREQUENCY1 0.79 0.92 0.85 0.98 0.39 9.48 0.23 0.78 0.36URGE1 0.78 0.92 0.85 0.98 0.38 9.33 0.24 0.77 0.35HEALTH6 0.68 0.92 0.84 0.98 0.32 8.83 0.32 0.67 0.27ROLE7 0.83 0.75 0.79 0.96 0.39 3.31 0.23 0.79 0.29CONCERN 0.86 0.83 0.85 0.97 0.48 5.18 0.16 0.84 0.40CONTROL 0.94 0.67 0.80 0.95 0.62 2.81 0.09 0.89 0.41
Sedative FREQUENCY5 0.81 0.73 0.77 0.91 0.55 3.03 0.26 0.73 0.40URGE1 0.85 0.60 0.73 0.87 0.56 2.13 0.25 0.74 0.34ROLE7 0.68 0.73 0.72 0.89 0.42 2.55 0.44 0.61 0.31CONCERN 0.77 0.88 0.82 0.95 0.54 6.15 0.26 0.73 0.47CONTROL 0.72 0.53 0.63 – – – – – –
Opioid FREQUENCY5 0.73 0.33 0.52 – – – – – –URGE5 0.79 0.78 0.79 0.94 0.47 3.63 0.26 0.75 0.37HEALTH1 0.66 0.97 0.83 0.99 0.41 21.76 0.35 0.65 0.39ROLE7 0.70 0.97 0.85 0.99 0.43 21.68 0.31 0.69 0.42CONCERN 0.88 0.82 0.85 0.95 0.61 4.82 0.15 0.84 0.50CONTROL 0.85 0.88 0.86 0.97 0.58 6.99 0.17 0.82 0.51
Note:Emboldened test items are those selected for ASSIST-Lite.Se, sensitivity; Sp, specificity; PVP, predictive value of the positive test; NPV, predictive value of the negative test; LR+, likelihood ratio for the positive test; LR#, likelihoodratio for the negative test; CUI+, the positive clinical utility index; CUI#, the negative clinical utility index; AUC, area under the (receiver operating characteristic) curve.1 Weekly or more often.2 Had six or more drinks on single occasion.3 Smokes 10 or more cigarettes each days.4 Smokes within 30 min of waking.5 Daily or almost daily.6 Monthly or more often.7 One or more times.
with the highest overall clinical utility ([CU+] + [CU#]) (as embold-ened in Table 4) to form the ASSIST-Lite.
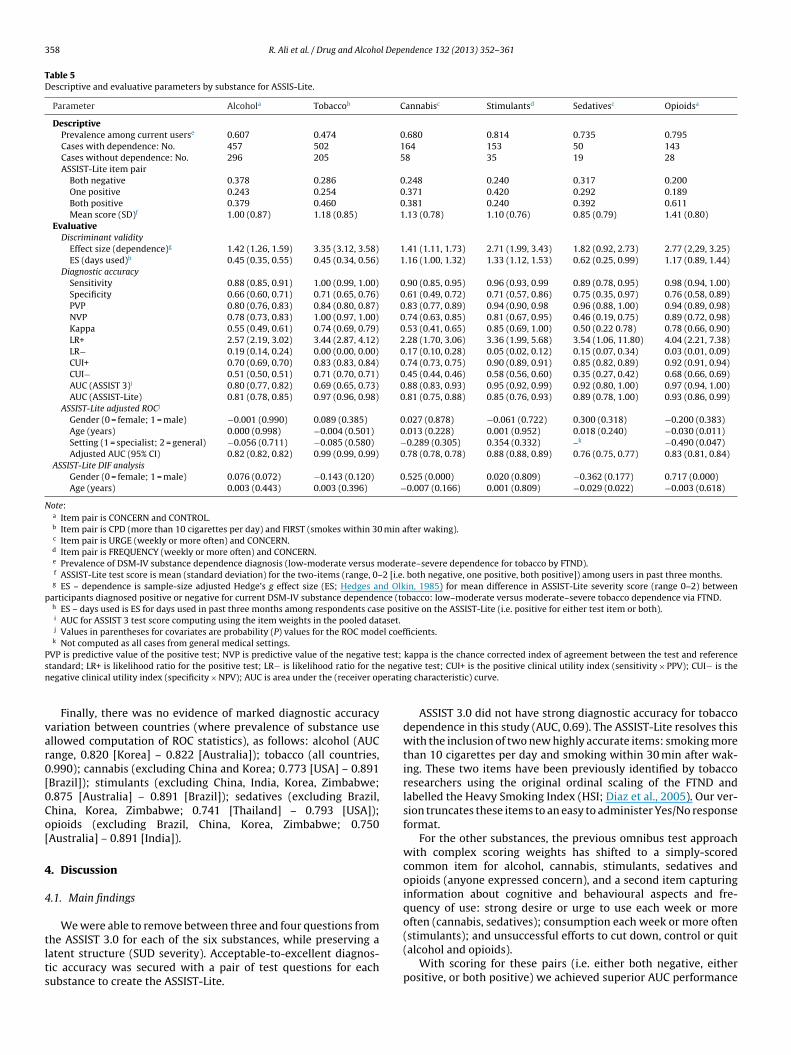
Table 5 brings the completed main analysis together, addingdescriptive and evaluative information for the new instrument andin comparison to ASSIST 3.0. The top section of Table 5 displaysdescriptive information and the mean score for the test pair (scorerange 0–2; where 0 = negative on both items, 1 = positive for either,and 2 = positive for both). This gives a cut-off score of 2 for likelySUD on each substance. In the evaluative section of Table 5, weevidenced the concurrent validity of the ASSIST-Lite by calculatingthe Hedge’s g effect size [ES]) difference in test scores for partic-ipants diagnosed positive or negative on the reference standardsand days of substance use in the past three months. For depend-ence, all ES were in the high range (i.e. >0.8; range 1.41–2.77),and of medium or greater magnitude (i.e. >0.5, range 0.45–1.17)for frequency of use. These results indicate that respondents witha positive diagnosis, and who use the substance more frequently,have a higher SSI score.
The set of diagnostic accuracy statistics for each of theselected test pairs (scored positive or negative) are shownand the favourable AUC for the ASSIST-Lite’s SSI is contrastedwith the ASSIST 3.0 SSI calculated from the data used in thisstudy.
3.4. Assessment of test bias
The final section of Table 5 displays the results of adjustedROC and the DIF analysis. For the former, there was also no evi-dence of test bias for gender, age, and those recruited from generalmedical or specialist mental health/addictions treatment services(adjusted AUC 0.76–0.99), with the exception of opioids. Here, agewas statistically significant. Post hoc analysis indicated that theAUC fell below 0.71 for participants aged 59 and over (an outly-ing seven cases in the sample), and there was a relatively lowerAUC between specialist and general medical settings (0.79 versus0.88).
In the DIF analysis (MIMIC models), there were three instancesof statistically significant differential item functioning for the finalASSIST-Lite scores: males had more severe scores for cannabis andopioids (P = 0.000), and older age was modestly associated withless severity for sedatives (P = 0.022). All other covariate compar-isons were non-significant. Post hoc testing of raw scores suggestedthat the DIF result for male cannabis users and for increasing age isunlikely to be clinically important (t = 1.676, P = 0.094, and t = 0.917,P = 0.360, respectively). On average male opioid users had moresevere scores on the opioid items (means, 2.53 and 1.94, respec-tively; t = #5.793, P = 0.000).
358 R. Ali et al. / Drug and Alcohol Dependence 132 (2013) 352– 361
Table 5Descriptive and evaluative parameters by substance for ASSIS-Lite.
Parameter Alcohola Tobaccob Cannabisc Stimulantsd Sedativesc Opioidsa
DescriptivePrevalence among current userse 0.607 0.474 0.680 0.814 0.735 0.795Cases with dependence: No. 457 502 164 153 50 143Cases without dependence: No. 296 205 58 35 19 28ASSIST-Lite item pair
Both negative 0.378 0.286 0.248 0.240 0.317 0.200One positive 0.243 0.254 0.371 0.420 0.292 0.189Both positive 0.379 0.460 0.381 0.240 0.392 0.611Mean score (SD)f 1.00 (0.87) 1.18 (0.85) 1.13 (0.78) 1.10 (0.76) 0.85 (0.79) 1.41 (0.80)
EvaluativeDiscriminant validity
Effect size (dependence)g 1.42 (1.26, 1.59) 3.35 (3.12, 3.58) 1.41 (1.11, 1.73) 2.71 (1.99, 3.43) 1.82 (0.92, 2.73) 2.77 (2,29, 3.25)ES (days used)h 0.45 (0.35, 0.55) 0.45 (0.34, 0.56) 1.16 (1.00, 1.32) 1.33 (1.12, 1.53) 0.62 (0.25, 0.99) 1.17 (0.89, 1.44)
Diagnostic accuracySensitivity 0.88 (0.85, 0.91) 1.00 (0.99, 1.00) 0.90 (0.85, 0.95) 0.96 (0.93, 0.99 0.89 (0.78, 0.95) 0.98 (0.94, 1.00)Specificity 0.66 (0.60, 0.71) 0.71 (0.65, 0.76) 0.61 (0.49, 0.72) 0.71 (0.57, 0.86) 0.75 (0.35, 0.97) 0.76 (0.58, 0.89)PVP 0.80 (0.76, 0.83) 0.84 (0.80, 0.87) 0.83 (0.77, 0.89) 0.94 (0.90, 0.98 0.96 (0.88, 1.00) 0.94 (0.89, 0.98)NVP 0.78 (0.73, 0.83) 1.00 (0.97, 1.00) 0.74 (0.63, 0.85) 0.81 (0.67, 0.95) 0.46 (0.19, 0.75) 0.89 (0.72, 0.98)Kappa 0.55 (0.49, 0.61) 0.74 (0.69, 0.79) 0.53 (0.41, 0.65) 0.85 (0.69, 1.00) 0.50 (0.22 0.78) 0.78 (0.66, 0.90)LR+ 2.57 (2.19, 3.02) 3.44 (2.87, 4.12) 2.28 (1.70, 3.06) 3.36 (1.99, 5.68) 3.54 (1.06, 11.80) 4.04 (2.21, 7.38)LR# 0.19 (0.14, 0.24) 0.00 (0.00, 0.00) 0.17 (0.10, 0.28) 0.05 (0.02, 0.12) 0.15 (0.07, 0.34) 0.03 (0.01, 0.09)CUI+ 0.70 (0.69, 0.70) 0.83 (0.83, 0.84) 0.74 (0.73, 0.75) 0.90 (0.89, 0.91) 0.85 (0.82, 0.89) 0.92 (0.91, 0.94)CUI# 0.51 (0.50, 0.51) 0.71 (0.70, 0.71) 0.45 (0.44, 0.46) 0.58 (0.56, 0.60) 0.35 (0.27, 0.42) 0.68 (0.66, 0.69)AUC (ASSIST 3)i 0.80 (0.77, 0.82) 0.69 (0.65, 0.73) 0.88 (0.83, 0.93) 0.95 (0.92, 0.99) 0.92 (0.80, 1.00) 0.97 (0.94, 1.00)AUC (ASSIST-Lite) 0.81 (0.78, 0.85) 0.97 (0.96, 0.98) 0.81 (0.75, 0.88) 0.85 (0.76, 0.93) 0.89 (0.78, 1.00) 0.93 (0.86, 0.99)
ASSIST-Lite adjusted ROCj
Gender (0 = female; 1 = male) #0.001 (0.990) 0.089 (0.385) 0.027 (0.878) #0.061 (0.722) 0.300 (0.318) #0.200 (0.383)Age (years) 0.000 (0.998) #0.004 (0.501) 0.013 (0.228) 0.001 (0.952) 0.018 (0.240) #0.030 (0.011)Setting (1 = specialist; 2 = general) #0.056 (0.711) #0.085 (0.580) #0.289 (0.305) 0.354 (0.332) –k #0.490 (0.047)Adjusted AUC (95% CI) 0.82 (0.82, 0.82) 0.99 (0.99, 0.99) 0.78 (0.78, 0.78) 0.88 (0.88, 0.89) 0.76 (0.75, 0.77) 0.83 (0.81, 0.84)
ASSIST-Lite DIF analysisGender (0 = female; 1 = male) 0.076 (0.072) #0.143 (0.120) 0.525 (0.000) 0.020 (0.809) #0.362 (0.177) 0.717 (0.000)Age (years) 0.003 (0.443) 0.003 (0.396) #0.007 (0.166) 0.001 (0.809) #0.029 (0.022) #0.003 (0.618)
Note:a Item pair is CONCERN and CONTROL.b Item pair is CPD (more than 10 cigarettes per day) and FIRST (smokes within 30 min after waking).c Item pair is URGE (weekly or more often) and CONCERN.d Item pair is FREQUENCY (weekly or more often) and CONCERN.e Prevalence of DSM-IV substance dependence diagnosis (low-moderate versus moderate–severe dependence for tobacco by FTND).f ASSIST-Lite test score is mean (standard deviation) for the two-items (range, 0–2 [i.e. both negative, one positive, both positive]) among users in past three months.g ES – dependence is sample-size adjusted Hedge’s g effect size (ES; Hedges and Olkin, 1985) for mean difference in ASSIST-Lite severity score (range 0–2) between
participants diagnosed positive or negative for current DSM-IV substance dependence (tobacco: low–moderate versus moderate–severe tobacco dependence via FTND.h ES – days used is ES for days used in past three months among respondents case positive on the ASSIST-Lite (i.e. positive for either test item or both).i AUC for ASSIST 3 test score computing using the item weights in the pooled dataset.j Values in parentheses for covariates are probability (P) values for the ROC model coefficients.k Not computed as all cases from general medical settings.
PVP is predictive value of the positive test; NVP is predictive value of the negative test; kappa is the chance corrected index of agreement between the test and referencestandard; LR+ is likelihood ratio for the positive test; LR# is likelihood ratio for the negative test; CUI+ is the positive clinical utility index (sensitivity % PPV); CUI# is thenegative clinical utility index (specificity % NPV); AUC is area under the (receiver operating characteristic) curve.
Finally, there was no evidence of marked diagnostic accuracyvariation between countries (where prevalence of substance useallowed computation of ROC statistics), as follows: alcohol (AUCrange, 0.820 [Korea] – 0.822 [Australia]); tobacco (all countries,0.990); cannabis (excluding China and Korea; 0.773 [USA] – 0.891[Brazil]); stimulants (excluding China, India, Korea, Zimbabwe;0.875 [Australia] – 0.891 [Brazil]); sedatives (excluding Brazil,China, Korea, Zimbabwe; 0.741 [Thailand] – 0.793 [USA]);opioids (excluding Brazil, China, Korea, Zimbabwe; 0.750[Australia] – 0.891 [India]).
4. Discussion
4.1. Main findings
We were able to remove between three and four questions fromthe ASSIST 3.0 for each of the six substances, while preserving alatent structure (SUD severity). Acceptable-to-excellent diagnos-tic accuracy was secured with a pair of test questions for eachsubstance to create the ASSIST-Lite.
ASSIST 3.0 did not have strong diagnostic accuracy for tobaccodependence in this study (AUC, 0.69). The ASSIST-Lite resolves thiswith the inclusion of two new highly accurate items: smoking morethan 10 cigarettes per day and smoking within 30 min after wak-ing. These two items have been previously identified by tobaccoresearchers using the original ordinal scaling of the FTND andlabelled the Heavy Smoking Index (HSI; Diaz et al., 2005). Our ver-sion truncates these items to an easy to administer Yes/No responseformat.
For the other substances, the previous omnibus test approachwith complex scoring weights has shifted to a simply-scoredcommon item for alcohol, cannabis, stimulants, sedatives andopioids (anyone expressed concern), and a second item capturinginformation about cognitive and behavioural aspects and fre-quency of use: strong desire or urge to use each week or moreoften (cannabis, sedatives); consumption each week or more often(stimulants); and unsuccessful efforts to cut down, control or quit(alcohol and opioids).
With scoring for these pairs (i.e. either both negative, eitherpositive, or both positive) we achieved superior AUC performance

R. Ali et al. / Drug and Alcohol Dependence 132 (2013) 352– 361 359
for the ASSIST-Lite compared to the ASSIST 3.0 for alcohol andtobacco and good overall (non-inferior) discrimination (AUC range0.81–0.93) for the other four substances, all with acceptable-to-excellent concordance between positive screening results anddependence for all items (concordance kappa range, 0.53–0.85).Using the SSI scoring, we demonstrated excellent construct valid-ity between respondents who were diagnosed on the referencestandard, and on average there were more reported days of sub-stance use among participants who met the cut-off score. Therewas no sign of significant statistical or clinically important testbias when assessing gender, age and recruitment setting covari-ates and when examining country-level AUC (as permitted byavailable data). DIF assessments showed no group differences intest scores with the exception that male opioid users had a moresevere SSI. The clinical implication of this finding needs furtherevaluation.
4.2. Strengths and limitations
Study strengths include the relatively large and culturallydiverse sample, and the application of a systematic test item evalua-tion and reduction procedure. Three limitations are acknowledged:firstly, substance use prevalence limited sample sizes such thatwhile all countries contributed data on alcohol and tobacco, somesamples were limited to alcohol only (China and Korea) and seda-tives and opioids (Brazil and Zimbabwe). There is an opportunity forfurther development work specifically on the instrument in thesecountries. We also hope our development of the ASSIST-Lite willencourage further external validation using new samples in othercultural settings.
Second, the development of the ASSIST-Lite relies substantiallyon data from Sample 1 (the psychometric study) which includedone-third of respondents from specialist addictions clinics wherethe prevalence of SUD is greater than would be seen in an exclu-sively general medical cohort. As noted in the Methods, it was adeliberate decision to sample higher levels of SUD severity; largescale sampling would have been needed to secure data from thissub-population exclusively from general medical settings.
Third, clinical interview based screening risks false-negativeand false-positive reporting (the latter possible in communitycontexts with low treatment capacity and high demand). Urinedrug screening for primary metabolites and other markers of sub-stance use (saliva or blood tests for alcohol [liver function] andbreath carbon monoxide test for tobacco) could serve as an alter-native to clinical interview. However, low patient acceptance couldcompromise the validity of findings. Some of these measures arealso relatively costly and generally only indicate recent consump-tion. We acknowledge an important role for biological measures,where feasible, and as a research method to inform case formula-tion and monitor behaviour change.
4.3. Practical application
For each substance, the ASSIST-Lite has the following scoring:
Not used in the past three months (0);Use, but no other items positive (1);Use and either test item positive (2);Use and both items positive (3).
The cut-off score for a likely SUD is 2. Any use of tobacco,cannabis, stimulants, sedatives and opioids (including non-prescribed use of pharmaceutical products in the latter threesubstance types) is a risk to health. However, alcohol is a logicalexception. To capture hazardous drinking related to intoxicationwe recommend that an additional criterion question is included.
There is no international consensus on a level of alcohol consump-tion that is hazardous to health. As an example, the Australiannational guideline (no more than four standard drinks [1 standarddrink = 10 g alcohol] on a single occasion for both men and women)is evidence-supported (Commonwealth of Australia, 2009). Alter-natively, the third question from AUDIT could be used, binaryscored for ease of administration and scoring. A respondent whohas consumed alcohol in the past three months and screens neg-ative on the alcohol ASSIST-Lite items, but has recently consumedmore than four drinks on an occasion, could receive normativefeedback and advice on health risks. With a hazardous con-sumption item included, the alcohol cut-off for the ASSIST-Liteincreases to a score of 3. Optionally, including a final question torecord another substance type, given local prevalence or emergentsubstance use patterns, can help to cue further evaluation inscreening programmes.
Taking the ASSIST-Lite forward, we are now preparing suppor-ting material on linking the SSI score to behavioural interventions,including referral to specialist services. Our existing screeningand case management materials remain highly relevant for healthservice professionals planning brief interventions. Using meth-ods described by Marsden et al. (2011), we are now preparinga report on the new SSI’s statistical and clinical sensitivity char-acteristics as an outcome measure for intervention evaluation.With an ultra-brief, multi-substance screener in hand (which weestimate can be completed in less than 2 min), we are also devel-oping an electronic self-completion format using computer tabletand smart-phone technologies. We envisage that an adaptive IRTapproach, which presents items based on previous responses canunderpin a screening which offers personalised feedback and per-sonalised, brief psychological treatments.
Appendix A below shows the final simplified question structureand scoring for a single-page, interviewer-administered format forthe ASSIST-Lite, using the Australian four standard drinks crite-rion as an example. To minimise false-positive reporting we havemodified the phrasing of the medications to refer to use ‘not as pre-scribed’ to avoid questioning patients who are taking a medicationas instructed. This phrase captures use for the direct psychoac-tive effect and also where the patient self-medicates (i.e. takesmore than prescribed or consumed via a different administrationroute).
4.4. Conclusions
In 2008, an American Preventive Services Task Force called fora research and development initiative to: “provide questionnairesshort enough to be potentially useful in the practice setting withacceptable accuracy and reliability” (US Preventive Services TaskForce, 2008). We would add several further desirable characteris-tics: development in different cultural and language contexts; widecoverage of psychoactive substances; ease of completion; simpleand clearly interpretable scoring; and public availability withoutcost for non-commercial use. The ASSIST-Lite has all of the abovecharacteristics. It is therefore ideally suited for opportunistic androutine screening for SUD severity in primary, general medical andwelfare service settings.
Role of funding source
Resource costs for this study were supported by the AustralianCommonwealth Department of Health and Ageing to the Drugand Alcohol Services South Australia WHO Collaborating Centrefor Research into the Treatment of Drug and Alcohol Problems.Previous studies generating Samples 1 and 2 were funded by theDepartment of Mental Health and Substance Abuse, World Health

360 R. Ali et al. / Drug and Alcohol Dependence 132 (2013) 352– 361
Organization, Geneva, Switzerland. The contents of this article aresolely the responsibility of the authors and do not necessarilyreflect the official policy or views of the Australian CommonwealthDepartment of Health and Ageing, or the opinion, decision or statedpolicy of the WHO or Public Health England.
Contributors
The statistical analysis plan for the ASSIST-Lite was developed byJ.M. and R.A. following advice from an independent scientific con-sultative committee (see Acknowledgements). J.M. implementedthe analysis with B.E., and B.E., S.M. and I.R. were responsible fordata management and quality assurance. R.A. and J.M. wrote a com-plete first draft of the manuscript. Following input from all authorsregarding interpretation of the data and final editing of the text,R.A. took the decision to submit for publication.
Conflict of interest
Through the University of Adelaide R.A. has received untied edu-cational grants (but no fees or benefits) from Reckitt BenckiserPharmaceuticals (RBP) to convene scientific meetings, and anuntied grant for a pharmacogenetic study of opioid agonist treat-ment (OAT) in 2010. J.M. works in an integrated university andNational Health Service academic health sciences centre in theUnited Kingdom (King’s Health Partners) and declares the followingfinancial relationships: part-time employment as Senior AcademicAdvisor for the Drugs and Alcohol, Health and Wellbeing Direc-torate, Public Health England. All other authors declare no otherpotential conflicts of interest relevant to this article.
Instructions: These questions ask about psychoactive substances in the PAST 3 MONTHS ONLY
1 Did you smoke a cigarette containing tobacco? Yes [1] No [0] > No: Skip to Q21a Did you usually smoke more than 10 cigarettes each day? Yes [1] No [0]1b Did you usually smoke within 30 minutes after waking? Yes [1] No [0] Tobacco score: [0–3]
Cut-off = 2
2 Did you have a drink containing alcohol? Yes [1] No [0] > No: Skip to Q32a On any occasion, did you drink more than 4 standard drinks of alcohol?* Yes [1] No [0]2b Have you tried and failed to control, cut down or stop drinking? Yes [1] No [0]2c Has anyone expressed concern about your drinking? Yes [1] No [0] Alcohol score: [0–4]* 1 standard drink is about 1 small glass of wine, or one can of medium
strength beer, or one single shot of spirits1Cut-off = 3
3 Did you use cannabis? Yes [1] No [0] > No: Skip to Q43a Have you had a strong desire or urge to use cannabis at least once a
week or more often?Yes [1] No [0]
3b Has anyone expressed concern about your use of cannabis? Yes [1] No [0] Cannabis score: [0–3]Cut-off = 2
4 Did you use an amphetamine-type stimulant, or cocaine, or a stimulantmedication not as prescribed?
Yes [1] No [0] > No: Skip to Q5
4a Did you use a stimulant at least once each week or more often? Yes [1] No [0]4b Has anyone expressed concern about your use of a stimulant? Yes [1] No [0] Stimulant score: [0–3]
Cut-off = 2
5 Did you use a sedative or sleeping medication not as prescribed? Yes [1] No [0] > No: Skip to Q65a Have you had a strong desire or urge to use a sedative or sleeping
medication at least once a week or more often?Yes [1] No [0]
5b Has anyone expressed concern about your use of a sedative or sleepingmedication?
Yes [1] No [0] Sedative score: [0–3]
Cut-off = 2
6 Did you use a street opioid (e.g. heroin), or an opioid-containingmedication not as prescribed?
Yes [1] No [0] > No: Skip to Q7
6a Have you tried and failed to control, cut down or stop using an opioid? Yes [1] No [0]6b Has anyone expressed concern about your use of an opioid? Yes [1] No [0] Opioid score: [0–3]
Cut-off = 2
7. Did you use any other psychoactive altering substance?What did you take? Not scored – but prompts further assessment* Note that this is the Australian national guideline shown as an example.
Acknowledgements
Our sincere thanks is extended to all collaborators on the pre-vious ASSIST projects, and to our current collaborators on theUniversity of Adelaide study: Atul Ambeker (All India Instituteof Medical Sciences, New Delhi, India); Sawitri Assanangkornchai(Prince of Songkhla University, Thailand); Sylvia Ebert (Interme-diate Care Centre, Adelaide Health Services, Australia); Du Jiang(Shanghai Jiaotong University, Shanghai, China); Rakesh Lal (AllIndia Institute of Medical Sciences, New Delhi, India); and KyeSeong Lee (Seoul National Hospital, Seoul, South Korea).
We also kindly acknowledge the advice of the members of theASSIST-Lite scientific consultative group: Betty Tai (National Insti-tutes of Health/National Institute of Drug Abuse [Chair]); LitzyWu (Duke University); Richard Saitz (Boston University Schools ofMedicine & Public Health); and Richard Schottenfeld (Yale Univer-sity). J.M. kindly acknowledges Robert West and John Stapleton(University College London) for advice on tobacco dependencescreening.
The following members of the WHO ASSIST advisory commit-tee also provided helpful comments on a draft of the manuscript:Thomas Babor (University of Connecticut); Wilson Compton(NIDA); Richard Denisco (NIDA); Carina Ferreira-Borges (WHO);Maria Lucia O Souza-Formigoni (Universidade Federal de SaoPaulo); Walter Ling (UCLA); Vladimir Poznyak (WHO); and RichardRawson (UCLA).
Appendix A. Alcohol, Smoking and Substance InvolvementScreening Test (ASSIST-Lite)

R. Ali et al. / Drug and Alcohol Dependence 132 (2013) 352– 361 361
Appendix B. Supplementary data
Supplementary data associated with this article can be found,in the online version, at http://dx.doi.org/10.1016/j.drugalcdep.2013.03.001.
References
American Psychiatric Association, 2000. Diagnostic and Statistical Manual of MentalDisorders, 4th ed., Text Revision. American Psychiatric Publishing, Washington,DC.
Banta, J.E., Montgomery, S., 2007. Substance abuse and dependence treatmentin outpatient physician offices, 1997–2004. Am. J. Drug Alcohol Abuse 33,583–593.
Bossuyt, P.M., Reitsma, J.B., Bruns, D.E., Gatsonis, C.A., Glasziou, P.P., Irwig, L.M.,Lijmer, J.G., Moher, D., Rennie, D., de Vet, H.C., 2003. Towards complete andaccurate reporting of studies of diagnostic accuracy: the STARD initiative. BMJ326, 41–44.
Browne, M.W., Cudeck, R., 1993. Alternative ways of assessing model fit. In: Bollen,K., Long, J. (Eds.), Testing Structural Equation Models. Sage, Newbury Park, pp.136–162.
Bush, K., Kivlahan, D.R., McDonell, M.B., Fihn, S.D., Bradley, K.A., 1998. The AUDITAlcohol Consumption Questions (AUDIT-C): an effective brief screening test forproblem drinking. Arch. Intern. Med. 158, 1789–1795.
Cattell, R., 1966. Handbook of Multivariate Experimental Psychology. Rand McNally,Chicago.
Commonwealth of Australia, 2009. Australian Guidelines to Reduce Health Risksfrom Drinking Alcohol. Australian Government and National Health and MedicalResearch Council, Canberra.
Diaz, F.J., Jané, M., Saltó, E., Pardell, H., Salleras, L., Pinet, C., de Leon, J., 2005. A briefmeasure of high nicotine dependence for busy clinicians and large epidemio-logical surveys. Aust. N. Z. J. Psychiatry 39, 161–168.
Embretson, S.E., Reise, S., 2000. Item Response Theory for Psychologists. ErlbaumPublishers, Mahwah.
Ferguson, E., Cox, T., 1993. Exploratory factor analysis: a users’ guide. Int. J. Select.Assess. 1, 84–94.
Flora, D.B., Curran, P.J., 2004. An empirical evaluation of alternative methods of esti-mation for confirmatory factor analysis with ordinal data. Psychol. Methods 9,466–491.
Hedges, L.V., Olkin, I., 1985. Statistical Methods for Meta-Analysis. Academic Press,New York.
Harrell, F.E., Kerry, L.L., Mark, D.B., 1996. Tutorial in biostatistics. Multivari-able prognostic models: issues in developing models, evaluating assump-tions and adequacy and measuring and reducing errors. Stat. Med. 15,361–387.
Hides, L., Cotton, S.M., Berger, G., Gleeson, J., O‘Donnell, C., Proffitt, T., McGorry, P.D.,Lubman, D.I., 2009. The reliability and validity of the Alcohol, Smoking andSubstance Involvement Screening Test (ASSIST) in first-episode psychosis.Addict. Behav. 34, 821–825.
Hotham, E., Ali, R., White, J., Sullivan T., Franzcog, J.R. Investigation of the alcohol,smoking and substance involvement screening test (the ASSIST) version 3.0 inpregnancy. Addict. Disord. Treat. in press
Hu, L., Bentler, P.M., 1999. Cutoff criteria for fit indexes in covariance structureanalysis: conventional criteria versus new alternatives. Struct. Equat. Model.6, 1–55.
Humeniuk, R., Henry-Edwards, S., Ali, R., 2003. Self-Help Strategies for Cutting Downor Stopping Substance Use: Guide (Draft version 1.1 for field testing). WorldHealth Organization, Geneva.
Humeniuk, R., Ali, R., Babor, T.F., Farrell, M., Formigoni, M.L., Jittiwutikarn, J., De Lac-erda, R.B., Ling, W., Marsden, J., Monteiro, M., Nhiwatiwa, S., Pal, H., Poznyak, V.,Simon, S., 2008. Validation of the Alcohol, Smoking and Substance InvolvementScreening Test (ASSIST). Addiction 103, 1039–1047.
Humeniuk, R.E., Henry-Edwards, S., Ali, R.L., Poznyak, V., Monteiro, M., 2010a. TheAlcohol, Smoking and Substance Involvement Screening Test (ASSIST): Manualfor use in Primary Care. World Health Organization, Geneva.
Humeniuk, R.E., Henry-Edwards, S., Ali, R.L., Poznyak, V., Monteiro, M., 2010b. TheASSIST-Linked Brief Intervention for Hazardous and Harmful Substance Use:Manual for Use in Primary Care. World Health Organization, Geneva.
Humeniuk, R., Ali, R., Babor, T., Souza-Formigoni, M.L., de Lacerda, R.B., Ling, W.,McRee, B., Newcombe, D., Pal, H., Poznyak, V., Simon, S., Vendetti, J., 2012. Arandomized controlled trial of a brief intervention for illicit drugs linked to theAlcohol, Smoking and Substance Involvement Screening Test (ASSIST) in clients
recruited from primary health-care settings in four countries. Addiction 107,957–966.
Khan, R., Chatton, A., Nallet, A., Broers, B., Thorens, G., Achab-Arigo, S., Poznyak, V.,Fleischmann, A., Khazaal, Y., Zullino, D., 2011. Validation of the French version ofthe Alcohol, Smoking and Substance Involvement Screening Test (ASSIST). Eur.Addict. Res. 17, 190–197.
Landis, J.R., Koch, G.G., 1977. The measurement of observer agreement for categoricaldata. Biometrics 33, 159–174.
Langenbucher, J.W., Labouvie, E., Martin, C.S., Sanjuan, P.M., Bavly, L., Kirisci, L.,Chung, T., 2004. An application of item response theory analysis to alcohol,cannabis, and cocaine criteria in DSM-IV. J. Abnorm. Psychol. 113, 72–80.
Lee, J.D., Delbanco, B., Wu, E., Gourevitch, M.N., 2011. Substance use prevalenceand screening instrument comparisons in urban primary care. Subst. Abuse 32,128–134.
Madras, B.K., Compton, W.M., Avula, D., Stegbauer, T., Stein, J.B., Clark, H.W., 2009.Screening, brief interventions, referral to treatment (SBIRT) for illicit drug andalcohol use at multiple healthcare sites: comparison at intake and 6 monthslater. Drug Alcohol Depend. 99, 280–295.
Marsden, J., Eastwood, B., Wright, C., Bradbury, C., Knight, J., Hammond, P., 2011. Howbest to measure change in evaluations of treatment for substance use disorder.Addiction 106, 294–302.
Marsden, J., Eastwood, B., Jones, H., Bradbury, C., Hickman, M., Knight, J., Rand-hawa, K., White, M., 2012. Risk adjustment of heroin treatment outcomes forcomparative performance assessment in England. Addiction 107, 2161–2172.
Mdege, N.D., Lang, J., 2011. Screening instruments for detecting illicit drug use/abusethat could be useful in general hospital wards: a systematic review. Addict.Behav. 36, 1111–1119.
Mitchell, A.J., 2012. Clinical utility of screening for clinical depression and bipolardisorder. Curr. Opin. Psychiatr. 25, 24–31.
National Institute of Drug Abuse, 2009. Screening for Drug Use in General MedicalSettings: A Resource Guide for Providers. Available from: http://www.nida.nih.gov/nidamed/screening/
Raykov, T., Marcoulides, G.A., 2006. A First Course in Structural Equation Modeling.Erlbaum, Mahwah.
Ruscio, J., Roche, B., 2012. Determining the number of factors to retain in anexploratory factor analysis using comparison data of known factorial structure.Psychol. Assess. 24, 282–292.
Saha, T.D., Chou, S.P., Grant, B.F., 2006. Toward an alcohol use disorder continuumusing item response theory: results from the National Epidemiologic Survey onAlcohol and Related Conditions. Psychol. Med. 36, 931–941.
Samejima, F., 1969. Estimation of latent ability using a response pattern of gradedscores. Psychometrik. Monogr. Suppl. 34, 100–114.
Sheehan, D.V., Lecrubier, Y., Sheehan, K.H., Amorim, P., Janavs, J., Weiller, E., Her-gueta, T., Baker, R., Dunbar, G.C., 1998. The Mini-International NeuropsychiatricInterview (M.I.N.I.): the development and validation of a structured diagnosticpsychiatric interview for DSM-IV and ICD-10. J. Clin. Psychiatry 59 (Suppl. 20),22–33.
Smith, P.C., Schmidt, S.M., Davis, D.A., Saitz, R., 2010. A single-question screeningtest for drug use in primary care. Ann. Intern. Med. 170, 1155–1160.
Stout, W.F., 1990. A new item response theory modeling approach with applica-tions to unidimensionality assessment and ability estimation. Psychometrika55, 293–325.
Tate, J.C., Schmitz, J.M., 1993. A proposed revision of the Fagerstrom Tolerance Ques-tionnaire. Addict. Behav. 18, 135–143.
United Nations Office on Drug and Crime, 2012. World Drug Report 2012. UnitedNations Office on Drug and Crime, Vienna.
US Preventive Services Task Force, 2008. Screening in Primary Health Care Settingsfor Illicit Drug Use: Assessment of Screening Instruments – A Supplemental Evi-dence Update for the US Preventive Services Task Force. Evidence Synthesis.Number 58, Part 2. Washington, DC.
World Health Organization, 2002. World Health Report 2002: Reducing Risks Pro-moting Health Life. World Health Organization, Geneva.
World Health Organization Alcohol, Smoking and Substance Involvement ScreeningTest (WHO ASSIST Working Group), 2002. The Alcohol, Smoking and SubstanceInvolvement Screening Test (ASSIST): development, reliability and feasibility.Addiction 97, 1183–1194.
World Health Organization, 2008. The Global Burden of Disease: 2004 Update. WorldHealth Organization, Geneva.
World Health Organization, 2009. Global Health Risks. Mortality and Burden ofDiseases Attributable to Selected Major Risks. WHO Press, World Health Orga-nization, Geneva.
World Health Organization, 2010. ATLAS on Substance Use: Resources for the Pre-ventions and Treatment of Substance Use Disorders. World Health Organization,Geneva.
Related Documents