Volume 2, Issue 7, July– 2017 International Journal of Innovative Science and Research Technology ISSN No: - 2456 – 2165 IJISRT17JL171 www.ijisrt.com 334 Ultra-Performance Liquid Chromatographic Method for Quantification of Clofarabine Related Substances in an Injection Formulation Dhananjay Prasad Dwivedi* B Ravi Kumar,Konda Sidda Reddy, Prof.J. Sreeramlu *Department of Chemistry Rayalaseema University Kurnool- Andhra Pradesh, India Abstract:-A new and stability-indicatingreversed- phase ultra performance liquid chromatographymethod was developed and validated for simultaneous determination of clofarabine impurities in Injectionformulation. The chromatographic separation was carried out on an ACQUITY UPLC® CSH C18 (50mm x 2.1mm, 1.7μm)using a mobile phase consisting of Ammonium formate buffer with pH 3.0 andacetonitrile at a flow rate of 0.28 ml/min and an injection volume of 1μL. The method was validated for precision, accuracy, specificity, linearity, sensitivity and robustness. The UV detection was performed at 264 nm.The proposed method can be applied for quality control, release and stability analysis of clofarabine and its impurities in Injection formulation. Keywords:- Clofarabine, Stability-indicating, UPLC, Validation. I. INTRODUCTION: Clofarabine, an antimetabolite purine nucleoside used in the treatment of lymphoblastic leukemia. The clofarabine is intracellularly converted to 5'- monophosphate by deoxycytidine kinase and 5'- triphosphate by mono- and di-phosphokinases [101. This metabolite halts DNA synthesis by inhibiting ribonucleotide reductase leading to depletion of intracellular deoxynucleotide triphosphate pool. However, self - potentiation of clofarabine triphosphate incorporation into DNA increases the extent of inhibition of DNA synthesis [Ill Preclinical models has been demonstrated that clofarabine 5'- triphosphate inhibits DNA repair by incorporation into the DNA chain during the repair process [12-13]. It disrupts the mitochondrial membrane integrity and induces apoptosis by releasing cytochrome C and apoptosis- inducing factor [1°1. The IUPAC name of clofarabine is (2R, 3R, 4S, 5R)-5-(6-amino- 2-chloropurin-9- y1)- 4-fluoro-2- (hydroxymethyl) oxolan-3-ol empirical formula is CioHi IC1 FN503 and molecular weight is 303.67 g/mol• (Figure 1). Clofarabine developed by Genzyme Corporation, USA, listed on January 11, 2005 by the U.S. FDA expedited procedures, as over the past decade the first approved specifically for the treatment of childhood leukemia drug, mainly used in the treatment of children with refractory or recurrent acute lymphoblastic leukemia (ALL) in children previously at least has received two therapy invalid. Clofarabine is not listed in any pharmacopoeia, however few chromatographic methods are reported on its determination. Recently, LC-MS/MS method was used for determination of clofarabine in human urine and plasma. Of late, HPLC method is reported for the determination of concentration of clofarabine in rat plasma [10]. LC/MS method is reported for analysis and identification of chlorinated impurity of clofarabine. Ultra performance convergence chromatography method was used for identification of two related substances in clofarabine [11]. Over period, several stabilityindicating reverse phase high performance liquid chromatography (RP-HPLC) methods were developed for determination of concentration of clofarabine [14-15]. II. CHEMICAL STRUCTURE OF CLOFARABINE AND ITS IMPURITIES: a) Clofarabine

Welcome message from author
This document is posted to help you gain knowledge. Please leave a comment to let me know what you think about it! Share it to your friends and learn new things together.
Transcript

Volume 2, Issue 7, July– 2017 International Journal of Innovative Science and Research Technology
ISSN No: - 2456 – 2165
IJISRT17JL171 www.ijisrt.com 334
Ultra-Performance Liquid Chromatographic Method for
Quantification of Clofarabine Related Substances in an
Injection Formulation
Dhananjay Prasad Dwivedi* B Ravi Kumar,Konda Sidda Reddy, Prof.J. Sreeramlu
*Department of Chemistry Rayalaseema
University Kurnool- Andhra Pradesh, India
Abstract:-A new and stability-indicatingreversed-
phase ultra performance liquid
chromatographymethod was developed and
validated for simultaneous determination of
clofarabine impurities in Injectionformulation. The
chromatographic separation was carried out on an
ACQUITY UPLC® CSH C18 (50mm x 2.1mm,
1.7µm)using a mobile phase consisting of
Ammonium formate buffer with pH 3.0
andacetonitrile at a flow rate of 0.28 ml/min and an
injection volume of 1µL. The method was validated
for precision, accuracy, specificity, linearity,
sensitivity and robustness. The UV detection was
performed at 264 nm.The proposed method can be
applied for quality control, release and stability
analysis of clofarabine and its impurities in
Injection formulation.
Keywords:- Clofarabine, Stability-indicating, UPLC,
Validation.
I. INTRODUCTION:
Clofarabine, an antimetabolite purine nucleoside used
in the treatment of lymphoblastic leukemia. The
clofarabine is intracellularly converted to 5' -
monophosphate by deoxycytidine kinase and 5'-
triphosphate by mono- and di-phosphokinases [101.
This metabolite halts DNA synthesis by inhibiting
ribonucleotide reductase leading to depletion of
intracellular deoxynucleotide triphosphate pool.
However, self - potentiation of clofarabine triphosphate
incorporation into DNA increases the extent of
inhibition of DNA synthesis [Ill Preclinical models has
been demonstrated that clofarabine 5'- triphosphate
inhibits DNA repair by incorporation into the DNA
chain during the repair process [12-13]. It disrupts the
mitochondrial membrane integrity and induces
apoptosis by releasing cytochrome C and apoptosis-
inducing factor [1°1. The IUPAC name of clofarabine
is (2R, 3R, 4S, 5R)-5-(6-amino- 2-chloropurin-9- y1)-
4-fluoro-2- (hydroxymethyl) oxolan-3-ol empirical
formula is CioHi IC1 FN503 and molecular weight is
303.67 g/mol• (Figure 1). Clofarabine developed by
Genzyme Corporation, USA, listed on January 11, 2005
by the U.S. FDA expedited procedures, as over the past
decade the first approved specifically for the treatment
of childhood leukemia drug, mainly used in the
treatment of children with refractory or recurrent acute
lymphoblastic leukemia (ALL) in children previously at
least has received two therapy invalid. Clofarabine is
not listed in any pharmacopoeia, however few
chromatographic methods are reported on its
determination. Recently, LC-MS/MS method was used
for determination of clofarabine in human urine and
plasma. Of late, HPLC method is reported for the
determination of concentration of clofarabine in rat
plasma [10]. LC/MS method is reported for analysis
and identification of chlorinated impurity of
clofarabine. Ultra performance convergence
chromatography method was used for identification of
two related substances in clofarabine [11]. Over period,
several stabilityindicating reverse phase high
performance liquid chromatography (RP-HPLC)
methods were developed for determination of
concentration of clofarabine [14-15].
II. CHEMICAL STRUCTURE OF
CLOFARABINE AND ITS IMPURITIES :
a) Clofarabine

Volume 2, Issue 7, July– 2017 International Journal of Innovative Science and Research Technology
ISSN No: - 2456 – 2165
IJISRT17JL171 www.ijisrt.com 335
b) Impurity-A:
c) Impurity-B:
d) Impurity-C:
III. MATERIALS AND METHODS
A. Chemicals And Drugs
Ammonium formate (AR Grade) was used to prepare
the buffer and obtained from Sigma-Aldrich. Formic
acid (AR Grade) used to adjust the pH, was obtained
from Merck Specialties, India. The active
pharmaceutical ingredient clofarabine and impurities
were obtained from internally.
B. Selection of detection wavelength
The sensitivity of a method that uses a UV detector depends on
the proper selection of wavelength. An ideal wavelength is that
which is maximally absorbed and provides an acceptable
response for the drug, which should not interfere with other
peaks.
UV spectra of the drug and its impurities were recorded by
scanning between 200 and 400 nm.The spectra of drug and its
impurities were overlaid and the wavelength 264 nm was
selected where the active analyte as well as impurities have
sufficient response for detection and quantification. The
ultraviolet scans of Clofarabine and the three potential
impurities are depicted.
C. Instrument and Chromatographic condition:
The Integrated Acquity UPLC system used for the study was
purchased from Waters Corporation, Milford, USA and
equipped with Waters photodiode array detector (PDA). Data
collection and analysis was performed using Empower
software 2pro (Waters Corporation). The balance used for
weighing the reference standards and samples was purchased
from Metter Toledo. Separation was achieved on a Waters
acquity CSH C18 column with dimensions 50 mm x 2.1 mm
I.D and a particle size of 1.7 µm. A simple mobile phase
consisting of Ammonium formate buffer (0.01 M, pH 3.0) and
Buffer: acetonitrile (Mobile phase B) was pumped into the
UPLC chromatograph using a gradient program with varying
compositions at a flow rate of 0.28 mL/ min, with a column
temperature of 50°C throughout the run. Sample volume of
1µpL was injected into the chromatograph and detected at 264
nm.
The final conditions summarized in the Table.No:1 and 2.
• Preparation of standard and sample solution
A mixture of water and methanol in the ratio 20:80 was used as
a diluent for preparing the solutions of standard and samples
(diluent).
• Standard stock solution
A standard stock solution was prepared by dissolving 25 mg of
Clofarabine working standard in 100 mL of the diluent.
• Preparation of standard solution for impurities
determination (0.001 mg per mL)
The standard solution for the determination of impurities was
prepared by diluting 5 mL of the standard stock into 50 mL with
the diluent and further diluted 2 mL of the solution into 50 mL
with the diluent to obtain a concentration of 0.001 mg per mL.

Volume 2, Issue 7, July– 2017 International Journal of Innovative Science and Research Technology
ISSN No: - 2456 – 2165
IJISRT17JL171 www.ijisrt.com 336
• Preparation of sample and placebo solution for impurities
determination.
Sample solution was prepared by diluting 2 mL of the pooled
Clofarabine injection to 10 mL using the diluents to obtain a
concentration of 0.5 mg per mL.
Placebo equivalent to 5 mg of the sample was taken and diluted
to 10 mL with the diluents and mixed.
• Preparation of spiked sample solution for impurities
determination
Stock solution of all impurities was prepared by dissolving an
appropriate quantity of each impurity in the diluent to obtain a
concentration of 1 mg per mL. An appropriate volume of
impurity stock solution was diluted with sample solution to get
a final concentration of 0.2% for each impurity.
Figure 2.
D. Method development and optimization
Clofarabine has ionizable amino groups, and hence, the
retention time of the drug is highly dependent on the pH of the
mobile phase. In the present study, the pH of the mobile phase
was maintained acidic (pH = 3.0) by the addition of formic acid
solution. This yields narrow and symmetrical peak.Before
initiating the development activity, information on impurities
and their acceptable limits was collected to define sample
concentration and the range of the method. The maximum daily
dose of Clofarabine is 50mg/day. Based on the daily dose, the
qualification threshold did not exceed 0.5%, and the
identification threshold was 0.2%. Method development was
targeted to cover a range of 50-150% of identification threshold
for impurities. A systematic approach was adopted for the
method development.
Fig. 3 .Chromatogram obtained from Trial-1.
263.0
210.0
264.0
336.0 370.0 389.0
263.0
210.0
264.0
328.0 375.0
nm
200.00 220.00 240.00 260.00 280.00 300.00 320.00 340.00 360.00 380.00 400.00
Clofarabine
Impurity B
Impurity A
Impurity C

Volume 2, Issue 7, July– 2017 International Journal of Innovative Science and Research Technology
ISSN No: - 2456 – 2165
IJISRT17JL171 www.ijisrt.com 337
Another attempt was made by changing the gradient program
and keeping other parameters unchanged. The patterns obtained
from both trials did not differ significantly. The pattern obtained
for trial 2 is depicted in Figure 4.
The next trial was made by changing the column to Waters CSH
C18, 50 x 2.1 mm, 1.7 µm. The remaining chromatographic
parameters were unchanged. All impurities were appropriately
separated from each other. The resolution between impurity B
and the Clofarabine is further improved by modifying the
gradient program. The optimized chromatographic conditions
are listed in Table:1 and 2. A specimen chromatogram obtained
from the final method parameters is illustrated in Figure 5.
Fig. 4 . Chromatogram obtained from Trial-2.
Fig. 5 . Specimen Chromatogram obtained from final method:

Volume 2, Issue 7, July– 2017 International Journal of Innovative Science and Research Technology
ISSN No: - 2456 – 2165
IJISRT17JL171 www.ijisrt.com 338
Table No. : 1. Optimized Chromatographic Conditions.
Chromatograph WatersAcquity UPLC system
Mobile phase
Mobile Phase A: pH3.0, 10mM Ammonium formate Buffer
Mobile Phase B: Buffer : Acetonitrile (20:80v/v)
(80:20%v/v)
Column Acquity UPLC CSH C18, (50mmx2.1mm) 1.7µm
size)
Detector PDA
Flow rate 0.28 ml/min
Wavelength detection 264 nm
Injection volume 1µL
Column Oven Temperature 50°C
Run time 16 min
Diluent Methanol: Water (80:20 v/v)
Table No. : 2. Gradient Programmed.
Time(mins) Flow(ml/min) %A %B
Initial 0.28 95.00 5.00
5.00 0.28 95.00 5.00
7.00 0.28 75.00 25.0
9.00 0.28 60.00 40.0
12.00 0.28 15.00 85.0
14.00 0.28 95.00 5.00
16.00 0.28 95.00 5.00
Volume 2, Issue 7, July– 2017 International Journal of Innovative Science and Research Technology
ISSN No: - 2456 – 2165
IJISRT17JL171 www.ijisrt.com 339
IV. METHOD VALIDATION
A. Results and Discussion
The optimized method was fully validated for determination of
impurities as per ICH guidelines, (Q2A (R1) validation of
analytical procedures. The method was validated for specificity,
precision, accuracy, linearity,Limit of Detection (LOD), Limit
of Quantification (LOQ) and Robustness.
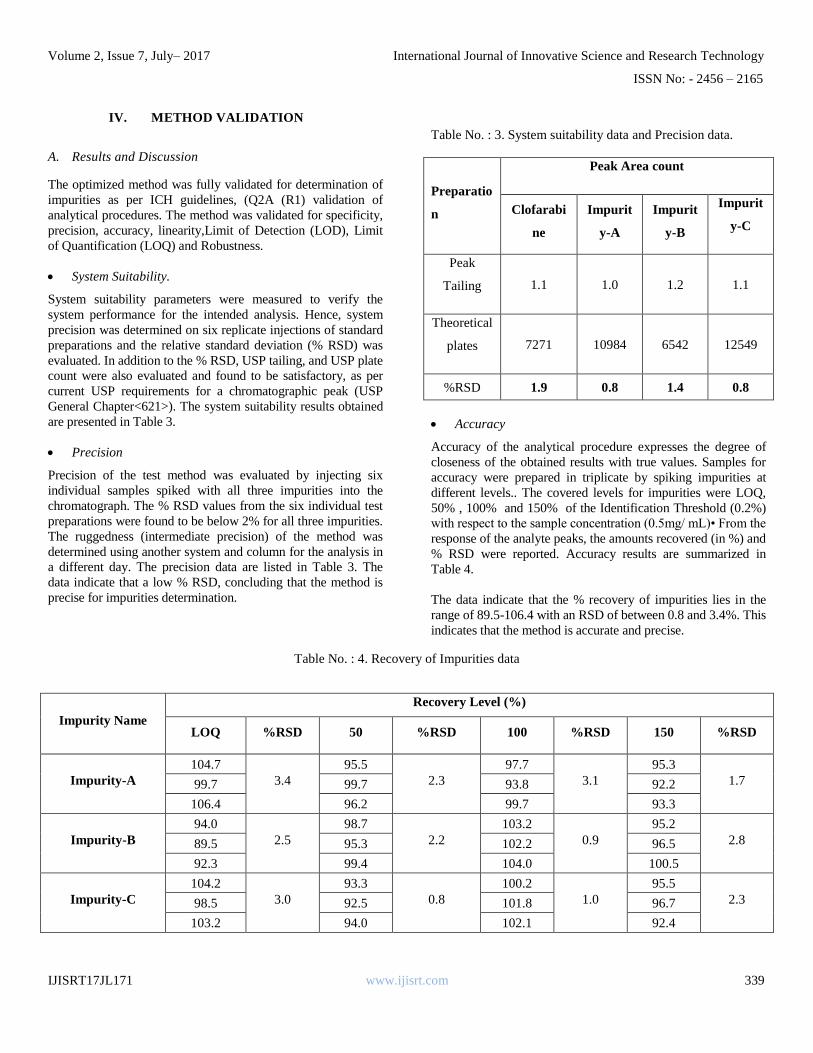
• System Suitability.
System suitability parameters were measured to verify the
system performance for the intended analysis. Hence, system
precision was determined on six replicate injections of standard
preparations and the relative standard deviation (% RSD) was
evaluated. In addition to the % RSD, USP tailing, and USP plate
count were also evaluated and found to be satisfactory, as per
current USP requirements for a chromatographic peak (USP
General Chapter<621>). The system suitability results obtained
are presented in Table 3.
• Precision
Precision of the test method was evaluated by injecting six
individual samples spiked with all three impurities into the
chromatograph. The % RSD values from the six individual test
preparations were found to be below 2% for all three impurities.
The ruggedness (intermediate precision) of the method was
determined using another system and column for the analysis in
a different day. The precision data are listed in Table 3. The
data indicate that a low % RSD, concluding that the method is
precise for impurities determination.
Table No. : 3. System suitability data and Precision data.
Preparatio
n
Peak Area count
Clofarabi
ne
Impurit
y-A
Impurit
y-B
Impurit
y-C
Peak
Tailing 1.1 1.0 1.2 1.1
Theoretical
plates 7271 10984 6542 12549
%RSD 1.9 0.8 1.4 0.8
• Accuracy
Accuracy of the analytical procedure expresses the degree of
closeness of the obtained results with true values. Samples for
accuracy were prepared in triplicate by spiking impurities at
different levels.. The covered levels for impurities were LOQ,
50% , 100% and 150% of the Identification Threshold (0.2%)
with respect to the sample concentration (0.5mg/ mL)• From the
response of the analyte peaks, the amounts recovered (in %) and
% RSD were reported. Accuracy results are summarized in
Table 4.
The data indicate that the % recovery of impurities lies in the
range of 89.5-106.4 with an RSD of between 0.8 and 3.4%. This
indicates that the method is accurate and precise.
Table No. : 4. Recovery of Impurities data
Impurity Name
Recovery Level (%)
LOQ %RSD 50 %RSD 100 %RSD 150 %RSD
Impurity-A
104.7
3.4
95.5
2.3
97.7
3.1
95.3
1.7 99.7 99.7 93.8 92.2
106.4 96.2 99.7 93.3
Impurity-B
94.0
2.5
98.7
2.2
103.2
0.9
95.2
2.8 89.5 95.3 102.2 96.5
92.3 99.4 104.0 100.5
Impurity-C
104.2
3.0
93.3
0.8
100.2
1.0
95.5
2.3 98.5 92.5 101.8 96.7
103.2 94.0 102.1 92.4
Volume 2, Issue 7, July– 2017 International Journal of Innovative Science and Research Technology
ISSN No: - 2456 – 2165
IJISRT17JL171 www.ijisrt.com 340
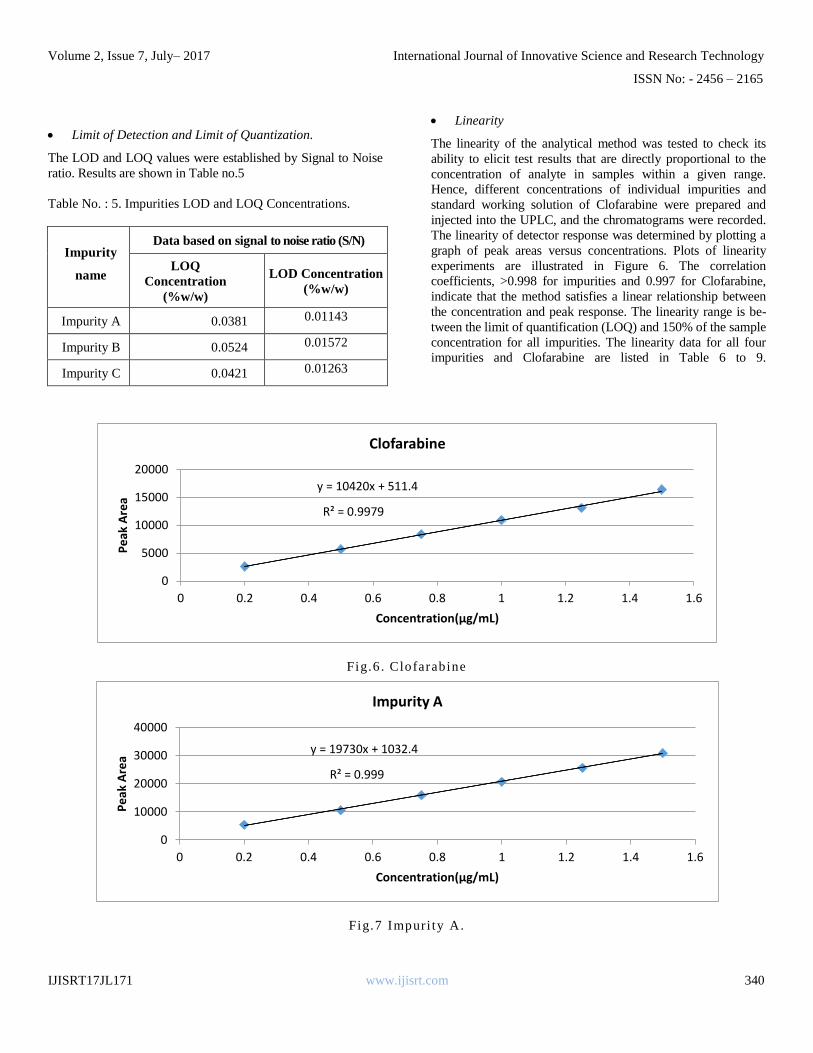
• Limit of Detection and Limit of Quantization.
The LOD and LOQ values were established by Signal to Noise
ratio. Results are shown in Table no.5
Table No. : 5. Impurities LOD and LOQ Concentrations.
Impurity
name
Data based on signal to noise ratio (S/N)
LOQ
Concentration
(%w/w)
LOD Concentration
(%w/w)
Impurity A 0.0381 0.01143
Impurity B 0.0524 0.01572
Impurity C 0.0421 0.01263
• Linearity
The linearity of the analytical method was tested to check its
ability to elicit test results that are directly proportional to the
concentration of analyte in samples within a given range.
Hence, different concentrations of individual impurities and
standard working solution of Clofarabine were prepared and
injected into the UPLC, and the chromatograms were recorded.
The linearity of detector response was determined by plotting a
graph of peak areas versus concentrations. Plots of linearity
experiments are illustrated in Figure 6. The correlation
coefficients, >0.998 for impurities and 0.997 for Clofarabine,
indicate that the method satisfies a linear relationship between
the concentration and peak response. The linearity range is be-
tween the limit of quantification (LOQ) and 150% of the sample
concentration for all impurities. The linearity data for all four
impurities and Clofarabine are listed in Table 6 to 9.
Fig.6 . Clofarabine
Fig.7 Impuri ty A.
y = 10420x + 511.4
R² = 0.9979
0
5000
10000
15000
20000
0 0.2 0.4 0.6 0.8 1 1.2 1.4 1.6
Pe
ak A
rea
Concentration(µg/mL)
Clofarabine
y = 19730x + 1032.4
R² = 0.999
0
10000
20000
30000
40000
0 0.2 0.4 0.6 0.8 1 1.2 1.4 1.6
Pe
ak A
rea
Concentration(µg/mL)
Impurity A

Volume 2, Issue 7, July– 2017 International Journal of Innovative Science and Research Technology
ISSN No: - 2456 – 2165
IJISRT17JL171 www.ijisrt.com 341
Fig.8 . Impuri ty B
Fig.9 . Impuri ty C
• Specificity
The specificity of the RP-HPLC method was checked by
comparison of chromatogram obtained from standard, placebo
and sample. The Placebo did not should not show any
interference at retention of main analyte peak and at impurities.
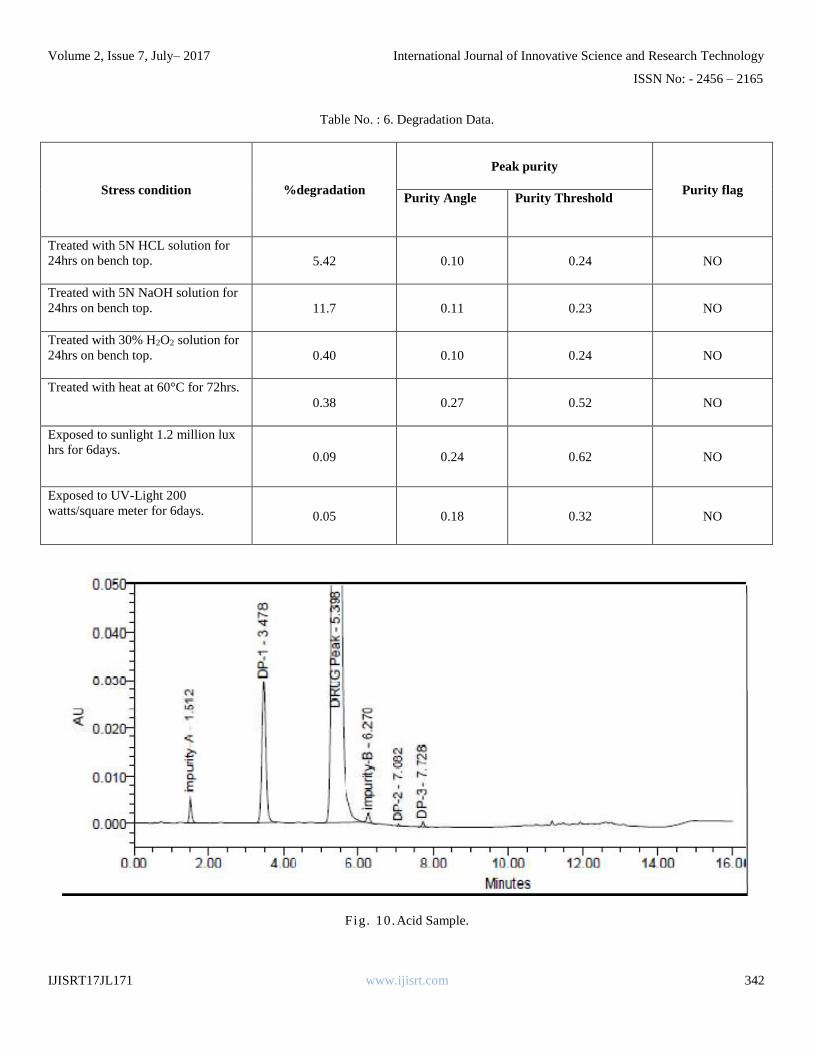
➢ Forced degradation study.
Forced degradation studies were conducted on samples and on
the plain placebo to prove the specificity and stability-indicating
power of the method. Specificity was determined by exposing
test solution to oxidation by hydrogen peroxide, acid hydrolysis,
base hydrolysis, heat and photolytic stress. A detailed procedure
has been reported.
The stressed samples were then further diluted with the diluent
and chromatographed as per the proposed method.
The peak purity of Clofarabine peak was evaluated using the
PDA. The purity angle should be less than the purity threshold.
The results are summarized in Table.No:6
y = 5994.5x + 15.788
R² = 0.9981
0
2000
4000
6000
8000
10000
0 0.2 0.4 0.6 0.8 1 1.2 1.4 1.6
Pe
ak A
rea
Concentration(µg/mL)
Impurity B
y = 7524.5x + 565.39
R² = 0.9991
0
2000
4000
6000
8000
10000
12000
14000
0 0.2 0.4 0.6 0.8 1 1.2 1.4 1.6
Pe
ak A
rea
Concentration(µg/mL)
Impurity C
Volume 2, Issue 7, July– 2017 International Journal of Innovative Science and Research Technology
ISSN No: - 2456 – 2165
IJISRT17JL171 www.ijisrt.com 342
Table No. : 6. Degradation Data.
Stress condition %degradation
Peak purity
Purity flag Purity Angle Purity Threshold
Treated with 5N HCL solution for
24hrs on bench top. 5.42 0.10 0.24 NO
Treated with 5N NaOH solution for
24hrs on bench top. 11.7 0.11 0.23 NO
Treated with 30% H2O2 solution for
24hrs on bench top. 0.40 0.10 0.24 NO
Treated with heat at 60°C for 72hrs.
0.38 0.27 0.52 NO
Exposed to sunlight 1.2 million lux
hrs for 6days. 0.09 0.24 0.62 NO
Exposed to UV-Light 200
watts/square meter for 6days. 0.05 0.18 0.32 NO
Fig. 10.Acid Sample.

Volume 2, Issue 7, July– 2017 International Journal of Innovative Science and Research Technology
ISSN No: - 2456 – 2165
IJISRT17JL171 www.ijisrt.com 343
Fig. 11.Base Sample.
Fig.12 .Thermal Sample.
Fig.13 .Sunlight Sample.

Volume 2, Issue 7, July– 2017 International Journal of Innovative Science and Research Technology
ISSN No: - 2456 – 2165
IJISRT17JL171 www.ijisrt.com 344
• Robustness.
Reliability during normal usage. The robustness of a method is
evaluated by varying method parameters such as mobile phase
composition, pH, etc., and determiningthe effect (if any) on the
results of the method. Result are shown in Table no.8 The
robustness of an analytical procedure is a measure of its
capacity to remain unaffected by small, but deliberate variations
in method parameters and provides an indication of its
Table No. : 7. Robustness conditions.
Parameters Change of conditions
Flowvariation
(ml/min)
High(+) 0.31
Actual 0.28
Low(-) 0.25
Buffer pH
variation
High(+) 3.2
Actual 3.0
Low(-) 2.8
Column oven temp.
variation (°C)
High(+) 55
Actual 50
Low(-) 45
Organic phase (%)
Mobile phase B
High(+) 88
Actual 80
Low(-) 72
Table No. : 8. Robustness data.
Impurity
Name
Relative Retention Time (RRT)
Control pH(+) pH(-) Flow(+) Flow(-) Temp(+) Temp(-) Organic(+) Organic(-)
Impurity A 0.28 0.27 0.28 0.28 0.28 0.28 0.28 0.28 0.28
Impurity B 1.18 1.12 1.16 1.16 1.16 1.16 1.16 1.16 1.16
Impurity C 1.92 1.75 1.86 1.86 1.86 1.86 1.86 1.86 1.86

Volume 2, Issue 7, July– 2017 International Journal of Innovative Science and Research Technology
ISSN No: - 2456 – 2165
IJISRT17JL171 www.ijisrt.com 345
V. CONCLUSIONS
The rapid gradient reverse phase UPLC method, developed for
the quantitative analysis of clofarabine related substances in
pharmaceutical dosage forms, is precise, accurate, linear,
specific, and robust. Satisfactory results were obtained from
validation of the method. The method is stability-indicating and
can be used for routine analysis of production samples, and
checking the stability of samples of Clofarabine Injection.
REFERENCES
[1]. Chemical and Physical properties of Clofarabine
(2004) Chem Spider.
[2]. DeGennero LJ, Raetz E (2014) Acute Lymphoblastic
Leukemia.
[3]. Fanali, S., Haddad, P., Poole, C., Schoenmakers, P., &
Lloyd, D.(2013). Liquid chromatography. Waltham,
MA: Elsevier.
[4]. Q2A (R1) validation of analytical procedures: Text and
methodology, international conference on
harmonization.2005.
[5]. Drug Bank. Retrieved from
http://www.drugbank.ca/drugs/DB00631.
[6]. Bakshi M, Singh S, Development of validated stability
indicating assay methods critical review. J Pharm
Biomed. 2002:28:1011-1040.
[7]. C.H.Pui, S. Jeha, P.Kirkpatrick, Clofarabine, Nature
Reviews Drug Discovery, 4, 2005, 369-370.
[8]. .L. Peng, T. Farkas, Analysis of basic compounds by
reversed-phase liquid chromatography electrospray mass
spectrometry in high-pH mobile phases, J Chromatogr
A., 1179, 2008,131–144.
[9]. A. Zhenchuka, K. Lotfib, G. Juliussond, F. Albertionia,
Mechanisms of anti-cancer action and pharmacology of
clofarabine, Biochemical Pharmacology, 78(11),
2009,1351–1359.
[10]. M.A. Zhang-Qing, H.Zong-Yuan, L. Jia-Jie.
Determination of clofarabine in rat plasma and the
pharmacokinetic research, ActaMetallurgica Sinica,
16(8), 2011, 852-855.
[11]. N.R.Venkata NR, D. Jalandhar, G. Gnanadey, R.
Bandari, P. Manoi, Development of supercritical Fluid
(Carbon dioxide) based ultra-performance convergence
chromatographic stability indicating assay method for
determination of clofarabine in injection.Analytical
methods, 5, 2013, 7008-7013.
[12]. L. Huang, P. Lizak, C. Dvorak, J. Long-Boyle,
Simultaneous determination of Fludarabine and
Clofarabine in human plasma by LC-MS/MS, Journal of
Chromatography B Analyt Technol Biomed Life Sci.,
960, 2014, 194-199.
[13]. L. J. De Gennero, E. Raetz, Acute lymphoblastic
leukemia (Leukemia and Lymphoma Society, 2014, pp
1-52).
[14]. Brijesh D Patel, Usmangani K Chhalotiya, Dhruv B
Patel Quantification of Newer Anti-Cancer Drug
Clofarabine in their Bulkand Pharmaceutical Dosage
Form.J Chromatogr Sep Tech 2016, 7:3.
[15]. B.D.Patel, U. K.Chhalotiya, D.B.Patel,
Quantification of Newer Anti-Cancer Drug Clofarabine
in their Bulk and Pharmaceutica Dosage Form. J
Chromatogr Sep Tech, 7(3), 2016, 328-832.
Related Documents