Ultra-low viscosity liquid crystal materials Haiwei Chen, 1 Minggang Hu, 1,2 Fenglin Peng, 1 Jian Li, 2 Zhongwei An, 2 and Shin-Tson Wu 1,* 1 CREOL, The College of Optics and Photonics, University of Central Florida, Orlando, FL 32816, USA 2 Xi'an Modern Chemistry Research Institute, Xi’an 710065, China * [email protected] Abstract: We report five ultra-low viscosity nematic liquid crystal mixtures with birefringence around 0.1, dielectric anisotropy in the range of 3 to 6, and clearing temperature about 80°C. A big advantage of these low viscosity mixtures is low activation energy, which significantly suppresses the rising rate of viscosity at low temperatures. Using our mixture M3 as an example, the response time of a 3-ȝm cell at -20°C is only 30 ms. Widespread application of these materials for display devices demanding a fast response time, especially at low temperatures, is foreseeable. ©2015 Optical Society of America OCIS codes: (160.3710) Liquid crystals; (230.3720) Liquid-crystal devices. References and links 1. M. Schadt, “Milestone in the history of field-effect liquid crystal displays and materials,” Jpn. J. Appl. Phys. 48, 03B001 (2009). 2. K.-H. Fan-Chiang, C.-C. Lai, J.-T. Cheng, C.-C. Yen, B.-J. Liao, Y.-Y. Ho, and Y.-C. Chen, “P-173: A 0.38” field-sequential-color liquid-crystal-on-silicon microdisplay for mobile projectors,” Dig. Tech. Pap. 40(1), 1770– 1773 (2009). 3. Z. Luo, F. Peng, H. Chen, M. Hu, J. Li, Z. An, and S. T. Wu, “Fast-response liquid crystals for high image quality wearable displays,” Opt. Mater. Express 5(3), 603–610 (2015). 4. Y. Iwata, M. Murata, K. Tanaka, T. Ohtake, H. Yoshida, and K. Miyachi, “Novel super fast response vertical alignment-liquid crystal display with extremely wide temperature range,” J. Soc. Inf. Disp. 22(1), 35–42 (2014). 5. S. J. Kim, H. Y. Kim, S. H. Lee, Y. K. Lee, K. C. Park, and J. Jang, “Cell gap-dependent transmittance characteristic in a fringe field-driven homogeneously aligned liquid crystal cell with positive dielectric anisotropy,” Jpn. J. Appl. Phys. 44(9A), 6581–6586 (2005). 6. S. H. Lee, S. L. Lee, and H. Y. Kim, “Electro-optic characteristics and switching principle of a nematic liquid crystal cell controlled by fringe-field switching,” Appl. Phys. Lett. 73(20), 2881–2883 (1998). 7. Z. Ge, S. T. Wu, S. S. Kim, J. W. Park, and S. H. Lee, “Thin cell fringe-field-switching liquid crystal display with a chiral dopant,” Appl. Phys. Lett. 92(18), 181109 (2008). 8. J. Li, C. H. Wen, S. Gauza, R. Lu, and S. T. Wu, “Refractive indices of liquid crystals for display applications,” J. Display Technol. 1(1), 51–61 (2005). 9. H. Takatsu, “Advanced liquid crystal materials for active matrix displays,” Conf. Proc. Advanced Display Materials and Devices, p.43 (Sendai, Japan, 2014). 10. J. Li, M. Hu, J. Li, Z. An, X. Yang, Z. Yang, and Z. Che, “Highly fluorinated liquid crystals with wide nematic phase interval and good solubility,” Liq. Cryst. 41(12), 1783–1790 (2014). 11. M. Schadt, R. Buchecker, and K. Muller, “Material properties, structural relations with molecular ensembles and electro-optical performance of new bicyclohexane liquid crystals in field-effect liquid crystal displays,” Liq. Cryst. 5(1), 293–312 (1989). 12. J. W. Ryu, J. Y. Lee, H. Y. Kim, J. W. Park, G. D. Lee, and S. H. Lee, “Effect of magnitude of dielectric anisotropy of a liquid crystal on light efficiency in the fringe-field switching nematic liquid crystal cell,” Liq. Cryst. 35(4), 407–411 (2008). 13. S. T. Wu and C. S. Wu, “Experimental confirmation of the Osipov-Terentjev theory on the viscosity of nematic liquid crystals,” Phys. Rev. A 42(4), 2219–2227 (1990). 14. S. W. Kang, I. W. Jang, D. H. Kim, Y. J. Lim, and S. H. Lee, “Enhancing transmittance of fringe-field switching liquid crystal device by controlling perpendicular component of dielectric constant of liquid crystal,” Jpn. J. Appl. Phys. 53(1), 010304 (2014). 15. H. Chen, F. Peng, Z. Luo, D. Xu, S. T. Wu, M. C. Li, S. L. Lee, and W. C. Tsai, “High performance liquid crystal displays with a low dielectric constant material,” Opt. Mater. Express 4(11), 2262–2273 (2014). 16. S. T. Wu, “Birefringence dispersions of liquid crystals,” Phys. Rev. A 33(2), 1270–1274 (1986). 17. S. T. Wu, U. Efron, and L. D. Hess, “Birefringence measurements of liquid crystals,” Appl. Opt. 23(21), 3911– 3915 (1984). #232795 - $15.00 USD Received 18 Jan 2015; revised 19 Feb 2015; accepted 19 Feb 2015; published 25 Feb 2015 (C) 2015 OSA 1 Mar 2015 | Vol. 5, No. 3 | DOI:10.1364/OME.5.000655 | OPTICAL MATERIALS EXPRESS 655

Welcome message from author
This document is posted to help you gain knowledge. Please leave a comment to let me know what you think about it! Share it to your friends and learn new things together.
Transcript

Ultra-low viscosity liquid crystal materials
Haiwei Chen,1 Minggang Hu,
1,2 Fenglin Peng,
1 Jian Li,
2 Zhongwei An,
2
and Shin-Tson Wu1,*
1CREOL, The College of Optics and Photonics, University of Central Florida, Orlando, FL 32816, USA
2Xi'an Modern Chemistry Research Institute, Xi’an 710065, China *[email protected]
Abstract: We report five ultra-low viscosity nematic liquid crystal mixtures
with birefringence around 0.1, dielectric anisotropy in the range of 3 to 6,
and clearing temperature about 80°C. A big advantage of these low
viscosity mixtures is low activation energy, which significantly suppresses
the rising rate of viscosity at low temperatures. Using our mixture M3 as an
example, the response time of a 3- m cell at −20°C is only 30 ms.
Widespread application of these materials for display devices demanding a
fast response time, especially at low temperatures, is foreseeable.
©2015 Optical Society of America
OCIS codes: (160.3710) Liquid crystals; (230.3720) Liquid-crystal devices.
References and links
1. M. Schadt, “Milestone in the history of field-effect liquid crystal displays and materials,” Jpn. J. Appl. Phys. 48,
03B001 (2009).
2. K.-H. Fan-Chiang, C.-C. Lai, J.-T. Cheng, C.-C. Yen, B.-J. Liao, Y.-Y. Ho, and Y.-C. Chen, “P-173: A 0.38”
field-sequential-color liquid-crystal-on-silicon microdisplay for mobile projectors,” Dig. Tech. Pap. 40(1), 1770–
1773 (2009).
3. Z. Luo, F. Peng, H. Chen, M. Hu, J. Li, Z. An, and S. T. Wu, “Fast-response liquid crystals for high image
quality wearable displays,” Opt. Mater. Express 5(3), 603–610 (2015).
4. Y. Iwata, M. Murata, K. Tanaka, T. Ohtake, H. Yoshida, and K. Miyachi, “Novel super fast response vertical
alignment-liquid crystal display with extremely wide temperature range,” J. Soc. Inf. Disp. 22(1), 35–42 (2014).
5. S. J. Kim, H. Y. Kim, S. H. Lee, Y. K. Lee, K. C. Park, and J. Jang, “Cell gap-dependent transmittance
characteristic in a fringe field-driven homogeneously aligned liquid crystal cell with positive dielectric
anisotropy,” Jpn. J. Appl. Phys. 44(9A), 6581–6586 (2005).
6. S. H. Lee, S. L. Lee, and H. Y. Kim, “Electro-optic characteristics and switching principle of a nematic liquid
crystal cell controlled by fringe-field switching,” Appl. Phys. Lett. 73(20), 2881–2883 (1998).
7. Z. Ge, S. T. Wu, S. S. Kim, J. W. Park, and S. H. Lee, “Thin cell fringe-field-switching liquid crystal display
with a chiral dopant,” Appl. Phys. Lett. 92(18), 181109 (2008).
8. J. Li, C. H. Wen, S. Gauza, R. Lu, and S. T. Wu, “Refractive indices of liquid crystals for display applications,”
J. Display Technol. 1(1), 51–61 (2005).
9. H. Takatsu, “Advanced liquid crystal materials for active matrix displays,” Conf. Proc. Advanced Display
Materials and Devices, p.43 (Sendai, Japan, 2014).
10. J. Li, M. Hu, J. Li, Z. An, X. Yang, Z. Yang, and Z. Che, “Highly fluorinated liquid crystals with wide nematic
phase interval and good solubility,” Liq. Cryst. 41(12), 1783–1790 (2014).
11. M. Schadt, R. Buchecker, and K. Muller, “Material properties, structural relations with molecular ensembles and
electro-optical performance of new bicyclohexane liquid crystals in field-effect liquid crystal displays,” Liq.
Cryst. 5(1), 293–312 (1989).
12. J. W. Ryu, J. Y. Lee, H. Y. Kim, J. W. Park, G. D. Lee, and S. H. Lee, “Effect of magnitude of dielectric
anisotropy of a liquid crystal on light efficiency in the fringe-field switching nematic liquid crystal cell,” Liq.
Cryst. 35(4), 407–411 (2008).
13. S. T. Wu and C. S. Wu, “Experimental confirmation of the Osipov-Terentjev theory on the viscosity of nematic
liquid crystals,” Phys. Rev. A 42(4), 2219–2227 (1990).
14. S. W. Kang, I. W. Jang, D. H. Kim, Y. J. Lim, and S. H. Lee, “Enhancing transmittance of fringe-field switching
liquid crystal device by controlling perpendicular component of dielectric constant of liquid crystal,” Jpn. J.
Appl. Phys. 53(1), 010304 (2014).
15. H. Chen, F. Peng, Z. Luo, D. Xu, S. T. Wu, M. C. Li, S. L. Lee, and W. C. Tsai, “High performance liquid
crystal displays with a low dielectric constant material,” Opt. Mater. Express 4(11), 2262–2273 (2014).
16. S. T. Wu, “Birefringence dispersions of liquid crystals,” Phys. Rev. A 33(2), 1270–1274 (1986).
17. S. T. Wu, U. Efron, and L. D. Hess, “Birefringence measurements of liquid crystals,” Appl. Opt. 23(21), 3911–
3915 (1984).
#232795 - $15.00 USD Received 18 Jan 2015; revised 19 Feb 2015; accepted 19 Feb 2015; published 25 Feb 2015
(C) 2015 OSA 1 Mar 2015 | Vol. 5, No. 3 | DOI:10.1364/OME.5.000655 | OPTICAL MATERIALS EXPRESS 655
18. I. Haller, “Thermodynamic and static properties of liquid crystals,” Prog. Solid State Chem. 10(2), 103–118
(1975).
19. M. Oh-e and K. Kondo, “Electro-optical characteristics and switching behavior of the in-plane switching mode,”
Appl. Phys. Lett. 67(26), 3895–3897 (1995).
20. Y. Chen, F. Peng, T. Yamaguchi, X. Song, and S. T. Wu, “High performance negative dielectric anisotropy
liquid crystals for display applications,” Crystals 3(3), 483–503 (2013).
21. L. M. Blinov and V. G. Chigrinov, Electrooptic Effects in Liquid Crystal Materials (Springer-Verlag, 1994).
22. S. T. Wu and C. S. Wu, “Rotational viscosity of nematic liquid crystals A critical examination of existing
models,” Liq. Cryst. 8(2), 171–182 (1990).
23. W. H. De Jeu, “Physical properties of liquid crystalline materials in relation to their applications,” Mol. Cryst.
Liq. Cryst. (Phila. Pa.) 63(1), 83–109 (1981).
24. L. Rao, S. Gauza, and S. T. Wu, “Low temperature effects on the response time of liquid crystal displays,” Appl.
Phys. Lett. 94(7), 071112 (2009).
1. Introduction
Fast response time is one of the most critical requirements for most liquid crystal display
(LCD) devices [1] because it helps reduce motion picture image blur and crosstalk, enhance
optical efficiency, and suppress color mixing for field-sequential displays [2, 3]. Mobile
displays, wearable displays, and car navigation systems are often used in outdoor and they
have to endure harsh weather conditions, like low temperatures (−20°C). In such a cold
ambient temperature, LC response time is usually as sluggish as several hundreds of
milliseconds. As a result, the displayed image quality is severely degraded [4].
To shorten response time, a straightforward approach is to decrease the LC cell gap (d).
However, for an LCD a certain dΔn value is required in order to obtain high transmittance;
here Δn is the LC birefringence. For example, the commonly used fringe field switching
(FFS) LCD requires dΔn≈320-340 nm in order to achieve high transmittance [5, 6]. Although
thin cell gap helps greatly to achieve fast response time [7], this approach imposes two
problems: it reduces manufacturing yield and it demands a higher Δn LC, which has stronger
wavelength dispersion [8]. To obtain white color, the transmittance of red, green, and blue
sub-pixels should be balanced. From experimental studies, the preferred Δn for FFS is around
0.10 ± 0.01. Under such circumstance, the cell gap is about 3 m, which is still manageable
for high-yield manufacturing. With abovementioned constraints, the simplest way to reduce
response time is to employ a low viscosity LC.
In this paper, we formulated five ultra-low viscosity LC mixtures with Δn≈0.1, dielectric
anisotropy Δε≈3 to 6, and clearing temperature about 80°C. A big advantage of these low
viscosity LC mixtures is their small activation energy, which significantly suppresses the
rising rate of viscosity at low temperatures. Using our mixture M3 as an example, the
response time of a 3- m FFS cell at −20°C is about 30ms. These materials will find
widespread applications for display devices that demand a fast response time.
2. Mixture formulation
Our low viscosity LC mixtures contain three major ingredients: 1) high Δn and large Δε compounds, 2) ultra-low viscosity diluters, and 3) wide nematic range compounds. Table 1
lists the chemical structures and compositions of our five mixtures. Compounds 1 and 2 have
high Δn and large Δε (>25) [9, 10], but their viscosity is also high. To lower the viscosity, we
added more than 40% non-polar diluters (#3) [11]. To widen nematic range and achieve high
clearing point, we added some terphenyl compounds (#4). To obtain different Δε values, we
formulated five LC mixtures by varying the compound concentrations as Table 1 shows.
#232795 - $15.00 USD Received 18 Jan 2015; revised 19 Feb 2015; accepted 19 Feb 2015; published 25 Feb 2015
(C) 2015 OSA 1 Mar 2015 | Vol. 5, No. 3 | DOI:10.1364/OME.5.000655 | OPTICAL MATERIALS EXPRESS 656

Table 1. Chemical structures and compositions of LC mixtures; R and R’ represent alkyl
chains.
No. Compound Structure Mixtures (wt%)
M1 M2 M3 M4 M5
1 12% 11% 12% 13% 24%
2 10% 12% 13% 18% 18%
3
56% 55% 53% 48% 40%
4 R R'
F
22% 22% 22% 21% 18%
3. Material characterization
In experiment, we measured the dielectric anisotropy, birefringence, visco-elastic constant,
and activation energy of these five mixtures. To avoid crowdedness of data presentation, here
we only show the measured results of M3, M4, and M5 in the following Sections. Table 2
summarizes the key results of these five mixtures.
3.1 Dielectric anisotropy
Dielectric anisotropy affects the operation voltage, peak transmittance [12], and response time
(through viscosity) of the FFS LCD. To reduce the power consumption of a mobile display, it
is desirable to keep the on-state voltage below 5V. This requirement demands a fairly large
Δε. On the other hand, to obtain low viscosity we should keep Δε as small as possible. Thus,
there exist contradicting requirements for Δε between low operation voltage and fast response
time. A compromised Δε value is in the range of 3 to 6.
Table 2. Measured properties of the five LC mixtures at T = 23°C, λ = 633nm, and f = 1
kHz.
ε// ε⊥ Δε Δn K11 (pN) 1 (mPas) 1/K11 Tc (°C) E (meV)
M1 5.66 2.61 3.05 0.098 11.8 41.3 3.50 78.8 190
M2 5.91 2.68 3.23 0.102 12.2 42.2 3.46 79.5 195
M3 6.26 2.76 3.50 0.100 11.7 45.1 3.85 77.9 205
M4 7.43 2.83 4.60 0.097 12.1 50.4 4.17 80.1 228
M5 9.51 3.33 6.18 0.099 11.4 53.3 4.68 75.5 260
In experiment, we used the capacitance method to measure the dielectric constants (ε// and
ε⊥) of our five LC mixtures at room temperature (23°C). Detailed procedures have been
reported in Ref [13], and the measured results are listed in Table 2. From Table 2, the ε// and
ε⊥ of M3 is 6.26 and 2.76, respectively, i.e., Δε = 3.50, which is much lower than that used in
conventional p-FFS LCD (Δε = 8~10) [14]. With such a low Δε, the operation voltage, which
#232795 - $15.00 USD Received 18 Jan 2015; revised 19 Feb 2015; accepted 19 Feb 2015; published 25 Feb 2015
(C) 2015 OSA 1 Mar 2015 | Vol. 5, No. 3 | DOI:10.1364/OME.5.000655 | OPTICAL MATERIALS EXPRESS 657
is inversely proportional to the square root of Δε, would undoubtedly increase [12].
Fortunately, the transmittance of p-FFS increases as Δε gradually decreases. As a result, we
can still get high transmittance at a relatively low voltage (5V) using a low Δε LC material
[15]. For M4 and M5, the Δε value is 4.60 and 6.18, respectively. Among these three mixtures
studied, M3 contains the largest amount of diluters, thus its viscosity is the lowest but its
dielectric anisotropy is also the smallest.
3.2 Temperature dependent birefringence
Birefringence of an LC is mainly governed by the conjugation length and order parameter
[16]. To measure Δn, we filled the LC mixture into a homogeneous cell made of indium tin
oxide (ITO) glass substrates. The inner surface of the ITO-glass was over-coated with a thin
polyimide alignment layer. The pretilt angle was about 2°. The cell was sandwiched between
two crossed linear polarizers. By measuring the voltage dependent transmittance through
LabView system, we can obtain Δn easily. Detailed method has been described in [17]. From
Table 2, the measured birefringence at room temperature is Δn = 0.100 for M3, 0.097 for M4,
and 0.099 for M5. These values are very close to our ideal one, which is 0.1.
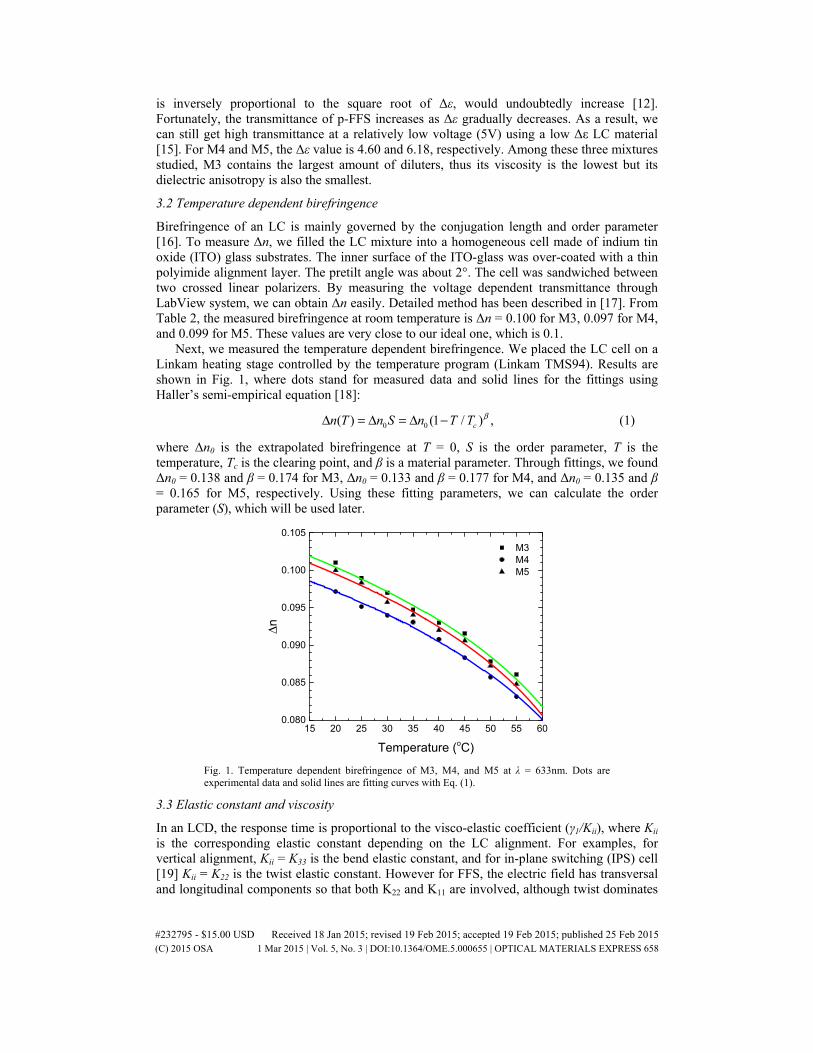
Next, we measured the temperature dependent birefringence. We placed the LC cell on a
Linkam heating stage controlled by the temperature program (Linkam TMS94). Results are
shown in Fig. 1, where dots stand for measured data and solid lines for the fittings using
Haller’s semi-empirical equation [18]:
0 0( ) (1 / ) ,cn T n S n T T βΔ = Δ = Δ − (1)
where Δn0 is the extrapolated birefringence at T = 0, S is the order parameter, T is the
temperature, Tc is the clearing point, and is a material parameter. Through fittings, we found
Δn0 = 0.138 and = 0.174 for M3, Δn0 = 0.133 and = 0.177 for M4, and Δn0 = 0.135 and
= 0.165 for M5, respectively. Using these fitting parameters, we can calculate the order
parameter (S), which will be used later.
15 20 25 30 35 40 45 50 55 600.080
0.085
0.090
0.095
0.100
0.105
M3
M4
M5
Δn
Temperature (oC)
Fig. 1. Temperature dependent birefringence of M3, M4, and M5 at λ = 633nm. Dots are
experimental data and solid lines are fitting curves with Eq. (1).
3.3 Elastic constant and viscosity
In an LCD, the response time is proportional to the visco-elastic coefficient ( 1/Kii), where Kii
is the corresponding elastic constant depending on the LC alignment. For examples, for
vertical alignment, Kii = K33 is the bend elastic constant, and for in-plane switching (IPS) cell
[19] Kii = K22 is the twist elastic constant. However for FFS, the electric field has transversal
and longitudinal components so that both K22 and K11 are involved, although twist dominates
#232795 - $15.00 USD Received 18 Jan 2015; revised 19 Feb 2015; accepted 19 Feb 2015; published 25 Feb 2015
(C) 2015 OSA 1 Mar 2015 | Vol. 5, No. 3 | DOI:10.1364/OME.5.000655 | OPTICAL MATERIALS EXPRESS 658

[20]. Several approaches have been proposed to measure 1 and K11. Here, we used the time
dependent transmittance method described in Ref [13].
For a homogeneous cell, the threshold voltage is related to K11 and Δε as [21]:
11 0/ ( ),thV Kπ ε ε= ⋅ Δ (2)
where K11 is the splay elastic constant and ε0 is the permittivity of vacuum. From the
measured threshold voltage and dielectric anisotropy, we can extract K11 from Eq. (2). As
listed in Table 2, all the five mixture we prepared have a very similar K11 value (~12pN)
because they basically consist of same compounds except at different compositions.
Next, we used the same setup as described in Sec. 3.2 to measure 1/K11. Detailed method
has been described in [13]. Since K11 has already been obtained from Eq. (2), we can extract
1 from the measured 1/K11. The measured 1 is 45.1 mPas, 50.4 mPas, and 52.3 mPas for
M3, M4, and M5, respectively. These 1 values seem to correlate with Δε linearly, as will be
examined in more detail later.
3.4 Activation energy
As the temperature decreases, rotational viscosity increases exponentially as [22, 23]:
1 ~ exp( / ),BS E k Tγ ⋅ (3)
where E is the activation energy and kB is the Boltzmann constant. From Eq. (3), activation
energy determines the rising rate of rotational viscosity in the low temperature region. Key
parameters affecting E include molecular structure and conformation, and intermolecular
interactions [13]. As Table 1 shows, the low Δε LC mixture contains more non-polar diluters.
As a result, its activation energy is relatively small, which in turn only causes a mild increase
as the temperature decreases. To extract E, we measured the temperature dependent visco-
elastic coefficient of these mixtures using the same method discussed above. In theory,
temperature dependent 1/K11 (homogenous cell) can be described as follows [22]:
2
11 ~ ,K S (4)
1 11/ exp( / ) / .BK A E k T Sγ = ⋅ (5)
-30 -20 -10 0 10 20 30 40 50 600
5
10
15
20
25
30
35
40
M3
M4
M5
γ 1/k
11 (
ms/µ
m2)
Temperature (oC)
Fig. 2. Temperature dependent 1/K11 of M3, M4, and M5. Dots are experimental data and solid
lines are fittings with Eq. (5).
Figure 2 depicts the measured data (dots) and fitted curves (solid lines). The measured
data fit well with Eq. (5). Through fittings, we found E = 205 meV for M3, 228 meV for M4,
and 260 meV for M5. For comparison, the reported activation energy of MLC-6686 (Δε = 10)
#232795 - $15.00 USD Received 18 Jan 2015; revised 19 Feb 2015; accepted 19 Feb 2015; published 25 Feb 2015
(C) 2015 OSA 1 Mar 2015 | Vol. 5, No. 3 | DOI:10.1364/OME.5.000655 | OPTICAL MATERIALS EXPRESS 659

is 353.9 meV and MLC-6608 (Δε = −4.2) is 496.0 meV [15, 24]. Our low viscosity LC
mixtures exhibit much lower activation energy. In experiment, we tested a 3.5- m FFS cell
with electrode width l = 3 m, electrode gap g = 4 m using M3. Peak transmittance (90.4%)
was achieved at 7.1 Vrms under = 514nm. The measured response time [rise, decay] is
[10.3ms, 10.7ms] at room temperature. As the temperature decreases to −20°C, the decay
time increases to 42ms. If we use a thinner cell gap (e.g. d = 3 m), the expected decay time,
which is proportional to d2, is ~30ms. This result is >10X faster than that of the MVA cell
reported in Ref [4] at the same temperature. More details about the electro-optic properties
using ultra-low viscosity and low dielectric anisotropy materials have been reported in Ref
[15].
4. Discussion
Table 2 summarizes the measured physical properties of the five mixtures we prepared. Their
Δn is around 0.1 and clearing point ≈80°C, which is desirable for FFS LCD applications. As
Δε decreases from 6.2 to 3.1, γ1 decreases from 53 mPas to 41 mPas. The correlation seems to
be linear between these two parameters. To further investigate this empirical relation, more
mixtures using the compounds listed in Table 1 are prepared for comparison. Figure 3 depicts
the results, from which a linear relation between Δε and 1 is indeed observed. The
extrapolated 1 is about 30 mPas for the employed non-polar diluters whose Δε≈0. For some
LCDs, such as desktop computers and TVs, they can afford to have a higher operation
voltage, say 7.5V. Thus, we can use a lower Δε LC mixture and achieve a faster response
time.
0 1 2 3 4 5 6 7 8 920
30
40
50
60
70
Ro
tation
al V
isco
sity (
mP
as)
Dielectric Anisotropy (Δε)
Fig. 3. Relation between rotational viscosity and dielectric anisotropy at 23°C.
5. Conclusion
We have formulated five ultra-low viscosity LC mixtures with positive Δε and characterized
their physical properties. In addition to low viscosity, their Δn is around 0.1 and Tc~80°C,
which is ideal for FFS LCDs. Another big advantage is their small activation energy, which
significantly suppresses the rising rate of viscosity at low temperatures. Widespread
applications of these ultra-low viscosity LC mixtures are expected.
Acknowledgment
The authors are indebted to AFOSR for partial financial supports under contract No. FA9550-
14-1-0279.
#232795 - $15.00 USD Received 18 Jan 2015; revised 19 Feb 2015; accepted 19 Feb 2015; published 25 Feb 2015
(C) 2015 OSA 1 Mar 2015 | Vol. 5, No. 3 | DOI:10.1364/OME.5.000655 | OPTICAL MATERIALS EXPRESS 660
Related Documents