Ultra-Low-Power Smart Electronic Nose System Based on Three-Dimensional Tin Oxide Nanotube Arrays Jiaqi Chen, † Zhuo Chen, † Farid Boussaid, ‡ Daquan Zhang, † Xiaofang Pan, †,⊥ Huijuan Zhao, § Amine Bermak, †,∥ Chi-Ying Tsui, † Xinran Wang, § and Zhiyong Fan* ,† † Department of Electronic and Computer Engineering, The Hong Kong University of Science and Technology, Clear Water Bay, Kowloon, Hong Kong SAR, China ‡ Department of Electrical, Electronic and Computer Engineering, The University of Western Australia, Perth, WA 6009, Australia § National Laboratory of Solid State Microstructure, School of Electronic Science and Engineering, and Collaborate Innovation Center of Advanced Microstructures, Nanjing University, Nanjing 210093, China ∥ College of Science and Engineering, Hamad Bin Khalifa University, Doha, Qatar * S Supporting Information ABSTRACT: In this work, we present a high-performance smart electronic nose (E-nose) system consisting of a multiplexed tin oxide (SnO 2 ) nanotube sensor array, read-out circuit, wireless data transmission unit, mobile phone receiver, and data processing application (App). Using the designed nanotube sensor device structure in conjunction with multiple electrode materials, high-sensitivity gas detection and discrim- ination have been achieved at room temperature, enabling a 1000 times reduction of the sensor’s power consumption as compared to a conventional device using thin film SnO 2 . The experimental results demonstrate that the developed E-nose can identify indoor target gases using a simple vector-matching gas recognition algorithm. In addition, the fabricated E-nose has achieved state-of-the-art sensitivity for H 2 and benzene detection at room temperature with metal oxide sensors. Such a smart E-nose system can address the imperative needs for distributed environmental monitoring in smart homes, smart buildings, and smart cities. KEYWORDS: tin oxide nanotube, low-power gas sensor, gas recognition, electronic nose, distributed sensor system E lectronic noses (E-noses) are biomimetic devices mimicking the functionalities of mammals’ olfaction system. 1,2 Employing chemical gas sensor arrays in conjunction with classification algorithms, smart E-noses are able to detect and discriminate types and concentrations of target gases. 3 E-noses have triggered enormous interest globally because of their critical roles in gas leakage detection, indoor air quality, and environmental safety monitoring. 4−8 This type of smart devices can be widely used in factories as well as smart homes and smart buildings, where the safety levels of particular gas species, such as hydrogen (H 2 ), carbon monoxide (CO), and nitrogen dioxide (NO 2 ), are well-defined either interna- tionally or domestically. 9−11 In addition to monitoring fire hazardous gases, detection of low-level health-threatening chemical species (e.g., benzene) emitted by house decorations and ventilation systems has also gained increasing attention over time in both developed and developing countries. This poses more sophisticated requirements for smart E-nose systems. 12 As the primary purpose of E-noses is to ensure a safe environment for human users, E-noses should ideally be human-centered devices that can be either deployed in a distributed fashion around human users or integrated with the mobile/wearable devices of the users. Therefore, not only high performance but also ultra-low power consumption and miniaturized form are crucial. 13,14 In this regard, solid state semiconductor gas sensors are ideal candidates for this application. However, existing semiconductor E-nose technol- ogies, such as microelectro-mechanical system (MEMS)-based micro-hot plates, microplatforms, etc., all suffer from prohib- itively high power consumption, e.g., tens of milliwatts or even more, due to the utilization of resistive heaters to maintain a high operating temperature. 15,16 In addition, they are bulky, Received: March 29, 2018 Accepted: May 24, 2018 Published: May 24, 2018 Article www.acsnano.org Cite This: ACS Nano 2018, 12, 6079-6088 © 2018 American Chemical Society 6079 DOI: 10.1021/acsnano.8b02371 ACS Nano 2018, 12, 6079−6088 Downloaded via HONG KONG UNIV SCIENCE TECHLGY on August 19, 2018 at 09:36:33 (UTC). See https://pubs.acs.org/sharingguidelines for options on how to legitimately share published articles.

Welcome message from author
This document is posted to help you gain knowledge. Please leave a comment to let me know what you think about it! Share it to your friends and learn new things together.
Transcript

Ultra-Low-Power Smart Electronic NoseSystem Based on Three-Dimensional Tin OxideNanotube ArraysJiaqi Chen,† Zhuo Chen,† Farid Boussaid,‡ Daquan Zhang,† Xiaofang Pan,†,⊥ Huijuan Zhao,§
Amine Bermak,†,∥ Chi-Ying Tsui,† Xinran Wang,§ and Zhiyong Fan*,†
†Department of Electronic and Computer Engineering, The Hong Kong University of Science and Technology, Clear Water Bay,Kowloon, Hong Kong SAR, China‡Department of Electrical, Electronic and Computer Engineering, The University of Western Australia, Perth, WA 6009, Australia§National Laboratory of Solid State Microstructure, School of Electronic Science and Engineering, and Collaborate Innovation Centerof Advanced Microstructures, Nanjing University, Nanjing 210093, China∥College of Science and Engineering, Hamad Bin Khalifa University, Doha, Qatar
*S Supporting Information
ABSTRACT: In this work, we present a high-performance smartelectronic nose (E-nose) system consisting of a multiplexed tin oxide(SnO2) nanotube sensor array, read-out circuit, wireless data transmissionunit, mobile phone receiver, and data processing application (App).Using the designed nanotube sensor device structure in conjunction withmultiple electrode materials, high-sensitivity gas detection and discrim-ination have been achieved at room temperature, enabling a 1000 timesreduction of the sensor’s power consumption as compared to aconventional device using thin film SnO2. The experimental resultsdemonstrate that the developed E-nose can identify indoor target gasesusing a simple vector-matching gas recognition algorithm. In addition,the fabricated E-nose has achieved state-of-the-art sensitivity for H2 andbenzene detection at room temperature with metal oxide sensors. Such asmart E-nose system can address the imperative needs for distributedenvironmental monitoring in smart homes, smart buildings, and smart cities.
KEYWORDS: tin oxide nanotube, low-power gas sensor, gas recognition, electronic nose, distributed sensor system
Electronic noses (E-noses) are biomimetic devicesmimicking the functionalities of mammals’ olfactionsystem.1,2 Employing chemical gas sensor arrays in
conjunction with classification algorithms, smart E-noses areable to detect and discriminate types and concentrations oftarget gases.3 E-noses have triggered enormous interest globallybecause of their critical roles in gas leakage detection, indoor airquality, and environmental safety monitoring.4−8 This type ofsmart devices can be widely used in factories as well as smarthomes and smart buildings, where the safety levels of particulargas species, such as hydrogen (H2), carbon monoxide (CO),and nitrogen dioxide (NO2), are well-defined either interna-tionally or domestically.9−11 In addition to monitoring firehazardous gases, detection of low-level health-threateningchemical species (e.g., benzene) emitted by house decorationsand ventilation systems has also gained increasing attentionover time in both developed and developing countries. Thisposes more sophisticated requirements for smart E-nosesystems.12
As the primary purpose of E-noses is to ensure a safeenvironment for human users, E-noses should ideally behuman-centered devices that can be either deployed in adistributed fashion around human users or integrated with themobile/wearable devices of the users. Therefore, not only highperformance but also ultra-low power consumption andminiaturized form are crucial.13,14 In this regard, solid statesemiconductor gas sensors are ideal candidates for thisapplication. However, existing semiconductor E-nose technol-ogies, such as microelectro-mechanical system (MEMS)-basedmicro-hot plates, microplatforms, etc., all suffer from prohib-itively high power consumption, e.g., tens of milliwatts or evenmore, due to the utilization of resistive heaters to maintain ahigh operating temperature.15,16 In addition, they are bulky,
Received: March 29, 2018Accepted: May 24, 2018Published: May 24, 2018
Artic
lewww.acsnano.orgCite This: ACS Nano 2018, 12, 6079−6088
© 2018 American Chemical Society 6079 DOI: 10.1021/acsnano.8b02371ACS Nano 2018, 12, 6079−6088
Dow
nloa
ded
via
HO
NG
KO
NG
UN
IV S
CIE
NC
E T
EC
HL
GY
on
Aug
ust 1
9, 2
018
at 0
9:36
:33
(UT
C).
Se
e ht
tps:
//pub
s.ac
s.or
g/sh
arin
ggui
delin
es f
or o
ptio
ns o
n ho
w to
legi
timat
ely
shar
e pu
blis
hed
artic
les.
since the capacity of primary batteries has to be sufficientlylarge. Thus, they cannot be readily used as human-centereddevices in the foreseeable future.17 In this work, wedemonstrate a high-performance solid state smart E-nosesystem using tin oxide (SnO2) nanotube arrays as the key
sensing material. The system also has a read-out electroniccircuit, a wireless data transmission unit, a mobile phonereceiver, and a data processing application (App). Using theproposed nanotube sensor device structure with a large surfacearea to interact with gas molecules, in conjunction with
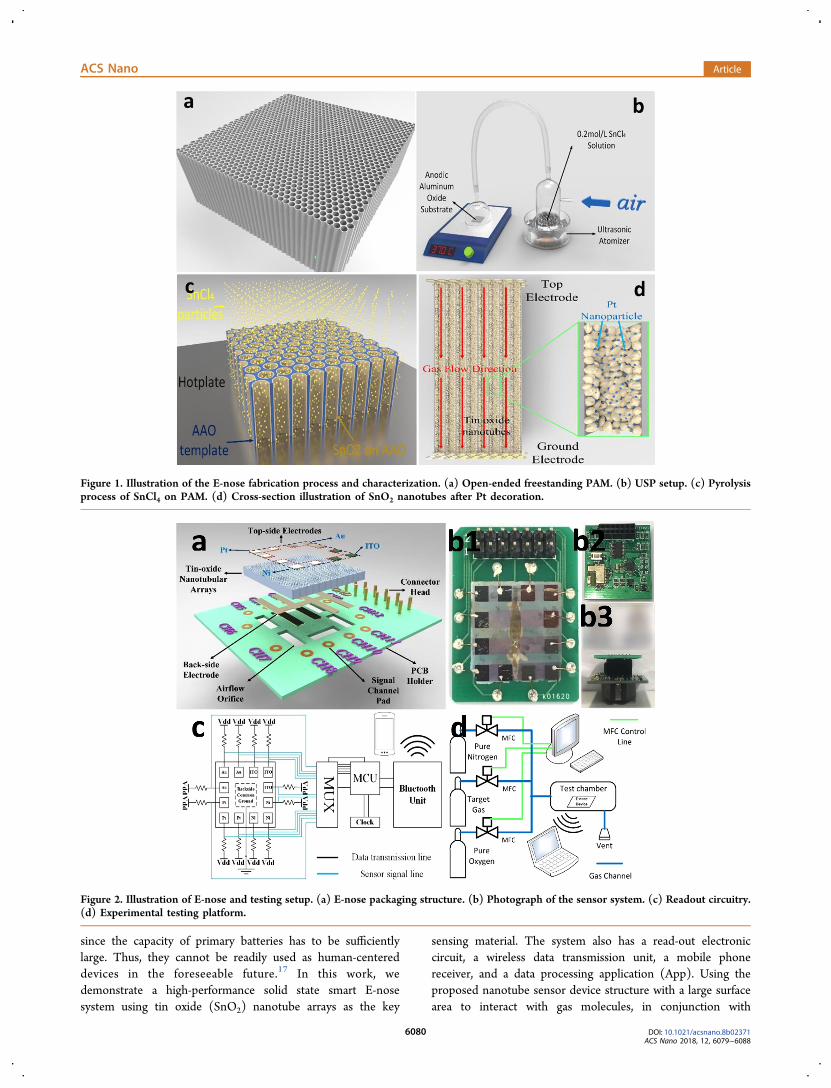
Figure 1. Illustration of the E-nose fabrication process and characterization. (a) Open-ended freestanding PAM. (b) USP setup. (c) Pyrolysisprocess of SnCl4 on PAM. (d) Cross-section illustration of SnO2 nanotubes after Pt decoration.
Figure 2. Illustration of E-nose and testing setup. (a) E-nose packaging structure. (b) Photograph of the sensor system. (c) Readout circuitry.(d) Experimental testing platform.
ACS Nano Article
DOI: 10.1021/acsnano.8b02371ACS Nano 2018, 12, 6079−6088
6080
multiple electrode materials, high-sensitivity gas detection anddiscrimination have been achieved at room temperature.Therefore, sensor power consumption has been reduced by 3orders of magnitude, as compared with a conventional deviceusing thin film SnO2. More specifically, the average powerconsumption of a heater-free single sensor device is around12.5 μW, which represents 1% power of the state-of-the-artcommercial SnO2 sensors. Furthermore, the system gas-sensingtest results demonstrate that the developed E-nose can identifyindoor target gases using a simple vector-matching gasrecognition algorithm. Particularly, the fabricated E-nose hasachieved state-of-the-art sensitivity for hydrogen and benzenedetection at room temperature for semiconductor gas sensors.Such a smart E-nose system can address the imperative need fordistributed environmental monitoring in smart homes, smartbuildings, and smart cities.
RESULTS AND DISCUSSION
E-Nose Sensor Fabrication. The fabrication process of theSnO2 nanotube E-nose is illustrated in Figure 1, with more
details provided in the Methods section. Briefly, to form ahighly ordered nanotube array to enhance the surface-area-to-volume ratio (SA/V) of the sensing material, a 40 μm thickfreestanding porous alumina membrane (PAM) with a 500 nmpitch and a 400 nm average pore size was fabricated (Figure 1aand Supplementary Figure S1a,b) using anodization ofaluminum (Al) foil in conjunction with nanoimprinting.18−20
The PAM was chosen as the host sensing material because itforms an insulating template capable of withstanding hightemperatures during the fabrication process. It also offers arelatively good mechanical strength, which is crucial for futuremass production.21,22 After that, a 70 nm thick polycrystallineSnO2 film with a ∼70 nm grain size was deposited into thePAM using the ultrasonic spray pyrolysis (USP) method toform a SnO2 nanotube array, as shown in Figure 1b andSupplementary Figure S1c.23,24 We investigated the impact ofthe PAM pore diameter on device performance. A smaller porediameter was found to translate into a larger surface area tovolume ratio. However, if the pore diameter is too small, itbecomes difficult to achieve conformal deposition of the
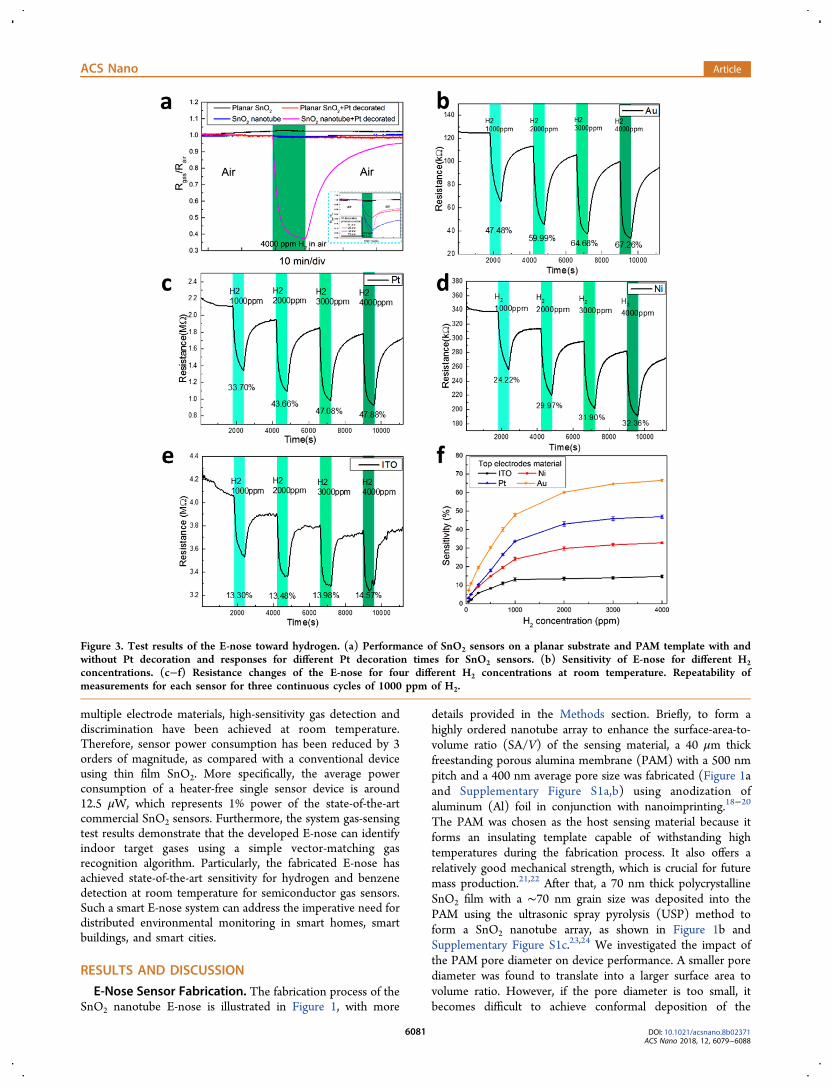
Figure 3. Test results of the E-nose toward hydrogen. (a) Performance of SnO2 sensors on a planar substrate and PAM template with andwithout Pt decoration and responses for different Pt decoration times for SnO2 sensors. (b) Sensitivity of E-nose for different H2concentrations. (c−f) Resistance changes of the E-nose for four different H2 concentrations at room temperature. Repeatability ofmeasurements for each sensor for three continuous cycles of 1000 ppm of H2.
ACS Nano Article
DOI: 10.1021/acsnano.8b02371ACS Nano 2018, 12, 6079−6088
6081

sensing material in the porous alumina membrane. A 400 nmpore diameter (before deposition) was found to be a goodtrade-off between performance and ease of fabrication. Notably,this process could be further used for depositing various typesof other oxide materials in the PAM nanochannels.Subsequently, 5 nm diameter Pt nanoparticles were decoratedon the entire surface of the SnO2 nanotubes (Figure 1d andSupplementary Figure S1d) in colloidal solution; then fourdifferent materials including gold (Au), platinum (Pt), nickel(Ni), and indium tin oxide (ITO) were deposited on the topside of the SnO2 nanotubes at different locations to form thetop electrode array. A single layer of Au film was deposited onthe bottom side of the SnO2 nanotubes to form the commonbottom electrodes. Figure 2a schematically shows the devicestructure, and Figure 2b1 shows a photograph of the actualdevice. Note that the USP method can highly conformallydeposit a SnO2 film into the nanochannels of the PAM with anaspect ratio higher than 100, as shown in Supplementary FigureS1c. This method has a high deposition rate and is much morecost-effective than other conformal coating techniques such asatomic layer deposition and chemical vapor deposition. The Ptnanoparticle decoration process is illustrated in SupplementaryFigure S1d. Since the Pt particles are much smaller than theSnO2 grains, they cannot be clearly distinguished in the SEMimage. However, traces of the Pt element can be found in X-raydiffraction and energy-dispersive X-ray spectroscopy (EDS)analysis in the cross-section of the SnO2 nanotubes(Supplementary Figure S2).E-Nose Circuit Design and Power Consumption. The
fabricated monolithically integrated sensor array was sub-sequently packaged on a printed circuit board (PCB), with thetop electrode of each sensor connected to a signal channel pad,as shown in Figure 2a and b1. Note that the current size of eachtop electrode is 2 mm by 2 mm so that the resistance of eachsensor is at the megaohm level, confirmed by the I−V curves(Supplementary Figure S3). This size can be further reduced toincrease sensor integration density and obtain devices withsmaller dimensions in the future. The actual E-nose deviceconsists of two PCBs as shown Figure 2b3. The upper PCB isthe sensor PCB (Figure 2b1), and the lower is the dataacquisition PCB, which comprises a multiplexer and amicrocontroller unit (MCU) with an embedded analog-to-digital converter (Figure 2b2). A CR 2032 battery cassette isinstalled at the bottom of the device to provide a 3 V voltage.The detailed circuit design is provided in Supplementary FigureS4. During the gas-sensing test, the voltage drop (Vs) acrosseach sensor is read-out by the MCU sequentially and the dataare transmitted to the receiver through a Bluetooth unit (Figure2c). The sensor resistance (Rs) can be simply calculated as
=−
×RV
V VRs
s
DD sconst
(1)
where Rconst is the series resistance connected to the sensor.Our circuit level test shows that the entire E-nose systemconsumes 20 mW of power in a continuous working mode withall 12 sensors in operation. However, in four different types ofsensors, only one sensor for each type is needed duringoperation. Thus, the power consumption of the four sensors isaround 50 μW. This represents only 1% of a 2 × 2 state-of-the-art commercial SnO2 sensor array (60 mW for 4 sensors)(Supplementary Table 1), which comprises embedded heatersto maintain the acquired high operating temperature. In
addition, as the readout circuit can work under “sentry”mode with a low duty cycle of 1%, the average powerconsumption of our E-nose sensor system is only about 250μW.
Hydrogen Gas Sensing. Figure 2d schematically showsour E-nose gas sensing test setup. Specifically, the target gasand balance gas are injected into the test chamber usingcomputer-programmed mass flow controllers (MFCs) with aproper mixture ratio. The resistance change of the sensors isthen measured by the MCU and transmitted to the receiver fordata processing. More specifically, hydrogen gas (H2) mixedwith synthetic air was used to test the E-nose sensingperformance since H2 is one of the major flammable gases.To evaluate the effectiveness of the nanotube device structureand compare its sensing performance with its thin filmcounterpart, a 140 nm thick SnO2 thin film was deposited onSiO2-coated silicon wafers also using the USP process, and twoAu electrodes were patterned on the thin film to fabricate aplanar sensor device (Methods section). The test results ofthese two types of sensors for 4000 ppm of H2 before and afterPt decoration are presented in Figure 3a. Interestingly, at roomtemperature both the SnO2 nanotube sensor and the planarSnO2 sensor do not respond to a low concentration of H2.However, after Pt nanoparticle decoration, the SnO2 nanotubesensor demonstrates a dramatically enhanced response to H2, ascompared with the Pt-decorated thin film sensor. Furthermore,Supplementary Figure S6a shows the nanotube sensor’sresponse to H2 with different Pt decoration times, indicatingthat a 75 min decoration time leads to the optimal sensingresponse. The thickness effect of the PAM has also beeninvestigated, and 40 μm was found to exhibit the bestsensitivity, as shown in Supplementary Figure S7. It is wellknown that at an elevated high temperature (200−300 °C) inair, SnO2 shows a rise of conduction due to the reactionbetween H2 and surface-adsorbed O2, which forms neutralH2O, thus releasing the trapped electrons back to SnO2 fromthe surface-adsorbed O2 molecules.1,25 However, in ourexperiments carried out at room temperature, the reactionbetween H2 and SnO2 surface-adsorbed O2 molecules isnegligible; thus SnO2 nearly demonstrates no conductancechange upon exposure to H2 gas. Nevertheless, Pt cansignificantly improve the SnO2 sensing response to H2 atroom temperature mainly due to its catalytic behavior andreduction of the barrier height at the Pt/SnO2 interface. Morespecifically, before the device was exposed to H2, since Pt has ahigher work function than SnO2, electron depletion occurs inSnO2 at the SnO2/Pt interface, and a Schottky contact will beformed, as shown in Supplementary Figure S5. Such electrondepletion certainly reduces the conductivity of the SnO2nanostructure. However, when H2 is injected into the testchamber, H2 molecules are readily adsorbed by the Ptnanoparticle surface and are then dissociated into atomic Hon the surface of Pt. The H atoms contribute electrons to Pt,and the Schottky barrier height reduces after the H atomsrapidly diffuse through Pt reaching the Pt/SnO2 interface,leading to an injection of electrons back to SnO2 and to anincrease of conductance of the SnO2 nanotubes.
26,27
Figure 3b−e demonstrate the response of the sensors usingAu, Pt, Ni, and ITO top electrodes, respectively, towardhydrogen concentrations ranging from 1000 to 4000 ppm atroom temperature. Note that 1000 ppm is the low detectionlimit for H2 required by the U.S. Department of Energy, and4000 ppm is the alarm level.28 In general, it can be seen that
ACS Nano Article
DOI: 10.1021/acsnano.8b02371ACS Nano 2018, 12, 6079−6088
6082
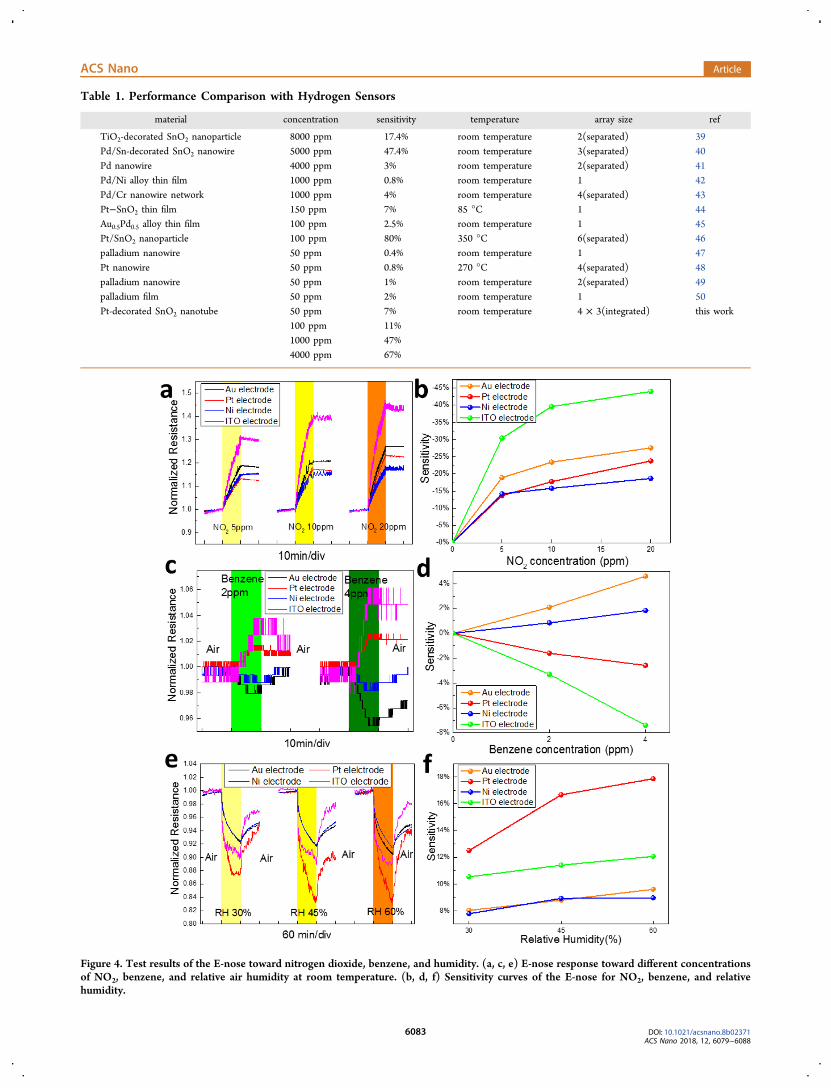
Table 1. Performance Comparison with Hydrogen Sensors
material concentration sensitivity temperature array size ref
TiO2-decorated SnO2 nanoparticle 8000 ppm 17.4% room temperature 2(separated) 39Pd/Sn-decorated SnO2 nanowire 5000 ppm 47.4% room temperature 3(separated) 40Pd nanowire 4000 ppm 3% room temperature 2(separated) 41Pd/Ni alloy thin film 1000 ppm 0.8% room temperature 1 42Pd/Cr nanowire network 1000 ppm 4% room temperature 4(separated) 43Pt−SnO2 thin film 150 ppm 7% 85 °C 1 44Au0.5Pd0.5 alloy thin film 100 ppm 2.5% room temperature 1 45Pt/SnO2 nanoparticle 100 ppm 80% 350 °C 6(separated) 46palladium nanowire 50 ppm 0.4% room temperature 1 47Pt nanowire 50 ppm 0.8% 270 °C 4(separated) 48palladium nanowire 50 ppm 1% room temperature 2(separated) 49palladium film 50 ppm 2% room temperature 1 50Pt-decorated SnO2 nanotube 50 ppm 7% room temperature 4 × 3(integrated) this work
100 ppm 11%1000 ppm 47%4000 ppm 67%
Figure 4. Test results of the E-nose toward nitrogen dioxide, benzene, and humidity. (a, c, e) E-nose response toward different concentrationsof NO2, benzene, and relative air humidity at room temperature. (b, d, f) Sensitivity curves of the E-nose for NO2, benzene, and relativehumidity.
ACS Nano Article
DOI: 10.1021/acsnano.8b02371ACS Nano 2018, 12, 6079−6088
6083
higher H2 concentrations lead to larger sensor resistancechanges. To perform a more quantitative analysis, thesensitivity of a given sensor to a target gas is defined as
=−
×R R
RSensitivity 100%O Gas
O (2)
where RO is the transient resistance before H2 injection andRGas is the resistance at the end of the 10 min H2 injectionperiod. The test results show that for 4000 ppm of H2 thesensitivities of sensors with Au, Pt, Ni, and ITO electrodes are67.26%, 47.88%, 32.36%, and 14.57%, respectively. Supple-mentary Figure S8 reports additional sensor response to 1000ppm of H2 and shows less than a 3% sensitivity shift withexcellent repeatability for all devices. Lower H2 concentrationsranging from 750 ppm down to 10 ppm were also used forsensing test, with the responses provided in SupplementaryFigure S9 and Figure S6b. Notably, although the sensors
demonstrated a readable response toward H2 below 10 ppm(signal-to-noise ratio (SNR) = 2), our existing MFCs do notallow for an accurate control of gas concentration below 10ppm. As the result, 10 ppm is the lowest concentration wecould actually measure. However, the lower limit could befurther reduced by using an MFC with a smaller flow raterange. Nevertheless, 50 ppm of H2 detection at roomtemperature with a semiconductor sensor provides alreadythe state-of-the-art detection capability in atmospheric pressure.The calculated sensitivities at different H2 concentrations areplotted in Figure 3f and Supplementary Figure S6. The overalltrend shows higher sensitivity can be achieved with higher gasconcentration with an exponential dependence on concen-tration that agrees with the empirical formula for metal oxidegas sensors (Supporting Information). The performance of ournanotube sensor was benchmarked against previously reportedH2 sensors in Table 1. It can be seen that among all room-
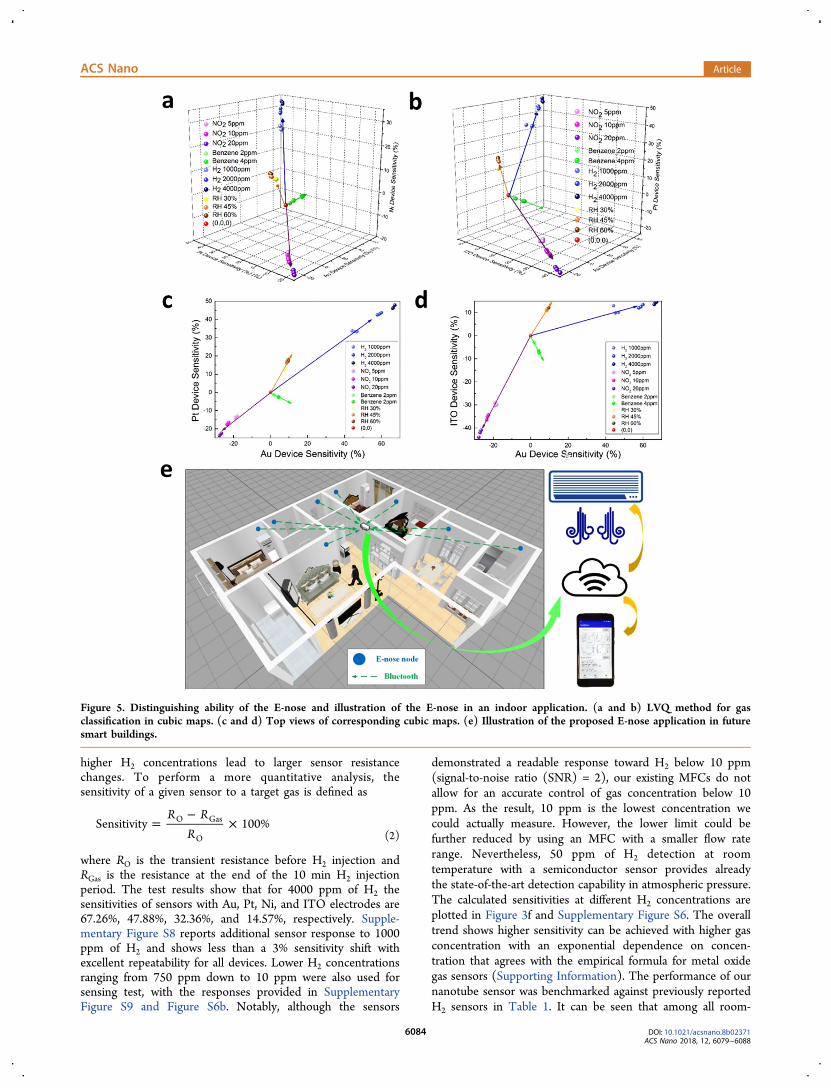
Figure 5. Distinguishing ability of the E-nose and illustration of the E-nose in an indoor application. (a and b) LVQ method for gasclassification in cubic maps. (c and d) Top views of corresponding cubic maps. (e) Illustration of the proposed E-nose application in futuresmart buildings.
ACS Nano Article
DOI: 10.1021/acsnano.8b02371ACS Nano 2018, 12, 6079−6088
6084

temperature-operated sensors our nanotube sensor demon-strates the best sensitivity for H2 concentrations ranging from4000 to 100 ppm. Although the Pt/SnO2 nanoparticle sensorshows higher sensitivity to 100 ppm of H2, it requires a 350 °Coperating temperature and high power consumption.Nitrogen Dioxide and Benzene Gas Sensing. In
addition to flammable H2 gas sensing, detection of toxic NO2and benzene gases with nanotube sensors has also beenexamined. Note that NO2 is one typical kind of air pollutionfrom automobile exhaust emission, while benzene can beemitted by house/building construction/decoration materials.Figure 4a reports nanotube sensor responses toward oxidizingNO2 for three different indoor level concentrations (5, 10, and20 ppm) in synthetic air and at room temperature. Figure 4breveals the exponential dependence of sensitivity versus NO2concentration. It can be seen that exposure to NO2 increasessensor resistance since NO2 molecules can withdraw electronsfrom metal oxides.29,30 The ITO electrode sensor exhibits thelargest resistance change because of the affected work functionand barrier height of the interface. However, given that NO2 isa strong oxidizing gas, the recovery process of the E-nose atroom temperature usually takes hours to recover back to theoriginal baseline resistances. Although a heater or a UV LEDcould be used to help the recovery,1,31 such a heater or LEDwould only need to be turned on when a dangerous level ofNO2 has been detected. In real life applications, due to the rareopportunity of detecting high-concentration NO2, the heaterwould remain off for most of the time. The use of a heater onlyfor fast sensor recovery will thus result in a significantly lowerpower budget as compared to commercial sensors using heatersfor high-temperature operation.Figure 4c shows the E-nose’s response to benzene. Because
of the low concentration (2−4 ppm) and room-temperatureoperation, acquired responses were relatively small compared tothe sensitivity toward H2, leading to low signal-to-noise ratio inthe response curve. However, the sensitivity could still beclearly observed and calculated from test results, as presented inFigure 4d. Intriguingly, for the ITO and Pt electrode sensors,benzene acts as an oxidizing gas, while it acts as a reducing gasfor Au and Ni electrode sensors. Figure 4d plots the sensitivityversus benzene concentration where the four normalizedresistance curves distinctively show positive and negativeresponses. The fact that ITO and Pt electrode sensors showa negative response, while Ni and Au electrode sensors show apositive response can be attributed to the different effect onelectrode work function exerted by benzene, leading to achange of contact property, e.g., barrier height, between theelectrodes and sensing material. Meanwhile, the catalytic effectof the electrode material toward the target gas can also affectthe impedance of the sensor.32 It is noteworthy to point outthat 8% sensitivity for the ITO electrode sensor (Figure 4d) is,to our best our knowledge, the highest sensitivity of a SnO2-based gas sensor toward indoor levels of benzene at roomtemperature.33,34 In contrast to NO2 and H2, individual sensorsof the E-nose exhibit different sensing properties when exposedto benzene. This can be further exploited for subsequent gasidentification tasks. The impact of humidity on sensors was alsoevaluated for 30%, 45%, and 60% relative humidity. Among thefour types of sensors, the Pt electrode sensor exhibits thehighest sensitivity to humidity because water molecules couldbe more easily dissociated into hydroxyl species on the Ptelectrodes.35 By changing the barrier height of the Schottkycontact and donating free electrons, the resistance of SnO2
nanotubes with Pt electrodes shows a large reduction, as shownin Figure 4e and f. Note that the sensor array could recoverback toward its original baseline even at room temperature.
Gas Identification Algorithm Design. The above E-nosetests revealed that each type of sensor has a characteristicresponse pattern to a specific gas. This behavior can be used forsubsequent gas identification. Learning vector quantization(LVQ) is used to process acquired data and identify the sensedgas.36 With the previous input training data defining thetraining vectors, the new testing data are also labeled as testingvectors and then discriminated by comparing with training data.Based on acquired data, a small library without a dimensionalityreduction process is presented in Figure 5a,b. Note that theaxes represent the sensitivity as defined in eq 2, and there is nooverlap between the sensitivity patterns representing each gassignature, with each gas having their own cluster direction.When applying the LVQ method for gas identification, therewill not be any cluster overlap even if the identification zone ofsensitivity is set at ±3%. This means the E-nose can accuratelydistinguish among all four target gases. To better visualize theLVQ classification, two-dimensional coordinates representingthe top view of Figure 5a,b are drawn in Figure 5c,d, withparameters labeled in each vector. The other two sets ofcombinations are presented in Supplementary Figure S10.Clearly, the vector orientation is the signature of a given gastype. Therefore, in practice, when an unknown gas is sensed bythe E-nose, the orientation and length of the acquired vectorassociated with its sensitivity pattern can be obtained andsubsequently matched with the vectors prestored in theidentification library. Based on eq 3 and the vector length,the concentration of the identified gas could be calculated,which means this vector representation method provides a widediscrimination range for these gases.37,38 Cg in eq 3 stands forthe concentration (ppm) of the target gas, which is linearlyrelated with the partial pressure (Pg). S is the sensitivitycalculated from the sensor array. Ag and the exponentcoefficient, α, depend on the analyte and electrode materials,which has already been trained and stored in the library.
= × = ×− ×
α⎛⎝⎜⎜
⎞⎠⎟⎟C P
SS A
10 10(1 )g
6g
6
g
1/
(3)
As our E-nose is a miniaturized, portable, and low-powerdevice, we have built an in-house sensor network consisting ofmultiple E-noses and a mobile phone receiver with a softwareApp developed for data processing. The supplementary videoshows a town gas leakage detection scenario, in which hydrogenis the major component (50%), with our wireless E-nose. Fastresponse to hydrogen in a town gas released by a kitchen stoveis demonstrated. Figure 5e illustrates the concept of deployingour lower power E-nose system in a smart home as anenvironmental safety system. Owing to the long operationlifetime and wireless communication, the sensor nodes could bedistributed to any preferred location within Bluetooth broad-casting range (e.g., 100 m). The acquired data can be in facttransmitted to a server and then uploaded to the Cloud. Theresidents of the house can monitor the environment in thehouse anywhere with the Internet. If the system is connectedwith air conditioners or air purifiers, the system could alsotrigger air purification/exchange automatically.
ACS Nano Article
DOI: 10.1021/acsnano.8b02371ACS Nano 2018, 12, 6079−6088
6085
CONCLUSIONS
In summary, we reported a high-performance ultra-low-powerE-nose system based on highly ordered SnO2 nanotube arrays.The proposed nanotubes have a high SA/V and Pt decorationto significantly improve sensor performance. The E-nosedemonstrates a heater-free detection capability toward H2,NO2, benzene, and humidity, with only 1% of powerconsumption of a commercial SnO2 thin film gas sensor.Particularly, the E-nose has achieved state-of-the-art H2 andbenzene detection sensitivity. Benefitting from multiple types ofelectrodes, the monolithically integrated sensor array hassuccessfully distinguished different gases using a simple vectorquantization algorithm. With its readout circuit, the E-nose cantransmit sensing data through a Bluetooth unit, to a mobilephone receiver, which enables construction of high-perform-ance smart sensor networks. Overall, the ultra-low-power smartE-nose system reported here can thus play a critical role infuture smart homes and buildings.
METHODSExperimental Methods. Freestanding Open-Ended PAM Sub-
strate Fabrication. A 0.5 mm thick aluminum foil was cut into a 2 × 2cm2 square piece, which was placed in an ultrasonic bath of acetone,followed by a 2-propanol bath. The aluminum foil was then rinsedwith deionized water. After that, it was put into an electrical polishingsolution (HClO4/C2H5OH, 1:3 in volume ratio) under a 16 V positivevoltage for 2 min. The polished Al foil was then immersed in ananodizing solution (H2O/C2H6O2/85% H3PO4, 200:100:1 in volumeratio) with a 200 V voltage applied between the Al foil and thenegative carbon electrode. When the thickness of the PAM filmreached 40 μm, the entire foil was immersed in a 0.2 mol/L H3PO4solution. A positive bias voltage of 200 V was applied on the aluminumfoil through a programmed Keithley, and then the Al foil was switchedto constant-current mode (4 mA) until the bias voltage dropped to 4V. The edge of the foil was then manually scratched with a knife.Electrical polishing was then used again to separate the interface ofaluminum from the PAM under a 16 V voltage for 3 min. After thepolishing process and natural drying, two freestanding PAMmembranes could be detached from the Al foil by tweezers. Toremove the barrier layer, the membranes were immersed into a 5%H3PO4 solution placed in a 53 °C water bath for 35 min.SnO2 Deposition on a Freestanding PAM Template. A 0.2
mol/L SnCl4·5H2O ethanol solution was used as the precursorsolution for the USP process. After vibrating it into a vapor phase in acontainer using an ultrasonic atomizer, the precursor was carried into anozzle by controlled dry air. The PAM template in the nozzle washeated to 370 °C for the subsequent spray pyrolysis process. Becauseof the open-ended structure, a 17 min spray pyrolysis process wasconducted on each side of the PAM template. For the planarcomparison test, the same precursor solution (0.2 mol/L SnCl4·5H2Oethanol solution) was used for depositing SnO2 on 1 μm oxide coatedsilicon wafer. The deposition process on the wafer was conducted for34 min.Pt Decoration and Forming Sensor Array. After the USP
process, the nanotube array was immersed in a 0.5 wt % Pt particle (5nm diameter) solution for surface decoration with a 600 rpm stirringrate. Following the decoration process, the freestanding SnO2nanotube array was covered by a shadow mask with 12 2 × 2 mm2
square openings. Then, 100 nm thick Au, Pt, Ni, and ITO werethermally evaporated each time to three neighboring openings,respectively, forming the electrode array shown in Figure 2a. Thebackside of the SnO2 nanotube array was covered by a shadow maskwith a fish bone shaped opening before 100 nm thick Au wasevaporated to form the common ground.E-Nose Characterization Procedure. The E-nose system,
integrated with a readout circuit, was put inside a glass chamber.Three program-controlled MFCs (UNIT Instrument, model UFC-
8100) were connected to the target gases, pure nitrogen, and pureoxygen, respectively. In our work, three types of target gases balancedin nitrogen were used, namely, 5000 ppm of H2, 25 ppm of NO2, and5 ppm of benzene. The concentration of the mixed gas delivered to gassensors was controlled through the MFC flow rate ratios. The totalflow rate was always maintained at 500.
ASSOCIATED CONTENT*S Supporting InformationThe Supporting Information is available free of charge on theACS Publications website at DOI: 10.1021/acsnano.8b02371.
Methods and additional figures (PDF)Demo video for ultra-low-power smart electronic nosesystem (AVI)
AUTHOR INFORMATIONCorresponding Author*Tel (Z. Fan): +852-23588027. E-mail: [email protected] Wang: 0000-0002-3975-1667Zhiyong Fan: 0000-0002-5397-0129Present Address⊥College of Information Engineering, Shenzhen University,Shenzhen, Guangdong, China.Author ContributionsJ.C., Z.C., F.B., X.P., A.B., C.Y.T., X.W., and Z.F. designed theexperiments. J.C., Z.C., D.Z., H.Z, and Z.F. carried out theexperiments. J.C., Z.C., F.B., and Z.F. contributed to dataanalysis. J.C., F.B., X.W., and Z.F. wrote and revised the paper,and all authors provided feedback.NotesThe authors declare no competing financial interest.
ACKNOWLEDGMENTSThis work was supported by National Natural ScienceFoundation of China (project 51672231), General ResearchFund (16237816) from Hong Kong Research Grant Council,ITS/415/16 and ITS/211/16FP from Hong Kong InnovationTechnology Commission, and the Australian Research CouncilDiscovery Projects funding scheme (Project DP130104374).The authors also acknowledge the support from the Center for1D/2D Quantum Materials and State Key Laboratory onAdvanced Displays and Optoelectronics at HKUST.
REFERENCES(1) Carpenter, M. A.; Mathur, S.; Kolmakov, A. Metal OxideNanomaterials for Chemical Sensors; Springer Science & BusinessMedia, 2012.(2) Persaud, K.; Dodd, G. Analysis of Discrimination Mechanisms inthe Mammalian Olfactory System Using a Model Nose. Nature 1982,299, 352−355.(3) Scott, S. M.; James, D.; Ali, Z. Data Analysis for Electronic NoseSystems. Microchim. Acta 2006, 156, 183−207.(4) Chen, K.; Gao, W.; Emaminejad, S.; Kiriya, D.; Ota, H.; Nyein,H. Y. Y.; Takei, K.; Javey, A. Printed Carbon Nanotube Electronics andSensor Systems. Adv. Mater. 2016, 28, 4397−4414.(5) Pan, Z. W.; Dai, Z. R.; Wang, Z. L. Nanobelts of SemiconductingOxides. Science 2001, 291, 1947−1949.(6) Zampolli, S.; Elmi, I.; Ahmed, F.; Passini, M.; Cardinali, G. C.;Nicoletti, S.; Dori, L. An Electronic Nose Based on Solid State SensorArrays for Low-Cost Indoor Air Quality Monitoring Applications. Sens.Actuators, B 2004, 101, 39−46.
ACS Nano Article
DOI: 10.1021/acsnano.8b02371ACS Nano 2018, 12, 6079−6088
6086

(7) Nagle, H. T.; Gutierrez-Osuna, R.; Schiffman, S. S. the How andWhy of Electronic Noses. IEEE Spectrum 1998, 35, 22−31.(8) Lee, D. S.; Lee, D. D.; Ban, S. W.; Lee, M.; Kim, Y. T. SnO2 GasSensing Array for Combustible and Explosive Gas LeakageRecognition. IEEE Sens. J. 2002, 2, 140−149.(9) Prosser, S. J.; Schmidt, E. D. Smart Sensors for IndustrialApplications. Sens. Rev. 1997, 17, 217−222.(10) Lewis, F. L. Wireless Sensor Networks. Smart environments:technologies, protocols, and applications 2005, 11−46.(11) Sysoev, V. V.; Button, B. K.; Wepsiec, K.; Dmitriev, S.;Kolmakov, A. Toward The Nanoscopic “Electronic Nose”: Hydrogenvs Carbon Monoxide Discrimination With an Array of IndividualMetal Oxide Nano-and Mesowire Sensors. Nano Lett. 2006, 6, 1584−1588.(12) Orwell, R. L.; Wood, R. L.; Tarran, J.; Torpy, F.; Burchett, M. D.Removal of Benzene by the Indoor Plant/Substrate Microcosm andImplications for Air Quality. Water, Air, Soil Pollut. 2004, 157, 193−207.(13) McAlpine, M. C.; Ahmad, H.; Wang, D.; Heath, J. R. HighlyOrdered Nanowire Arrays on Plastic Substrates for UltrasensitiveFlexible Chemical Sensors. Nat. Mater. 2007, 6, 379.(14) Hong, H. K.; Shin, H. W.; Yun, D. H.; Kim, S. R.; Kwon, C. H.;Lee, K.; Moriizumi, T. Electronic Nose System with Micro Gas SensorArray. Sens. Actuators, B 1996, 36, 338−341.(15) Kim, I.; Choi, W. Y. Hybrid Gas Sensor Having TiO2 NanotubeArrays and SnO2 Nanoparticles. Int. J. Nanotechnol. 2017, 14, 155−165.(16) Guo, B.; Bermak, A.; Chan, P. C.; Yan, G. Z. Characterization ofIntegrated Tin Oxide Gas Sensors With Metal Additives and IonImplantations. IEEE Sens. J. 2008, 8, 1397−1398.(17) Ha, M.; Park, J.; Lee, Y.; Ko, H. Triboelectric Generators andSensors for Self-Powered Wearable Electronics. ACS Nano 2015, 9,3421−3427.(18) Fan, Z.; Razavi, H.; Do, J. W.; Moriwaki, A.; Ergen, O.; Chueh,Y. L.; Neale, S.; Javey, A. Three-Dimensional Nanopillar-ArrayPhotovoltaics on Low-Cost and Flexible Substrates. Nat. Mater.2009, 8, 648−653.(19) Lin, Q.; Hua, B.; Leung, S. F.; Duan, X.; Fan, Z. Efficient LightAbsorption with Integrated Nanopillar/Nanowell Arrays for Three-Dimensional Thin-Film Photovoltaic Applications. ACS Nano 2013, 7,2725−2732.(20) Leung, S. F.; Yu, M.; Lin, Q.; Kwon, K.; Ching, K. L.; Gu, L.;Fan, Z. Efficient Photon Capturing with Ordered Three-DimensionalNanowell Arrays. Nano Lett. 2012, 12, 3682−3689.(21) Fan, Z.; Ruebusch, D. J.; Rathore, A. A.; Kapadia, R.; Ergen, O.;Leu, P. W.; Javey, A. Challenges and Prospects of Nanopillar-basedSolar Cells. Nano Res. 2009, 2, 829−843.(22) Tavakoli, M. M.; Lin, Q.; Leung, S. F.; Lui, G. C.; Lu, H.; Li, L.;Xiang, B.; Fan, Z. Efficient, Flexible and Mechanically RobustPerovskite Solar Cells on Inverted Nanocone Plastic Substrates.Nanoscale 2016, 8, 4276−4283.(23) Park, S. H.; Son, Y. C.; Willis, W. S.; Suib, S. L.; Creasy, K. E.Tin Oxide Films Made by Physical Vapor Deposition-ThermalOxidation and Spray Pyrolysis. Chem. Mater. 1998, 10, 2389−2398.(24) Hieda, K.; Hyodo, T.; Shimizu, Y.; Egashira, M. Preparation ofPorous Tin Dioxide Powder by Ultrasonic Spray Pyrolysis and TheirApplication to Sensor Materials. Sens. Actuators, B 2008, 133, 144−150.(25) Al-Hardan, N. H.; Abdullah, M. J.; Aziz, A. Sensing Mechanismof Hydrogen Gas Sensor Based on RF-Sputtered Zno Thin Films. Int.J. Hydrogen Energy 2010, 35, 4428−4434.(26) Lim, W.; Wright, J. S.; Gila, B. P.; Pearton, S. J.; Ren, F.; Lai, W.T.; Chen, L. C.; Hu, M. S.; Chen, K. H. Selective-Hydrogen Sensing atRoom Temperature with Pt-Coated Inn Nanobelts. Appl. Phys. Lett.2008, 93, 202109.(27) Cerchez, M.; Langer, H.; El Achhab, M.; Heinzel, T.;Ostermann, D.; Luder, H.; Degenhardt, J. Dynamics of HydrogenSensing with Pt/TiO2 Schottky Diodes. Appl. Phys. Lett. 2013, 103,033522.
(28) Buttner, W.; Burgess, R.; Post, M.; Rivkin, C. Summary andFindings from the NREL/DOE Hydrogen Sensor Workshop; NationalRenewable Energy Laboratory: Golden, CO, 2011, NREL/TP-5600-55645. www.nrel.gov/docs/fy12osti/55645.pdf (date of access: 05/10/2018).(29) Fan, Z.; Lu, J. G. Gate-refreshable Nanowire Chemical Sensors.Appl. Phys. Lett. 2005, 86, 123510.(30) Pan, X.; Liu, X.; Bermak, A.; Fan, Z. Self-Gating Effect InducedLarge Performance Improvement of ZnO Nanocomb Gas Sensors.ACS Nano 2013, 7, 9318−9324.(31) Kong, J.; Franklin, N. R.; Zhou, C.; Chapline, M. G.; Peng, S.;Cho, K.; Dai, H. Nanotube Molecular Wires as Chemical Sensors.Science 2000, 287, 622−625.(32) Rank, S.; Hafner, S.; Barsan, N.; Weimar, U. the Impact of theNature of the Electrode Material on SnO2 Thick Film SensorPerformance: Influence on Oxygen Adsorption. Procedia Eng. 2012,47, 514−517.(33) Stuckert, E. P.; Miller, C. J.; Fisher, E. R. the Effect of Ar/O2 andH2O Plasma Treatment of SnO2 Nanoparticles and Nanowires onCarbon Monoxide and Benzene Detection. ACS Appl. Mater. Interfaces2017, 9, 15733−15743.(34) Zito, C. A.; Perfecto, T. M.; Volanti, D. P. Impact of ReducedGraphene Oxide on the Ethanol Sensing Performance of Hollow SnO2
Nanoparticles Under Humid Atmosphere. Sens. Actuators, B 2017, 244,466−474.(35) Michaelides, A.; Hu, P. A Density Functional Theory Study ofHydroxyl and the Intermediate in the Water Formation Reaction onPt. J. Chem. Phys. 2001, 114, 513−519.(36) Kohonen, T. The Self-Organizing Map. Neurocomputing 1998,21, 1−6.(37) Scott, R. W.; Yang, S. M.; Chabanis, G.; Coombs, N.; Williams,D. E.; Ozin, G. A. Tin Dioxide Opals and Inverted Opals: Near-IdealMicrostructures for Gas Sensors. Adv. Mater. 2001, 13, 1468−1472.(38) Yin, Y. X.; Jiang, L. Y.; Wan, L. J.; Li, C. J.; Guo, Y. G.Polyethylene Glycol-Directed SnO2 Nanowires for Enhanced Gas-Sensing Properties. Nanoscale 2011, 3, 1802−1806.(39) Nasirian, S.; Moghaddam, H. M. Polyaniline Assisted by TiO2:SnO2 Nanoparticles as a Hydrogen Gas Sensor at EnvironmentalConditions. Appl. Surf. Sci. 2015, 328, 395−404.(40) Jeong, S. H.; Kim, S.; Cha, J.; Son, M. S.; Park, S. H.; Kim, H. Y.;Cho, M. H.; Whangbo, M. H.; Yoo, K. H.; Kim, S. J. HydrogenSensing Under Ambient Conditions Using SnO2 Nanowires:Synergetic Effect of Pd/Sn Co-Deposition. Nano Lett. 2013, 13,5938−5943.(41) Yang, F.; Taggart, D. K.; Penner, R. M. Fast, Sensitive HydrogenGas Detection Using Single Palladium Nanowires that Resist Fracture.Nano Lett. 2009, 9, 2177−2182.(42) Hughes, R. C.; Schubert, W. K. Thin Films of Pd/Ni Alloys forDetection of High Hydrogen Concentrations. J. Appl. Phys. 1992, 71,542−544.(43) Zeng, X. Q.; Wang, Y. L.; Deng, H.; Latimer, M. L.; Xiao, Z. L.;Pearson, J.; Xu, T.; Wang, H. H.; Welp, U.; Crabtree, G. W.; Kwok, W.K. Networks of Ultrasmall Pd/Cr Nanowires as High PerformanceHydrogen Sensors. ACS Nano 2011, 5, 7443−7452.(44) Rane, S.; Arbuj, S.; Rane, S.; Gosavi, S. Hydrogen SensingCharacteristics of Pt−SnO2 Nano-Structured Composite Thin Films. J.Mater. Sci.: Mater. Electron. 2015, 26, 3707−3716.(45) Menumerov, E.; Marks, B. A.; Dikin, D. A.; Lee, F. X.; Winslow,R. D.; Guru, S.; Sil, D.; Borguet, E.; Hutapea, P.; Hughes, R. A.;Neretina, S. Sensing Hydrogen Gas from Atmospheric Pressure to aHundred Parts per Million with Nanogaps Fabricated Using a Single-Step Bending Deformation. ACS Sens. 2016, 1, 73−80.(46) Kocemba, I.; Rynkowski, J. The Influence of Catalytic Activityon the Response of Pt/SnO2 Gas Sensors to Carbon Monoxide andHydrogen. Sens. Actuators, B 2011, 155, 659−666.(47) Offermans, P.; Tong, H. D.; Van Rijn, C. J. M.; Merken, P.;Brongersma, S. H.; Crego-Calama, M. Ultralow-Power HydrogenSensing with Single Palladium Nanowires. Appl. Phys. Lett. 2009, 94,223110.
ACS Nano Article
DOI: 10.1021/acsnano.8b02371ACS Nano 2018, 12, 6079−6088
6087

(48) Yang, F.; Donavan, K. C.; Kung, S. C.; Penner, R. M. TheSurface Scattering-Based Detection of Hydrogen in Air Using aPlatinum Nanowire. Nano Lett. 2012, 12, 2924−2930.(49) Yang, F.; Kung, S. C.; Cheng, M.; Hemminger, J. C.; Penner, R.M. Smaller is Faster and More Sensitive: the Effect of Wire Size on theDetection of Hydrogen by Single Palladium Nanowires. ACS Nano2010, 4, 5233−5244.(50) Xu, T.; Zach, M. P.; Xiao, Z. L.; Rosenmann, D.; Welp, U.;Kwok, W. K.; Crabtree, G. W. Self-Assembled Monolayer-EnhancedHydrogen Sensing with Ultrathin Palladium Films. Appl. Phys. Lett.2005, 86, 203104.
ACS Nano Article
DOI: 10.1021/acsnano.8b02371ACS Nano 2018, 12, 6079−6088
6088
Related Documents