ULTRA-HIGH TEMPERATURE STEAM GASIFICATION OF BIOMASS Qari Muhammad Khalid Waheed Submitted in accordance with the requirements for the degree of Doctor of Philosophy The University of Leeds School of Process, Environmental and Materials Engineering October 2013

Welcome message from author
This document is posted to help you gain knowledge. Please leave a comment to let me know what you think about it! Share it to your friends and learn new things together.
Transcript
ULTRA-HIGH TEMPERATURE STEAM
GASIFICATION OF BIOMASS
Qari Muhammad Khalid Waheed
Submitted in accordance with the requirements for the degree of
Doctor of Philosophy
The University of Leeds
School of Process, Environmental and Materials Engineering
October 2013
ii
The candidate confirms that the work submitted is his own, except where work which
has formed part of jointly-authored publications has been included. The contribution of
the candidate and the other authors to this work has been explicitly indicated below. The
candidate confirms that appropriate credit has been given within the thesis where
reference has been made to the work of others
This copy has been supplied on the understanding that it is copyright material and that
no quotation from the thesis may be published without proper acknowledgement.
The details of chapter 4 and chapter 5.3 of the thesis are based on the following
published papers, respectively:
[1] WAHEED, Q. & NAHIL, M.A. & WILLIAMS, P.T. (2013) Pyrolysis of waste
biomass: investigation of fast pyrolysis and slow pyrolysis process conditions on
product yield and gas composition. Journal of Energy Institute 4 (2013) 233 - 241.
[2] WAHEED, Q. & WILLIAMS, P.T. (2013) Hydrogen production from high
temperature pyrolysis/steam reforming of waste biomass: rice husk, sugarcane bagasse
and wheat straw. Energy & Fuel 27 (2013) 6695 - 6704.
The candidate (Qari Waheed) performed the experimental work and prepared the initial
draft along with the graphical and tabular presentation, calculation and summarization
of the papers.
The co-author (Prof. Dr. P.T. Williams) supervised the work, proof read the drafts and
made suggestions and corrections to the draft papers.
The co-author (Dr. M.A. Nahil) helped to perform slow pyrolysis experiments on his
one-stage reactor in first paper.
© <2013> The University of Leeds and <Qari Muhammad Khalid Waheed>
iii
ACKNOWLEDGEMENTS
“Praise be to Allah, the most beneficent and the most merciful”
I owe my deepest gratitude to the University of Engineering and Technology Peshawar,
Pakistan and Higher Education Commission Pakistan for their financial support during
my study abroad.
My heartily gratitude and appreciation go to my supervisor, Prof. Paul. T. Williams, for
his continuous and constant support throughout this research. His kindness, patience,
motivation, enthusiasm and guidance helped me a lot throughout the duration of this
study.
I would like to thank Dr. Chunfei Wu, Dr. Jude Onwudili, Dr. Anas Nahil, Dr. Adrian
Cunliffe, and Dr. Surjit Singh for their encouragement and guidance during this
research. I would like to thank Mr. Ed Woodhouse for his continuous support from
design and manufacturing of the reactor to various timely repairs and modifications. I
am grateful to Eyub, Alfred, Naji, Rattana, Ruzinah, Faeiza, Safari, Brian, Ibrahim,
Chidi, Paula, Eyup, Chika, Jonathan, Junizah, Amar, and Ramzi for their invaluable
support and friendship they have shared with me. I am thankful to my friends Dr. Jafar
Iqbal, Yameen Sandhu, Asim Ali, Safeer Haider, Dr. Shahid Maqsood, Dr. Bilal
Ahmed, Dr. Shakoor, Mahabat Khan, Ali Arif and Imran Bashir for their help, support
and encouragement.
I am very thankful to my parents, Muhammad Aslam and Ruqayya Aslam for their
unconditional support during this research. I am thankful to my brothers and sisters for
their time to time encouragement. Finally I am deeply thankful to my wife Sumiya for
her unprecedented support, love, understanding and motivation during this research.
iv
ABSTRACT
In this research, hydrogen production from conventional slow pyrolysis, flash pyrolysis,
steam gasification and catalytic steam gasification of various biomass samples including
rice husk, wood pellets, wheat straw and sugarcane bagasse was investigated at ultra-
high temperature (~1000 °C). During flash pyrolysis of the waste wood, the gas yield
was improved to ~78 wt.% as compared to ~25 wt.% obtained during slow pyrolysis.
The addition of steam enhanced the hydrogen concentration from 26.91 vol.% for
pyrolysis to 44.13 vol.% for steam gasification. The comparison of pyrolysis, steam
gasification and catalytic steam gasification in a down-draft gasification reactor at 950
°C using rice husk, bagasse and wheat straw showed a significant increase in gas yield
as well as hydrogen yield. The hydrogen yield was enhanced from ~2 mmoles g-1
for
pyrolysis to ~25 mmoles g-1
during steam gasification using a 10 wt.% Ni-dolomite
catalyst. The higher hydrogen yield was due to the enhanced steam reforming of
hydrocarbons and thermal cracking of tar compounds at higher temperature. When
compared with the other catalysts such as 10 wt.% Ni-dolomite, 10 wt.% Ni-MgO, and
10 wt.% Ni-SiO2, the 10 wt.% Ni-Al2O3 catalyst showed the highest hydrogen yield of
29.62 mmoles g-1
. The investigation on gasification temperature showed that the
hydrogen yield was significantly improved from 21.17 mmoles g-1
at 800 °C to 35.65
mmoles g-1
at 1050 °C. The hydrogen concentration in the product gas mixture was
increased from 50.32 vol.% at 800 °C to 67.41 vol.% at 1050 °C. The increase in steam
injection rate from 6 to 35 ml hr-1
enhanced the hydrogen yield from 29.93 mmoles g-1
to 44.47 mmoles g-1
. The hydrogen concentration increased from 60.73 to 72.92 vol.%.
The increase was mainly due to the shift in the equilibrium of the water gas shift
reaction as H2:CO ratio increased from 2.97 to 7.78. The other process variables such as
catalyst to sample ratio, carrier gas flow rate showed little or no influence on the gas
yield and hydrogen yield. The steam gasification of residual biomass char was
performed at 950 °C to recover extra hydrogen. The presence of 10 wt.% Ni-Al2O3 in
the gasifier improved the hydrogen yield to ~47 mmoles per gram of biomass as
compared to the other catalysts such as 10 wt.% Ni-dolomite and 10 wt.% Ni-MgO. The
gasification temperature showed a positive influence on hydrogen yield from 750 °C to
950 °C. The increase in steam injection rate from 6 ml hr-1
to 15 ml hr-1
enhanced the
hydrogen yield from 46.81 to 52.10 mmoles g-1
of biomass.
v
TABLE OF CONTENTS
ACKNOWLEDGEMENTS ..................................................................................... iii
ABSTRACT .............................................................................................................. iv
TABLE OF CONTENTS .......................................................................................... v
LIST OF TABLES .................................................................................................. xii
LIST OF FIGURES ............................................................................................... xiv
ABBREVIATIONS ................................................................................................ xix
NOMENCLATURE ................................................................................................ xx
Chapter 1 INTRODUCTION .................................................................................. 1
1.1 World energy demand and resources ........................................................ 1
1.2 Biomass and organic waste ....................................................................... 3
1.3 Hydrogen ................................................................................................... 6
1.3.1 Hydrogen economy .......................................................................... 6
1.3.2 Hydrogen production ....................................................................... 7
1.3.2.1 Steam methane reforming (SMR) of natural gas ............... 7
1.3.2.2 Coal gasification ................................................................ 8
1.3.2.3 Biomass gasification .......................................................... 8
1.3.2.4 Electrolysis (Direct/Wind/Solar) ....................................... 9
1.3.2.5 Nuclear thermochemical .................................................. 10
1.4 Energy from biomass .............................................................................. 11
1.4.1 Biological methods ........................................................................ 11
1.4.1.1 Fermentative hydrogen production.................................. 11
1.4.1.2 Anaerobic digestion ......................................................... 11
1.4.2 Thermochemical methods .............................................................. 12
1.4.2.1 Combustion ..................................................................... 12
1.4.2.2 Pyrolysis .......................................................................... 12
1.4.2.3 Gasification ..................................................................... 13
1.5 Chapter references ................................................................................... 15
Chapter 2 LITERATURE REVIEW .................................................................... 17
2.1 Biomass gasification ............................................................................... 17
2.1.1 Gasification reactions ..................................................................... 18
2.1.2 Syngas clean-up systems ................................................................ 19
2.1.3 Tar removal .................................................................................... 19
2.2 Review of gasification conditions ........................................................... 21
vi
2.2.1 Feedstock composition ................................................................... 22
2.2.2 Biomass particle size ...................................................................... 28
2.2.3 The influence of gasification temperature...................................... 32
2.2.4 Steam to biomass ratio ................................................................... 36
2.2.5 The influence of gasifying agent .................................................... 38
2.3 Gasification reactors................................................................................ 40
2.3.1 Fixed bed reactors .......................................................................... 40
2.3.1.1 Up-draft fixed-bed reactors ............................................. 40
2.3.1.2 Down-draft fixed-bed reactors ........................................ 42
2.3.2 Fluidised bed reactors .................................................................... 43
2.3.2.1 Bubbling fluidised bed reactors ....................................... 44
2.3.2.2 Circulating fluidised bed reactors .................................... 45
2.4 Catalytic gasification ............................................................................... 47
2.4.1 Mineral-based catalysts .................................................................. 48
2.4.1.1 Dolomite .......................................................................... 48
2.4.1.2 Olivine ............................................................................. 49
2.4.2 Nickel based and other metal catalysts .......................................... 50
2.5 Ultra-high temperature gasification of biomass ...................................... 53
2.6 Research aims and objectives.................................................................. 54
2.7 Conclusions ............................................................................................. 56
2.8 Chapter references ................................................................................... 58
Chapter 3 RESEARCH METHODOLOGY ........................................................ 67
3.1 Introduction ............................................................................................. 67
3.2 Materials .................................................................................................. 68
3.2.1 Biomass .......................................................................................... 68
3.2.2 Catalyst ........................................................................................... 73
3.3 Pyrolysis/gasification reactors ................................................................ 74
3.3.1 Up-draft ultra-high temperature fixed-bed reactor ......................... 74
3.3.1.1 Up-draft flash pyrolysis reactor ....................................... 74
3.3.1.2 Standard operating procedure for up-draft flash
pyrolysis reactor .................................................................... 78
3.3.1.3 Repeatability test for up-draft flash pyrolysis reactor ..... 78
3.3.2 Down-draft ultra-high temperature fixed bed reactor .................... 80
3.3.2.1 Down-draft catalytic steam gasification reactor .............. 80
vii
3.3.2.2 Standard operating procedure for down-draft
gasification reactor ................................................................ 82
3.3.2.3 Repeatability test for down-draft catalytic steam
gasification reactor ................................................................ 83
3.3.3 Single-stage fixed bed reactor ........................................................ 84
3.4 Analysis and characterisation .................................................................. 86
3.4.1 Gaseous products analysis ............................................................. 86
3.4.1.1 Gas analysis ..................................................................... 86
3.4.2 Biomass and char characterization ................................................. 87
3.4.2.1 Proximate analysis ........................................................... 87
3.4.2.2 Ultimate analysis ............................................................. 89
3.4.2.3 X-ray fluorescence (XRF) analysis of ash....................... 90
3.4.3 Catalyst characterization ................................................................ 90
3.4.3.1 Temperature programmed oxidation (TPO) .................... 90
3.4.3.2 Scanning electron microscopy (SEM) ............................. 92
3.4.3.3 Transmission electron microscopy (TEM) ...................... 93
3.4.3.4 Brunauer–Emmett–Teller (BET) surface area analysis ... 94
3.4.3.5 X-ray diffraction (XRD) analysis .................................... 95
3.5 Chapter references ................................................................................... 96
Chapter 4 FAST AND SLOW PYROLYSIS OF BIOMASS .............................. 97
4.1 Introduction ............................................................................................. 97
4.2 Fast and slow pyrolysis of biomass at 850 °C ........................................ 98
4.2.1 Product yield .................................................................................. 98
4.2.2 Gas composition from fast pyrolysis and slow pyrolysis of
biomass at 850 °C ........................................................................ 102
4.3 The influence of temperature on product yield from fast pyrolysis ...... 103
4.3.1 Product yield ................................................................................ 103
4.3.2 The effect of fast pyrolysis temperature on gas composition ...... 106
4.4 The influence of steam on the fast pyrolysis of biomass ...................... 108
4.5 Potential hydrogen production for fast pyrolysis .................................. 110
4.6 Conclusions ........................................................................................... 111
4.7 Chapter references ................................................................................. 113
Chapter 5 TWO-STAGE PYROLYSIS GASIFICATION OF RICE HUSK,
BAGASSE AND WHEAT STRAW ........................................................... 115
5.1 Introduction ........................................................................................... 115
viii
5.2 Characterization of rice husk, sugarcane bagasse and wheat straw
using thermogravimetric analysis ......................................................... 115
5.2.1 Comparison of biomass samples .................................................. 116
5.2.2 The effect of heating rate ............................................................. 118
5.2.3 The effect of particle size ............................................................. 121
5.2.4 Kinetic parameters ....................................................................... 125
5.2.5 Comparison of activation energy from literature ......................... 127
5.2.6 Conclusions for section 5.2 .......................................................... 130
5.3 Hydrogen production from ultra-high temperature pyrolysis, steam
gasification and catalytic steam gasification of rice husk, sugarcane
bagasse and wheat straw ....................................................................... 131
5.3.1 Characterization of fresh catalysts ............................................... 132
5.3.2 Pyrolysis of rice husk, sugarcane bagasse and wheat straw......... 136
5.3.2.1 Product yield from pyrolysis ......................................... 136
5.3.2.2 Gas composition and hydrogen production ................... 138
5.3.3 Steam gasification of rice husk, bagasse and wheat straw ........... 141
5.3.3.1 Product yield from steam gasification ........................... 141
5.3.3.2 Gas composition from steam gasification ..................... 142
5.3.4 Dolomite catalytic steam gasification of rice husk, bagasse and
wheat straw................................................................................... 144
5.3.4.1 Product yield from dolomite catalytic steam gasification144
5.3.4.2 Gas composition from dolomite catalytic steam
gasification .......................................................................... 146
5.3.5 10 wt.% Ni-dolomite catalytic steam gasification of rice husk,
bagasse and wheat straw .............................................................. 146
5.3.5.1 Product yield from 10 wt.% Ni-dolomite catalytic steam
gasification .......................................................................... 146
5.3.5.2 Gas composition and hydrogen production ................... 148
5.3.6 Characterization of reacted catalysts ............................................ 150
5.3.7 Conclusions for section 5.3 .......................................................... 153
5.4 The influence of process conditions on ultra-high temperature catalytic
steam gasification of rice husk using 10 wt.% Ni-dolomite catalyst. ... 154
5.4.1 The influence of gasification temperature.................................... 154
5.4.1.1 Product yield .................................................................. 154
5.4.1.2 The influence of temperature on gas composition and
hydrogen production ........................................................... 157
5.4.2 The effect of water/steam injection rate ....................................... 162
ix
5.4.2.1 Product yield .................................................................. 162
5.4.2.2 The influence of water injection rate on gas composition
and hydrogen production..................................................... 164
5.4.3 The influence of biomass particle size ......................................... 168
5.4.3.1 Product yield .................................................................. 168
5.4.3.2 The influence of particle size on gas composition and
hydrogen production ........................................................... 170
5.4.4 The influence of catalyst to sample ratio ..................................... 171
5.4.4.1 Product yield .................................................................. 171
5.4.4.2 The influence of catalyst to sample ratio on gas
composition and hydrogen production ................................ 173
5.4.5 The influence of carrier gas flow rate .......................................... 174
5.4.5.1 Product yield .................................................................. 174
5.4.5.2 The influence of carrier gas flow rate on gas
composition and hydrogen production ................................ 175
5.4.6 Conclusions for section 5.4 .......................................................... 176
5.5 Chapter references ................................................................................. 178
Chapter 6 CATALYST SELECTION & PYROLYSIS/GASIFICATION OF
BAGASSE ..................................................................................................... 186
6.1 Introduction ........................................................................................... 186
6.2 Catalyst selection for hydrogen production from pyrolysis-gasification
of sugarcane bagasse ............................................................................. 187
6.2.1 Characterisation of the fresh researched catalysts ....................... 187
6.2.2 Product yield ................................................................................ 190
6.2.3 The influence of different catalysts on gas composition and
hydrogen production .................................................................... 193
6.2.4 Characterisation of reacted catalyst ............................................. 195
6.3 The influence of gasification temperature............................................. 201
6.3.1 Product yield ................................................................................ 201
6.3.2 The influence of temperature on gas composition and hydrogen
production .................................................................................... 203
6.3.3 Characterization of reacted 10 % Ni-Al2O3 catalyst .................... 205
6.4 The influence of Ni loading .................................................................. 208
6.4.1 Product yield ................................................................................ 208
6.4.2 The influence of Ni-loading on gas composition and hydrogen
production .................................................................................... 209
6.4.3 Characterization of reacted Ni-Al2O3 catalysts ............................ 211
x
6.5 The influence of water/steam injection rate .......................................... 214
6.5.1 Product yield ................................................................................ 214
6.5.2 The influence of water injection rate on gas composition and
hydrogen production .................................................................... 215
6.6 The influence of calcination temperature .............................................. 217
6.6.1 Characterization of fresh catalysts ............................................... 217
6.6.2 Product yield ................................................................................ 219
6.6.3 The influence of calcination temperature on gas composition and
hydrogen production .................................................................... 220
6.7 The influence of catalyst to sample ratio .............................................. 222
6.7.1 Product yield ................................................................................ 222
6.7.2 The influence of catalyst to sample ratio on gas composition and
hydrogen production .................................................................... 224
6.8 Conclusions ........................................................................................... 226
6.9 Chapter references ................................................................................. 228
Chapter 7 CHAR GASIFICATION .................................................................... 231
7.1 Introduction ........................................................................................... 231
7.2 Characterization of char from rice husk wheat straw and sugarcane
bagasse pyrolysis ................................................................................... 232
7.3 The influence of different catalysts on hydrogen production from
gasification of sugarcane bagasse char at 950 °C ................................. 235
7.3.1 Product yield ................................................................................ 235
7.3.2 The influence of different catalysts on gas composition and
hydrogen production .................................................................... 237
7.4 The influence of temperature on char gasification ................................ 238
7.4.1 Product yield ................................................................................ 238
7.4.2 The influence of temperature on gas composition and hydrogen
production .................................................................................... 240
7.5 The influence of water/steam injection rate on gasification of char ..... 242
7.5.1 Product yield ................................................................................ 242
7.5.2 The influence of water injection rate on gas composition ........... 243
7.6 Conclusions ........................................................................................... 245
7.7 Chapter references ................................................................................. 246
Chapter 8 CONCLUSIONS AND FUTURE WORK ........................................ 248
8.1 Introduction ........................................................................................... 248
8.2 Conclusions ........................................................................................... 249
xi
8.2.1 Pyrolysis of waste biomass: Investigation of fast pyrolysis and
slow pyrolysis process conditions on product yield and gas
composition .................................................................................. 249
8.2.2 Characterization of rice husk, sugarcane bagasse and wheat straw
using thermogravimetric analysis ................................................ 250
8.2.3 Hydrogen production from ultra-high temperature pyrolysis,
steam gasification and catalytic steam gasification of rice husk,
sugarcane bagasse and wheat straw ............................................. 251
8.2.4 The influence of various process conditions on ultra-high
temperature catalytic steam gasification of rice husk using 10
wt.% Ni-dolomite catalyst at 950 °C ........................................... 251
8.2.5 The influence of catalyst and other process conditions on ultra-
high temperature catalytic steam gasification of sugarcane
bagasse ......................................................................................... 252
8.2.6 Catalytic steam gasification of residual biomass char ................. 254
8.3 Future work ........................................................................................... 255
APPENDIX - A GAS CACLULATIONS .......................................................... 257
APPENDIX - B CALCULATION OF KINETIC PARAMETERS ................ 262
APPENDIX – C GLOSSARY OF COMMONLY USED TERMS .................. 265
xii
LIST OF TABLES
Table 1-1 “ Proveda ” world oil reserve estimates from selected sources [3] ................... 2
Table 1-2 Biomass energy potentials and current use in different regions (EJ/a)
(EJ=1018
) [15] ............................................................................................................ 9
Table 2-1 Different classes of tar compounds [9] ........................................................... 20
Table 2-2 Chemical composition of various biomasses: based on proximate analysis
(wt.% dry basis) and ultimate analysis (wt.% dry, ash-free basis) adapted from [16].
................................................................................................................................. 22
Table 2-3 Ash composition of biomass (parts per million weight of dry biomass) [19] 25
Table 2-4 Component analysis of biomass (wt.% db) [20] ............................................. 27
Table 2-5 Various zones in the fixed-bed reactors and the respective reactions adapted
from [87] .................................................................................................................. 43
Table 2-6 Comparison of fixed bed and fluidized bed reactors [79] .............................. 46
Table 3-1 Proximate and ultimate analysis of feedstock ................................................ 70
Table 3-2 Proximate and ultimate analysis of biomass feedstock sourced from Pakistan
................................................................................................................................. 71
Table 3-3 Surface properties of fresh catalysts ............................................................... 94
Table 4-1 Product yield from the fast pyrolysis of wood, rice husks and forestry residue
in relation to pyrolysis temperature ....................................................................... 104
Table 4-2 Gas composition from the fast pyrolysis of wood, rice husks and forestry
residue in relation to pyrolysis temperature ........................................................... 107
Table 4-3 Gas composition and hydrogen production from the steam gasification of
wood ...................................................................................................................... 108
Table 5-1 Cellulose, hemicellulose and lignin contents of biomass samples [1].......... 116
Table 5-2 The effect of particle size on weight loss of biomass samples ..................... 124
Table 5-3 Comparison of kinetic parameters with literature ........................................ 127
Table 5-4 Kinetic parameters ........................................................................................ 128
Table 5-5 Results from Coats-Redfern method ............................................................ 129
Table 5-6 Surface properties of fresh catalysts ............................................................. 132
Table 5-7 Pyrolysis of different biomass samples ........................................................ 137
Table 5-8 Steam gasification of different biomass samples.......................................... 141
Table 5-9 Dolomite catalytic steam gasification of different biomass samples ............ 145
Table 5-10 10 wt.% Ni-dolomite catalytic steam gasification of different biomass
samples .................................................................................................................. 148
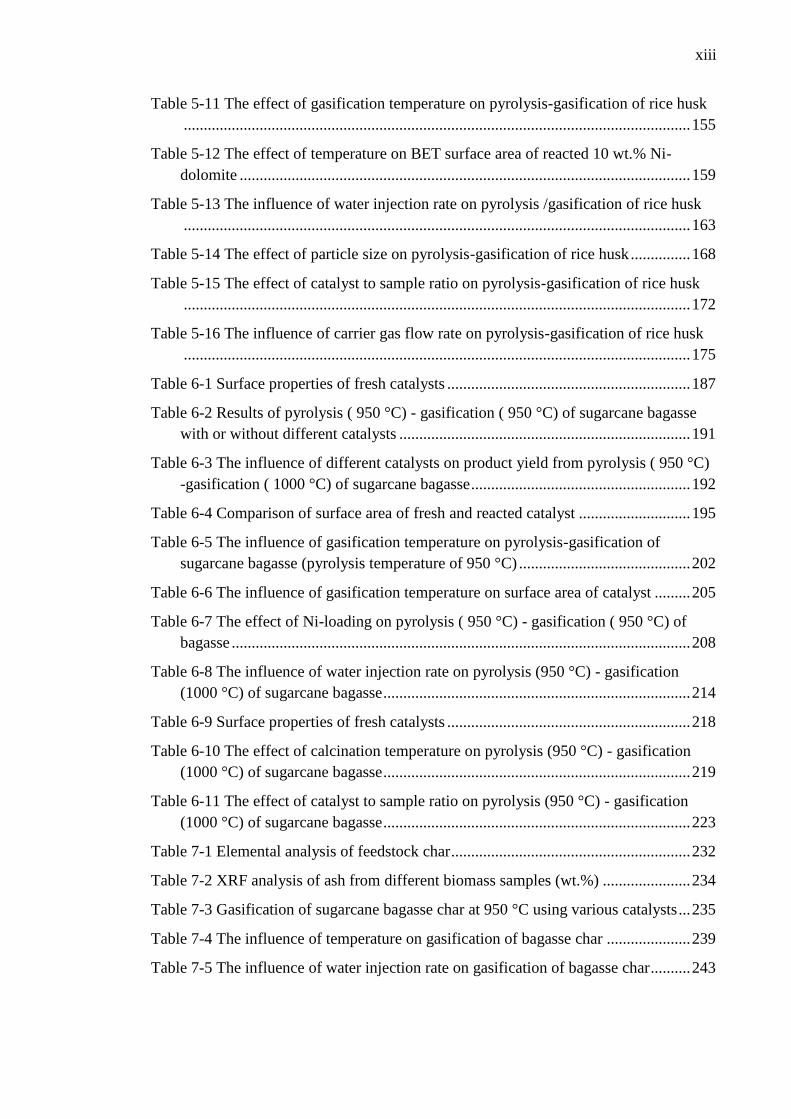
xiii
Table 5-11 The effect of gasification temperature on pyrolysis-gasification of rice husk
............................................................................................................................... 155
Table 5-12 The effect of temperature on BET surface area of reacted 10 wt.% Ni-
dolomite ................................................................................................................. 159
Table 5-13 The influence of water injection rate on pyrolysis /gasification of rice husk
............................................................................................................................... 163
Table 5-14 The effect of particle size on pyrolysis-gasification of rice husk ............... 168
Table 5-15 The effect of catalyst to sample ratio on pyrolysis-gasification of rice husk
............................................................................................................................... 172
Table 5-16 The influence of carrier gas flow rate on pyrolysis-gasification of rice husk
............................................................................................................................... 175
Table 6-1 Surface properties of fresh catalysts ............................................................. 187
Table 6-2 Results of pyrolysis ( 950 °C) - gasification ( 950 °C) of sugarcane bagasse
with or without different catalysts ......................................................................... 191
Table 6-3 The influence of different catalysts on product yield from pyrolysis ( 950 °C)
-gasification ( 1000 °C) of sugarcane bagasse ....................................................... 192
Table 6-4 Comparison of surface area of fresh and reacted catalyst ............................ 195
Table 6-5 The influence of gasification temperature on pyrolysis-gasification of
sugarcane bagasse (pyrolysis temperature of 950 °C) ........................................... 202
Table 6-6 The influence of gasification temperature on surface area of catalyst ......... 205
Table 6-7 The effect of Ni-loading on pyrolysis ( 950 °C) - gasification ( 950 °C) of
bagasse ................................................................................................................... 208
Table 6-8 The influence of water injection rate on pyrolysis (950 °C) - gasification
(1000 °C) of sugarcane bagasse ............................................................................. 214
Table 6-9 Surface properties of fresh catalysts ............................................................. 218
Table 6-10 The effect of calcination temperature on pyrolysis (950 °C) - gasification
(1000 °C) of sugarcane bagasse ............................................................................. 219
Table 6-11 The effect of catalyst to sample ratio on pyrolysis (950 °C) - gasification
(1000 °C) of sugarcane bagasse ............................................................................. 223
Table 7-1 Elemental analysis of feedstock char ............................................................ 232
Table 7-2 XRF analysis of ash from different biomass samples (wt.%) ...................... 234
Table 7-3 Gasification of sugarcane bagasse char at 950 °C using various catalysts ... 235
Table 7-4 The influence of temperature on gasification of bagasse char ..................... 239
Table 7-5 The influence of water injection rate on gasification of bagasse char .......... 243
xiv
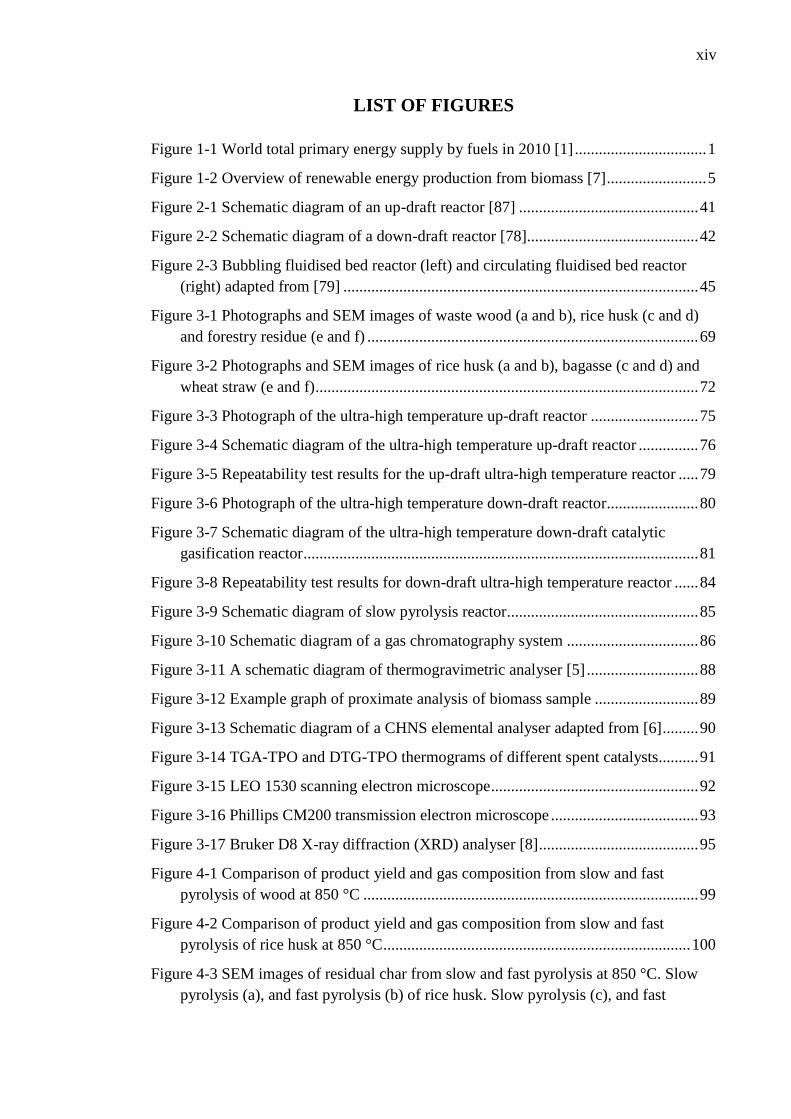
LIST OF FIGURES
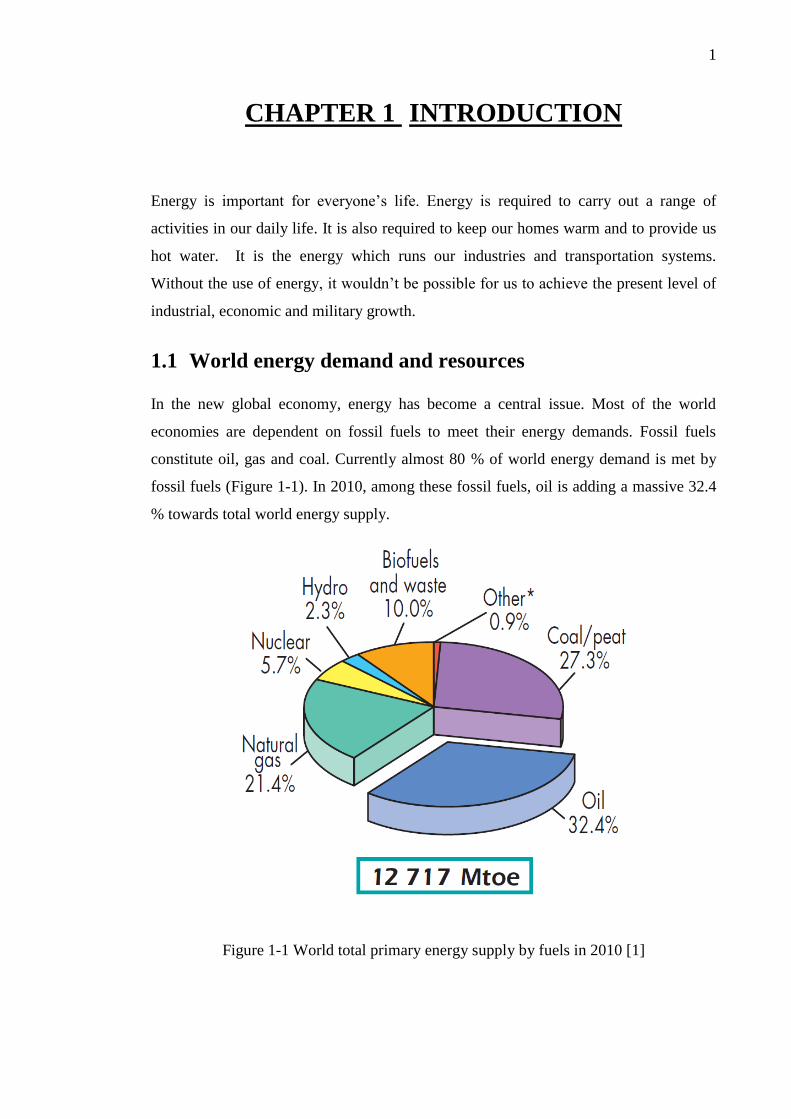
Figure 1-1 World total primary energy supply by fuels in 2010 [1] ................................. 1
Figure 1-2 Overview of renewable energy production from biomass [7] ......................... 5
Figure 2-1 Schematic diagram of an up-draft reactor [87] ............................................. 41
Figure 2-2 Schematic diagram of a down-draft reactor [78]........................................... 42
Figure 2-3 Bubbling fluidised bed reactor (left) and circulating fluidised bed reactor
(right) adapted from [79] ......................................................................................... 45
Figure 3-1 Photographs and SEM images of waste wood (a and b), rice husk (c and d)
and forestry residue (e and f) ................................................................................... 69
Figure 3-2 Photographs and SEM images of rice husk (a and b), bagasse (c and d) and
wheat straw (e and f) ................................................................................................ 72
Figure 3-3 Photograph of the ultra-high temperature up-draft reactor ........................... 75
Figure 3-4 Schematic diagram of the ultra-high temperature up-draft reactor ............... 76
Figure 3-5 Repeatability test results for the up-draft ultra-high temperature reactor ..... 79
Figure 3-6 Photograph of the ultra-high temperature down-draft reactor....................... 80
Figure 3-7 Schematic diagram of the ultra-high temperature down-draft catalytic
gasification reactor ................................................................................................... 81
Figure 3-8 Repeatability test results for down-draft ultra-high temperature reactor ...... 84
Figure 3-9 Schematic diagram of slow pyrolysis reactor................................................ 85
Figure 3-10 Schematic diagram of a gas chromatography system ................................. 86
Figure 3-11 A schematic diagram of thermogravimetric analyser [5] ............................ 88
Figure 3-12 Example graph of proximate analysis of biomass sample .......................... 89
Figure 3-13 Schematic diagram of a CHNS elemental analyser adapted from [6] ......... 90
Figure 3-14 TGA-TPO and DTG-TPO thermograms of different spent catalysts.......... 91
Figure 3-15 LEO 1530 scanning electron microscope .................................................... 92
Figure 3-16 Phillips CM200 transmission electron microscope ..................................... 93
Figure 3-17 Bruker D8 X-ray diffraction (XRD) analyser [8] ........................................ 95
Figure 4-1 Comparison of product yield and gas composition from slow and fast
pyrolysis of wood at 850 °C .................................................................................... 99
Figure 4-2 Comparison of product yield and gas composition from slow and fast
pyrolysis of rice husk at 850 °C ............................................................................. 100
Figure 4-3 SEM images of residual char from slow and fast pyrolysis at 850 °C. Slow
pyrolysis (a), and fast pyrolysis (b) of rice husk. Slow pyrolysis (c), and fast
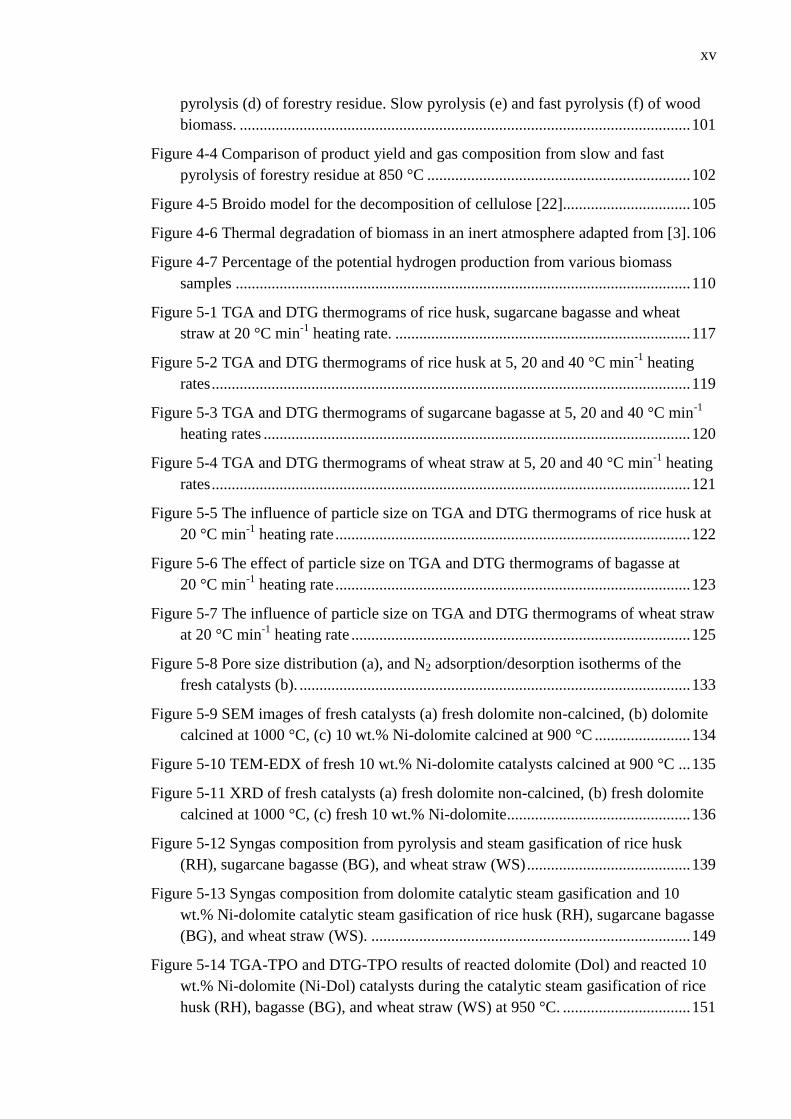
xv
pyrolysis (d) of forestry residue. Slow pyrolysis (e) and fast pyrolysis (f) of wood
biomass. ................................................................................................................. 101
Figure 4-4 Comparison of product yield and gas composition from slow and fast
pyrolysis of forestry residue at 850 °C .................................................................. 102
Figure 4-5 Broido model for the decomposition of cellulose [22]................................ 105
Figure 4-6 Thermal degradation of biomass in an inert atmosphere adapted from [3]. 106
Figure 4-7 Percentage of the potential hydrogen production from various biomass
samples .................................................................................................................. 110
Figure 5-1 TGA and DTG thermograms of rice husk, sugarcane bagasse and wheat
straw at 20 °C min-1
heating rate. .......................................................................... 117
Figure 5-2 TGA and DTG thermograms of rice husk at 5, 20 and 40 °C min-1
heating
rates ........................................................................................................................ 119
Figure 5-3 TGA and DTG thermograms of sugarcane bagasse at 5, 20 and 40 °C min-1
heating rates ........................................................................................................... 120
Figure 5-4 TGA and DTG thermograms of wheat straw at 5, 20 and 40 °C min-1
heating
rates ........................................................................................................................ 121
Figure 5-5 The influence of particle size on TGA and DTG thermograms of rice husk at
20 °C min-1
heating rate ......................................................................................... 122
Figure 5-6 The effect of particle size on TGA and DTG thermograms of bagasse at
20 °C min-1
heating rate ......................................................................................... 123
Figure 5-7 The influence of particle size on TGA and DTG thermograms of wheat straw
at 20 °C min-1
heating rate ..................................................................................... 125
Figure 5-8 Pore size distribution (a), and N2 adsorption/desorption isotherms of the
fresh catalysts (b). .................................................................................................. 133
Figure 5-9 SEM images of fresh catalysts (a) fresh dolomite non-calcined, (b) dolomite
calcined at 1000 °C, (c) 10 wt.% Ni-dolomite calcined at 900 °C ........................ 134
Figure 5-10 TEM-EDX of fresh 10 wt.% Ni-dolomite catalysts calcined at 900 °C ... 135
Figure 5-11 XRD of fresh catalysts (a) fresh dolomite non-calcined, (b) fresh dolomite
calcined at 1000 °C, (c) fresh 10 wt.% Ni-dolomite .............................................. 136
Figure 5-12 Syngas composition from pyrolysis and steam gasification of rice husk
(RH), sugarcane bagasse (BG), and wheat straw (WS) ......................................... 139
Figure 5-13 Syngas composition from dolomite catalytic steam gasification and 10
wt.% Ni-dolomite catalytic steam gasification of rice husk (RH), sugarcane bagasse
(BG), and wheat straw (WS). ................................................................................ 149
Figure 5-14 TGA-TPO and DTG-TPO results of reacted dolomite (Dol) and reacted 10
wt.% Ni-dolomite (Ni-Dol) catalysts during the catalytic steam gasification of rice
husk (RH), bagasse (BG), and wheat straw (WS) at 950 °C. ................................ 151
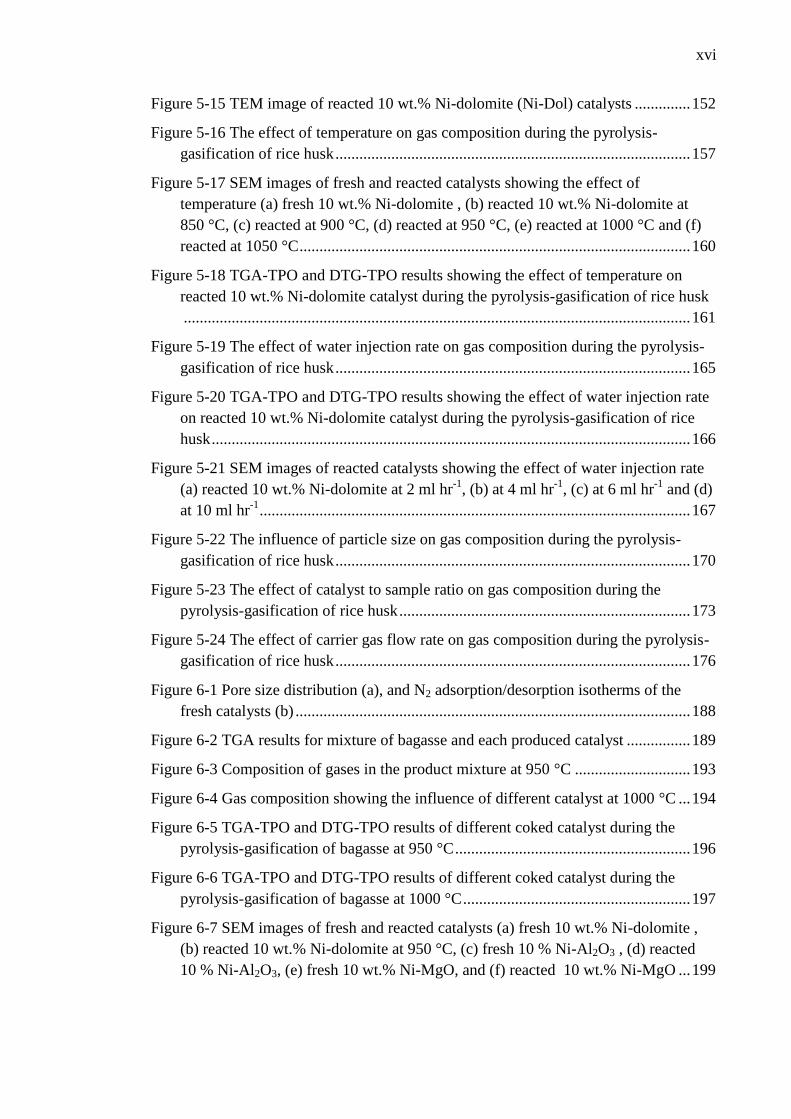
xvi
Figure 5-15 TEM image of reacted 10 wt.% Ni-dolomite (Ni-Dol) catalysts .............. 152
Figure 5-16 The effect of temperature on gas composition during the pyrolysis-
gasification of rice husk ......................................................................................... 157
Figure 5-17 SEM images of fresh and reacted catalysts showing the effect of
temperature (a) fresh 10 wt.% Ni-dolomite , (b) reacted 10 wt.% Ni-dolomite at
850 °C, (c) reacted at 900 °C, (d) reacted at 950 °C, (e) reacted at 1000 °C and (f)
reacted at 1050 °C .................................................................................................. 160
Figure 5-18 TGA-TPO and DTG-TPO results showing the effect of temperature on
reacted 10 wt.% Ni-dolomite catalyst during the pyrolysis-gasification of rice husk
............................................................................................................................... 161
Figure 5-19 The effect of water injection rate on gas composition during the pyrolysis-
gasification of rice husk ......................................................................................... 165
Figure 5-20 TGA-TPO and DTG-TPO results showing the effect of water injection rate
on reacted 10 wt.% Ni-dolomite catalyst during the pyrolysis-gasification of rice
husk ........................................................................................................................ 166
Figure 5-21 SEM images of reacted catalysts showing the effect of water injection rate
(a) reacted 10 wt.% Ni-dolomite at 2 ml hr-1
, (b) at 4 ml hr-1
, (c) at 6 ml hr-1
and (d)
at 10 ml hr-1
............................................................................................................ 167
Figure 5-22 The influence of particle size on gas composition during the pyrolysis-
gasification of rice husk ......................................................................................... 170
Figure 5-23 The effect of catalyst to sample ratio on gas composition during the
pyrolysis-gasification of rice husk ......................................................................... 173
Figure 5-24 The effect of carrier gas flow rate on gas composition during the pyrolysis-
gasification of rice husk ......................................................................................... 176
Figure 6-1 Pore size distribution (a), and N2 adsorption/desorption isotherms of the
fresh catalysts (b) ................................................................................................... 188
Figure 6-2 TGA results for mixture of bagasse and each produced catalyst ................ 189
Figure 6-3 Composition of gases in the product mixture at 950 °C ............................. 193
Figure 6-4 Gas composition showing the influence of different catalyst at 1000 °C ... 194
Figure 6-5 TGA-TPO and DTG-TPO results of different coked catalyst during the
pyrolysis-gasification of bagasse at 950 °C ........................................................... 196
Figure 6-6 TGA-TPO and DTG-TPO results of different coked catalyst during the
pyrolysis-gasification of bagasse at 1000 °C ......................................................... 197
Figure 6-7 SEM images of fresh and reacted catalysts (a) fresh 10 wt.% Ni-dolomite ,
(b) reacted 10 wt.% Ni-dolomite at 950 °C, (c) fresh 10 % Ni-Al2O3 , (d) reacted
10 % Ni-Al2O3, (e) fresh 10 wt.% Ni-MgO, and (f) reacted 10 wt.% Ni-MgO ... 199
xvii
Figure 6-8 SEM images of fresh and reacted catalysts (a) fresh 10 wt.%Ni-SiO2 , (b)
reacted 10 wt.% Ni- SiO2 at 950 °C, (c) fresh 2 % Ce -10 % Ni-dolomite , (d)
reacted 2 % Ce - 10 % Ni-dolomite, (e) fresh 5 % Ce - 10 wt.% Ni-dolomite and (f)
reacted 5 % Ce - 10 wt.% Ni-dolomite ................................................................. 200
Figure 6-9 SEM of fresh and reacted catalysts (a) fresh 10 % Ce - 10wt.%Ni-dolomite
and (b) reacted 10 % Ce - 10wt.%Ni-dolomite ..................................................... 201
Figure 6-10 The influence of gasification temperature on gas composition during the
pyrolysis-gasification of sugarcane bagasse .......................................................... 204
Figure 6-11 TGA-TPO and DTG-TPO results showing the effect of temperature on
reacted 10 wt.%Ni-Al2O3 catalyst during the pyrolysis-gasification of sugarcane
bagasse ................................................................................................................... 206
Figure 6-12 SEM images of reacted 10 % Ni-Al2O3 catalysts reacted at different
temperatures (a) at 800 °C, (b) at 850 °C, (c) at 900 °C, (d) at 950 °C, (e) at
1000 °C, and (f) at 1050 °C ................................................................................... 207
Figure 6-13 The influence of Ni loading on gas composition during the pyrolysis-
gasification of bagasse ........................................................................................... 210
Figure 6-14 The influence of Ni-loading on surface area of fresh and reacted catalysts
............................................................................................................................... 211
Figure 6-15 TGA-TPO and DTG-TPO results showing the effect of Ni-loading on
reacted Ni-alumina catalyst during the pyrolysis-gasification of bagasse ............. 212
Figure 6-16 SEM images of fresh and reacted catalysts (a) fresh 5 wt.% Ni-Al2O3 , (b)
reacted 5 wt.% Ni-Al2O3, (c) fresh 20 wt.% Ni-Al2O3 , (d) reacted 20 wt.% Ni-
Al2O3, (e) fresh 40 wt.% Ni-Al2O3 and (f) reacted 40 wt.% Ni-Al2O3 .................. 213
Figure 6-17 The influence of water injection rate on gas composition ........................ 216
Figure 6-18 TGA-TPO and DTG-TPO results showing the effect of water injection rate
on reacted 10 wt.% Ni-Al2O3 catalyst during the pyrolysis-gasification of sugarcane
bagasse ................................................................................................................... 217
Figure 6-19 Pore size distribution (a), and N2 adsorption/desorption isotherms of the
fresh catalysts (b) ................................................................................................... 218
Figure 6-20 The influence of calcination temperature on gas composition .................. 221
Figure 6-21 The influence of calcination temperature on surface area of fresh and
reacted catalysts ..................................................................................................... 222
Figure 6-22 The influence of catalyst to sample ratio on gas composition .................. 225
Figure 7-1 TGA and DTG thermograms of rice husk, sugarcane bagasse and wheat
straw char at 25 °C min-1
....................................................................................... 233
Figure 7-2 Composition of gases in the product mixture (nitrogen free) from
gasification of sugarcane bagasse char using different catalysts ........................... 237

xviii
Figure 7-3 The influence of temperature on gas composition during steam gasification
of sugarcane bagasse char ...................................................................................... 241
Figure 7-4 The influence of water injection rate on gas composition during gasification
of sugarcane bagasse char ...................................................................................... 244
xix
ABBREVIATIONS
BET
Brauner, Emmett and Teller
BJH
Barrett, Joyner and Halenda
CHNS
Carbon, Hydrogen, Nitrogen and Sulphur
CHP
Combined heat and power
DTG
Derivative thermogravimetry
EDXS
Energy dispersive X-ray spectrometry
EIA
Energy Information Administration
GC-FID
Gas chromatography with flame ionization detector
GC-TCD
Gas chromatography with thermal conductivity detector
IEA
International Energy Agency
IGCC
Integrated gasification combined cycle
PEM
Proton exchange membrane
SEM
Scanning electron microscopy
SMR
Steam methane reforming reaction
SNG
Substitute natural gas
SOEC
Solid oxide electrolysis cell
TEM
Transmission electron microscopy
TGA
Thermogravimetric analysis
TPO
Temperature programmed oxidation
XRD
X-ray diffraction
XRF
X-ray fluorescence
xx
NOMENCLATURE
A
Exponential factor
C/S
Catalyst to sample ratio
daf
Dry ash-free basis
db
Dry basis
Ea
Activation energy
EJ
1018
J
FC
Fuel conversion
Gb
Billion barrels (of oil)
mchar
Mass of char
mfuel
Mass of biomass fuel
Mtoe
Million tonnes of oil equivalent
n
order of reaction
P
Absolute pressure
P°
Standard state pressure
PAH
Polycyclic aromatic hydrocarbons
PS
Particle size
R2
Correlation coefficient
R
Universal gas constant
SBR
Steam to biomass ratio
T
Temperature
VM
Volatile matter
1
CHAPTER 1 INTRODUCTION
Energy is important for everyone’s life. Energy is required to carry out a range of
activities in our daily life. It is also required to keep our homes warm and to provide us
hot water. It is the energy which runs our industries and transportation systems.
Without the use of energy, it wouldn’t be possible for us to achieve the present level of
industrial, economic and military growth.
1.1 World energy demand and resources
In the new global economy, energy has become a central issue. Most of the world
economies are dependent on fossil fuels to meet their energy demands. Fossil fuels
constitute oil, gas and coal. Currently almost 80 % of world energy demand is met by
fossil fuels (Figure 1-1). In 2010, among these fossil fuels, oil is adding a massive 32.4
% towards total world energy supply.
Figure 1-1 World total primary energy supply by fuels in 2010 [1]
2
According to the International Energy Agency (IEA) total world energy usage in 2007
was 12029 Million tonnes of oil equivalent (Mtoe) which is equivalent to 477.3
quadrillion Btu. A similar figure of 12483.41 Mtoe (495 Quadrillion Btu) is presented
by US Energy Information Administration (EIA) for year 2007 [2]. For year 2010, a
higher energy usage of 12717 Mtoe was reported by IEA [1]. EIA also projected the
total world energy consumption till 2035, which comes out to be 18636.85 Mtoe (739
quadrillion Btu) per year in 2035. In their report, it is estimated that around one third of
this total energy will come from oils. This shows that world energy demands heavily
relies on the oil supply. It is well known that fossil fuels are non-renewable in nature.
This non-renewable nature poses two big problems for our world. Firstly, sooner or later
all the fossil fuels will be consumed. Secondly, combustion of fossil fuels releases huge
quantities of carbon dioxide in our environment (just over 30,000 Million tonnes of CO2
for year 2010) [1]. This extra carbon dioxide is creating an imbalance in nature’s cycle
and causing global warming.
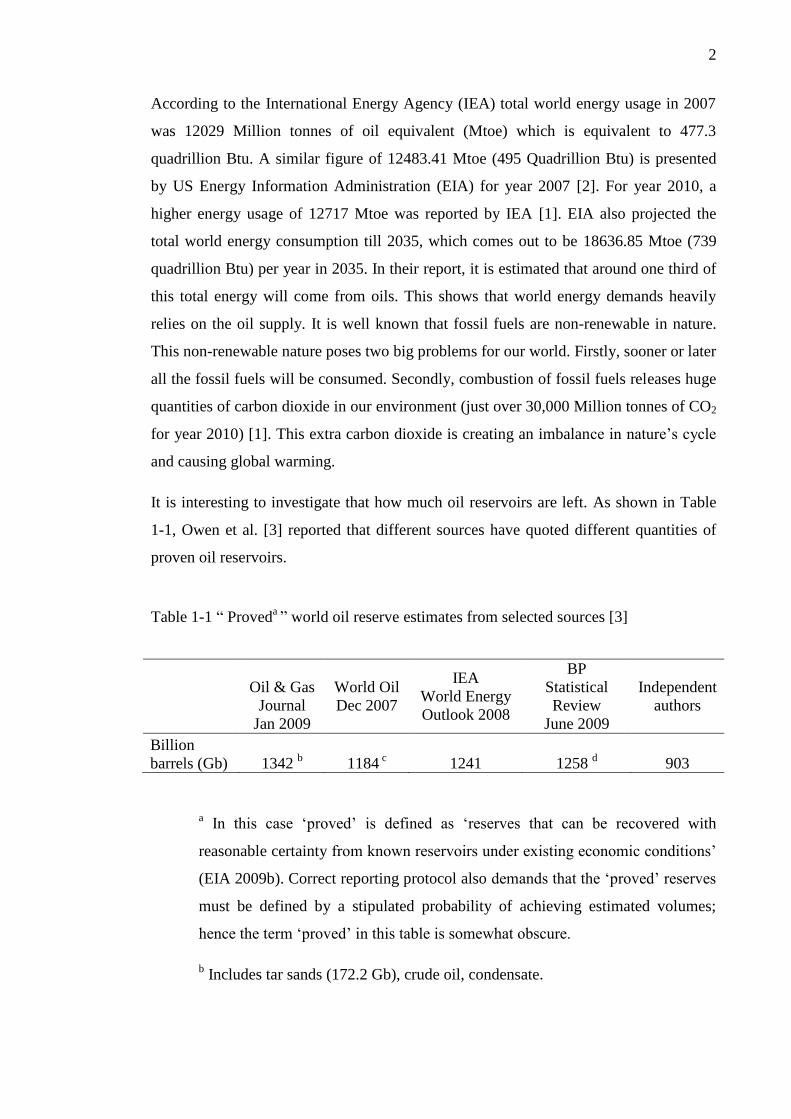
It is interesting to investigate that how much oil reservoirs are left. As shown in Table
1-1, Owen et al. [3] reported that different sources have quoted different quantities of
proven oil reservoirs.
Table 1-1 “ Proveda ” world oil reserve estimates from selected sources [3]
Oil & Gas
Journal
Jan 2009
World Oil
Dec 2007
IEA
World Energy
Outlook 2008
BP
Statistical
Review
June 2009
Independent
authors
Billion
barrels (Gb) 1342 b 1184
c 1241 1258
d 903
a In this case ‘proved’ is defined as ‘reserves that can be recovered with
reasonable certainty from known reservoirs under existing economic conditions’
(EIA 2009b). Correct reporting protocol also demands that the ‘proved’ reserves
must be defined by a stipulated probability of achieving estimated volumes;
hence the term ‘proved’ in this table is somewhat obscure.
b Includes tar sands (172.2 Gb), crude oil, condensate.
3
c Includes tar sands (4.9 Gb), crude oil, gas condensate and natural gas liquids.
d BPSR figure includes tar sands (22 Gb), crude oil, gas condensate, natural gas
liquids.
The highest figure in the table above (1342 Gb) translates into 196708.36 Mtoe (7800
Quadrillion Btu). If we assume an average annual energy consumption of 15131.41
Mtoe (600 Quadrillion Btu) for next few decades [1], and one third contribution of oil
towards the total world energy supply, then the present oil reserves will last only for the
next 39 years. This figure of 39 years closely resembles the findings given by Shafiee et
al. [4]. In the light of their calculations, they suggested the life of another 35 years for
current oil reserves [4]. As the oil is contributing almost one third towards the world
total energy and it is available only for the next few decades, this indicates the need to
find the alternate energy sources which can replace the oils and guarantee the
sustainable growth in the future.
1.2 Biomass and organic waste
Ever increasing energy demands, emission of large quantities of greenhouse gases and
uncertainty about the supplies of fossil fuels in the future, are the major concerns of
today’s world economies. These factors will make it difficult for most of the nations to
cope with their energy requirements. There is an utmost need to explore the alternative
sources of energy which must be cheap, renewable and environment friendly. Biomass
is one of the major components in the world’s energy system. It plays a very important
role in the energy ecosystem of developing nations, accounting for approximately 38 %
of total primary energy supply [5].
Biomass mainly consists of organic matter from living organisms like plants and
animals. Global annual production of biomass is 220 billion tonnes by photosynthesis
[6]. Cellulose, hemicelluloses and lignin are the main components of biomass. It is
renewable in nature and in principle it does not add carbon dioxide to the atmosphere. It
is cheap and readily available in various forms like energy crops, forestry waste,
agricultural waste, organic food waste, sewage sludge and animal manure. Biomass has
the potential to replace conventional fossil fuels with reduction in greenhouse gases
emission.
4
The use of organic waste has double advantages. Not only it eliminates the
environmental pollution but also it can provide clean energy and saves foreign exchange
which otherwise would have spent on fossil fuel purchase. Waste food, organic waste
from food processing plants and waste edible oil are amongst the promising and
sustainable sources of biomass. Different countries around the world have exploited the
locally available biomass resources and saved millions of dollars. Malaysia is one of the
major producers of palm oil in the world. It provides more than 40 % of the world palm
oil supplies. They have generated millions of tonnes of biomass from palm oil
production which mainly consist of palm oil fibre, palm oil shell and palm oil empty
fruit bunch. Similarly sugarcane producing countries have a huge potential of using
bagasse. It is rich in starch and can be used for the production of energy. Animal dung is
also a potential renewable source for energy production. Non-edible oils like castor oil
are important for the production of biodiesel. Crops residue materials like cotton &
wheat straws, rice husk and corn stalks are potential biomass sources for many
agricultural developing nations.
Biomass can be used in various ways to produce renewable energy. Different processes
can be used to extract energy from biomass depending upon the nature of the desired
end product. Different forms of biomass like energy crops, residues from forest &
crops, by products from industries and organic waste can be employed as starting
material. Before conversion to energy, issues related to transportation, storage and pre-
treatment of biomass must be addressed. A systematic approach is required to enhance
the overall efficiency of conversion process.
Conversion processes can be broadly categorized as thermochemical, physicochemical
and biochemical. The nature of output product mainly depends on the process employed
and hence the operating parameters of that process. Solid, liquid and gaseous fuels can
be produced from these processes. Thermochemical processes like pyrolysis and
gasification can be used to produce solid, liquid or gaseous products. Flexibility to
produce solid, liquid and gaseous fuels is a very important advantage of thermochemical
conversion processes over the others. Liquid oils can be directly extracted from the seed
of some plants like Jatropha (Jatropha curcas) using physical methods like pressing or
extraction. In biochemical processes, different microorganisms are used to convert the
raw feedstock into the useful products like ethanol or biogas. Fermentation and
anaerobic digestion are the most popular biochemical methods used to produce liquid
5
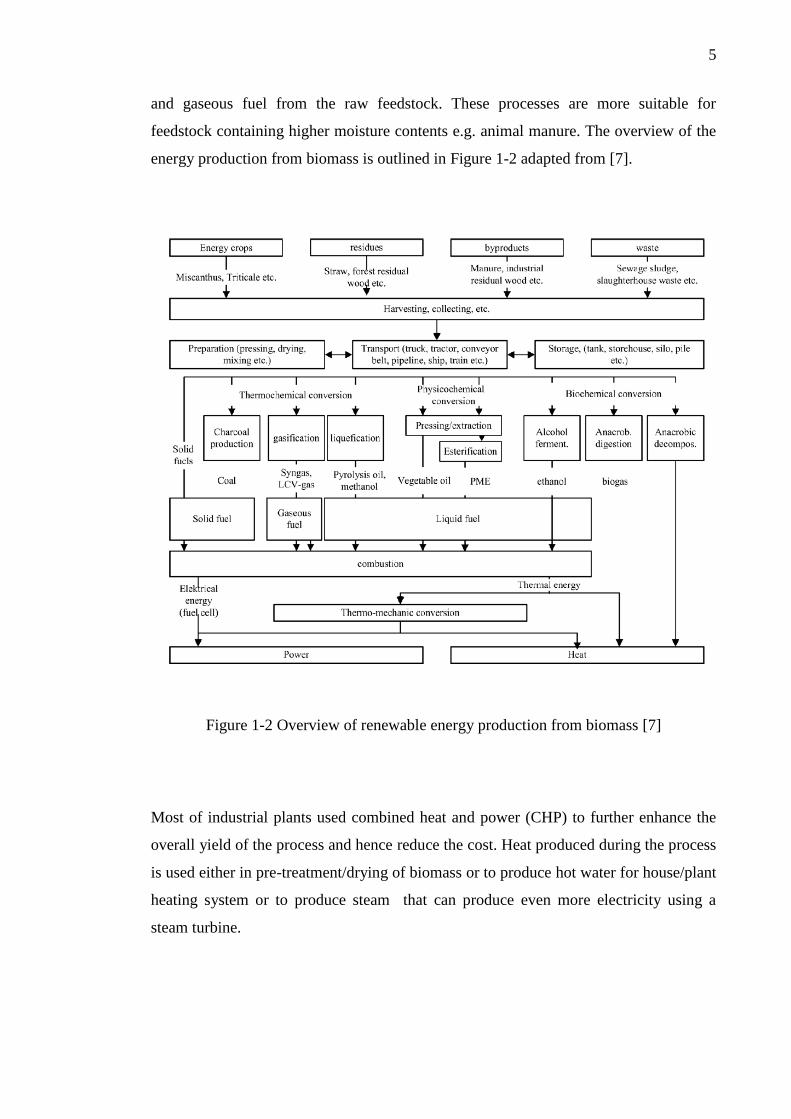
and gaseous fuel from the raw feedstock. These processes are more suitable for
feedstock containing higher moisture contents e.g. animal manure. The overview of the
energy production from biomass is outlined in Figure 1-2 adapted from [7].
Figure 1-2 Overview of renewable energy production from biomass [7]
Most of industrial plants used combined heat and power (CHP) to further enhance the
overall yield of the process and hence reduce the cost. Heat produced during the process
is used either in pre-treatment/drying of biomass or to produce hot water for house/plant
heating system or to produce steam that can produce even more electricity using a
steam turbine.
6
1.3 Hydrogen
Hydrogen is the simplest of all the elements known. It has a potential to be a future fuel.
It is abundantly available in our universe. Hydrogen is the cleanest fuel. It has the
maximum energy per unit mass (142.31 kJ g-1
) and it does not produce any of the
greenhouse gases on combustion. The only exhaust from the combustion of hydrogen is
water.
1.3.1 Hydrogen economy
The phrase hydrogen economy was first time used by the Australian chemist John
Bockris in the early 1970s [8]. The main idea of the hydrogen economy is to produce
significant amount of energy using hydrogen as a fuel with the consequent reduction in
greenhouse emissions. During the initial stages, fossil fuels along with nuclear energy
will play a major role in the energy market. With the advancements in hydrogen
production, storage and transportation technologies, eventually hydrogen will replace
fossil fuels.
The main drivers of hydrogen economy are
Reduction in greenhouse gases emissions
Energy security against fossil fuel depletion
Good local air quality
Reduction in noise pollution in cosmopolitan cities
International competitiveness and geo-political dominance
Hydrogen economy has its own benefits over the finite sources of fossil fuel but the cost
of fuel cells and absence of sufficient refuelling infrastructure are the major challenges
that must be overcome to make this dream come true. In order to make a fast and quick
transition from fossil fuels to hydrogen economy, vital support is required from
governments in terms of funding and policy making. Funds are required for
infrastructure development and demonstration projects. Policies like tax credits &
subsidies to encourage hydrogen use and carbon tax to discourage the use of fossil fuels
are very essential. It is suggested in some studies [9] that the technological barriers in
implementing hydrogen economy are already overcome or are readily solvable if
governments support is available. Since governments in many countries around the
7
world are supporting R&D for hydrogen production, storage and transportation,
prospects of hydrogen economy are promising.
1.3.2 Hydrogen production
The current world demand of hydrogen is above 50 million metric tonnes per year [8]. It
is mainly used in ammonia fertilizer, chemical industries and refineries. Due to the use
of hydrogen as the cleanest fuel, its demand is expected to rise heavily in the next few
years. The following are the main methods used to produce hydrogen.
Steam methane reforming (SMR) of natural gas
Coal gasification
Biomass gasification
Electrolysis (Direct/Wind/Solar)
Nuclear thermochemical
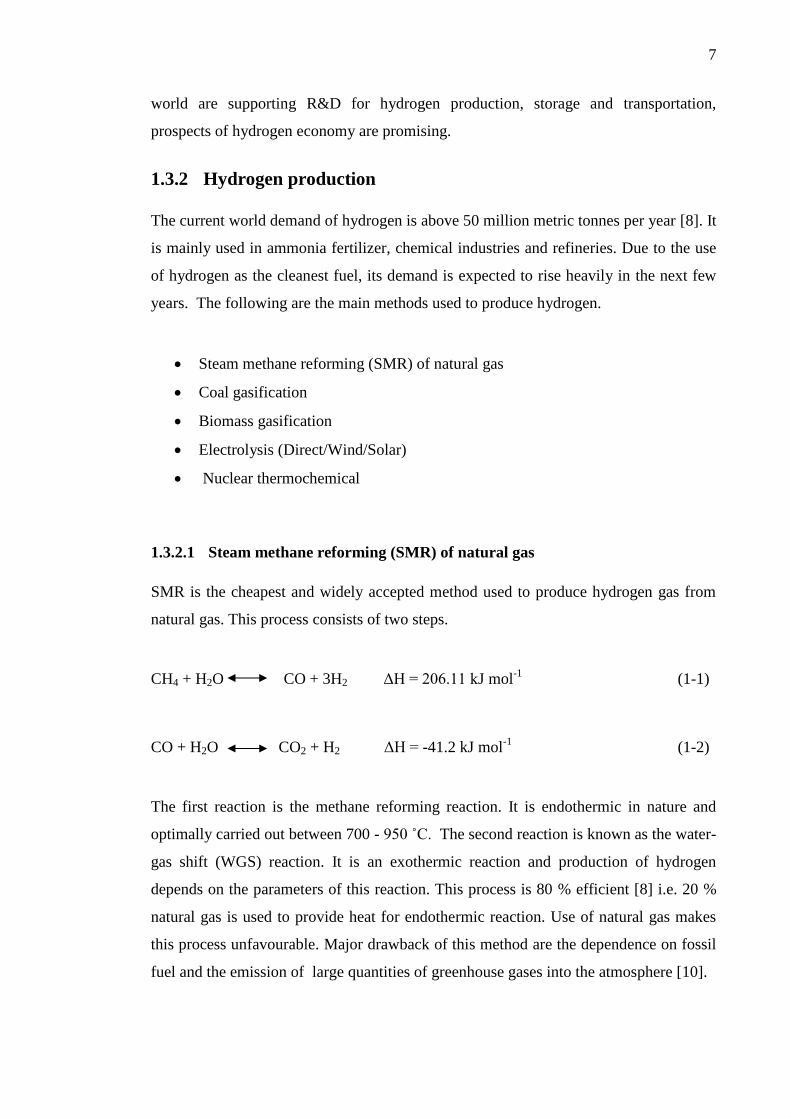
1.3.2.1 Steam methane reforming (SMR) of natural gas
SMR is the cheapest and widely accepted method used to produce hydrogen gas from
natural gas. This process consists of two steps.
CH4 + H2O CO + 3H2 ΔH = 206.11 kJ mol-1
(1-1)
CO + H2O CO2 + H2 ΔH = -41.2 kJ mol-1
(1-2)
The first reaction is the methane reforming reaction. It is endothermic in nature and
optimally carried out between 700 - 950 ˚C. The second reaction is known as the water-
gas shift (WGS) reaction. It is an exothermic reaction and production of hydrogen
depends on the parameters of this reaction. This process is 80 % efficient [8] i.e. 20 %
natural gas is used to provide heat for endothermic reaction. Use of natural gas makes
this process unfavourable. Major drawback of this method are the dependence on fossil
fuel and the emission of large quantities of greenhouse gases into the atmosphere [10].
8
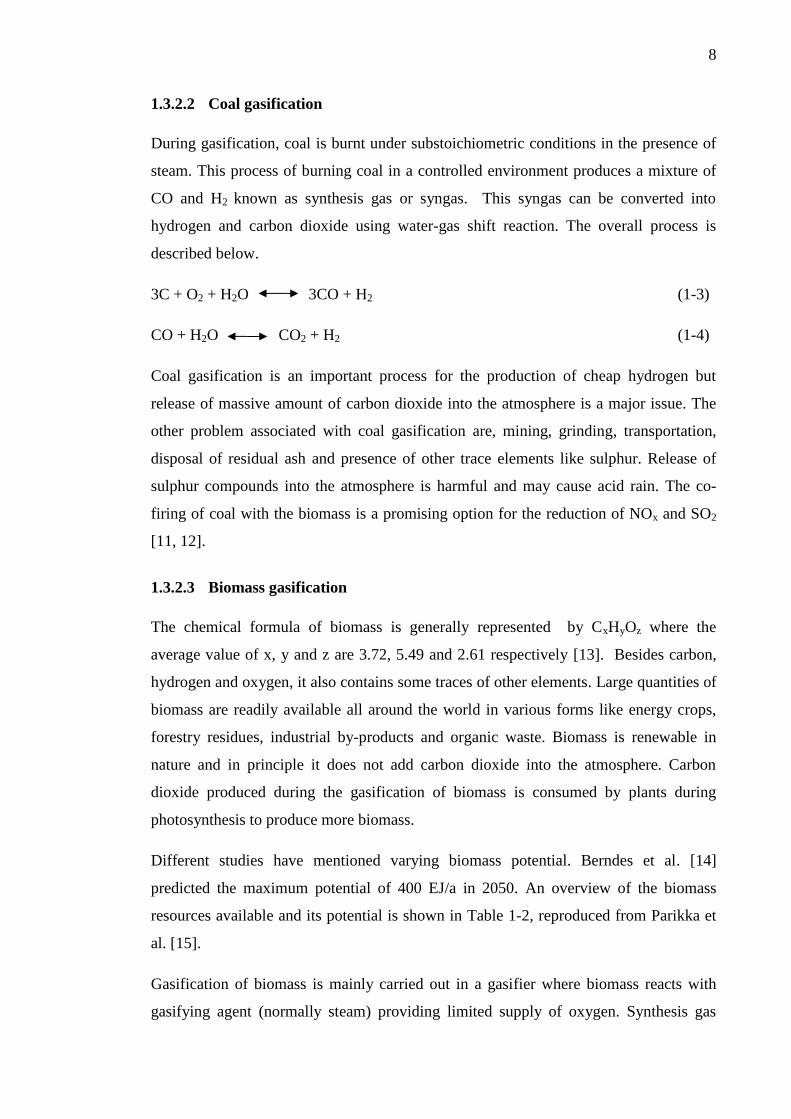
1.3.2.2 Coal gasification
During gasification, coal is burnt under substoichiometric conditions in the presence of
steam. This process of burning coal in a controlled environment produces a mixture of
CO and H2 known as synthesis gas or syngas. This syngas can be converted into
hydrogen and carbon dioxide using water-gas shift reaction. The overall process is
described below.
3C + O2 + H2O 3CO + H2 (1-3)
CO + H2O CO2 + H2 (1-4)
Coal gasification is an important process for the production of cheap hydrogen but
release of massive amount of carbon dioxide into the atmosphere is a major issue. The
other problem associated with coal gasification are, mining, grinding, transportation,
disposal of residual ash and presence of other trace elements like sulphur. Release of
sulphur compounds into the atmosphere is harmful and may cause acid rain. The co-
firing of coal with the biomass is a promising option for the reduction of NOx and SO2
[11, 12].
1.3.2.3 Biomass gasification
The chemical formula of biomass is generally represented by CxHyOz where the
average value of x, y and z are 3.72, 5.49 and 2.61 respectively [13]. Besides carbon,
hydrogen and oxygen, it also contains some traces of other elements. Large quantities of
biomass are readily available all around the world in various forms like energy crops,
forestry residues, industrial by-products and organic waste. Biomass is renewable in
nature and in principle it does not add carbon dioxide into the atmosphere. Carbon
dioxide produced during the gasification of biomass is consumed by plants during
photosynthesis to produce more biomass.
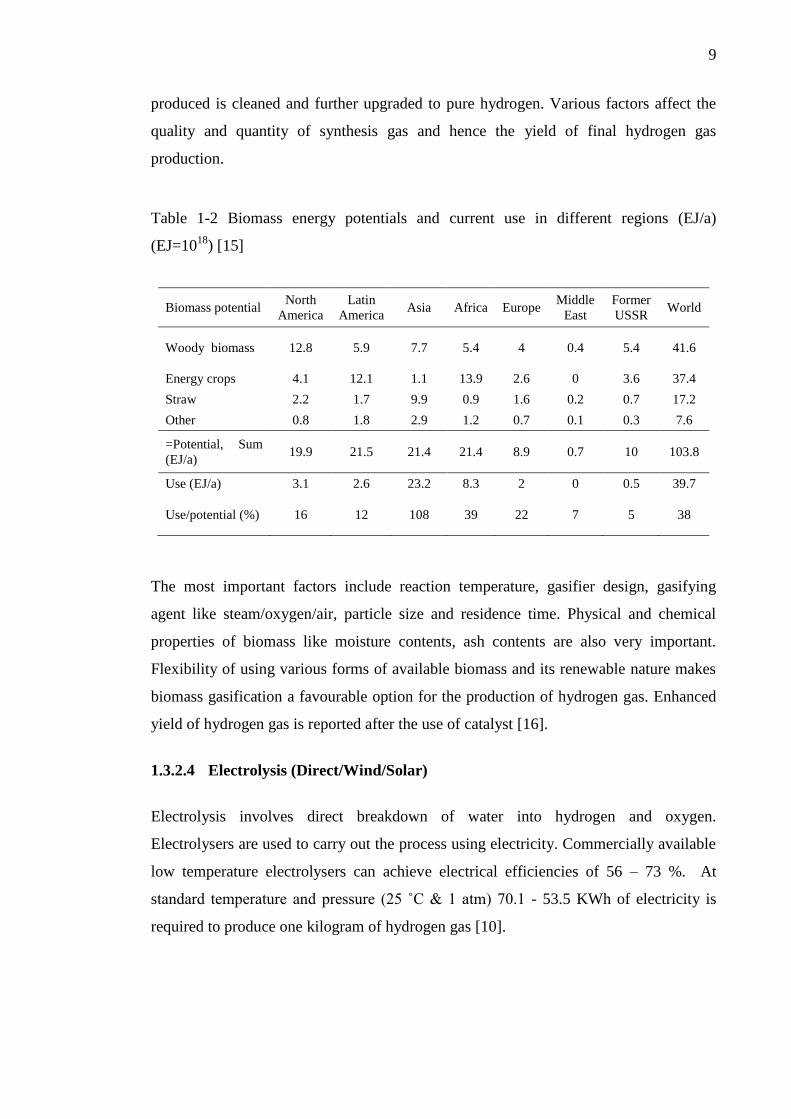
Different studies have mentioned varying biomass potential. Berndes et al. [14]
predicted the maximum potential of 400 EJ/a in 2050. An overview of the biomass
resources available and its potential is shown in Table 1-2, reproduced from Parikka et
al. [15].
Gasification of biomass is mainly carried out in a gasifier where biomass reacts with
gasifying agent (normally steam) providing limited supply of oxygen. Synthesis gas
9
produced is cleaned and further upgraded to pure hydrogen. Various factors affect the
quality and quantity of synthesis gas and hence the yield of final hydrogen gas
production.
Table 1-2 Biomass energy potentials and current use in different regions (EJ/a)
(EJ=1018
) [15]
Biomass potential North
America
Latin
America Asia Africa Europe
Middle
East
Former
USSR World
Woody biomass 12.8 5.9 7.7 5.4 4 0.4 5.4 41.6
Energy crops 4.1 12.1 1.1 13.9 2.6 0 3.6 37.4
Straw 2.2 1.7 9.9 0.9 1.6 0.2 0.7 17.2
Other 0.8 1.8 2.9 1.2 0.7 0.1 0.3 7.6
=Potential, Sum
(EJ/a) 19.9 21.5 21.4 21.4 8.9 0.7 10 103.8
Use (EJ/a) 3.1 2.6 23.2 8.3 2 0 0.5 39.7
Use/potential (%) 16 12 108 39 22 7 5 38
The most important factors include reaction temperature, gasifier design, gasifying
agent like steam/oxygen/air, particle size and residence time. Physical and chemical
properties of biomass like moisture contents, ash contents are also very important.
Flexibility of using various forms of available biomass and its renewable nature makes
biomass gasification a favourable option for the production of hydrogen gas. Enhanced
yield of hydrogen gas is reported after the use of catalyst [16].
1.3.2.4 Electrolysis (Direct/Wind/Solar)
Electrolysis involves direct breakdown of water into hydrogen and oxygen.
Electrolysers are used to carry out the process using electricity. Commercially available
low temperature electrolysers can achieve electrical efficiencies of 56 – 73 %. At
standard temperature and pressure (25 ˚C & 1 atm) 70.1 - 53.5 KWh of electricity is
required to produce one kilogram of hydrogen gas [10].
10
Different technologies are used for electrolysis. Most common technologies include
alkaline electrolyser, proton exchange membrane (PEM) and solid oxide electrolysis
cell (SOEC). All technologies have their own advantages and disadvantages in terms of
cost, maintenance and efficiencies.
Net carbon dioxide emission from electrolytic hydrogen depends on the source of
electricity used in electrolysis. If electricity was produced using fossil fuels, it will not
only result in more carbon dioxide emission but will also make the whole process
uneconomical. It is suggested that the combined electricity production from wind or
solar energy with electrolysis to make the process economic and environment friendly
but added cost and non-uniform distribution of solar & wind energy resources reduces
the prospects of this technology to become first choice of hydrogen production.
1.3.2.5 Nuclear thermochemical
Direct heat can be used to split water into hydrogen and oxygen. But it is well
established that it requires a very high temperature of ~ 2500 ˚C. The availability of
materials which can withstand such high temperature and sources required to achieve
this high temperature are very rare. These two major barriers limit the wide range
adaptation of the process.
However energy released during atomic fission in a nuclear reaction can be used to
carry out direct thermolysis of water molecules. As the nuclear technology is available
only in a few countries, this process cannot be adopted worldwide. Despite of all these
limitations, nuclear thermolysis cannot be regarded as a green technology. Drilling,
processing and refining of nuclear fuel also results in carbon dioxide emission.
Furthermore, disposal of nuclear waste is a risky and hazardous process.
Due to the greenhouse gases emissions and inherited limitations of different hydrogen
production technologies, hydrogen production form biomass is a promising option for
the sustainable economic growth of the world.
11
1.4 Energy from biomass
1.4.1 Biological methods
Energy can be produced from biomass and organic waste using microorganisms.
Fermentation and anaerobic digestion are two important biological methods that can be
used for energy production.
1.4.1.1 Fermentative hydrogen production
Bacteria species such as Enterobactor, Bacillus and Clostridium can produce hydrogen
gas using enzymes on organic substrate. Dark fermentation bacteria do not require light
to produce hydrogen while photo fermentation bacteria need light to carry out the
process.
First step is hydrolysis of biomass/organic waste into carbohydrates using enzymes.
These carbohydrates are used by dark fermentation bacteria to produce fatty acids and
hydrogen gas. Light fermentation bacteria can use this fatty acid substrate to produce
more hydrogen gas. This combination of dark and light fermentation has improved the
overall yield of the process [17]. Overall low yield and large surface area required are
the major limitation of the process.
1.4.1.2 Anaerobic digestion
Some bacteria in the absence of oxygen can produce combustible gas from organic
substrate using enzymes. This is relatively an old process, largely used for the
production of biogas from animal manure. Biogas is a mixture of methane and carbon
dioxide. This process is feasible for agricultural places where agricultural waste/ animal
manure is readily available on regular basis. Gas produced from the process can be used
for combustion or upgraded for other applications. Slow reaction time, large digester
size and feedstock availability are the major issues for the large scale application of this
process.
12
1.4.2 Thermochemical methods
Energy can be generated from biomass using various thermochemical methods.
Biomass is heated in the presence/absence of oxygen (depending on the process) to
produce heat. This heat can be used for heating, cooking and for the production of
electricity.
1.4.2.1 Combustion
Combustion is one of the oldest methods to generate heat from biomass. Biomass is
burnt in open atmosphere in the presence of excess amount of oxygen to produce carbon
dioxide, water and heat. Heat generated from combustion of biomass can be used in
various ways especially for electricity generation. A maximum temperature of 1000 ˚C
can be achieved during combustion [18]. Combustion is feasible for the biomass with
less than 50 % moisture contents. Pre-treatment of biomass i.e. drying cutting, chopping
and emission of carbon dioxide in large quantities into the atmosphere makes process
unfavourable.
1.4.2.2 Pyrolysis
Pyrolysis is the process of conversion of biomass and waste materials into useful liquid,
gaseous fuels and char. The process is carried out in the absence of oxygen. Thermal
breakdown of biomass produces varying proportion of char, liquid oils and gaseous
fuel, depending on the process conditions. Pyrolysis starts around 300 - 350 ˚C and it
goes up to 700 ˚C. This process is more favourable for the production of solid char and
liquid oils as compared to gaseous fuels. Different parameters like temperature, particle
size, heating rate, reactor design, swap gas flow rate, reaction time and chemical
composition of feedstock determine the yield of entire process.
Depending upon the heating rate pyrolysis can be categorized into slow, fast or flash
pyrolysis.
Slow pyrolysis
During slow pyrolysis, heating rate varies from 5 - 7 ˚C min-1
. This slow heating rate
produces more solid char and lesser amounts of liquid oils and gaseous fuels. Output of
the process varies with the increase in reaction temperature. Increasing temperature
13
produces more oils up to 550 - 600 ˚C and less char. Further increase in temperature
favours the gas yield and a decrease in oil and char yield is observed [19].
Fast pyrolysis
A higher heating rate of around 300 ˚C min-1
is used in fast pyrolysis. It favours
production of more oils and less char. Fast pyrolysis is more successful with fluidized
bed reactor in producing more oil yield.
Flash pyrolysis
Flash pyrolysis employs very high heating rates ( > 100 ˚C s-1
) and reaction time is only
few seconds or even less. Entrained flow and fluidized bed reactors are more common
in flash pyrolysis. Due to high heating rate and low reaction time, particle size is an
important factor. Particle size from 105 - 250 µm is favourable for flash pyrolysis. Oil
yield increases in flash pyrolysis but gas yield also increases during the process.
Oil produced during pyrolysis cannot be used directly as transportation fuel, because it
contains water and oxygen contents in large proportions. This pyrolysis oil must be
upgraded before it can be used as a transportation fuel. Pyrolysis oil mainly consists of
acids, aldehydes, ketones, esters, phenols, furans, sugars and various nitrogen and
oxygenated compounds. This oil can be used as a fuel in petrol and diesel engines after
up gradation. It can also be used to produce syngas which can be used to produce a
variety of industrial chemicals. It can also be used as combustion fuel and for the
production of electricity. Char produced during the pyrolysis can be used to produce
activated carbon or carbon nanotubes, as a solid fuel in boilers. Char can also be used as
a feedstock in gasification to produce syngas.
Pyrolysis is more favourable for oil production from organic materials but gasification
is more feasible for the production of gaseous fuel which can be further upgraded to
produce pure hydrogen gas.
1.4.2.3 Gasification
Gasification is the process of conversion of biomass or organic waste feedstock into a
combustible gas. This process is carried out at substoichiometric conditions typically at
temperature varying from 500 - 850 ˚C. Combustible gas produced is called synthesis
gas, commonly known as syngas. Syngas is a mixture of various gases. It comprises of
14
carbon monoxide, hydrogen, methane, carbon dioxide in varying proportion, depending
on the process conditions.
Overall yield of the process depend on the following parameters.
Reaction temperature
Particle size
Residence time
Heating rate
Catalyst
Reactor design
Steam to biomass ratio
Gasifying agent such as air/steam/oxygen
Reaction temperature is the most influencing of all the parameters. Increase in reaction
temperature evidenced increase in gas yield. Particle size and residence time are also
important reaction parameters which are discussed in detail in the next chapter. Use of
various catalysts also enhances the overall yield of the process.
Use of air as gasifying agent produces a syngas with lower heating contents due to
higher percentage of nitrogen in air. Whereas use of oxygen produces syngas with
higher heating value but cost associated with pure oxygen does not make the process
economically viable. Steam gasification is the most favourable option for production of
hydrogen. Steam reacts with different volatiles during the gasification process and
contributes considerably to the overall hydrogen yield.
The process of gasification is flexible as it accepts a wide variety of input feedstock.
Synthesis gas produced during the process can be used in a variety of applications
ranging from transportation fuels to hydrogen gas for fuel cells.
15
1.5 Chapter references
[1] I. E. Agency, "Key World Energy statistics," ed: International Energy Agency,
9, rue de federation, 75739 Paris Cedex 15 - France, 2012, p. 82.
[2] H. Gruenspecht, "International energy Outlook 2010 with projections to 2035,"
C. f. S. a. I. Studies, Ed., ed. Washington DC: US Energy Information
Administration, 2010, p. 21.
[3] N. A. Owen, O. R. Inderwildi, and D. A. King, "The status of conventional
world oil reserves--Hype or cause for concern?," Energy Policy, vol. 38, pp.
4743-4749, 2010.
[4] S. Shafiee and E. Topal, "When will fossil fuel reserves be diminished?," Energy
Policy, vol. 37, pp. 181-189, 2009.
[5] Y. Kalinci, A. Hepbasli, and I. Dincer, "Biomass-based hydrogen production: A
review and analysis," International Journal of Hydrogen Energy, vol. 34, pp.
8799-8817, 2009.
[6] U. K. Mirza, N. Ahmad, and T. Majeed, "An overview of biomass energy
utilization in Pakistan," Renewable and Sustainable Energy Reviews, vol. 12, pp.
1988-1996, 2008.
[7] E. Iakovou, A. Karagiannidis, D. Vlachos, A. Toka, and A. Malamakis, "Waste
biomass-to-energy supply chain management: A critical synthesis," Waste
Management, vol. In Press, Corrected Proof, 2010.
[8] W. C. Lattin and V. P. Utgikar, "Transition to hydrogen economy in the United
States: A 2006 status report," International Journal of Hydrogen Energy, vol.
32, pp. 3230-3237, 2007.
[9] W. McDowall and M. Eames, "Forecasts, scenarios, visions, backcasts and
roadmaps to the hydrogen economy: A review of the hydrogen futures
literature," Energy Policy, vol. 34, pp. 1236-1250, 2006.
[10] J. D. Holladay, J. Hu, D. L. King, and Y. Wang, "An overview of hydrogen
production technologies," Catalysis Today, vol. 139, pp. 244-260, 2009.
[11] S. Munir, W. Nimmo, and B. M. Gibbs, "Co-combustion of Agricultural
Residues with Coal: Turning Waste into Energy," Energy & Fuels, vol. 24, pp.
2146-2153, 2010/03/18 2010.
[12] S. S. Daood, M. T. Javed, B. M. Gibbs, and W. Nimmo, "NOx control in coal
combustion by combining biomass co-firing, oxygen enrichment and SNCR,"
Fuel, vol. 105, pp. 283-292, 3// 2013.
[13] V. Kirubakaran, V. Sivaramakrishnan, R. Nalini, T. Sekar, M. Premalatha, and
P. Subramanian, "A review on gasification of biomass," Renewable and
Sustainable Energy Reviews, vol. 13, pp. 179-186, 2009.
[14] G. Berndes, M. Hoogwijk, and R. van den Broek, "The contribution of biomass
in the future global energy supply: a review of 17 studies," Biomass and
Bioenergy, vol. 25, pp. 1-28, 2003.
[15] M. Parikka, "Global biomass fuel resources," Biomass and Bioenergy, vol. 27,
pp. 613-620, 2004.
[16] J. F. González, S. Román, D. Bragado, and M. Calderón, "Investigation on the
reactions influencing biomass air and air/steam gasification for hydrogen
production," Fuel Processing Technology, vol. 89, pp. 764-772, 2008.
[17] H. Argun, F. Kargi, I. K. Kapdan, and R. Oztekin, "Biohydrogen production by
dark fermentation of wheat powder solution: Effects of C/N and C/P ratio on
hydrogen yield and formation rate," International Journal of Hydrogen Energy,
vol. 33, pp. 1813-1819, 2008.

16
[18] R. C. Saxena, D. Seal, S. Kumar, and H. B. Goyal, "Thermo-chemical routes for
hydrogen rich gas from biomass: A review," Renewable and Sustainable Energy
Reviews, vol. 12, pp. 1909-1927, 2008.
[19] H. B. Goyal, D. Seal, and R. C. Saxena, "Bio-fuels from thermochemical
conversion of renewable resources: A review," Renewable and Sustainable
Energy Reviews, vol. 12, pp. 504-517, 2008.
17
CHAPTER 2 LITERATURE REVIEW
Energy demand is increasing every year. Fear of fossil fuel depletion and heavy
emissions of greenhouse gases from combustion of these fossil fuels has led to research
to find clean and alternative sources to meet the future energy demands. Biomass is one
of the clean and sustainable sources of energy. It is renewable in nature with net zero
carbon dioxide emission into the atmosphere. It is available abundantly in various
forms and it can be used to produce hydrogen gas which is a clean fuel.
2.1 Biomass gasification
Gasification is the process of conversion of carbonaceous materials e.g. paper waste,
woodchips, sawdust, wood residue, bark, shrubs and municipal solid waste into
combustible gas. The gas produced commonly known as synthesis gas or syngas. It is a
mixture of hydrogen, carbon monoxide, carbon dioxide and methane and lighter
hydrocarbons including ethane, ethene, propane, propene, butane, butene and butadiene.
Syngas is commonly used to generate electrical energy and heat. It is also used as a raw
material for the production of many industrial chemicals, liquid and gaseous fuels such
as hydrogen gas.
Gasification can be classified into air, steam or oxygen gasification depending upon the
type of gasifying agent used. In every case, the amount of oxygen supplied is less than
the total amount required for complete combustion. After gasification, syngas requires
clean-up to remove undesirable substances including sulphur, tar and particles. When
biomass is heated under a limited supply of oxygen, firstly it is pyrolysed and yields
light hydrocarbons rich in hydrogen along with tar compounds & hydrocarbon gases.
Feedstock is further decomposed thermally to produce carbon and syngas with higher
hydrogen contents than the original feedstock. Steam gasification is more efficient than
air gasification in terms of the amount of syngas produced per kilogram of feedstock.
The effect of catalyst was also investigated by various researchers [1-6] at low
temperature (T < 500 ˚C) and medium temperature (500 ˚C < T < 900 ˚C) range.
Catalysts have a net positive effect on syngas yield but cost and deactivation of catalyst
are the major issues which still need to be addressed.
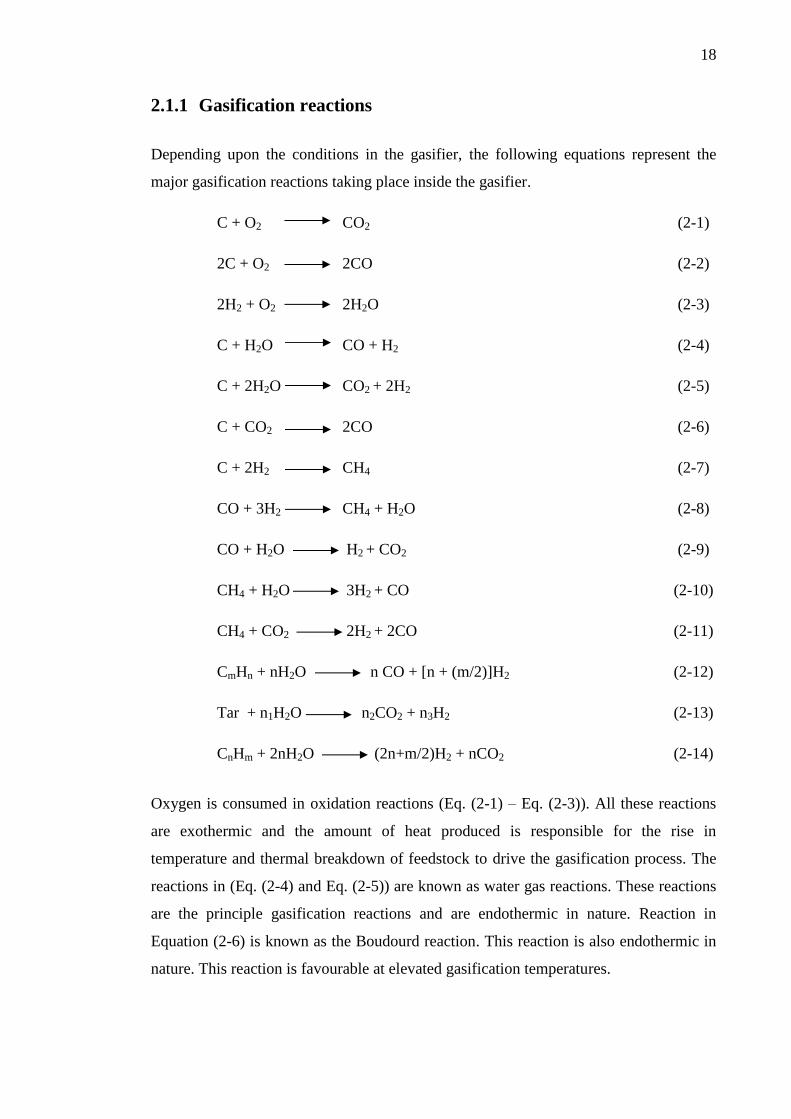
18
2.1.1 Gasification reactions
Depending upon the conditions in the gasifier, the following equations represent the
major gasification reactions taking place inside the gasifier.
C + O2 CO2 (2-1)
2C + O2 2CO (2-2)
2H2 + O2 2H2O (2-3)
C + H2O CO + H2 (2-4)
C + 2H2O CO2 + 2H2 (2-5)
C + CO2 2CO (2-6)
C + 2H2 CH4 (2-7)
CO + 3H2 CH4 + H2O (2-8)
CO + H2O H2 + CO2 (2-9)
CH4 + H2O 3H2 + CO (2-10)
CH4 + CO2 2H2 + 2CO (2-11)
CmHn + nH2O n CO + [n + (m/2)]H2 (2-12)
Tar + n1H2O n2CO2 + n3H2 (2-13)
CnHm + 2nH2O (2n+m/2)H2 + nCO2 (2-14)
Oxygen is consumed in oxidation reactions (Eq. (2-1) – Eq. (2-3)). All these reactions
are exothermic and the amount of heat produced is responsible for the rise in
temperature and thermal breakdown of feedstock to drive the gasification process. The
reactions in (Eq. (2-4) and Eq. (2-5)) are known as water gas reactions. These reactions
are the principle gasification reactions and are endothermic in nature. Reaction in
Equation (2-6) is known as the Boudourd reaction. This reaction is also endothermic in
nature. This reaction is favourable at elevated gasification temperatures.
19
Reactions 2-7 and 2-8 are methane formation reactions. These reactions are very slow
under normal gasification conditions and favoured by high pressure. Reaction 2-9 is
known as the water-gas shift reaction. This reaction is very important for the production
of hydrogen from gasification. Catalysts can be used to carry out this reaction even at
lower temperatures. Increase in pressure has no effect on this reaction. Reactions 2-10
and 2-11 are steam reforming and dry reforming reactions respectively. Reactions 2-12
and 2-13 are hydrocarbon and tar reforming reaction respectively. Reaction 2-14 is
overall gasification reaction.
2.1.2 Syngas clean-up systems
Syngas produced during the gasification process must be cleaned and filtered from toxic
gases and particulates. If not trapped during cleaning and filtration, these gases and
particulates may pose a threat to the environment. Type of application of syngas
determines the level of cleaning and filtration required. Much cleaner gas is required for
fuel cells as compared to boilers for steam production.
The syngas mainly consists of CO, CO2 H2, NH3, N2, CH4, H2S, HCl, HCN, elemental
carbon and traces of heavier hydrocarbon gases. The syngas must be cleaned from
different acid gases like SO2 and HCl which otherwise may cause acid rain [7].
Depending upon the composition of feedstock, syngas is processed in a series of process
units to remove particulate, heavy metals and inorganic acid gases. These processes may
include gas cooling followed by venturi scrubbers, or wet electrostatic precipitators [8].
Some facilities may include fabric filters for particulate removal. Demisters are also
employed to remove visual water vapours before the gas is emitted into the atmosphere.
2.1.3 Tar removal
Reforming of tar generated during the biomass gasification processes is also very
important since it is a huge obstacle in the utilization of these processes for power
generation or hydrogen production [9]. Tar compounds can be broadly classified into
five different classes. The properties and description of various classes of tar
compounds is shown in Table 2-1.
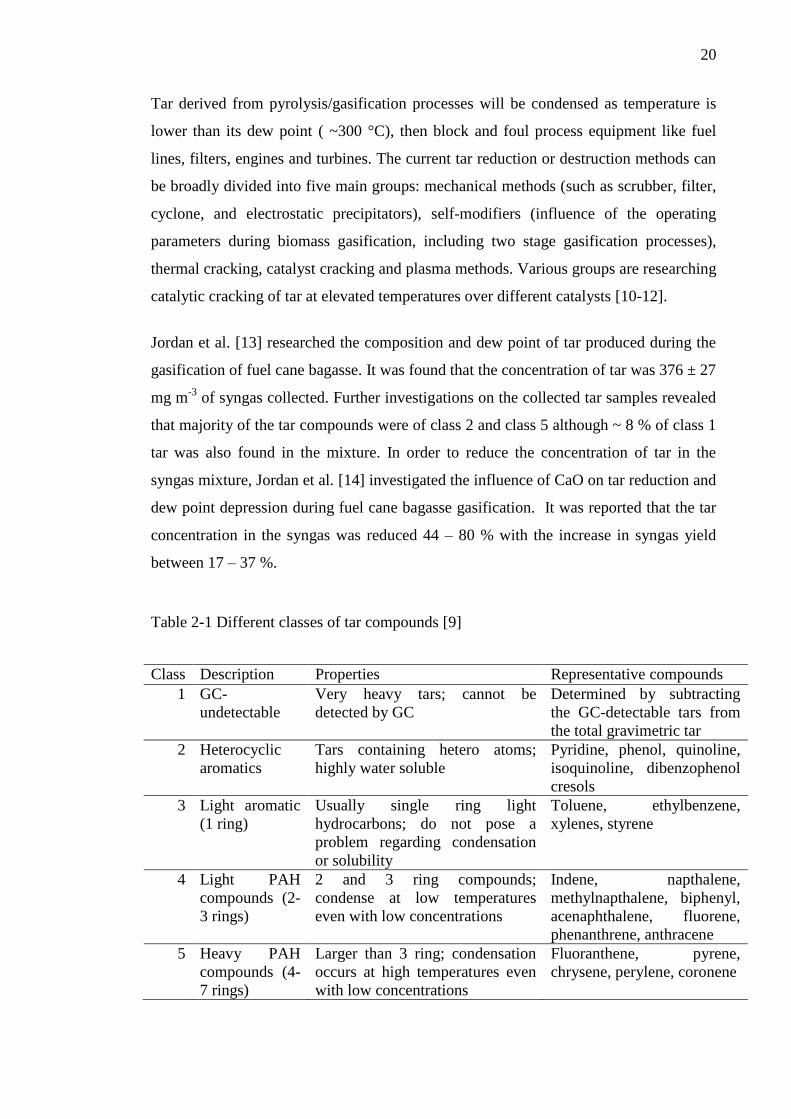
20
Tar derived from pyrolysis/gasification processes will be condensed as temperature is
lower than its dew point ( ~300 °C), then block and foul process equipment like fuel
lines, filters, engines and turbines. The current tar reduction or destruction methods can
be broadly divided into five main groups: mechanical methods (such as scrubber, filter,
cyclone, and electrostatic precipitators), self-modifiers (influence of the operating
parameters during biomass gasification, including two stage gasification processes),
thermal cracking, catalyst cracking and plasma methods. Various groups are researching
catalytic cracking of tar at elevated temperatures over different catalysts [10-12].
Jordan et al. [13] researched the composition and dew point of tar produced during the
gasification of fuel cane bagasse. It was found that the concentration of tar was 376 ± 27
mg m-3
of syngas collected. Further investigations on the collected tar samples revealed
that majority of the tar compounds were of class 2 and class 5 although ~ 8 % of class 1
tar was also found in the mixture. In order to reduce the concentration of tar in the
syngas mixture, Jordan et al. [14] investigated the influence of CaO on tar reduction and
dew point depression during fuel cane bagasse gasification. It was reported that the tar
concentration in the syngas was reduced 44 – 80 % with the increase in syngas yield
between 17 – 37 %.
Table 2-1 Different classes of tar compounds [9]
Class Description Properties Representative compounds
1 GC-
undetectable
Very heavy tars; cannot be
detected by GC
Determined by subtracting
the GC-detectable tars from
the total gravimetric tar
2 Heterocyclic
aromatics
Tars containing hetero atoms;
highly water soluble
Pyridine, phenol, quinoline,
isoquinoline, dibenzophenol
cresols
3 Light aromatic
(1 ring)
Usually single ring light
hydrocarbons; do not pose a
problem regarding condensation
or solubility
Toluene, ethylbenzene,
xylenes, styrene
4 Light PAH
compounds (2-
3 rings)
2 and 3 ring compounds;
condense at low temperatures
even with low concentrations
Indene, napthalene,
methylnapthalene, biphenyl,
acenaphthalene, fluorene,
phenanthrene, anthracene
5 Heavy PAH
compounds (4-
7 rings)
Larger than 3 ring; condensation
occurs at high temperatures even
with low concentrations
Fluoranthene, pyrene,
chrysene, perylene, coronene
21
2.2 Review of gasification conditions
Overall yield of the syngas from the gasification process mainly depends on following
parameters.
Feedstock composition
Feedstock preparation (e.g. particle size, moisture level)
Reaction temperature
Heating rate
Presence of catalyst
Residence time
Steam to biomass ratio
Reactor design
Gasifying agent
Depending upon the operating conditions, gasifier configuration and gasification agent,
four types of syngas can be produced.
i. Low heating value gas (3.5 to 10 MJ m-3
)
ii. Medium heating value gas (10 to 20 MJ m-3
)
iii. High heating value gas (20 to 35 MJ m-3
)
iv. Substitute natural gas (SNG) (over 35 MJ m-3
)
Low heating value gas can be used as gas turbine fuel in an IGCC (Integrated
gasification combined cycle), as a boiler fuel for steam production and as a smelting and
reducing agent for iron ores. In addition to the above applications medium heating value
gas can be used for hydrogen production, for fuel cells and for chemicals and fuel
synthesis. High heating value gas can also be used in all the above mentioned
applications but with less methanation reactions and with more ease. SNG can be used
easily as a substitute for natural gas and hence can be used for the production of
hydrogen gas and for chemical production and also as a feed for fuel cells.
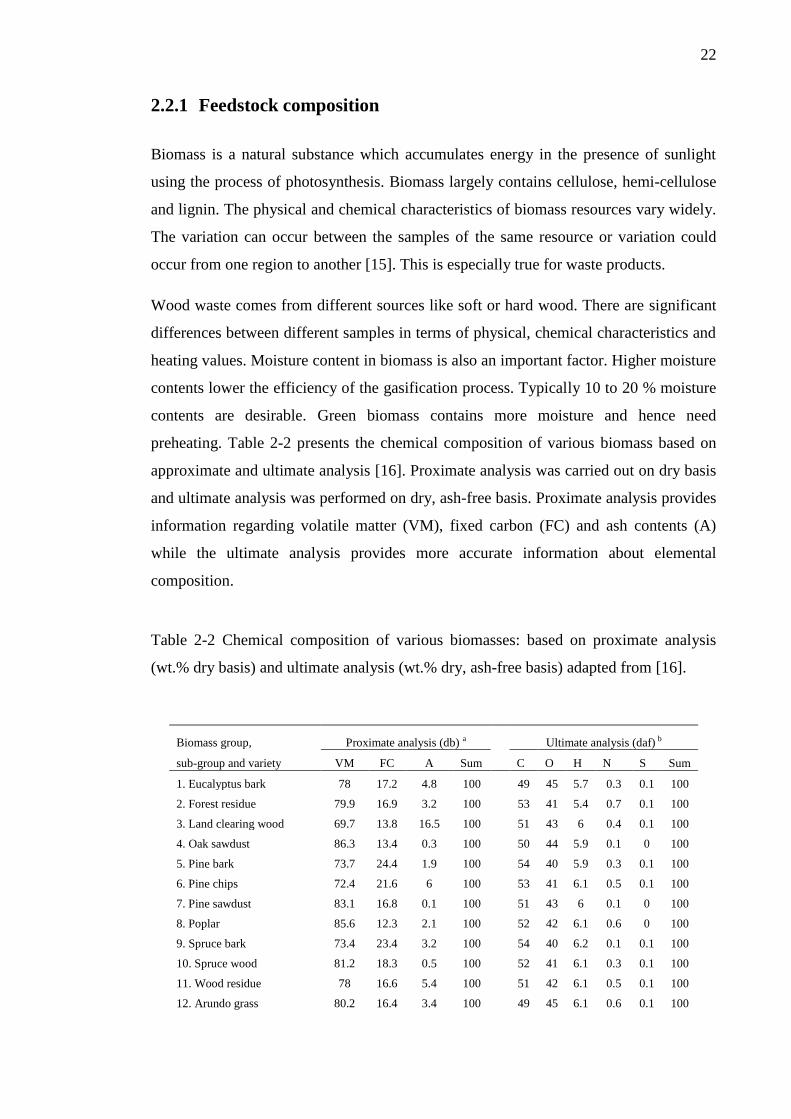
22
2.2.1 Feedstock composition
Biomass is a natural substance which accumulates energy in the presence of sunlight
using the process of photosynthesis. Biomass largely contains cellulose, hemi-cellulose
and lignin. The physical and chemical characteristics of biomass resources vary widely.
The variation can occur between the samples of the same resource or variation could
occur from one region to another [15]. This is especially true for waste products.
Wood waste comes from different sources like soft or hard wood. There are significant
differences between different samples in terms of physical, chemical characteristics and
heating values. Moisture content in biomass is also an important factor. Higher moisture
contents lower the efficiency of the gasification process. Typically 10 to 20 % moisture
contents are desirable. Green biomass contains more moisture and hence need
preheating. Table 2-2 presents the chemical composition of various biomass based on
approximate and ultimate analysis [16]. Proximate analysis was carried out on dry basis
and ultimate analysis was performed on dry, ash-free basis. Proximate analysis provides
information regarding volatile matter (VM), fixed carbon (FC) and ash contents (A)
while the ultimate analysis provides more accurate information about elemental
composition.
Table 2-2 Chemical composition of various biomasses: based on proximate analysis
(wt.% dry basis) and ultimate analysis (wt.% dry, ash-free basis) adapted from [16].
Biomass group, Proximate analysis (db) a Ultimate analysis (daf) b
sub-group and variety VM FC A Sum C O H N S Sum
1. Eucalyptus bark 78 17.2 4.8 100 49 45 5.7 0.3 0.1 100
2. Forest residue 79.9 16.9 3.2 100 53 41 5.4 0.7 0.1 100
3. Land clearing wood 69.7 13.8 16.5 100 51 43 6 0.4 0.1 100
4. Oak sawdust 86.3 13.4 0.3 100 50 44 5.9 0.1 0 100
5. Pine bark 73.7 24.4 1.9 100 54 40 5.9 0.3 0.1 100
6. Pine chips 72.4 21.6 6 100 53 41 6.1 0.5 0.1 100
7. Pine sawdust 83.1 16.8 0.1 100 51 43 6 0.1 0 100
8. Poplar 85.6 12.3 2.1 100 52 42 6.1 0.6 0 100
9. Spruce bark 73.4 23.4 3.2 100 54 40 6.2 0.1 0.1 100
10. Spruce wood 81.2 18.3 0.5 100 52 41 6.1 0.3 0.1 100
11. Wood residue 78 16.6 5.4 100 51 42 6.1 0.5 0.1 100
12. Arundo grass 80.2 16.4 3.4 100 49 45 6.1 0.6 0.1 100
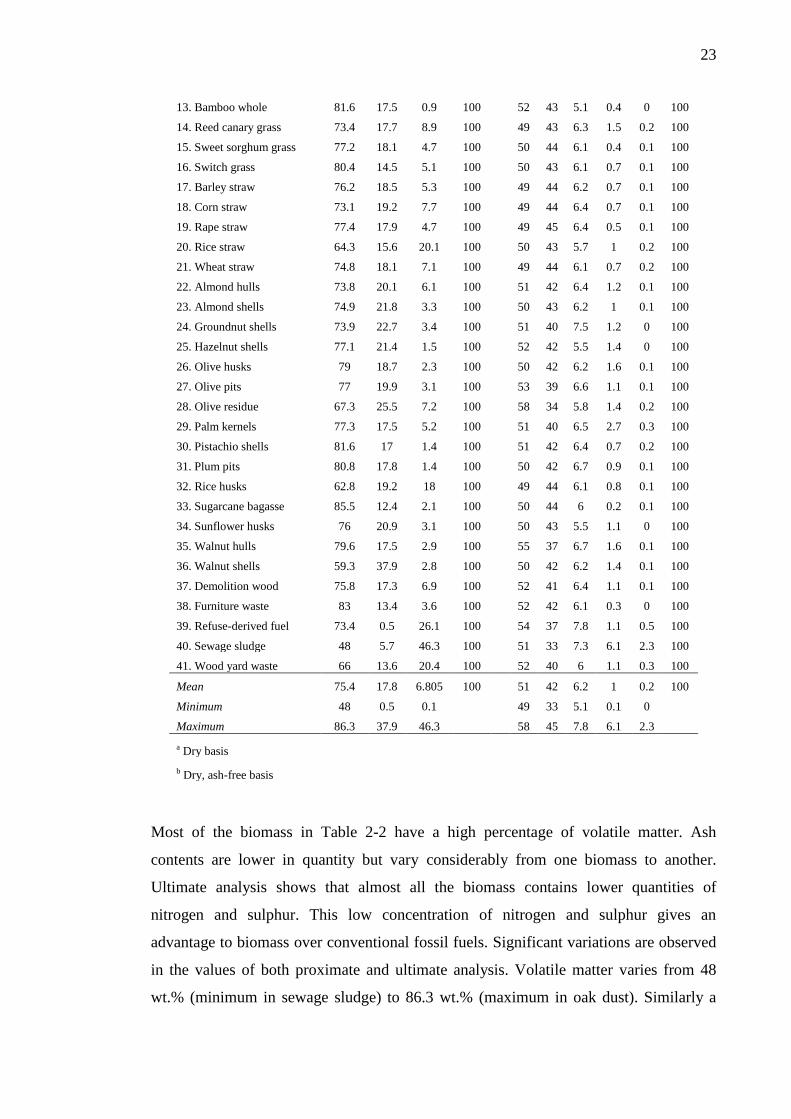
23
Most of the biomass in Table 2-2 have a high percentage of volatile matter. Ash
contents are lower in quantity but vary considerably from one biomass to another.
Ultimate analysis shows that almost all the biomass contains lower quantities of
nitrogen and sulphur. This low concentration of nitrogen and sulphur gives an
advantage to biomass over conventional fossil fuels. Significant variations are observed
in the values of both proximate and ultimate analysis. Volatile matter varies from 48
wt.% (minimum in sewage sludge) to 86.3 wt.% (maximum in oak dust). Similarly a
13. Bamboo whole 81.6 17.5 0.9 100 52 43 5.1 0.4 0 100
14. Reed canary grass 73.4 17.7 8.9 100 49 43 6.3 1.5 0.2 100
15. Sweet sorghum grass 77.2 18.1 4.7 100 50 44 6.1 0.4 0.1 100
16. Switch grass 80.4 14.5 5.1 100 50 43 6.1 0.7 0.1 100
17. Barley straw 76.2 18.5 5.3 100 49 44 6.2 0.7 0.1 100
18. Corn straw 73.1 19.2 7.7 100 49 44 6.4 0.7 0.1 100
19. Rape straw 77.4 17.9 4.7 100 49 45 6.4 0.5 0.1 100
20. Rice straw 64.3 15.6 20.1 100 50 43 5.7 1 0.2 100
21. Wheat straw 74.8 18.1 7.1 100 49 44 6.1 0.7 0.2 100
22. Almond hulls 73.8 20.1 6.1 100 51 42 6.4 1.2 0.1 100
23. Almond shells 74.9 21.8 3.3 100 50 43 6.2 1 0.1 100
24. Groundnut shells 73.9 22.7 3.4 100 51 40 7.5 1.2 0 100
25. Hazelnut shells 77.1 21.4 1.5 100 52 42 5.5 1.4 0 100
26. Olive husks 79 18.7 2.3 100 50 42 6.2 1.6 0.1 100
27. Olive pits 77 19.9 3.1 100 53 39 6.6 1.1 0.1 100
28. Olive residue 67.3 25.5 7.2 100 58 34 5.8 1.4 0.2 100
29. Palm kernels 77.3 17.5 5.2 100 51 40 6.5 2.7 0.3 100
30. Pistachio shells 81.6 17 1.4 100 51 42 6.4 0.7 0.2 100
31. Plum pits 80.8 17.8 1.4 100 50 42 6.7 0.9 0.1 100
32. Rice husks 62.8 19.2 18 100 49 44 6.1 0.8 0.1 100
33. Sugarcane bagasse 85.5 12.4 2.1 100 50 44 6 0.2 0.1 100
34. Sunflower husks 76 20.9 3.1 100 50 43 5.5 1.1 0 100
35. Walnut hulls 79.6 17.5 2.9 100 55 37 6.7 1.6 0.1 100
36. Walnut shells 59.3 37.9 2.8 100 50 42 6.2 1.4 0.1 100
37. Demolition wood 75.8 17.3 6.9 100 52 41 6.4 1.1 0.1 100
38. Furniture waste 83 13.4 3.6 100 52 42 6.1 0.3 0 100
39. Refuse-derived fuel 73.4 0.5 26.1 100 54 37 7.8 1.1 0.5 100
40. Sewage sludge 48 5.7 46.3 100 51 33 7.3 6.1 2.3 100
41. Wood yard waste 66 13.6 20.4 100 52 40 6 1.1 0.3 100
Mean 75.4 17.8 6.805 100 51 42 6.2 1 0.2 100
Minimum 48 0.5 0.1 49 33 5.1 0.1 0
Maximum 86.3 37.9 46.3 58 45 7.8 6.1 2.3
a Dry basis
b Dry, ash-free basis
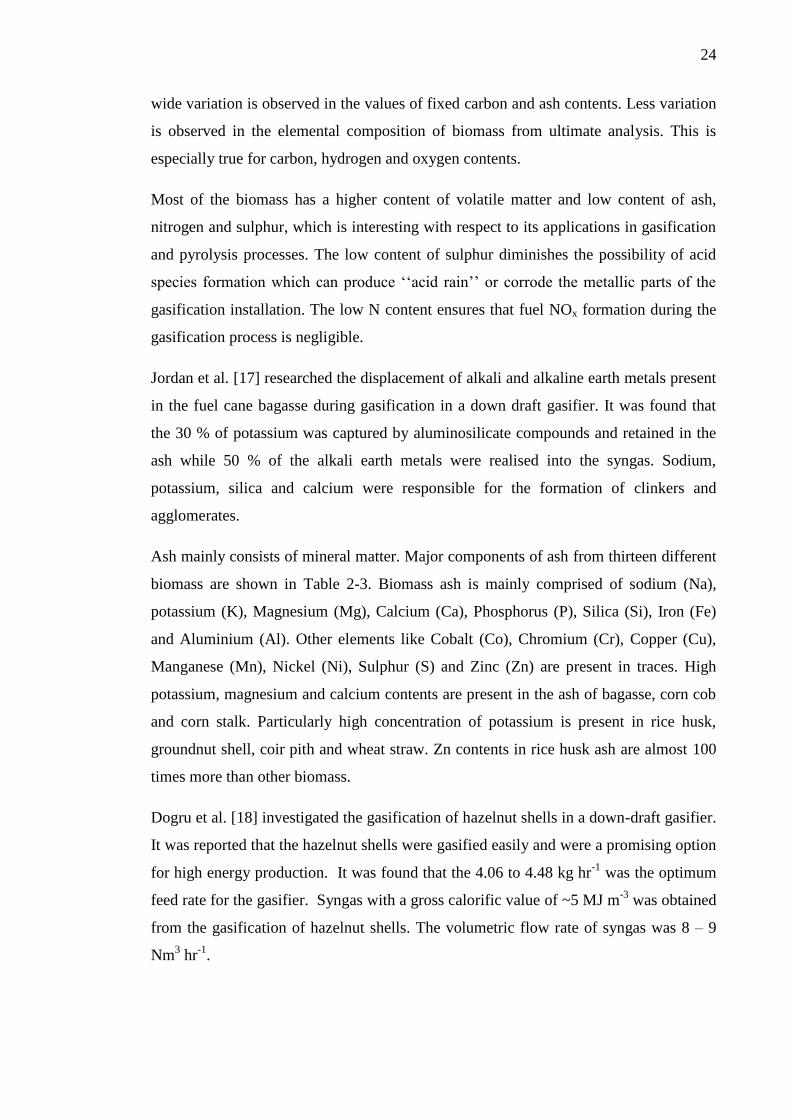
24
wide variation is observed in the values of fixed carbon and ash contents. Less variation
is observed in the elemental composition of biomass from ultimate analysis. This is
especially true for carbon, hydrogen and oxygen contents.
Most of the biomass has a higher content of volatile matter and low content of ash,
nitrogen and sulphur, which is interesting with respect to its applications in gasification
and pyrolysis processes. The low content of sulphur diminishes the possibility of acid
species formation which can produce ‘‘acid rain’’ or corrode the metallic parts of the
gasification installation. The low N content ensures that fuel NOx formation during the
gasification process is negligible.
Jordan et al. [17] researched the displacement of alkali and alkaline earth metals present
in the fuel cane bagasse during gasification in a down draft gasifier. It was found that
the 30 % of potassium was captured by aluminosilicate compounds and retained in the
ash while 50 % of the alkali earth metals were realised into the syngas. Sodium,
potassium, silica and calcium were responsible for the formation of clinkers and
agglomerates.
Ash mainly consists of mineral matter. Major components of ash from thirteen different
biomass are shown in Table 2-3. Biomass ash is mainly comprised of sodium (Na),
potassium (K), Magnesium (Mg), Calcium (Ca), Phosphorus (P), Silica (Si), Iron (Fe)
and Aluminium (Al). Other elements like Cobalt (Co), Chromium (Cr), Copper (Cu),
Manganese (Mn), Nickel (Ni), Sulphur (S) and Zinc (Zn) are present in traces. High
potassium, magnesium and calcium contents are present in the ash of bagasse, corn cob
and corn stalk. Particularly high concentration of potassium is present in rice husk,
groundnut shell, coir pith and wheat straw. Zn contents in rice husk ash are almost 100
times more than other biomass.
Dogru et al. [18] investigated the gasification of hazelnut shells in a down-draft gasifier.
It was reported that the hazelnut shells were gasified easily and were a promising option
for high energy production. It was found that the 4.06 to 4.48 kg hr-1
was the optimum
feed rate for the gasifier. Syngas with a gross calorific value of ~5 MJ m-3
was obtained
from the gasification of hazelnut shells. The volumetric flow rate of syngas was 8 – 9
Nm3 hr
-1.
25
Table 2-3 Ash composition of biomass (parts per million weight of dry biomass) [19]
Sr# Biomass Al Ca Fe Mg Na K P Si Co Cr Cu Mn Ni S Zn
1 Bagasse – 1518 125 6261 93 2682 284 17340 – – 18 9 16 60 16
2 Coconut coir 148 477 187 532 1758 2438 47 2990 0.6 2 68 4 2 64 25
3 Coconut shell 73 1501 115 389 1243 1965 94 256 0.5 0.3 5 1 13 35 9
4 Coir pith 1653 3126 837 8095 10564 26283 1170 13050 3.2 0.2 1239 27 22 476 40
5 Corn cob – 182 24 1693 141 9366 445 9857 – – Trace 19 6 15 11
6 Corn stalks 1911 4686 518 5924 6463 32 2127 13400 8 11 32 12 13 564 32
7 Cotton gin waste – 3737 746 4924 1298 7094 736 13000 – – Trace 38 10 58 22
8 Groundnut shell 3642 12970 1092 3547 467 17690 278 10960 2.3 6 11 44 11 299 52
9 Millet husk – 6255 1020 11140 1427 3860 1267 200000 – – Trace 38 49 317 94
10 Rice husk – 1793 533 1612 132 9061 337 200000 – – 21 108 32 163 1244
11 Rice straw – 4772 205 6283 5106 5402 752 200000 – – Trace 463 45 221 47
12 Subabul wood – 6025 614 1170 92 614 100 195 – – 1 2 1 66 40
13 Wheat straw 2455 7666 132 4329 7861 28930 214 44440 – – 7 25 25 787 18
26
High contents of silica are observed in straw and rice husks (~95 wt.%) while high
calcium (~70 wt.%), magnesium (~14 wt.%) and potassium (~7 wt.%) contents are
present in wood biomass. Coconut coir has higher potassium contents (~36 wt.%) than
sodium (~13 wt.%). Aluminium is absent in bagasse, corn cob, cotton gin waste, husks,
rice straw and wood biomass. Although cobalt and chromium are among the minor
elements in ash but these elements are also absent in straws, husks wood, bagasse, corn
cob and cotton gin waste.
Cellulose, hemicellulose and lignin are major components of a typical biomass.
Percentage by weight (wt.%) of each component in 13 different biomass is shown in
Table 2-4 on a dry basis ( adapted from [20]).
Thermogravimetric analysis (TGA) is used extensively to investigate the thermal
decomposition of biomass. The system consists of an electrically heated furnace with a
sample holder on a microbalance. The sample is placed in the sample holder is heated
from room temperature to the final required temperature with known flow rate and
heating rate. Accurate microbalance and thermocouples connected with a computer are
used to record the sample weight loss against temperature and time. Weight loss data is
plotted on screen in real time and finally all the data recorded on a file. Williams and
Besler [21, 22] used rice husk and wood samples to investigate the thermal
decomposition on various temperatures and heating rates. It was observed that for
cellulose, hemicelluloses and lignin, maximum weight loss occurs only at one specific
temperature for each but in the case of wood two temperatures are noticed for maximum
weight loss; one close to the cellulose maximum weight loss temperature and the other
closer to hemicellulose. Hemicellulose decomposes between 220 and 320 °C while
thermal decomposition of cellulose starts around 250 °C and ends at 360 °C. Lignin
decomposes gradually between 80 - 500 °C.
Daood et al. [23] studied the oxidation of char from bagasse, cotton stalk and coal under
1 % and 3 % oxygen concentration in a TGA. The char reactivity was increased when
the oxygen concentration was increased from 1 % to 3 %. Biomass samples were found
to be more reactive than the studied coal. Vassile et al. [24] compiled the organic and
inorganic phase composition of 93 different biomass samples from different sources.
Detailed analysis showed a wide variation in terms of organic matter, inorganic matter
and fluid matter present in different biomass samples.
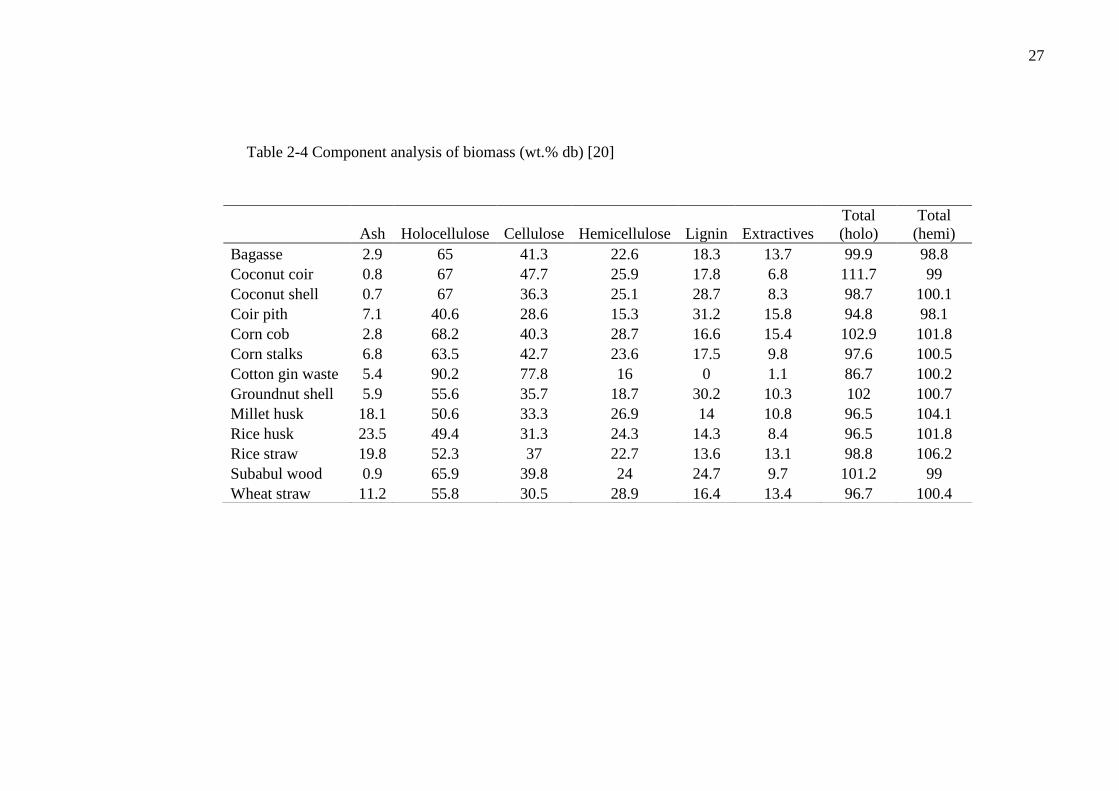
27
Table 2-4 Component analysis of biomass (wt.% db) [20]
Ash Holocellulose Cellulose Hemicellulose Lignin Extractives
Total
(holo)
Total
(hemi)
Bagasse 2.9 65 41.3 22.6 18.3 13.7 99.9 98.8
Coconut coir 0.8 67 47.7 25.9 17.8 6.8 111.7 99
Coconut shell 0.7 67 36.3 25.1 28.7 8.3 98.7 100.1
Coir pith 7.1 40.6 28.6 15.3 31.2 15.8 94.8 98.1
Corn cob 2.8 68.2 40.3 28.7 16.6 15.4 102.9 101.8
Corn stalks 6.8 63.5 42.7 23.6 17.5 9.8 97.6 100.5
Cotton gin waste 5.4 90.2 77.8 16 0 1.1 86.7 100.2
Groundnut shell 5.9 55.6 35.7 18.7 30.2 10.3 102 100.7
Millet husk 18.1 50.6 33.3 26.9 14 10.8 96.5 104.1
Rice husk 23.5 49.4 31.3 24.3 14.3 8.4 96.5 101.8
Rice straw 19.8 52.3 37 22.7 13.6 13.1 98.8 106.2
Subabul wood 0.9 65.9 39.8 24 24.7 9.7 101.2 99
Wheat straw 11.2 55.8 30.5 28.9 16.4 13.4 96.7 100.4
28
2.2.2 Biomass particle size
A considerable amount of literature has been published on biomass gasification [5, 25-
37]. Particle size is one of the major factors affecting the yield and composition of
synthesis gas. Several studies have investigated the influence of particle size on the gas
yield, fuel conversion and synthesis gas composition [38-44].
As a general trend, the concentration of all the combustible gases (CO, H2 and CH4)
increase with the decrease in particle size while there is a slight decrease in the
concentration of CO2 . Fuel conversion also increases with the decrease in particle size.
Similarly with the decrease in particle size, an incremental trend is observed in gas yield
and heating value of synthesis gas.
Hernández et al. [39] investigated the influence of particle size on the gas yield, gas
composition, fuel conversion (FC %), lower heating value and gas efficiency of
biomass. A series of gasification experiments were carried out using dealcoholized marc
of grape (solid residue of grapes) as a target biomass fuel. All the experiments were
carried out at 1050 ˚C at a pressure of 3 bars with the relative fuel to air ratio (Frg) ~ 4.
Biomass flow rate (mf) and air flow rate (ma) were varied from 1.49 to 1.67 kg hr-1
&
2.04 to 2.29 kg hr-1
respectively. Fuel conversion FC(%) was calculated by altering the
particle size from 0.5, 1, 2, 4 to 8 mm using the following formula [39].
( ) (
) ( )
Where mchar and mf are the mass of char-ash residue and mass of biomass fuel
respectively.
An increase in the concentration of CO, H2 and CH4 was seen with the diminishing
effect on the concentration of CO2. Fuel conversion (FC) also increased from 57.5 % to
91.4 % when the particle size was decreased from 8 mm to 0.5 mm. Conversion
efficiency was also improved with the decrease in particle size. This is perhaps due to
the increase in heating value and near constant gas yield.
29
Many factors contribute towards the increased fuel conversion and enhanced yield of
CO, H2 and CH4. It is well established that the decrease in particle size results in
improved heat and mass transfer during the reaction. It also increases the surface area to
volume ratio of fuel particles. This increased surface area to volume ratio makes it
easier for most of volatiles to evolve, leaving behind a highly porous particle. This very
porous nature of remaining char increases its reactivity by decreasing the temperature
gradient and internal heat transfer conduction resistance within the char particle.
Reaction takes place all over the particle instead of only at the surface. This resulted in
the up gradation of the synthesis gas produced. In other words, by decreasing the
particle size, diffusion coefficient resistance is lowered and heat and mass transferred is
improved considerably. This results in the rate of reaction controlled by chemical
kinetics and hence the rate of reaction increases exponentially with the increase in
reaction temperature and surface area to volume ratio. This is in agreement with Babu et
al. [45] who suggested that less time is required for reaction completion when the
particle size is small.
Thermochemical analysis of char-ash residue also suggests that the decrease in particle
size produces more volatiles during the reaction thus less volatiles and more ash
contents are observed in the char-ash residue of lower particle size biomass. Hernández
et al. [39] investigated the influence of biomass particle size during gasification of
biomass in an entrained flow reactor. It was reported that for smaller particle size ( < 1
mm) higher ash contents were obtained which in turn were related to increase in fuel
conversion and decrease in fix carbon contents. They suggested that the gasification
reaction takes place effectively for the particle size of less than 1 mm.
Li et al. [43] performed a series of experiments on palm oil waste in the presence of
catalyst. Reactions were carried out at a constant gasifier temperature of 800 ˚C while
the temperature of catalyst bed was maintained at 850 ˚C. Steam to biomass ratio was
kept constant at a value of 1.33. Four groups of particle size 5 - 2, 2 - 1, 1 - 0.15 and
<0.15 mm were investigated under the above mentioned conditions. Gas yield was
increased from 2.16 m3
kg-1
to 2.41 m3
kg-1
when the particle size was decreased from 5
mm to less than 0.15 mm. A diminishing trend was noticed in the values of LHV of
synthesis gas from 10.28 MJ/Nm3 to 8.99 MJ/Nm
3 with the decrease in particle size.
Effective heat and mass transfer along with the increased surface area to volume ratio
30
are the main factors for the increase in the concentration of CO, H2 and other
combustible species.
Xiao et al. [40] carried out steam gasification of biomass in a laboratory-scale fix bed
reactor. The effects of particle size on gas composition and carbon conversion
efficiency were investigated. Five different groups of biomass sizes (below 0.075 mm,
0.075-0.15 mm, 0.15-0.3 mm, 0.3-0.6 mm and 0.6-1.2 mm) were used in this study.
Temperature was varied from 600 - 900 °C while fuel flow rate and steam to biomass
ratio were kept constant at the values of 5g min-1
and 1.2 respectively. It was noticed
that at a constant temperature, decreasing particle size increased carbon conversion
efficiency and gas yield. This effect was less evident at higher temperatures where the
results tend to converge. This was partially due to the fact that increase in temperature
increases the effective thermal conductivity which is the result of an increase in
radiation contribution to heat transfer.
A decline in the amount of char and tar was observed with the decrease in particle size.
The smallest particle size (below 0.075 mm) produced a negligible amount of char and
tar (0.4 %) at 700 °C. This amount further decreased with the increase in temperature or
with the decrease in particle size. More than 10 % char and tar was reported for the
largest particle size (0.6-1.2 mm) even at 900 °C. As discussed in the literature [38-42,
44, 45], the reason for better conversion and less char and tar is primarily related to the
surface area to volume ratio and better heat and mass transfer. For larger particles the
reaction is controlled by heat and mass transfer while for the smallest particles, the
reaction is controlled by chemical kinetics. Greater heat transfer resistance creates a
temperature gradient inside the larger particles. This temperature gradient causes
reactions to take place only at the particle surface which results in more char and tar and
lower carbon conversion efficiencies.
A decrease in particle size supports the reactions which produce CO and H2. Primarily
increased surface area provides greater contact with steam and hence the concentration
of hydrogen was increased by the water gas shift reaction along with carbon
gasification. Secondary tar cracking and Boudouard reaction also favours H2 and CO
production.
31
A diminishing effect was observed in CO2 concentration when the particle size was
reduced. Perhaps it was related to the equilibrium between CO, CO2 and H2 in the
water gas shift and other gasification reactions. CH4 concentration increased with the
decrease in particle size. This was supported by the fact that CH4 concentration was not
affected by the water gas shift reaction. An inverse relationship exists between the
particle size and rate of reaction of the following reactions and this causes a minor
increase in CH4 concentration with the decrease in biomass particle size. Better heat
transfer results in more volatiles. An increase in overall gas yield and conversion
efficiency was also witnessed, when particle size was reduced.
Luo et al. [41] performed a series of pyrolysis and gasification experiments on a
municipal solid waste (MSW) sample. Experiments were designed to study the effect of
particle size on the yield of syngas. A laboratory-scale fixed bed reactor was used and
temperature was varied from 600 to 900 °C. Three groups of particle size (below 5 mm,
5 - 10 mm and above 10 mm) were investigated. A decrease in particle size showed a
positive effect on the concentration of CO, H2 and other combustible species. When
particle size was reduced, gas yield and carbon conversion efficiency were also
improved while a decrease in the amount of char-ash residue was noticed.
Onay et al. [46] conducted fixed-bed pyrolysis of rapeseed. The effect of temperature,
sweep gas flow rate and particle size were investigated on the yield of oil, gas and char.
Six particle size groups (below 0.425 mm, 0.425 - 0.6 mm, 0.6 - 0.85 mm, 0.85 - 1.25
mm, 1.25 - 1.8 mm and above 1.8 mm) were used in this study to carry out slow
pyrolysis; without any sweep gas. For the smallest particle size group (below 0.425
mm) a minor increase in char yield was observed while a decline was observed in gas
and oil yield, when compared with the largest particle size group (1.25 - 1.8 mm). This
increase in char yield might be the result of recondensation and repolymerization of
various species in the absence of sweep gas. Interestingly neither the smallest particle
size group nor the largest particle size group produced maximum oil and gas yield.
Instead the intermediate particle size group (0.85 - 1.25 mm) produced maximum oil
and gas yield.
Onay et al. [47] also performed fast pyrolysis of the same six particle size groups using
the same biomass at 550 °C with sweep gas velocity of 100 cm3 min
-1. With the
decrease in particle size, an increase in gas and char yield while a decrease in oil yield
32
was observed for the smallest particle size. Although the effect is not linear over the
entire particle size range but again maximum oil yield was witnessed for the
intermediate particle size (0.6 - 0.85 mm)
Wei et al. [48] performed fast pyrolysis of various biomass types in a free fall reactor.
Decreasing particle size increased overall gas yield but the amount of char and tar was
reduced. The concentration of CO, H2 and other combustible gases was also increased
with the decrease in particle size.
Wilk et al. [49] reported that with an increasing proportion of particles smaller than
1 mm, the product gas contained less H2 and more CO and CH4. Less product gas was
generated and the concentration of tar increased.
2.2.3 The influence of gasification temperature
Temperature is the key parameter for steam gasification of biomass. Many researchers
[5, 35, 37, 50-62] investigated the effect of temperature on gasification performance.
From the literature, it can be inferred that hydrogen concentration increases with the
increase in gasification temperature. Overall gas yield and carbon conversion efficiency
are also enhanced with the increase in temperature. The gasification process is the result
of combination of a series of complex and competing reactions shown below. Species
are interlinked by chemical equilibrium. The major gasification reactions are outlined in
Section 2.1.
Reactions 2-1 to 2-3 are oxidation reactions. These reactions are exothermic in nature
and all the oxygen is consumed by these reactions. Water gas reactions are endothermic
in nature and are favoured by the increase in temperature. 131 kJ of energy is required
to convert one mole of carbon and steam into hydrogen and carbon monoxide. At higher
temperatures CO produced by the water gas reaction is consumed by the water gas shift
reaction. The Boudouard reaction is also endothermic (+172 kJ mol-1
) and the formation
of CO is favoured by higher temperature. It is observed that for temperatures above 700
˚C, formation of CO is favoured.
Water gas shift reaction is one of the two major reactions for the production of
hydrogen during gasification. It is slightly exothermic in nature (-41 kJ mol-1
). Reaction
is favoured for medium to high temperatures (~ 600 – 800 ˚C). The steam methane
33
reforming reaction is endothermic (+206 kJ mol-1
) and it is favoured by higher
temperatures (~ 700 - 1100 ˚C). This is the main reaction used by industry to produce
large quantities of hydrogen for hydrogenation of edible oils and for the production of
ammonia. Carbon is mainly gasified in oxidation, Boudouard and water gas reactions.
The overall reaction can be summarized by Equation 2-14 as presented by Yan et al.
[50].
Yan et al. [50] investigated the effect of gasification temperature on the production of
hydrogen gas from biomass char. Steam gasification was carried out in a fixed-bed
reactor using nitrogen as a purge gas. Temperature was varied from 600 to 850 ˚C while
the steam flow rate was kept constant at 0.165 g min-1
, per gram of sample. It was
reported that the highest concentration of hydrogen was obtained at 850 °C. Overall dry
gas yield and carbon conversion efficiency also improved with the increase in
temperature. This is mainly due to the fact that the higher temperatures favour more
volatiles release, further reforming and cracking of volatiles and gasification of residual
char. Increase in overall gas yield was mainly due to the water gas, Boudouard and
steam methane reforming reactions. All these reaction are endothermic and favour the
gasification of carbon with the increase in temperature. Further cracking and reforming
of tar due to higher temperatures also contribute towards the increase in overall gas
yield and improved carbon conversion efficiency. From 600 – 700 ˚C, the concentration
of H2 and CO was lower as compared to the other species while the opposite was true
for higher temperatures. This indicates that the water gas shift reaction was the
dominant reaction during this temperature range. Decrease in heating value of the
product gas was reported with the increase in temperature. This was mainly due to the
higher percentage of CO and H2 along with a decrease in the concentration of CH4 in the
product gas. From the temperature 800 – 850 ˚C sharp increase in CO concentration but
a decline in H2/CO concentration was observed. During the same temperature range, a
decrease in the concentration of CO2 and CH4 was observed. This was again due to the
water gas, Boudouard and steam methane reforming reactions. This argument was
further supported by an increased ash percentage in the residue.
Luo et al. [51] also investigated the effect of temperature on the production of hydrogen
gas from the steam gasification of pine sawdust. Temperature was varied from 600 to
900 ˚C with a fixed steam to biomass ratio of 1.43. A fixed-bed reactor used in this
study was fitted with a screw feeding system and the fuel flow rate was kept constant at
34
the rate of 5 g min-1
. Increase in dry gas yield and carbon conversion efficiency was
reported with the increase in temperature. More gaseous products (volatiles) evolved at
higher temperatures. Endothermic reactions like Boudouard, water gas and steam
methane reforming reaction were favoured by higher temperatures. Steam cracking and
reforming of tar was also made possible due to higher temperatures. H2, CO and CO2
were the major components in the product gas while small quantities of hydrocarbon
gases such as CH4 C2H4 and C2H6 were observed. Increase in H2 and CO2 concentration
was observed but a decline in the concentration of CO was noticed. This was probably
interlinked with the dominance of the water gas shift reaction. Methane decomposition
was favoured by the increase in temperature mainly due to the steam methane reforming
reaction. A decline from 15.4 to 4.8 % was observed in the CH4 concentration. C2H4
and C2H6 were present in small quantities and a decreasing trend in the concentration of
these species was observed with the increase in temperature.
Franco et al. [52] studied the temperature effect on the steam gasification of biomass
using a fluidised bed reactor. They studied three different biomass (Pine, Holm-oak and
Eucalyptus) while the temperature was varied from 700 to 900 ˚C. Biomass samples
were fed to the reactor using a screw feeding system. In order to investigate the effect of
temperature, steam flow rate was 4.6g min-1
while steam to biomass ratio was kept
constant at 0.8. Moisture contents in the biomass samples were around 10 % and
particle size was in the range of 1250 µm to 2000 µm. Gas yield increased with the
increase in temperature. Further reforming and cracking decreased the amount of
residual char. Higher gaseous products were obtained primarily due to the endothermic
reactions favoured by higher temperatures. Further gasification of char and cracking of
heavier hydrocarbon species and tar also contributed toward this increase in overall
yield. For temperatures of 750 to 850 °C variation in gas yield was observed for
different biomass but at 900 °C almost the same gas yield was observed for all the three
biomass.
This difference in gas yield at lower temperatures might be related to the char reactivity
of different biomass which in turn is related to the cellulose and lignin contents of the
biomass. Char gasification with steam is also favoured by higher temperature as it is an
endothermic reaction. In agreement with the literature, gas yield, energy to carbon
conversion and carbon conversion efficiency increased with the increase in temperature.
Gas heating value decreased with the increase in temperature. This effect is very
35
significant for temperatures higher than 850 °C. At these temperatures a sharp increase
in H2 concentration and a decline in hydrocarbon concentration was reported. Higher
temperatures thermally cracked the heavier hydrocarbons and converted them into
lighter species.
In the case of all three biomass, the hydrogen concentration increased with the
increasing temperature. From 800 to 900 °C, a sharp decline was observed in the
concentration of CnHm for eucalyptus and holm-oak biomass but its concentration was
almost constant for pine. A gradual decrease in CO concentration was observed for all
three biomass. This was mainly linked to the equilibrium of water gas, Boudouard and
water-gas shift reactions. A slight decrease in the concentration of CO2 and CH4 was
also noticed. At higher temperatures, Boudouard and steam methane reforming reaction
favours the breakdown of CO2 and CH4 respectively.
Xiao et al. [53] performed the steam gasification of livestock manure in a fluidised bed.
Biomass was fed at a constant rate of 0.6 kg hr-1
into a two stage gasifier. Reactor
temperature was varied from 540 to 639 °C and the reactions were carried out in a
nitrogen environment. In agreement with other studies, increase in temperature
improved the carbon conversion efficiency and gas yield. Hydrogen concentration and
energy conversion also improved with the increase in temperature. This improved
gasification performance was attributed to the further release of volatiles and thermal
cracking and steam reforming of tar. According to the Le chatelier principle, higher
temperatures favour the forward endothermic steam reforming reaction.
Gao et al. [54] investigate the influence of temperature on the steam gasification of pine
sawdust. They used a fixed-bed gasifier connected with a porous ceramic reformer.
Biomass was fed to the reactor using a screw feeder at a constant rate of 0.44 kg hr-1
.
Steam flow rate and steam to biomass ratio were kept constant at 0.67 kg hr-1
and 1.05
respectively. During this study, temperature was varied from 800 to 950 °C. Overall gas
yield and hydrogen gas concentration increased with the increase in temperature while
product gas heating value was decreased. They reported that higher temperature favours
endothermic reactions which in turn resulted in higher concentration of hydrogen in
product gas.
36
2.2.4 Steam to biomass ratio
Steam to biomass ratio is one of the major factors affecting the gas yield and hydrogen
concentration. Among the other operating parameters, the influence of steam to biomass
ratio has been widely studied [50, 62-68]. Optimal steam to biomass ratio is essential
for maximum gas yield and enhanced hydrogen gas concentration. Little or no steam
results in lower gas yield and less concentration of hydrogen because steam is required
for all the major reactions for the production of hydrogen gas. These reactions include
water gas, steam methane reforming and water gas shift reactions. Similarly if excess
steam is injected into the reactor, it results in lower gas yield and less hydrogen
concentration. There are two possible explanations for this behaviour, firstly injecting
excess steam lowers reactor temperature and secondly increased concentration of steam
disturb the equilibrium of the above mentioned interlinked reactions and results in lower
gas yield and less hydrogen concentrations.
Li et al. [43] investigated the effect of steam to biomass ratio on the yield and the
composition of gas produced during the steam gasification of palm oil waste. All the
experiments were carried out at a constant reactor temperature of 800 °C. Steam to
biomass ratio was varied from 0 to 2.67 while all other reaction parameters were kept
constant. Steam to biomass ratio was varied by varying the steam rate from 0 to 0.8 kg
hr-1
while biomass feed was kept constant at 0.3 kg hr-1
. Initially with the introduction
of steam, an increasing trend was observed in overall gas yield and hydrogen gas
concentration while a decrease in LHV was noticed. This increasing trend in hydrogen
concentration and overall gas yield was almost linear when the steam to biomass ratio
(SBR) was increased from 0 to 1.33 but when SBR was varied from 1.33 to 2.67 a
decreasing trend was observed for gas yield and hydrogen gas concentration. The
increase was probably explained by the fact that the initial introduction of steam
favoured the forward water gas and water gas shift reactions while the decrease in
hydrogen concentration was probably the result of decrease in reaction temperature with
the injection of excess steam. CO2 concentration increased when SBR was increased
from 0 to 2.67 whereas CO, CH4 and other lighter hydrocarbons shows a decreasing
trend. This might be due to the steam reforming reaction which was favoured by the
increase in SBR from 0 to 2.67. Cracking of tar and lighter hydrocarbons was further
favoured by the increase in residence time due to the use of catalyst.
37
Luo et al. [51] performed steam gasification of biomass in a fixed-bed reactor. The
effect of steam to biomass ratio was investigated at a constant temperature of 900 °C.
SBR was varied from 0 to 2.80. It was reported that when the SBR was varied from 0 to
0.73, tar contents decreased sharply from 4.7 to 0 %. This proved the initial
effectiveness of steam injection into the reaction environment. When SBR was varied
from 0.73 to 2.80 gas composition of H2 and CO2 was not monotonic. Initially there was
an increase in H2 and CO2 concentration perhaps due to the decomposition of CH4 and
other lighter hydrocarbons. Water gas, thermal cracking of tar, water gas shift reaction
and Boudouard reactions were favoured by the increased steam while the opposite was
true when a decline in the concentration of H2 and CO2 was observed with the excess
injection of steam. Increase in steam partial pressure favoured the above mentioned
reactions in reverse direction.
Initial steam injection of steam favoured tar cracking and decomposition of
hydrocarbons and resulted in enhanced gas yield and improved carbon conversion
efficiencies. On the other hand, excess steam lowered the reactor temperature and
decreased decomposition of steam. Considering the maximum overall gas yield and
carbon conversion, an optimal value of 1.43 was suggested for SBR. At this SBR of
1.43 a maximum dry gas yield of 2.53 Nm3 kg
-1 and maximum carbon conversion
efficiency of 92.59 % were achieved. Maximum concentration of hydrogen gas was
obtained at SBR of 2.10.
Franco et al. [52] investigated the effect of steam to biomass ratio on steam gasification
of biomass. Three different biomass; pine, eucalyptus and holm-oak were used in this
study. SBR was varied from 0.4 to 0.85 w/w whereas reaction temperature was kept
constant at 800 °C. Variation in SBR was achieved by varying the biomass feed rate
while steam flow rate was kept constant. Maximum gaseous products were obtained for
SBR ranging from 0.6 to 0.7. For pine wood, a decrease in CO concentration was
observed for SBR of up to 0.6 while no significant change in concentration was
observed for higher SBR values. With the increase in SBR, little or no influence was
observed on lighter hydrocarbons concentration. No significant changes in the
concentration of CO2 were observed while H2 formation was favoured by the
introduction of steam and the maximum H2 concentration was obtained for SBR values
of 0.6 to 0.7. Similar trends were found for the other two biomass samples. Gas yield,
carbon conversion efficiency and energy contents were increased with the increase in
38
SBR up to 0.7 while lowest HHV were observed for the same SBR range. When the
SBR was lower than 0.6, less steam was available to complete the water gas and steam
methane reforming reactions but when it was increased from 0.7, water gas reactions are
favoured which resulted in enhanced H2 and CO concentration. This increased H2
concentration favoured the methanation reaction and hence formation of CH4. Increased
CO concentration was explained by the enhanced rate of reaction for the Boudouard
reaction which is favoured by more steam being available. CO2 concentration was
almost constant for all values of SBR.
2.2.5 The influence of gasifying agent
Overall gas yield and the percentage of individual gases in a syngas heavily depend on
the nature of the gasifying agent. Steam, air and oxygen are normally used as gasifying
agents. In some literature [28, 69-71], it has been reported that a combination of air and
steam was used to vary the amount of available oxygen for the gasification reaction.
Steam and oxygen gasification have proved to be more effective in terms of amount of
hydrogen gas production. The cost associated with the use of pure oxygen makes the
overall process less economically feasible. In order to carry out steam gasification, a
higher temperature is required to carry out gasification reactions to produce hydrogen
from biomass and steam. Air gasification is cheap and cost effective for large scale
industrial processes. Many researchers [72-76] have investigated the air gasification of
different biomass materials but the low production of hydrogen gas makes it less
attractive.
González et al. [28] performed a comparative study to investigate the effect of gasifying
agents on the gasification of biomass. Olive oil waste was used in this study and a
constant SBR of 1.2 w/w was used. Temperature was varied from 700 to 900 °C and
ZnCl2 and dolomite were used as a catalyst. Results showed that the less solid was
produced for steam gasification as compared to air gasification. At 900 °C only 6.04 %
solid was left unreacted but in case of air gasification 17.69 % solid was found at the
end of the reaction at the same temperature. This showed that the presence of steam
favoured the gasification of solid biomass. Water gas, water gas shift reaction and steam
reforming reaction, all are favoured by the presence of steam in the gasification reactor.
With steam gasification, the use of ZnCl2 and dolomite as a catalyst further decrease the
solid yield by enhancing the gasification of solid char. Solid yield was further decreased
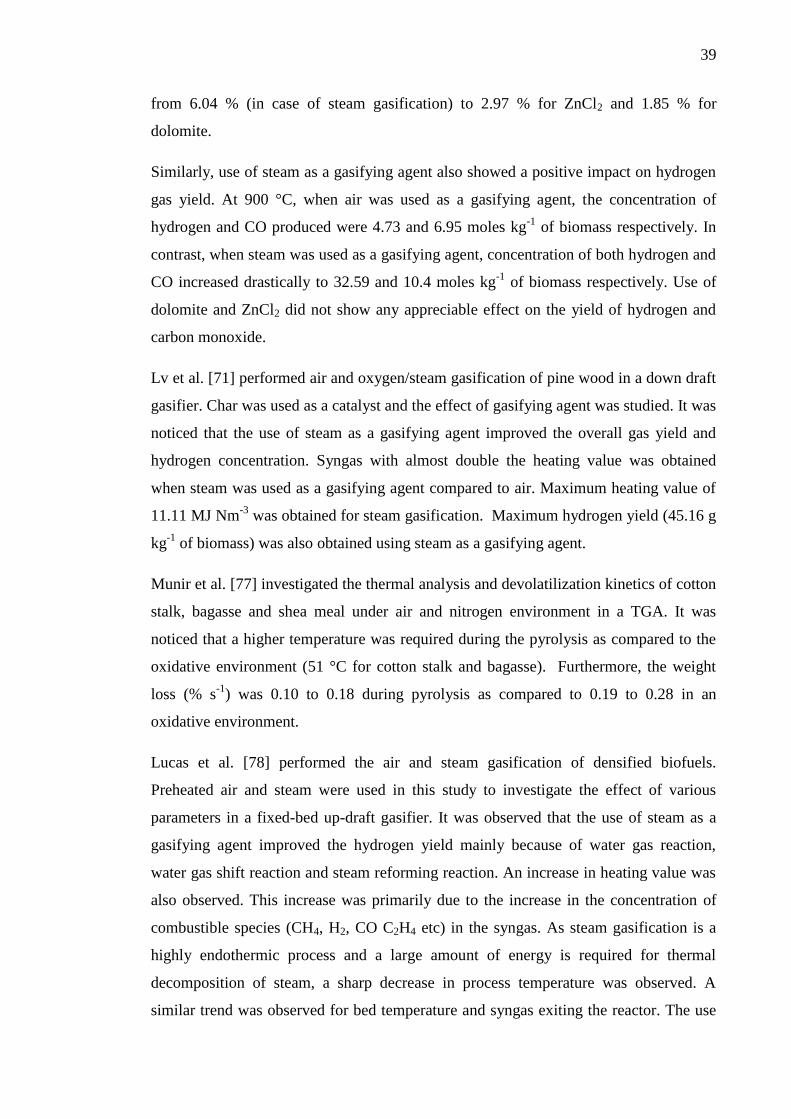
39
from 6.04 % (in case of steam gasification) to 2.97 % for ZnCl2 and 1.85 % for
dolomite.
Similarly, use of steam as a gasifying agent also showed a positive impact on hydrogen
gas yield. At 900 °C, when air was used as a gasifying agent, the concentration of
hydrogen and CO produced were 4.73 and 6.95 moles kg-1
of biomass respectively. In
contrast, when steam was used as a gasifying agent, concentration of both hydrogen and
CO increased drastically to 32.59 and 10.4 moles kg-1
of biomass respectively. Use of
dolomite and ZnCl2 did not show any appreciable effect on the yield of hydrogen and
carbon monoxide.
Lv et al. [71] performed air and oxygen/steam gasification of pine wood in a down draft
gasifier. Char was used as a catalyst and the effect of gasifying agent was studied. It was
noticed that the use of steam as a gasifying agent improved the overall gas yield and
hydrogen concentration. Syngas with almost double the heating value was obtained
when steam was used as a gasifying agent compared to air. Maximum heating value of
11.11 MJ Nm-3
was obtained for steam gasification. Maximum hydrogen yield (45.16 g
kg-1
of biomass) was also obtained using steam as a gasifying agent.
Munir et al. [77] investigated the thermal analysis and devolatilization kinetics of cotton
stalk, bagasse and shea meal under air and nitrogen environment in a TGA. It was
noticed that a higher temperature was required during the pyrolysis as compared to the
oxidative environment (51 °C for cotton stalk and bagasse). Furthermore, the weight
loss (% s-1
) was 0.10 to 0.18 during pyrolysis as compared to 0.19 to 0.28 in an
oxidative environment.
Lucas et al. [78] performed the air and steam gasification of densified biofuels.
Preheated air and steam were used in this study to investigate the effect of various
parameters in a fixed-bed up-draft gasifier. It was observed that the use of steam as a
gasifying agent improved the hydrogen yield mainly because of water gas reaction,
water gas shift reaction and steam reforming reaction. An increase in heating value was
also observed. This increase was primarily due to the increase in the concentration of
combustible species (CH4, H2, CO C2H4 etc) in the syngas. As steam gasification is a
highly endothermic process and a large amount of energy is required for thermal
decomposition of steam, a sharp decrease in process temperature was observed. A
similar trend was observed for bed temperature and syngas exiting the reactor. The use
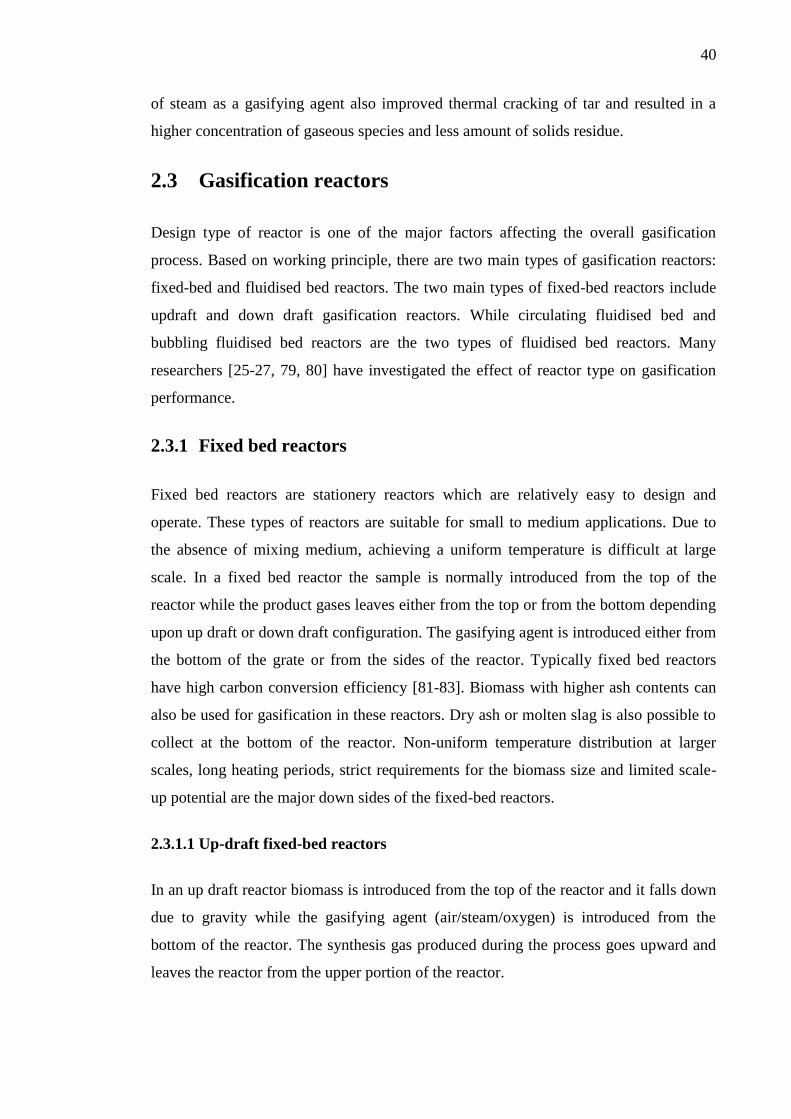
40
of steam as a gasifying agent also improved thermal cracking of tar and resulted in a
higher concentration of gaseous species and less amount of solids residue.
2.3 Gasification reactors
Design type of reactor is one of the major factors affecting the overall gasification
process. Based on working principle, there are two main types of gasification reactors:
fixed-bed and fluidised bed reactors. The two main types of fixed-bed reactors include
updraft and down draft gasification reactors. While circulating fluidised bed and
bubbling fluidised bed reactors are the two types of fluidised bed reactors. Many
researchers [25-27, 79, 80] have investigated the effect of reactor type on gasification
performance.
2.3.1 Fixed bed reactors
Fixed bed reactors are stationery reactors which are relatively easy to design and
operate. These types of reactors are suitable for small to medium applications. Due to
the absence of mixing medium, achieving a uniform temperature is difficult at large
scale. In a fixed bed reactor the sample is normally introduced from the top of the
reactor while the product gases leaves either from the top or from the bottom depending
upon up draft or down draft configuration. The gasifying agent is introduced either from
the bottom of the grate or from the sides of the reactor. Typically fixed bed reactors
have high carbon conversion efficiency [81-83]. Biomass with higher ash contents can
also be used for gasification in these reactors. Dry ash or molten slag is also possible to
collect at the bottom of the reactor. Non-uniform temperature distribution at larger
scales, long heating periods, strict requirements for the biomass size and limited scale-
up potential are the major down sides of the fixed-bed reactors.
2.3.1.1 Up-draft fixed-bed reactors
In an up draft reactor biomass is introduced from the top of the reactor and it falls down
due to gravity while the gasifying agent (air/steam/oxygen) is introduced from the
bottom of the reactor. The synthesis gas produced during the process goes upward and
leaves the reactor from the upper portion of the reactor.
41
As shown in Figure 2-1, biomass dropped from the top falls down due to gravity and
passes through different zones. Biomass is dried and devolatilized in drying and
devolatilization zones respectively. Char is formed due to drying and devolatilization
resulting in an increase in the temperature of this zone. Hot gases flowing upward are
reduced immediately above the oxidation zone. The oxidation zone is the bottom zone
and it is hottest of all the zones. These hot gases while passing upward cause pyrolysis
and drying of the biomass. This whole process cools the gases and product gases leave
at the top at relatively lower temperature. Tar and volatiles are produced due to the
pyrolysis of biomass. Some of the tar may leave along with the outgoing gases. Ash is
swept downward along with the solid biomass opposite to the direction of flow of gases.
Finally ash falls at the bottom through a grate. Therefore up draft reactors produce
higher tar contents than the down draft reactors but due to the lower temperature of
exiting gases overall thermal efficiency of the up-draft gasifier is better than the down
draft counterpart [83-86].
Figure 2-1 Schematic diagram of an up-draft reactor [87]
42
2.3.1.2 Down-draft fixed-bed reactors
In a down draft reactor, biomass is introduced from the top and the gasifying agent
(air/steam/oxygen) is introduced from either from the sides of the reactor or from the
top of the reactor. The product gases leave the reactor near the bottom.
Similar to the up draft reactor, biomass falls freely from the top and pass through
different heating zones. Biomass is first dried and devolatilized in drying and
devolatilization zones respectively. Due to this devolatilization, char is formed and this
char formation increases the reaction temperature. As the char goes further down,
oxidation and reduction reactions take place in their respective zones. Various reactions
occurring in different zones are summarized in Table 2-5, adapted from Buragohain et
al. [87].
Figure 2-2 Schematic diagram of a down-draft reactor [78]
As the product gases leave the reactor from the bottom just after the oxidation zone,
temperature of the exit gases is relatively higher hence the overall efficiency of the
down draft reactor is low as compared to an updraft reactor. Just before leaving the
reactor product gases pass through the hottest zone. This results in further cracking and
decomposition of tar and hence less tar contents are observed in product gases leaving
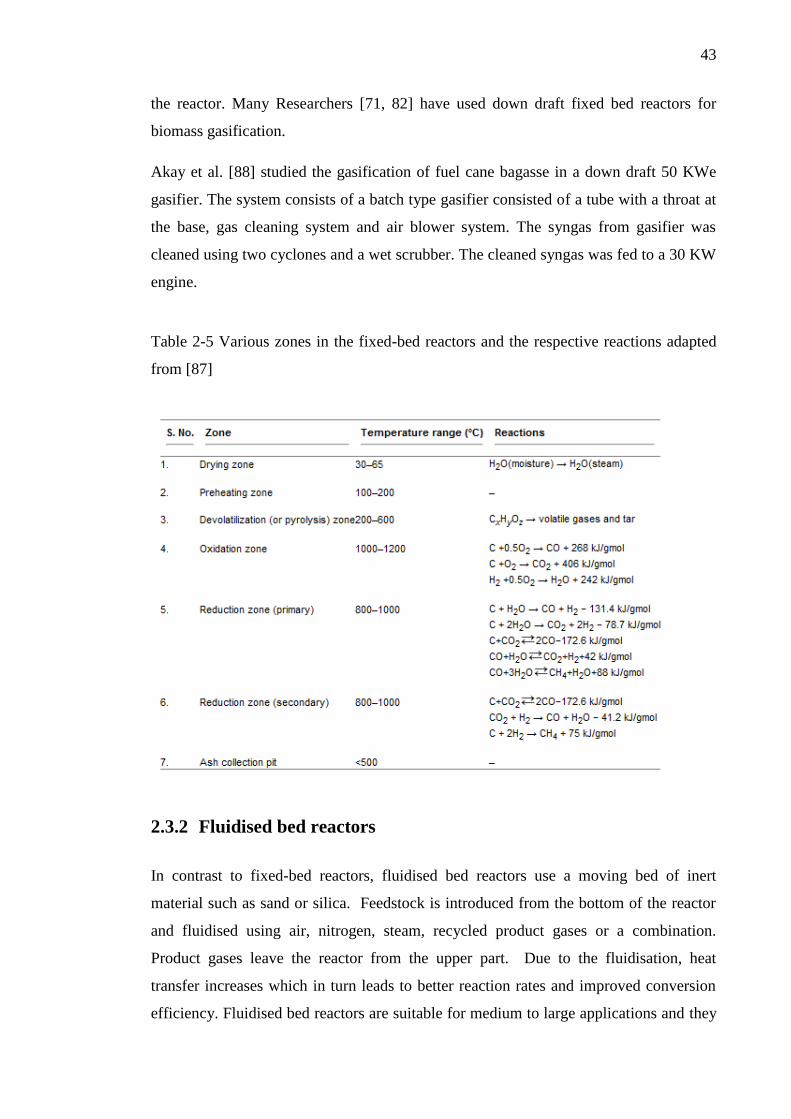
43
the reactor. Many Researchers [71, 82] have used down draft fixed bed reactors for
biomass gasification.
Akay et al. [88] studied the gasification of fuel cane bagasse in a down draft 50 KWe
gasifier. The system consists of a batch type gasifier consisted of a tube with a throat at
the base, gas cleaning system and air blower system. The syngas from gasifier was
cleaned using two cyclones and a wet scrubber. The cleaned syngas was fed to a 30 KW
engine.
Table 2-5 Various zones in the fixed-bed reactors and the respective reactions adapted
from [87]
2.3.2 Fluidised bed reactors
In contrast to fixed-bed reactors, fluidised bed reactors use a moving bed of inert
material such as sand or silica. Feedstock is introduced from the bottom of the reactor
and fluidised using air, nitrogen, steam, recycled product gases or a combination.
Product gases leave the reactor from the upper part. Due to the fluidisation, heat
transfer increases which in turn leads to better reaction rates and improved conversion
efficiency. Fluidised bed reactors are suitable for medium to large applications and they
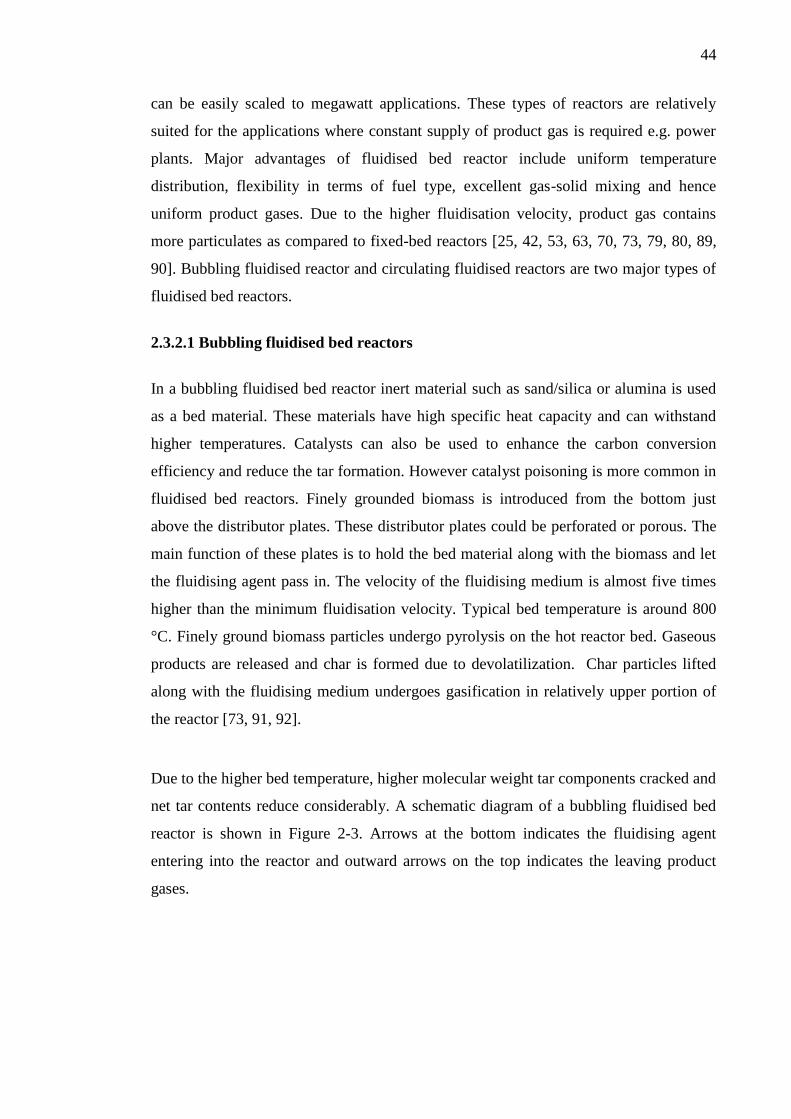
44
can be easily scaled to megawatt applications. These types of reactors are relatively
suited for the applications where constant supply of product gas is required e.g. power
plants. Major advantages of fluidised bed reactor include uniform temperature
distribution, flexibility in terms of fuel type, excellent gas-solid mixing and hence
uniform product gases. Due to the higher fluidisation velocity, product gas contains
more particulates as compared to fixed-bed reactors [25, 42, 53, 63, 70, 73, 79, 80, 89,
90]. Bubbling fluidised reactor and circulating fluidised reactors are two major types of
fluidised bed reactors.
2.3.2.1 Bubbling fluidised bed reactors
In a bubbling fluidised bed reactor inert material such as sand/silica or alumina is used
as a bed material. These materials have high specific heat capacity and can withstand
higher temperatures. Catalysts can also be used to enhance the carbon conversion
efficiency and reduce the tar formation. However catalyst poisoning is more common in
fluidised bed reactors. Finely grounded biomass is introduced from the bottom just
above the distributor plates. These distributor plates could be perforated or porous. The
main function of these plates is to hold the bed material along with the biomass and let
the fluidising agent pass in. The velocity of the fluidising medium is almost five times
higher than the minimum fluidisation velocity. Typical bed temperature is around 800
°C. Finely ground biomass particles undergo pyrolysis on the hot reactor bed. Gaseous
products are released and char is formed due to devolatilization. Char particles lifted
along with the fluidising medium undergoes gasification in relatively upper portion of
the reactor [73, 91, 92].
Due to the higher bed temperature, higher molecular weight tar components cracked and
net tar contents reduce considerably. A schematic diagram of a bubbling fluidised bed
reactor is shown in Figure 2-3. Arrows at the bottom indicates the fluidising agent
entering into the reactor and outward arrows on the top indicates the leaving product
gases.
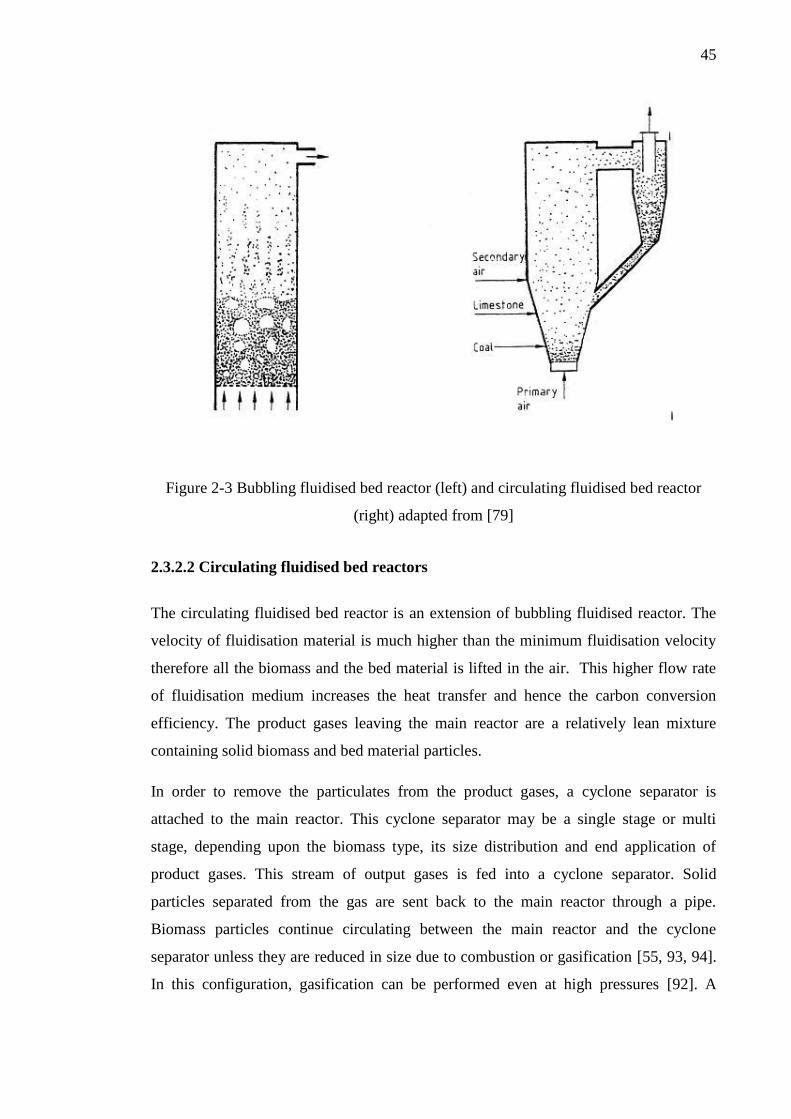
45
Figure 2-3 Bubbling fluidised bed reactor (left) and circulating fluidised bed reactor
(right) adapted from [79]
2.3.2.2 Circulating fluidised bed reactors
The circulating fluidised bed reactor is an extension of bubbling fluidised reactor. The
velocity of fluidisation material is much higher than the minimum fluidisation velocity
therefore all the biomass and the bed material is lifted in the air. This higher flow rate
of fluidisation medium increases the heat transfer and hence the carbon conversion
efficiency. The product gases leaving the main reactor are a relatively lean mixture
containing solid biomass and bed material particles.
In order to remove the particulates from the product gases, a cyclone separator is
attached to the main reactor. This cyclone separator may be a single stage or multi
stage, depending upon the biomass type, its size distribution and end application of
product gases. This stream of output gases is fed into a cyclone separator. Solid
particles separated from the gas are sent back to the main reactor through a pipe.
Biomass particles continue circulating between the main reactor and the cyclone
separator unless they are reduced in size due to combustion or gasification [55, 93, 94].
In this configuration, gasification can be performed even at high pressures [92]. A
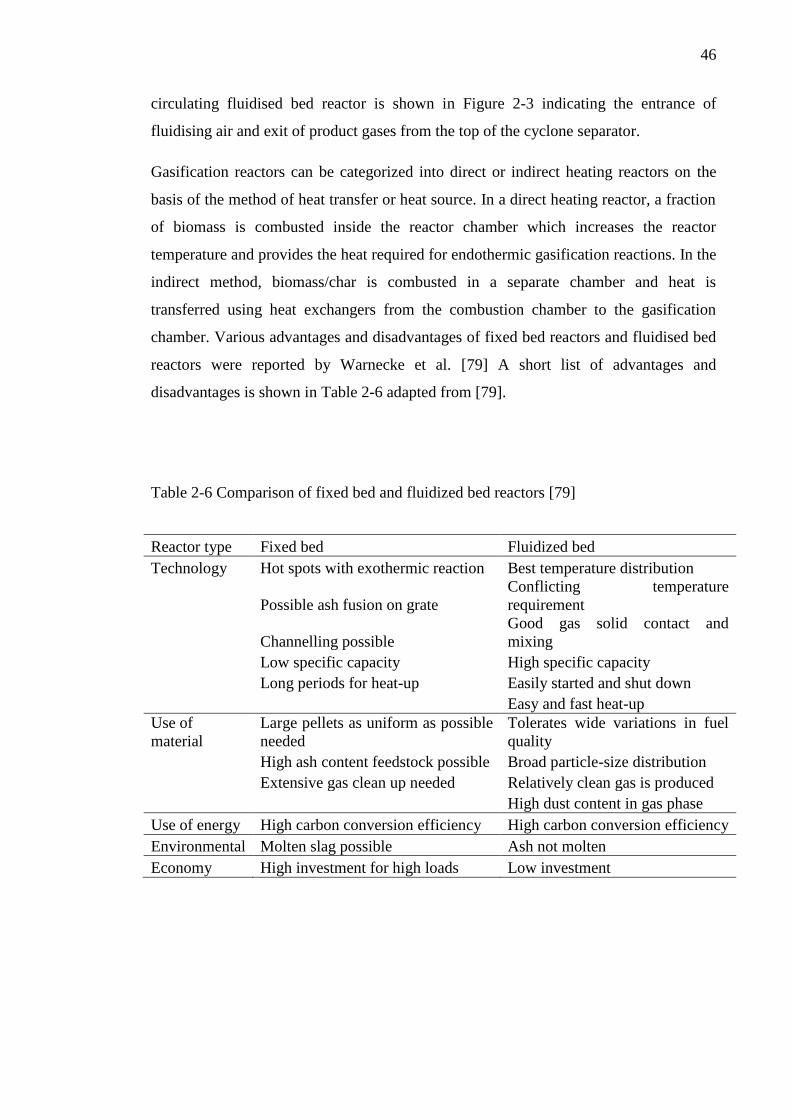
46
circulating fluidised bed reactor is shown in Figure 2-3 indicating the entrance of
fluidising air and exit of product gases from the top of the cyclone separator.
Gasification reactors can be categorized into direct or indirect heating reactors on the
basis of the method of heat transfer or heat source. In a direct heating reactor, a fraction
of biomass is combusted inside the reactor chamber which increases the reactor
temperature and provides the heat required for endothermic gasification reactions. In the
indirect method, biomass/char is combusted in a separate chamber and heat is
transferred using heat exchangers from the combustion chamber to the gasification
chamber. Various advantages and disadvantages of fixed bed reactors and fluidised bed
reactors were reported by Warnecke et al. [79] A short list of advantages and
disadvantages is shown in Table 2-6 adapted from [79].
Table 2-6 Comparison of fixed bed and fluidized bed reactors [79]
Reactor type Fixed bed Fluidized bed
Technology Hot spots with exothermic reaction Best temperature distribution
Possible ash fusion on grate
Conflicting temperature
requirement
Channelling possible
Good gas solid contact and
mixing
Low specific capacity High specific capacity
Long periods for heat-up Easily started and shut down
Easy and fast heat-up
Use of
material
Large pellets as uniform as possible
needed
Tolerates wide variations in fuel
quality
High ash content feedstock possible Broad particle-size distribution
Extensive gas clean up needed Relatively clean gas is produced
High dust content in gas phase
Use of energy High carbon conversion efficiency High carbon conversion efficiency
Environmental Molten slag possible Ash not molten
Economy High investment for high loads Low investment
47
2.4 Catalytic gasification
Catalysts are widely used in biomass gasification to enhance the hydrogen yield and to
reduce tar contents [12, 95-106]. These catalysts can be categorised as either primary or
secondary catalysts. Primary catalysts are directly mixed with the biomass prior to
gasification. These catalysts can be added by dry mixing with biomass or by wet
impregnation. As these catalysts cannot be recovered, cheap catalysts are used for
mixing. They have little reforming effect on gasification products but can effectively
reduce tar contents in the product gas. Catalysts placed in a separate reactor
downstream, are known as secondary catalysts. Temperature and other operating
conditions in this separate reactor are similar to that of the main reactor. Gaseous
products from the main reactor pass over the catalyst placed in this chamber. These
types of catalysts can be recovered and reused. Conditions inside the chamber can be
controlled independent of the main gasification reactor and steam or CO2 can also be
introduced to enhance the H2 yield and reduce tar contents as shown in the reactions in
Section 2.1 [107]. Secondary catalysts placed in a separate reactor play an active
reforming role for hydrocarbons and methane.
Various types of catalysts are used for biomass gasification [2, 3, 28, 43, 53, 65, 89,
107-128]. Dolomite, olivine and metal catalysts are among the most commonly used
catalysts. Sutton et al. [107] reviewed various catalysts used in biomass gasification.
They grouped these catalysts in three major categories namely 1) Dolomite 2) Alkali
metal catalysts and 3) Nickel based catalysts. Ni-based catalysts are effective for tar
reduction and enhanced hydrogen production. Although the noble metals like Rh and
Ru are more effective than Ni based catalysts, their high cost makes them less
favourable.
Many researchers have used Ni-based catalysts for biomass gasification [65, 89, 107,
110-112, 117, 120, 124, 126]. Ni based catalysts are also commonly used in industry but
the problems associated with the sintering, fouling and mechanical deactivation of these
catalysts must be addressed. In many cases, various additives are added to enhance the
catalytic activity of Ni-based catalysts. Different types of catalysts used in biomass
gasification are discussed in the next section.
48
2.4.1 Mineral-based catalysts
Various minerals are used as catalyst for various chemical reactions. Mineral-based
catalysts also play an important role in biomass gasification. Dolomite and olivine are
the most widely used naturally occurring catalysts in biomass gasification. These
catalysts help reducing the tar contents and enhance the overall gas yield.
2.4.1.1 Dolomite
Dolomite is a crystalline ore used as a catalyst in biomass gasification [2, 3, 89, 90, 107,
110, 115, 120, 124, 127]. It is a magnesium ore with a chemical formula of
MgCO3.CaCO3. Exact composition depends on the mineral source. Pore size and
surface area also varies from source to source. Typically it contains 30 wt.% CaO, 21
wt.% MgO and 45 wt.% CO2 along with traces of Al2O3, Fe2O3 and SiO2. Being one of
naturally occurring minerals, it is cheap and widely used as a primary catalyst. It is dry
mixed with biomass prior to gasification. It is also used in downstream reactors to
reduce tar contents in product gases. In this case it helps in reducing coking of nickel
based reforming catalysts.
Corujo et al. [110] carried out gasification of eucalyptus saligna in a laboratory scale
reactor. The amount of dolomite catalyst was varied from 2 g to 20 g and its effect on
product gas composition was investigated. The use of Ni-loaded calcined dolomite
increased 30 % product gas volume. The maximum energy yield (21.50 MJ kg-1
on a
dry-wood basis) was obtained with the least amount of Ni loading (0.4 wt.% Ni-
dolomite). Ni loading also improved the catalytic ability of dolomite catalysts. Only
0.05 g carbon was formed after 5 hours of operation when dolomite was loaded with 1.6
wt.% Ni.
The performance of various catalysts has been evaluated by Miccio et al. [120] in a
bubbling fluidised bed reactor. Dolomite, olivine, quartzite and alumina were
investigated in this study. Use of dolomite as a catalyst resulted in enhanced overall gas
yield and reduced tar formation. In comparison to the other catalysts used in this study,
use of olivine showed a nominal gas yield (1.02 kg/kg while 1.14 for quartzite and 1.21
for alumina). Its performance in relation to tar reduction was also the same. The least
amount of tar was released when alumina was used as a catalyst while the use of quartz
49
produced maximum tar. Dolomite and olivine were intermediate with 14 g m-3
and 12 g
m-3
of tar respectively.
Tomishige et al. [127] performed gasification of cedar wood in a fluidised bed reactor.
Performance of various catalysts has been compared in this study. Dolomite was
compared with commercial steam reforming catalyst G-91 and Rh/CeO2/SiO2 at
relatively lower temperatures (550 to 700 °C). Although the other catalysts like G-91
and Rh/CeO2/SiO2 out performed dolomite catalyst but its use as a catalyst reduced tar
from 139 g m-3
(no catalyst) to 113g m-3
. Similarly it improved H2 concentration from
1.99 (no catalyst) to 3.22 vol.%.
Hu et al. [115] compared the performance of dolomite and olivine catalysts during the
gasification of apricot stones in a fixed-bed reactor. Both catalysts were used
downstream to enhance the hydrogen concentration in the product gas. Calcined
dolomite produced more H2 (130.9 g H2 kg-1
biomass daf.) as compared to the olivine
catalyst (67.7 g H2 kg-1
biomass daf.) at 850 °C with steam to biomass ratio of 0.8 but
calcined olivine kept its mechanical strength and dolomite appeared to be a friable
substance.
2.4.1.2 Olivine
Olivine is also one of the minerals widely used as a catalyst in biomass gasification. Its
chemical formula is (Mg. Fe)2 SiO4 commonly known as magnesium iron silicate.
Various groups have used it to research its catalytic activity on biomass gasification [90,
94, 111, 112, 115, 120, 123].
Catalytic activity of naturally occurring dolomite and olivine was investigated by
Rapagná et al. [90] in a laboratory scale reactor. Almost similar results were reported
for both catalysts under the same operating conditions but olivine exhibited better
mechanical strength especially when used in a fluidised bed reactor. Both catalysts
improved tar cracking and resulted in less tar content in the product gas. Courson et al.
[112] optimised olivine based catalysts to enhance the hydrogen gas yield from biomass
gasification. Catalyst was loaded with more than 5 % NiO and calcined at 1100 °C.
When tested at 800 °C with a CH4/CO2 ratio of 1, hydrogen yield was more than 95 %
after 80 hours. Very good stability of the catalyst was observed with little or no
sintering or coking. In another study conducted by Courson et al. [111], a similar kind
50
of Ni/olivine catalyst was investigated at various calcination temperatures. Catalyst
containing 2.8 wt.% Ni, calcined at 1100 °C out performed others with 95 % methane
conversion in dry reforming and 88 % in steam-reforming. It produced 80 % CO during
dry reforming and 75 % during steam reforming process. Characterisation after use of
the catalyst showed little carbon deposition and no sintering of nickel particles. These
results after 260 hours of operation at 800 °C suggest this catalyst as one of the most
suitable candidates for fluidised bed reactors.
2.4.2 Nickel based and other metal catalysts
As nickel based catalysts have been used by industry for many years for steam
reforming of hydrocarbons and methane, most of the literature available is based on
commercially available nickel catalysts. Nickel based catalyst have various advantages
over their other counterparts. Many supporter/promoter species can be added into these
nickel based catalysts to enhance their catalytic capabilities. Being the most important
element in group VIII metals, nickel is widely used in industries as a reforming catalyst
for methane and hydrocarbons [65, 89, 107, 110-112, 117, 120, 124, 126]. Normally at
temperatures around 800 °C or above, nickel based catalysts enhance over all gas yield
(mainly CO and H2 concentration) and reduce methane and hydrocarbons
concentrations.
Various Ni-based catalysts are listed below.
i. Ni/Al2O3 catalyst
ii. Ni-Al catalyst
iii. Ni-Al-Mg and Ni- Al-K catalysts
iv. Ni/MgO catalyst
v. Ni/CeO2 catalyst
vi. Ni/CeO2/Al2O3 catalyst
vii. Ni/Olivine
viii. Ni/Dolomite
ix. Ni/Zeolite and Ni/Ce/Zeolite
x. Ni based commercial catalysts
51
Alumina is a good support for nickel catalysts. It enhances physical and chemical
stability of catalyst and improves its mechanical resistance. Ni/Al2O3 catalyst has been
used by many researchers [53, 120, 126] for biomass gasification. This catalyst showed
high mechanical strength but it faces a deactivation problem.
In order to solve this problem other combinations of Ni and Al have been developed in
the form of Ni-Al catalyst. It was prepared by co-precipitation and showed high
catalytic activity due to its thermal stability and bigger surface area. Martínez et al.
[119] developed and investigated the performance of Ni-Al catalyst after introducing La
into the catalyst. It improved overall gas yield but H2 concentration remain unchanged.
Alkali/Alkaline earth metals like K or Mg have been introduced into Ni-Al catalyst to
improve its physical strength especially for its use in fluidised bed reactors. K is
important and it is supposed to improve carbon gasification and reduce carbon
deposition on catalysts. Addition of MgO to Ni produces a catalyst which is effective
for reforming. Sato et al. [124] developed and tested the performance of Ni/MgO
catalyst for biomass gasification. This catalyst when loaded with CaO from dolomite
and doped with WO3 as a promoter against sulphur showed improved reforming
activity. They used naphthalene as a model tar compound in this study and catalyst
showed improved resistance to coking and sulphur poisoning in comparison to various
commercially available nickel catalysts.
CeO2 is an effective promoter for Ni catalysts. It reduces coking on nickel based
catalyst by promoting the reaction between carbon and steam. This promotion capability
is due to the fact that CeO2 has the capability to store oxygen. Despite acting as a
promoter, it showed low activity for tar gasification. Park et al. [65] researched various
Ni/CeO2 catalysts for biomass gasification. ZrO2 was added to this catalyst and various
concentrations were investigated but 15 wt.% Ni/CeO2 (75 %) – ZrO2 (25 %) showed
enhanced catalytic activity over the other commercial catalysts. The presence of CeO2
stopped coking and the catalyst performed for 5 hours effectively. Similarly addition of
CeO2 to Ni/Al2O3 improved the performance and solved the problem of deactivation by
stopping coke formation on the catalyst. This resulted in improved performance during
biomass gasification and enhanced H2 production and reduction in tar [114, 122].
Olivine and dolomite are minerals used as catalysts. Olivine helps to reduce tar
concentration during gasification of biomass but Ni was added to improve its
52
performance. Dolomite is one of the most commonly used minerals as a catalyst for
biomass gasification. It is soft in nature and need some support like Ni to improve its
mechanical strength and hence catalytic activity. Details about olivine and dolomite
catalysts have been discussed in previous section.
Another class of Ni based catalyst is Ni/Zeolite or Ni/Ce/zeolite. Increased surface area,
adjustable acid sites and special pore size make this catalyst a very important candidate
for biomass gasification. Addition of CeO2 prevents the carbon deposition on catalyst.
Many commercial nickel based catalysts have been researched by various groups for
gasification of biomass. It is observed that catalysts designed for naphtha reforming are
more suitable for tar reduction as compared to the ones used for hydrocarbon (methane
and natural gas) reforming [129].
Alkali and other metal catalysts are also used in biomass gasification mainly to reduce
tar and to upgrade the product gases. Typically these metals are used as primary
catalysts and added in the biomass sample either by dry mixing or wet impregnation.
Being used as a primary catalyst creates problems related to the recovery of these
catalysts. As these catalysts are not very cheap and non- recovery of these catalysts
renders the whole gasification process uneconomical. Due to the use of these catalysts,
increase in ash concentration has also been reported [107] which poses another problem
for the whole process.
Demirbas et al. [113] used various alkali metal catalysts to investigate their catalytic
ability on pyrolysis of various biomass samples (cotton cocoon shell, tea factory waste
and olive husk). Temperature was varied from 502 °C (775 K) to 752 °C (1025 K) with
equal increments of 75 °C. When the amount of Na2CO3 was varied from 5 to 45 g for
different temperatures mentioned above for cotton cocoon shell biomass, an increase in
H2 concentration was observed. Similar kind of behaviour was observed for K2CO3
where relatively higher concentration of 49 vol.% and 47 vol.% were produced for
temperatures of 502 °C (775 K) and 577 °C (850 K) respectively.
Marońo et al. [118] used a Fe-Cr catalyst to accelerate the water gas shift reaction in a
micro reactor. The catalyst performed well at lower temperatures 350 – 450 °C and an
increase of 10 - 17 % in H2 concentration was observed. Tasaka et al. [125] investigated
the performance of Co/MgO catalyst in a fluidised bed reactor during steam gasification
of radiata pine. Higher performance of MgO loaded with 12 wt.% Co was reported.
53
2.5 Ultra-high temperature gasification of biomass
Biomass gasification at ultra-high temperatures (T > 900 °C) is a relatively new area
for many researchers. Enhanced hydrogen yield, higher carbon conversion efficiency
and low tar in the product gas make the process simple and attractive. No further
cracking or reforming of product gas is required e.g. high temperature of the reactor
eliminates the need of a separate reactor which is often required to further crack down
the tar contents in the product gas. As this area of research is relatively new, the effect
of various catalysts and other gasification variables must be investigated to better
understand this biomass gasification at ultra-high temperatures.
Very few researchers have studied biomass gasification around 1000 °C or above [78,
130-135]. Jangsawang et al. [131] studied the various factors of biomass gasification
(temperature, steam/cellulose, air/steam) using the EQUIL (a part of Chemkin software)
code. They used cellulose as a biomass model compound and compared the calculated
results with the experimental results. During the simulation, temperature was varied
from 400 K to 1800 K while experiments were carried out from 500 °C to 1000 °C. It
was established that the concentration of H2 and CO increased with the increase in
temperature in both cases. But the actual concentration was less than the theoretical
result. Steam only gasification was found to be more effective than air-steam
gasification.
In another study [130] Gupta et al. carried out gasification of different biomass at ultra-
high temperature using a specially designed reactor. The reactor comprises of a
combustion chamber surrounded by an electrically heated furnace. High temperature
steam was obtained from the combustion of hydrogen and oxygen in this combustion
chamber. The desired mass flow rate of steam was achieved by the flow rate of oxygen
and hydrogen. Thermocouples were also used at different positions to measure the
temperature. Before the product gas passed to any analysing equipment, it was passed
through a filter to trap any particulates. The gas was analysed by a micro gas
chromatograph. Paper, cardboard and wood pellets, cellulose and MSW (municipal
solid waste) were used as target material and temperature was varied from 700 °C to
1100 °C. Again the experimental results were compared with the calculated results
using EQUIL; a part of Chemkin software. The results showed a strong influence of
high-temperature on the overall gas yield in general and on hydrogen concentration in
54
particular. Paper waste produced the highest amount of hydrogen (~ 36 %) at 1000 °C.
All other biomass produced ~ 25 % hydrogen at 1100 °C. Results produced by EQUIL
were in agreement with the experimental results. Higher temperature resulted in low tar
contents. Using the same gasification reactor, Kriengsak et al. [132] gasified paper
waste, wood chips and coal up to 1200 °C. Results showed a 10 times decrease in tar
with the increase in temperature. It was also observed that increasing the temperature up
to 1200 °C also increase the hydrogen gas production especially in cellulose rich
biomass like waste papers. An increase in CO concentration with a decrease in CO2
concentration was observed.
Skoulou et al. [133, 134] investigated the gasification of olive kernel at high
temperature using steam as gasifying agent. Temperature was varied from 750 °C to
1050 °C. A gas of medium heating value was obtained at 1050 °C. Almost 40 %
hydrogen was produced at a maximum temperature of 1050 °C. Tar contents were
decreased from 124.07 g/Nm3 to 25.26 g/Nm
3; a reduction of 79.64 %. Similarly Zhou
et al. [135] carried out gasification of three different biomass (Rice husk, sawdust and
camphor wood ) at high temperatures. Temperature was varied from 1000 °C to 1400
°C. Results indicated that the increase in temperature favour biomass gasification and
enhance H2 and CO yield.
2.6 Research aims and objectives
The overall aim of the project is to study the various process parameters of biomass
gasification at ultra-high temperatures (T ~1000 ˚C) in order to enhance the yield of
hydrogen gas.
Objectives of this research are as follows.
Design of ultra-high temperature steam gasification reactor
Investigate the influence of slow pyrolysis and flash pyrolysis on gas yield and
hydrogen yield
Comparative study of pyrolysis, two-stage pyrolysis/gasification and catalytic
steam gasification of various biomass samples at ultra-high temperature
55
Investigation of various process parameters including gasification temperature,
presence of catalyst, steam injection rate, catalyst to sample ratio and carrier
gas flow rate on hydrogen production from biomass using steam gasification
Preparation of catalysts to investigate the influence of various catalysts on
hydrogen production from the two-stage pyrolysis/gasification of biomass
Investigation of various catalysts parameters including calcination temperature,
Ni loading and addition of other metals on hydrogen yield
Investigate the influence of various process parameters on ultra-high
temperature steam gasification of biomass char
56
2.7 Conclusions
Gasification is the process of conversion of solid carbonaceous materials into
various combustible gases. Biomass mainly consists of cellulose, hemicellulose
and lignin. The process of biomass gasification is a complex set of reactions
interlinked with each other.
Production of hydrogen gas from biomass depends on various factors. Physical
properties of biomass such as its size, shape and physical structure or chemical
properties such as amount of ash, fixed carbon or volatile matter effects the
process. Smaller particle size favours the process and better surface to volume
ratio results in enhanced hydrogen production. Pre-treatment of the biomass to
bring it to the required size and shape is also an important obstacle for the large
scale implementation of biomass gasification. Gasification temperature is the
most influencing parameter for the whole process and increase in temperature
results in an increase in overall gas yield. Use of steam as a gasifying agent has
proved very useful. It plays a very important role in the whole process. A
considerable increase in hydrogen concentration was reported when steam was
used as a gasifying agent as compared to air. As the whole process of biomass
gasification is the set of various reversible chemical reactions linked together,
varying the steam to biomass ratio results in considerable change in gas
composition. A nominal steam supply enhances the hydrogen yield.
Design of the gasification reactor is also one of the major factors in determining
the overall gas yield and efficiency of the whole process. Two most commonly
used gasification reactors are fixed bed reactors and fluidised bed reactors. Both
types have their own pros and cons but fixed bed reactors, being simple, are easy
to design and operate especially for small scale applications like the usage in a
laboratory. Up-draft and down-draft are the two types of fixed bed reactors
while bubbling fluidised bed reactors and circulating fluidised bed reactors are
the two sub categories of fluidised bed reactors.
57
Use of catalyst to enhance the yield the hydrogen concentration and to reduce
the tar in product gas has proved to be very effective. Various types of catalysts
are in use to enhance hydrogen concentration either by cracking of the tar or by
catalysing the steam reforming reactions. Various mineral based catalysts like
dolomite/olivine or metal based catalysts like nickel/alkali metals are in use.
Production of hydrogen gas at ultra-high temperature (T > 900 °C) is relatively
a new area of research and much work needs to be done in order to attain the in
depth understanding of the whole gasification process.
58
2.8 Chapter references
[1] J. Arauzo, D. Radlein, J. Piskorz, and D. S. Scott, "A New Catalyst for the
Catalytic Gasification of Biomass," Energy & Fuels, vol. 8, pp. 1192-1196,
1994/11/01 1994.
[2] M. Asadullah, T. Miyazawa, S.-i. Ito, K. Kunimori, S. Koyama, and K.
Tomishige, "A comparison of Rh/CeO2/SiO2 catalysts with steam reforming
catalysts, dolomite and inert materials as bed materials in low throughput
fluidized bed gasification systems," Biomass and Bioenergy, vol. 26, pp. 269-
279, 2004.
[3] M. Asadullah, T. Miyazawa, S.-i. Ito, K. Kunimori, and K. Tomishige,
"Demonstration of real biomass gasification drastically promoted by effective
catalyst," Applied Catalysis A: General, vol. 246, pp. 103-116, 2003.
[4] H. Chen, Y. Ding, N. T. Cong, B. Dou, V. Dupont, M. Ghadiri, et al., "Progress
in low temperature hydrogen production with simultaneous CO2 abatement,"
Chemical Engineering Research and Design, vol. 89, pp. 1774-1782, 9// 2011.
[5] K.-Y. Chiang, K.-L. Chien, and C.-H. Lu, "Hydrogen energy production from
disposable chopsticks by a low temperature catalytic gasification," International
Journal of Hydrogen Energy, vol. 37, pp. 15672-15680, 2012.
[6] A. Corujo, L. Yermán, B. Arizaga, M. Brusoni, and J. Castiglioni, "Improved
yield parameters in catalytic steam gasification of forestry residue; optimizing
biomass feed rate and catalyst type," Biomass and Bioenergy, vol. 34, pp. 1695-
1702, 2010.
[7] P. Mondal, G. S. Dang, and M. O. Garg, "Syngas production through
gasification and cleanup for downstream applications — Recent developments,"
Fuel Processing Technology, vol. 92, pp. 1395-1410, 8// 2011.
[8] E. Furimsky, "Gasification in Petroleum Refinery of 21st Century," Oil & Gas
Science and Technology - Rev. IFP, vol. 54, pp. 597-618, 1999.
[9] P. J. Woolcock and R. C. Brown, "A review of cleaning technologies for
biomass-derived syngas," Biomass and Bioenergy, vol. 52, pp. 54-84, 5// 2013.
[10] B. Dou, J. Gao, X. Sha, and S. W. Baek, "Catalytic cracking of tar component
from high-temperature fuel gas," Applied Thermal Engineering, vol. 23, pp.
2229-2239, 12// 2003.
[11] D. Wang, W. Yuan, and W. Ji, "Char and char-supported nickel catalysts for
secondary syngas cleanup and conditioning," Applied Energy, vol. 88, pp. 1656-
1663, 5// 2011.
[12] E. M. Grieco, C. Gervasio, and G. Baldi, "Lanthanum–chromium–nickel
perovskites for the catalytic cracking of tar model compounds," Fuel, vol. 103,
pp. 393-397, 1// 2013.
[13] C. A. Jordan and G. Akay, "Occurrence, composition and dew point of tars
produced during gasification of fuel cane bagasse in a downdraft gasifier,"
Biomass and Bioenergy, vol. 42, pp. 51-58, 7// 2012.
[14] C. A. Jordan and G. Akay, "Effect of CaO on tar production and dew point
depression during gasification of fuel cane bagasse in a novel downdraft
gasifier," Fuel Processing Technology, vol. 106, pp. 654-660, 2// 2013.
[15] E. M. Monono, P. E. Nyren, M. T. Berti, and S. W. Pryor, "Variability in
biomass yield, chemical composition, and ethanol potential of individual and
mixed herbaceous biomass species grown in North Dakota," Industrial Crops
and Products, vol. 41, pp. 331-339, 1// 2013.
59
[16] S. V. Vassilev, D. Baxter, L. K. Andersen, and C. G. Vassileva, "An overview of
the chemical composition of biomass," Fuel, vol. 89, pp. 913-933.
[17] C. Andrea Jordan and G. Akay, "Speciation and distribution of alkali, alkali
earth metals and major ash forming elements during gasification of fuel cane
bagasse," Fuel, vol. 91, pp. 253-263, 1// 2012.
[18] M. Dogru, C. R. Howarth, G. Akay, B. Keskinler, and A. A. Malik,
"Gasification of hazelnut shells in a downdraft gasifier," Energy, vol. 27, pp.
415-427, 5// 2002.
[19] V. Kirubakaran, V. Sivaramakrishnan, R. Nalini, T. Sekar, M. Premalatha, and
P. Subramanian, "A review on gasification of biomass," Renewable and
Sustainable Energy Reviews, vol. 13, pp. 179-186, 2009.
[20] K. Raveendran, A. Ganesh, and K. C. Khilar, "Influence of mineral matter on
biomass pyrolysis characteristics," Fuel, vol. 74, pp. 1812-1822, 1995.
[21] P. T. Williams and S. Besler, "The pyrolysis of rice husks in a
thermogravimetric analyser and static batch reactor," Fuel, vol. 72, pp. 151-159,
1993.
[22] P. T. Williams and S. Besler, "The influence of temperature and heating rate on
the slow pyrolysis of biomass," Renewable Energy, vol. 7, pp. 233-250, 1996.
[23] S. S. Daood, S. Munir, W. Nimmo, and B. M. Gibbs, "Char oxidation study of
sugar cane bagasse, cotton stalk and Pakistani coal under 1% and 3% oxygen
concentrations," Biomass and Bioenergy, vol. 34, pp. 263-271, 2010.
[24] S. V. Vassilev, D. Baxter, L. K. Andersen, C. G. Vassileva, and T. J. Morgan,
"An overview of the organic and inorganic phase composition of biomass,"
Fuel, vol. 94, pp. 1-33, 4// 2012.
[25] Z. A. B. Z. Alauddin, P. Lahijani, M. Mohammadi, and A. R. Mohamed,
"Gasification of lignocellulosic biomass in fluidized beds for renewable energy
development: A review," Renewable and Sustainable Energy Reviews, vol. In
Press, Corrected Proof.
[26] M.-K. Bahng, C. Mukarakate, D. J. Robichaud, and M. R. Nimlos, "Current
technologies for analysis of biomass thermochemical processing: A review,"
Analytica Chimica Acta, vol. 651, pp. 117-138, 2009.
[27] A. V. Bridgwater, "The technical and economic feasibility of biomass
gasification for power generation," Fuel, vol. 74, pp. 631-653, 1995.
[28] J. F. González, S. Román, D. Bragado, and M. Calderón, "Investigation on the
reactions influencing biomass air and air/steam gasification for hydrogen
production," Fuel Processing Technology, vol. 89, pp. 764-772, 2008.
[29] Y. Kalinci, A. Hepbasli, and I. Dincer, "Biomass-based hydrogen production: A
review and analysis," International Journal of Hydrogen Energy, vol. 34, pp.
8799-8817, 2009.
[30] R. C. Saxena, D. Seal, S. Kumar, and H. B. Goyal, "Thermo-chemical routes for
hydrogen rich gas from biomass: A review," Renewable and Sustainable Energy
Reviews, vol. 12, pp. 1909-1927, 2008.
[31] A. Tanksale, J. N. Beltramini, and G. M. Lu, "A review of catalytic hydrogen
production processes from biomass," Renewable and Sustainable Energy
Reviews, vol. 14, pp. 166-182.
[32] I. Ahmed, W. Jangsawang, and A. K. Gupta, "Energy recovery from pyrolysis
and gasification of mangrove," Applied Energy, vol. 91, pp. 173-179, 2012.
[33] I. I. Ahmed and A. K. Gupta, "Sugarcane bagasse gasification: Global reaction
mechanism of syngas evolution," Applied Energy, vol. 91, pp. 75-81, 2012.
60
[34] C. E. Efika, C. Wu, and P. T. Williams, "Syngas production from pyrolysis–
catalytic steam reforming of waste biomass in a continuous screw kiln reactor,"
Journal of Analytical and Applied Pyrolysis, vol. 95, pp. 87-94, 5// 2012.
[35] L. Emami Taba, M. F. Irfan, W. A. M. Wan Daud, and M. H. Chakrabarti, "The
effect of temperature on various parameters in coal, biomass and CO-
gasification: A review," Renewable and Sustainable Energy Reviews, vol. 16,
pp. 5584-5596, 2012.
[36] J. F. Pérez, A. Melgar, and P. N. Benjumea, "Effect of operating and design
parameters on the gasification/combustion process of waste biomass in fixed bed
downdraft reactors: An experimental study," Fuel, vol. 96, pp. 487-496, 2012.
[37] K. Qin, W. Lin, P. A. Jensen, and A. D. Jensen, "High-temperature entrained
flow gasification of biomass," Fuel, vol. 93, pp. 589-600, 2012.
[38] J. M. Encinar, J. F. González, and J. González, "Steam gasification of Cynara
cardunculus L.: influence of variables," Fuel Processing Technology, vol. 75,
pp. 27-43, 2002.
[39] J. J. Hernández, G. Aranda-Almansa, and A. Bula, "Gasification of biomass
wastes in an entrained flow gasifier: Effect of the particle size and the residence
time," Fuel Processing Technology, vol. 91, pp. 681-692, 2010.
[40] S. Luo, B. Xiao, X. Guo, Z. Hu, S. Liu, and M. He, "Hydrogen-rich gas from
catalytic steam gasification of biomass in a fixed bed reactor: Influence of
particle size on gasification performance," International Journal of Hydrogen
Energy, vol. 34, pp. 1260-1264, 2009.
[41] S. Luo, B. Xiao, Z. Hu, S. Liu, Y. Guan, and L. Cai, "Influence of particle size
on pyrolysis and gasification performance of municipal solid waste in a fixed
bed reactor," Bioresource Technology, vol. 101, pp. 6517-6520, 2010.
[42] S. Rapagnà and A. Latif, "Steam gasification of almond shells in a fluidised bed
reactor: the influence of temperature and particle size on product yield and
distribution," Biomass and Bioenergy, vol. 12, pp. 281-288, 1997.
[43] J. Li, Y. Yin, X. Zhang, J. Liu, and R. Yan, "Hydrogen-rich gas production by
steam gasification of palm oil wastes over supported tri-metallic catalyst,"
International Journal of Hydrogen Energy, vol. 34, pp. 9108-9115, 2009.
[44] R. Yin, R. Liu, J. Wu, X. Wu, C. Sun, and C. Wu, "Influence of particle size on
performance of a pilot-scale fixed-bed gasification system," Bioresource
Technology, vol. 119, pp. 15-21, 2012.
[45] B. V. Babu and A. S. Chaurasia, "Modeling for pyrolysis of solid particle:
kinetics and heat transfer effects," Energy Conversion and Management, vol. 44,
pp. 2251-2275, 2003.
[46] O. Onay and O. Mete Koçkar, "Fixed-bed pyrolysis of rapeseed (Brassica napus
L.)," Biomass and Bioenergy, vol. 26, pp. 289-299, 2004.
[47] O. Onay and O. M. Kockar, "Slow, fast and flash pyrolysis of rapeseed,"
Renewable Energy, vol. 28, pp. 2417-2433, 2003.
[48] L. Wei, S. Xu, L. Zhang, H. Zhang, C. Liu, H. Zhu, et al., "Characteristics of
fast pyrolysis of biomass in a free fall reactor," Fuel Processing Technology,
vol. 87, pp. 863-871, 2006.
[49] V. Wilk and H. Hofbauer, "Influence of fuel particle size on gasification in a
dual fluidized bed steam gasifier," Fuel Processing Technology, vol. 115, pp.
139-151, 11// 2013.
[50] F. Yan, S.-y. Luo, Z.-q. Hu, B. Xiao, and G. Cheng, "Hydrogen-rich gas
production by steam gasification of char from biomass fast pyrolysis in a fixed-
61
bed reactor: Influence of temperature and steam on hydrogen yield and syngas
composition," Bioresource Technology, vol. 101, pp. 5633-5637, 2010.
[51] S. Luo, B. Xiao, Z. Hu, S. Liu, X. Guo, and M. He, "Hydrogen-rich gas from
catalytic steam gasification of biomass in a fixed bed reactor: Influence of
temperature and steam on gasification performance," International Journal of
Hydrogen Energy, vol. 34, pp. 2191-2194, 2009.
[52] C. Franco, F. Pinto, I. Gulyurtlu, and I. Cabrita, "The study of reactions
influencing the biomass steam gasification process," Fuel, vol. 82, pp. 835-842,
2003.
[53] X. Xiao, D. D. Le, L. Li, X. Meng, J. Cao, K. Morishita, et al., "Catalytic steam
gasification of biomass in fluidized bed at low temperature: Conversion from
livestock manure compost to hydrogen-rich syngas," Biomass and Bioenergy,
vol. 34, pp. 1505-1512, 2010.
[54] N. Gao, A. Li, and C. Quan, "A novel reforming method for hydrogen
production from biomass steam gasification," Bioresource Technology, vol. 100,
pp. 4271-4277, 2009.
[55] G. Chen, J. Andries, H. Spliethoff, M. Fang, and P. J. van de Enden, "Biomass
gasification integrated with pyrolysis in a circulating fluidised bed," Solar
Energy, vol. 76, pp. 345-349.
[56] I. F. Elbaba and P. T. Williams, "Two stage pyrolysis-catalytic gasification of
waste tyres: Influence of process parameters," Applied Catalysis B:
Environmental, vol. 125, pp. 136-143, 8/21/ 2012.
[57] T. Imam and S. Capareda, "Characterization of bio-oil, syn-gas and bio-char
from switchgrass pyrolysis at various temperatures," Journal of Analytical and
Applied Pyrolysis, vol. 93, pp. 170-177, 2012.
[58] S. Septien, S. Valin, C. Dupont, M. Peyrot, and S. Salvador, "Effect of particle
size and temperature on woody biomass fast pyrolysis at high temperature
(1000–1400°C)," Fuel, vol. 97, pp. 202-210, 2012.
[59] Y. Chen, H. Yang, X. Wang, S. Zhang, and H. Chen, "Biomass-based pyrolytic
polygeneration system on cotton stalk pyrolysis: Influence of temperature,"
Bioresource Technology, vol. 107, pp. 411-418, 2012.
[60] P. Fu, S. Hu, J. Xiang, L. Sun, S. Su, and J. Wang, "Evaluation of the porous
structure development of chars from pyrolysis of rice straw: Effects of pyrolysis
temperature and heating rate," Journal of Analytical and Applied Pyrolysis, vol.
98, pp. 177-183, 2012.
[61] K. Sasaki, X. Qiu, Y. Hosomomi, S. Moriyama, and T. Hirajima, "Effect of
natural dolomite calcination temperature on sorption of borate onto calcined
products," Microporous and Mesoporous Materials, vol. 171, pp. 1-8, 2013.
[62] J. J. Hernández, R. Ballesteros, and G. Aranda, "Characterisation of tars from
biomass gasification: Effect of the operating conditions," Energy, vol. 50, pp.
333-342, 2013.
[63] A. Kumar, K. Eskridge, D. D. Jones, and M. A. Hanna, "Steam-air fluidized bed
gasification of distillers grains: Effects of steam to biomass ratio, equivalence
ratio and gasification temperature," Bioresource Technology, vol. 100, pp. 2062-
2068, 2009.
[64] A. Smolinski, K. Stanczyk, and N. Howaniec, "Steam gasification of selected
energy crops in a fixed bed reactor," Renewable Energy, vol. 35, pp. 397-404,
2010.
[65] H. J. Park, S. H. Park, J. M. Sohn, J. Park, J.-K. Jeon, S.-S. Kim, et al., "Steam
reforming of biomass gasification tar using benzene as a model compound over
62
various Ni supported metal oxide catalysts," Bioresource Technology, vol. 101,
pp. S101-S103, 2010.
[66] D. Li, L. Wang, M. Koike, Y. Nakagawa, and K. Tomishige, "Steam reforming
of tar from pyrolysis of biomass over Ni/Mg/Al catalysts prepared from
hydrotalcite-like precursors," Applied Catalysis B: Environmental, vol. 102, pp.
528-538, 2011.
[67] K. Umeki, T. Namioka, and K. Yoshikawa, "The effect of steam on pyrolysis
and char reactions behavior during rice straw gasification," Fuel Processing
Technology, vol. 94, pp. 53-60, 2012.
[68] P. Nanou, H. E. Gutiérrez Murillo, W. P. M. van Swaaij, G. van Rossum, and S.
R. A. Kersten, "Intrinsic reactivity of biomass-derived char under steam
gasification conditions-potential of wood ash as catalyst," Chemical Engineering
Journal, vol. 217, pp. 289-299, 2013.
[69] A. Ponzio, S. Kalisz, and W. Blasiak, "Effect of operating conditions on tar and
gas composition in high temperature air/steam gasification (HTAG) of plastic
containing waste," Fuel Processing Technology, vol. 87, pp. 223-233, 2006.
[70] P. M. Lv, Z. H. Xiong, J. Chang, C. Z. Wu, Y. Chen, and J. X. Zhu, "An
experimental study on biomass air-steam gasification in a fluidized bed,"
Bioresource Technology, vol. 95, pp. 95-101, 2004.
[71] P. Lv, Z. Yuan, L. Ma, C. Wu, Y. Chen, and J. Zhu, "Hydrogen-rich gas
production from biomass air and oxygen/steam gasification in a downdraft
gasifier," Renewable Energy, vol. 32, pp. 2173-2185, 2007.
[72] T.-Y. Mun, J.-W. Kim, and J.-S. Kim, "Air gasification of dried sewage sludge
in a two-stage gasifier: Part 1. The effects and reusability of additives on the
removal of tar and hydrogen production," International Journal of Hydrogen
Energy.
[73] M. Campoy, A. Gómez-Barea, F. B. Vidal, and P. Ollero, "Air-steam
gasification of biomass in a fluidised bed: Process optimisation by enriched air,"
Fuel Processing Technology, vol. 90, pp. 677-685, 2009.
[74] J. D. Martínez, E. E. Silva Lora, R. V. Andrade, and R. L. Jaén, "Experimental
study on biomass gasification in a double air stage downdraft reactor," Biomass
and Bioenergy, vol. 35, pp. 3465-3480, 8// 2011.
[75] M. A. A. Mohammed, A. Salmiaton, W. A. K. G. Wan Azlina, M. S.
Mohammad Amran, and A. Fakhru’l-Razi, "Air gasification of empty fruit
bunch for hydrogen-rich gas production in a fluidized-bed reactor," Energy
Conversion and Management, vol. 52, pp. 1555-1561, 2011.
[76] T.-Y. Mun, J.-W. Kim, and J.-S. Kim, "Air gasification of railroad wood ties
treated with creosote: Effects of additives and their combination on the removal
of tar in a two-stage gasifier," Fuel, vol. 102, pp. 326-332, 12// 2012.
[77] S. Munir, S. S. Daood, W. Nimmo, A. M. Cunliffe, and B. M. Gibbs, "Thermal
analysis and devolatilization kinetics of cotton stalk, sugar cane bagasse and
shea meal under nitrogen and air atmospheres," Bioresource Technology, vol.
100, pp. 1413-1418, 2009.
[78] C. Lucas, D. Szewczyk, W. Blasiak, and S. Mochida, "High-temperature air and
steam gasification of densified biofuels," Biomass and Bioenergy, vol. 27, pp.
563-575, 2004.
[79] R. Warnecke, "Gasification of biomass: comparison of fixed bed and fluidized
bed gasifier," Biomass and Bioenergy, vol. 18, pp. 489-497, 2000.
63
[80] E. Natarajan, A. Nordin, and A. N. Rao, "Overview of combustion and
gasification of rice husk in fluidized bed reactors," Biomass and Bioenergy, vol.
14, pp. 533-546.
[81] R. Kramreiter, M. Url, J. Kotik, and H. Hofbauer, "Experimental investigation of
a 125 kW twin-fire fixed bed gasification pilot plant and comparison to the
results of a 2 MW combined heat and power plant (CHP)," Fuel Processing
Technology, vol. 89, pp. 90-102, 2008.
[82] F. V. Tinaut, A. Melgar, J. F. Pérez, and A. Horrillo, "Effect of biomass particle
size and air superficial velocity on the gasification process in a downdraft fixed
bed gasifier. An experimental and modelling study," Fuel Processing
Technology, vol. 89, pp. 1076-1089, 2008.
[83] W. Yang, A. Ponzio, C. Lucas, and W. Blasiak, "Performance analysis of a
fixed-bed biomass gasifier using high-temperature air," Fuel Processing
Technology, vol. 87, pp. 235-245, 2006.
[84] N. Gao, A. Li, C. Quan, and F. Gao, "Hydrogen-rich gas production from
biomass steam gasification in an updraft fixed-bed gasifier combined with a
porous ceramic reformer," International Journal of Hydrogen Energy, vol. 33,
pp. 5430-5438, 2008.
[85] E. Kurkela, P. Ståhlberg, P. Simell, and J. Leppälahti, "Updraft gasification of
peat and biomass," Biomass, vol. 19, pp. 37-46, 1989.
[86] G. Berndes, M. Hoogwijk, and R. van den Broek, "The contribution of biomass
in the future global energy supply: a review of 17 studies," Biomass and
Bioenergy, vol. 25, pp. 1-28, 2003.
[87] B. Buragohain, P. Mahanta, and V. S. Moholkar, "Biomass gasification for
decentralized power generation: The Indian perspective," Renewable and
Sustainable Energy Reviews, vol. 14, pp. 73-92, 2010.
[88] G. Akay and C. A. Jordan, "Gasification of Fuel Cane Bagasse in a Downdraft
Gasifier: Influence of Lignocellulosic Composition and Fuel Particle Size on
Syngas Composition and Yield," Energy & Fuels, vol. 25, pp. 2274-2283,
2011/05/19 2011.
[89] L. Di Felice, C. Courson, N. Jand, K. Gallucci, P. U. Foscolo, and A.
Kiennemann, "Catalytic biomass gasification: Simultaneous hydrocarbons steam
reforming and CO2 capture in a fluidised bed reactor," Chemical Engineering
Journal, vol. 154, pp. 375-383, 2009.
[90] S. Rapagnà, N. Jand, A. Kiennemann, and P. U. Foscolo, "Steam-gasification of
biomass in a fluidised-bed of olivine particles," Biomass and Bioenergy, vol. 19,
pp. 187-197, 2000.
[91] S. Kaewluan and S. Pipatmanomai, "Potential of synthesis gas production from
rubber wood chip gasification in a bubbling fluidised bed gasifier," Energy
Conversion and Management, vol. In Press, Corrected Proof.
[92] W. de Jong, J. Andries, and K. R. G. Hein, "Coal/biomass co-gasification in a
pressurised fluidised bed reactor," Renewable Energy, vol. 16, pp. 1110-1113.
[93] P. García-Ibañez, A. Cabanillas, and J. M. Sánchez, "Gasification of leached
orujillo (olive oil waste) in a pilot plant circulating fluidised bed reactor.
Preliminary results," Biomass and Bioenergy, vol. 27, pp. 183-194, 2004.
[94] J. Pecho, T. J. Schildhauer, M. Sturzenegger, S. Biollaz, and A. Wokaun,
"Reactive bed materials for improved biomass gasification in a circulating
fluidised bed reactor," Chemical Engineering Science, vol. 63, pp. 2465-2476,
2008.
64
[95] Y. Richardson, J. Blin, and A. Julbe, "A short overview on purification and
conditioning of syngas produced by biomass gasification: Catalytic strategies,
process intensification and new concepts," Progress in Energy and Combustion
Science, vol. 38, pp. 765-781, 2012.
[96] B.-S. Huang, H.-Y. Chen, K.-H. Chuang, R.-X. Yang, and M.-Y. Wey,
"Hydrogen production by biomass gasification in a fluidized-bed reactor
promoted by an Fe/CaO catalyst," International Journal of Hydrogen Energy,
vol. 37, pp. 6511-6518, 2012.
[97] R. Isha and P. T. Williams, "Hydrogen production from catalytic steam
reforming of methane: influence of catalyst composition," Journal of the Energy
Institute, vol. 85, pp. 29-37, 2012.
[98] E. Salaices, H. de Lasa, and B. Serrano, "Steam gasification of a cellulose
surrogate over a fluidizable Ni/α-alumina catalyst: A kinetic model," AIChE
Journal, vol. 58, pp. 1588-1599, 2012.
[99] C. Yang, L. Jia, S. Su, Z. Tian, Q. Song, W. Fang, et al., "Utilization of CO2 and
biomass char derived from pyrolysis of Dunaliella salina: The effects of steam
and catalyst on CO and H2 gas production," Bioresource Technology, vol. 110,
pp. 676-681, 2012.
[100] J. A. Onwudili and P. T. Williams, "Hydrogen and methane selectivity during
alkaline supercritical water gasification of biomass with ruthenium-alumina
catalyst," Applied Catalysis B: Environmental, vol. 132–133, pp. 70-79, 3/27/
2013.
[101] S. Singh, M. A. Nahil, X. Sun, C. Wu, J. Chen, B. Shen, et al., "Novel
application of cotton stalk as a waste derived catalyst in the low temperature
SCR-deNOx process," Fuel, vol. 105, pp. 585-594, 3// 2013.
[102] C. Wu, Z. Wang, J. Huang, and P. T. Williams, "Pyrolysis/gasification of
cellulose, hemicellulose and lignin for hydrogen production in the presence of
various nickel-based catalysts," Fuel, vol. 106, pp. 697-706, 2013.
[103] I. F. Elbaba and P. T. Williams, "High yield hydrogen from the pyrolysis–
catalytic gasification of waste tyres with a nickel/dolomite catalyst," Fuel, vol.
106, pp. 528-536, 2013.
[104] P. H. Blanco, C. Wu, J. A. Onwudili, and P. T. Williams, "Characterization and
evaluation of Ni/SiO2 catalysts for hydrogen production and tar reduction from
catalytic steam pyrolysis-reforming of refuse derived fuel," Applied Catalysis B:
Environmental, vol. 134–135, pp. 238-250, 2013.
[105] C. Wang, B. Dou, H. Chen, Y. Song, Y. Xu, X. Du, et al., "Renewable hydrogen
production from steam reforming of glycerol by Ni–Cu–Al, Ni–Cu–Mg, Ni–Mg
catalysts," International Journal of Hydrogen Energy, vol. 38, pp. 3562-3571,
2013.
[106] L.-x. Zhang, S. Kudo, N. Tsubouchi, J.-i. Hayashi, Y. Ohtsuka, and K.
Norinaga, "Catalytic effects of Na and Ca from inexpensive materials on in-situ
steam gasification of char from rapid pyrolysis of low rank coal in a drop-tube
reactor," Fuel Processing Technology, vol. 113, pp. 1-7, 2013.
[107] D. Sutton, B. Kelleher, and J. R. H. Ross, "Review of literature on catalysts for
biomass gasification," Fuel Processing Technology, vol. 73, pp. 155-173, 2001.
[108] M. Asadullah, T. Miyazawa, S.-i. Ito, K. Kunimori, M. Yamada, and K.
Tomishige, "Gasification of different biomasses in a dual-bed gasifier system
combined with novel catalysts with high energy efficiency," Applied Catalysis
A: General, vol. 267, pp. 95-102, 2004.
65
[109] M. Asadullah, T. Miyazawa, S.-i. Ito, K. Kunimori, M. Yamada, and K.
Tomishige, "Catalyst development for the gasification of biomass in the dual-
bed gasifier," Applied Catalysis A: General, vol. 255, pp. 169-180, 2003.
[110] A. Corujo, L. Yermán, B. Arizaga, M. Brusoni, and J. Castiglioni, "Improved
yield parameters in catalytic steam gasification of forestry residue; optimizing
biomass feed rate and catalyst type," Biomass and Bioenergy, vol. In Press,
Corrected Proof.
[111] C. Courson, E. Makaga, C. Petit, and A. Kiennemann, "Development of Ni
catalysts for gas production from biomass gasification. Reactivity in steam- and
dry-reforming," Catalysis Today, vol. 63, pp. 427-437, 2000.
[112] C. Courson, L. Udron, D. Swierczynski, C. Petit, and A. Kiennemann,
"Hydrogen production from biomass gasification on nickel catalysts: Tests for
dry reforming of methane," Catalysis Today, vol. 76, pp. 75-86, 2002.
[113] A. Demirbas, "Gaseous products from biomass by pyrolysis and gasification:
effects of catalyst on hydrogen yield," Energy Conversion and Management,
vol. 43, pp. 897-909, 2002.
[114] A. Haryanto, S. Fernando, and S. Adhikari, "Ultrahigh temperature water gas
shift catalysts to increase hydrogen yield from biomass gasification," Catalysis
Today, vol. 129, pp. 269-274, 2007.
[115] G. Hu, S. Xu, S. Li, C. Xiao, and S. Liu, "Steam gasification of apricot stones
with olivine and dolomite as downstream catalysts," Fuel Processing
Technology, vol. 87, pp. 375-382, 2006.
[116] S. Hurley, H. Li, and C. Xu, "Effects of impregnated metal ions on air/CO2-
gasification of woody biomass," Bioresource Technology, vol. 101, pp. 9301-
9307, 2010.
[117] B. Dou, G. L. Rickett, V. Dupont, P. T. Williams, H. Chen, Y. Ding, et al.,
"Steam reforming of crude glycerol with in situ CO2 sorption," Bioresource
Technology, vol. 101, pp. 2436-2442, 4// 2010.
[118] M. Maroño, J. M. Sánchez, and E. Ruiz, "Hydrogen-rich gas production from
oxygen pressurized gasification of biomass using a Fe-Cr Water Gas Shift
catalyst," International Journal of Hydrogen Energy, vol. 35, pp. 37-45, 2010.
[119] R. Martínez, E. Romero, L. García, and R. Bilbao, "The effect of lanthanum on
Ni-Al catalyst for catalytic steam gasification of pine sawdust," Fuel Processing
Technology, vol. 85, pp. 201-214, 2004.
[120] F. Miccio, B. Piriou, G. Ruoppolo, and R. Chirone, "Biomass gasification in a
catalytic fluidized reactor with beds of different materials," Chemical
Engineering Journal, vol. 154, pp. 369-374, 2009.
[121] M. Ni, D. Y. C. Leung, and M. K. H. Leung, "A review on reforming bio-
ethanol for hydrogen production," International Journal of Hydrogen Energy,
vol. 32, pp. 3238-3247, 2007.
[122] J. Nishikawa, T. Miyazawa, K. Nakamura, M. Asadullah, K. Kunimori, and K.
Tomishige, "Promoting effect of Pt addition to Ni/CeO2/Al2O3 catalyst for
steam gasification of biomass," Catalysis Communications, vol. 9, pp. 195-201,
2008.
[123] S. Rapagná, H. Provendier, C. Petit, A. Kiennemann, and P. U. Foscolo,
"Development of catalysts suitable for hydrogen or syn-gas production from
biomass gasification," Biomass and Bioenergy, vol. 22, pp. 377-388, 2002.
[124] K. Sato and K. Fujimoto, "Development of new nickel based catalyst for tar
reforming with superior resistance to sulfur poisoning and coking in biomass
gasification," Catalysis Communications, vol. 8, pp. 1697-1701, 2007.
66
[125] K. Tasaka, T. Furusawa, and A. Tsutsumi, "Biomass gasification in fluidized
bed reactor with Co catalyst," Chemical Engineering Science, vol. 62, pp. 5558-
5563.
[126] A. D. Taylor, G. J. DiLeo, and K. Sun, "Hydrogen production and performance
of nickel based catalysts synthesized using supercritical fluids for the
gasification of biomass," Applied Catalysis B: Environmental, vol. 93, pp. 126-
133, 2009.
[127] K. Tomishige, M. Asadullah, and K. Kunimori, "Syngas production by biomass
gasification using Rh/CeO2/SiO2 catalysts and fluidized bed reactor," Catalysis
Today, vol. 89, pp. 389-403, 2004.
[128] X. Xiao, X. Meng, D. D. Le, and T. Takarada, "Two-stage steam gasification of
waste biomass in fluidized bed at low temperature: Parametric investigations
and performance optimization," Bioresource Technology, vol. In Press,
Accepted Manuscript.
[129] M. P. Aznar, M. A. Caballero, J. Gil, J. A. Martín, and J. Corella, "Commercial
Steam Reforming Catalysts To Improve Biomass Gasification with
Steam−Oxygen Mixtures. 2. Catalytic Tar Removal," Industrial & Engineering
Chemistry Research, vol. 37, pp. 2668-2680, 1998/07/01 1998.
[130] A. K. Gupta and W. Cichonski, "Ultrahigh temperature steam gasification of
biomass and solid wastes," Environmental Engineering Science, vol. 24, pp.
1179-1189, 2007.
[131] W. Jangsawang, A. Klimanek, and A. K. Gupta, "Enhanced yield of hydrogen
from wastes using high temperature steam gasification," Journal of Energy
Resources Technology-Transactions of the Asme, vol. 128, pp. 179-185, 2006.
[132] S. N. Kriengsak, R. Buczynski, J. Gmurczyk, and A. K. Gupta, "Hydrogen
Production by High-Temperature Steam Gasification of Biomass and Coal,"
Environmental Engineering Science, vol. 26, pp. 739-744, 2009.
[133] V. Skoulou, E. Kantarelis, S. Arvelakis, W. Yang, and A. Zabaniotou, "Effect of
biomass leaching on H2 production, ash and tar behavior during high
temperature steam gasification (HTSG) process," International Journal of
Hydrogen Energy, vol. 34, pp. 5666-5673, 2009.
[134] V. Skoulou, A. Swiderski, W. Yang, and A. Zabaniotou, "Process characteristics
and products of olive kernel high temperature steam gasification (HTSG),"
Bioresource Technology, vol. 100, pp. 2444-2451, 2009.
[135] J. Zhou, Q. Chen, H. Zhao, X. Cao, Q. Mei, Z. Luo, et al., "Biomass-oxygen
gasification in a high-temperature entrained-flow gasifier," Biotechnology
Advances, vol. 27, pp. 606-611.
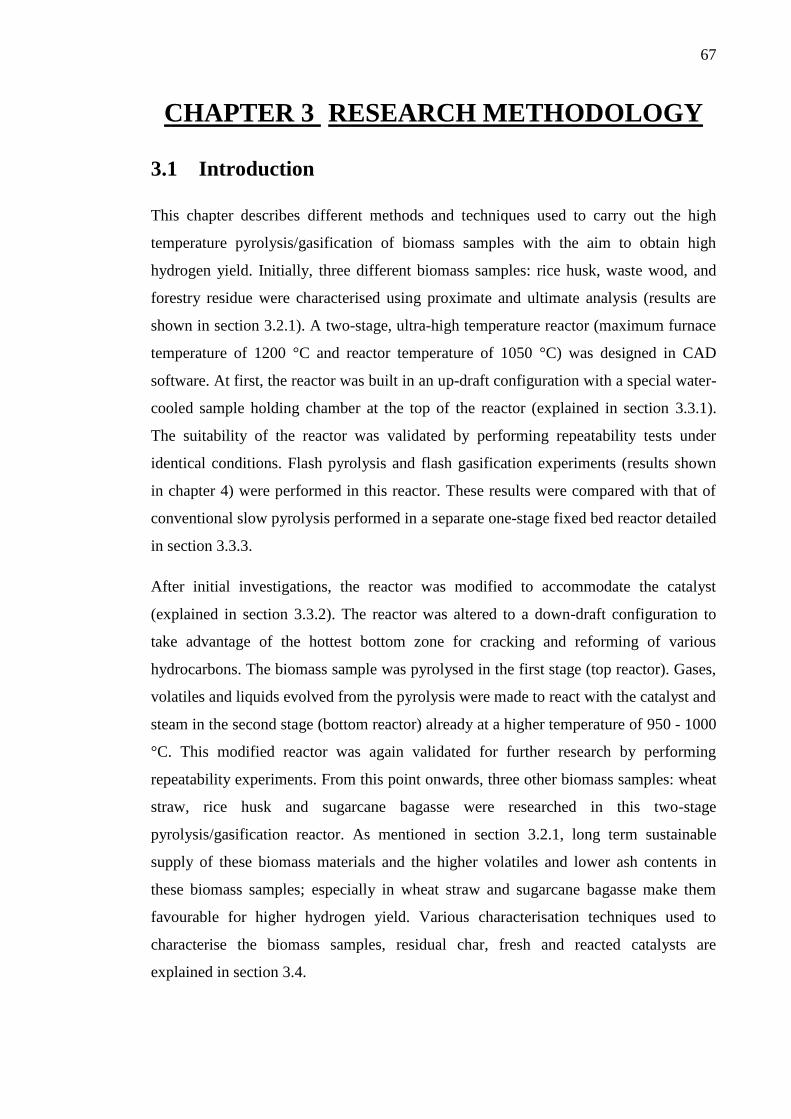
67
CHAPTER 3 RESEARCH METHODOLOGY
3.1 Introduction
This chapter describes different methods and techniques used to carry out the high
temperature pyrolysis/gasification of biomass samples with the aim to obtain high
hydrogen yield. Initially, three different biomass samples: rice husk, waste wood, and
forestry residue were characterised using proximate and ultimate analysis (results are
shown in section 3.2.1). A two-stage, ultra-high temperature reactor (maximum furnace
temperature of 1200 °C and reactor temperature of 1050 °C) was designed in CAD
software. At first, the reactor was built in an up-draft configuration with a special water-
cooled sample holding chamber at the top of the reactor (explained in section 3.3.1).
The suitability of the reactor was validated by performing repeatability tests under
identical conditions. Flash pyrolysis and flash gasification experiments (results shown
in chapter 4) were performed in this reactor. These results were compared with that of
conventional slow pyrolysis performed in a separate one-stage fixed bed reactor detailed
in section 3.3.3.
After initial investigations, the reactor was modified to accommodate the catalyst
(explained in section 3.3.2). The reactor was altered to a down-draft configuration to
take advantage of the hottest bottom zone for cracking and reforming of various
hydrocarbons. The biomass sample was pyrolysed in the first stage (top reactor). Gases,
volatiles and liquids evolved from the pyrolysis were made to react with the catalyst and
steam in the second stage (bottom reactor) already at a higher temperature of 950 - 1000
°C. This modified reactor was again validated for further research by performing
repeatability experiments. From this point onwards, three other biomass samples: wheat
straw, rice husk and sugarcane bagasse were researched in this two-stage
pyrolysis/gasification reactor. As mentioned in section 3.2.1, long term sustainable
supply of these biomass materials and the higher volatiles and lower ash contents in
these biomass samples; especially in wheat straw and sugarcane bagasse make them
favourable for higher hydrogen yield. Various characterisation techniques used to
characterise the biomass samples, residual char, fresh and reacted catalysts are
explained in section 3.4.
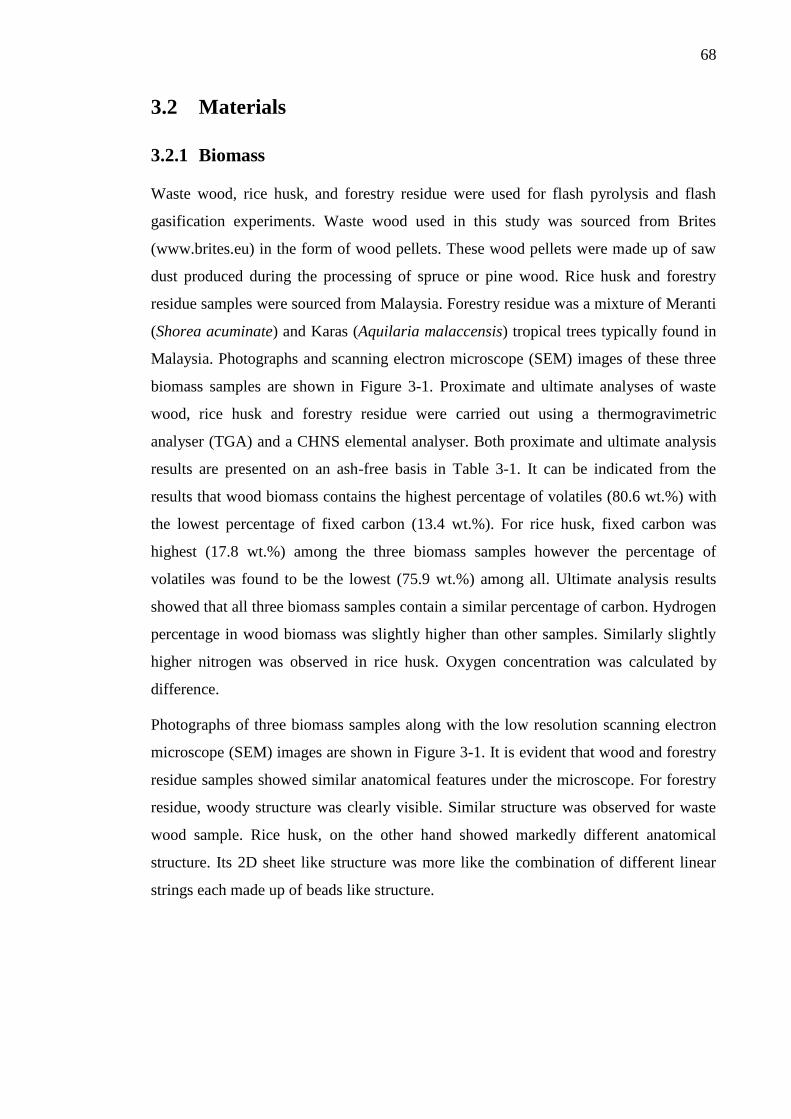
68
3.2 Materials
3.2.1 Biomass
Waste wood, rice husk, and forestry residue were used for flash pyrolysis and flash
gasification experiments. Waste wood used in this study was sourced from Brites
(www.brites.eu) in the form of wood pellets. These wood pellets were made up of saw
dust produced during the processing of spruce or pine wood. Rice husk and forestry
residue samples were sourced from Malaysia. Forestry residue was a mixture of Meranti
(Shorea acuminate) and Karas (Aquilaria malaccensis) tropical trees typically found in
Malaysia. Photographs and scanning electron microscope (SEM) images of these three
biomass samples are shown in Figure 3-1. Proximate and ultimate analyses of waste
wood, rice husk and forestry residue were carried out using a thermogravimetric
analyser (TGA) and a CHNS elemental analyser. Both proximate and ultimate analysis
results are presented on an ash-free basis in Table 3-1. It can be indicated from the
results that wood biomass contains the highest percentage of volatiles (80.6 wt.%) with
the lowest percentage of fixed carbon (13.4 wt.%). For rice husk, fixed carbon was
highest (17.8 wt.%) among the three biomass samples however the percentage of
volatiles was found to be the lowest (75.9 wt.%) among all. Ultimate analysis results
showed that all three biomass samples contain a similar percentage of carbon. Hydrogen
percentage in wood biomass was slightly higher than other samples. Similarly slightly
higher nitrogen was observed in rice husk. Oxygen concentration was calculated by
difference.
Photographs of three biomass samples along with the low resolution scanning electron
microscope (SEM) images are shown in Figure 3-1. It is evident that wood and forestry
residue samples showed similar anatomical features under the microscope. For forestry
residue, woody structure was clearly visible. Similar structure was observed for waste
wood sample. Rice husk, on the other hand showed markedly different anatomical
structure. Its 2D sheet like structure was more like the combination of different linear
strings each made up of beads like structure.
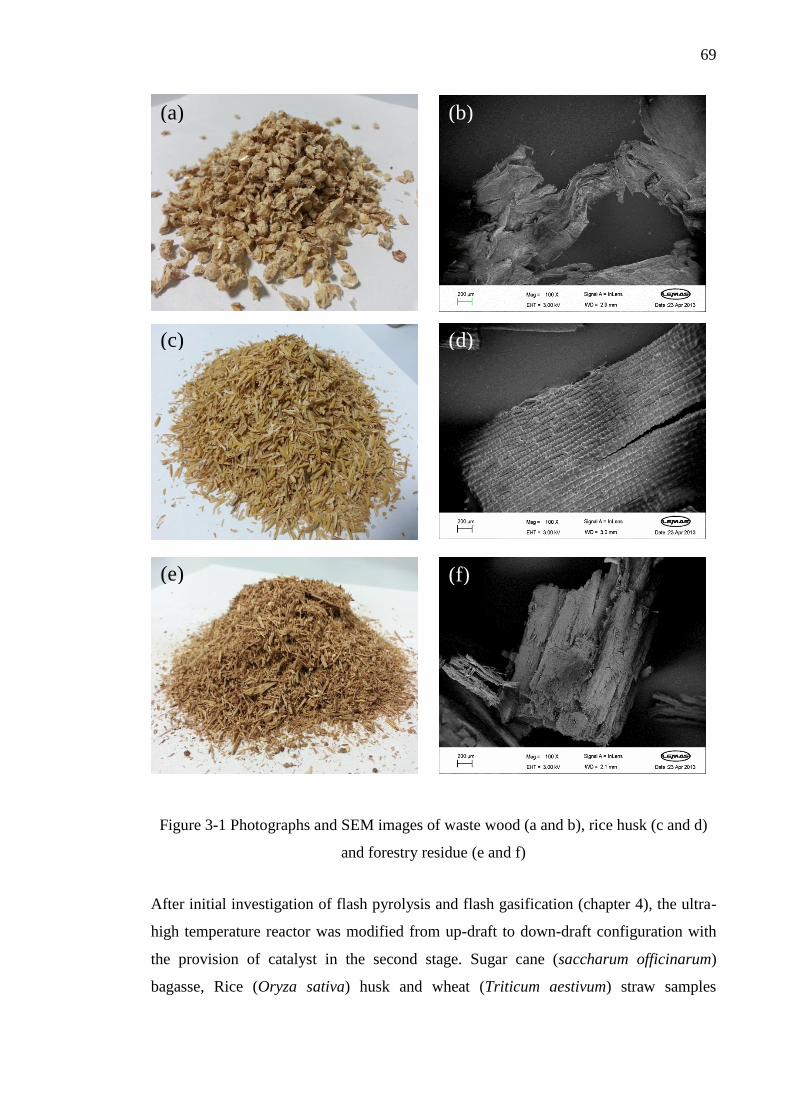
69
Figure 3-1 Photographs and SEM images of waste wood (a and b), rice husk (c and d)
and forestry residue (e and f)
After initial investigation of flash pyrolysis and flash gasification (chapter 4), the ultra-
high temperature reactor was modified from up-draft to down-draft configuration with
the provision of catalyst in the second stage. Sugar cane (saccharum officinarum)
bagasse, Rice (Oryza sativa) husk and wheat (Triticum aestivum) straw samples
(d) (c)
(e) (f)
(a) (b)
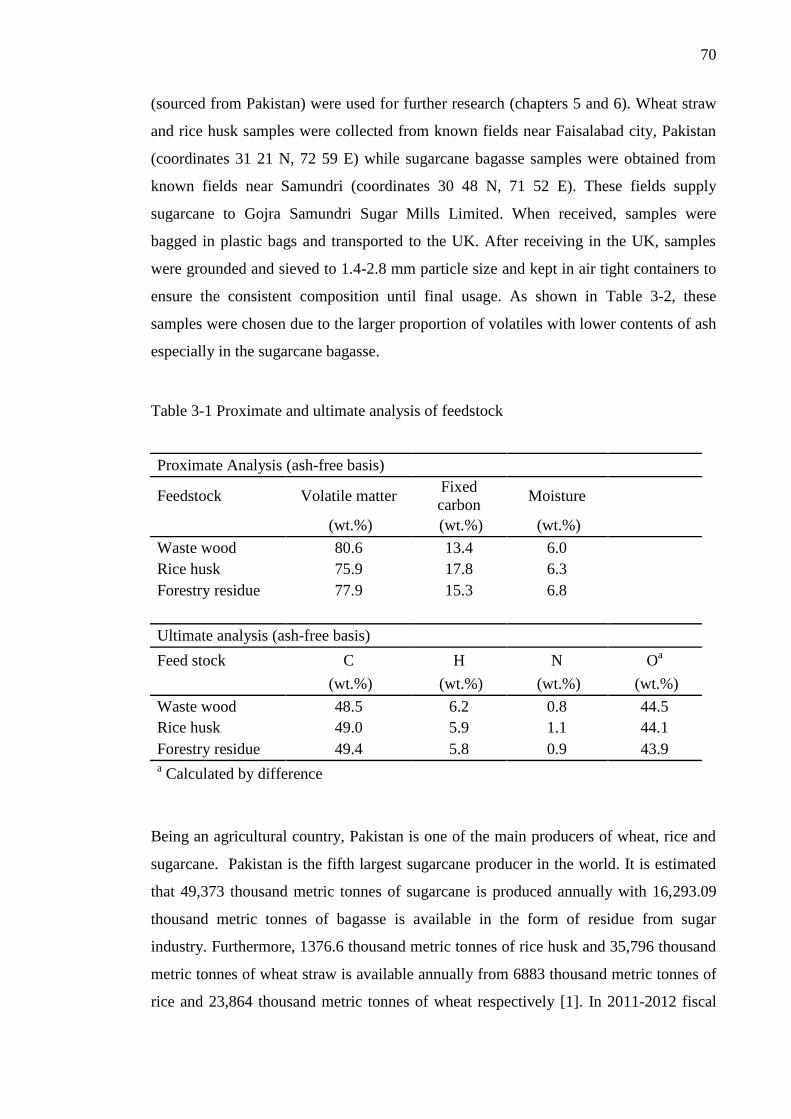
70
(sourced from Pakistan) were used for further research (chapters 5 and 6). Wheat straw
and rice husk samples were collected from known fields near Faisalabad city, Pakistan
(coordinates 31 21 N, 72 59 E) while sugarcane bagasse samples were obtained from
known fields near Samundri (coordinates 30 48 N, 71 52 E). These fields supply
sugarcane to Gojra Samundri Sugar Mills Limited. When received, samples were
bagged in plastic bags and transported to the UK. After receiving in the UK, samples
were grounded and sieved to 1.4-2.8 mm particle size and kept in air tight containers to
ensure the consistent composition until final usage. As shown in Table 3-2, these
samples were chosen due to the larger proportion of volatiles with lower contents of ash
especially in the sugarcane bagasse.
Table 3-1 Proximate and ultimate analysis of feedstock
Proximate Analysis (ash-free basis)
Feedstock Volatile matter Fixed
carbon Moisture
(wt.%) (wt.%) (wt.%)
Waste wood 80.6 13.4 6.0
Rice husk 75.9 17.8 6.3
Forestry residue 77.9 15.3 6.8
Ultimate analysis (ash-free basis)
Feed stock C H N Oa
(wt.%) (wt.%) (wt.%) (wt.%)
Waste wood 48.5 6.2 0.8 44.5
Rice husk 49.0 5.9 1.1 44.1
Forestry residue 49.4 5.8 0.9 43.9 a Calculated by difference
Being an agricultural country, Pakistan is one of the main producers of wheat, rice and
sugarcane. Pakistan is the fifth largest sugarcane producer in the world. It is estimated
that 49,373 thousand metric tonnes of sugarcane is produced annually with 16,293.09
thousand metric tonnes of bagasse is available in the form of residue from sugar
industry. Furthermore, 1376.6 thousand metric tonnes of rice husk and 35,796 thousand
metric tonnes of wheat straw is available annually from 6883 thousand metric tonnes of
rice and 23,864 thousand metric tonnes of wheat respectively [1]. In 2011-2012 fiscal
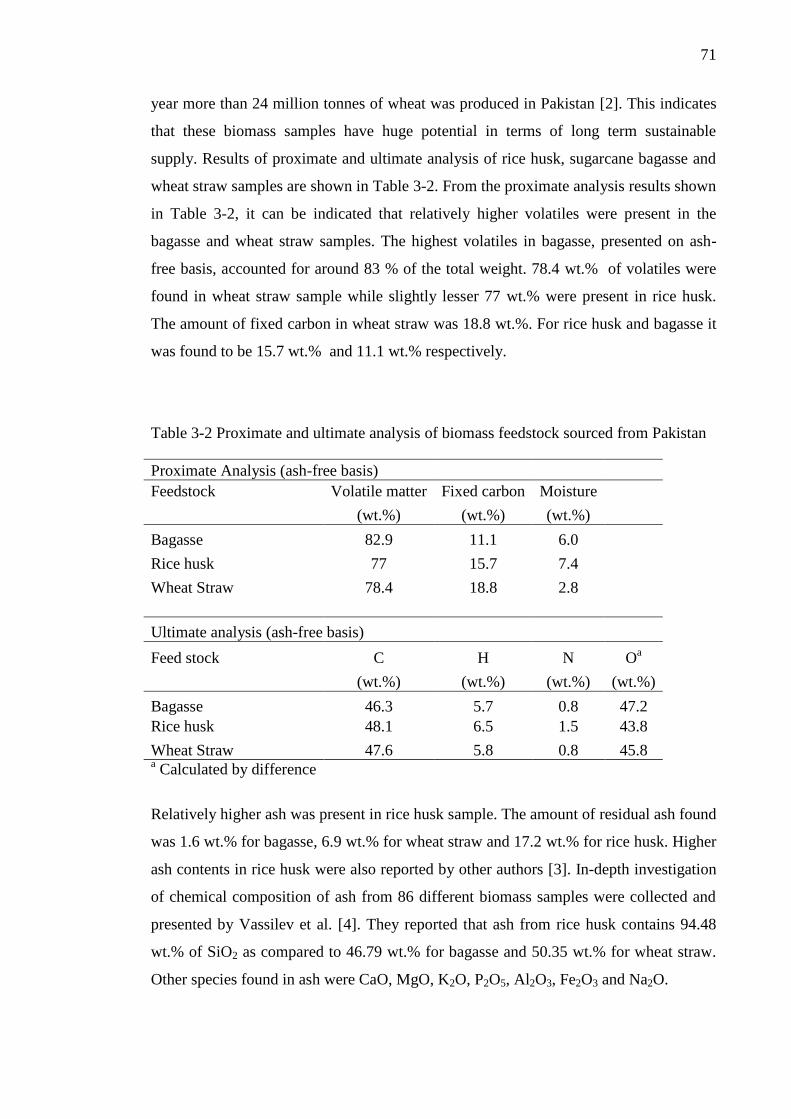
71
year more than 24 million tonnes of wheat was produced in Pakistan [2]. This indicates
that these biomass samples have huge potential in terms of long term sustainable
supply. Results of proximate and ultimate analysis of rice husk, sugarcane bagasse and
wheat straw samples are shown in Table 3-2. From the proximate analysis results shown
in Table 3-2, it can be indicated that relatively higher volatiles were present in the
bagasse and wheat straw samples. The highest volatiles in bagasse, presented on ash-
free basis, accounted for around 83 % of the total weight. 78.4 wt.% of volatiles were
found in wheat straw sample while slightly lesser 77 wt.% were present in rice husk.
The amount of fixed carbon in wheat straw was 18.8 wt.%. For rice husk and bagasse it
was found to be 15.7 wt.% and 11.1 wt.% respectively.
Table 3-2 Proximate and ultimate analysis of biomass feedstock sourced from Pakistan
Proximate Analysis (ash-free basis)
Feedstock Volatile matter Fixed carbon Moisture
(wt.%) (wt.%) (wt.%)
Bagasse 82.9 11.1 6.0
Rice husk 77 15.7 7.4
Wheat Straw 78.4 18.8 2.8
Ultimate analysis (ash-free basis)
Feed stock C H N Oa
(wt.%) (wt.%) (wt.%) (wt.%)
Bagasse 46.3 5.7 0.8 47.2
Rice husk 48.1 6.5 1.5 43.8
Wheat Straw 47.6 5.8 0.8 45.8 a Calculated by difference
Relatively higher ash was present in rice husk sample. The amount of residual ash found
was 1.6 wt.% for bagasse, 6.9 wt.% for wheat straw and 17.2 wt.% for rice husk. Higher
ash contents in rice husk were also reported by other authors [3]. In-depth investigation
of chemical composition of ash from 86 different biomass samples were collected and
presented by Vassilev et al. [4]. They reported that ash from rice husk contains 94.48
wt.% of SiO2 as compared to 46.79 wt.% for bagasse and 50.35 wt.% for wheat straw.
Other species found in ash were CaO, MgO, K2O, P2O5, Al2O3, Fe2O3 and Na2O.
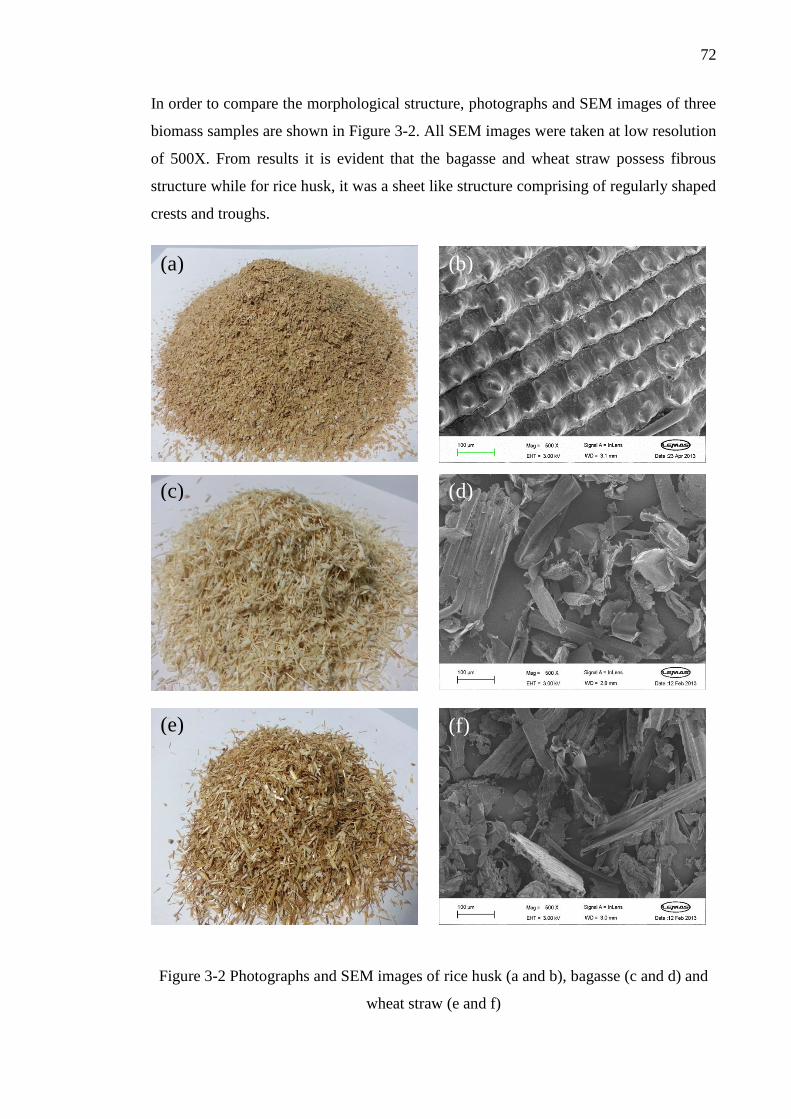
72
In order to compare the morphological structure, photographs and SEM images of three
biomass samples are shown in Figure 3-2. All SEM images were taken at low resolution
of 500X. From results it is evident that the bagasse and wheat straw possess fibrous
structure while for rice husk, it was a sheet like structure comprising of regularly shaped
crests and troughs.
Figure 3-2 Photographs and SEM images of rice husk (a and b), bagasse (c and d) and
wheat straw (e and f)
(d) (c)
(e) (f)
(a) (b)
73
3.2.2 Catalyst
During an initial study, cost effective and naturally abundant dolomite and 10 wt.% Ni-
dolomite catalysts were used during the two-stage pyrolysis/gasification of rice husk
biomass (chapter 5). Dolomite was calcined at 1000 °C and then grounded and sieved to
attain a particle size between 50-212 µm. In order to increase the hydrogen yield, 10
wt.% Ni-dolomite catalyst was prepared by a wet impregnation method. Aqueous
solution of Ni(NO3)2•6H2O (received from Sigma Aldrich UK) was obtained by
dissolving it in deionised water. Calcined dolomite was mixed in this aqueous solution
and stirred for four hours. The left over paste was dried at 105 °C overnight followed by
calcination in an air atmosphere at 900 °C. Catalyst was finally ground and sieved to
achieve the particle size of 50 - 212 µm.
In order to investigation the influence of different metal oxide supports on hydrogen
yield from pyrolysis/gasification of biomass, seven different Ni-based catalysts; 10
wt.% Ni-dolomite, 10 wt.% Ni-MgO, 10 wt.% Ni-SiO2, 10 wt.% Ni-Al2O3, 2 wt.% Ce-
10 wt.% Ni-dolomite, 5 wt.% Ce-10 wt.% Ni-dolomite and 10 wt.% Ce-10 wt.% Ni-
dolomite were compared with silica sand in terms of hydrogen yield (chapter 6). All
metal oxides and Ce(NO3)3•6H2O were received from Sigma Aldrich UK. For the
preparation of 2 wt.% Ce – 10 wt.% Ni-dolomite, 5 wt.% Ce – 10 wt.% Ni-dolomite and
10 wt.% Ce – 10 wt.% Ni-dolomite catalysts, dolomite was mixed and stirred into the
aqueous solution of Ni(NO3)2•6H2O and Ce(NO3)3•6H2O followed by overnight drying
at 105 °C and calcination at 900 °C. All the catalysts were calcined at 900 °C and
grinded and sieved to achieve a particle size range between 50-212 µm.
The influence of calcination temperature on 10 wt.% Ni-Al2O3 catalyst was also
researched. The 10 wt.% Ni-Al2O3 catalyst was prepared by a wet impregnation
method. After overnight drying at 105 °C, the catalyst was divided in four different
samples of around 5g each. Each sample was calcined in an air atmosphere at
calcination temperatures of 700, 800, 900 and 1000 °C. During the investigation of
nickel loading on the Ni-Al2O3 catalyst, four different Ni loadings of 5 wt.%, 10 wt.%,
20 wt.% and 40 wt.% on the alumina support were prepared separately using wet
impregnation method. After drying and calcination at 900 °C, all the catalysts were
tested for hydrogen production during pyrolysis/gasification of sugarcane bagasse
biomass.
74
3.3 Pyrolysis/gasification reactors
Two different reactors (ultra-high temperature two-stage reactor and single-stage fixed-
bed reactor) were used in this research work. The ultra-high temperature reactor was
initially built in an up-draft configuration for flash pyrolysis studies (chapter 4) and later
modified to a down-draft configuration for catalytic steam gasification research
(chapters 5 and 6). The single stage fixed-bed reactor was employed to investigate the
pyrolysis of biomass samples under slow heating rate conditions (10 °C min-1
) and
results were compared with flash pyrolysis results in chapter 4. Details of each
individual reactor configuration are explained in the following sections.
3.3.1 Up-draft ultra-high temperature fixed-bed reactor
3.3.1.1 Up-draft flash pyrolysis reactor
In order to study the flash pyrolysis of biomass at ultra-high temperature, a special rig
needs to be designed. A novel fixed bed up-draft reactor was designed in Solid Works; a
CAD software developed by Dassault systems. A photograph of the reactor is shown in
Figure 3-3.The main objective was to design a reactor which must be capable of
attaining ultra-high temperatures (950 – 1050 °C) and can hold the sample around room
temperature while the main reactor is reaching that desired high temperature in an air-
tight environment. This involves various material challenges as the normal stainless
steel used to build conventional reactors cannot withstand such high furnace
temperatures of up to 1200 °C. Inconel was chosen as a target material for this high
temperature application. It is an alloy of various metals including Ni, Cr, Fe, Mo, Nb,
Co, Mn, Cu, Al and Ti. The reactor was made up of 60.96 cm long inconel tube with
2.54 cm internal diameter. From the top, it is connected to a specially designed sample
holding chamber to hold the sample before pyrolysis. The reactor was heated using two
furnaces (slightly different in size) manufactured by Elite Thermal Systems limited.
Each furnace is provided with a controller unit (Eurotherm model # 2416) to control the
final temperature, heating rate, hold time etc.
The lower furnace (model # TSV12/38/200) was used to generate steam from the water
injected into the reactor using a syringe pump manufactured by Cole Parmer
Instruments Ltd UK. It is 900 watts furnace with a maximum rated temperature of 1200
°C. The main furnace was used to heat the main reactor zone. Maximum power rating
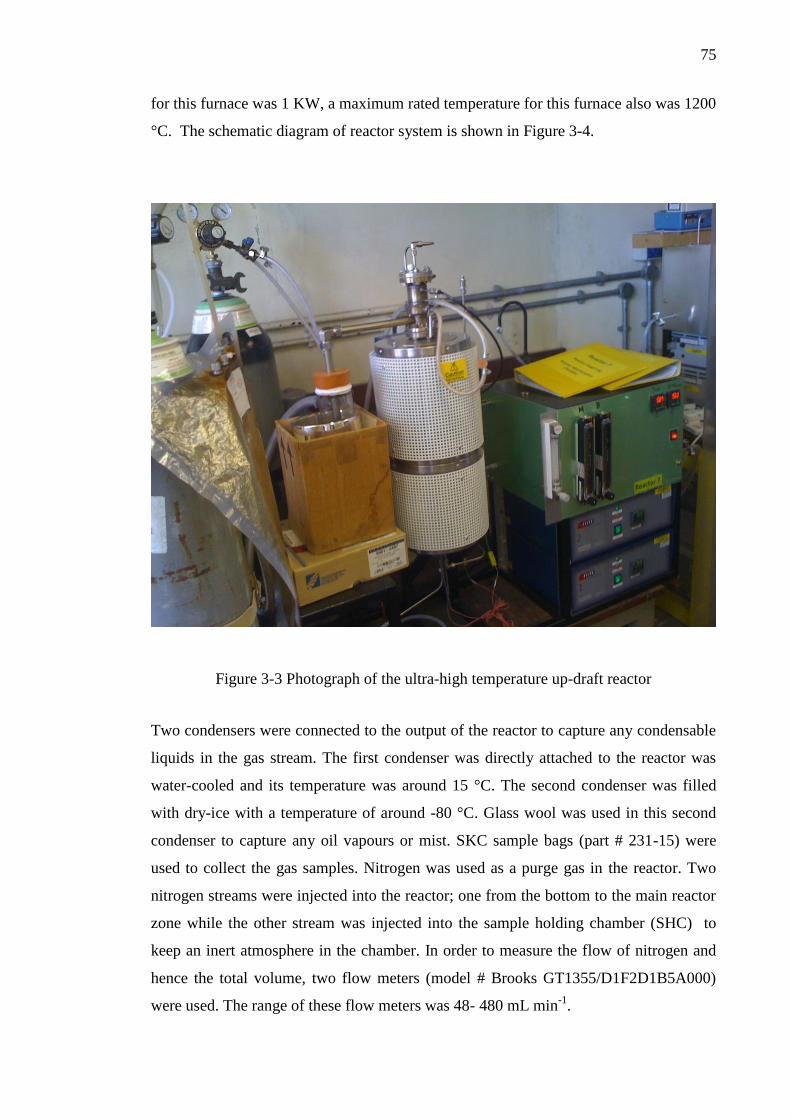
75
for this furnace was 1 KW, a maximum rated temperature for this furnace also was 1200
°C. The schematic diagram of reactor system is shown in Figure 3-4.
Figure 3-3 Photograph of the ultra-high temperature up-draft reactor
Two condensers were connected to the output of the reactor to capture any condensable
liquids in the gas stream. The first condenser was directly attached to the reactor was
water-cooled and its temperature was around 15 °C. The second condenser was filled
with dry-ice with a temperature of around -80 °C. Glass wool was used in this second
condenser to capture any oil vapours or mist. SKC sample bags (part # 231-15) were
used to collect the gas samples. Nitrogen was used as a purge gas in the reactor. Two
nitrogen streams were injected into the reactor; one from the bottom to the main reactor
zone while the other stream was injected into the sample holding chamber (SHC) to
keep an inert atmosphere in the chamber. In order to measure the flow of nitrogen and
hence the total volume, two flow meters (model # Brooks GT1355/D1F2D1B5A000)
were used. The range of these flow meters was 48- 480 mL min-1
.
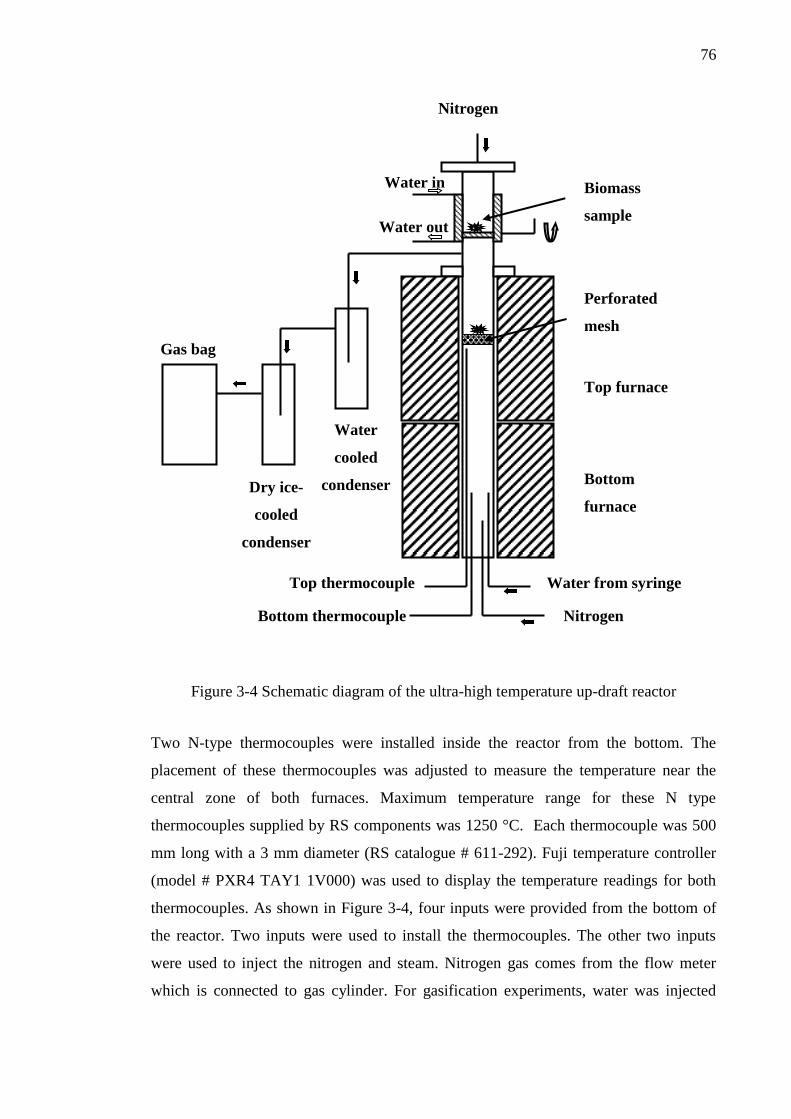
76
Figure 3-4 Schematic diagram of the ultra-high temperature up-draft reactor
Two N-type thermocouples were installed inside the reactor from the bottom. The
placement of these thermocouples was adjusted to measure the temperature near the
central zone of both furnaces. Maximum temperature range for these N type
thermocouples supplied by RS components was 1250 °C. Each thermocouple was 500
mm long with a 3 mm diameter (RS catalogue # 611-292). Fuji temperature controller
(model # PXR4 TAY1 1V000) was used to display the temperature readings for both
thermocouples. As shown in Figure 3-4, four inputs were provided from the bottom of
the reactor. Two inputs were used to install the thermocouples. The other two inputs
were used to inject the nitrogen and steam. Nitrogen gas comes from the flow meter
which is connected to gas cylinder. For gasification experiments, water was injected
Water in
Water out
Nitrogen
Biomass
sample
Top thermocouple
Bottom thermocouple Nitrogen
Gas bag
Water from syringe
Top furnace
Perforated
mesh
Bottom
furnace
Dry ice-
cooled
condenser
Water
cooled
condenser
77
using a syringe pump. Flow rate and total volume of the water injected can be precisely
measured and controlled by this Cole Parmer syringe pump. This water enters into the
lower part of the reactor and is immediately converted into steam and moves upward
into the main reactor. The total weight of the steam injected into the system was
calculated by weighing the syringe before and after each experiment. In the centre of the
main reactor, a perforated sample plate or mesh was placed from the top. The purpose
of this plate was to provide the base for the biomass sample coming down and to pass
the steam and nitrogen gas coming from the bottom of the reactor. The sample when
dropped from the sample holding chamber at the top falls directly on this plate where it
is then completely pyrolysed. Any remaining char and ash at the end of the experiment
can be collected from this plate as this plate can be brought out of the reactor using a
vertical rod connected to it.
A special chamber was designed to hold the sample before it was dropped down into the
main reactor. The main function of this sample holding chamber was to keep the sample
around room temperature in an inert atmosphere. This was achieved using a hollow disc
as a floor of this chamber connected with metallic pipes on both ends so that water
keeps flowing through the inside of this disc while the sample is placed at the top of this
plate. This constant flow of water through the disc stops the rapid increase in
temperature. This cooling effect was further supplemented by a water cooled jacket
around this sample-holding chamber. The height of whole chamber was 12.70 cm with
inner diameter of 2.54 cm. The chamber was made up of steel and connected with the
main reactor using flanges. A nitrogen bleed was injected into the chamber to ensure the
inert atmosphere. The flow rate of this nitrogen bleed can be adjusted using a flow
meter installed in the main control panel of the reactor (shown in Figure 3-3). Before the
start of the pyrolysis, the sample was introduced into the chamber stays at the top of the
hollow disc. When the furnaces attain the required temperature, this hollow disc was
rotated 90 degree about its centre axis and the sample was dropped down onto the
sample plate in the main reactor. During the testing phase, a K type thermocouple was
installed in this sample-holding chamber to monitor the variations in temperature inside
the chamber while main reactor was reaching to 1050 °C. The process was repeated
three times. It was noticed that the highest temperature of this sample holding chamber
was 76 °C which indicates the effectiveness of this chamber for keeping the sample
cool.
78
3.3.1.2 Standard operating procedure for up-draft flash pyrolysis reactor
A standard operating procedure was devised to carryout flash pyrolysis and flash
gasification experiments. Before the start of the experiment, reactor and its components
were checked for any visible damages such as insulation of electric cables and any
cracks on glassware. The condenser system (two flasks and connecting pipes), and
sample plate were weighed and then connected to the reactor. The syringe was also
weighed and required steam flow rate (for gasification experiments) was set on syringe
pump. A clean sample gas bag was connected to the outlet pipe of the condenser system
to collect the gases. Sample holding chamber was also connected to the reactor. Five
grams of biomass sample was placed on hollow disc in sample holding chamber and the
chamber was closed from the top. Nitrogen supply connections were made and both
flow meters were set to the required flow rate of 100 ml min-1
. Finally both furnaces
were start heating to the desired temperature of 950 °C. Once the required temperature
was achieved, the biomass sample was dropped from the sample holding chamber into
the reactor. All the gases were collected into the gas sample bag for 40 minutes. All the
condensable liquids in the gas stream were captured in condenser system using dry ice.
Once the gas collection time was over, gas sample bag was disconnected and gas was
analysed offline using gas chromatography. The condenser system was disconnected
from the reactor and was weighed and subtracted the initial weight to find the amount of
liquid collected. Syringe was disconnected from the reactor and weighed. The amount
of injected steam was calculated by the difference of initial and final weight of the
syringe. Once the reactor was cooled down to the room temperature, the sample plate
was removed from the reactor and was weighed to find the weight of the solid residue.
3.3.1.3 Repeatability test for up-draft flash pyrolysis reactor
In order to establish the suitability of the up-draft reactor for further research,
repeatability tests were performed. All the experiments were performed under identical
conditions. Waste wood samples were used for these repeatability experiments. The
results of these experiments are presented in Figure 3-5.
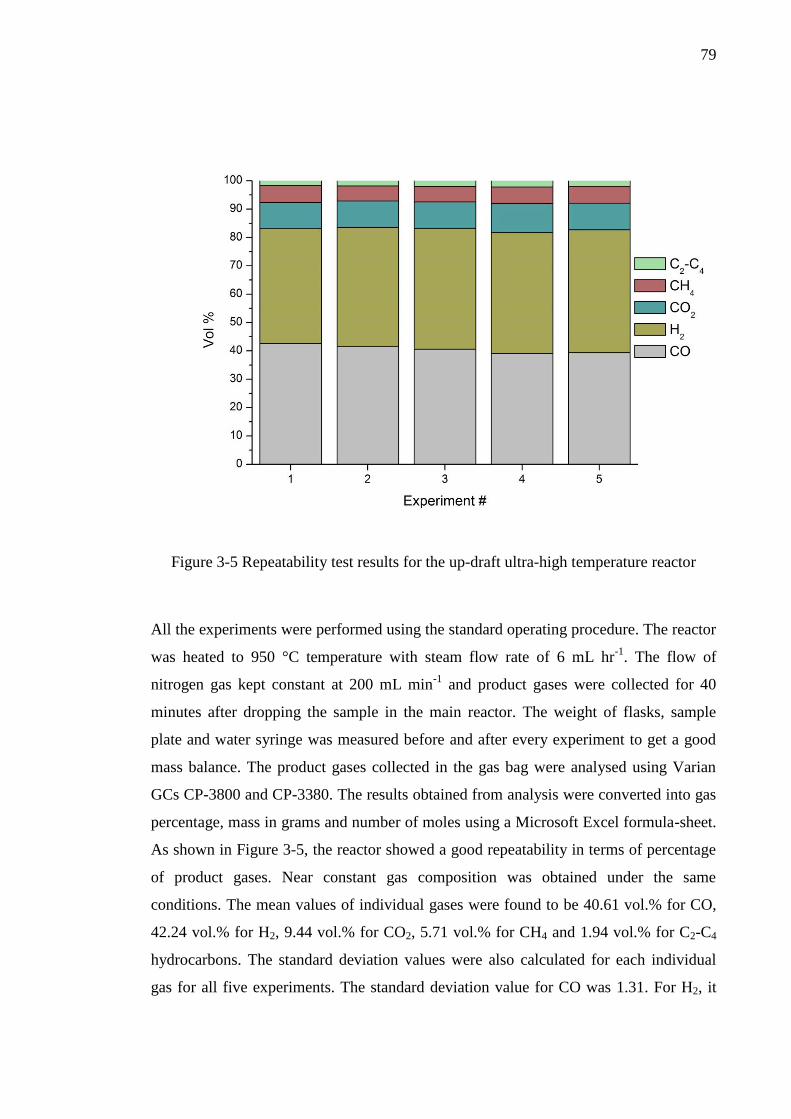
79
Figure 3-5 Repeatability test results for the up-draft ultra-high temperature reactor
All the experiments were performed using the standard operating procedure. The reactor
was heated to 950 °C temperature with steam flow rate of 6 mL hr-1
. The flow of
nitrogen gas kept constant at 200 mL min-1
and product gases were collected for 40
minutes after dropping the sample in the main reactor. The weight of flasks, sample
plate and water syringe was measured before and after every experiment to get a good
mass balance. The product gases collected in the gas bag were analysed using Varian
GCs CP-3800 and CP-3380. The results obtained from analysis were converted into gas
percentage, mass in grams and number of moles using a Microsoft Excel formula-sheet.
As shown in Figure 3-5, the reactor showed a good repeatability in terms of percentage
of product gases. Near constant gas composition was obtained under the same
conditions. The mean values of individual gases were found to be 40.61 vol.% for CO,
42.24 vol.% for H2, 9.44 vol.% for CO2, 5.71 vol.% for CH4 and 1.94 vol.% for C2-C4
hydrocarbons. The standard deviation values were also calculated for each individual
gas for all five experiments. The standard deviation value for CO was 1.31. For H2, it
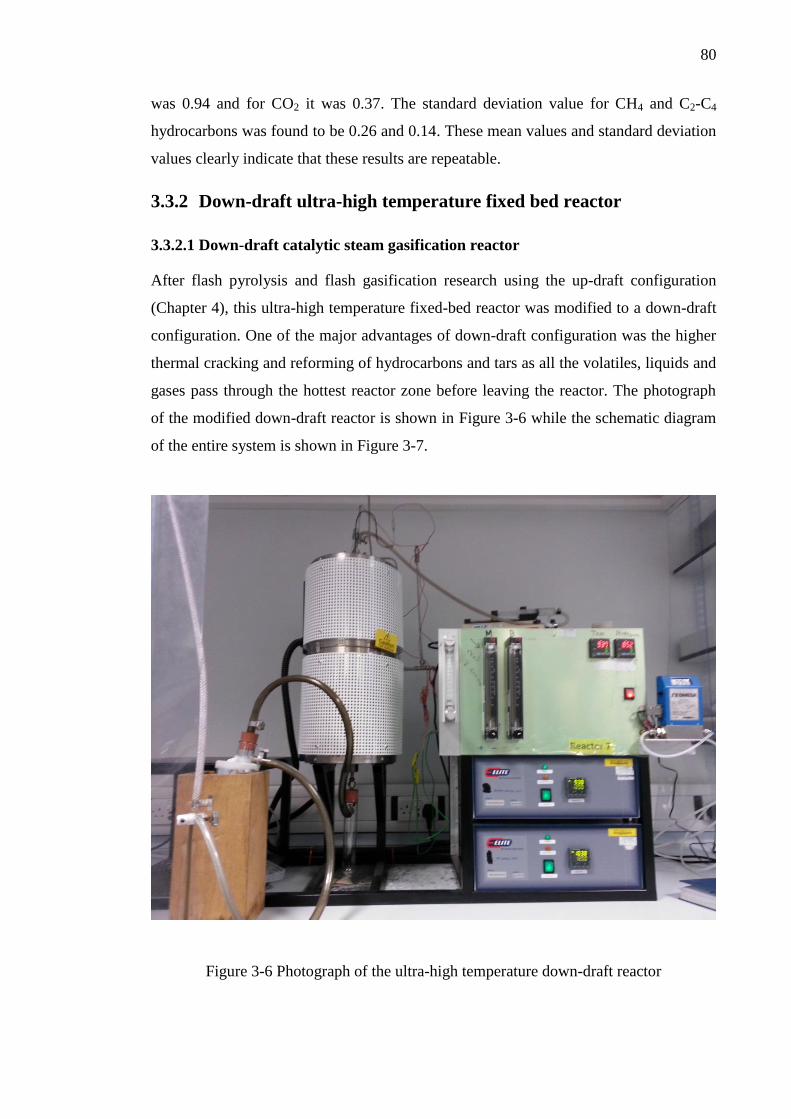
80
was 0.94 and for CO2 it was 0.37. The standard deviation value for CH4 and C2-C4
hydrocarbons was found to be 0.26 and 0.14. These mean values and standard deviation
values clearly indicate that these results are repeatable.
3.3.2 Down-draft ultra-high temperature fixed bed reactor
3.3.2.1 Down-draft catalytic steam gasification reactor
After flash pyrolysis and flash gasification research using the up-draft configuration
(Chapter 4), this ultra-high temperature fixed-bed reactor was modified to a down-draft
configuration. One of the major advantages of down-draft configuration was the higher
thermal cracking and reforming of hydrocarbons and tars as all the volatiles, liquids and
gases pass through the hottest reactor zone before leaving the reactor. The photograph
of the modified down-draft reactor is shown in Figure 3-6 while the schematic diagram
of the entire system is shown in Figure 3-7.
Figure 3-6 Photograph of the ultra-high temperature down-draft reactor
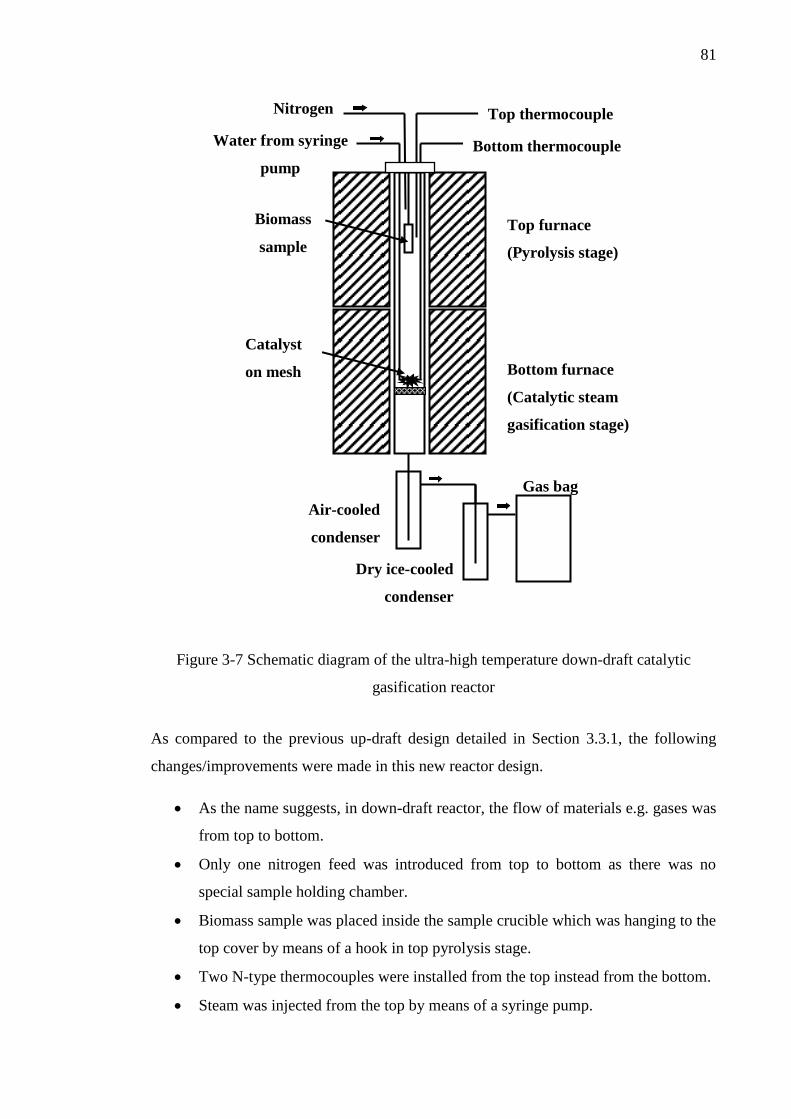
81
Figure 3-7 Schematic diagram of the ultra-high temperature down-draft catalytic
gasification reactor
As compared to the previous up-draft design detailed in Section 3.3.1, the following
changes/improvements were made in this new reactor design.
As the name suggests, in down-draft reactor, the flow of materials e.g. gases was
from top to bottom.
Only one nitrogen feed was introduced from top to bottom as there was no
special sample holding chamber.
Biomass sample was placed inside the sample crucible which was hanging to the
top cover by means of a hook in top pyrolysis stage.
Two N-type thermocouples were installed from the top instead from the bottom.
Steam was injected from the top by means of a syringe pump.
Water from syringe
pump
Top thermocouple
Bottom thermocouple
Nitrogen
Catalyst
on mesh
Top furnace
(Pyrolysis stage)
Biomass
sample
Bottom furnace
(Catalytic steam
gasification stage)
Dry ice-cooled
condenser
Gas bag
Air-cooled
condenser
82
A ring was welded inside the reactor tube at the middle point of the bottom
reactor so that the perforated mesh can be placed on the top of it. This mesh was
used as a physical support to place the catalyst on quartz wool.
Analogue nitrogen flow meter was replaced with the digital mass flow rate
controller to precisely control the nitrogen flow.
3.3.2.2 Standard operating procedure for down-draft gasification reactor
A standard operating procedure was developed to perform ultra-high temperature
pyrolysis and gasification of biomass in a modified reactor. Before the start of the
experiment, empty and cleaned sample pot/crucible was weighed and 4 grams of
biomass sample was placed in it. The reactor tube, catalyst mesh and condenser system
(two condensers and connecting pipes) were weighed separately before the start of each
experiment. Before placing the reactor tube inside the furnace heaters, 2 grams of
catalyst (for catalytic steam gasification experiments) was placed on quartz wool on a
perforated mesh (catalyst to sample ratio of 0.5). The water syringe was weighed and
connected to the reactor using a syringe pump. Steam to biomass ratio was 1.37 for
gasification experiments as steam was introduced at 0.1 g min-1
for 55 minutes (5.5 g)
for 4 grams of biomass. An empty and cleaned gas bag was connected to the output of
the condenser system. Once all the connections were made, the desired temperature of
950 °C was set for both pyrolysis and gasification reactors. The flow rate of nitrogen
was set to 100 ml min-1
. Initially, gasification stage was heated from room temperature
to 950 °C at 20 °C min-1
. Once the desired temperature for gasification stage was
achieved, steam injection into the gasification stage was started along with the heat up
of the pyrolysis stage from ambient temperature to 950 °C at 20 °C min-1
. All the
volatiles, liquids and gases evolving from the pyrolysis stage were made to react with
the steam in the presence of catalyst in the gasification stage. All the condensable
liquids and unreacted steam were collected in condenser system using glass wool trap
and dry ice. The synthesis gas was collected in a gas sample bag.
For pyrolysis experiments in the absence of catalyst, the biomass sample was placed in
the pyrolysis reactor stage and both stages were heated simultaneously at 20 °C min-1
for ~50 minutes to achieve the final temperature of 950 °C. The gases were collected for
another 40 minutes to ensure good material balance. For pyrolysis experiments, the
total gas collection time was 90 minutes. For gasification experiments, the gasification
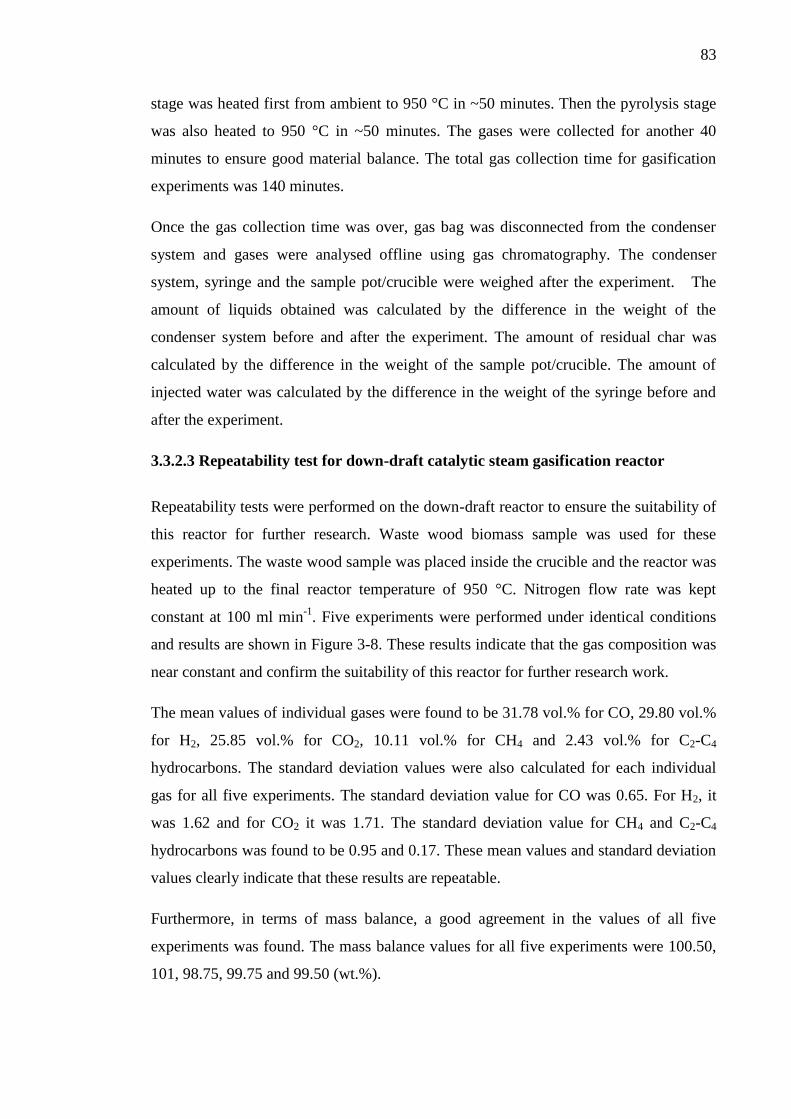
83
stage was heated first from ambient to 950 °C in ~50 minutes. Then the pyrolysis stage
was also heated to 950 °C in ~50 minutes. The gases were collected for another 40
minutes to ensure good material balance. The total gas collection time for gasification
experiments was 140 minutes.
Once the gas collection time was over, gas bag was disconnected from the condenser
system and gases were analysed offline using gas chromatography. The condenser
system, syringe and the sample pot/crucible were weighed after the experiment. The
amount of liquids obtained was calculated by the difference in the weight of the
condenser system before and after the experiment. The amount of residual char was
calculated by the difference in the weight of the sample pot/crucible. The amount of
injected water was calculated by the difference in the weight of the syringe before and
after the experiment.
3.3.2.3 Repeatability test for down-draft catalytic steam gasification reactor
Repeatability tests were performed on the down-draft reactor to ensure the suitability of
this reactor for further research. Waste wood biomass sample was used for these
experiments. The waste wood sample was placed inside the crucible and the reactor was
heated up to the final reactor temperature of 950 °C. Nitrogen flow rate was kept
constant at 100 ml min-1
. Five experiments were performed under identical conditions
and results are shown in Figure 3-8. These results indicate that the gas composition was
near constant and confirm the suitability of this reactor for further research work.
The mean values of individual gases were found to be 31.78 vol.% for CO, 29.80 vol.%
for H2, 25.85 vol.% for CO2, 10.11 vol.% for CH4 and 2.43 vol.% for C2-C4
hydrocarbons. The standard deviation values were also calculated for each individual
gas for all five experiments. The standard deviation value for CO was 0.65. For H2, it
was 1.62 and for CO2 it was 1.71. The standard deviation value for CH4 and C2-C4
hydrocarbons was found to be 0.95 and 0.17. These mean values and standard deviation
values clearly indicate that these results are repeatable.
Furthermore, in terms of mass balance, a good agreement in the values of all five
experiments was found. The mass balance values for all five experiments were 100.50,
101, 98.75, 99.75 and 99.50 (wt.%).
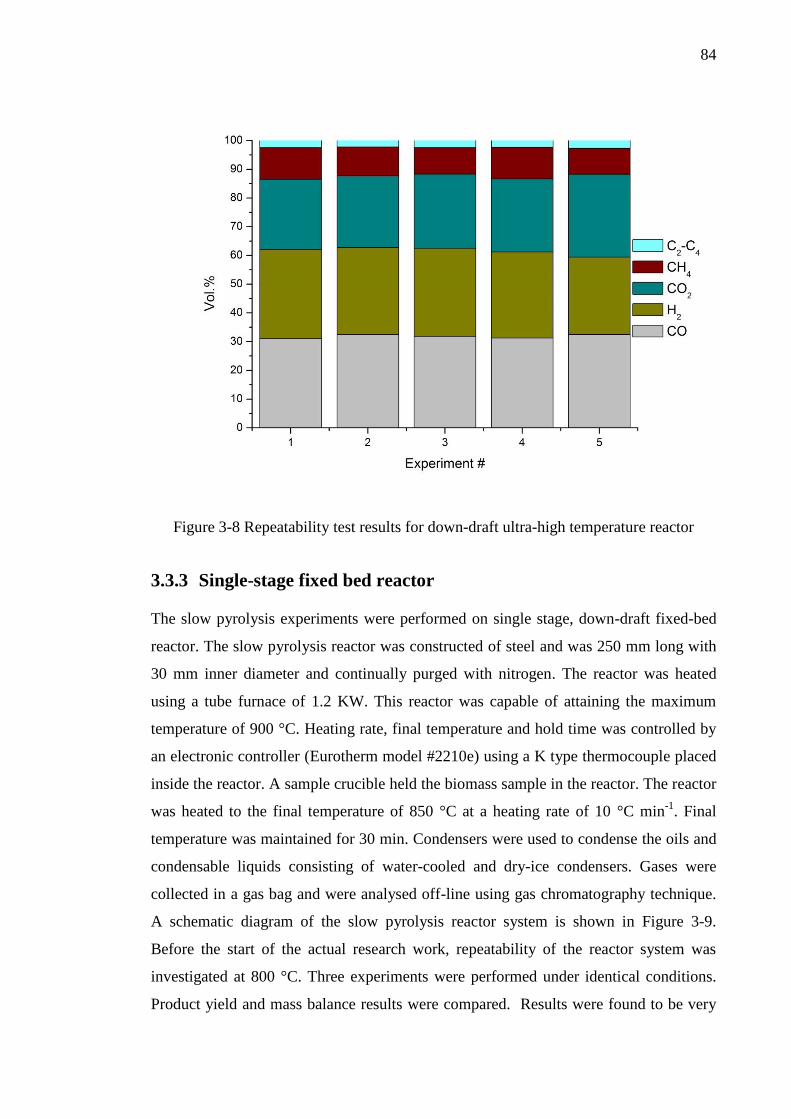
84
Figure 3-8 Repeatability test results for down-draft ultra-high temperature reactor
3.3.3 Single-stage fixed bed reactor
The slow pyrolysis experiments were performed on single stage, down-draft fixed-bed
reactor. The slow pyrolysis reactor was constructed of steel and was 250 mm long with
30 mm inner diameter and continually purged with nitrogen. The reactor was heated
using a tube furnace of 1.2 KW. This reactor was capable of attaining the maximum
temperature of 900 °C. Heating rate, final temperature and hold time was controlled by
an electronic controller (Eurotherm model #2210e) using a K type thermocouple placed
inside the reactor. A sample crucible held the biomass sample in the reactor. The reactor
was heated to the final temperature of 850 °C at a heating rate of 10 °C min-1
. Final
temperature was maintained for 30 min. Condensers were used to condense the oils and
condensable liquids consisting of water-cooled and dry-ice condensers. Gases were
collected in a gas bag and were analysed off-line using gas chromatography technique.
A schematic diagram of the slow pyrolysis reactor system is shown in Figure 3-9.
Before the start of the actual research work, repeatability of the reactor system was
investigated at 800 °C. Three experiments were performed under identical conditions.
Product yield and mass balance results were compared. Results were found to be very
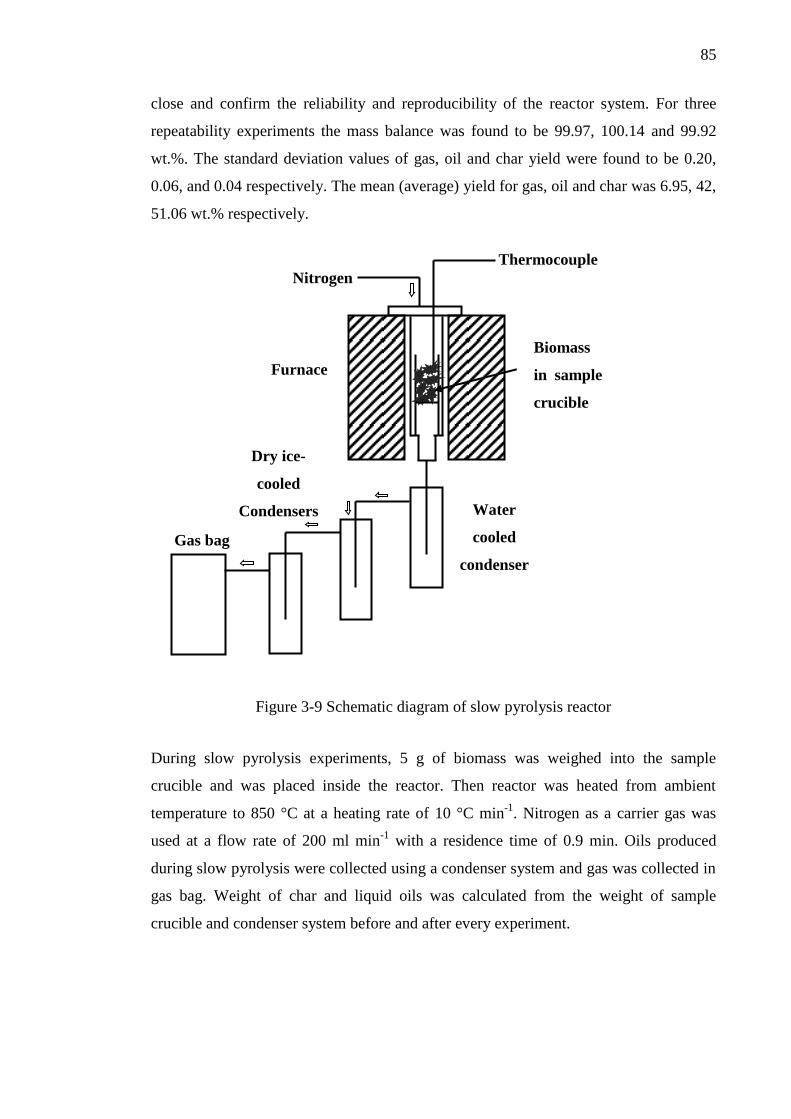
85
close and confirm the reliability and reproducibility of the reactor system. For three
repeatability experiments the mass balance was found to be 99.97, 100.14 and 99.92
wt.%. The standard deviation values of gas, oil and char yield were found to be 0.20,
0.06, and 0.04 respectively. The mean (average) yield for gas, oil and char was 6.95, 42,
51.06 wt.% respectively.
Figure 3-9 Schematic diagram of slow pyrolysis reactor
During slow pyrolysis experiments, 5 g of biomass was weighed into the sample
crucible and was placed inside the reactor. Then reactor was heated from ambient
temperature to 850 °C at a heating rate of 10 °C min-1
. Nitrogen as a carrier gas was
used at a flow rate of 200 ml min-1
with a residence time of 0.9 min. Oils produced
during slow pyrolysis were collected using a condenser system and gas was collected in
gas bag. Weight of char and liquid oils was calculated from the weight of sample
crucible and condenser system before and after every experiment.
Gas bag
Furnace
Dry ice-
cooled
Condensers Water
cooled
condenser
Biomass
in sample
crucible
Thermocouple
Nitrogen
86
3.4 Analysis and characterisation
3.4.1 Gaseous products analysis
3.4.1.1 Gas analysis
Gases produced during the pyrolysis/gasification of biomass were analysed using an
established gas chromatography technique. The mixture of gases was analysed for
hydrocarbons (C1-C4), and permanent gases (H2, O2, N2, CO, CO2). A simplified
schematic` diagram of a gas chromatography system is shown in Figure 3-10.
Figure 3-10 Schematic diagram of a gas chromatography system
A typical GC system consists of an inert carrier gas (also known as mobile phase), a
metallic column inside the temperature controlled oven and a detector connected to a
computer. The sample was injected into the injector using a one ml glass syringe. The
inner lining of the column is coated with a microscopic layer of liquid or polymer
known as stationery phase. Gases injected into the column react with the stationery
phase differently and hence the time required to reach the detector is different for
different gases. The detector detects the gas and presents the signal on a computer in
volts or millivolts depending upon the volume of the gas. Typically TCD (thermal
conductivity detector) or FID (flame ionization detector) is used in GCs.
Flow rate
controller
Sample
injection
Output to
PC
Oven
Carrier gas
Column
Detector
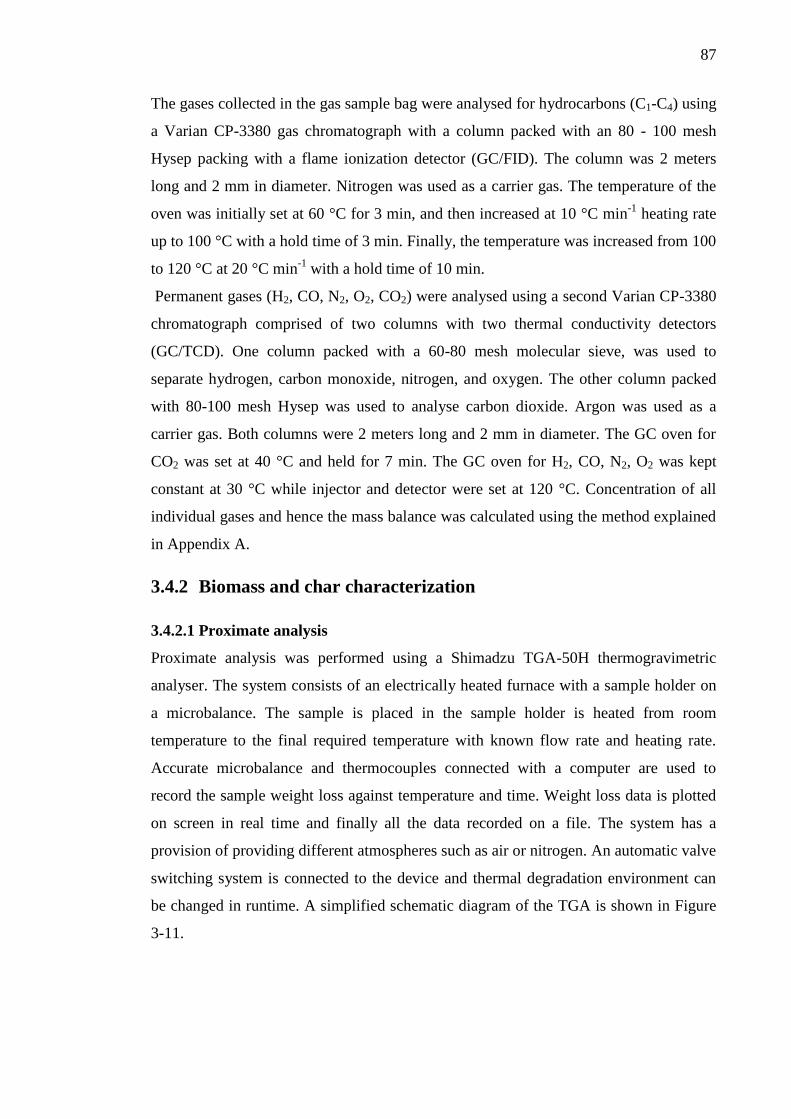
87
The gases collected in the gas sample bag were analysed for hydrocarbons (C1-C4) using
a Varian CP-3380 gas chromatograph with a column packed with an 80 - 100 mesh
Hysep packing with a flame ionization detector (GC/FID). The column was 2 meters
long and 2 mm in diameter. Nitrogen was used as a carrier gas. The temperature of the
oven was initially set at 60 °C for 3 min, and then increased at 10 °C min-1
heating rate
up to 100 °C with a hold time of 3 min. Finally, the temperature was increased from 100
to 120 °C at 20 °C min-1
with a hold time of 10 min.
Permanent gases (H2, CO, N2, O2, CO2) were analysed using a second Varian CP-3380
chromatograph comprised of two columns with two thermal conductivity detectors
(GC/TCD). One column packed with a 60-80 mesh molecular sieve, was used to
separate hydrogen, carbon monoxide, nitrogen, and oxygen. The other column packed
with 80-100 mesh Hysep was used to analyse carbon dioxide. Argon was used as a
carrier gas. Both columns were 2 meters long and 2 mm in diameter. The GC oven for
CO2 was set at 40 °C and held for 7 min. The GC oven for H2, CO, N2, O2 was kept
constant at 30 °C while injector and detector were set at 120 °C. Concentration of all
individual gases and hence the mass balance was calculated using the method explained
in Appendix A.
3.4.2 Biomass and char characterization
3.4.2.1 Proximate analysis
Proximate analysis was performed using a Shimadzu TGA-50H thermogravimetric
analyser. The system consists of an electrically heated furnace with a sample holder on
a microbalance. The sample is placed in the sample holder is heated from room
temperature to the final required temperature with known flow rate and heating rate.
Accurate microbalance and thermocouples connected with a computer are used to
record the sample weight loss against temperature and time. Weight loss data is plotted
on screen in real time and finally all the data recorded on a file. The system has a
provision of providing different atmospheres such as air or nitrogen. An automatic valve
switching system is connected to the device and thermal degradation environment can
be changed in runtime. A simplified schematic diagram of the TGA is shown in Figure
3-11.
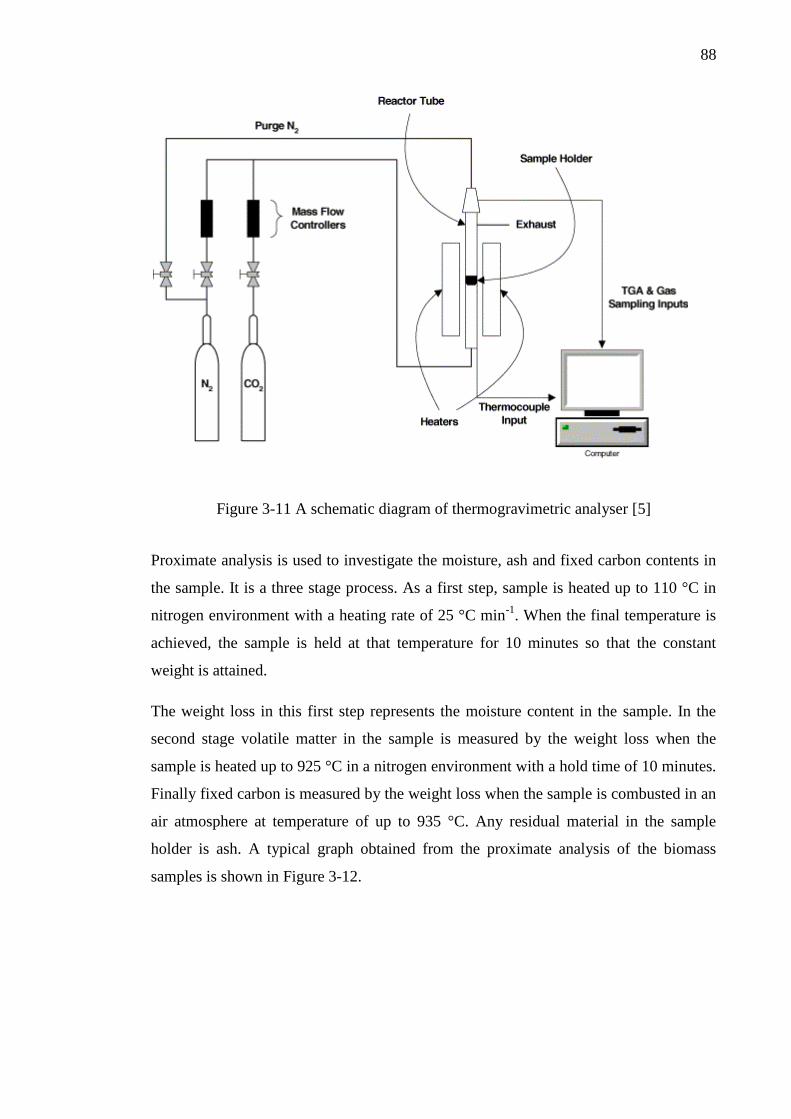
88
Figure 3-11 A schematic diagram of thermogravimetric analyser [5]
Proximate analysis is used to investigate the moisture, ash and fixed carbon contents in
the sample. It is a three stage process. As a first step, sample is heated up to 110 °C in
nitrogen environment with a heating rate of 25 °C min-1
. When the final temperature is
achieved, the sample is held at that temperature for 10 minutes so that the constant
weight is attained.
The weight loss in this first step represents the moisture content in the sample. In the
second stage volatile matter in the sample is measured by the weight loss when the
sample is heated up to 925 °C in a nitrogen environment with a hold time of 10 minutes.
Finally fixed carbon is measured by the weight loss when the sample is combusted in an
air atmosphere at temperature of up to 935 °C. Any residual material in the sample
holder is ash. A typical graph obtained from the proximate analysis of the biomass
samples is shown in Figure 3-12.
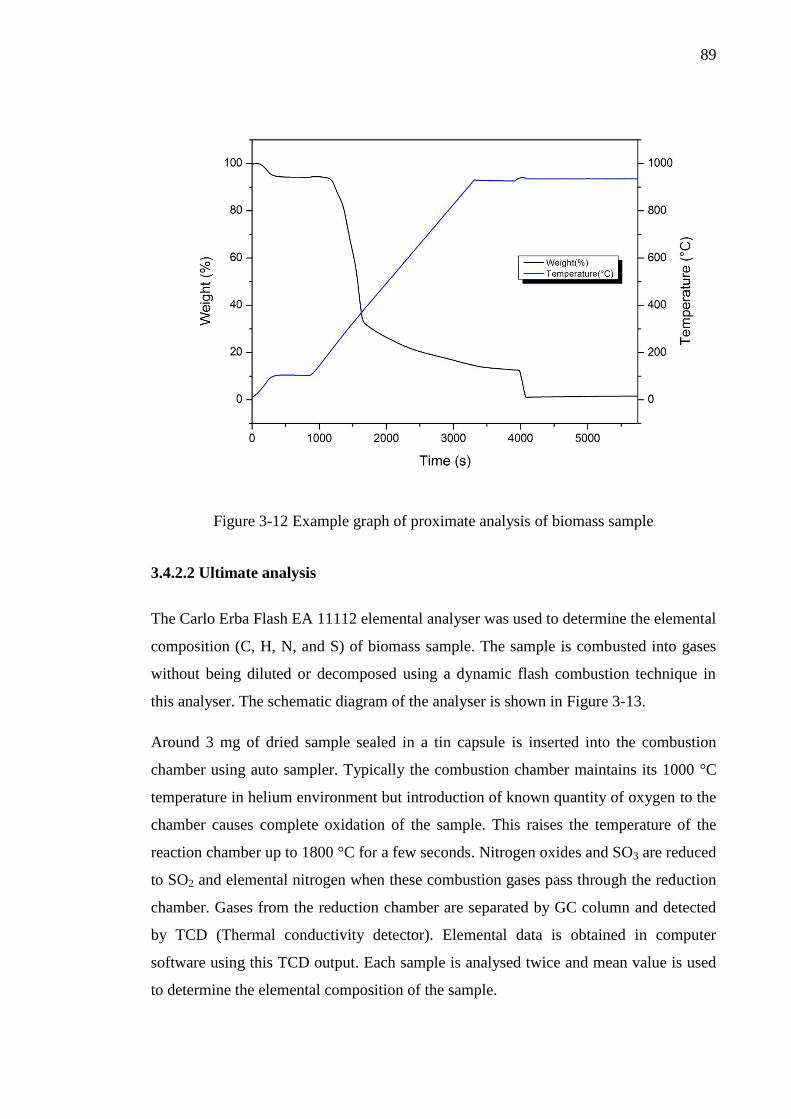
89
Figure 3-12 Example graph of proximate analysis of biomass sample
3.4.2.2 Ultimate analysis
The Carlo Erba Flash EA 11112 elemental analyser was used to determine the elemental
composition (C, H, N, and S) of biomass sample. The sample is combusted into gases
without being diluted or decomposed using a dynamic flash combustion technique in
this analyser. The schematic diagram of the analyser is shown in Figure 3-13.
Around 3 mg of dried sample sealed in a tin capsule is inserted into the combustion
chamber using auto sampler. Typically the combustion chamber maintains its 1000 °C
temperature in helium environment but introduction of known quantity of oxygen to the
chamber causes complete oxidation of the sample. This raises the temperature of the
reaction chamber up to 1800 °C for a few seconds. Nitrogen oxides and SO3 are reduced
to SO2 and elemental nitrogen when these combustion gases pass through the reduction
chamber. Gases from the reduction chamber are separated by GC column and detected
by TCD (Thermal conductivity detector). Elemental data is obtained in computer
software using this TCD output. Each sample is analysed twice and mean value is used
to determine the elemental composition of the sample.
90
Figure 3-13 Schematic diagram of a CHNS elemental analyser adapted from [6]
3.4.2.3 X-ray fluorescence (XRF) analysis of ash
The residual ash from the biomass samples was analysed using an Olympus Innovex X-
5000 X-ray Fluorescence (XRF). This device is equipped with a Rh source and is
capable of analysing powders and solids. It is a non-destructive characterisation
technique and samples can be analysed in less than 5 minutes. During XRF analysis, the
sample is exposed to intense beam of X-rays which illuminated the sample. Some of
this incident X-ray energy is absorbed by the sample to remove the electrons from the
lower electronic shells like K and L shells. Once electrons are removed by this high
energy incident X-rays from these shells, vacancies are created. The electrons from the
upper shell jump to fill up vacancies in these low energy shells and release energy in the
form of radiations. Because these radiations are characteristic of each individual
element, these elements can be identified by these radiations. All the data from the
device sent to the software which can recognise the elements present in a sample.
3.4.3 Catalyst characterization
3.4.3.1 Temperature programmed oxidation (TPO)
The temperature programmed oxidation (TPO) technique was used to characterise the
reacted catalysts using a thermogravimetric analyser (TGA). This technique is used to
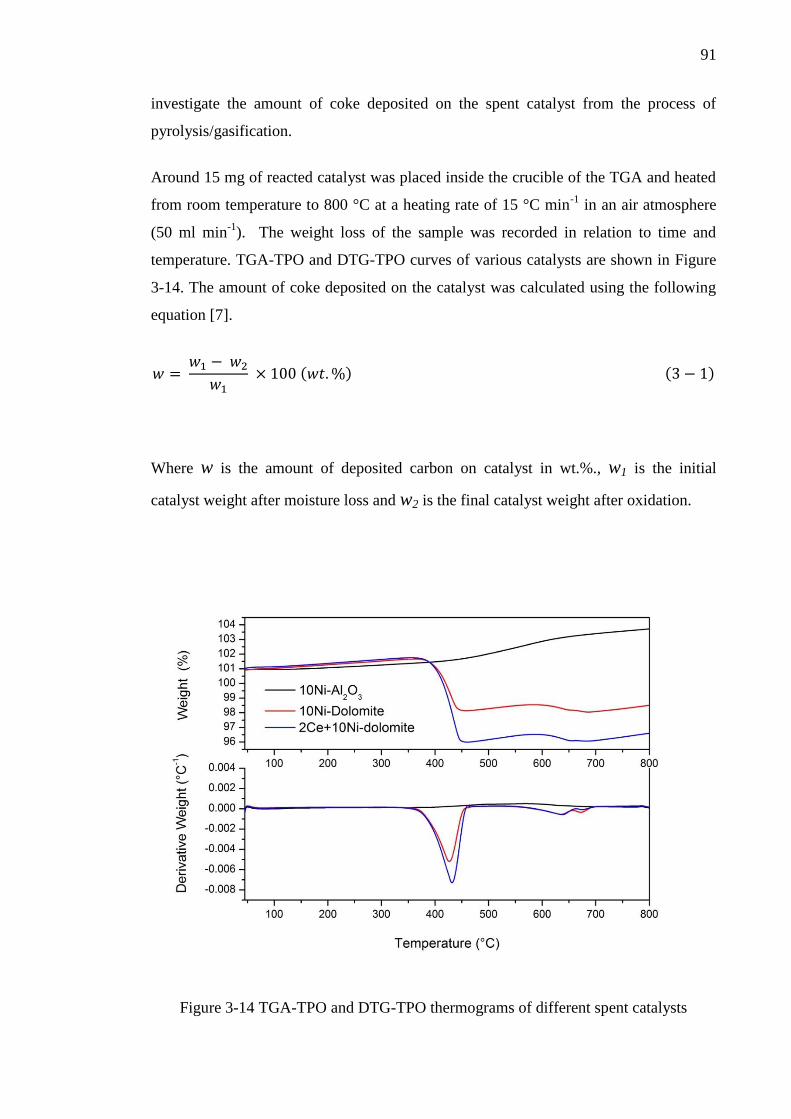
91
investigate the amount of coke deposited on the spent catalyst from the process of
pyrolysis/gasification.
Around 15 mg of reacted catalyst was placed inside the crucible of the TGA and heated
from room temperature to 800 °C at a heating rate of 15 °C min-1
in an air atmosphere
(50 ml min-1
). The weight loss of the sample was recorded in relation to time and
temperature. TGA-TPO and DTG-TPO curves of various catalysts are shown in Figure
3-14. The amount of coke deposited on the catalyst was calculated using the following
equation [7].
( ) ( )
Where w is the amount of deposited carbon on catalyst in wt.%., w1 is the initial
catalyst weight after moisture loss and w2 is the final catalyst weight after oxidation.
Figure 3-14 TGA-TPO and DTG-TPO thermograms of different spent catalysts
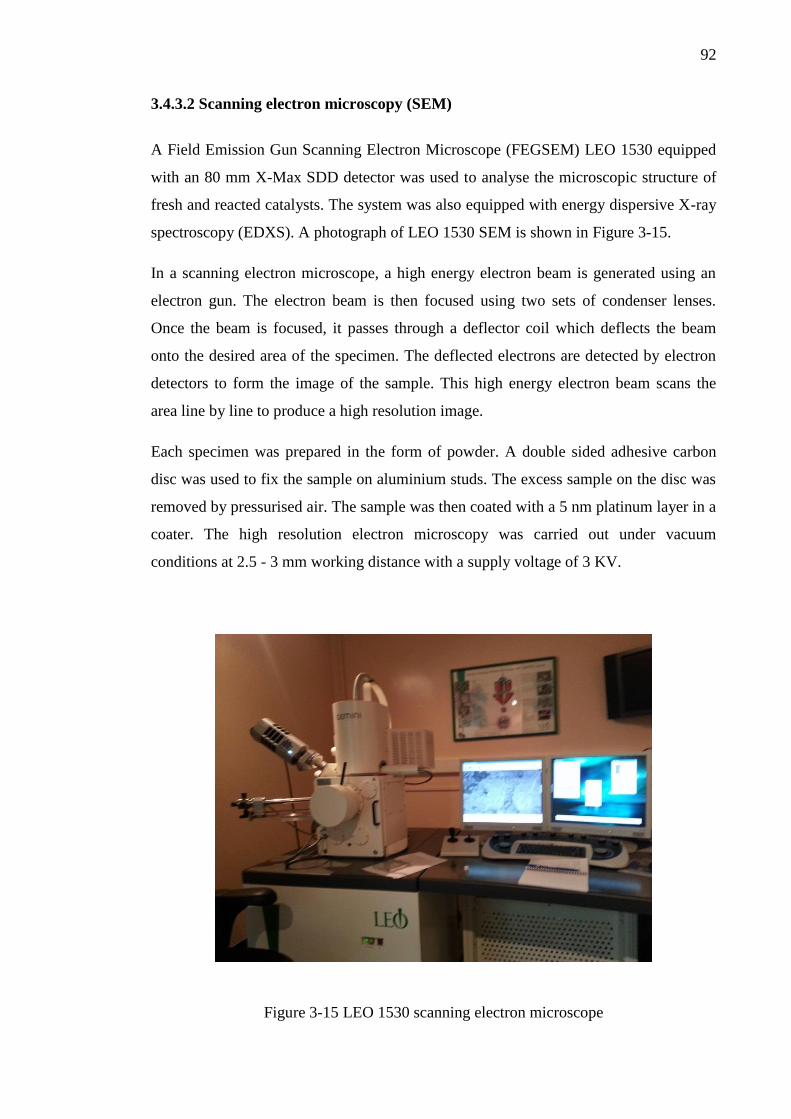
92
3.4.3.2 Scanning electron microscopy (SEM)
A Field Emission Gun Scanning Electron Microscope (FEGSEM) LEO 1530 equipped
with an 80 mm X-Max SDD detector was used to analyse the microscopic structure of
fresh and reacted catalysts. The system was also equipped with energy dispersive X-ray
spectroscopy (EDXS). A photograph of LEO 1530 SEM is shown in Figure 3-15.
In a scanning electron microscope, a high energy electron beam is generated using an
electron gun. The electron beam is then focused using two sets of condenser lenses.
Once the beam is focused, it passes through a deflector coil which deflects the beam
onto the desired area of the specimen. The deflected electrons are detected by electron
detectors to form the image of the sample. This high energy electron beam scans the
area line by line to produce a high resolution image.
Each specimen was prepared in the form of powder. A double sided adhesive carbon
disc was used to fix the sample on aluminium studs. The excess sample on the disc was
removed by pressurised air. The sample was then coated with a 5 nm platinum layer in a
coater. The high resolution electron microscopy was carried out under vacuum
conditions at 2.5 - 3 mm working distance with a supply voltage of 3 KV.
Figure 3-15 LEO 1530 scanning electron microscope
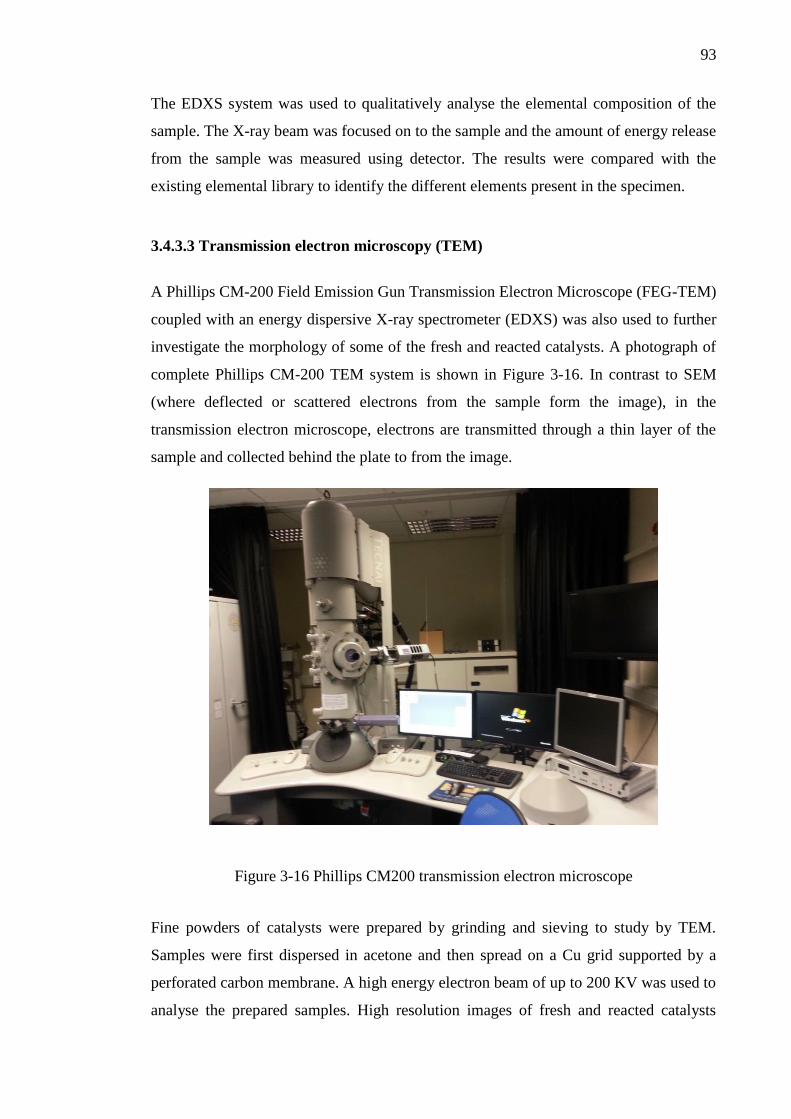
93
The EDXS system was used to qualitatively analyse the elemental composition of the
sample. The X-ray beam was focused on to the sample and the amount of energy release
from the sample was measured using detector. The results were compared with the
existing elemental library to identify the different elements present in the specimen.
3.4.3.3 Transmission electron microscopy (TEM)
A Phillips CM-200 Field Emission Gun Transmission Electron Microscope (FEG-TEM)
coupled with an energy dispersive X-ray spectrometer (EDXS) was also used to further
investigate the morphology of some of the fresh and reacted catalysts. A photograph of
complete Phillips CM-200 TEM system is shown in Figure 3-16. In contrast to SEM
(where deflected or scattered electrons from the sample form the image), in the
transmission electron microscope, electrons are transmitted through a thin layer of the
sample and collected behind the plate to from the image.
Figure 3-16 Phillips CM200 transmission electron microscope
Fine powders of catalysts were prepared by grinding and sieving to study by TEM.
Samples were first dispersed in acetone and then spread on a Cu grid supported by a
perforated carbon membrane. A high energy electron beam of up to 200 KV was used to
analyse the prepared samples. High resolution images of fresh and reacted catalysts
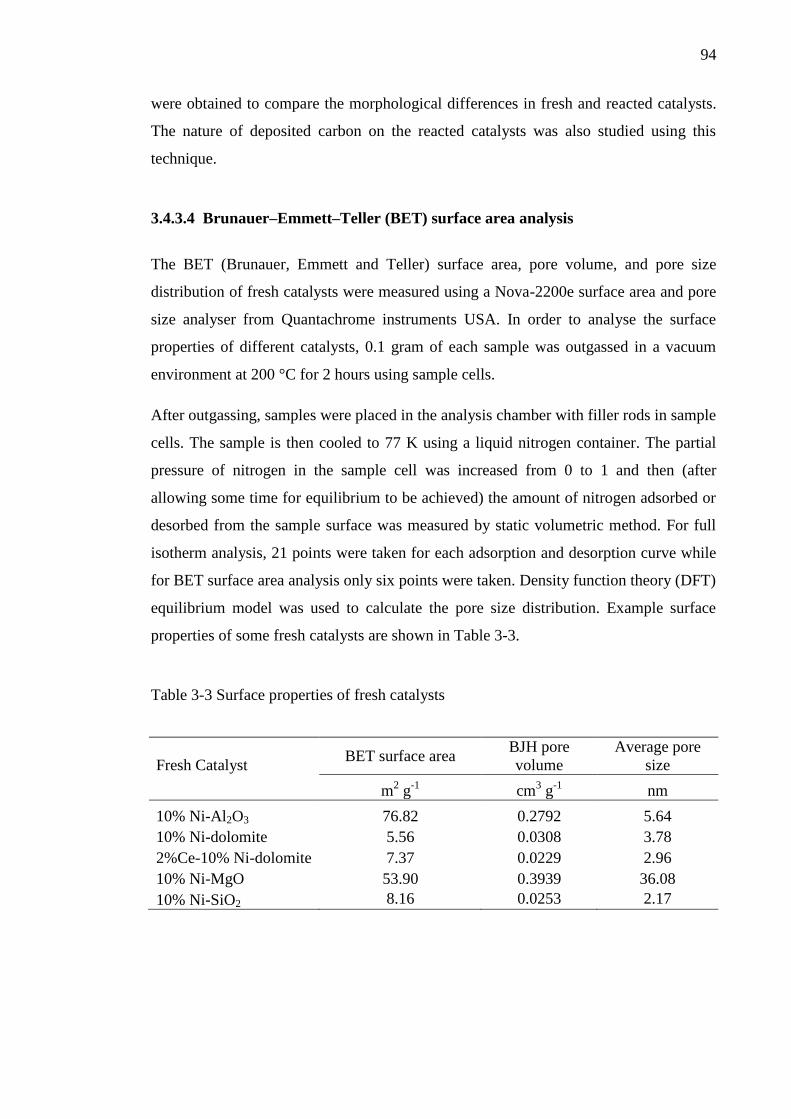
94
were obtained to compare the morphological differences in fresh and reacted catalysts.
The nature of deposited carbon on the reacted catalysts was also studied using this
technique.
3.4.3.4 Brunauer–Emmett–Teller (BET) surface area analysis
The BET (Brunauer, Emmett and Teller) surface area, pore volume, and pore size
distribution of fresh catalysts were measured using a Nova-2200e surface area and pore
size analyser from Quantachrome instruments USA. In order to analyse the surface
properties of different catalysts, 0.1 gram of each sample was outgassed in a vacuum
environment at 200 °C for 2 hours using sample cells.
After outgassing, samples were placed in the analysis chamber with filler rods in sample
cells. The sample is then cooled to 77 K using a liquid nitrogen container. The partial
pressure of nitrogen in the sample cell was increased from 0 to 1 and then (after
allowing some time for equilibrium to be achieved) the amount of nitrogen adsorbed or
desorbed from the sample surface was measured by static volumetric method. For full
isotherm analysis, 21 points were taken for each adsorption and desorption curve while
for BET surface area analysis only six points were taken. Density function theory (DFT)
equilibrium model was used to calculate the pore size distribution. Example surface
properties of some fresh catalysts are shown in Table 3-3.
Table 3-3 Surface properties of fresh catalysts
Fresh Catalyst BET surface area
BJH pore
volume
Average pore
size
m2 g
-1 cm
3 g
-1 nm
10% Ni-Al2O3 76.82 0.2792 5.64
10% Ni-dolomite 5.56 0.0308 3.78
2%Ce-10% Ni-dolomite 7.37 0.0229 2.96
10% Ni-MgO 53.90 0.3939 36.08
10% Ni-SiO2 8.16 0.0253 2.17
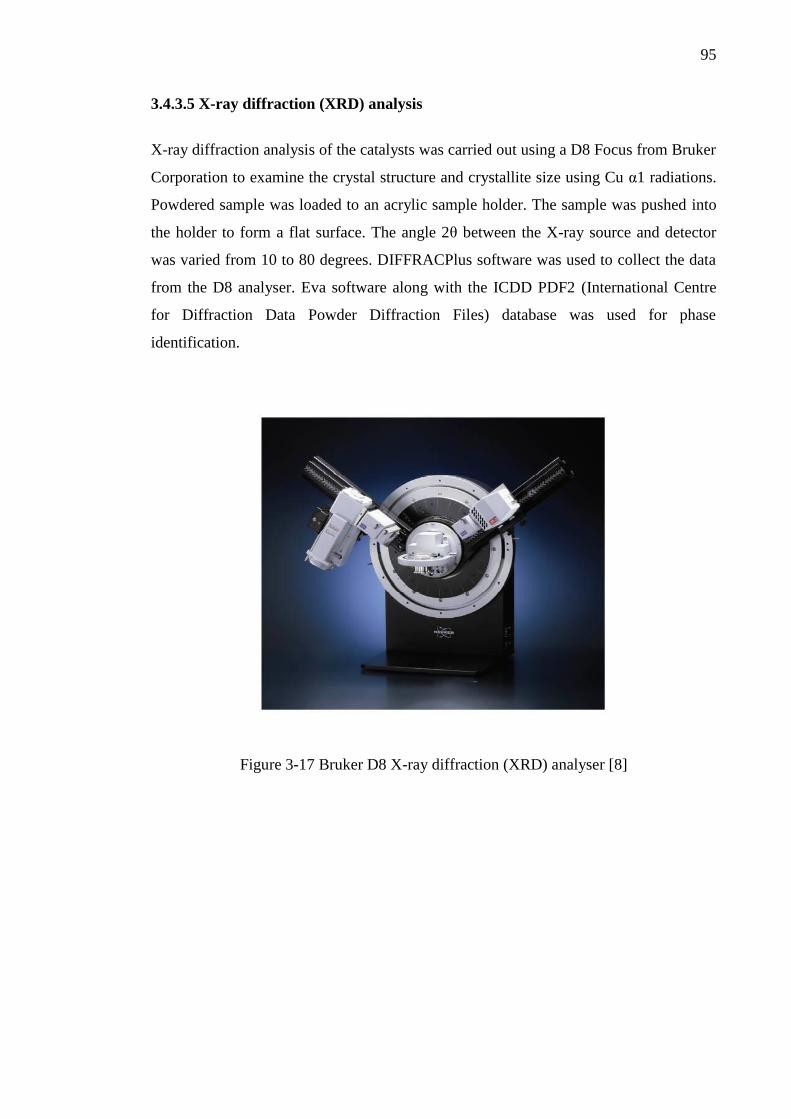
95
3.4.3.5 X-ray diffraction (XRD) analysis
X-ray diffraction analysis of the catalysts was carried out using a D8 Focus from Bruker
Corporation to examine the crystal structure and crystallite size using Cu α1 radiations.
Powdered sample was loaded to an acrylic sample holder. The sample was pushed into
the holder to form a flat surface. The angle 2θ between the X-ray source and detector
was varied from 10 to 80 degrees. DIFFRACPlus software was used to collect the data
from the D8 analyser. Eva software along with the ICDD PDF2 (International Centre
for Diffraction Data Powder Diffraction Files) database was used for phase
identification.
Figure 3-17 Bruker D8 X-ray diffraction (XRD) analyser [8]
96
3.5 Chapter references
[1] A. W. Bhutto, A. A. Bazmi, and G. Zahedi, "Greener energy: Issues and
challenges for Pakistan—Biomass energy prospective," Renewable and
Sustainable Energy Reviews, vol. 15, pp. 3207-3219, 2011.
[2] Wheat output for FY12 expected below target. Available:
http://dawn.com/2012/04/18/wheat-output-for-fy12-expected-below-target/
Accessed on (2012, 08/11/12).
[3] M. S. Abu Bakar and J. O. Titiloye, "Catalytic pyrolysis of rice husk for bio-oil
production," Journal of Analytical and Applied Pyrolysis.
[4] S. V. Vassilev, D. Baxter, L. K. Andersen, and C. G. Vassileva, "An overview of
the chemical composition of biomass," Fuel, vol. 89, pp. 913-933, 2010.
[5] C. Salvador, D. Lu, E. J. Anthony, and J. C. Abanades, "Enhancement of CaO
for CO2 capture in an FBC environment," Chemical Engineering Journal, vol.
96, pp. 187-195, 12/15/ 2003.
[6] C.-J. Ma, M. Kasahara, S. Tohno, and K.-C. Hwang, "Characterization of the
winter atmospheric aerosols in Kyoto and Seoul using PIXE, EAS and IC,"
Atmospheric Environment, vol. 35, pp. 747-752, 2001.
[7] I. F. Elbaba and P. T. Williams, "Two stage pyrolysis-catalytic gasification of
waste tyres: Influence of process parameters," Applied Catalysis B:
Environmental, vol. 125, pp. 136-143, 8/21/ 2012.
[8] Bruker d8 Advance X-ray Diffractometer. Available:
http://xraysrv.wustl.edu/web/xrd/brukerd8.html,P. Carpenter. Accessed on
(14/10/2013).
97
CHAPTER 4 FAST AND SLOW PYROLYSIS
OF BIOMASS
4.1 Introduction
Biomass plays a very important role in the world energy system, especially for
developing nations, accounting for approximately 38 % of their primary energy supply
[1]. Annual global production of biomass is estimated at 220 billion tonnes [2]. In this
study, three different biomass samples; waste wood, rice husk and forestry residue were
used to study the pyrolysis. The proximate and ultimate analysis results of these
biomass samples are reported in chapter 3.
In this chapter, the comparison of product yield and gas composition obtained from the
slow and fast pyrolysis (carried out at 850 °C) of these three different biomass samples
was performed. Two different laboratory-scale fixed-bed reactors were used in this
study. For fast pyrolysis experiments, biomass sample was exposed to the 850 °C
temperature by dropping from a water-cooled chamber into the reactor’s hot central
zone. For slow pyrolysis experiments, biomass containing crucible was placed inside
the reactor. Then the reactor was heated from room temperature to 850 °C at a constant
heating rate of 10 °C min-1
. The detailed reactor diagrams and experimental procedures
are explained in chapter 3.
It is well established that the proportion of the end products from the pyrolysis is highly
dependent on the process conditions, particularly temperature and heating rate [3-7]. In
this study, slow heating rate of 10 °C min-1
was employed during slow pyrolysis
experiments while a very high heating rate of more than 100 C/s was used during fast
pyrolysis experiments.
For three biomass samples, fast pyrolysis was also carried out at high temperatures of
750 – 1050 °C, to determine the influence of temperature on gas yield and composition.
Steam gasification of the wood biomass sample was also carried out to further enhance
the gas yield, particularly hydrogen yield.
98
4.2 Fast and slow pyrolysis of biomass at 850 °C
4.2.1 Product yield
Figure 4-1, Figure 4-2 and Figure 4-4 show the comparison of product yield and gas
composition from the fast and slow pyrolysis of biomass in relation to the wood, rice
husks and forestry residue respectively. The product yield from slow pyrolysis of
biomass samples (5 grams each) at 850 °C was drastically different from that of fast
pyrolysis. As shown in Figure 4-1, for the wood, only 24.7 wt.% gas yield was obtained
from slow pyrolysis as compared to 78.63 wt.% from fast pyrolysis. For rice husk only
18.94 wt.% gas yield from slow pyrolysis was obtained in contrast of 66.61 wt.% from
fast pyrolysis as shown in Figure 4-2. For forestry residue (Figure 4-4), only 24.01 wt.%
of biomass was recovered as gas from slow pyrolysis while 73.91 wt.% of biomass was
converted into gas from fast pyrolysis. The product yield from pyrolysis of biomass
mainly depends on the process conditions such as temperature and heating rate and the
residence time for which the volatiles stay at that final temperature. Zanzi et al. [8]
investigated the fast pyrolysis of wood and agricultural residues using a free-fall reactor
to determine the effects of heating rate, temperature, particle size and residence time on
the product distribution and gas composition. They reported that higher heating rates
favoured the cracking of tar and hydrocarbons into gaseous products. Also, higher
heating rates lead to lower char and higher gas yield during fast pyrolysis. In contrast,
during slow pyrolysis, longer residence time favours increased secondary reactions of
recondensation and re-polymerization of volatiles and hydrocarbons present in the
reactor which increases the formation of char [8]. Ahmed et al. [9] investigated the
pyrolysis and gasification of mangrove biomass from 600 °C to 900 °C. Their results
indicated the higher yield of syngas and hydrogen at higher temperature. During
pyrolysis they achieved around 72 wt.% conversion efficiency which was significantly
higher than their previous study [10].
The majority of the products obtained from slow pyrolysis of the three biomass samples
were volatiles and tars which were collected in the form of liquid oils and an aqueous
phase. The yield of liquids from slow pyrolysis was 59.4, 40, and 50.4 wt.% as
compared to 12.31, 10.22 and 16.98 wt.% from fast pyrolysis for wood , rice husk and
forestry residue respectively.
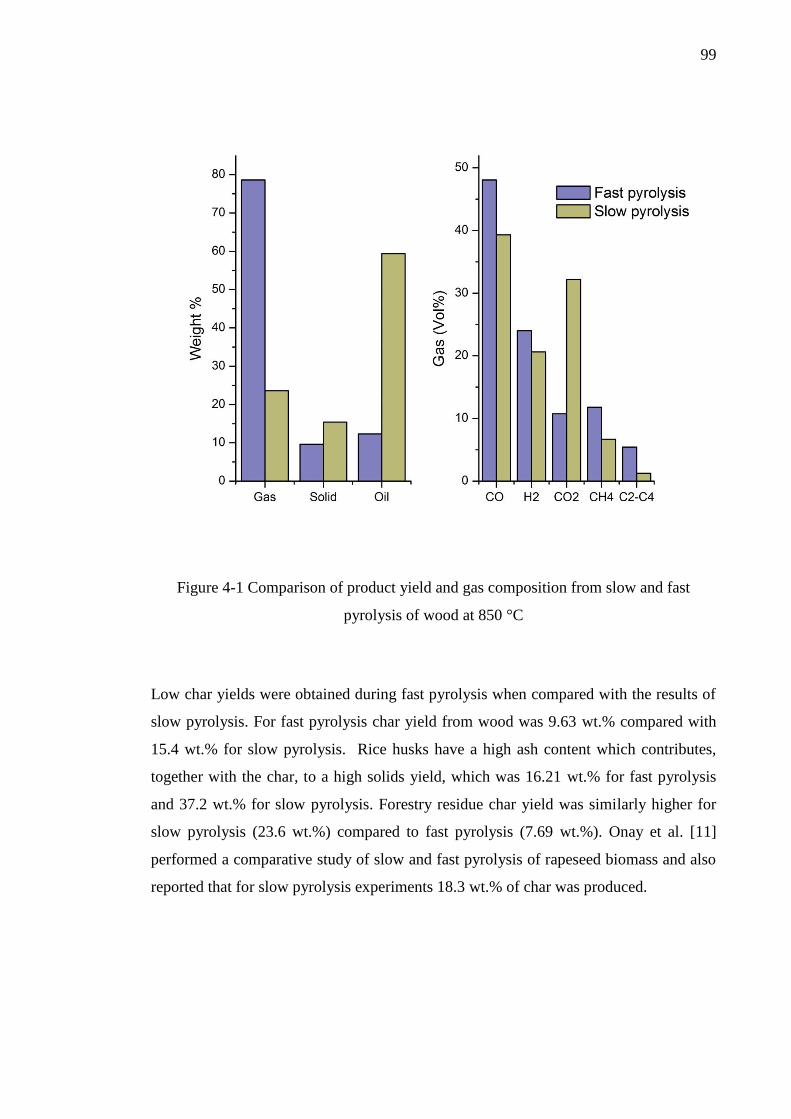
99
Figure 4-1 Comparison of product yield and gas composition from slow and fast
pyrolysis of wood at 850 °C
Low char yields were obtained during fast pyrolysis when compared with the results of
slow pyrolysis. For fast pyrolysis char yield from wood was 9.63 wt.% compared with
15.4 wt.% for slow pyrolysis. Rice husks have a high ash content which contributes,
together with the char, to a high solids yield, which was 16.21 wt.% for fast pyrolysis
and 37.2 wt.% for slow pyrolysis. Forestry residue char yield was similarly higher for
slow pyrolysis (23.6 wt.%) compared to fast pyrolysis (7.69 wt.%). Onay et al. [11]
performed a comparative study of slow and fast pyrolysis of rapeseed biomass and also
reported that for slow pyrolysis experiments 18.3 wt.% of char was produced.
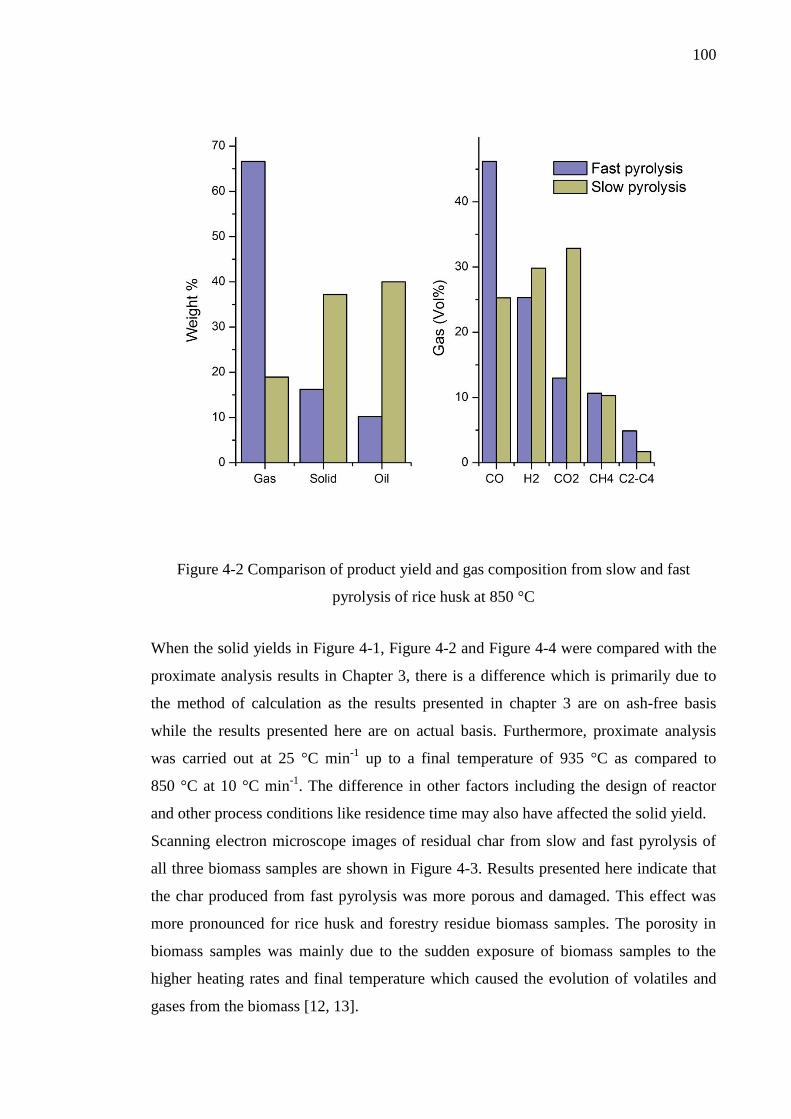
100
Figure 4-2 Comparison of product yield and gas composition from slow and fast
pyrolysis of rice husk at 850 °C
When the solid yields in Figure 4-1, Figure 4-2 and Figure 4-4 were compared with the
proximate analysis results in Chapter 3, there is a difference which is primarily due to
the method of calculation as the results presented in chapter 3 are on ash-free basis
while the results presented here are on actual basis. Furthermore, proximate analysis
was carried out at 25 °C min-1
up to a final temperature of 935 °C as compared to
850 °C at 10 °C min-1
. The difference in other factors including the design of reactor
and other process conditions like residence time may also have affected the solid yield.
Scanning electron microscope images of residual char from slow and fast pyrolysis of
all three biomass samples are shown in Figure 4-3. Results presented here indicate that
the char produced from fast pyrolysis was more porous and damaged. This effect was
more pronounced for rice husk and forestry residue biomass samples. The porosity in
biomass samples was mainly due to the sudden exposure of biomass samples to the
higher heating rates and final temperature which caused the evolution of volatiles and
gases from the biomass [12, 13].
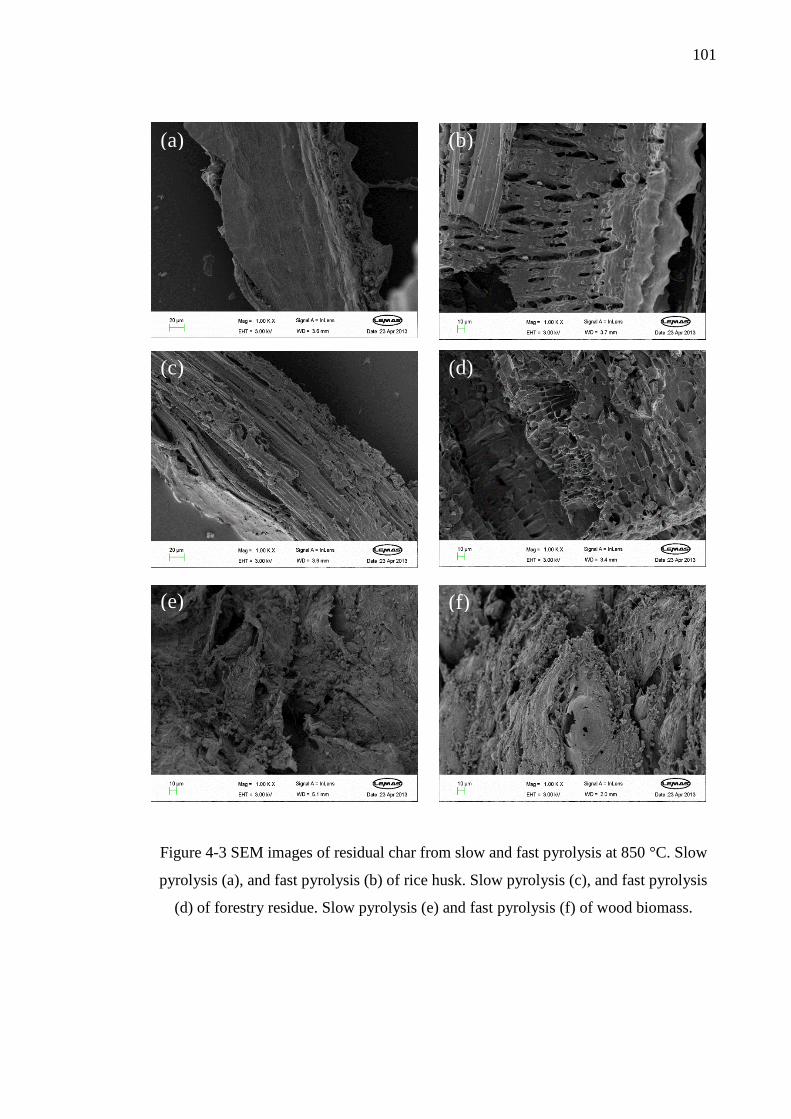
101
Figure 4-3 SEM images of residual char from slow and fast pyrolysis at 850 °C. Slow
pyrolysis (a), and fast pyrolysis (b) of rice husk. Slow pyrolysis (c), and fast pyrolysis
(d) of forestry residue. Slow pyrolysis (e) and fast pyrolysis (f) of wood biomass.
(d) (c)
(e) (f)
(a) (b)
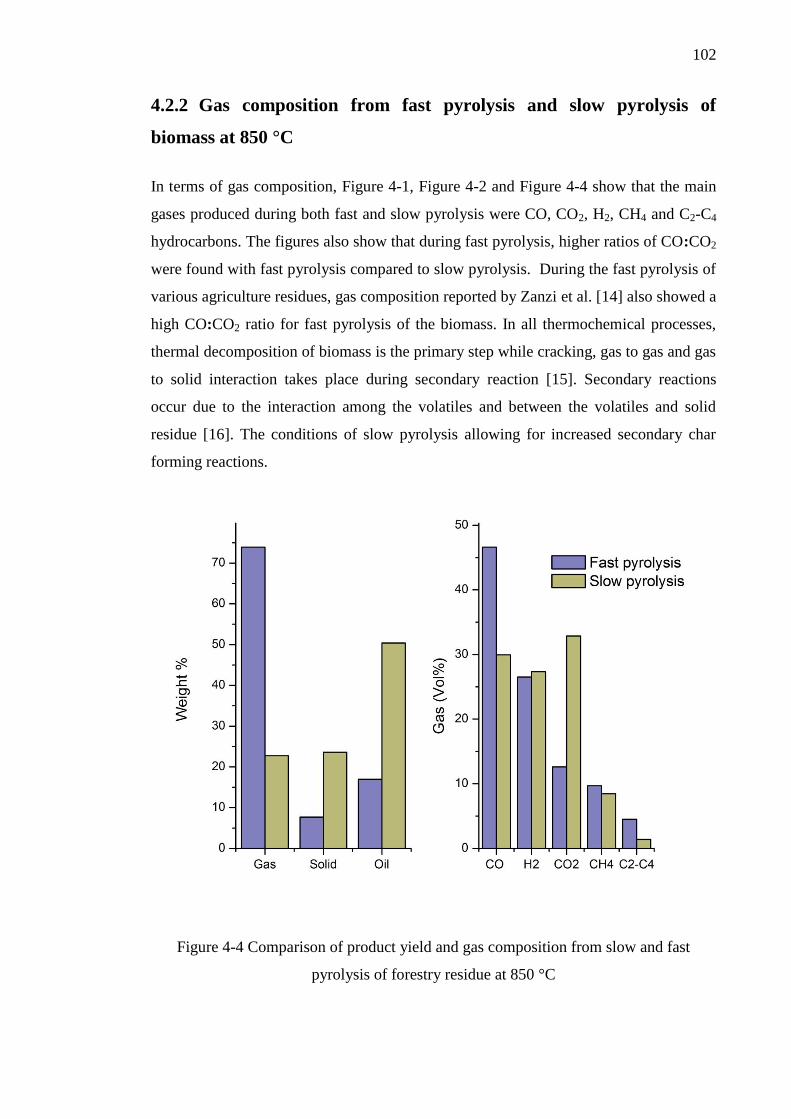
102
4.2.2 Gas composition from fast pyrolysis and slow pyrolysis of
biomass at 850 °C
In terms of gas composition, Figure 4-1, Figure 4-2 and Figure 4-4 show that the main
gases produced during both fast and slow pyrolysis were CO, CO2, H2, CH4 and C2-C4
hydrocarbons. The figures also show that during fast pyrolysis, higher ratios of CO:CO2
were found with fast pyrolysis compared to slow pyrolysis. During the fast pyrolysis of
various agriculture residues, gas composition reported by Zanzi et al. [14] also showed a
high CO:CO2 ratio for fast pyrolysis of the biomass. In all thermochemical processes,
thermal decomposition of biomass is the primary step while cracking, gas to gas and gas
to solid interaction takes place during secondary reaction [15]. Secondary reactions
occur due to the interaction among the volatiles and between the volatiles and solid
residue [16]. The conditions of slow pyrolysis allowing for increased secondary char
forming reactions.
Figure 4-4 Comparison of product yield and gas composition from slow and fast
pyrolysis of forestry residue at 850 °C
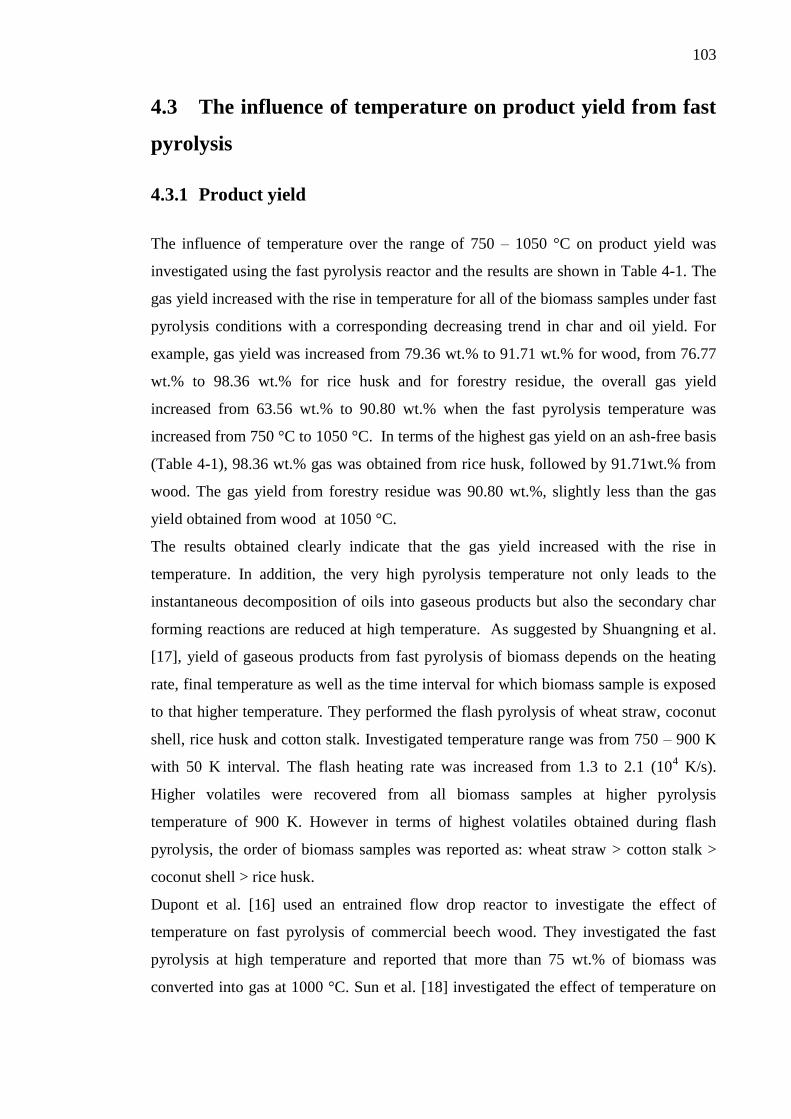
103
4.3 The influence of temperature on product yield from fast
pyrolysis
4.3.1 Product yield
The influence of temperature over the range of 750 – 1050 °C on product yield was
investigated using the fast pyrolysis reactor and the results are shown in Table 4-1. The
gas yield increased with the rise in temperature for all of the biomass samples under fast
pyrolysis conditions with a corresponding decreasing trend in char and oil yield. For
example, gas yield was increased from 79.36 wt.% to 91.71 wt.% for wood, from 76.77
wt.% to 98.36 wt.% for rice husk and for forestry residue, the overall gas yield
increased from 63.56 wt.% to 90.80 wt.% when the fast pyrolysis temperature was
increased from 750 °C to 1050 °C. In terms of the highest gas yield on an ash-free basis
(Table 4-1), 98.36 wt.% gas was obtained from rice husk, followed by 91.71wt.% from
wood. The gas yield from forestry residue was 90.80 wt.%, slightly less than the gas
yield obtained from wood at 1050 °C.
The results obtained clearly indicate that the gas yield increased with the rise in
temperature. In addition, the very high pyrolysis temperature not only leads to the
instantaneous decomposition of oils into gaseous products but also the secondary char
forming reactions are reduced at high temperature. As suggested by Shuangning et al.
[17], yield of gaseous products from fast pyrolysis of biomass depends on the heating
rate, final temperature as well as the time interval for which biomass sample is exposed
to that higher temperature. They performed the flash pyrolysis of wheat straw, coconut
shell, rice husk and cotton stalk. Investigated temperature range was from 750 – 900 K
with 50 K interval. The flash heating rate was increased from 1.3 to 2.1 (104 K/s).
Higher volatiles were recovered from all biomass samples at higher pyrolysis
temperature of 900 K. However in terms of highest volatiles obtained during flash
pyrolysis, the order of biomass samples was reported as: wheat straw > cotton stalk >
coconut shell > rice husk.
Dupont et al. [16] used an entrained flow drop reactor to investigate the effect of
temperature on fast pyrolysis of commercial beech wood. They investigated the fast
pyrolysis at high temperature and reported that more than 75 wt.% of biomass was
converted into gas at 1000 °C. Sun et al. [18] investigated the effect of temperature on
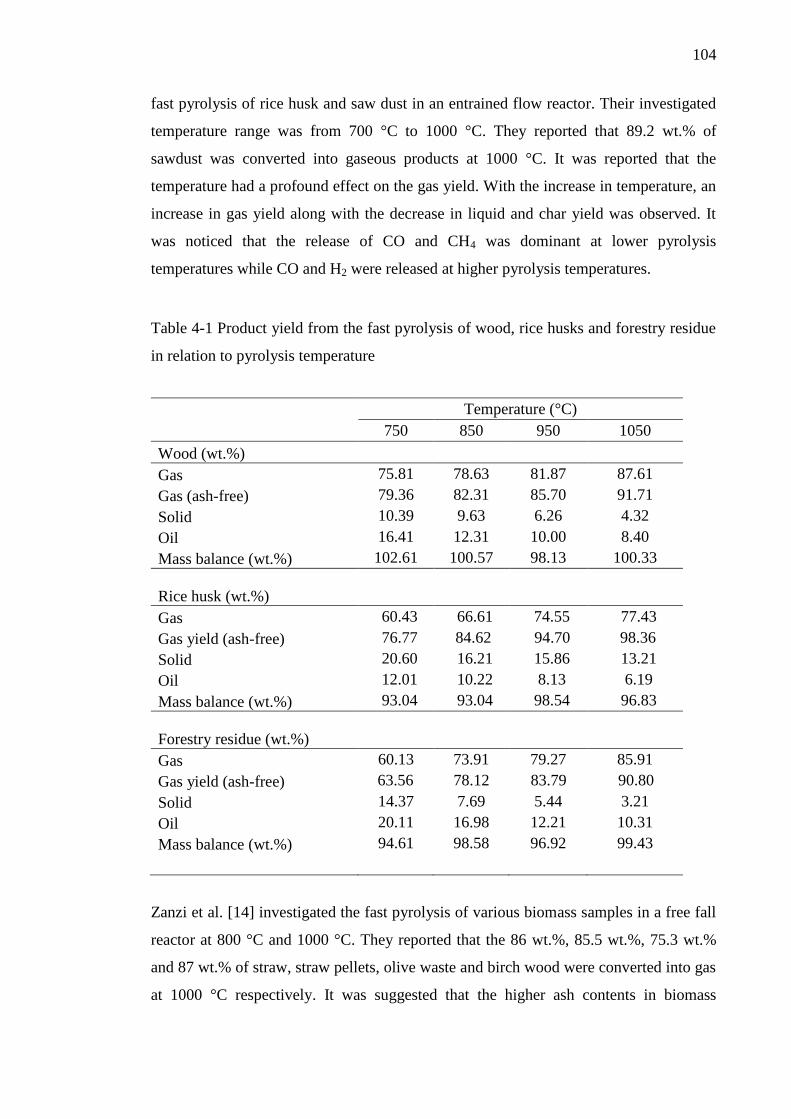
104
fast pyrolysis of rice husk and saw dust in an entrained flow reactor. Their investigated
temperature range was from 700 °C to 1000 °C. They reported that 89.2 wt.% of
sawdust was converted into gaseous products at 1000 °C. It was reported that the
temperature had a profound effect on the gas yield. With the increase in temperature, an
increase in gas yield along with the decrease in liquid and char yield was observed. It
was noticed that the release of CO and CH4 was dominant at lower pyrolysis
temperatures while CO and H2 were released at higher pyrolysis temperatures.
Table 4-1 Product yield from the fast pyrolysis of wood, rice husks and forestry residue
in relation to pyrolysis temperature
Temperature (°C)
750 850 950 1050
Wood (wt.%)
Gas 75.81 78.63 81.87 87.61
Gas (ash-free) 79.36 82.31 85.70 91.71
Solid 10.39 9.63 6.26 4.32
Oil 16.41 12.31 10.00 8.40
Mass balance (wt.%) 102.61 100.57 98.13 100.33
Rice husk (wt.%)
Gas 60.43 66.61 74.55 77.43
Gas yield (ash-free) 76.77 84.62 94.70 98.36
Solid 20.60 16.21 15.86 13.21
Oil 12.01 10.22 8.13 6.19
Mass balance (wt.%) 93.04 93.04 98.54 96.83
Forestry residue (wt.%)
Gas 60.13 73.91 79.27 85.91
Gas yield (ash-free) 63.56 78.12 83.79 90.80
Solid 14.37 7.69 5.44 3.21
Oil 20.11 16.98 12.21 10.31
Mass balance (wt.%) 94.61 98.58 96.92 99.43
Zanzi et al. [14] investigated the fast pyrolysis of various biomass samples in a free fall
reactor at 800 °C and 1000 °C. They reported that the 86 wt.%, 85.5 wt.%, 75.3 wt.%
and 87 wt.% of straw, straw pellets, olive waste and birch wood were converted into gas
at 1000 °C respectively. It was suggested that the higher ash contents in biomass
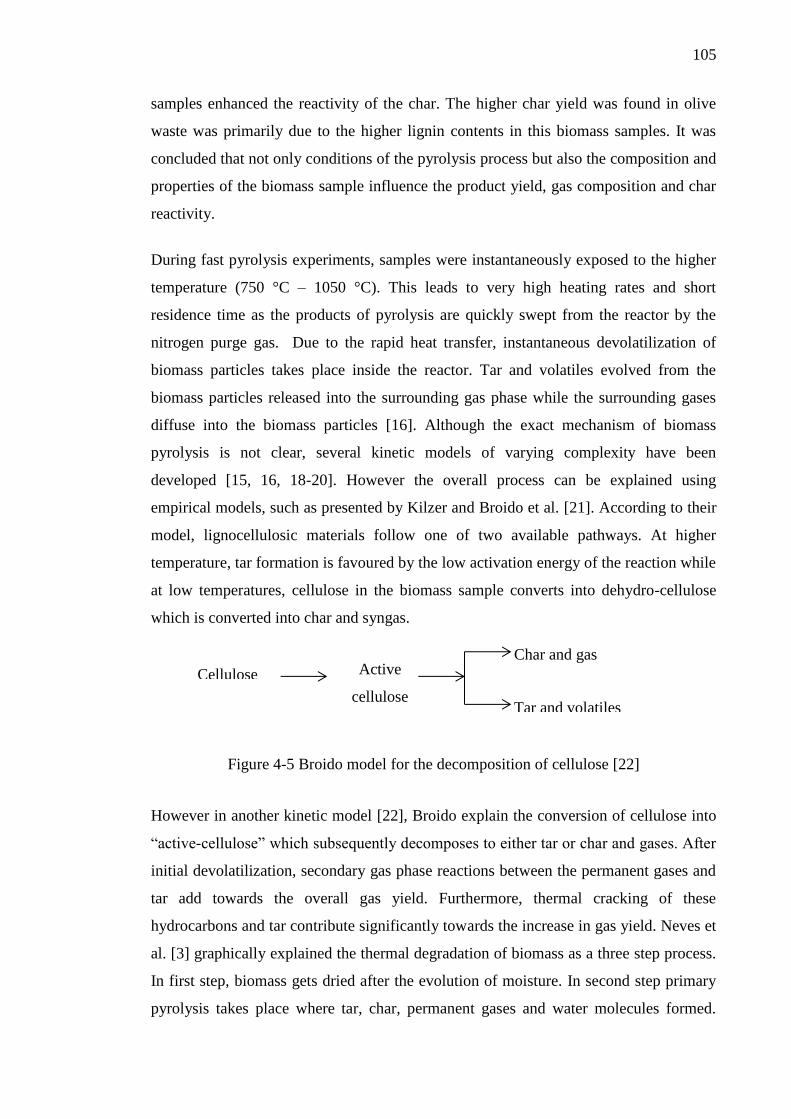
105
Cellulose Active
cellulose Tar and volatiles
Char and gas
samples enhanced the reactivity of the char. The higher char yield was found in olive
waste was primarily due to the higher lignin contents in this biomass samples. It was
concluded that not only conditions of the pyrolysis process but also the composition and
properties of the biomass sample influence the product yield, gas composition and char
reactivity.
During fast pyrolysis experiments, samples were instantaneously exposed to the higher
temperature (750 °C – 1050 °C). This leads to very high heating rates and short
residence time as the products of pyrolysis are quickly swept from the reactor by the
nitrogen purge gas. Due to the rapid heat transfer, instantaneous devolatilization of
biomass particles takes place inside the reactor. Tar and volatiles evolved from the
biomass particles released into the surrounding gas phase while the surrounding gases
diffuse into the biomass particles [16]. Although the exact mechanism of biomass
pyrolysis is not clear, several kinetic models of varying complexity have been
developed [15, 16, 18-20]. However the overall process can be explained using
empirical models, such as presented by Kilzer and Broido et al. [21]. According to their
model, lignocellulosic materials follow one of two available pathways. At higher
temperature, tar formation is favoured by the low activation energy of the reaction while
at low temperatures, cellulose in the biomass sample converts into dehydro-cellulose
which is converted into char and syngas.
Figure 4-5 Broido model for the decomposition of cellulose [22]
However in another kinetic model [22], Broido explain the conversion of cellulose into
“active-cellulose” which subsequently decomposes to either tar or char and gases. After
initial devolatilization, secondary gas phase reactions between the permanent gases and
tar add towards the overall gas yield. Furthermore, thermal cracking of these
hydrocarbons and tar contribute significantly towards the increase in gas yield. Neves et
al. [3] graphically explained the thermal degradation of biomass as a three step process.
In first step, biomass gets dried after the evolution of moisture. In second step primary
pyrolysis takes place where tar, char, permanent gases and water molecules formed.
106
During the third step, secondary pyrolysis takes place between these components from
primary pyrolysis which result in various reactions like reforming, cracking,
polymerization, oxidation and gasification.
Figure 4-6 Thermal degradation of biomass in an inert atmosphere adapted from [3]
4.3.2 The effect of fast pyrolysis temperature on gas composition
The gas composition for the fast pyrolysis of the biomass samples in relation to
temperature of pyrolysis from 750 - 1050 °C are shown in Table 4-2. The results show
that there was small increase in CO and a decrease in CO2 with increased pyrolysis
temperature. The hydrogen yield was significantly increased with temperature and there
was a consequent decrease in methane and C2-C4 hydrocarbons. Dupont et al. [12]
investigated the fast pyrolysis of pine and spruce wood in an entrained flow reactor.
They reported around 55 vol.% CO along with 23 vol.% H2 at 950 °C. Also around 5
vol.% CO2 and 15 vol.% CH4 along with less than 10 vol.% lighter hydrocarbons were
observed in the gas mixture.
Chen et al. [4] performed the fast pyrolysis of cotton stalks in a fixed bed reactor. They
reported the increase in hydrogen concentration with the rise in temperature, from 27.74
vol.% H2 at 750 °C and 36.66 vol.% of H2 at 950 °C. Zanzi et al. [14] performed the
rapid pyrolysis of straw, straw pellets, olive waste and birch wood at 800 °C and 1000
°C. Higher hydrogen and CO concentrations were reported with the rise in temperature.
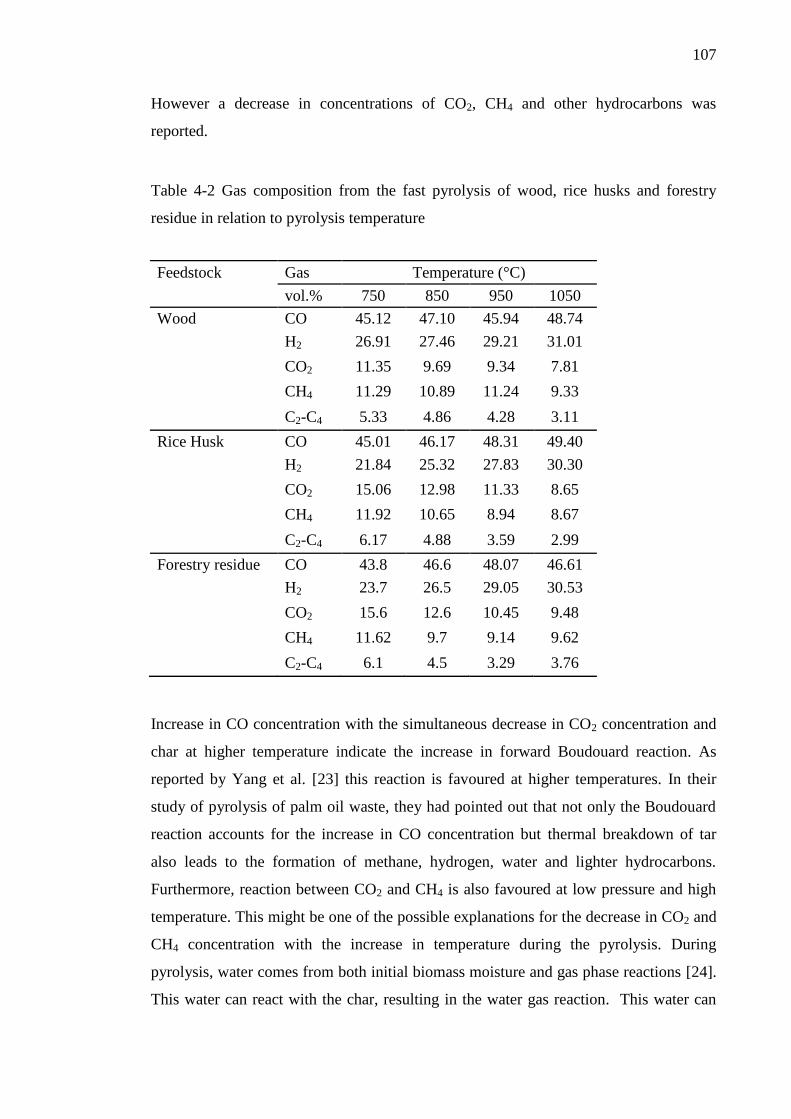
107
However a decrease in concentrations of CO2, CH4 and other hydrocarbons was
reported.
Table 4-2 Gas composition from the fast pyrolysis of wood, rice husks and forestry
residue in relation to pyrolysis temperature
Feedstock Gas Temperature (°C)
vol.% 750 850 950 1050
Wood CO 45.12 47.10 45.94 48.74
H2 26.91 27.46 29.21 31.01
CO2 11.35 9.69 9.34 7.81
CH4 11.29 10.89 11.24 9.33
C2-C4 5.33 4.86 4.28 3.11
Rice Husk CO 45.01 46.17 48.31 49.40
H2 21.84 25.32 27.83 30.30
CO2 15.06 12.98 11.33 8.65
CH4 11.92 10.65 8.94 8.67
C2-C4 6.17 4.88 3.59 2.99
Forestry residue CO 43.8 46.6 48.07 46.61
H2 23.7 26.5 29.05 30.53
CO2 15.6 12.6 10.45 9.48
CH4 11.62 9.7 9.14 9.62
C2-C4 6.1 4.5 3.29 3.76
Increase in CO concentration with the simultaneous decrease in CO2 concentration and
char at higher temperature indicate the increase in forward Boudouard reaction. As
reported by Yang et al. [23] this reaction is favoured at higher temperatures. In their
study of pyrolysis of palm oil waste, they had pointed out that not only the Boudouard
reaction accounts for the increase in CO concentration but thermal breakdown of tar
also leads to the formation of methane, hydrogen, water and lighter hydrocarbons.
Furthermore, reaction between CO2 and CH4 is also favoured at low pressure and high
temperature. This might be one of the possible explanations for the decrease in CO2 and
CH4 concentration with the increase in temperature during the pyrolysis. During
pyrolysis, water comes from both initial biomass moisture and gas phase reactions [24].
This water can react with the char, resulting in the water gas reaction. This water can
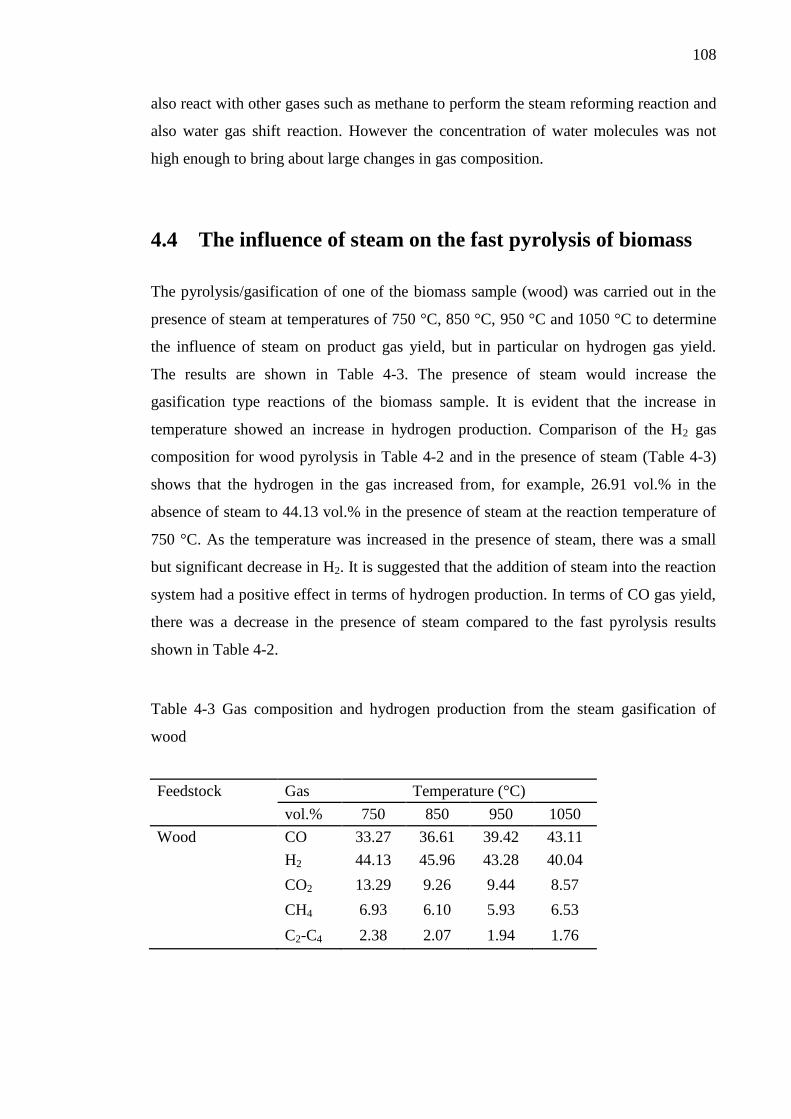
108
also react with other gases such as methane to perform the steam reforming reaction and
also water gas shift reaction. However the concentration of water molecules was not
high enough to bring about large changes in gas composition.
4.4 The influence of steam on the fast pyrolysis of biomass
The pyrolysis/gasification of one of the biomass sample (wood) was carried out in the
presence of steam at temperatures of 750 °C, 850 °C, 950 °C and 1050 °C to determine
the influence of steam on product gas yield, but in particular on hydrogen gas yield.
The results are shown in Table 4-3. The presence of steam would increase the
gasification type reactions of the biomass sample. It is evident that the increase in
temperature showed an increase in hydrogen production. Comparison of the H2 gas
composition for wood pyrolysis in Table 4-2 and in the presence of steam (Table 4-3)
shows that the hydrogen in the gas increased from, for example, 26.91 vol.% in the
absence of steam to 44.13 vol.% in the presence of steam at the reaction temperature of
750 °C. As the temperature was increased in the presence of steam, there was a small
but significant decrease in H2. It is suggested that the addition of steam into the reaction
system had a positive effect in terms of hydrogen production. In terms of CO gas yield,
there was a decrease in the presence of steam compared to the fast pyrolysis results
shown in Table 4-2.
Table 4-3 Gas composition and hydrogen production from the steam gasification of
wood
Feedstock Gas Temperature (°C)
vol.% 750 850 950 1050
Wood CO 33.27 36.61 39.42 43.11
H2 44.13 45.96 43.28 40.04
CO2 13.29 9.26 9.44 8.57
CH4 6.93 6.10 5.93 6.53
C2-C4 2.38 2.07 1.94 1.76
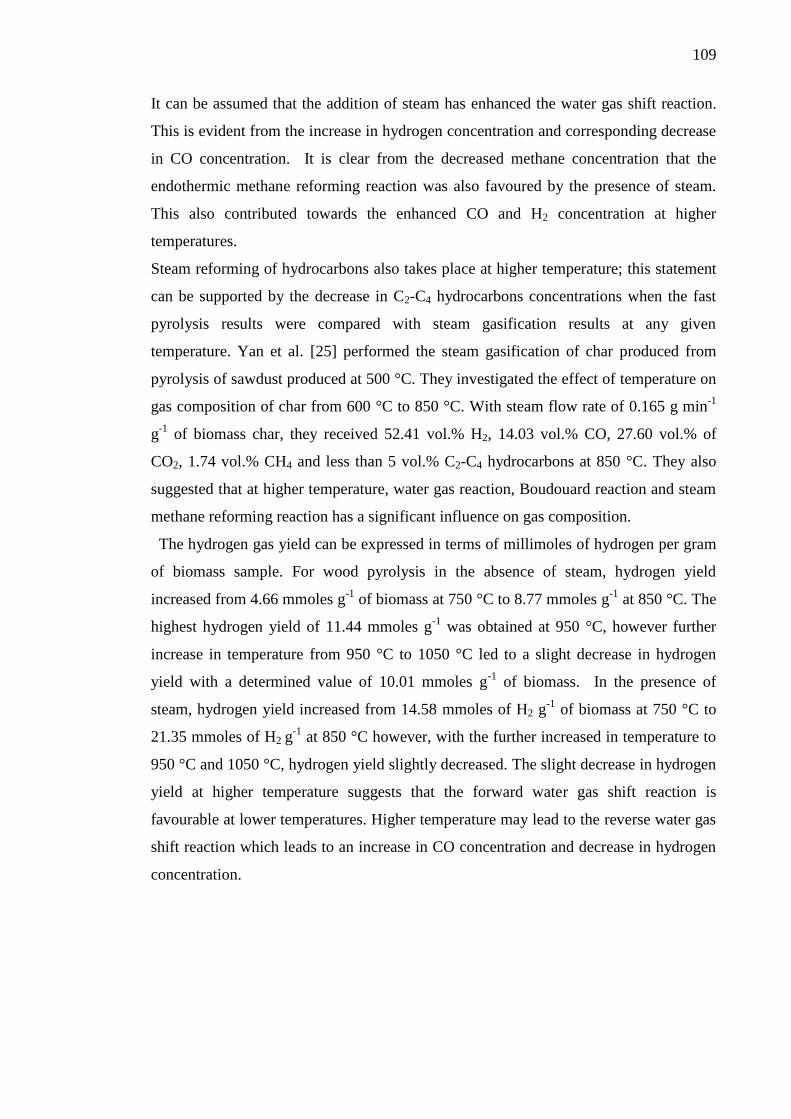
109
It can be assumed that the addition of steam has enhanced the water gas shift reaction.
This is evident from the increase in hydrogen concentration and corresponding decrease
in CO concentration. It is clear from the decreased methane concentration that the
endothermic methane reforming reaction was also favoured by the presence of steam.
This also contributed towards the enhanced CO and H2 concentration at higher
temperatures.
Steam reforming of hydrocarbons also takes place at higher temperature; this statement
can be supported by the decrease in C2-C4 hydrocarbons concentrations when the fast
pyrolysis results were compared with steam gasification results at any given
temperature. Yan et al. [25] performed the steam gasification of char produced from
pyrolysis of sawdust produced at 500 °C. They investigated the effect of temperature on
gas composition of char from 600 °C to 850 °C. With steam flow rate of 0.165 g min-1
g-1
of biomass char, they received 52.41 vol.% H2, 14.03 vol.% CO, 27.60 vol.% of
CO2, 1.74 vol.% CH4 and less than 5 vol.% C2-C4 hydrocarbons at 850 °C. They also
suggested that at higher temperature, water gas reaction, Boudouard reaction and steam
methane reforming reaction has a significant influence on gas composition.
The hydrogen gas yield can be expressed in terms of millimoles of hydrogen per gram
of biomass sample. For wood pyrolysis in the absence of steam, hydrogen yield
increased from 4.66 mmoles g-1
of biomass at 750 °C to 8.77 mmoles g-1
at 850 °C. The
highest hydrogen yield of 11.44 mmoles g-1
was obtained at 950 °C, however further
increase in temperature from 950 °C to 1050 °C led to a slight decrease in hydrogen
yield with a determined value of 10.01 mmoles g-1
of biomass. In the presence of
steam, hydrogen yield increased from 14.58 mmoles of H2 g-1
of biomass at 750 °C to
21.35 mmoles of H2 g-1
at 850 °C however, with the further increased in temperature to
950 °C and 1050 °C, hydrogen yield slightly decreased. The slight decrease in hydrogen
yield at higher temperature suggests that the forward water gas shift reaction is
favourable at lower temperatures. Higher temperature may lead to the reverse water gas
shift reaction which leads to an increase in CO concentration and decrease in hydrogen
concentration.
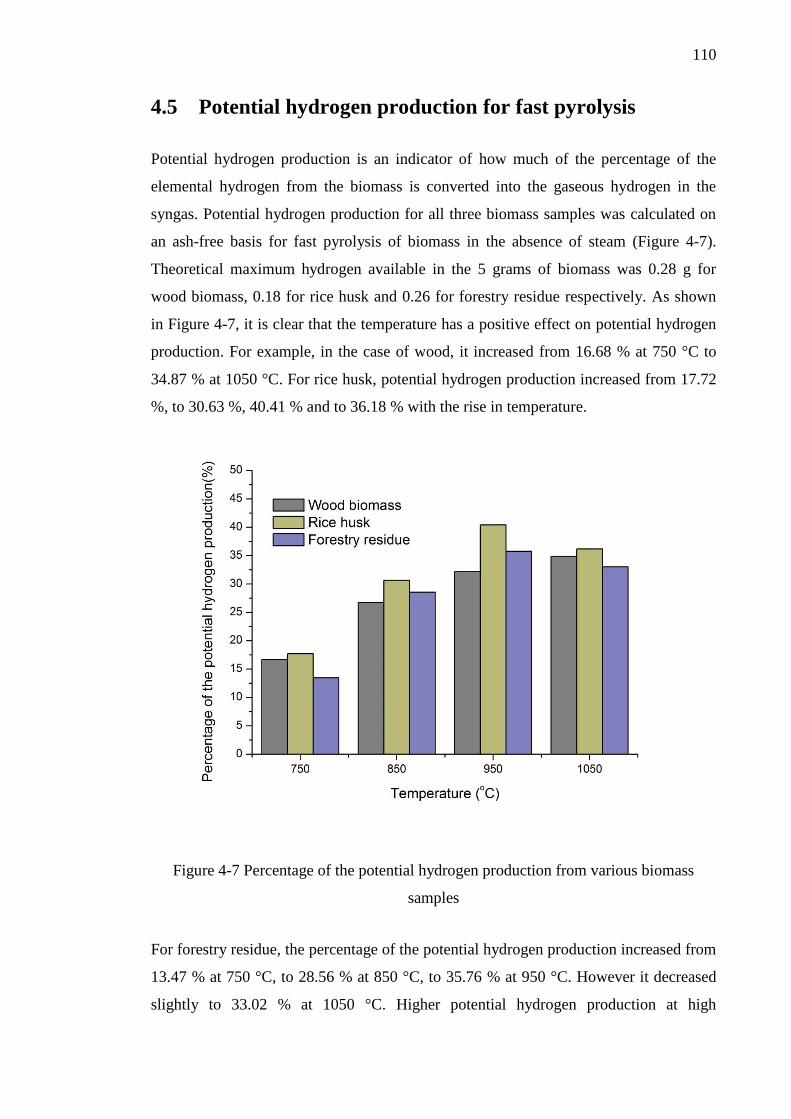
110
4.5 Potential hydrogen production for fast pyrolysis
Potential hydrogen production is an indicator of how much of the percentage of the
elemental hydrogen from the biomass is converted into the gaseous hydrogen in the
syngas. Potential hydrogen production for all three biomass samples was calculated on
an ash-free basis for fast pyrolysis of biomass in the absence of steam (Figure 4-7).
Theoretical maximum hydrogen available in the 5 grams of biomass was 0.28 g for
wood biomass, 0.18 for rice husk and 0.26 for forestry residue respectively. As shown
in Figure 4-7, it is clear that the temperature has a positive effect on potential hydrogen
production. For example, in the case of wood, it increased from 16.68 % at 750 °C to
34.87 % at 1050 °C. For rice husk, potential hydrogen production increased from 17.72
%, to 30.63 %, 40.41 % and to 36.18 % with the rise in temperature.
Figure 4-7 Percentage of the potential hydrogen production from various biomass
samples
For forestry residue, the percentage of the potential hydrogen production increased from
13.47 % at 750 °C, to 28.56 % at 850 °C, to 35.76 % at 950 °C. However it decreased
slightly to 33.02 % at 1050 °C. Higher potential hydrogen production at high
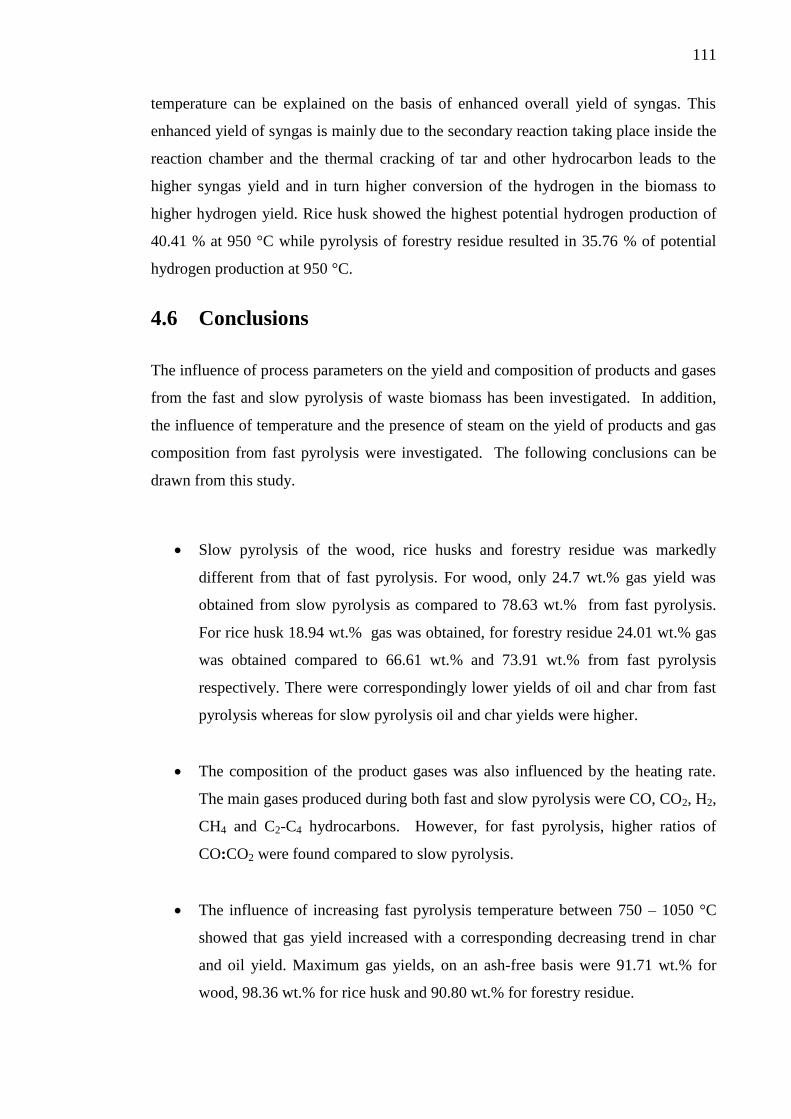
111
temperature can be explained on the basis of enhanced overall yield of syngas. This
enhanced yield of syngas is mainly due to the secondary reaction taking place inside the
reaction chamber and the thermal cracking of tar and other hydrocarbon leads to the
higher syngas yield and in turn higher conversion of the hydrogen in the biomass to
higher hydrogen yield. Rice husk showed the highest potential hydrogen production of
40.41 % at 950 °C while pyrolysis of forestry residue resulted in 35.76 % of potential
hydrogen production at 950 °C.
4.6 Conclusions
The influence of process parameters on the yield and composition of products and gases
from the fast and slow pyrolysis of waste biomass has been investigated. In addition,
the influence of temperature and the presence of steam on the yield of products and gas
composition from fast pyrolysis were investigated. The following conclusions can be
drawn from this study.
Slow pyrolysis of the wood, rice husks and forestry residue was markedly
different from that of fast pyrolysis. For wood, only 24.7 wt.% gas yield was
obtained from slow pyrolysis as compared to 78.63 wt.% from fast pyrolysis.
For rice husk 18.94 wt.% gas was obtained, for forestry residue 24.01 wt.% gas
was obtained compared to 66.61 wt.% and 73.91 wt.% from fast pyrolysis
respectively. There were correspondingly lower yields of oil and char from fast
pyrolysis whereas for slow pyrolysis oil and char yields were higher.
The composition of the product gases was also influenced by the heating rate.
The main gases produced during both fast and slow pyrolysis were CO, CO2, H2,
CH4 and C2-C4 hydrocarbons. However, for fast pyrolysis, higher ratios of
CO:CO2 were found compared to slow pyrolysis.
The influence of increasing fast pyrolysis temperature between 750 – 1050 °C
showed that gas yield increased with a corresponding decreasing trend in char
and oil yield. Maximum gas yields, on an ash-free basis were 91.71 wt.% for
wood, 98.36 wt.% for rice husk and 90.80 wt.% for forestry residue.

112
Addition of steam to the fast pyrolysis of wood produced increased yields of
hydrogen. For example, hydrogen concentration was 26.91 vol.% in the absence
of steam increasing to 44.13 vol.% in the presence of steam at the reaction
temperature of 750 °C.
113
4.7 Chapter references
[1] Y. Kalinci, A. Hepbasli, and I. Dincer, "Biomass-based hydrogen production: A
review and analysis," International Journal of Hydrogen Energy, vol. 34, pp.
8799-8817, 2009.
[2] U. K. Mirza, N. Ahmad, and T. Majeed, "An overview of biomass energy
utilization in Pakistan," Renewable and Sustainable Energy Reviews, vol. 12, pp.
1988-1996, 2008.
[3] D. Neves, H. Thunman, A. Matos, L. Tarelho, and A. Gómez-Barea,
"Characterization and prediction of biomass pyrolysis products," Progress in
Energy and Combustion Science, vol. 37, pp. 611-630, 2011.
[4] Y. Chen, H. Yang, X. Wang, S. Zhang, and H. Chen, "Biomass-based pyrolytic
polygeneration system on cotton stalk pyrolysis: Influence of temperature,"
Bioresource Technology, vol. 107, pp. 411-418, 2012.
[5] R. Isha and P. T. Williams, "Pyrolysis-gasification of agriculture biomass wastes
for hydrogen production," Journal of the Energy Institute, vol. 84, pp. 80-87,
2011.
[6] P. T. Williams, and Besler S., "The Pyrolysis of municipal solid waste," Journal
of the Institute of Energy, vol. 65, pp. 192-200, 1992.
[7] N. Miskolczi, F. Buyong, and P. T. Williams, "Thermogravimetric analysis and
pyrolysis kinetic study of Malaysian refuse derived fuels," Journal of the Energy
Institute, vol. 83, pp. 125-132, 2010.
[8] R. Zanzi, K. Sjöström, and E. Björnbom, "Rapid high-temperature pyrolysis of
biomass in a free-fall reactor," Fuel, vol. 75, pp. 545-550, 1996.
[9] I. Ahmed, W. Jangsawang, and A. K. Gupta, "Energy recovery from pyrolysis
and gasification of mangrove," Applied Energy, vol. 91, pp. 173-179, 2012.
[10] I. Ahmed and A. K. Gupta, "Syngas yield during pyrolysis and steam
gasification of paper," Applied Energy, vol. 86, pp. 1813-1821, 2009.
[11] O. Onay and O. M. Kockar, "Slow, fast and flash pyrolysis of rapeseed,"
Renewable Energy, vol. 28, pp. 2417-2433, 2003.
[12] C. Dupont, J.-M. Commandré, P. Gauthier, G. Boissonnet, S. Salvador, and D.
Schweich, "Biomass pyrolysis experiments in an analytical entrained flow
reactor between 1073K and 1273K," Fuel, vol. 87, pp. 1155-1164, 2008.
[13] L. Tognotti and E. Biagini, "Characterization of biomass chars : reactivity and
morphology of chars obtained in different conditions," International Journal of
Energy for a Clean Environment, vol. 6, pp. 439-457, 2006-06-06.
[14] R. Zanzi, K. Sjöström, and E. Björnbom, "Rapid pyrolysis of agricultural
residues at high temperature," Biomass and Bioenergy, vol. 23, pp. 357-366,
2002.
[15] J. Lédé, "Cellulose pyrolysis kinetics: An historical review on the existence and
role of intermediate active cellulose," Journal of Analytical and Applied
Pyrolysis, vol. 94, pp. 17-32, 2012.
[16] C. Dupont, L. Chen, J. Cances, J.-M. Commandre, A. Cuoci, S. Pierucci, et al.,
"Biomass pyrolysis: Kinetic modelling and experimental validation under high
temperature and flash heating rate conditions," Journal of Analytical and
Applied Pyrolysis, vol. 85, pp. 260-267, 2009.
[17] X. Shuangning, L. Zhihe, L. Baoming, Y. Weiming, and B. Xueyuan,
"Devolatilization characteristics of biomass at flash heating rate," Fuel, vol. 85,
pp. 664-670, 2006.
114
[18] S. Sun, H. Tian, Y. Zhao, R. Sun, and H. Zhou, "Experimental and numerical
study of biomass flash pyrolysis in an entrained flow reactor," Bioresource
Technology, vol. 101, pp. 3678-3684, 2010.
[19] B. V. Babu and A. S. Chaurasia, "Modeling for pyrolysis of solid particle:
kinetics and heat transfer effects," Energy Conversion and Management, vol. 44,
pp. 2251-2275, 2003.
[20] C. Di Blasi, "Modeling chemical and physical processes of wood and biomass
pyrolysis," Progress in Energy and Combustion Science, vol. 34, pp. 47-90,
2008.
[21] F. J. K. a. A. Broido, "Speculations on the nature of cellulose pyrolysis," Pyro-
dynamics, vol. 2, pp. 151-163, 1965.
[22] F. S. A. Broido, Thermal Uses and Properties of Carbohydrates and Lignins.
New York: Academic Press, 1976.
[23] H. Yang, R. Yan, H. Chen, D. H. Lee, D. T. Liang, and C. Zheng, "Pyrolysis of
palm oil wastes for enhanced production of hydrogen rich gases," Fuel
Processing Technology, vol. 87, pp. 935-942, 2006.
[24] S. Septien, S. Valin, C. Dupont, M. Peyrot, and S. Salvador, "Effect of particle
size and temperature on woody biomass fast pyrolysis at high temperature
(1000–1400°C)," Fuel, vol. 97, pp. 202-210, 2012.
[25] F. Yan, S.-y. Luo, Z.-q. Hu, B. Xiao, and G. Cheng, "Hydrogen-rich gas
production by steam gasification of char from biomass fast pyrolysis in a fixed-
bed reactor: Influence of temperature and steam on hydrogen yield and syngas
composition," Bioresource Technology, vol. 101, pp. 5633-5637, 2010.
115
CHAPTER 5 TWO-STAGE PYROLYSIS
GASIFICATION OF RICE HUSK, BAGASSE
AND WHEAT STRAW
5.1 Introduction
In order to select the most suitable biomass samples for further research on hydrogen
production, three different biomass samples: rice husk, sugarcane bagasse and wheat
straw were initially characterized using thermogravimetric analysis (TGA) in chapter 3.
In this chapter, a scanning electron microscope (SEM) was also used to characterize the
structural and morphological differences among these biomass samples. In section 5.2,
the influence of different parameters such as heating rate and particle size was
investigated using TGA. Kinetic parameters of these biomasses were also calculated
using the Coats-Redfern method.
In section 5.3, pyrolysis, steam gasification and catalytic steam gasification (using
calcined dolomite and 10 wt.% Ni-dolomite) of all three biomass samples were
performed. The purpose of this study was to select the best suited process and biomass
sample to produce high hydrogen yield from two-stage pyrolysis/gasification reactor.
In section 5.4, investigation of various process conditions such as temperature, water
injection rate, catalysts to sample ratio, particle size and carrier gas flow rate were
carried out using two-stage catalytic steam gasification.
5.2 Characterization of rice husk, sugarcane bagasse and
wheat straw using thermogravimetric analysis
In order to design efficient thermochemical conversion systems, it is important to
investigate the thermal degradation and kinetic behaviour of biomass samples. TGA is a
very popular technique which is extensively used to investigate the devolatilization
characteristics and thermal degradation behaviour of different biomass samples. In this
section, comparison of three different biomass samples is outlined in section 5.2.1. The
influence of heating rate on devolatilization of rice husk, bagasse and wheat straw is
described in section 5.2.2. The effect of particle size on rice husk, bagasse and wheat
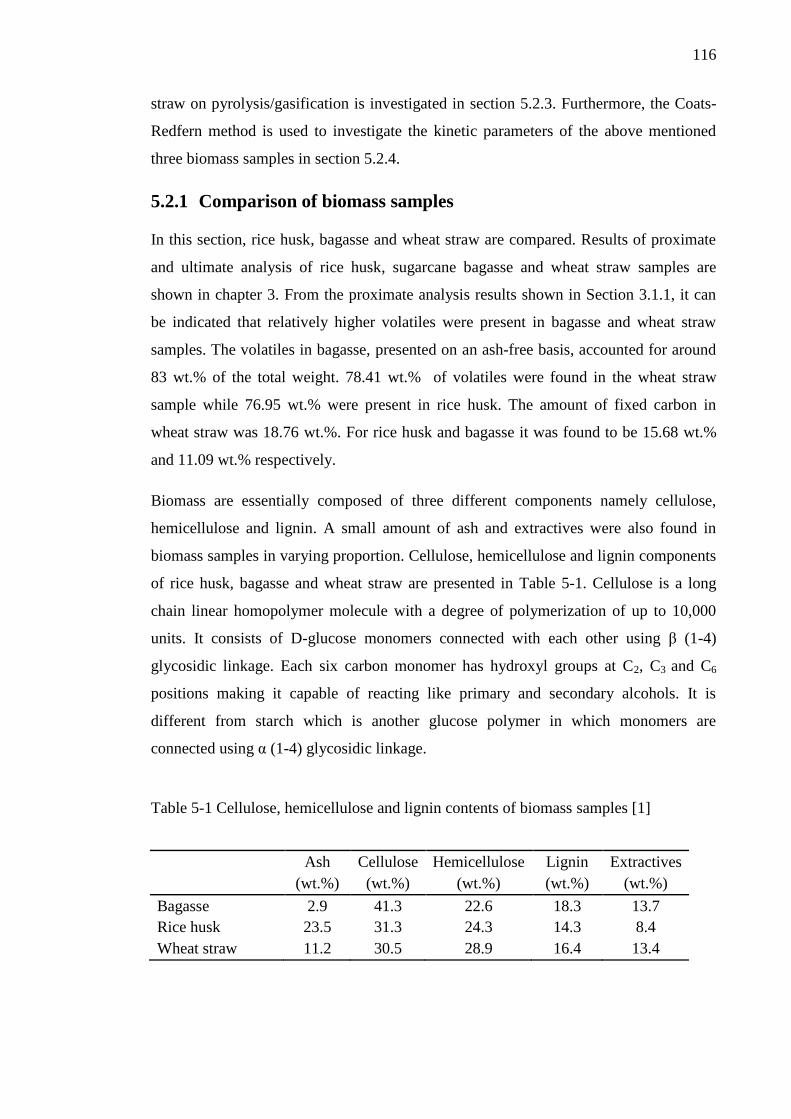
116
straw on pyrolysis/gasification is investigated in section 5.2.3. Furthermore, the Coats-
Redfern method is used to investigate the kinetic parameters of the above mentioned
three biomass samples in section 5.2.4.
5.2.1 Comparison of biomass samples
In this section, rice husk, bagasse and wheat straw are compared. Results of proximate
and ultimate analysis of rice husk, sugarcane bagasse and wheat straw samples are
shown in chapter 3. From the proximate analysis results shown in Section 3.1.1, it can
be indicated that relatively higher volatiles were present in bagasse and wheat straw
samples. The volatiles in bagasse, presented on an ash-free basis, accounted for around
83 wt.% of the total weight. 78.41 wt.% of volatiles were found in the wheat straw
sample while 76.95 wt.% were present in rice husk. The amount of fixed carbon in
wheat straw was 18.76 wt.%. For rice husk and bagasse it was found to be 15.68 wt.%
and 11.09 wt.% respectively.
Biomass are essentially composed of three different components namely cellulose,
hemicellulose and lignin. A small amount of ash and extractives were also found in
biomass samples in varying proportion. Cellulose, hemicellulose and lignin components
of rice husk, bagasse and wheat straw are presented in Table 5-1. Cellulose is a long
chain linear homopolymer molecule with a degree of polymerization of up to 10,000
units. It consists of D-glucose monomers connected with each other using β (1-4)
glycosidic linkage. Each six carbon monomer has hydroxyl groups at C2, C3 and C6
positions making it capable of reacting like primary and secondary alcohols. It is
different from starch which is another glucose polymer in which monomers are
connected using α (1-4) glycosidic linkage.
Table 5-1 Cellulose, hemicellulose and lignin contents of biomass samples [1]
Ash Cellulose Hemicellulose Lignin Extractives
(wt.%) (wt.%) (wt.%) (wt.%) (wt.%)
Bagasse 2.9 41.3 22.6 18.3 13.7
Rice husk 23.5 31.3 24.3 14.3 8.4
Wheat straw 11.2 30.5 28.9 16.4 13.4
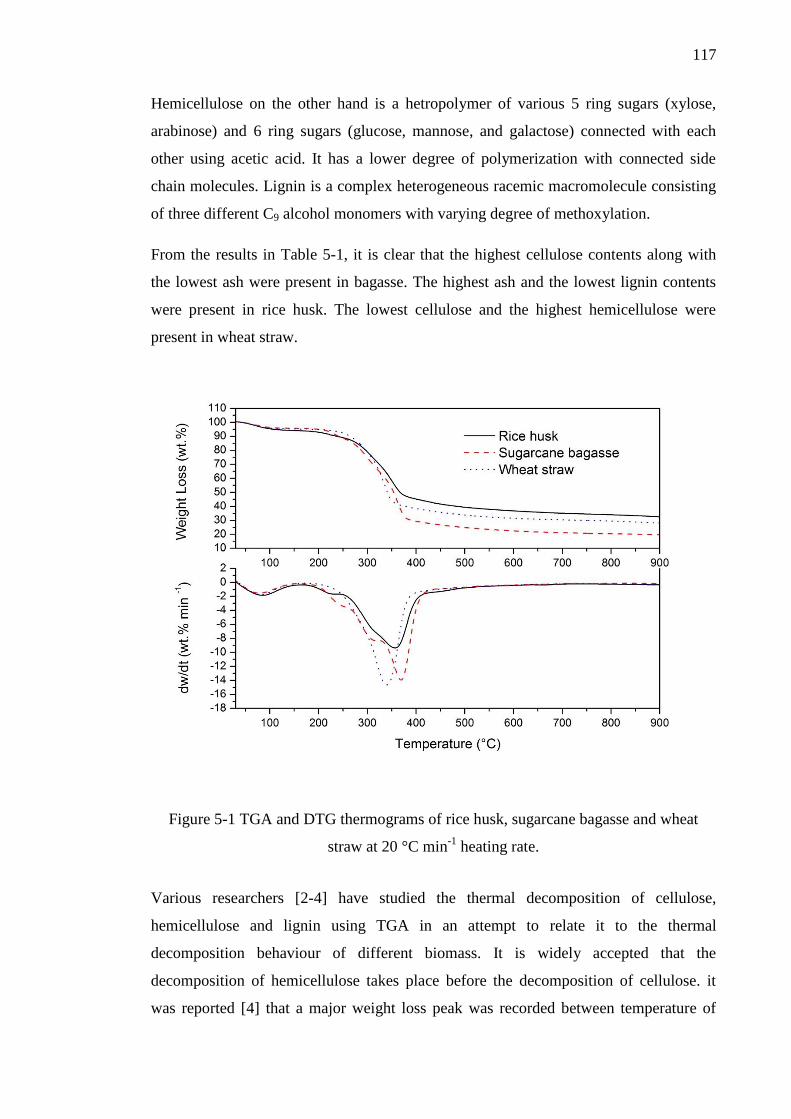
117
Hemicellulose on the other hand is a hetropolymer of various 5 ring sugars (xylose,
arabinose) and 6 ring sugars (glucose, mannose, and galactose) connected with each
other using acetic acid. It has a lower degree of polymerization with connected side
chain molecules. Lignin is a complex heterogeneous racemic macromolecule consisting
of three different C9 alcohol monomers with varying degree of methoxylation.
From the results in Table 5-1, it is clear that the highest cellulose contents along with
the lowest ash were present in bagasse. The highest ash and the lowest lignin contents
were present in rice husk. The lowest cellulose and the highest hemicellulose were
present in wheat straw.
Figure 5-1 TGA and DTG thermograms of rice husk, sugarcane bagasse and wheat
straw at 20 °C min-1
heating rate.
Various researchers [2-4] have studied the thermal decomposition of cellulose,
hemicellulose and lignin using TGA in an attempt to relate it to the thermal
decomposition behaviour of different biomass. It is widely accepted that the
decomposition of hemicellulose takes place before the decomposition of cellulose. it
was reported [4] that a major weight loss peak was recorded between temperature of
118
220 °C – 315 °C. The decomposition of cellulose on the other hand starts around 315 °C
up to a final temperature of 400 °C. One major weight loss peak is clearly observed
between these two temperatures. Lignin decomposition takes place slowly over the
entire temperature range.
Comparison of TGA and DTG thermograms of rice husk, bagasse and wheat straw is
shown in Figure 5-1, it can be indicated that after the initial moisture loss around 100
°C, the highest weight loss for bagasse was mainly due the higher cellulose and
hemicellulose contents which in turn produced more volatiles. This was further
complemented by the highest cellulose contents results in Table 5-1. In the DTG
thermogram of bagasse, the two shoulders on the left side of the main peak (around 300
°C) were most likely due to the decomposition of hemicellulose components in the
biomass sample. The main weight loss peak around 375 °C can be assigned to the
thermal decomposition of the cellulose component in biomass. Finally the slow
decomposition of the sample over the entire temperature range can be assigned to lignin.
For wheat straw, no separate decomposition peak or shoulder was visible before the
main weight loss curve around 340 °C.
For rice husk, after the initial moisture loss, a slight shoulder visible around 225 °C
indicate the decomposition of hemicellulose. Afterwards, major weight loss peak from
250 °C to 420 °C indicate the overlapping decomposition of hemicellulose and
cellulose. In contrast to bagasse and wheat straw, it is evident from Figure 5-1, that the
rice husk sample contains the lowest volatiles and the highest solid residue. These
results were further supported by the lower volatiles reported in chapter 3.
5.2.2 The effect of heating rate
The effect of heating rate on the devolatilization behaviour of rice husk, bagasse and
wheat straw were investigated using TGA. Three different heating rates of at 5, 20 and
40 °C min-1
were employed during this investigation. TGA and DTG thermograms for
rice husk, bagasse and wheat straw were shown in Figure 5-2, Figure 5-3, and Figure
5-4 respectively.
119
Figure 5-2 TGA and DTG thermograms of rice husk at 5, 20 and 40 °C min-1
heating
rates
The effect of heating rate on TGA and DTG rice husk is shown in Figure 5-2. From the
TGA thermogram it is clear that the increase in heating rate shifted the release of
volatiles to the slightly higher temperature. It was suggested in the literature [5, 6] that
this lateral shift was primarily due to the heat transfer limitations at higher heating rates.
Due to short reaction time at higher heating rates, higher temperature was required for
the evolution of volatiles from biomass samples while at slow heating rates, large
instantaneous energy along with longer residence time was available for the volatiles to
evolve from biomass. DTG thermogram showed initial weight loss attributed to the
moisture loss while the major weight loss observed between 250 °C to 450 °C was due
to the thermal decomposition and release of volatiles from rice husk.
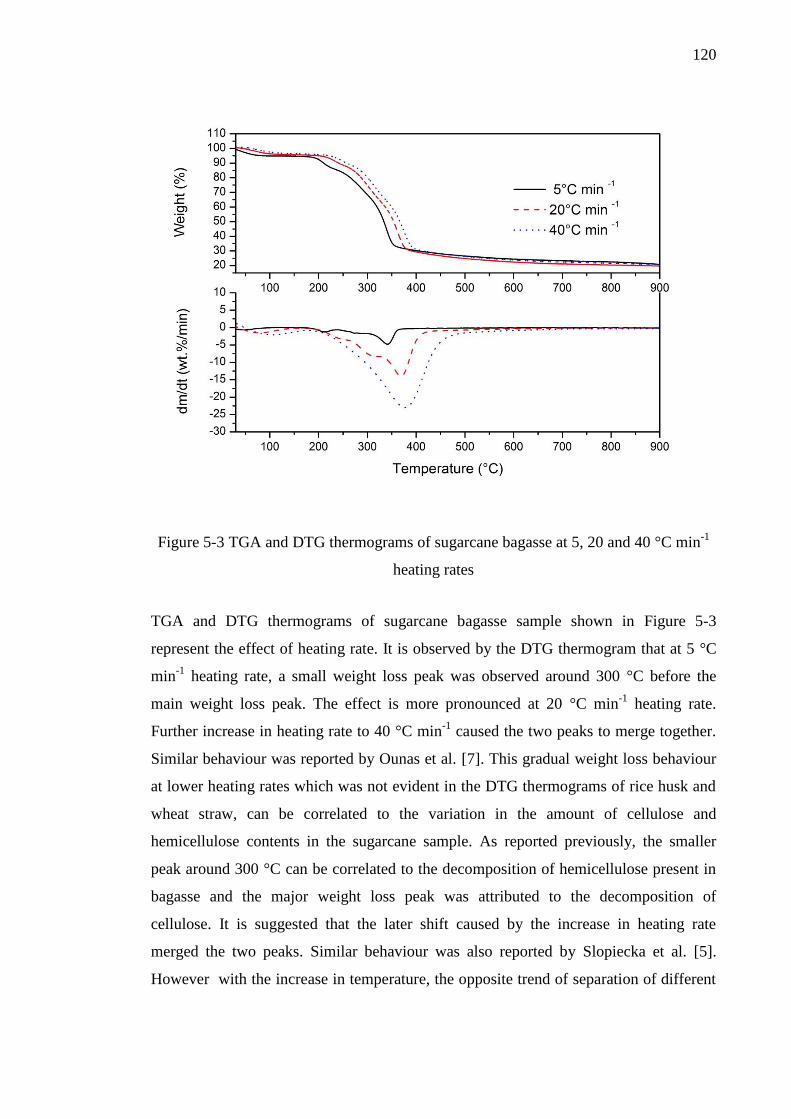
120
Figure 5-3 TGA and DTG thermograms of sugarcane bagasse at 5, 20 and 40 °C min-1
heating rates
TGA and DTG thermograms of sugarcane bagasse sample shown in Figure 5-3
represent the effect of heating rate. It is observed by the DTG thermogram that at 5 °C
min-1
heating rate, a small weight loss peak was observed around 300 °C before the
main weight loss peak. The effect is more pronounced at 20 °C min-1
heating rate.
Further increase in heating rate to 40 °C min-1
caused the two peaks to merge together.
Similar behaviour was reported by Ounas et al. [7]. This gradual weight loss behaviour
at lower heating rates which was not evident in the DTG thermograms of rice husk and
wheat straw, can be correlated to the variation in the amount of cellulose and
hemicellulose contents in the sugarcane sample. As reported previously, the smaller
peak around 300 °C can be correlated to the decomposition of hemicellulose present in
bagasse and the major weight loss peak was attributed to the decomposition of
cellulose. It is suggested that the later shift caused by the increase in heating rate
merged the two peaks. Similar behaviour was also reported by Slopiecka et al. [5].
However with the increase in temperature, the opposite trend of separation of different
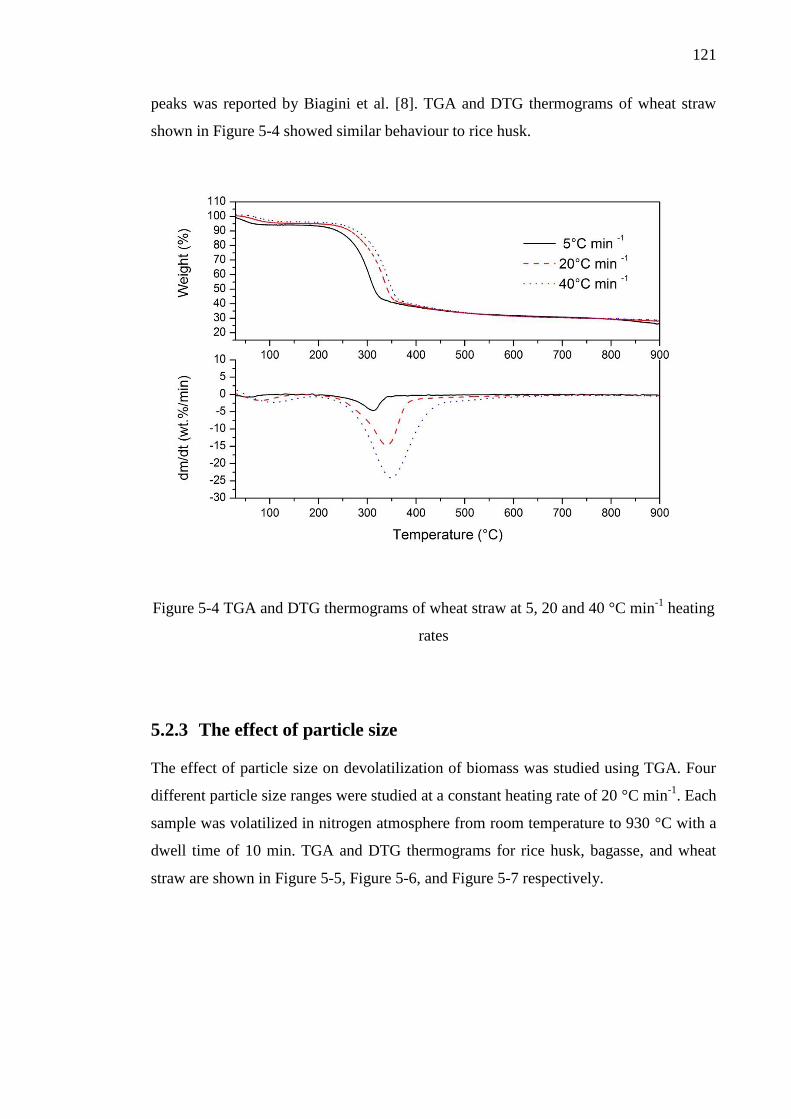
121
peaks was reported by Biagini et al. [8]. TGA and DTG thermograms of wheat straw
shown in Figure 5-4 showed similar behaviour to rice husk.
Figure 5-4 TGA and DTG thermograms of wheat straw at 5, 20 and 40 °C min-1
heating
rates
5.2.3 The effect of particle size
The effect of particle size on devolatilization of biomass was studied using TGA. Four
different particle size ranges were studied at a constant heating rate of 20 °C min-1
. Each
sample was volatilized in nitrogen atmosphere from room temperature to 930 °C with a
dwell time of 10 min. TGA and DTG thermograms for rice husk, bagasse, and wheat
straw are shown in Figure 5-5, Figure 5-6, and Figure 5-7 respectively.
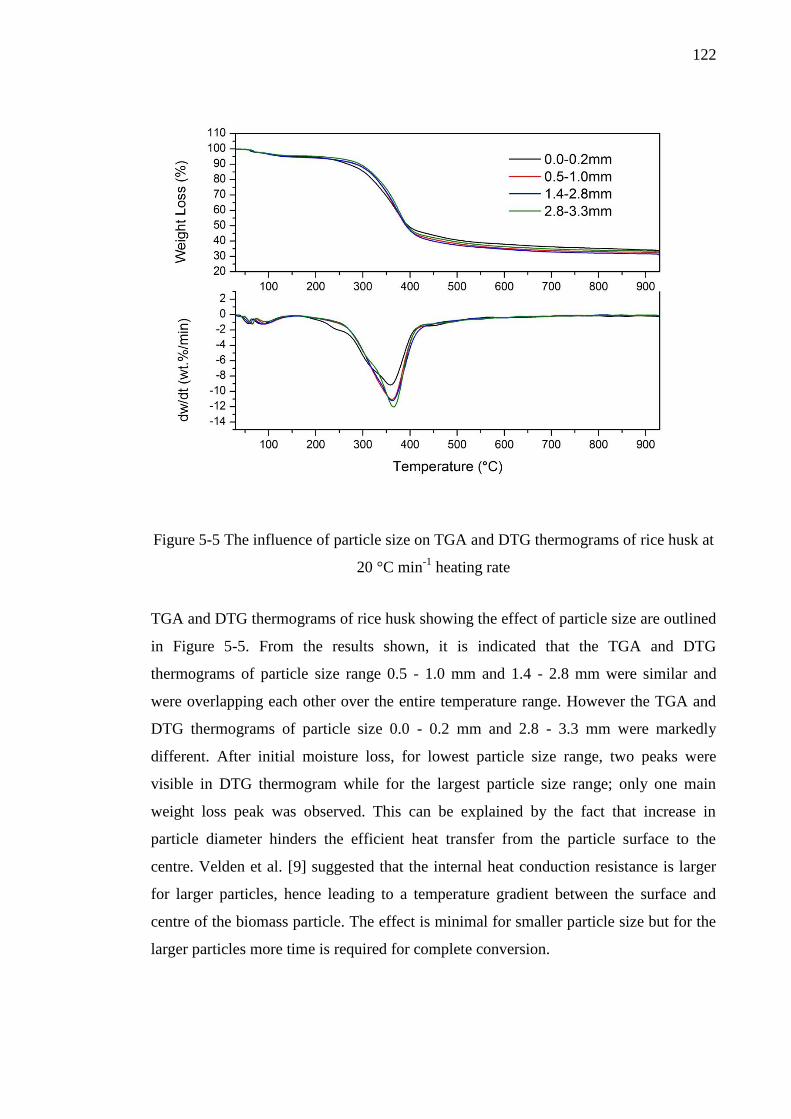
122
Figure 5-5 The influence of particle size on TGA and DTG thermograms of rice husk at
20 °C min-1
heating rate
TGA and DTG thermograms of rice husk showing the effect of particle size are outlined
in Figure 5-5. From the results shown, it is indicated that the TGA and DTG
thermograms of particle size range 0.5 - 1.0 mm and 1.4 - 2.8 mm were similar and
were overlapping each other over the entire temperature range. However the TGA and
DTG thermograms of particle size 0.0 - 0.2 mm and 2.8 - 3.3 mm were markedly
different. After initial moisture loss, for lowest particle size range, two peaks were
visible in DTG thermogram while for the largest particle size range; only one main
weight loss peak was observed. This can be explained by the fact that increase in
particle diameter hinders the efficient heat transfer from the particle surface to the
centre. Velden et al. [9] suggested that the internal heat conduction resistance is larger
for larger particles, hence leading to a temperature gradient between the surface and
centre of the biomass particle. The effect is minimal for smaller particle size but for the
larger particles more time is required for complete conversion.
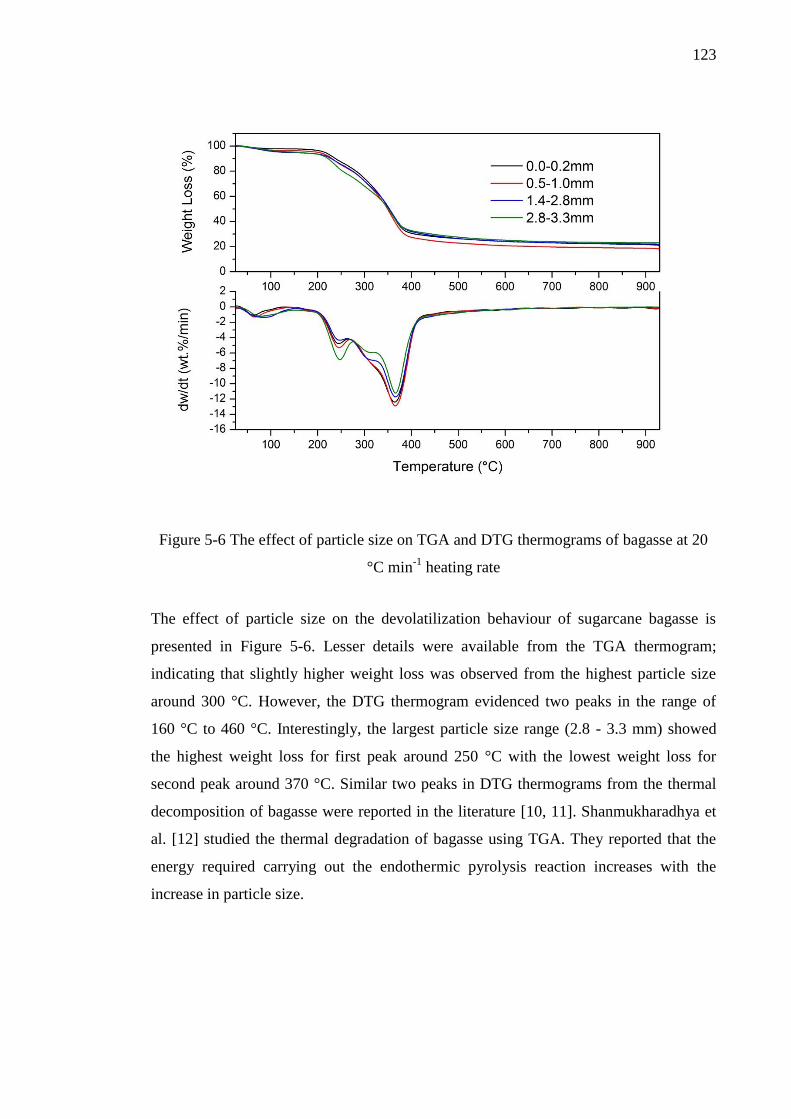
123
Figure 5-6 The effect of particle size on TGA and DTG thermograms of bagasse at 20
°C min-1
heating rate
The effect of particle size on the devolatilization behaviour of sugarcane bagasse is
presented in Figure 5-6. Lesser details were available from the TGA thermogram;
indicating that slightly higher weight loss was observed from the highest particle size
around 300 °C. However, the DTG thermogram evidenced two peaks in the range of
160 °C to 460 °C. Interestingly, the largest particle size range (2.8 - 3.3 mm) showed
the highest weight loss for first peak around 250 °C with the lowest weight loss for
second peak around 370 °C. Similar two peaks in DTG thermograms from the thermal
decomposition of bagasse were reported in the literature [10, 11]. Shanmukharadhya et
al. [12] studied the thermal degradation of bagasse using TGA. They reported that the
energy required carrying out the endothermic pyrolysis reaction increases with the
increase in particle size.
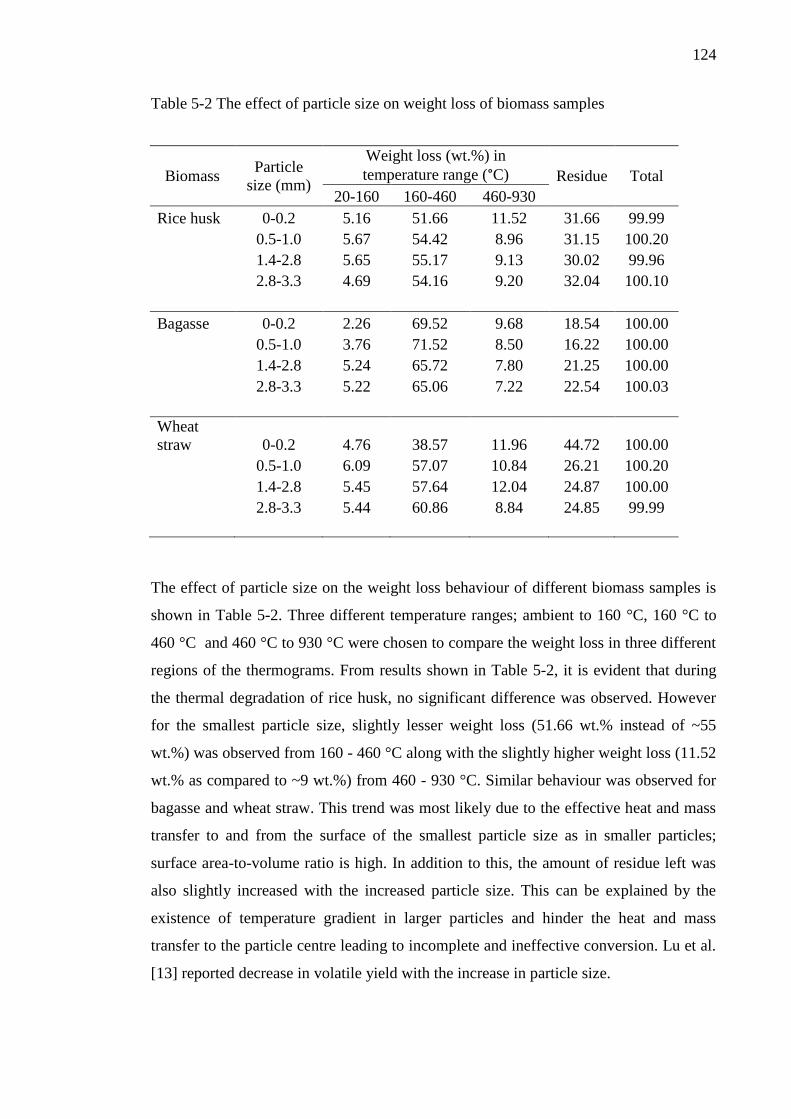
124
Table 5-2 The effect of particle size on weight loss of biomass samples
Biomass Particle
size (mm)
Weight loss (wt.%) in
temperature range (°C) Residue Total
20-160 160-460 460-930
Rice husk 0-0.2 5.16 51.66 11.52 31.66 99.99
0.5-1.0 5.67 54.42 8.96 31.15 100.20
1.4-2.8 5.65 55.17 9.13 30.02 99.96
2.8-3.3 4.69 54.16 9.20 32.04 100.10
Bagasse 0-0.2 2.26 69.52 9.68 18.54 100.00
0.5-1.0 3.76 71.52 8.50 16.22 100.00
1.4-2.8 5.24 65.72 7.80 21.25 100.00
2.8-3.3 5.22 65.06 7.22 22.54 100.03
Wheat
straw 0-0.2 4.76 38.57 11.96 44.72 100.00
0.5-1.0 6.09 57.07 10.84 26.21 100.20
1.4-2.8 5.45 57.64 12.04 24.87 100.00
2.8-3.3 5.44 60.86 8.84 24.85 99.99
The effect of particle size on the weight loss behaviour of different biomass samples is
shown in Table 5-2. Three different temperature ranges; ambient to 160 °C, 160 °C to
460 °C and 460 °C to 930 °C were chosen to compare the weight loss in three different
regions of the thermograms. From results shown in Table 5-2, it is evident that during
the thermal degradation of rice husk, no significant difference was observed. However
for the smallest particle size, slightly lesser weight loss (51.66 wt.% instead of ~55
wt.%) was observed from 160 - 460 °C along with the slightly higher weight loss (11.52
wt.% as compared to ~9 wt.%) from 460 - 930 °C. Similar behaviour was observed for
bagasse and wheat straw. This trend was most likely due to the effective heat and mass
transfer to and from the surface of the smallest particle size as in smaller particles;
surface area-to-volume ratio is high. In addition to this, the amount of residue left was
also slightly increased with the increased particle size. This can be explained by the
existence of temperature gradient in larger particles and hinder the heat and mass
transfer to the particle centre leading to incomplete and ineffective conversion. Lu et al.
[13] reported decrease in volatile yield with the increase in particle size.
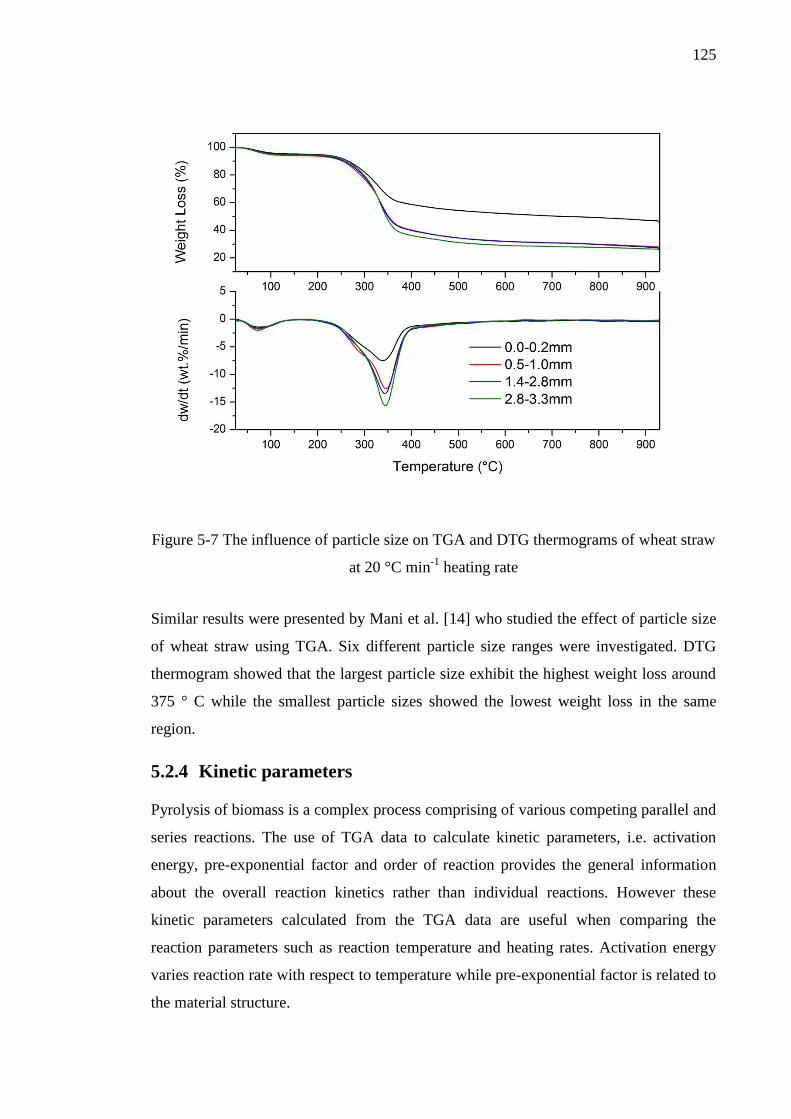
125
Figure 5-7 The influence of particle size on TGA and DTG thermograms of wheat straw
at 20 °C min-1
heating rate
Similar results were presented by Mani et al. [14] who studied the effect of particle size
of wheat straw using TGA. Six different particle size ranges were investigated. DTG
thermogram showed that the largest particle size exhibit the highest weight loss around
375 ° C while the smallest particle sizes showed the lowest weight loss in the same
region.
5.2.4 Kinetic parameters
Pyrolysis of biomass is a complex process comprising of various competing parallel and
series reactions. The use of TGA data to calculate kinetic parameters, i.e. activation
energy, pre-exponential factor and order of reaction provides the general information
about the overall reaction kinetics rather than individual reactions. However these
kinetic parameters calculated from the TGA data are useful when comparing the
reaction parameters such as reaction temperature and heating rates. Activation energy
varies reaction rate with respect to temperature while pre-exponential factor is related to
the material structure.
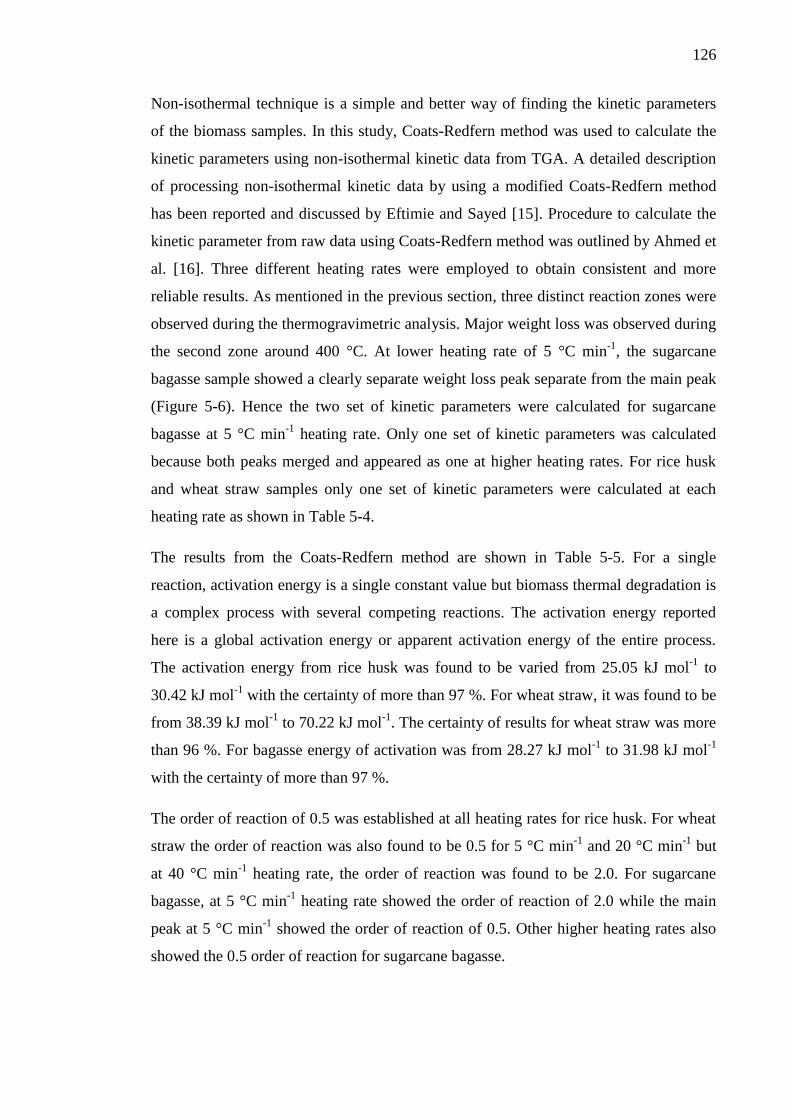
126
Non-isothermal technique is a simple and better way of finding the kinetic parameters
of the biomass samples. In this study, Coats-Redfern method was used to calculate the
kinetic parameters using non-isothermal kinetic data from TGA. A detailed description
of processing non-isothermal kinetic data by using a modified Coats-Redfern method
has been reported and discussed by Eftimie and Sayed [15]. Procedure to calculate the
kinetic parameter from raw data using Coats-Redfern method was outlined by Ahmed et
al. [16]. Three different heating rates were employed to obtain consistent and more
reliable results. As mentioned in the previous section, three distinct reaction zones were
observed during the thermogravimetric analysis. Major weight loss was observed during
the second zone around 400 °C. At lower heating rate of 5 °C min-1
, the sugarcane
bagasse sample showed a clearly separate weight loss peak separate from the main peak
(Figure 5-6). Hence the two set of kinetic parameters were calculated for sugarcane
bagasse at 5 °C min-1
heating rate. Only one set of kinetic parameters was calculated
because both peaks merged and appeared as one at higher heating rates. For rice husk
and wheat straw samples only one set of kinetic parameters were calculated at each
heating rate as shown in Table 5-4.
The results from the Coats-Redfern method are shown in Table 5-5. For a single
reaction, activation energy is a single constant value but biomass thermal degradation is
a complex process with several competing reactions. The activation energy reported
here is a global activation energy or apparent activation energy of the entire process.
The activation energy from rice husk was found to be varied from 25.05 kJ mol-1
to
30.42 kJ mol-1
with the certainty of more than 97 %. For wheat straw, it was found to be
from 38.39 kJ mol-1
to 70.22 kJ mol-1
. The certainty of results for wheat straw was more
than 96 %. For bagasse energy of activation was from 28.27 kJ mol-1
to 31.98 kJ mol-1
with the certainty of more than 97 %.
The order of reaction of 0.5 was established at all heating rates for rice husk. For wheat
straw the order of reaction was also found to be 0.5 for 5 °C min-1
and 20 °C min-1
but
at 40 °C min-1
heating rate, the order of reaction was found to be 2.0. For sugarcane
bagasse, at 5 °C min-1
heating rate showed the order of reaction of 2.0 while the main
peak at 5 °C min-1
showed the order of reaction of 0.5. Other higher heating rates also
showed the 0.5 order of reaction for sugarcane bagasse.
127
The value of pre-exponential factor was found to be varied from 12.77 - 111.08 min-1
,
117.92 - 1.17x10⁶ min
-1 and 21.45 - 5.92x10
4 min
-1 for rice husk, wheat straw and
sugarcane bagasse respectively.
5.2.5 Comparison of activation energy from literature
Numerous studies [7, 10, 17-22] have attempted to explain the kinetic parameter from
TGA data but there is a wide variation in kinetic parameters values. As shown in Table
5-3, these variations are mainly due to the type of method applied to calculate the
kinetic parameters, heating rate, type of biomass and whether the experiment was
carried out in an inert atmosphere or in oxygen atmosphere.
Table 5-3 Comparison of kinetic parameters with literature
Feedstock Ea (kJ mol-1
) ref
During
Pyrolysis
During
Combustion
Rice Husk 25.05 - 30.42 - This study
Wheat Straw 38.39 - 70.22 - -do-
Bagasse 28.27 - 31.98 - -do-
Rice husk - 142.7- 188.5 [20]
Corn straw 76.30 [9]
Cotton stalk - 50.10 [23]
Pakistani coal - 89.83 -do-
Olive husk - 83.20 [24]
Grape residue - 71.42 -do-
Pine wood - 100.40 -do-
Thai lignite - 89.12 [25]
Corn stalk skin 126 - [26]
Corn stalk core 101 - -do-
Wheat straw 70.51 - [27]
Wood chips 85.39 - -do-
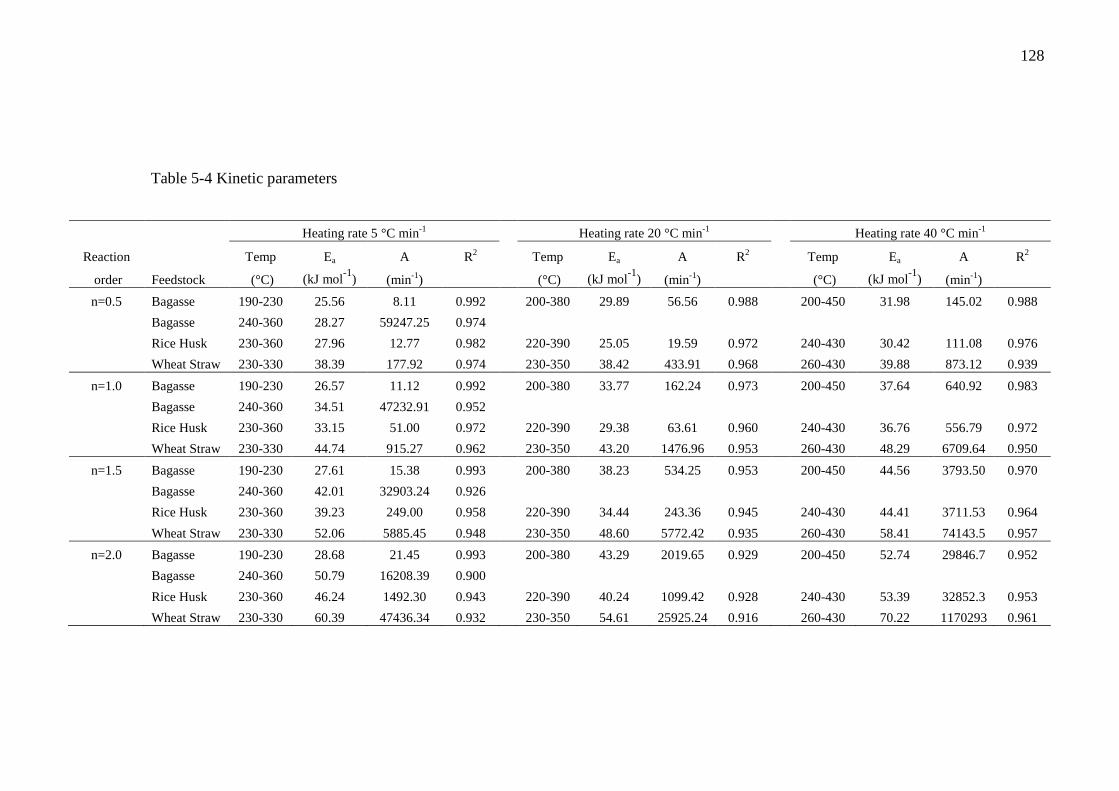
128
Table 5-4 Kinetic parameters
Heating rate 5 °C min-1
Heating rate 20 °C min-1
Heating rate 40 °C min-1
Reaction Temp Ea A R2 Temp Ea A R
2 Temp Ea A R
2
order Feedstock (°C) (kJ mol-1
) (min-1
) (°C) (kJ mol-1
) (min-1
) (°C) (kJ mol-1
) (min-1
)
n=0.5 Bagasse 190-230 25.56 8.11 0.992 200-380 29.89 56.56 0.988 200-450 31.98 145.02 0.988
Bagasse 240-360 28.27 59247.25 0.974
Rice Husk 230-360 27.96 12.77 0.982 220-390 25.05 19.59 0.972 240-430 30.42 111.08 0.976
Wheat Straw 230-330 38.39 177.92 0.974 230-350 38.42 433.91 0.968 260-430 39.88 873.12 0.939
n=1.0 Bagasse 190-230 26.57 11.12 0.992 200-380 33.77 162.24 0.973 200-450 37.64 640.92 0.983
Bagasse 240-360 34.51 47232.91 0.952
Rice Husk 230-360 33.15 51.00 0.972 220-390 29.38 63.61 0.960 240-430 36.76 556.79 0.972
Wheat Straw 230-330 44.74 915.27 0.962 230-350 43.20 1476.96 0.953 260-430 48.29 6709.64 0.950
n=1.5 Bagasse 190-230 27.61 15.38 0.993 200-380 38.23 534.25 0.953 200-450 44.56 3793.50 0.970
Bagasse 240-360 42.01 32903.24 0.926
Rice Husk 230-360 39.23 249.00 0.958 220-390 34.44 243.36 0.945 240-430 44.41 3711.53 0.964
Wheat Straw 230-330 52.06 5885.45 0.948 230-350 48.60 5772.42 0.935 260-430 58.41 74143.5 0.957
n=2.0 Bagasse 190-230 28.68 21.45 0.993 200-380 43.29 2019.65 0.929 200-450 52.74 29846.7 0.952
Bagasse 240-360 50.79 16208.39 0.900
Rice Husk 230-360 46.24 1492.30 0.943 220-390 40.24 1099.42 0.928 240-430 53.39 32852.3 0.953
Wheat Straw 230-330 60.39 47436.34 0.932 230-350 54.61 25925.24 0.916 260-430 70.22 1170293 0.961
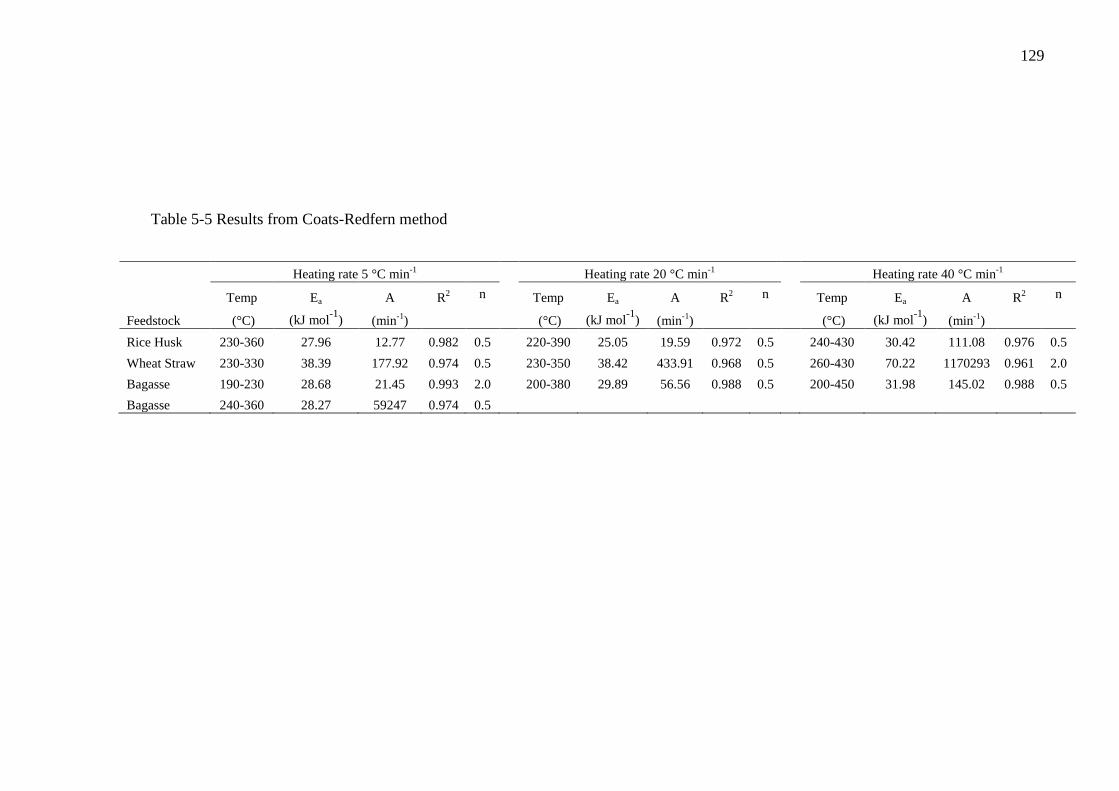
129
Table 5-5 Results from Coats-Redfern method
Heating rate 5 °C min-1
Heating rate 20 °C min-1
Heating rate 40 °C min-1
Temp Ea A R2 n Temp Ea A R
2 n Temp Ea A R
2 n
Feedstock (°C) (kJ mol-1
) (min-1
) (°C) (kJ mol-1
) (min-1
) (°C) (kJ mol-1
) (min-1
)
Rice Husk 230-360 27.96 12.77 0.982 0.5 220-390 25.05 19.59 0.972 0.5 240-430 30.42 111.08 0.976 0.5
Wheat Straw 230-330 38.39 177.92 0.974 0.5 230-350 38.42 433.91 0.968 0.5 260-430 70.22 1170293 0.961 2.0
Bagasse 190-230 28.68 21.45 0.993 2.0 200-380 29.89 56.56 0.988 0.5 200-450 31.98 145.02 0.988 0.5
Bagasse 240-360 28.27 59247 0.974 0.5
130
5.2.6 Conclusions for section 5.2
In this section, thermal degradation behaviour of three different biomass samples; rice
husk, sugarcane bagasse and wheat straw was investigated using thermogravimetric
analysis. The aim of this study was to investigate the effect of heating rate and particle
size on the devolatilization characteristics of the above mentioned biomass samples. In
addition, kinetic parameters were also calculated using Coats-Redfern method. The
following conclusions can be made from this study.
The effect of heating rate was investigated on all three biomass samples. It was
indicated that the increase in heating rates caused the lateral shift in the TGA
thermograms. It is suggested that this behaviour was due to short reaction time at
higher heating rates; therefore higher temperature was required for the evolution of
volatiles from biomass samples.
Four different ranges of particles sizes were pyrolysed in TGA under identical
conditions. It was found that the increase in particle size resulted in an increase in
residual char yield. This was most likely due to the existence of temperature
gradient in larger particles which hinders the heat and mass transfer to the particle
centre leading to incomplete and ineffective conversion.
Kinetic parameters i.e. activation energy, pre-exponential factor and order of
reaction were calculated using Coats-Redfern method. For rice husk, the order of
reaction was found to be 0.5 for all heating rates. For wheat straw it was 0.5 for 5
°C min-1
and 20 °C min-1
but for 40 °C min-1
heating rate, order of reaction was
changed to 2.0. For bagasse the first peak exhibited 2nd
order while 0.5 order of
reaction was calculated for second peak. In addition to that, activation energy
results were compared with the various other biomasses in the literature and
showed that the results presented in this study were comparable with the existing
literature.
131
5.3 Hydrogen production from ultra-high temperature
pyrolysis, steam gasification and catalytic steam gasification
of rice husk, sugarcane bagasse and wheat straw
In this section, hydrogen production from pyrolysis, steam gasification and catalytic
steam gasification of sugarcane bagasse, wheat straw and rice husk were investigated
using a two stage pyrolysis-gasification system. Biomass samples were pyrolysed in the
first stage, and the volatiles and liquids were gasified in the second stage. Unreacted
steam and condensable liquids were collected in condenser system. A hydrogen-rich gas
produced was collected in a gas sample bag and analysed offline using gas
chromatography. Detailed explanation and procedure along with a schematic diagram of
two stage pyrolysis-gasification system is given in chapter 3.
For pyrolysis experiments, both stages were heated simultaneously up to a final
temperature of 950 °C while for steam gasification, the second stage was heated first up
to 950 °C and then the biomass sample was pyrolysed in the first stage up to a final
temperature of 950 °C. Volatiles and oils produced from pyrolysis were gasified in the
second stage in the presence of steam. A silica sand bed was used in the second stage
during steam gasification. Heating rate for both stages was kept constant at 20 °C min-1
.
Water injection rate was 6 ml hr-1
during gasification experiments. Nitrogen was used as
a carrier gas at a flow rate of 100 ml min-1
. Dolomite and 10 wt.% Ni-dolomite were
used during the catalytic steam gasification of biomass samples. Two grams of catalyst
was placed in the second stage and heated up to 950 °C. Volatiles released from
pyrolysis of biomass in the first stage reacts with the catalyst in the second stage, in the
presence of steam producing more hydrogen.
Characterization results from different analytical techniques such as scanning electron
microscopy (SEM), transmission electron microscopy (TEM) coupled with energy
dispersive X-ray spectroscopy (EDX), and X-ray diffraction (XRD) of freshly prepared
catalyst are presented in section 5.3.1. Pyrolysis and steam gasification results are
discussed in section 5.3.2 and 5.3.3 respectively. Influence of dolomite and 10 wt.%
Ni-dolomite on catalytic steam gasification of rice husk, sugarcane bagasse and wheat
straw are outlined in section 5.3.4 and 5.3.5. Results from characterization of reacted
catalyst are discussed in section 5.3.6.
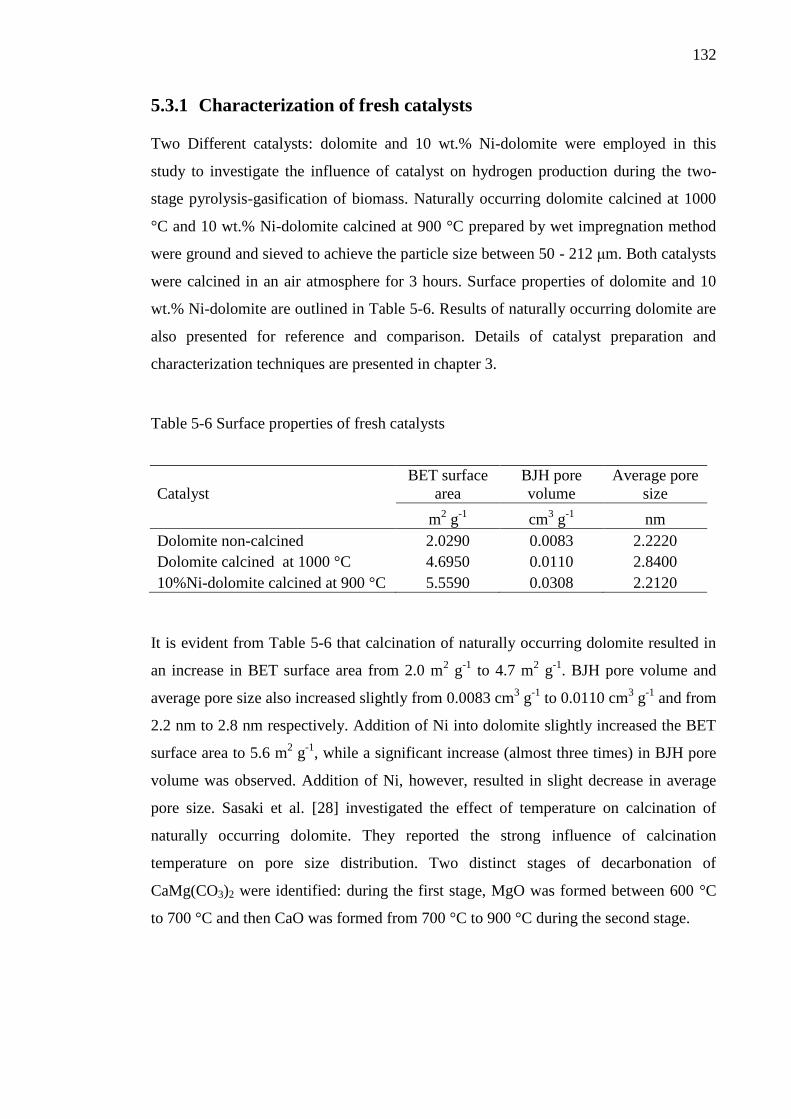
132
5.3.1 Characterization of fresh catalysts
Two Different catalysts: dolomite and 10 wt.% Ni-dolomite were employed in this
study to investigate the influence of catalyst on hydrogen production during the two-
stage pyrolysis-gasification of biomass. Naturally occurring dolomite calcined at 1000
°C and 10 wt.% Ni-dolomite calcined at 900 °C prepared by wet impregnation method
were ground and sieved to achieve the particle size between 50 - 212 μm. Both catalysts
were calcined in an air atmosphere for 3 hours. Surface properties of dolomite and 10
wt.% Ni-dolomite are outlined in Table 5-6. Results of naturally occurring dolomite are
also presented for reference and comparison. Details of catalyst preparation and
characterization techniques are presented in chapter 3.
Table 5-6 Surface properties of fresh catalysts
Catalyst
BET surface
area
BJH pore
volume
Average pore
size
m2 g
-1 cm
3 g
-1 nm
Dolomite non-calcined 2.0290 0.0083 2.2220
Dolomite calcined at 1000 °C 4.6950 0.0110 2.8400
10%Ni-dolomite calcined at 900 °C 5.5590 0.0308 2.2120
It is evident from Table 5-6 that calcination of naturally occurring dolomite resulted in
an increase in BET surface area from 2.0 m2 g
-1 to 4.7 m
2 g
-1. BJH pore volume and
average pore size also increased slightly from 0.0083 cm3 g
-1 to 0.0110 cm
3 g
-1 and from
2.2 nm to 2.8 nm respectively. Addition of Ni into dolomite slightly increased the BET
surface area to 5.6 m2 g
-1, while a significant increase (almost three times) in BJH pore
volume was observed. Addition of Ni, however, resulted in slight decrease in average
pore size. Sasaki et al. [28] investigated the effect of temperature on calcination of
naturally occurring dolomite. They reported the strong influence of calcination
temperature on pore size distribution. Two distinct stages of decarbonation of
CaMg(CO3)2 were identified: during the first stage, MgO was formed between 600 °C
to 700 °C and then CaO was formed from 700 °C to 900 °C during the second stage.
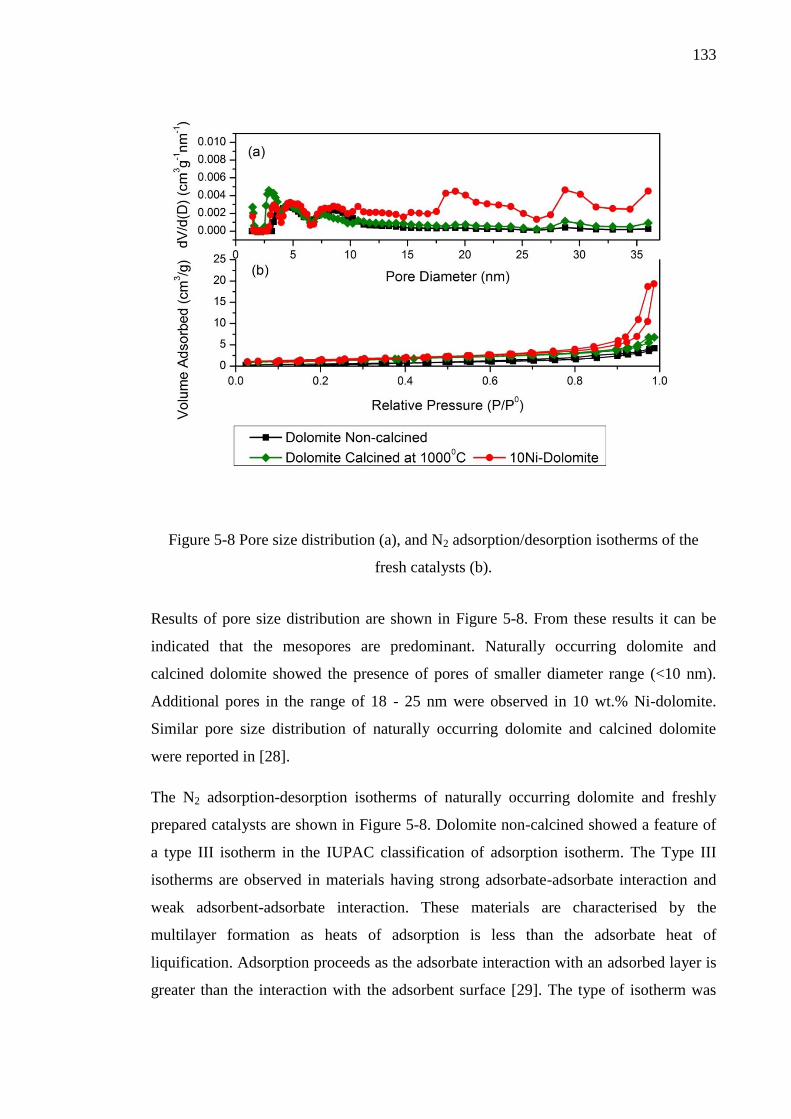
133
Figure 5-8 Pore size distribution (a), and N2 adsorption/desorption isotherms of the
fresh catalysts (b).
Results of pore size distribution are shown in Figure 5-8. From these results it can be
indicated that the mesopores are predominant. Naturally occurring dolomite and
calcined dolomite showed the presence of pores of smaller diameter range (<10 nm).
Additional pores in the range of 18 - 25 nm were observed in 10 wt.% Ni-dolomite.
Similar pore size distribution of naturally occurring dolomite and calcined dolomite
were reported in [28].
The N2 adsorption-desorption isotherms of naturally occurring dolomite and freshly
prepared catalysts are shown in Figure 5-8. Dolomite non-calcined showed a feature of
a type III isotherm in the IUPAC classification of adsorption isotherm. The Type III
isotherms are observed in materials having strong adsorbate-adsorbate interaction and
weak adsorbent-adsorbate interaction. These materials are characterised by the
multilayer formation as heats of adsorption is less than the adsorbate heat of
liquification. Adsorption proceeds as the adsorbate interaction with an adsorbed layer is
greater than the interaction with the adsorbent surface [29]. The type of isotherm was
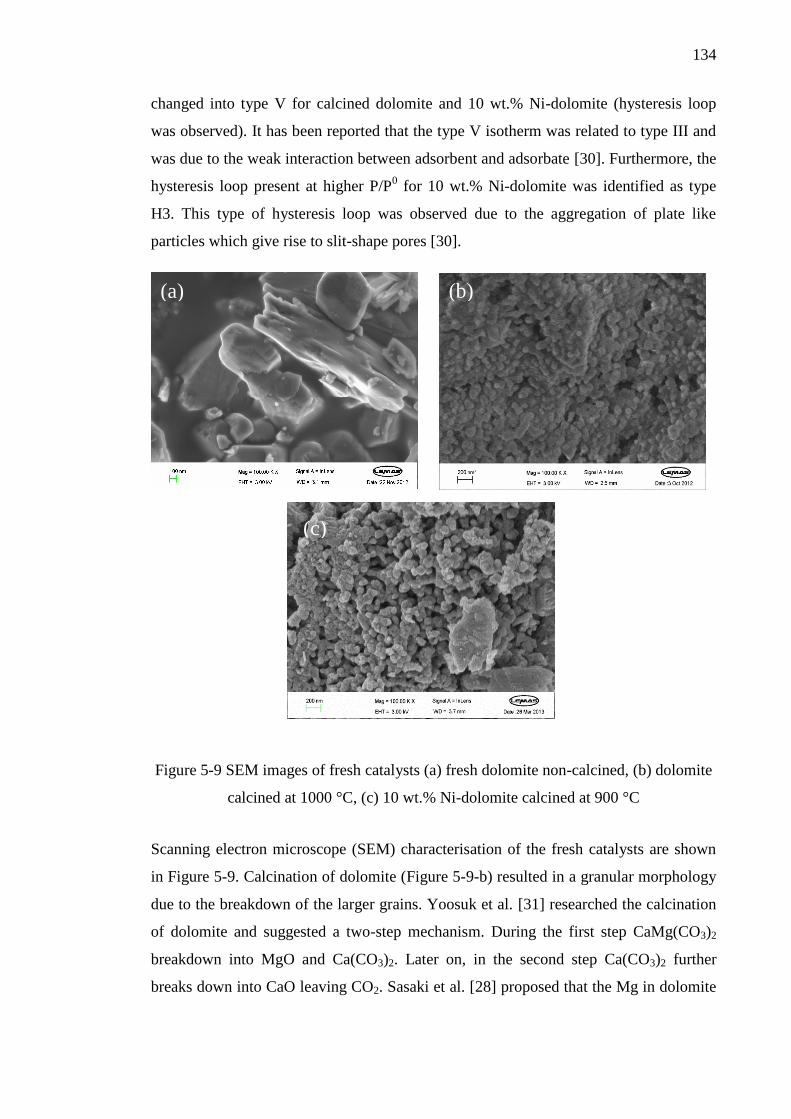
134
changed into type V for calcined dolomite and 10 wt.% Ni-dolomite (hysteresis loop
was observed). It has been reported that the type V isotherm was related to type III and
was due to the weak interaction between adsorbent and adsorbate [30]. Furthermore, the
hysteresis loop present at higher P/P0 for 10 wt.% Ni-dolomite was identified as type
H3. This type of hysteresis loop was observed due to the aggregation of plate like
particles which give rise to slit-shape pores [30].
Figure 5-9 SEM images of fresh catalysts (a) fresh dolomite non-calcined, (b) dolomite
calcined at 1000 °C, (c) 10 wt.% Ni-dolomite calcined at 900 °C
Scanning electron microscope (SEM) characterisation of the fresh catalysts are shown
in Figure 5-9. Calcination of dolomite (Figure 5-9-b) resulted in a granular morphology
due to the breakdown of the larger grains. Yoosuk et al. [31] researched the calcination
of dolomite and suggested a two-step mechanism. During the first step CaMg(CO3)2
breakdown into MgO and Ca(CO3)2. Later on, in the second step Ca(CO3)2 further
breaks down into CaO leaving CO2. Sasaki et al. [28] proposed that the Mg in dolomite
(a) (b)
(c)
135
moves to the surface, showing external growth and CaCO3 showed inward growth.
SEM of the 10 wt.% Ni-dolomite shown in Figure 5-9-c indicate the presence of
granular hexagonal plate-like morphology.
Figure 5-10 TEM-EDX of fresh 10 wt.% Ni-dolomite catalysts calcined at 900 °C
TEM-EDX results of the freshly prepared 10 wt.% Ni-dolomite catalyst are shown in
Figure 5-10. Characteristic plate-shape morphology of dolomite was visible in the TEM
image. Similar morphology was observed by Sasaki et al. [28]. During EDX analysis,
Ni was also present along with the Ca and Mg in the sample.
The X-ray diffraction analysis of naturally occurring raw dolomite, calcined dolomite
and 10 wt.% Ni-dolomite are presented in Figure 5-11. From these results shown in
Figure 5-11(a), it can be inferred that the raw dolomite primarily consists of
MgCa(CO3)2 however the presence of CaCO3 was also reported [28]. Calcination of
dolomite resulted in complete breakdown of MgCa(CO3)2 into CaO and MgO as shown
in Figure 5-11(b) [32]. Addition of Ni into the dolomite resulted in the formation of
NiO, NiMgO2 along with CaO and MgO (shown in Figure 5-11(c)). Srinakruang et al.
[33] investigated the effect of calcination temperature and Ni-loading on the tar
gasification of Ni-dolomite catalyst. It was reported that the NiO phase was only present
at a calcination temperature of 500 °C. At higher temperature a more stable form of
NiMgO2 was observed. In another study [34], it was suggested that there was a strong
interaction between Ni species and dolomite, which resulted in fine dispersion of Ni
particles on the dolomite surface.
(b)
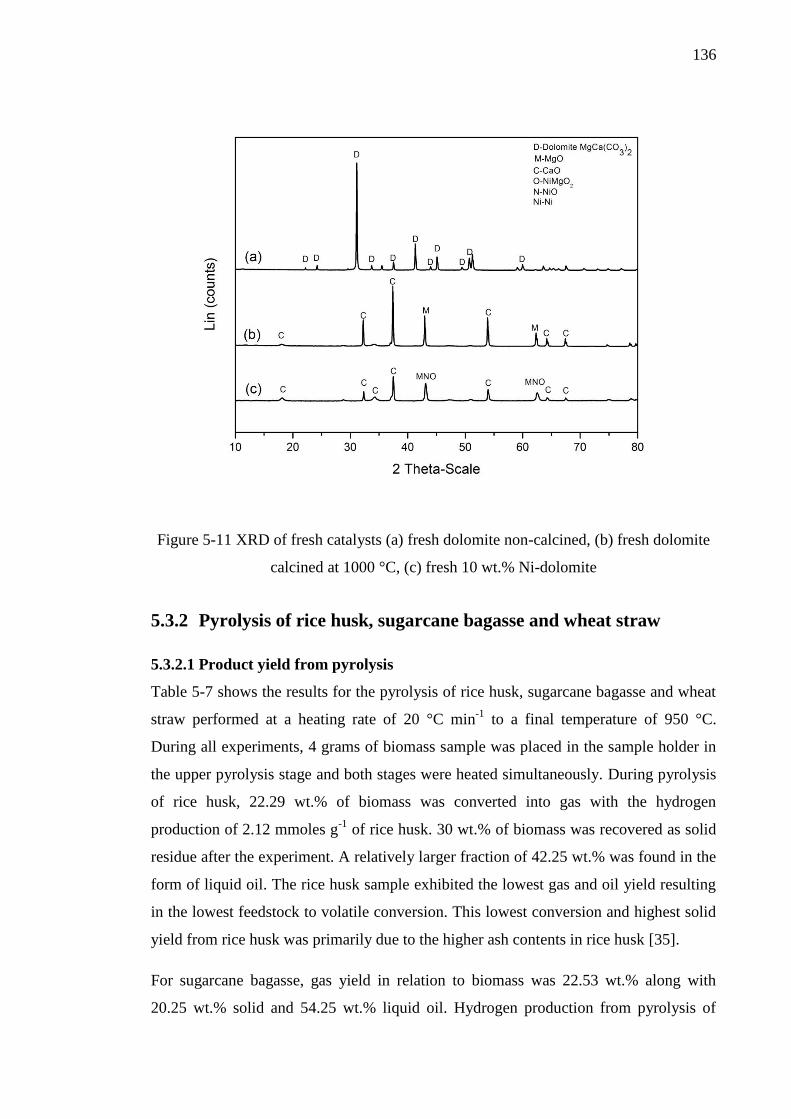
136
Figure 5-11 XRD of fresh catalysts (a) fresh dolomite non-calcined, (b) fresh dolomite
calcined at 1000 °C, (c) fresh 10 wt.% Ni-dolomite
5.3.2 Pyrolysis of rice husk, sugarcane bagasse and wheat straw
5.3.2.1 Product yield from pyrolysis
Table 5-7 shows the results for the pyrolysis of rice husk, sugarcane bagasse and wheat
straw performed at a heating rate of 20 °C min-1
to a final temperature of 950 °C.
During all experiments, 4 grams of biomass sample was placed in the sample holder in
the upper pyrolysis stage and both stages were heated simultaneously. During pyrolysis
of rice husk, 22.29 wt.% of biomass was converted into gas with the hydrogen
production of 2.12 mmoles g-1
of rice husk. 30 wt.% of biomass was recovered as solid
residue after the experiment. A relatively larger fraction of 42.25 wt.% was found in the
form of liquid oil. The rice husk sample exhibited the lowest gas and oil yield resulting
in the lowest feedstock to volatile conversion. This lowest conversion and highest solid
yield from rice husk was primarily due to the higher ash contents in rice husk [35].
For sugarcane bagasse, gas yield in relation to biomass was 22.53 wt.% along with
20.25 wt.% solid and 54.25 wt.% liquid oil. Hydrogen production from pyrolysis of
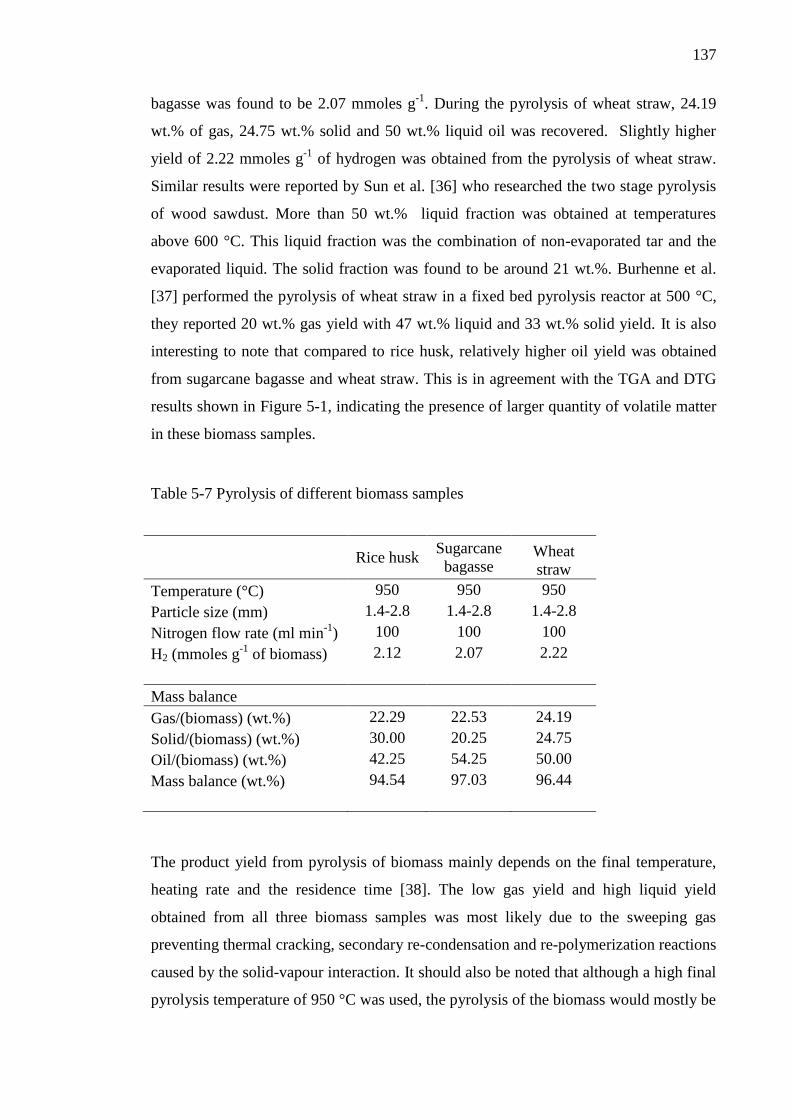
137
bagasse was found to be 2.07 mmoles g-1
. During the pyrolysis of wheat straw, 24.19
wt.% of gas, 24.75 wt.% solid and 50 wt.% liquid oil was recovered. Slightly higher
yield of 2.22 mmoles g-1
of hydrogen was obtained from the pyrolysis of wheat straw.
Similar results were reported by Sun et al. [36] who researched the two stage pyrolysis
of wood sawdust. More than 50 wt.% liquid fraction was obtained at temperatures
above 600 °C. This liquid fraction was the combination of non-evaporated tar and the
evaporated liquid. The solid fraction was found to be around 21 wt.%. Burhenne et al.
[37] performed the pyrolysis of wheat straw in a fixed bed pyrolysis reactor at 500 °C,
they reported 20 wt.% gas yield with 47 wt.% liquid and 33 wt.% solid yield. It is also
interesting to note that compared to rice husk, relatively higher oil yield was obtained
from sugarcane bagasse and wheat straw. This is in agreement with the TGA and DTG
results shown in Figure 5-1, indicating the presence of larger quantity of volatile matter
in these biomass samples.
Table 5-7 Pyrolysis of different biomass samples
Rice husk
Sugarcane
bagasse Wheat
straw
Temperature (°C) 950 950 950
Particle size (mm) 1.4-2.8 1.4-2.8 1.4-2.8
Nitrogen flow rate (ml min-1
) 100 100 100
H2 (mmoles g-1
of biomass) 2.12 2.07 2.22
Mass balance
Gas/(biomass) (wt.%) 22.29 22.53 24.19
Solid/(biomass) (wt.%) 30.00 20.25 24.75
Oil/(biomass) (wt.%) 42.25 54.25 50.00
Mass balance (wt.%) 94.54 97.03 96.44
The product yield from pyrolysis of biomass mainly depends on the final temperature,
heating rate and the residence time [38]. The low gas yield and high liquid yield
obtained from all three biomass samples was most likely due to the sweeping gas
preventing thermal cracking, secondary re-condensation and re-polymerization reactions
caused by the solid-vapour interaction. It should also be noted that although a high final
pyrolysis temperature of 950 °C was used, the pyrolysis of the biomass would mostly be
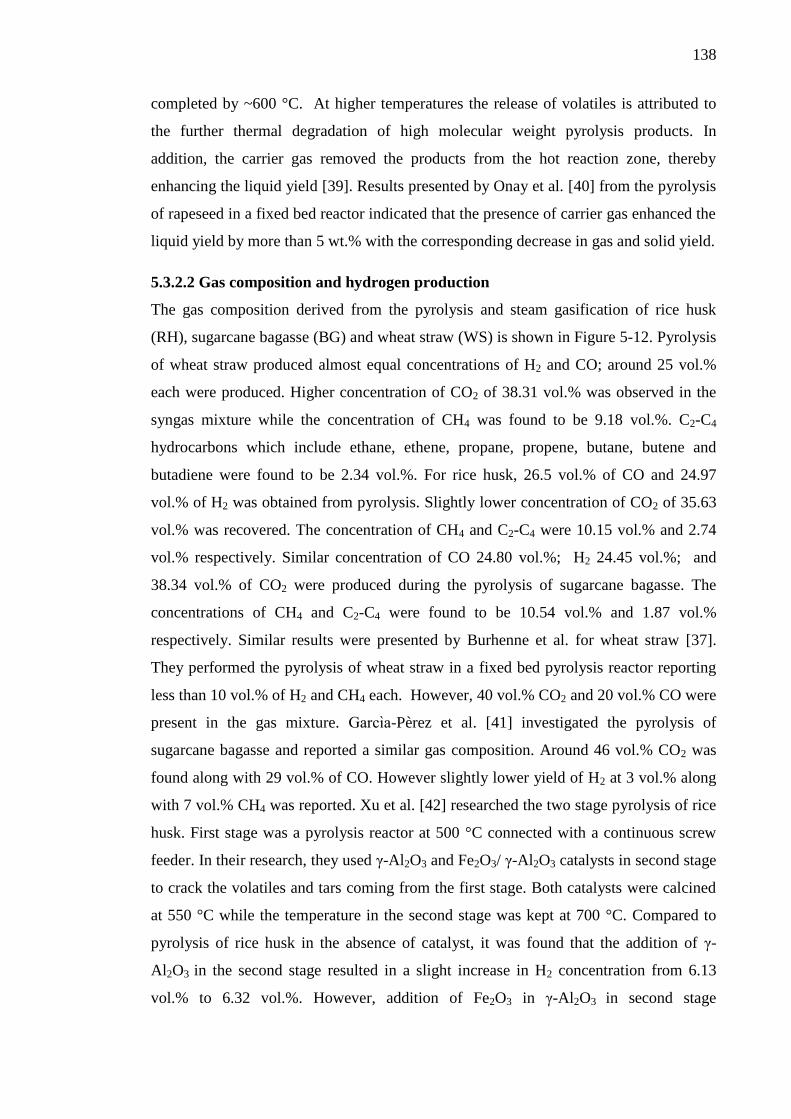
138
completed by ~600 °C. At higher temperatures the release of volatiles is attributed to
the further thermal degradation of high molecular weight pyrolysis products. In
addition, the carrier gas removed the products from the hot reaction zone, thereby
enhancing the liquid yield [39]. Results presented by Onay et al. [40] from the pyrolysis
of rapeseed in a fixed bed reactor indicated that the presence of carrier gas enhanced the
liquid yield by more than 5 wt.% with the corresponding decrease in gas and solid yield.
5.3.2.2 Gas composition and hydrogen production
The gas composition derived from the pyrolysis and steam gasification of rice husk
(RH), sugarcane bagasse (BG) and wheat straw (WS) is shown in Figure 5-12. Pyrolysis
of wheat straw produced almost equal concentrations of H2 and CO; around 25 vol.%
each were produced. Higher concentration of CO2 of 38.31 vol.% was observed in the
syngas mixture while the concentration of CH4 was found to be 9.18 vol.%. C2-C4
hydrocarbons which include ethane, ethene, propane, propene, butane, butene and
butadiene were found to be 2.34 vol.%. For rice husk, 26.5 vol.% of CO and 24.97
vol.% of H2 was obtained from pyrolysis. Slightly lower concentration of CO2 of 35.63
vol.% was recovered. The concentration of CH4 and C2-C4 were 10.15 vol.% and 2.74
vol.% respectively. Similar concentration of CO 24.80 vol.%; H2 24.45 vol.%; and
38.34 vol.% of CO2 were produced during the pyrolysis of sugarcane bagasse. The
concentrations of CH4 and C2-C4 were found to be 10.54 vol.% and 1.87 vol.%
respectively. Similar results were presented by Burhenne et al. for wheat straw [37].
They performed the pyrolysis of wheat straw in a fixed bed pyrolysis reactor reporting
less than 10 vol.% of H2 and CH4 each. However, 40 vol.% CO2 and 20 vol.% CO were
present in the gas mixture. arc a-Pèrez et al. [41] investigated the pyrolysis of
sugarcane bagasse and reported a similar gas composition. Around 46 vol.% CO2 was
found along with 29 vol.% of CO. However slightly lower yield of H2 at 3 vol.% along
with 7 vol.% CH4 was reported. Xu et al. [42] researched the two stage pyrolysis of rice
husk. First stage was a pyrolysis reactor at 500 °C connected with a continuous screw
feeder. In their research, they used γ-Al2O3 and Fe2O3/ γ-Al2O3 catalysts in second stage
to crack the volatiles and tars coming from the first stage. Both catalysts were calcined
at 550 °C while the temperature in the second stage was kept at 700 °C. Compared to
pyrolysis of rice husk in the absence of catalyst, it was found that the addition of γ-
Al2O3 in the second stage resulted in a slight increase in H2 concentration from 6.13
vol.% to 6.32 vol.%. However, addition of Fe2O3 in γ-Al2O3 in second stage
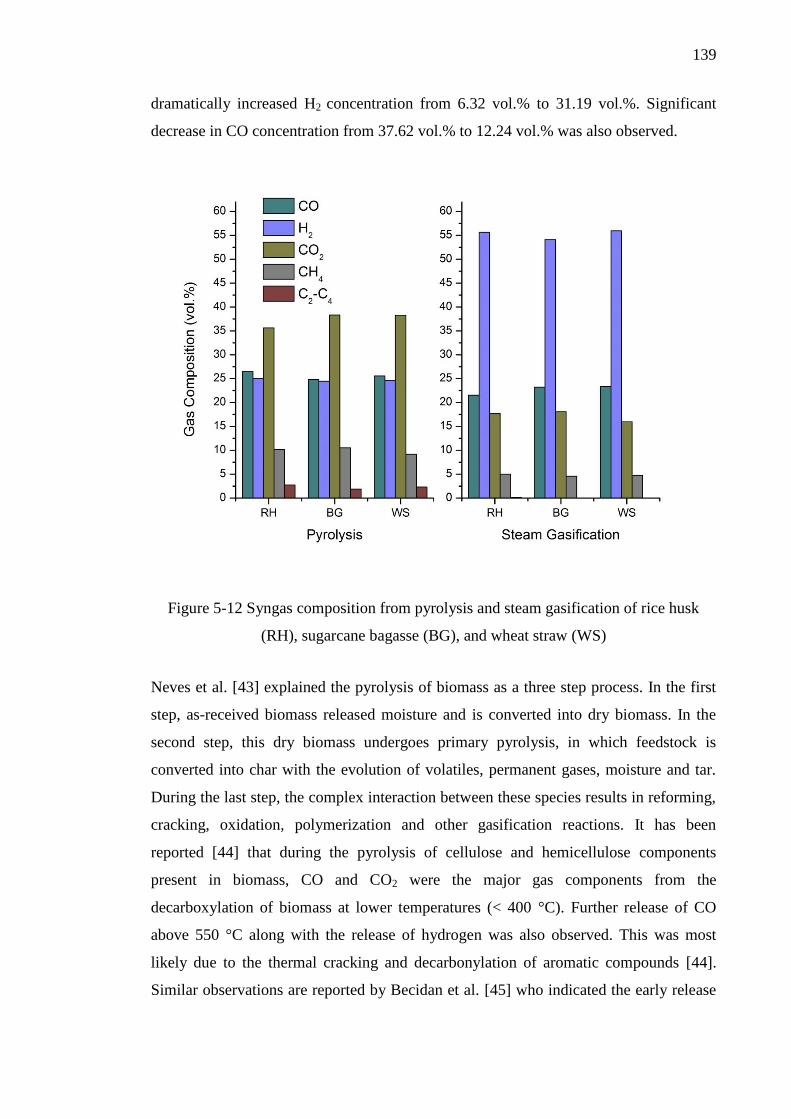
139
dramatically increased H2 concentration from 6.32 vol.% to 31.19 vol.%. Significant
decrease in CO concentration from 37.62 vol.% to 12.24 vol.% was also observed.
Figure 5-12 Syngas composition from pyrolysis and steam gasification of rice husk
(RH), sugarcane bagasse (BG), and wheat straw (WS)
Neves et al. [43] explained the pyrolysis of biomass as a three step process. In the first
step, as-received biomass released moisture and is converted into dry biomass. In the
second step, this dry biomass undergoes primary pyrolysis, in which feedstock is
converted into char with the evolution of volatiles, permanent gases, moisture and tar.
During the last step, the complex interaction between these species results in reforming,
cracking, oxidation, polymerization and other gasification reactions. It has been
reported [44] that during the pyrolysis of cellulose and hemicellulose components
present in biomass, CO and CO2 were the major gas components from the
decarboxylation of biomass at lower temperatures (< 400 °C). Further release of CO
above 550 °C along with the release of hydrogen was also observed. This was most
likely due to the thermal cracking and decarbonylation of aromatic compounds [44].
Similar observations are reported by Becidan et al. [45] who indicated the early release
140
of CO and CO2 from biomass and later release of hydrogen at relatively higher
temperature. Cellulose is the main component of biomass and it is found in large
proportions in biomass materials. Various researchers [46-51] have studied the
mechanism for the pyrolysis of cellulose. empirical models, such as presented by Kilzer
and Broido et al. [52] suggested that the lignocellulosic materials follow one of two
available pathways. At higher temperature, tar formation is favoured by the low
activation energy of the reaction while at low temperatures, cellulose in the biomass
sample converts into dehydro-cellulose which is converted into char and syngas. Shin et
al. [51] studied the kinetics of levoglucosan using molecular beam mass spectrometry
(MBMS). According to their model, three types of compounds; primary, secondary and
tertiary compounds were present during pyrolysis. With the increase in temperature, the
concentration of primary compound (levoglucosan) decreased while the concentration
of secondary compounds (methanol, acetaldehyde, acrolein and furans) increased to a
certain temperature and decreased with the further increase in temperature. The
concentration of tertiary compounds (carbon monoxide, permanent gases and other
lighter hydrocarbons) was increased with the increase in temperature up to a higher
temperature of 700 °C.
Diebold et el. [47] developed a model for the pyrolysis of cellulose using seven
different pyrolysis reaction rate equations. The product composition of pyrolysis of
cellulose was predicted as a function of time, temperature and heating rate. It was
reported that the low heating rates coupled with the low final temperature produced
more char while high heating rate coupled with higher final temperature produced
higher gas yield. They suggested that the pyrolysis of cellulose initially produced char
and active cellulose. This active cellulose gets converted into char, water, gases and
condensable vapours.
Banyasz et al. [48] investigated the real time evolution of different species from the
pyrolysis of cellulose using fast evolved gas-FTIR apparatus. The evolution of
formaldehyde, hydroxyacetaldehyde, CO, and CO2, was studied in details. They
reported that the cellulose initially pyrolysed into anhydrocellulose (which lead to char
formation) and lower degree of polymerised active cellulose which further converted
into tar, CO2 and char or produce different intermediates. These intermediates converted
into hydroxyacetaldehyde or formaldehyde and CO.
Lin et al. [49] investigated the pyrolysis of cellulose using pyroprobe reactor and TGA-
MS. It was reported that the first step was the depolymerization of cellulose to form
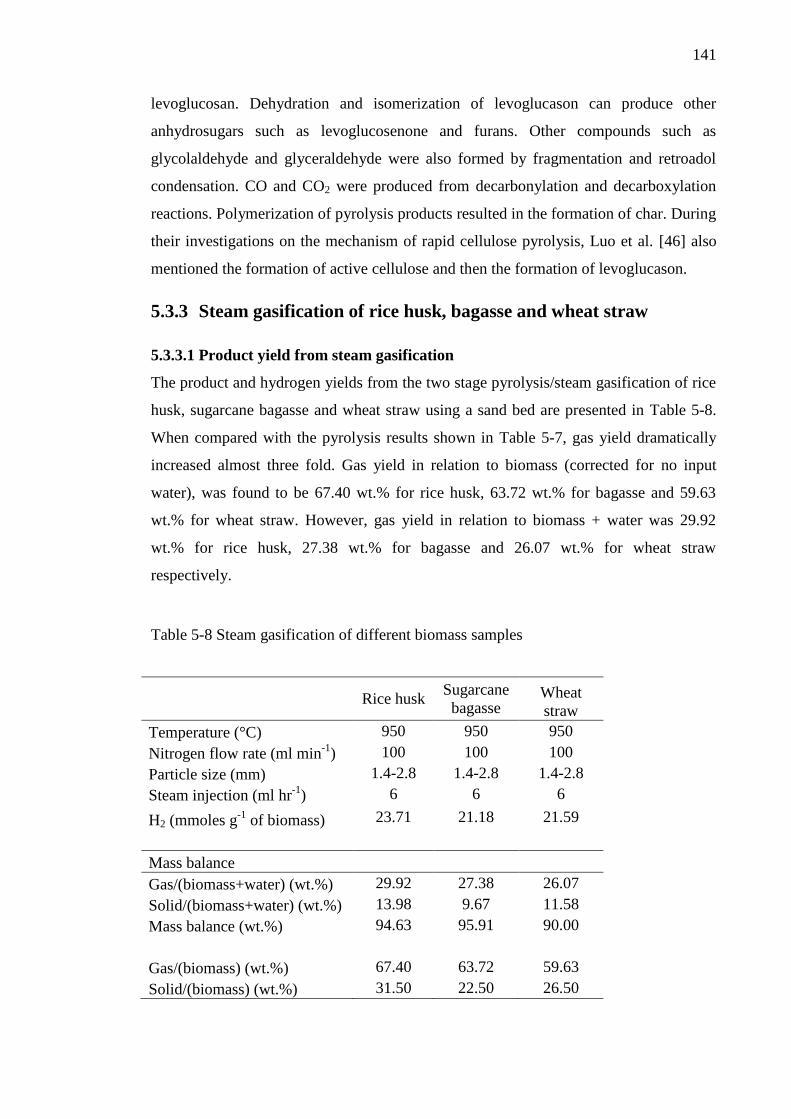
141
levoglucosan. Dehydration and isomerization of levoglucason can produce other
anhydrosugars such as levoglucosenone and furans. Other compounds such as
glycolaldehyde and glyceraldehyde were also formed by fragmentation and retroadol
condensation. CO and CO2 were produced from decarbonylation and decarboxylation
reactions. Polymerization of pyrolysis products resulted in the formation of char. During
their investigations on the mechanism of rapid cellulose pyrolysis, Luo et al. [46] also
mentioned the formation of active cellulose and then the formation of levoglucason.
5.3.3 Steam gasification of rice husk, bagasse and wheat straw
5.3.3.1 Product yield from steam gasification
The product and hydrogen yields from the two stage pyrolysis/steam gasification of rice
husk, sugarcane bagasse and wheat straw using a sand bed are presented in Table 5-8.
When compared with the pyrolysis results shown in Table 5-7, gas yield dramatically
increased almost three fold. Gas yield in relation to biomass (corrected for no input
water), was found to be 67.40 wt.% for rice husk, 63.72 wt.% for bagasse and 59.63
wt.% for wheat straw. However, gas yield in relation to biomass + water was 29.92
wt.% for rice husk, 27.38 wt.% for bagasse and 26.07 wt.% for wheat straw
respectively.
Table 5-8 Steam gasification of different biomass samples
Rice husk
Sugarcane
bagasse Wheat
straw
Temperature (°C) 950 950 950
Nitrogen flow rate (ml min-1
) 100 100 100
Particle size (mm) 1.4-2.8 1.4-2.8 1.4-2.8
Steam injection (ml hr-1
) 6 6 6
H2 (mmoles g-1
of biomass) 23.71 21.18 21.59
Mass balance
Gas/(biomass+water) (wt.%) 29.92 27.38 26.07
Solid/(biomass+water) (wt.%) 13.98 9.67 11.58
Mass balance (wt.%) 94.63 95.91 90.00
Gas/(biomass) (wt.%) 67.40 63.72 59.63
Solid/(biomass) (wt.%) 31.50 22.50 26.50
142
Higher hydrogen yield was attained from the steam gasification of volatiles and tars
evolving from the pyrolysis of biomass sample in the first stage. Rice husk produced
23.71 mmoles of hydrogen per gram of biomass while 21.18 and 21.59 mmoles of
hydrogen were recovered per gram of bagasse and wheat straw respectively. The
significantly higher hydrogen yield indicates the effectiveness of two stage pyrolysis
and gasification system over the single stage pyrolysis process. Several researchers [53-
57] have employed two staged pyrolysis-gasification systems and reported low tar
contents and higher gas and hydrogen yield.
5.3.3.2 Gas composition from steam gasification
The gas composition derived from the pyrolysis and steam gasification of rice husk
(RH), sugarcane bagasse (BG) and wheat straw (WS) are detailed in Figure 5-12. In
contrast to the pyrolysis results, during steam gasification, gas composition changed
substantially. Carbon monoxide concentration slightly reduced from 25 vol.% during
pyrolysis to around 23 vol.% during steam gasification. The concentration of CH4 was
also reduced from 10 vol.% during pyrolysis to less than 5 vol.% during gasification.
Only trace amounts (0.14 vol.% for rice husk; 0.004 vol.% for wheat straw) of C2-C4
hydrocarbons were found in gas mixture during the steam gasification, however no C2-
C4 hydrocarbons were detected during gasification of sugarcane bagasse. Previously
during pyrolysis; around 2 vol.% of C2-C4 hydrocarbons were present in the gas
mixture.
The hydrogen concentration in the product gaseous mixture was enhanced from around
25 vol.% during pyrolysis to 55 vol.% during two stage steam gasification. Hydrogen
concentration of 55.62 vol.% for rice husk, 54.12 vol.% for bagasse and 55.94 vol.% for
wheat straw were achieved.
The concentration of CO2 reduced to almost half from 38 vol.% during pyrolysis to 17
vol.% during gasification. This decrease in CO2 concentration at higher temperature
indicates the increase in forward Boudouard reaction. As reported by Yang et al. [58]
this reaction is favoured at higher temperatures. The endothermic reaction between CO2
and CH4 was also supported at high temperature contributing towards the decrease in
CO2 and CH4 concentrations.
The injected steam also boosted the hydrogen concentration by reacting with CH4, C,
and CO. Water gas reaction, and steam methane reforming reaction, are favoured at
143
high temperature due to their endothermic nature. Water gas shift reaction, on the other
hand is slightly exothermic but the equilibrium can be shifted towards the products at
higher steam to biomass ratios. Herguido et al. [59] reported an increase in hydrogen
concentration (up to 60 vol.%) with a corresponding decrease in CO concentration when
they increased steam to biomass ratio (S/B) from 0.5 to 2.5. A sharp reduction in tar
concentration was also noticed.
The decrease in C2-C4 hydrocarbons concentration was most likely due to the thermal
cracking of larger hydrocarbon molecules into the smaller molecules. Thermal cracking
of tar components, is one of the major advantages of the high temperature ( > 900 °C)
two-stage pyrolysis/gasification system over the other configuration as it require little or
no syngas upgrading equipment for final use [60].
Wu et al. [2] investigated the effect of two different catalysts on pyrolysis/gasification
of biomass components like cellulose, xylan and lignin using two-stage
pyrolysis/gasification system in a down-draft configuration. Samples were pyrolysed in
the first stage at 500 °C while all the derived products were gasified in the second stage
at a higher temperature of 800 °C. The highest hydrogen yield of 55.1 vol.% was
obtained from lignin sample in the presence of steam and Ni-Mg-Al catalyst. When
compared with the results of the current study, it is evident that the two-stage high-
temperature pyrolysis/gasification system used in this study was very effective as
similar hydrogen concentration of (~55 vol.%) was obtained without catalyst.
Various researchers [61, 62] have studied the global mechanism of gasification. Ahmed
et al.[61] proposed a detailed global mechanism of biomass gasification. It was reported
that the initial heating of biomass produced active precursor compounds. For slow
heating rate to final low gasification temperature, these precursor compounds produce
char, gases and water. Further gasification of char can produce syngas consisting of CO,
CO2 and hydrogen.
For higher heating rate up to medium final temperature lead to the depolymerization of
these precursor compounds forming aromatic cyclic and heterocyclic compounds.
Repolymerization of these compounds can produced some char while the
oligomerization of these single ring and multi-ring compounds can produce oligomer tar
compounds with the evolution of CO2. Further heating to a higher temperature can
open the rings of these aromatic cyclic and heterocyclic compounds and form
144
aldehydes, ketones, carboxylic acids and other gases by fragmentation, decarbonylation
and decarboxylation reaction. The tertiary reactions on these aldehydes, ketones,
carboxylic acids compounds can produce syngas.
For higher heating rates coupled with higher final temperature can produce aldehydes,
ketones, carboxylic acids and other gases from precursor compounds by fragmentation,
decarbonylation and decarboxylation reaction. Aromatization and repolymerization can
produce char from these compounds. Further tertiary reactions on these aldehydes,
ketones, carboxylic acids can produce light hydrocarbons and CO. Final reforming of
these hydrocarbons can also produce syngas consisting of CO, CO2, and hydrogen.
5.3.4 Dolomite catalytic steam gasification of rice husk, bagasse and
wheat straw
5.3.4.1 Product yield from dolomite catalytic steam gasification
In this set of experiments, the second stage containing dolomite (calcined at 1000 °C)
was heated first to 950 °C. Once the desired temperature was achieved, the biomass
sample was pyrolysed in the first stage up to a final temperature of 950 °C. Volatiles,
gases and tar evolving from the pyrolysis of biomass were made to react with steam in
the presence of calcined dolomite. The product and hydrogen yield derived from the
dolomite catalytic steam gasification of the three biomass samples are shown in Table
5-9
As shown in Table 5-9, in relation to biomass (corrected for no input water), more than
60 wt.% of the biomass samples was converted into gas, however the gas yield in
relation to biomass + water was found to be 24.63 wt.% for rice husk, 25.55 wt.% for
bagasse and 25.63 wt.% for wheat straw respectively. As compared to the two-stage
steam gasification results shown in Table 5-8, the solid yield was similar as the
conditions in the pyrolysis stage were identical. Hydrogen yield was slightly improved
to 22.55 mmoles g-1
for rice husk, 22.30 mmoles g-1
for bagasse and 21.97 mmoles g-1
for wheat straw.
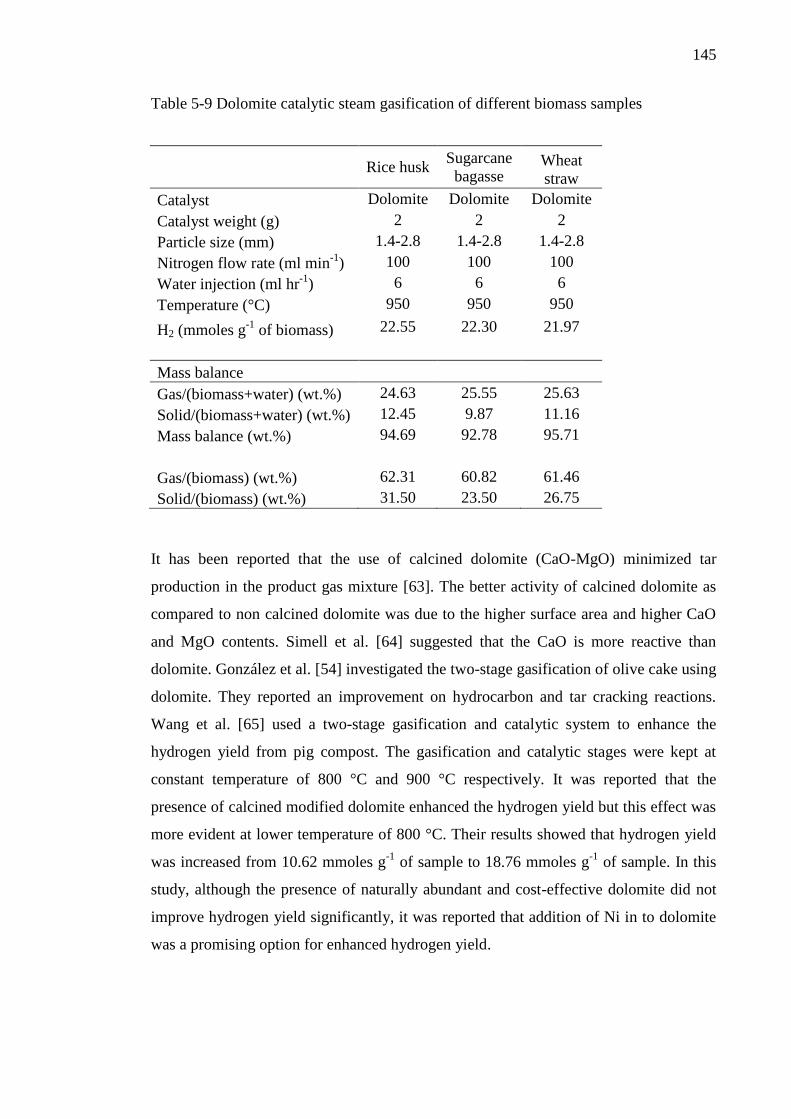
145
Table 5-9 Dolomite catalytic steam gasification of different biomass samples
Rice husk
Sugarcane
bagasse Wheat
straw
Catalyst Dolomite Dolomite Dolomite
Catalyst weight (g) 2 2 2
Particle size (mm) 1.4-2.8 1.4-2.8 1.4-2.8
Nitrogen flow rate (ml min-1
) 100 100 100
Water injection (ml hr-1
) 6 6 6
Temperature (°C) 950 950 950
H2 (mmoles g-1
of biomass) 22.55 22.30 21.97
Mass balance
Gas/(biomass+water) (wt.%) 24.63 25.55 25.63
Solid/(biomass+water) (wt.%) 12.45 9.87 11.16
Mass balance (wt.%) 94.69 92.78 95.71
Gas/(biomass) (wt.%) 62.31 60.82 61.46
Solid/(biomass) (wt.%) 31.50 23.50 26.75
It has been reported that the use of calcined dolomite (CaO-MgO) minimized tar
production in the product gas mixture [63]. The better activity of calcined dolomite as
compared to non calcined dolomite was due to the higher surface area and higher CaO
and MgO contents. Simell et al. [64] suggested that the CaO is more reactive than
dolomite. González et al. [54] investigated the two-stage gasification of olive cake using
dolomite. They reported an improvement on hydrocarbon and tar cracking reactions.
Wang et al. [65] used a two-stage gasification and catalytic system to enhance the
hydrogen yield from pig compost. The gasification and catalytic stages were kept at
constant temperature of 800 °C and 900 °C respectively. It was reported that the
presence of calcined modified dolomite enhanced the hydrogen yield but this effect was
more evident at lower temperature of 800 °C. Their results showed that hydrogen yield
was increased from 10.62 mmoles g-1
of sample to 18.76 mmoles g-1
of sample. In this
study, although the presence of naturally abundant and cost-effective dolomite did not
improve hydrogen yield significantly, it was reported that addition of Ni in to dolomite
was a promising option for enhanced hydrogen yield.
146
5.3.4.2 Gas composition from dolomite catalytic steam gasification
Gas composition results from catalytic two stage gasification of biomass samples using
calcined dolomite are presented in Figure 5-13. Compared to the steam gasification
results shown in Figure 5-12, a slight increase in hydrogen concentration, for example,
for rice husk, increasing from 55 vol.% to 57 vol.% with a corresponding decrease in
CO concentration from 21.53 vol.% to 19.97 vol.%. A slight increase in CO2
concentration (from 17.70 vol.% to 19.59 vol.% for rice husk) along with some decrease
in CH4 concentration (4.99 vol.% to 3.02 vol.% for rice husk) was also observed.
However no C2-C4 hydrocarbons were detected during the catalytic steam gasification
of all three biomass samples.
Similar results are reported by González et al. [54], suggesting that the presence of
dolomite improved the water gas shift reaction as was evidenced by higher hydrogen
concentration with the reduction in CO concentration in the gas mixture . Other authors
[66-68] also reported the effectiveness of dolomite as catalyst. Dolomite was found to
be very effective for reduction of tar compounds. As reported by Olivares et al. [67] the
tar cracking capability of dolomite was mainly due to the steam reforming and dry
reforming reactions. Elbaba et al. [69] carried out two stage pyrolysis-gasification of
waste tyres. During their investigation, pyrolysis temperature was kept constant at 500
°C while gasification in the presence of steam and calcined dolomite was carried out at
800 °C. 49.10 vol.% hydrogen was achieved using calcined dolomite catalyst.
5.3.5 10 wt.% Ni-dolomite catalytic steam gasification of rice husk,
bagasse and wheat straw
5.3.5.1 Product yield from 10 wt.% Ni-dolomite catalytic steam gasification
Product yield and hydrogen production from the two-stage pyrolysis/gasification of the
biomass samples using 10 wt.% Ni-dolomite are presented in Table 5-10. By
introducing 10 wt.% Ni into the calcined catalyst increased the gas yield as well as
hydrogen yield. When compared with the dolomite results presented in Table 5-9, Gas
yield in relation to biomass + water increased marginally from 24.63 wt.% to 26.30
wt.% for rice husk, from 25.55 wt.% to 28.04 wt.% for bagasse and from 25.63 wt.% to
26.20 wt.% for wheat straw respectively. The presence of Ni in the dolomite also
enhanced the hydrogen yield for all three biomass samples. Compared to the dolomite
147
results, hydrogen yield was enhanced from 22.55 mmoles g-1
to 25.44 mmoles g-1
for
rice husk, from 22.30 mmoles g-1
to 25.41 mmoles g-1
for sugarcane bagasse and from
21.79 mmoles g-1
to 24.47 mmoles g-1
for wheat straw.
Significant increase in gas yield and hydrogen yield was also reported by Wang et al.
[65]. They used a two-stage gasification system to enhance the hydrogen yield from pig
compost. In the first stage, the sample was gasified in the presence of steam at 800 °C,
while in the second stage, gases, volatiles and liquids were made to react with the
catalyst at higher gasification temperature of 900 °C. The modified dolomite used in
this study was prepared by mixing naturally occurring dolomite (calcined in an air
atmosphere at 900 °C for 4 hours) with calcium aluminate and calcium citrate at a mass
ratio of 7:2:1. The introduction of Ni into the modified dolomite catalyst increased the
gas yield from 0.97 Nm3 kg
-1 to 1.33 Nm
3 kg
-1 and hydrogen production was also
enhanced from 18.76 mmoles g-1
to 32.45 mmoles g-1
of the sample. Ni-dolomite was
also reported to be very effective in tar reduction. Only 0.24 g/Nm3 of tar was found
with the use of Ni-dolomite catalyst.
Corujo et al. [70] investigated the influence of calcined dolomite and Ni-dolomite on
the product yield from the steam gasification of forestry residue at 900 °C. Dolomite
and different compositions of Ni-dolomite (prepared by incipient wetness method) were
calcined at 900 °C in an argon atmosphere. With the introduction of Ni-dolomite, there
was a significant increase in gas yield along with a decrease in tar and char formation
reported.
Various researchers have reported the effectiveness of Ni for lower tar production and
higher hydrogen production from gasification [69, 71-74]. However the deactivation of
Ni based catalysts was reported mainly due to carbon deposition [72]. Due to the two-
stage configuration and high temperature employed in this study, very little to no carbon
was observed on the catalyst after reaction. From the results shown in Table 5-10, it is
evident that the combination of high temperature steam gasification and the tar cracking
capabilities of 10 wt.% Ni-dolomite is a promising option for the production of
hydrogen from biomass.
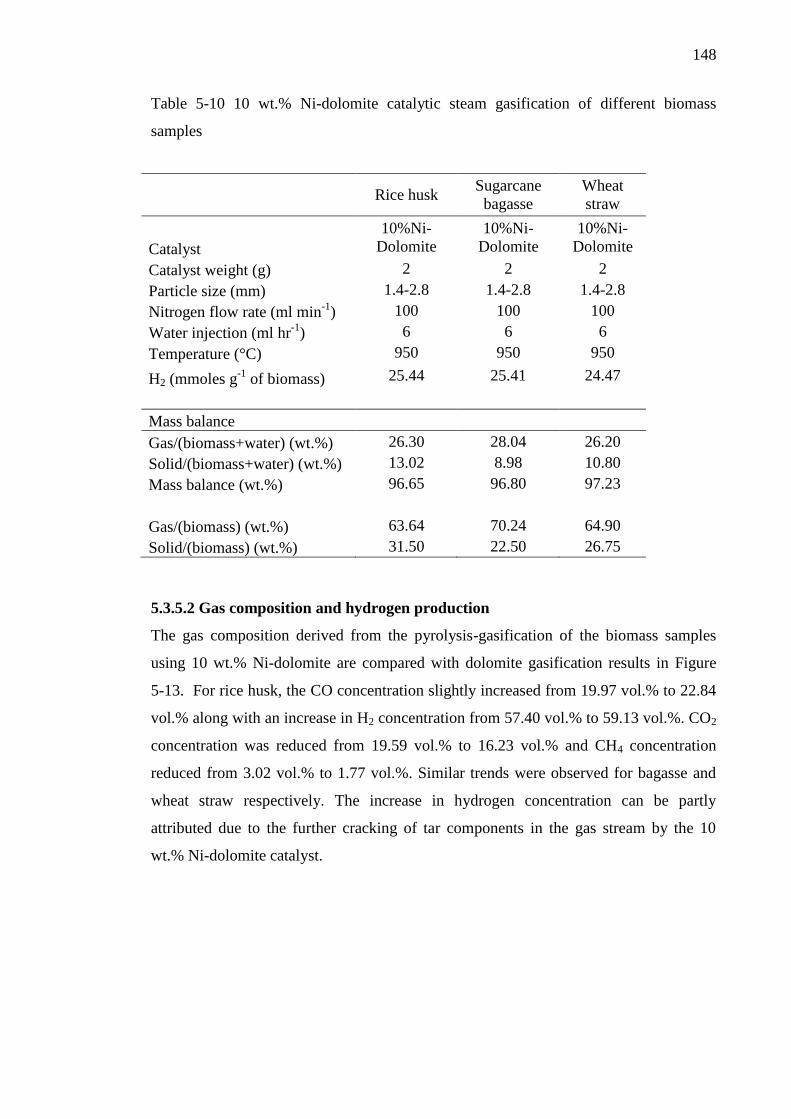
148
Table 5-10 10 wt.% Ni-dolomite catalytic steam gasification of different biomass
samples
Rice husk
Sugarcane
bagasse
Wheat
straw
Catalyst
10%Ni-
Dolomite
10%Ni-
Dolomite
10%Ni-
Dolomite
Catalyst weight (g) 2 2 2
Particle size (mm) 1.4-2.8 1.4-2.8 1.4-2.8
Nitrogen flow rate (ml min-1
) 100 100 100
Water injection (ml hr-1
) 6 6 6
Temperature (°C) 950 950 950
H2 (mmoles g-1
of biomass) 25.44 25.41 24.47
Mass balance
Gas/(biomass+water) (wt.%) 26.30 28.04 26.20
Solid/(biomass+water) (wt.%) 13.02 8.98 10.80
Mass balance (wt.%) 96.65 96.80 97.23
Gas/(biomass) (wt.%) 63.64 70.24 64.90
Solid/(biomass) (wt.%) 31.50 22.50 26.75
5.3.5.2 Gas composition and hydrogen production
The gas composition derived from the pyrolysis-gasification of the biomass samples
using 10 wt.% Ni-dolomite are compared with dolomite gasification results in Figure
5-13. For rice husk, the CO concentration slightly increased from 19.97 vol.% to 22.84
vol.% along with an increase in H2 concentration from 57.40 vol.% to 59.13 vol.%. CO2
concentration was reduced from 19.59 vol.% to 16.23 vol.% and CH4 concentration
reduced from 3.02 vol.% to 1.77 vol.%. Similar trends were observed for bagasse and
wheat straw respectively. The increase in hydrogen concentration can be partly
attributed due to the further cracking of tar components in the gas stream by the 10
wt.% Ni-dolomite catalyst.
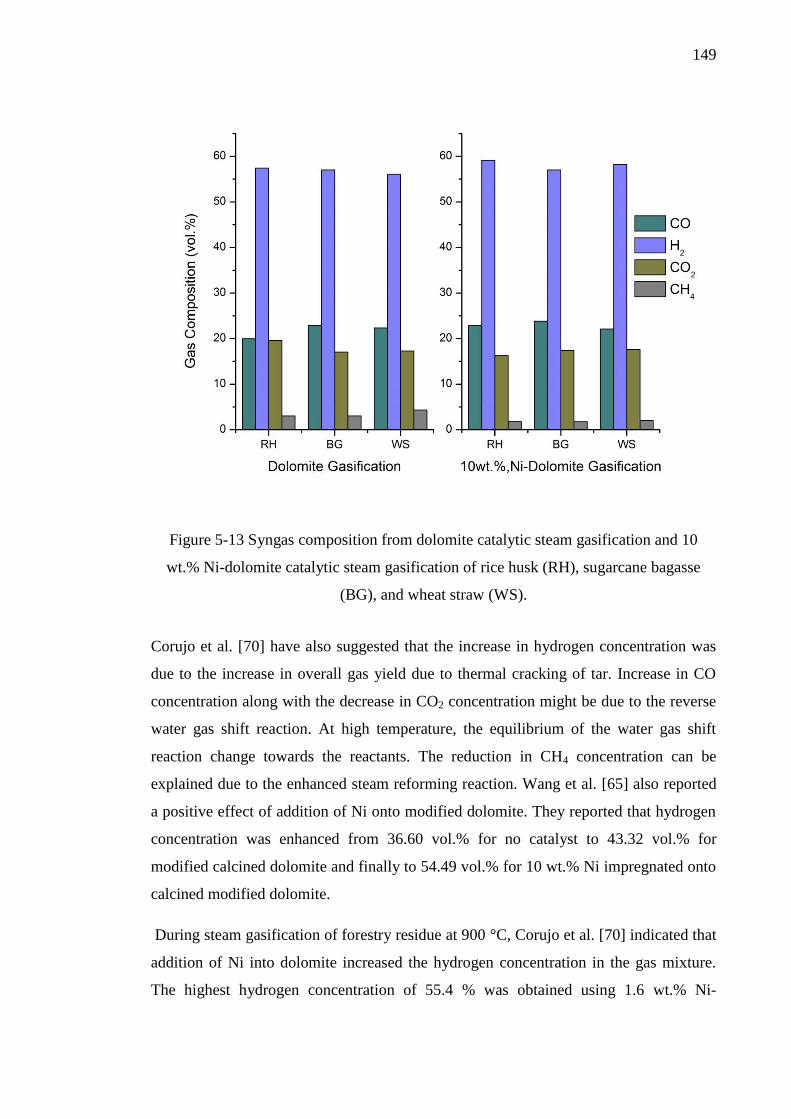
149
Figure 5-13 Syngas composition from dolomite catalytic steam gasification and 10
wt.% Ni-dolomite catalytic steam gasification of rice husk (RH), sugarcane bagasse
(BG), and wheat straw (WS).
Corujo et al. [70] have also suggested that the increase in hydrogen concentration was
due to the increase in overall gas yield due to thermal cracking of tar. Increase in CO
concentration along with the decrease in CO2 concentration might be due to the reverse
water gas shift reaction. At high temperature, the equilibrium of the water gas shift
reaction change towards the reactants. The reduction in CH4 concentration can be
explained due to the enhanced steam reforming reaction. Wang et al. [65] also reported
a positive effect of addition of Ni onto modified dolomite. They reported that hydrogen
concentration was enhanced from 36.60 vol.% for no catalyst to 43.32 vol.% for
modified calcined dolomite and finally to 54.49 vol.% for 10 wt.% Ni impregnated onto
calcined modified dolomite.
During steam gasification of forestry residue at 900 °C, Corujo et al. [70] indicated that
addition of Ni into dolomite increased the hydrogen concentration in the gas mixture.
The highest hydrogen concentration of 55.4 % was obtained using 1.6 wt.% Ni-
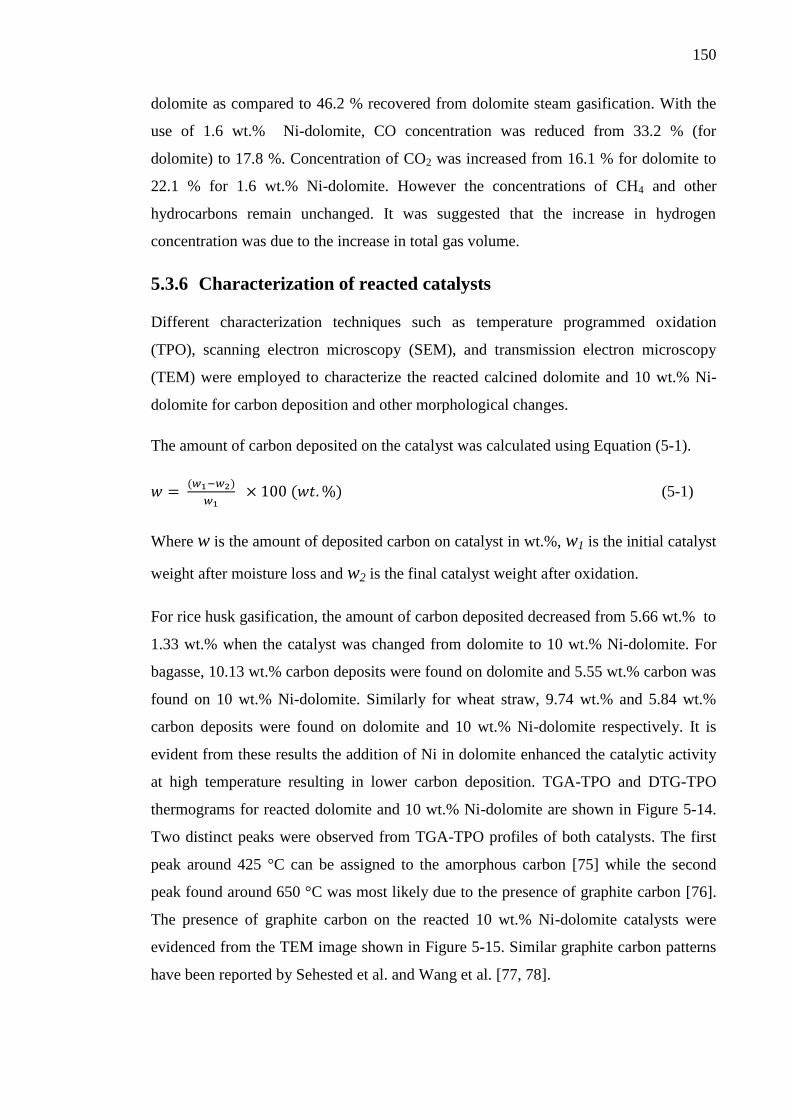
150
dolomite as compared to 46.2 % recovered from dolomite steam gasification. With the
use of 1.6 wt.% Ni-dolomite, CO concentration was reduced from 33.2 % (for
dolomite) to 17.8 %. Concentration of CO2 was increased from 16.1 % for dolomite to
22.1 % for 1.6 wt.% Ni-dolomite. However the concentrations of CH4 and other
hydrocarbons remain unchanged. It was suggested that the increase in hydrogen
concentration was due to the increase in total gas volume.
5.3.6 Characterization of reacted catalysts
Different characterization techniques such as temperature programmed oxidation
(TPO), scanning electron microscopy (SEM), and transmission electron microscopy
(TEM) were employed to characterize the reacted calcined dolomite and 10 wt.% Ni-
dolomite for carbon deposition and other morphological changes.
The amount of carbon deposited on the catalyst was calculated using Equation (5-1).
( )
( ) (5-1)
Where w is the amount of deposited carbon on catalyst in wt.%, w1 is the initial catalyst
weight after moisture loss and w2 is the final catalyst weight after oxidation.
For rice husk gasification, the amount of carbon deposited decreased from 5.66 wt.% to
1.33 wt.% when the catalyst was changed from dolomite to 10 wt.% Ni-dolomite. For
bagasse, 10.13 wt.% carbon deposits were found on dolomite and 5.55 wt.% carbon was
found on 10 wt.% Ni-dolomite. Similarly for wheat straw, 9.74 wt.% and 5.84 wt.%
carbon deposits were found on dolomite and 10 wt.% Ni-dolomite respectively. It is
evident from these results the addition of Ni in dolomite enhanced the catalytic activity
at high temperature resulting in lower carbon deposition. TGA-TPO and DTG-TPO
thermograms for reacted dolomite and 10 wt.% Ni-dolomite are shown in Figure 5-14.
Two distinct peaks were observed from TGA-TPO profiles of both catalysts. The first
peak around 425 °C can be assigned to the amorphous carbon [75] while the second
peak found around 650 °C was most likely due to the presence of graphite carbon [76].
The presence of graphite carbon on the reacted 10 wt.% Ni-dolomite catalysts were
evidenced from the TEM image shown in Figure 5-15. Similar graphite carbon patterns
have been reported by Sehested et al. and Wang et al. [77, 78].
151
Figure 5-14 TGA-TPO and DTG-TPO results of reacted dolomite (Dol) and reacted 10
wt.% Ni-dolomite (Ni-Dol) catalysts during the catalytic steam gasification of rice husk
(RH), bagasse (BG), and wheat straw (WS) at 950 °C.
Various researchers [79-81] have investigated the formation and morphology of
deposited carbon on catalyst. It has been reported by Trimm et al. [82] that the
deposition of carbon on the catalyst surface initiate with the dissociation of
hydrocarbons derived from the pyrolysis/gasification of biomass; leading to the
formation of highly reactive monoatomic carbon. This highly reactive carbon if not
converted into CO can react with the Ni phase (produced from the in situ reduction of
NiO phase) to form carbides which results in the formation of carbon whiskers by
further dissolving and diffusing of reactive layered carbon into the Ni particles [83].
This process of deposition of layered carbon at the rear of the Ni particle results in the
formation of filamentous carbon [81]. Further investigation of filamentous carbon
formed were performed by Wang et al. [78]. It was suggested that filamentous carbon
were consist of graphite sheets piled up in the shape of hollow cones. Similar findings
have been reported [79, 81], showing the presence of Ni particles on the tip of the
filamentous carbon.
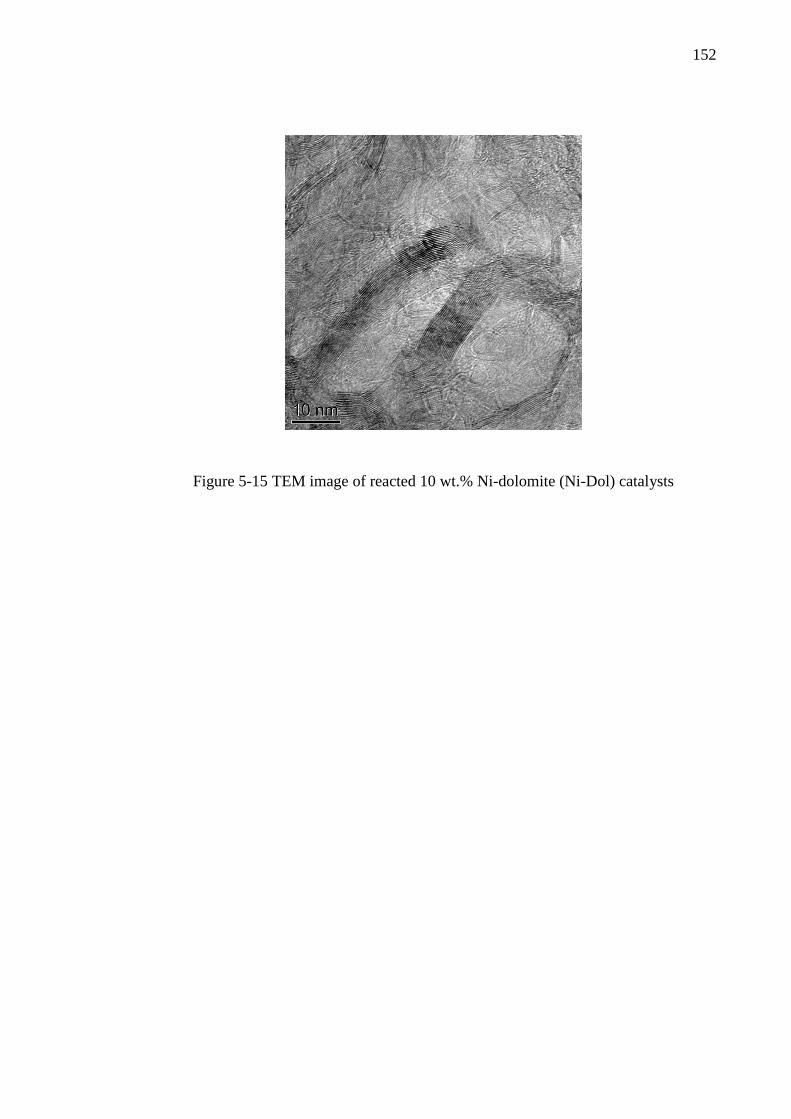
152
Figure 5-15 TEM image of reacted 10 wt.% Ni-dolomite (Ni-Dol) catalysts
153
5.3.7 Conclusions for section 5.3
In order to obtain high hydrogen yield, high temperature pyrolysis, steam gasification
and catalytic steam gasification of rice husk, bagasse and wheat straw were performed
in a two-stage fixed-bed reactor system. The following conclusions can be made from
this study.
Hydrogen yield increased dramatically from ~2 mmoles g-1
for pyrolysis to ~ 21
mmoles g -1
of biomass during two-stage pyrolysis/gasification in the presence
of steam. This showed that the high temperature (950 °C) employed in this study
was very promising as compared to conventional pyrolysis and gasification
performed at lower temperatures.
Use of calcined dolomite and 10 wt.% Ni-dolomite catalysts in the second stage
further boosted gas yield and hydrogen yield. The highest hydrogen yield of
25.44 mmoles g-1
of biomass was obtained from the pyrolysis/gasification of
rice husk using 10 wt.% Ni-dolomite. The highest hydrogen concentration in the
gas mixture was found to be 59.14 vol.%.
The higher gas yield obtained in this study was primarily due to the higher
temperature employed, leading to the thermal cracking of tar components and
effective reforming of methane and other hydrocarbons thereby enhancing the
hydrogen yield.
Inexpensive and naturally abundant dolomite catalyst used in this study was
characterized using TGA-TPO, SEM and TEM techniques. Significantly lower
carbon deposits found on reacted 10 wt.% Ni-dolomite suggest that the high
temperatures of pyrolysis/gasification has the potential to maintain the initial
higher catalytic activity by suppressing the carbon formation and deposition on
the catalyst.
154
5.4 The influence of process conditions on ultra-high
temperature catalytic steam gasification of rice husk using 10
wt.% Ni-dolomite catalyst.
In the previous section, pyrolysis, steam gasification and catalytic steam gasification of
rice husk, bagasse and wheat straw was performed to select the best suited process and
biomass sample to produce hydrogen. It was found that the highest hydrogen yield was
obtained from catalytic steam gasification of rice husk using 10 wt.% Ni-dolomite. In
this section, the influence of various process conditions on two-stage catalytic
pyrolysis/gasification of rice husk is investigated using 10 wt.% Ni-dolomite. Influence
of temperature is investigated in section 5.4.1 while water injection rate is studied in
section 5.4.2. Results from the effect of biomass particle size and catalyst to sample
ratio are outlined in section 5.4.3 and 5.4.4 respectively. Finally the influence of carrier
gas flow rate is reported in section 5.4.5.
5.4.1 The influence of gasification temperature
5.4.1.1 Product yield
Temperature is one of the most influential parameters affecting not only the gas yield
but also the gas composition during pyrolysis and gasification [84]. In this study, the
influence of temperature on product yield and gas composition during the two stage
pyrolysis/gasification of rice husk was investigated. The temperature of the pyrolysis
stage (top reactor) was kept constant at 950 °C while the temperature of the gasification
stage (bottom reactor) was varied from 850 °C to 1050 °C with an increment of 50 °C.
The gasification stage was first heated to the desired temperature and then the rice husk
was pyrolysed in the first stage. In order to maximize the hydrogen yield; volatiles,
liquids and tar evolving from the first stage were gasified in the second stage in the
presence of steam using 10 wt.% Ni-dolomite as catalyst. The two-stage configuration
was found to be very effective for high hydrogen yield with lower tar contents [54, 55].
Results from the influence of gasification temperature on product yield and hydrogen
production are shown in Table 5-11.
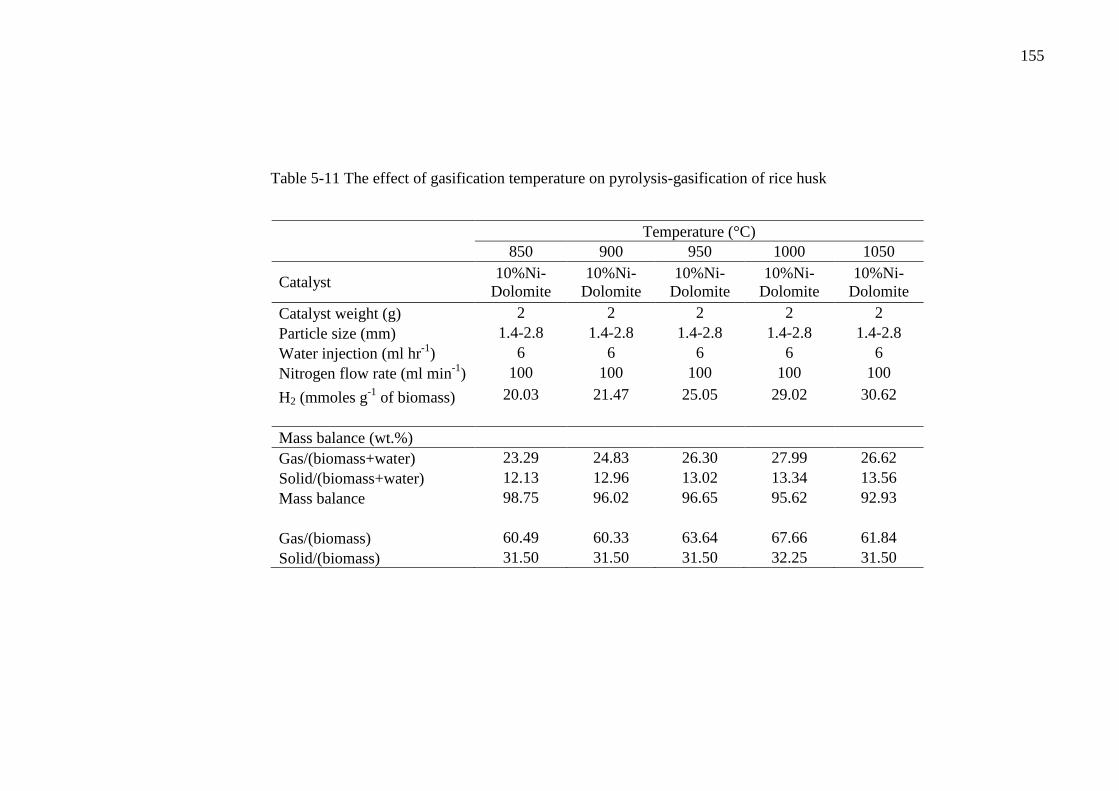
155
Table 5-11 The effect of gasification temperature on pyrolysis-gasification of rice husk
Temperature (°C)
850 900 950 1000 1050
Catalyst 10%Ni-
Dolomite
10%Ni-
Dolomite
10%Ni-
Dolomite
10%Ni-
Dolomite
10%Ni-
Dolomite
Catalyst weight (g) 2 2 2 2 2
Particle size (mm) 1.4-2.8 1.4-2.8 1.4-2.8 1.4-2.8 1.4-2.8
Water injection (ml hr-1
) 6 6 6 6 6
Nitrogen flow rate (ml min-1
) 100 100 100 100 100
H2 (mmoles g-1
of biomass) 20.03 21.47 25.05 29.02 30.62
Mass balance (wt.%)
Gas/(biomass+water) 23.29 24.83 26.30 27.99 26.62
Solid/(biomass+water) 12.13 12.96 13.02 13.34 13.56
Mass balance 98.75 96.02 96.65 95.62 92.93
Gas/(biomass) 60.49 60.33 63.64 67.66 61.84
Solid/(biomass) 31.50 31.50 31.50 32.25 31.50
156
From the results it is evident that with the increase in temperature, gas yield in relation
to biomass + water increased from 23.29 wt.% at 850 °C to 26.62 wt.% at 1050 °C.
However this increase in gas yield was not linear. Gas yield initially increased from
24.83 wt.% at 900 °C to 26.30 wt.% at 950 °C and to 27.99 wt.% at 1000 °C. However
when the temperature was raised from 1000 °C to 1050 °C, the gas yield slightly
decreased from 27.99 to 26.62 wt.%. Wang et al. [65] investigated the two-stage
catalytic gasification of pig compost from 750 °C to 900 °C using Ni-modified
dolomite. Gas yield linearly increased from 0.98 Nm3 kg
-1 at 750 °C to 1.33 Nm
3 kg
-1 of
feedstock at 900 °C. The increase in the gas yield with the increase in gasification
temperature was primarily due to the thermal cracking of volatiles, liquids and steam
reforming of higher hydrocarbons [85]. At higher temperature, the endothermic
Boudouard reaction and water gas reaction also contributed towards the higher gas
yield. Decarboxylation, depolymerization and thermal cracking reactions are also
favoured with the increase in temperature [53].
The slight decrease in gas yield at the highest studied temperature of 1050 °C was most
likely due to the series of complex repolymerization and condensation reactions
favourable at temperature above 1000 °C [86, 87]. These condensation and
repolymerization reactions lead to the formation of soot as considerable amount of soot
was observed in the condenser system. The TGA-TPO and DTG-TPO results shown in
Figure 5-18 indicate that the highest carbon deposits of 3.89 wt.% were found on the
catalyst at 1050 °C. It has been suggested that above 1000 °C, the tertiary tars (PAHs),
(even present in very small quantities) acted as a precursor for the formation of soot
[88]. These polyaromatic hydrocarbon molecules grow into bigger aromatic complexes
until they reach a critical weight, forming soot particles [86].
One of the major advantages of high temperature catalytic steam gasification used in
this study was the enhanced gas and hydrogen yield with lower tar contents. It was
reported [89] that as compared to olivine, the use of dolomite at higher temperature was
more effective leading to a substantial decrease in all categories of tar compounds.
Skoulou et al. [90] found a significant decrease in tar from 124.07g/Nm3 at 750 °C to
25.26 g/Nm3 at 1050 °C during the high temperature steam gasification of olive kernel.
Although the concentration of tar reduced with the rise in temperature, it was noticed
that at 1050 °C tar was mainly composed of light aromatic hydrocarbons with fraction
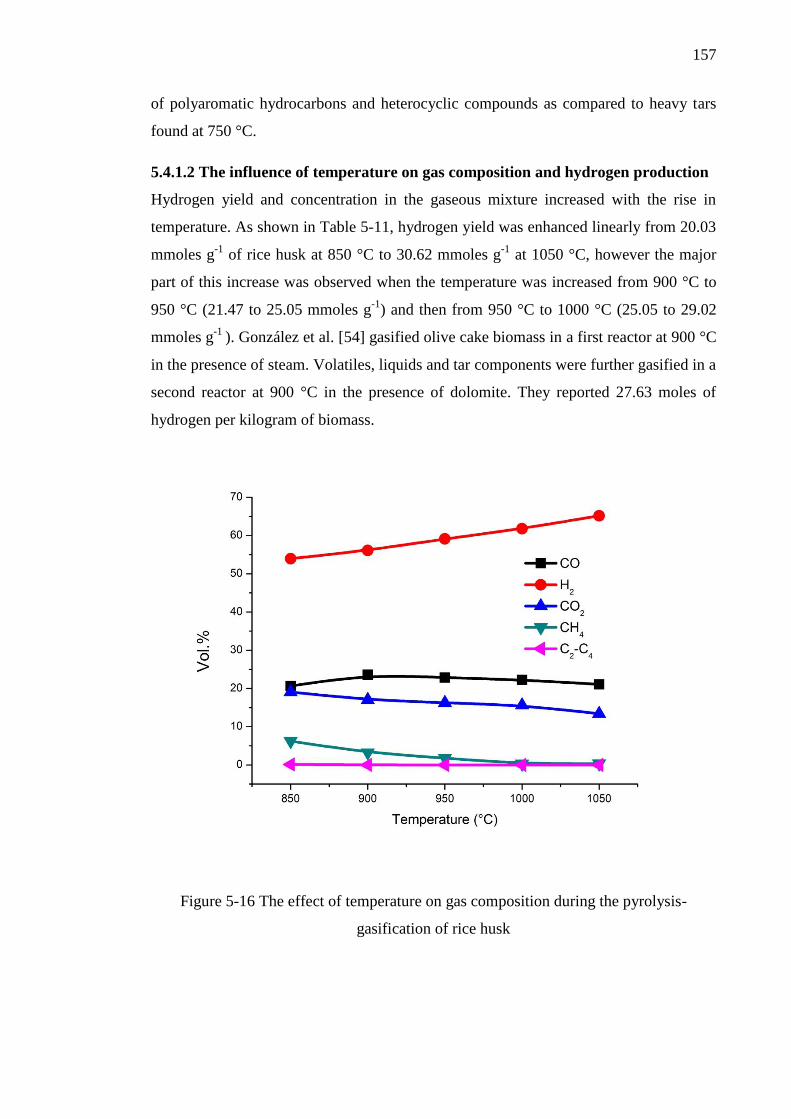
157
of polyaromatic hydrocarbons and heterocyclic compounds as compared to heavy tars
found at 750 °C.
5.4.1.2 The influence of temperature on gas composition and hydrogen production
Hydrogen yield and concentration in the gaseous mixture increased with the rise in
temperature. As shown in Table 5-11, hydrogen yield was enhanced linearly from 20.03
mmoles g-1
of rice husk at 850 °C to 30.62 mmoles g-1
at 1050 °C, however the major
part of this increase was observed when the temperature was increased from 900 °C to
950 °C (21.47 to 25.05 mmoles g-1
) and then from 950 °C to 1000 °C (25.05 to 29.02
mmoles g-1
). González et al. [54] gasified olive cake biomass in a first reactor at 900 °C
in the presence of steam. Volatiles, liquids and tar components were further gasified in a
second reactor at 900 °C in the presence of dolomite. They reported 27.63 moles of
hydrogen per kilogram of biomass.
Figure 5-16 The effect of temperature on gas composition during the pyrolysis-
gasification of rice husk
158
Hydrogen concentration in the gaseous mixture was also found to increase with
temperature. It increased from 53.95 vol.% at 850 °C to 56.10 vol.% at 900 °C. Further
increase in temperature leads to enhanced hydrogen concentration. At 950 °C, 59.14
vol.% while at 1000 °C, 61.80 vol.% and finally at 1050 °C, 65.18 vol.% of hydrogen
was obtained. Results presented here are in agreement with the findings of González et
al. [54], they reported around 52 vol.% of hydrogen from the two-stage gasification of
olive cake at 900 °C. Skoulou et al. [90] performed steam gasification of olive kernel in
a fixed bed gasifier. They also reported an increase in hydrogen gas concentration from
less than 10 vol.% at 750 °C to ~42 vol.% at 1050 °C. Increase in hydrogen
concentration with the rise in temperature can be explained by the fact that the higher
temperature favours endothermic reactions (e.g. water gas reaction and Boudouard
reaction) [84]. Steam reforming and dry reforming of methane and other higher
hydrocarbons also contribute towards the higher hydrogen concentration. Thermal
cracking of various tar components also lead to enhanced hydrogen yield at higher
gasification temperatures [91].
As shown in Figure 5-16, the concentration of CO slightly increased from 20.64 vol.%
at 850 °C to 21.08 vol.% at 1050 °C. A slight increase in CO concentration with the rise
in temperature from 750 °C to 1050 °C was also reported by Skoulou et al. [90]. This
increase was most likely due to the endothermic water gas, Boudouard reaction, steam
methane reforming and thermal cracking of heavy tar components at elevated
temperatures. It is also worth mentioning that the a major portion of produced CO was
most likely to be consumed by the water gas shift reaction to produce hydrogen,
however the extent of equilibrium of each reaction depends on many factors as various
competing parallel reactions are taking place simultaneously in the gasifier. CO2
concentration in the gaseous mixture gradually reduced from 19.06 vol.% at 850 °C to
13.38 vol.% at 1050 °C. This decrease in CO2 concentration can be attributed to the
endothermic Boudouard and dry reforming reactions favourable at higher temperatures
[91]. CH4 concentration also decreased from 6.22 vol.% at 850 °C to 0.35 vol.% at
1050 °C. This decrease was mainly due to the endothermic methane steam reforming
reaction leading to the enhanced hydrogen and CO production. Only 0.12 vol.% lighter
hydrocarbons (C2-C4) were detected at 850 °C. No C2-C4 hydrocarbons were detected at
900 °C or above. Similarly with the rise in temperature, a decrease in concentrations of
159
CH4 and lighter hydrocarbons during the steam gasification of wood biomass was
reported by Franco et al. [92].
The reacted 10 wt.% Ni-dolomite was characterized using TGA-TPO and SEM. In
addition, BET surface area of fresh and reacted catalysts was also calculated. As shown
in Table 5-12, compared to the surface area of fresh catalyst calcined at 900 °C, a
gradual reduction in surface area with the increase in temperature was observed. Surface
area was slightly reduced from 5.56 m2 g
-1 for fresh calcined catalyst to 4.33 m
2 g
-1 at
850 °C. However, a loss of surface area to 1.94 m2 g
-1 was observed at the gasification
temperature of 1050 °C. This decrease in surface area was most likely due to the
sintering of Ni particles on dolomite support. This effect was also evident from the
comparison of SEM images (shown in Figure 5-17) of fresh and reacted catalysts at
different gasification temperatures. Similar findings were reported by Sehested et al.
[93] who investigated the sintering of 9.5 wt.% Ni-Al2O3 catalyst from 500 – 825 °C.
They reported a decrease in surface area from 122 m2 g
-1 at 500 °C to 84.8 m
2 g
-1 at 825
°C. Loss of surface area with the rise in temperature due to sintering was also reported
in [94].
Table 5-12 The effect of temperature on BET surface area of reacted 10 wt.% Ni-
dolomite
Catalyst
Reaction
Temperature
BET surface
area
(°C) m2 g
-1
Fresh 10% Ni-dolomite -
5.56
Reacted 10% Ni-dolomite 850
4.33
Reacted 10% Ni-dolomite 1000
2.80
Reacted 10% Ni-dolomite 1050 1.94
Sintering is a complex process depending on various factors like temperature, time and
atmosphere, nickel-support interaction. It has been reported [95] that the higher
temperature and higher partial pressure of steam tend to promote sintering while
increase in partial pressure of hydrogen showed an inhibitory effect on sintering of
nickel [93]. It is widely accepted that the sintering of Ni particles follow one of the two
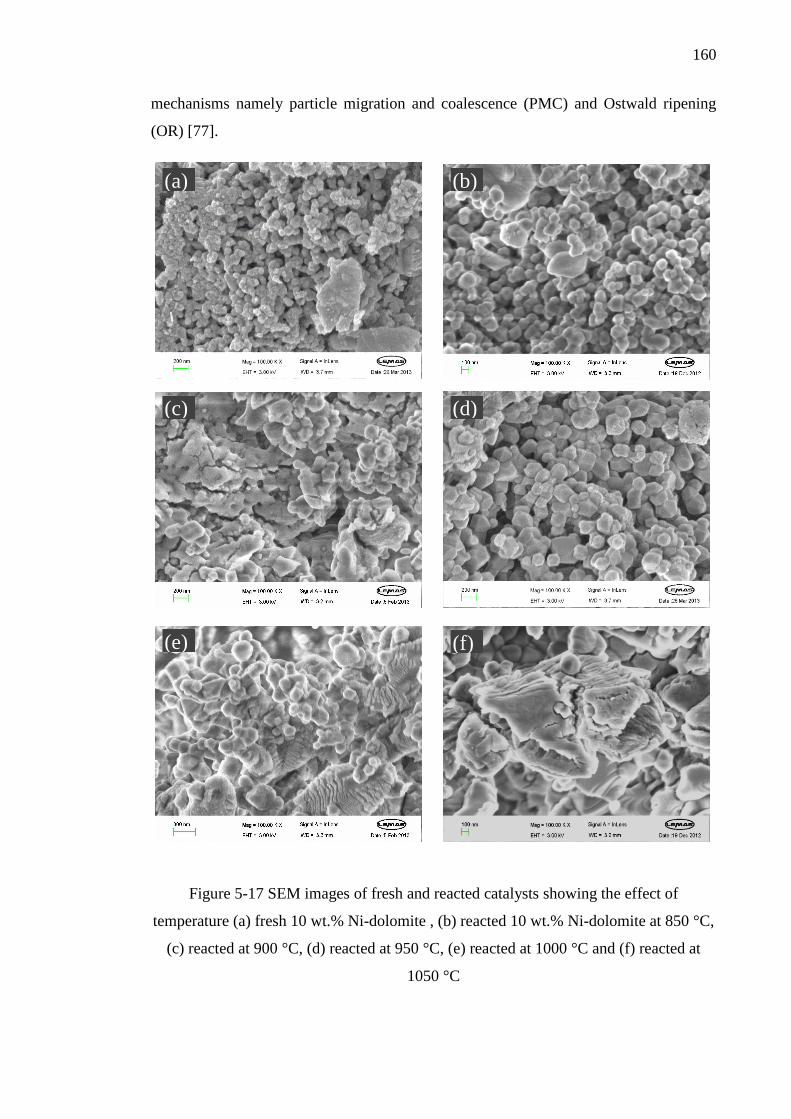
160
mechanisms namely particle migration and coalescence (PMC) and Ostwald ripening
(OR) [77].
Figure 5-17 SEM images of fresh and reacted catalysts showing the effect of
temperature (a) fresh 10 wt.% Ni-dolomite , (b) reacted 10 wt.% Ni-dolomite at 850 °C,
(c) reacted at 900 °C, (d) reacted at 950 °C, (e) reacted at 1000 °C and (f) reacted at
1050 °C
(d) (c)
(e) (f)
(a) (b)
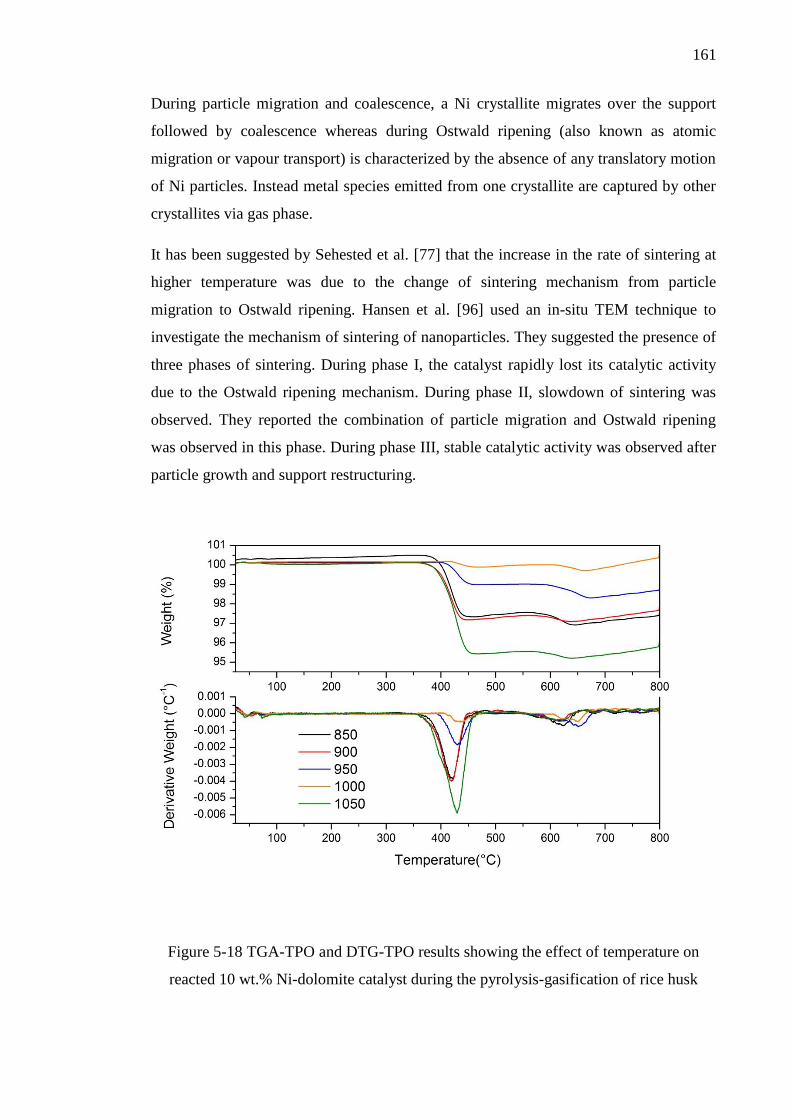
161
During particle migration and coalescence, a Ni crystallite migrates over the support
followed by coalescence whereas during Ostwald ripening (also known as atomic
migration or vapour transport) is characterized by the absence of any translatory motion
of Ni particles. Instead metal species emitted from one crystallite are captured by other
crystallites via gas phase.
It has been suggested by Sehested et al. [77] that the increase in the rate of sintering at
higher temperature was due to the change of sintering mechanism from particle
migration to Ostwald ripening. Hansen et al. [96] used an in-situ TEM technique to
investigate the mechanism of sintering of nanoparticles. They suggested the presence of
three phases of sintering. During phase I, the catalyst rapidly lost its catalytic activity
due to the Ostwald ripening mechanism. During phase II, slowdown of sintering was
observed. They reported the combination of particle migration and Ostwald ripening
was observed in this phase. During phase III, stable catalytic activity was observed after
particle growth and support restructuring.
Figure 5-18 TGA-TPO and DTG-TPO results showing the effect of temperature on
reacted 10 wt.% Ni-dolomite catalyst during the pyrolysis-gasification of rice husk
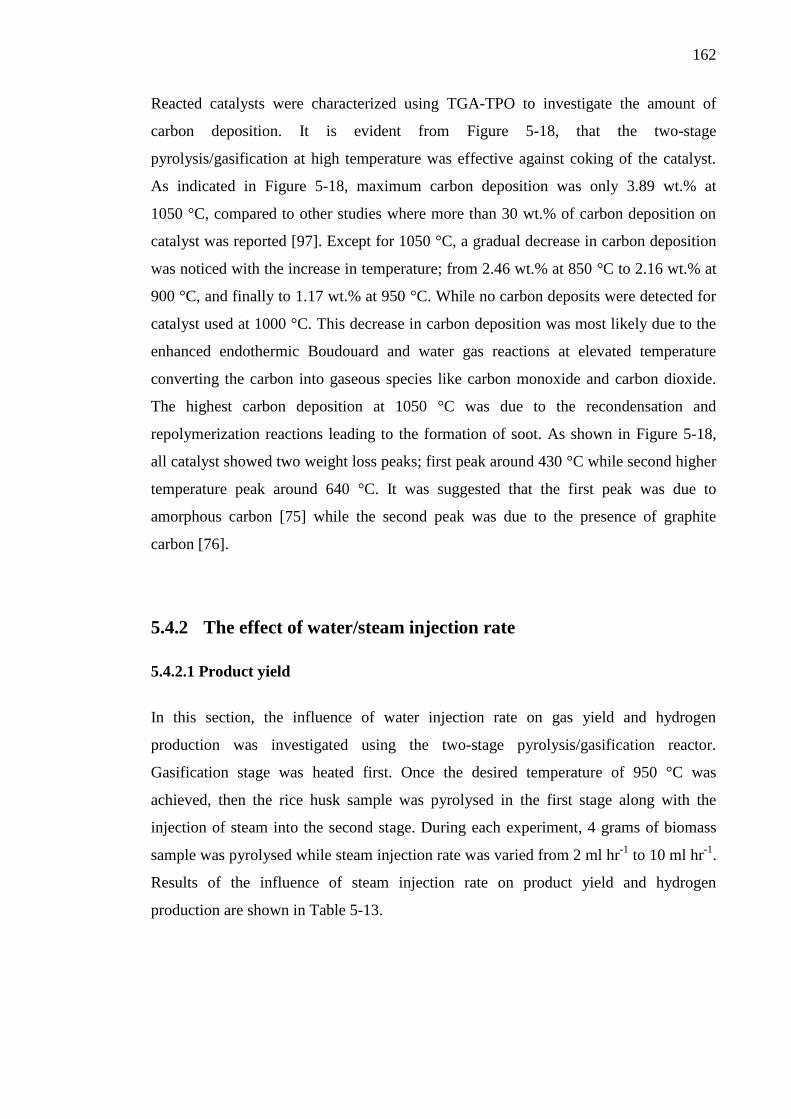
162
Reacted catalysts were characterized using TGA-TPO to investigate the amount of
carbon deposition. It is evident from Figure 5-18, that the two-stage
pyrolysis/gasification at high temperature was effective against coking of the catalyst.
As indicated in Figure 5-18, maximum carbon deposition was only 3.89 wt.% at
1050 °C, compared to other studies where more than 30 wt.% of carbon deposition on
catalyst was reported [97]. Except for 1050 °C, a gradual decrease in carbon deposition
was noticed with the increase in temperature; from 2.46 wt.% at 850 °C to 2.16 wt.% at
900 °C, and finally to 1.17 wt.% at 950 °C. While no carbon deposits were detected for
catalyst used at 1000 °C. This decrease in carbon deposition was most likely due to the
enhanced endothermic Boudouard and water gas reactions at elevated temperature
converting the carbon into gaseous species like carbon monoxide and carbon dioxide.
The highest carbon deposition at 1050 °C was due to the recondensation and
repolymerization reactions leading to the formation of soot. As shown in Figure 5-18,
all catalyst showed two weight loss peaks; first peak around 430 °C while second higher
temperature peak around 640 °C. It was suggested that the first peak was due to
amorphous carbon [75] while the second peak was due to the presence of graphite
carbon [76].
5.4.2 The effect of water/steam injection rate
5.4.2.1 Product yield
In this section, the influence of water injection rate on gas yield and hydrogen
production was investigated using the two-stage pyrolysis/gasification reactor.
Gasification stage was heated first. Once the desired temperature of 950 °C was
achieved, then the rice husk sample was pyrolysed in the first stage along with the
injection of steam into the second stage. During each experiment, 4 grams of biomass
sample was pyrolysed while steam injection rate was varied from 2 ml hr-1
to 10 ml hr-1
.
Results of the influence of steam injection rate on product yield and hydrogen
production are shown in Table 5-13.
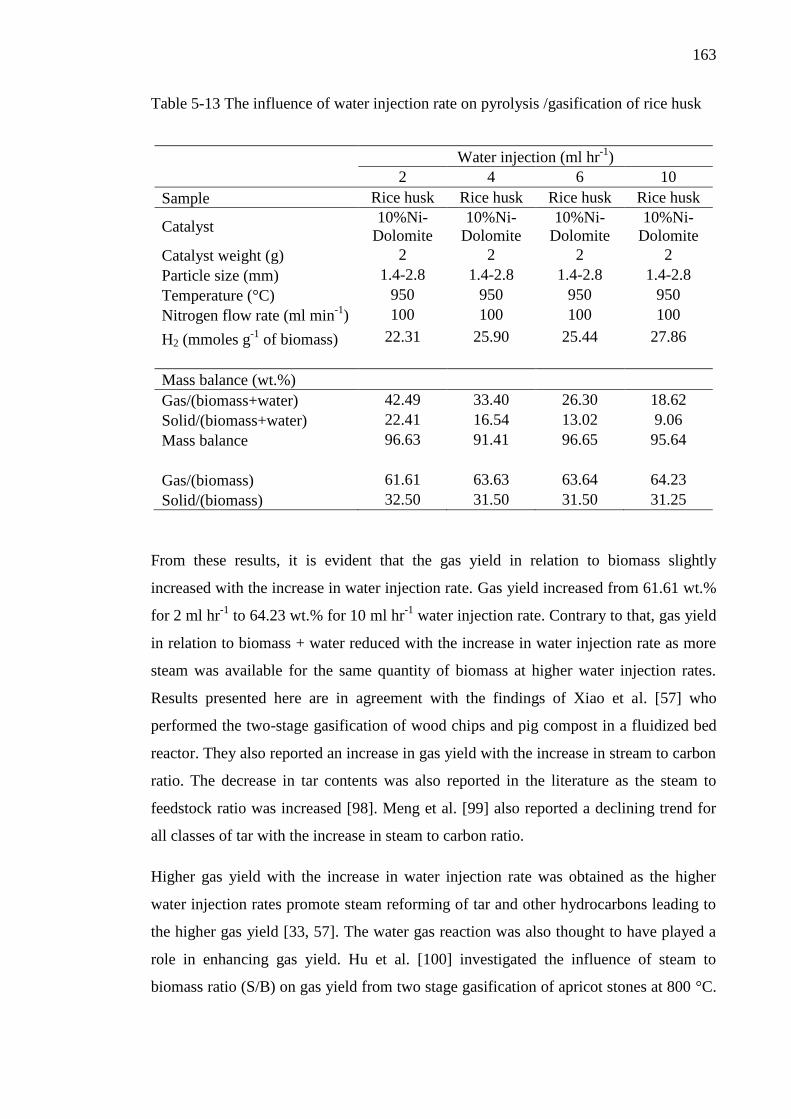
163
Table 5-13 The influence of water injection rate on pyrolysis /gasification of rice husk
Water injection (ml hr-1
)
2 4 6 10
Sample Rice husk Rice husk Rice husk Rice husk
Catalyst 10%Ni-
Dolomite
10%Ni-
Dolomite
10%Ni-
Dolomite
10%Ni-
Dolomite
Catalyst weight (g) 2 2 2 2
Particle size (mm) 1.4-2.8 1.4-2.8 1.4-2.8 1.4-2.8
Temperature (°C) 950 950 950 950
Nitrogen flow rate (ml min-1
) 100 100 100 100
H2 (mmoles g-1
of biomass) 22.31 25.90 25.44 27.86
Mass balance (wt.%)
Gas/(biomass+water) 42.49 33.40 26.30 18.62
Solid/(biomass+water) 22.41 16.54 13.02 9.06
Mass balance 96.63 91.41 96.65 95.64
Gas/(biomass) 61.61 63.63 63.64 64.23
Solid/(biomass) 32.50 31.50 31.50 31.25
From these results, it is evident that the gas yield in relation to biomass slightly
increased with the increase in water injection rate. Gas yield increased from 61.61 wt.%
for 2 ml hr-1
to 64.23 wt.% for 10 ml hr-1
water injection rate. Contrary to that, gas yield
in relation to biomass + water reduced with the increase in water injection rate as more
steam was available for the same quantity of biomass at higher water injection rates.
Results presented here are in agreement with the findings of Xiao et al. [57] who
performed the two-stage gasification of wood chips and pig compost in a fluidized bed
reactor. They also reported an increase in gas yield with the increase in stream to carbon
ratio. The decrease in tar contents was also reported in the literature as the steam to
feedstock ratio was increased [98]. Meng et al. [99] also reported a declining trend for
all classes of tar with the increase in steam to carbon ratio.
Higher gas yield with the increase in water injection rate was obtained as the higher
water injection rates promote steam reforming of tar and other hydrocarbons leading to
the higher gas yield [33, 57]. The water gas reaction was also thought to have played a
role in enhancing gas yield. Hu et al. [100] investigated the influence of steam to
biomass ratio (S/B) on gas yield from two stage gasification of apricot stones at 800 °C.
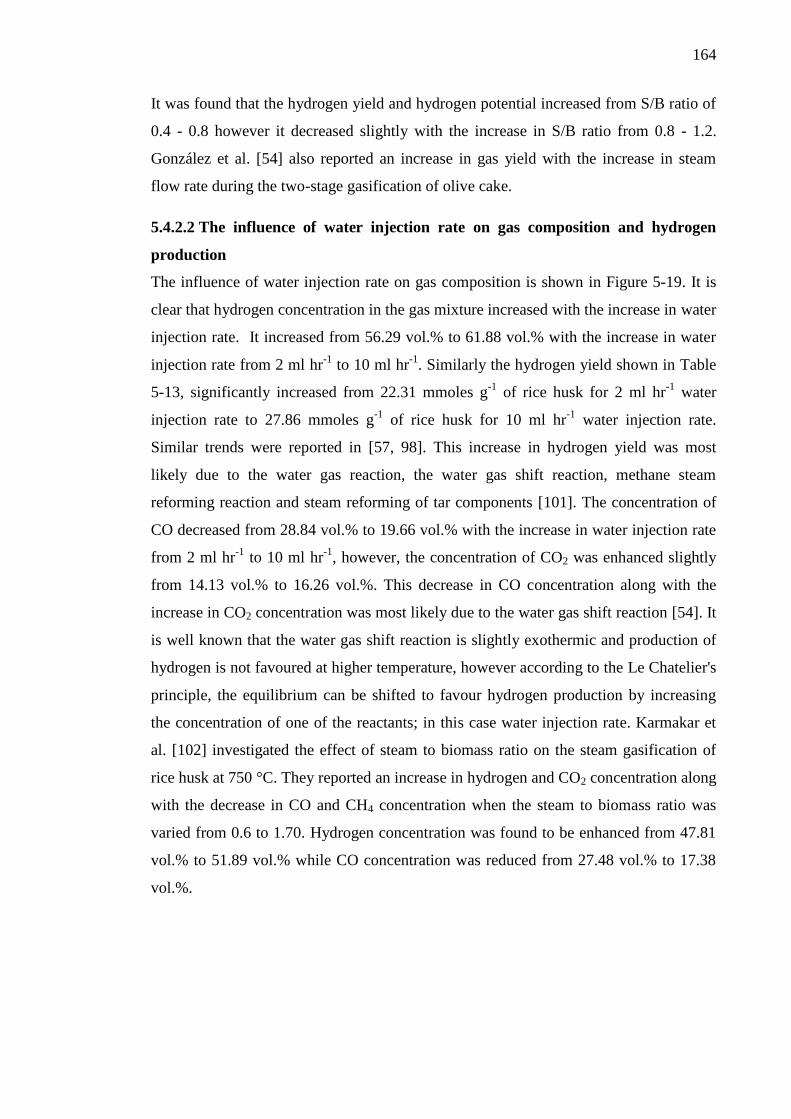
164
It was found that the hydrogen yield and hydrogen potential increased from S/B ratio of
0.4 - 0.8 however it decreased slightly with the increase in S/B ratio from 0.8 - 1.2.
González et al. [54] also reported an increase in gas yield with the increase in steam
flow rate during the two-stage gasification of olive cake.
5.4.2.2 The influence of water injection rate on gas composition and hydrogen
production
The influence of water injection rate on gas composition is shown in Figure 5-19. It is
clear that hydrogen concentration in the gas mixture increased with the increase in water
injection rate. It increased from 56.29 vol.% to 61.88 vol.% with the increase in water
injection rate from 2 ml hr-1
to 10 ml hr-1
. Similarly the hydrogen yield shown in Table
5-13, significantly increased from 22.31 mmoles g-1
of rice husk for 2 ml hr-1
water
injection rate to 27.86 mmoles g-1
of rice husk for 10 ml hr-1
water injection rate.
Similar trends were reported in [57, 98]. This increase in hydrogen yield was most
likely due to the water gas reaction, the water gas shift reaction, methane steam
reforming reaction and steam reforming of tar components [101]. The concentration of
CO decreased from 28.84 vol.% to 19.66 vol.% with the increase in water injection rate
from 2 ml hr-1
to 10 ml hr-1
, however, the concentration of CO2 was enhanced slightly
from 14.13 vol.% to 16.26 vol.%. This decrease in CO concentration along with the
increase in CO2 concentration was most likely due to the water gas shift reaction [54]. It
is well known that the water gas shift reaction is slightly exothermic and production of
hydrogen is not favoured at higher temperature, however according to the Le Chatelier's
principle, the equilibrium can be shifted to favour hydrogen production by increasing
the concentration of one of the reactants; in this case water injection rate. Karmakar et
al. [102] investigated the effect of steam to biomass ratio on the steam gasification of
rice husk at 750 °C. They reported an increase in hydrogen and CO2 concentration along
with the decrease in CO and CH4 concentration when the steam to biomass ratio was
varied from 0.6 to 1.70. Hydrogen concentration was found to be enhanced from 47.81
vol.% to 51.89 vol.% while CO concentration was reduced from 27.48 vol.% to 17.38
vol.%.
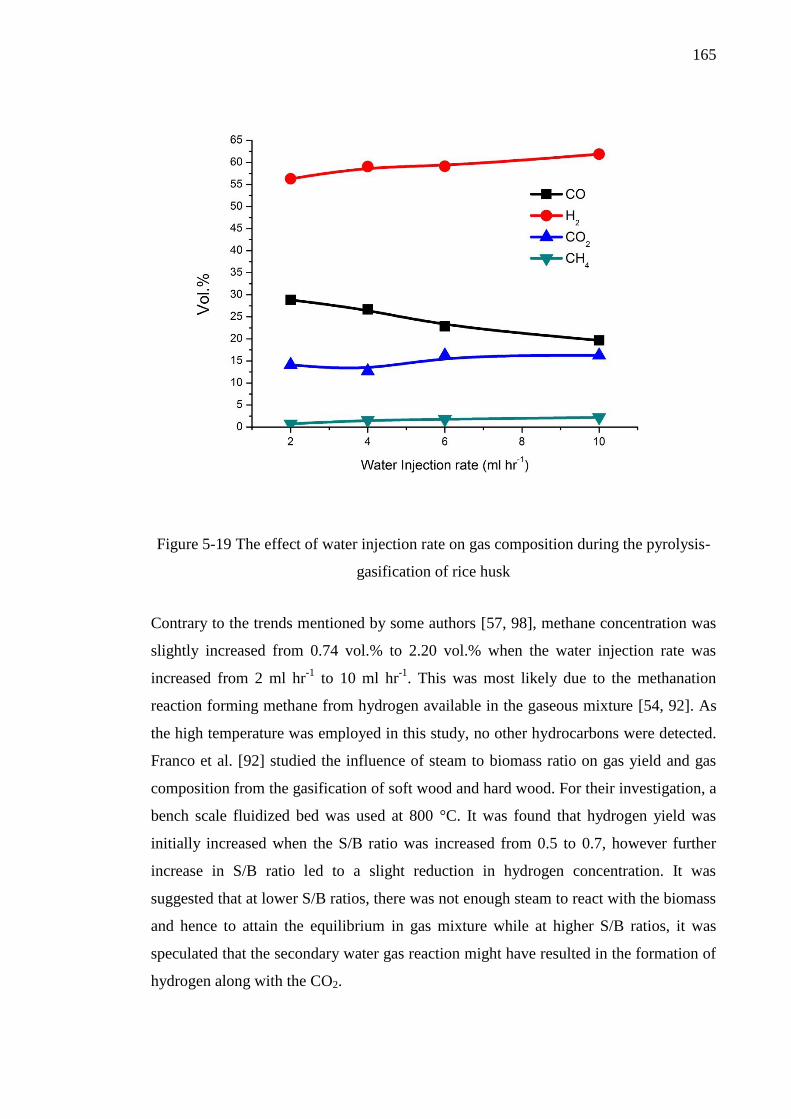
165
Figure 5-19 The effect of water injection rate on gas composition during the pyrolysis-
gasification of rice husk
Contrary to the trends mentioned by some authors [57, 98], methane concentration was
slightly increased from 0.74 vol.% to 2.20 vol.% when the water injection rate was
increased from 2 ml hr-1
to 10 ml hr-1
. This was most likely due to the methanation
reaction forming methane from hydrogen available in the gaseous mixture [54, 92]. As
the high temperature was employed in this study, no other hydrocarbons were detected.
Franco et al. [92] studied the influence of steam to biomass ratio on gas yield and gas
composition from the gasification of soft wood and hard wood. For their investigation, a
bench scale fluidized bed was used at 800 °C. It was found that hydrogen yield was
initially increased when the S/B ratio was increased from 0.5 to 0.7, however further
increase in S/B ratio led to a slight reduction in hydrogen concentration. It was
suggested that at lower S/B ratios, there was not enough steam to react with the biomass
and hence to attain the equilibrium in gas mixture while at higher S/B ratios, it was
speculated that the secondary water gas reaction might have resulted in the formation of
hydrogen along with the CO2.
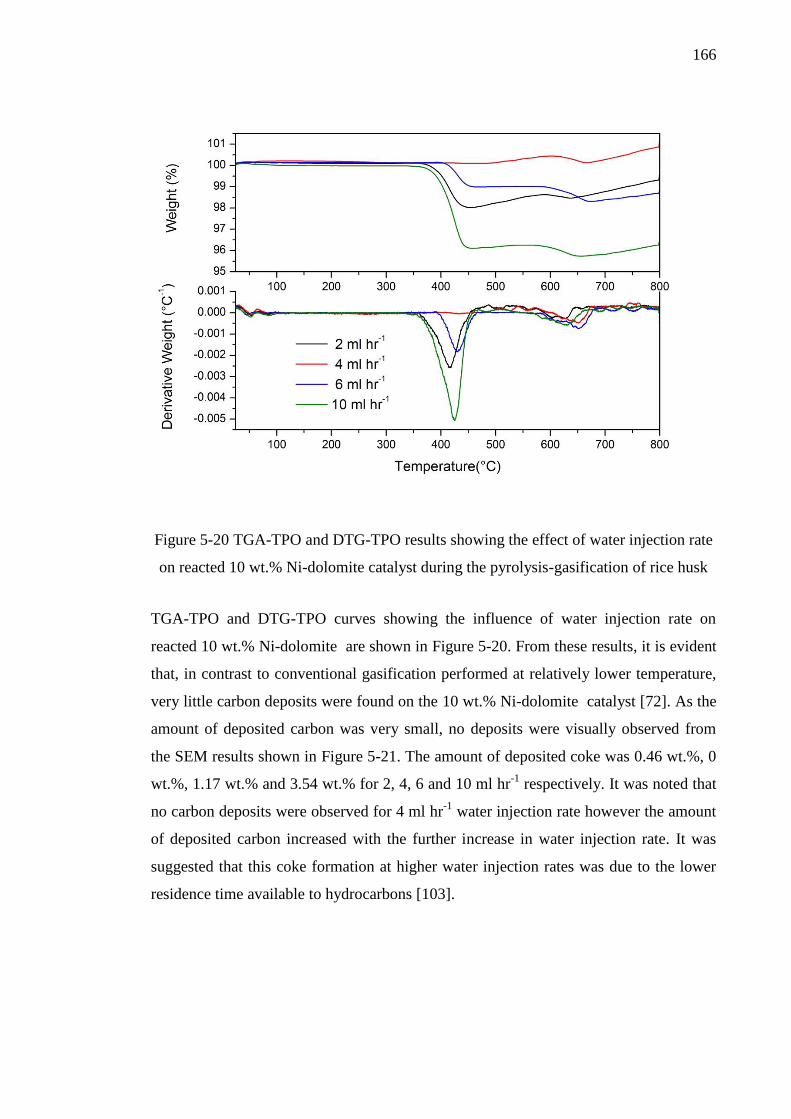
166
Figure 5-20 TGA-TPO and DTG-TPO results showing the effect of water injection rate
on reacted 10 wt.% Ni-dolomite catalyst during the pyrolysis-gasification of rice husk
TGA-TPO and DTG-TPO curves showing the influence of water injection rate on
reacted 10 wt.% Ni-dolomite are shown in Figure 5-20. From these results, it is evident
that, in contrast to conventional gasification performed at relatively lower temperature,
very little carbon deposits were found on the 10 wt.% Ni-dolomite catalyst [72]. As the
amount of deposited carbon was very small, no deposits were visually observed from
the SEM results shown in Figure 5-21. The amount of deposited coke was 0.46 wt.%, 0
wt.%, 1.17 wt.% and 3.54 wt.% for 2, 4, 6 and 10 ml hr-1
respectively. It was noted that
no carbon deposits were observed for 4 ml hr-1
water injection rate however the amount
of deposited carbon increased with the further increase in water injection rate. It was
suggested that this coke formation at higher water injection rates was due to the lower
residence time available to hydrocarbons [103].
167
Figure 5-21 SEM images of reacted catalysts showing the effect of water injection rate
(a) reacted 10 wt.% Ni-dolomite at 2 ml hr-1
, (b) at 4 ml hr-1
, (c) at 6 ml hr-1
and (d) at
10 ml hr-1
From the DTG-TPO results shown in Figure 5-20, two oxidation peaks were observed.
The second oxidation peak around 630 °C (most likely due to graphite carbon) was not
affected by the water injection rate [104]. However the first oxidation peak observed
around 430 °C (most likely due to amorphous carbon) was initially decreased at 2 ml hr-
1 water injection rate to 4 ml hr
-1 however with the further increase in water injection
rate, higher carbon deposits were observed. It has been reported that compared to the
aliphatic hydrocarbons, aromatic compounds have extremely higher tendency to form
coke [105].
(a) (b)
(d) (c)
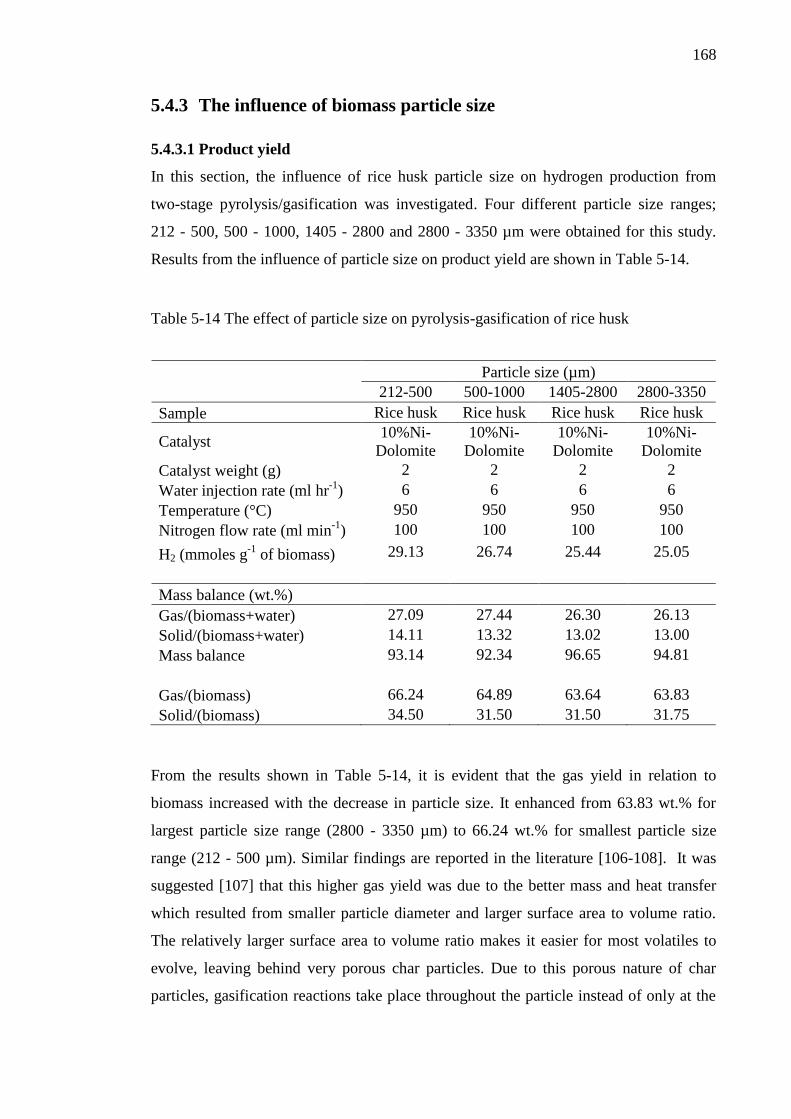
168
5.4.3 The influence of biomass particle size
5.4.3.1 Product yield
In this section, the influence of rice husk particle size on hydrogen production from
two-stage pyrolysis/gasification was investigated. Four different particle size ranges;
212 - 500, 500 - 1000, 1405 - 2800 and 2800 - 3350 µm were obtained for this study.
Results from the influence of particle size on product yield are shown in Table 5-14.
Table 5-14 The effect of particle size on pyrolysis-gasification of rice husk
Particle size (µm)
212-500 500-1000 1405-2800 2800-3350
Sample Rice husk Rice husk Rice husk Rice husk
Catalyst 10%Ni-
Dolomite
10%Ni-
Dolomite
10%Ni-
Dolomite
10%Ni-
Dolomite
Catalyst weight (g) 2 2 2 2
Water injection rate (ml hr-1
) 6 6 6 6
Temperature (°C) 950 950 950 950
Nitrogen flow rate (ml min-1
) 100 100 100 100
H2 (mmoles g-1
of biomass) 29.13 26.74 25.44 25.05
Mass balance (wt.%)
Gas/(biomass+water) 27.09 27.44 26.30 26.13
Solid/(biomass+water) 14.11 13.32 13.02 13.00
Mass balance 93.14 92.34 96.65 94.81
Gas/(biomass) 66.24 64.89 63.64 63.83
Solid/(biomass) 34.50 31.50 31.50 31.75
From the results shown in Table 5-14, it is evident that the gas yield in relation to
biomass increased with the decrease in particle size. It enhanced from 63.83 wt.% for
largest particle size range (2800 - 3350 µm) to 66.24 wt.% for smallest particle size
range (212 - 500 µm). Similar findings are reported in the literature [106-108]. It was
suggested [107] that this higher gas yield was due to the better mass and heat transfer
which resulted from smaller particle diameter and larger surface area to volume ratio.
The relatively larger surface area to volume ratio makes it easier for most volatiles to
evolve, leaving behind very porous char particles. Due to this porous nature of char
particles, gasification reactions take place throughout the particle instead of only at the
169
surface, hence the rate of reaction are controlled by chemical kinetic instead of heat and
mass transfer [107]. It was mentioned by Babu et al. [109] that less time is required for
the complete conversion of smaller particles. Li et al. [110] investigated the influence of
particle size in a two-stage system. Gasification temperature was 800 °C while
temperature of the catalyst bed was maintained at 850 °C. A steam to biomass ratio of
1.33 was used in their study. Four different groups of particle sizes; 5 - 2, 2 - 1, 1 - 0.15
and < 0.15 mm were investigated. It was reported that the gas yield increased from 2.16
to 2.41 m3 kg
-1 when the particle size was reduced from 5 mm to < 0.15 mm.
For larger particle sizes, gasification reactions are controlled by heat and mass transfer
[111]. Greater heat resistance on these large particles creates a temperature gradient
[112]. This temperature gradient causes the reactions to takes place only at the surface
of the particle which results in more char and tar with lower carbon conversion
efficiency. Hernández et al. [106] investigated the influence of particle size on gas yield
and carbon conversion of marc (solid remains) of grapes using an entrained flow
reactor. They reported higher fuel conversion for smaller particles. Fuel conversion was
increased from 57.5 % for 8 mm particle size to 91.4 % for 0.5 mm particle size. It was
suggested that the smaller particle size leads to the higher release of volatiles along with
the better conversion of fixed carbon. Proximate analysis of char-ash residue indicated
that the higher volatiles and fixed carbon contents were present in larger particle sizes of
8 mm while higher ash with the lowest fixed carbon and volatiles were obtained from
the smallest particle size of 0.5 mm.
Luo et al. [107] investigated the effect of particle size and temperature on the steam
gasification of pine sawdust in a laboratory-scale fixed bed reactor. They indicated that
with the decrease in particle size, gas yield and carbon conversion efficiency increased.
A decrease in tar and char contents was also reported. In their study, they plotted the
influence of temperature on gas yield for each particle size. It was interesting to notice
that for different particle sizes, the difference in gas yield was evident at lower
temperature of 600 °C while these curves tended to merge at the higher temperature of
900 °C. It was suggested that this convergence was due to the increase in effective
thermal conductivity at higher temperatures.
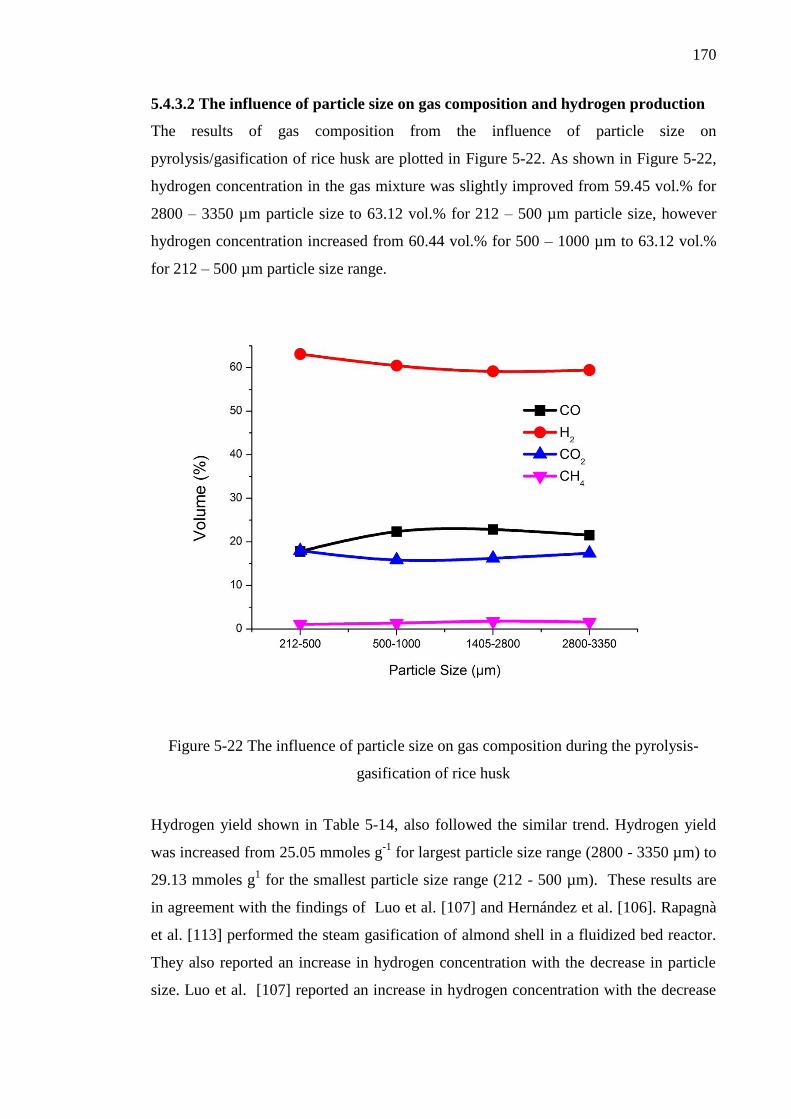
170
5.4.3.2 The influence of particle size on gas composition and hydrogen production
The results of gas composition from the influence of particle size on
pyrolysis/gasification of rice husk are plotted in Figure 5-22. As shown in Figure 5-22,
hydrogen concentration in the gas mixture was slightly improved from 59.45 vol.% for
2800 – 3350 µm particle size to 63.12 vol.% for 212 – 500 µm particle size, however
hydrogen concentration increased from 60.44 vol.% for 500 – 1000 µm to 63.12 vol.%
for 212 – 500 µm particle size range.
Figure 5-22 The influence of particle size on gas composition during the pyrolysis-
gasification of rice husk
Hydrogen yield shown in Table 5-14, also followed the similar trend. Hydrogen yield
was increased from 25.05 mmoles g-1
for largest particle size range (2800 - 3350 µm) to
29.13 mmoles g1 for the smallest particle size range (212 - 500 µm). These results are
in agreement with the findings of Luo et al. [107] and Hernández et al. [106]. Rapagnà
et al. [113] performed the steam gasification of almond shell in a fluidized bed reactor.
They also reported an increase in hydrogen concentration with the decrease in particle
size. Luo et al. [107] reported an increase in hydrogen concentration with the decrease
171
in particle size. It was suggested that this increase in hydrogen concentration was due to
the enhanced gas phase reaction due to the larger surface area to volume ratio of smaller
particles. Other reactions such as the water gas shift reaction and water gas reaction also
had played a significant role in improving hydrogen yield. It was suggested that the
smaller biomass particles pyrolysed sufficiently and more volatiles were released [111].
Due to the higher temperature used in the current study, the influence of particle size on
hydrogen production was not very evident. Zou et al. [114] also reported that during
their investigations, particle size did not show a significant influence on a two stage
pyrolysis gasification system.
When the particle size was reduced from 2800 - 3350 µm to 212 - 500 µm, the
concentration of CO and CH4 slightly reduced from 21.53 vol.% to 17.81 vol.% and
from 1.62 vol.% to 1.08 vol.% respectively. Li et al. [110] also investigated the
influence of particle size on gas composition during the two-stage pyrolysis/gasification
of palm oil waste. They reported a slight decrease in CO and CH4 concentrations with
the decrease in particle size. The lower CO concentration of 17.81 vol.% along with the
increase in hydrogen and CO2 concentration for the smallest particle size range indicates
the effectiveness of the water gas shift reaction. While the slight reduction in CH4
concentration at higher temperature was most likely due to the methane steam reforming
reaction [115].
5.4.4 The influence of catalyst to sample ratio
5.4.4.1 Product yield
In this section, the influence of catalyst to sample ratio (C/S) on hydrogen production
and gas yield during two-stage pyrolysis/gasification of rice husk was investigated. Four
catalysts to biomass ratios, 0.25, 0.5, 1.0 and 2.0 were researched in this study. During
each experiment, 4 grams of rice husk was pyrolysed in the top reactor; heating up from
ambient temperature to 950 °C at a constant heating rate of 20 °C min-1
. All the volatiles
and gases evolved were gasified in the presence of steam and 10 wt.% Ni-dolomite
catalyst, in the bottom stage reactor already at constant temperature of 950 °C. In order
to investigate the effect of catalyst to biomass ratio, the mass of biomass sample was
kept constant (4 grams) while the weight of catalyst present in the bottom stage was
varied from 1 g, to 2 g, 4 g and to 8 g to obtain C/S ratios of 0.25, 0.5, 1.0 and 2.0
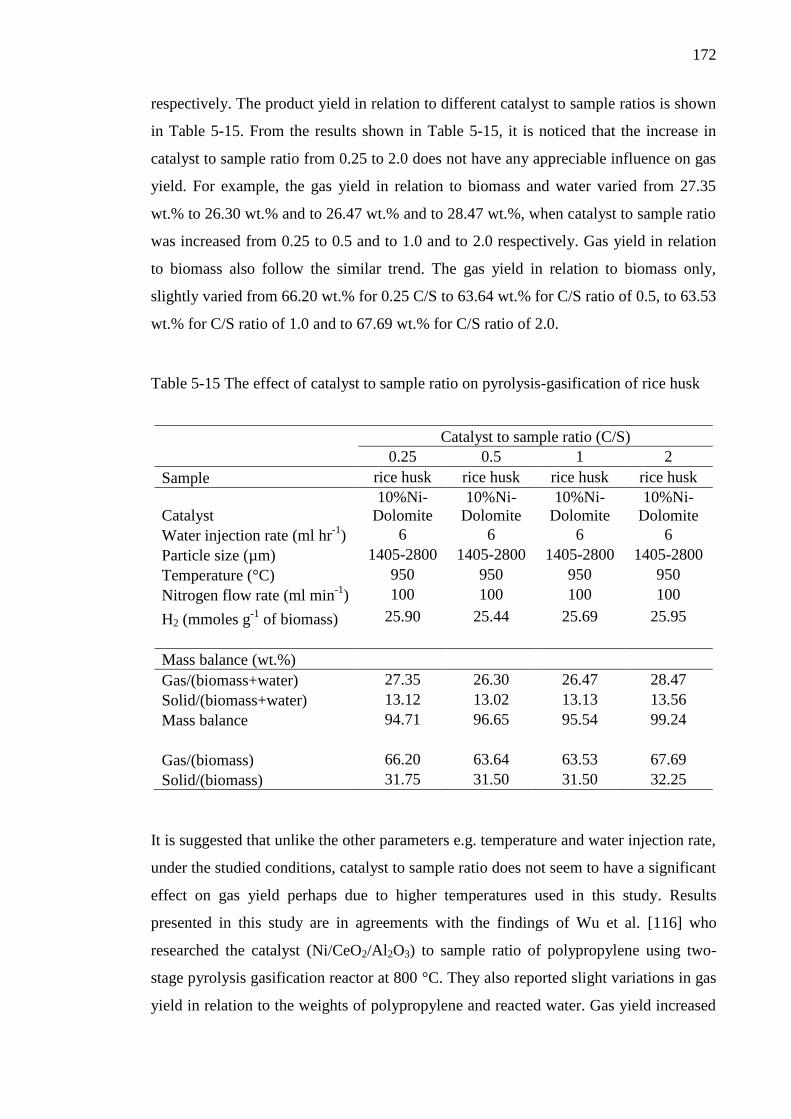
172
respectively. The product yield in relation to different catalyst to sample ratios is shown
in Table 5-15. From the results shown in Table 5-15, it is noticed that the increase in
catalyst to sample ratio from 0.25 to 2.0 does not have any appreciable influence on gas
yield. For example, the gas yield in relation to biomass and water varied from 27.35
wt.% to 26.30 wt.% and to 26.47 wt.% and to 28.47 wt.%, when catalyst to sample ratio
was increased from 0.25 to 0.5 and to 1.0 and to 2.0 respectively. Gas yield in relation
to biomass also follow the similar trend. The gas yield in relation to biomass only,
slightly varied from 66.20 wt.% for 0.25 C/S to 63.64 wt.% for C/S ratio of 0.5, to 63.53
wt.% for C/S ratio of 1.0 and to 67.69 wt.% for C/S ratio of 2.0.
Table 5-15 The effect of catalyst to sample ratio on pyrolysis-gasification of rice husk
Catalyst to sample ratio (C/S)
0.25 0.5 1 2
Sample rice husk rice husk rice husk rice husk
Catalyst
10%Ni-
Dolomite
10%Ni-
Dolomite
10%Ni-
Dolomite
10%Ni-
Dolomite
Water injection rate (ml hr-1
) 6 6 6 6
Particle size (µm) 1405-2800 1405-2800 1405-2800 1405-2800
Temperature (°C) 950 950 950 950
Nitrogen flow rate (ml min-1
) 100 100 100 100
H2 (mmoles g-1
of biomass) 25.90 25.44 25.69 25.95
Mass balance (wt.%)
Gas/(biomass+water) 27.35 26.30 26.47 28.47
Solid/(biomass+water) 13.12 13.02 13.13 13.56
Mass balance 94.71 96.65 95.54 99.24
Gas/(biomass) 66.20 63.64 63.53 67.69
Solid/(biomass) 31.75 31.50 31.50 32.25
It is suggested that unlike the other parameters e.g. temperature and water injection rate,
under the studied conditions, catalyst to sample ratio does not seem to have a significant
effect on gas yield perhaps due to higher temperatures used in this study. Results
presented in this study are in agreements with the findings of Wu et al. [116] who
researched the catalyst (Ni/CeO2/Al2O3) to sample ratio of polypropylene using two-
stage pyrolysis gasification reactor at 800 °C. They also reported slight variations in gas
yield in relation to the weights of polypropylene and reacted water. Gas yield increased
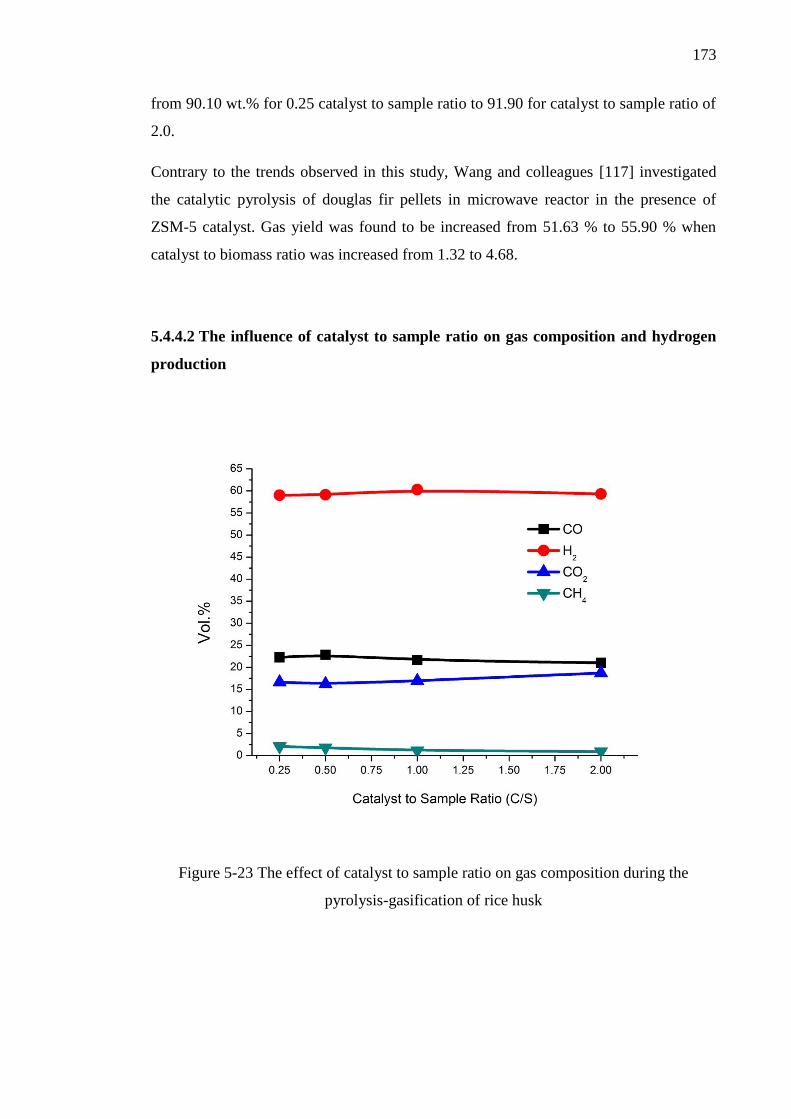
173
from 90.10 wt.% for 0.25 catalyst to sample ratio to 91.90 for catalyst to sample ratio of
2.0.
Contrary to the trends observed in this study, Wang and colleagues [117] investigated
the catalytic pyrolysis of douglas fir pellets in microwave reactor in the presence of
ZSM-5 catalyst. Gas yield was found to be increased from 51.63 % to 55.90 % when
catalyst to biomass ratio was increased from 1.32 to 4.68.
5.4.4.2 The influence of catalyst to sample ratio on gas composition and hydrogen
production
Figure 5-23 The effect of catalyst to sample ratio on gas composition during the
pyrolysis-gasification of rice husk
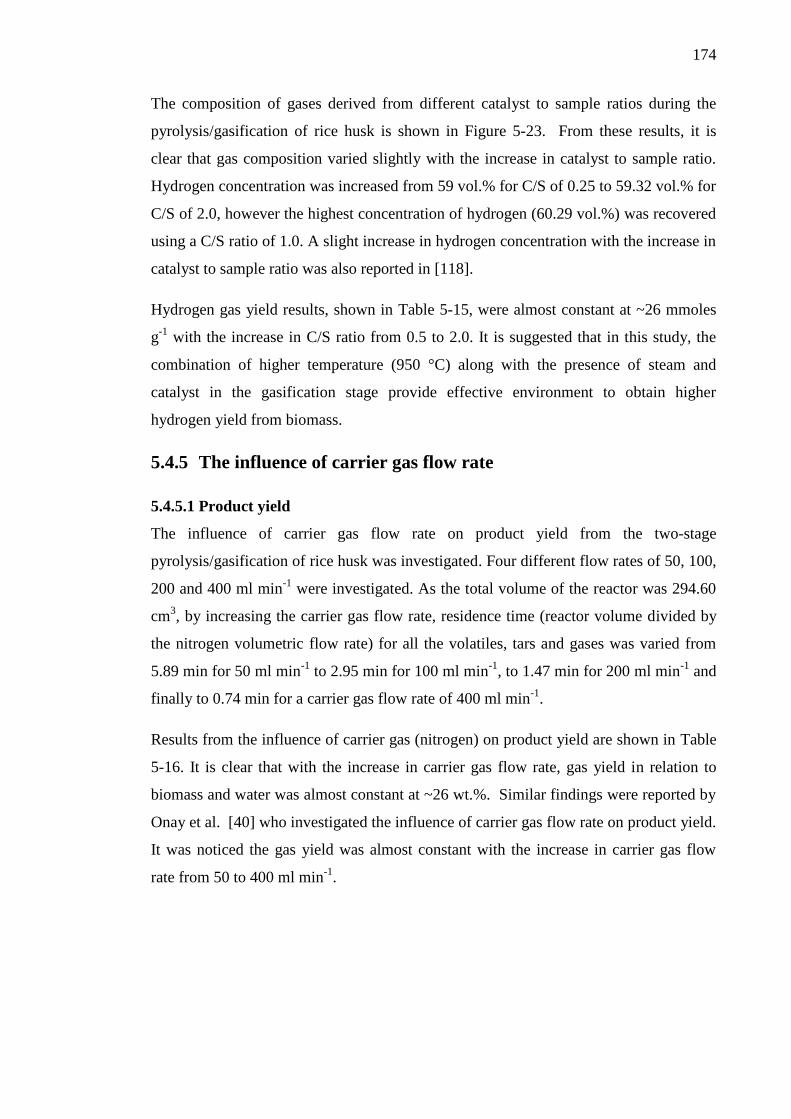
174
The composition of gases derived from different catalyst to sample ratios during the
pyrolysis/gasification of rice husk is shown in Figure 5-23. From these results, it is
clear that gas composition varied slightly with the increase in catalyst to sample ratio.
Hydrogen concentration was increased from 59 vol.% for C/S of 0.25 to 59.32 vol.% for
C/S of 2.0, however the highest concentration of hydrogen (60.29 vol.%) was recovered
using a C/S ratio of 1.0. A slight increase in hydrogen concentration with the increase in
catalyst to sample ratio was also reported in [118].
Hydrogen gas yield results, shown in Table 5-15, were almost constant at ~26 mmoles
g-1
with the increase in C/S ratio from 0.5 to 2.0. It is suggested that in this study, the
combination of higher temperature (950 °C) along with the presence of steam and
catalyst in the gasification stage provide effective environment to obtain higher
hydrogen yield from biomass.
5.4.5 The influence of carrier gas flow rate
5.4.5.1 Product yield
The influence of carrier gas flow rate on product yield from the two-stage
pyrolysis/gasification of rice husk was investigated. Four different flow rates of 50, 100,
200 and 400 ml min-1
were investigated. As the total volume of the reactor was 294.60
cm3, by increasing the carrier gas flow rate, residence time (reactor volume divided by
the nitrogen volumetric flow rate) for all the volatiles, tars and gases was varied from
5.89 min for 50 ml min-1
to 2.95 min for 100 ml min-1
, to 1.47 min for 200 ml min-1
and
finally to 0.74 min for a carrier gas flow rate of 400 ml min-1
.
Results from the influence of carrier gas (nitrogen) on product yield are shown in Table
5-16. It is clear that with the increase in carrier gas flow rate, gas yield in relation to
biomass and water was almost constant at ~26 wt.%. Similar findings were reported by
Onay et al. [40] who investigated the influence of carrier gas flow rate on product yield.
It was noticed the gas yield was almost constant with the increase in carrier gas flow
rate from 50 to 400 ml min-1
.
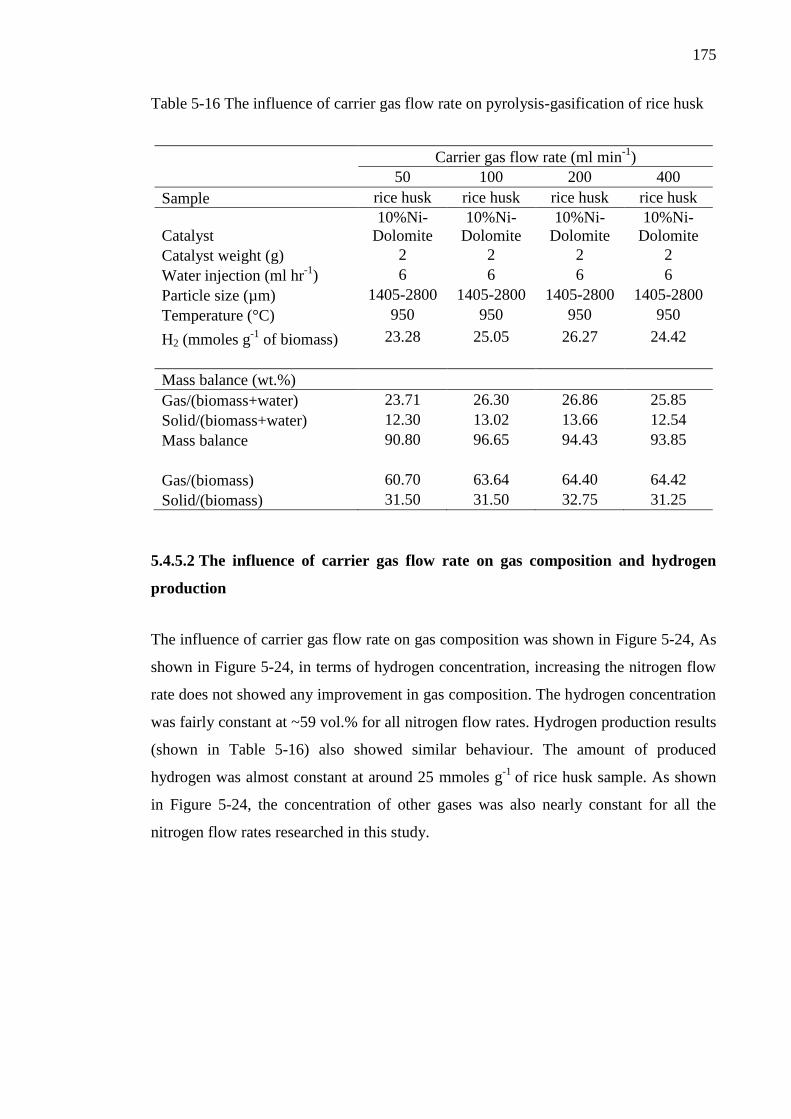
175
Table 5-16 The influence of carrier gas flow rate on pyrolysis-gasification of rice husk
Carrier gas flow rate (ml min-1
)
50 100 200 400
Sample rice husk rice husk rice husk rice husk
Catalyst
10%Ni-
Dolomite
10%Ni-
Dolomite
10%Ni-
Dolomite
10%Ni-
Dolomite
Catalyst weight (g) 2 2 2 2
Water injection (ml hr-1
) 6 6 6 6
Particle size (µm) 1405-2800 1405-2800 1405-2800 1405-2800
Temperature (°C) 950 950 950 950
H2 (mmoles g-1
of biomass) 23.28 25.05 26.27 24.42
Mass balance (wt.%)
Gas/(biomass+water) 23.71 26.30 26.86 25.85
Solid/(biomass+water) 12.30 13.02 13.66 12.54
Mass balance 90.80 96.65 94.43 93.85
Gas/(biomass) 60.70 63.64 64.40 64.42
Solid/(biomass) 31.50 31.50 32.75 31.25
5.4.5.2 The influence of carrier gas flow rate on gas composition and hydrogen
production
The influence of carrier gas flow rate on gas composition was shown in Figure 5-24, As
shown in Figure 5-24, in terms of hydrogen concentration, increasing the nitrogen flow
rate does not showed any improvement in gas composition. The hydrogen concentration
was fairly constant at ~59 vol.% for all nitrogen flow rates. Hydrogen production results
(shown in Table 5-16) also showed similar behaviour. The amount of produced
hydrogen was almost constant at around 25 mmoles g-1
of rice husk sample. As shown
in Figure 5-24, the concentration of other gases was also nearly constant for all the
nitrogen flow rates researched in this study.
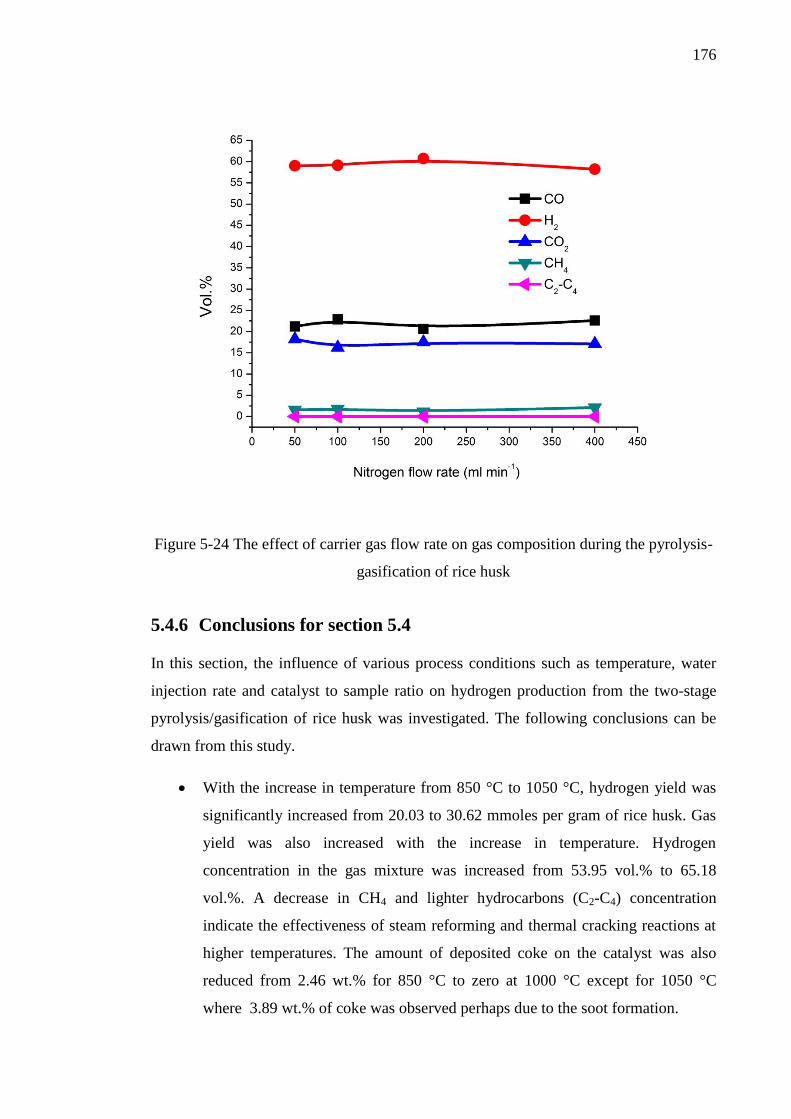
176
Figure 5-24 The effect of carrier gas flow rate on gas composition during the pyrolysis-
gasification of rice husk
5.4.6 Conclusions for section 5.4
In this section, the influence of various process conditions such as temperature, water
injection rate and catalyst to sample ratio on hydrogen production from the two-stage
pyrolysis/gasification of rice husk was investigated. The following conclusions can be
drawn from this study.
With the increase in temperature from 850 °C to 1050 °C, hydrogen yield was
significantly increased from 20.03 to 30.62 mmoles per gram of rice husk. Gas
yield was also increased with the increase in temperature. Hydrogen
concentration in the gas mixture was increased from 53.95 vol.% to 65.18
vol.%. A decrease in CH4 and lighter hydrocarbons (C2-C4) concentration
indicate the effectiveness of steam reforming and thermal cracking reactions at
higher temperatures. The amount of deposited coke on the catalyst was also
reduced from 2.46 wt.% for 850 °C to zero at 1000 °C except for 1050 °C
where 3.89 wt.% of coke was observed perhaps due to the soot formation.
177
With the increase in water injection rate from 2 ml hr-1
to 10 ml hr-1
, hydrogen
yield was considerably increased from 22.31 to 27.86 mmoles per gram of rice
husk. Gas yield in relation to biomass was also increased from 61.61 wt.% to
64.23 wt.%. Hydrogen concentration in the gas mixture was also improved from
56.29 vol.% to 61.88 vol.%.
The influence of biomass particle size on hydrogen production was also
investigated. It was found that with the decrease in particle size from the range
of 2800 - 3350 to 212 - 500 µm, hydrogen yield was improved from 25.05 to
29.13 mmoles per gram of rice husk. Gas yield was also increased with the
decrease in biomass particle size. Hydrogen concentration in the gas mixture
was increased from 59.45 vol.% to 63.12 vol.%. The concentration of CO and
CH4 were slightly reduced however CO2 concentration was almost constant.
No significant differences in hydrogen yield and gas yield were observed when
C/S ratio was varied from 0.25 to 2.0. Hydrogen yield was almost constant at 26
mmoles per gram of rice husk. Hydrogen concentration was also constant
around 60 vol.%. It was suggested that under the studied conditions of higher
temperature in the presence of steam, even the small amount of catalyst was
sufficient for effective gasification of volatiles.
The carrier gas flow rate was varied from 50 to 400 ml min-1
. It was found that
the nitrogen flow rate did not show any influence on gas yield as well as on
hydrogen yield. The hydrogen yield was almost constant at ~25 mmoles g-1
and
gas yield in relation to biomass and water was also constant at ~26 wt.%.
178
5.5 Chapter references
[1] K. Raveendran, A. Ganesh, and K. C. Khilar, "Influence of mineral matter on
biomass pyrolysis characteristics," Fuel, vol. 74, pp. 1812-1822, 1995.
[2] C. Wu, Z. Wang, V. Dupont, J. Huang, and P. T. Williams, "Nickel-catalysed
pyrolysis/gasification of biomass components," Journal of Analytical and
Applied Pyrolysis, vol. 99, pp. 143-148, 1// 2013.
[3] P. T. Williams and S. Besler, "The pyrolysis of rice husks in a
thermogravimetric analyser and static batch reactor," Fuel, vol. 72, pp. 151-159,
1993.
[4] H. Yang, R. Yan, H. Chen, D. H. Lee, and C. Zheng, "Characteristics of
hemicellulose, cellulose and lignin pyrolysis," Fuel, vol. 86, pp. 1781-1788,
2007.
[5] K. Slopiecka, P. Bartocci, and F. Fantozzi, "Thermogravimetric analysis and
kinetic study of poplar wood pyrolysis," Applied Energy.
[6] S. S. Idris, N. A. Rahman, K. Ismail, A. B. Alias, Z. A. Rashid, and M. J. Aris,
"Investigation on thermochemical behaviour of low rank Malaysian coal, oil
palm biomass and their blends during pyrolysis via thermogravimetric analysis
(TGA)," Bioresource Technology, vol. 101, pp. 4584-4592, 2010.
[7] A. Ounas, A. Aboulkas, K. El harfi, A. Bacaoui, and A. Yaacoubi, "Pyrolysis of
olive residue and sugar cane bagasse: Non-isothermal thermogravimetric kinetic
analysis," Bioresource Technology, vol. 102, pp. 11234-11238, 2011.
[8] E. Biagini, A. Fantei, and L. Tognotti, "Effect of the heating rate on the
devolatilization of biomass residues," Thermochimica Acta, vol. 472, pp. 55-63,
2008.
[9] M. Van de Velden, J. Baeyens, A. Brems, B. Janssens, and R. Dewil,
"Fundamentals, kinetics and endothermicity of the biomass pyrolysis reaction,"
Renewable Energy, vol. 35, pp. 232-242, 2010.
[10] A. O. Aboyade, T. J. Hugo, M. Carrier, E. L. Meyer, R. Stahl, J. H. Knoetze, et
al., "Non-isothermal kinetic analysis of the devolatilization of corn cobs and
sugar cane bagasse in an inert atmosphere," Thermochimica Acta, vol. 517, pp.
81-89, 2011.
[11] A. O. Aboyade, J. F. Görgens, M. Carrier, E. L. Meyer, and J. H. Knoetze,
"Thermogravimetric study of the pyrolysis characteristics and kinetics of coal
blends with corn and sugarcane residues," Fuel Processing Technology, vol.
106, pp. 310-320, 2013.
[12] K. S. Shanmukharadhya and K. Ramachandran, "Thermal degradation behaviour
of bagasse particles," Journal of the Energy Institute, vol. 82, pp. 120-122, 2009.
[13] H. Lu, E. Ip, J. Scott, P. Foster, M. Vickers, and L. L. Baxter, "Effects of particle
shape and size on devolatilization of biomass particle," Fuel, vol. 89, pp. 1156-
1168, 2010.
[14] T. Mani, P. Murugan, J. Abedi, and N. Mahinpey, "Pyrolysis of wheat straw in a
thermogravimetric analyzer: Effect of particle size and heating rate on
devolatilization and estimation of global kinetics," Chemical Engineering
Research and Design, vol. 88, pp. 952-958, 2010.
[15] E. Eftimie and E. Segal, "Basic language programs for automatic processing
non-isothermal kinetic data," Thermochimica Acta, vol. 111, pp. 359-367, 1987.
179
[16] I. I. Ahmed and A. K. Gupta, "Hydrogen production from polystyrene pyrolysis
and gasification: Characteristics and kinetics," International Journal of
Hydrogen Energy, vol. 34, pp. 6253-6264, 2009.
[17] A. T. Harris and Z. Zhong, "Non-isothermal thermogravimetric analysis of
plywood wastes under N2, CO2 and O2 atmospheres," Asia-Pacific Journal of
Chemical Engineering, vol. 3, pp. 473-480, 2008.
[18] N. Y. Harun and M. T. Afzal, "Thermal Decomposition Kinetics of Forest
Residue," Journal of Applied Sciences, vol. 10, pp. 1122-7, 2010.
[19] P. Luangkiattikhun, C. Tangsathitkulchai, and M. Tangsathitkulchai, "Non-
isothermal thermogravimetric analysis of oil-palm solid wastes," Bioresource
Technology, vol. 99, pp. 986-997, 2008.
[20] K. G. Mansaray and A. E. Ghaly, "Determination of kinetic parameters of rice
husks in oxygen using thermogravimetric analysis," Biomass and Bioenergy,
vol. 17, pp. 19-31, 1999.
[21] A. Saddawi, . M. ones, A. illiams, and M. A. towicz, " inetics of the
Thermal Decomposition of Biomass," Energy & Fuels, vol. 24, pp. 1274-1282,
2010/02/18 2009.
[22] . b. rhegyi, H. Chen, and S. odoy, "Thermal ecomposition of heat,
Oat, Barley, and Brassica carinata Straws. A Kinetic Study," Energy & Fuels,
vol. 23, pp. 646-652, 2009/02/19 2009.
[23] S. S. Daood, S. Munir, W. Nimmo, and B. M. Gibbs, "Char oxidation study of
sugar cane bagasse, cotton stalk and Pakistani coal under 1% and 3% oxygen
concentrations," Biomass and Bioenergy, vol. 34, pp. 263-271, 2010.
[24] A. S. Jamaluddin, "Estimation of kinetic parameters for char oxidation," Fuel,
vol. 71, pp. 311-317, 3// 1992.
[25] R. H. Hurt and J. M. Calo, "Semi-global intrinsic kinetics for char combustion
modeling," Combustion and Flame, vol. 125, pp. 1138-1149, 5// 2001.
[26] Z. Li, W. Zhao, B. Meng, C. Liu, Q. Zhu, and G. Zhao, "Kinetic study of corn
straw pyrolysis: Comparison of two different three-pseudocomponent models,"
Bioresource Technology, vol. 99, pp. 7616-7622, 2008.
[27] M. X. Xiaodong Zhang, Rongfeng Sun and Li Sun, "Study on Biomass Pyrolysis
Kinetics," Journal of Engineering for Gas Turbines and Power, vol. 128, pp.
493-496, 2006.
[28] K. Sasaki, X. Qiu, Y. Hosomomi, S. Moriyama, and T. Hirajima, "Effect of
natural dolomite calcination temperature on sorption of borate onto calcined
products," Microporous and Mesoporous Materials, vol. 171, pp. 1-8, 2013.
[29] S. Lowell and J. Shields, "Adsorption isotherms," in Powder Surface Area and
Porosity, ed: Springer Netherlands, 1984, pp. 11-13.
[30] K. Sing, D. Everett;, R. Haul;, L. M. ;, R. P. ;, J. R. ;, et al., "Reporting
Physisorption data for Gas/Solid systems with Special Reference to the
Determination of Surface Area and Porosity," Pure and Applied Chemistry, vol.
57, pp. 603-619, 1985.
[31] B. Yoosuk, P. Udomsap, and B. Puttasawat, "Hydration–dehydration technique
for property and activity improvement of calcined natural dolomite in
heterogeneous biodiesel production: Structural transformation aspect," Applied
Catalysis A: General, vol. 395, pp. 87-94, 2011.
[32] É. Kristóf-Makó and A. Z. Juhász, "The effect of mechanical treatment on the
crystal structure and thermal decomposition of dolomite," Thermochimica Acta,
vol. 342, pp. 105-114, 1999.
180
[33] J. Srinakruang, K. Sato, T. Vitidsant, and K. Fujimoto, "Highly efficient sulfur
and coking resistance catalysts for tar gasification with steam," Fuel, vol. 85, pp.
2419-2426, 2006.
[34] J. Srinakruang, K. Sato, T. Vitidsant, and K. Fujimoto, "A highly efficient
catalyst for tar gasification with steam," Catalysis Communications, vol. 6, pp.
437-440, 2005.
[35] M. S. Abu Bakar and J. O. Titiloye, "Catalytic pyrolysis of rice husk for bio-oil
production," Journal of Analytical and Applied Pyrolysis.
[36] Q. Sun, S. Yu, F. Wang, and J. Wang, "Decomposition and gasification of
pyrolysis volatiles from pine wood through a bed of hot char," Fuel, vol. 90, pp.
1041-1048, 2011.
[37] L. Burhenne, J. Messmer, T. Aicher, and M.-P. Laborie, "The effect of the
biomass components lignin, cellulose and hemicellulose on TGA and fixed bed
pyrolysis," Journal of Analytical and Applied Pyrolysis.
[38] E. rtay, "Recent advances in production of hydrogen from biomass," Energy
Conversion and Management, vol. 52, pp. 1778-1789, 2011.
[39] O. Onay and O. Mete Koçkar, "Fixed-bed pyrolysis of rapeseed (Brassica napus
L.)," Biomass and Bioenergy, vol. 26, pp. 289-299, 2004.
[40] O. Onay and O. M. Kockar, "Slow, fast and flash pyrolysis of rapeseed,"
Renewable Energy, vol. 28, pp. 2417-2433, 2003.
[41] M. arc a-Pèrez, A. Chaala, and C. Roy, "Co-pyrolysis of sugarcane bagasse
with petroleum residue. Part II. Product yields and properties," Fuel, vol. 81, pp.
893-907, 2002.
[42] X. Xu, J. Enchen, W. Mingfeng, L. Bosong, and Z. Ling, "Hydrogen production
by catalytic cracking of rice husk over Fe2O3/γ-Al2O3 catalyst," Renewable
Energy, vol. 41, pp. 23-28, 5// 2012.
[43] D. Neves, H. Thunman, A. Matos, L. Tarelho, and A. Gómez-Barea,
"Characterization and prediction of biomass pyrolysis products," Progress in
Energy and Combustion Science, vol. 37, pp. 611-630, 2011.
[44] Y. Chen, H. Yang, X. Wang, S. Zhang, and H. Chen, "Biomass-based pyrolytic
polygeneration system on cotton stalk pyrolysis: Influence of temperature,"
Bioresource Technology, vol. 107, pp. 411-418, 2012.
[45] M. Becidan, Ø. Skreiberg, and J. E. Hustad, "Products distribution and gas
release in pyrolysis of thermally thick biomass residues samples," Journal of
Analytical and Applied Pyrolysis, vol. 78, pp. 207-213, 2007.
[46] Luo, Wang, Liao, and Cen, "Mechanism Study of Cellulose Rapid Pyrolysis,"
Industrial & Engineering Chemistry Research, vol. 43, pp. 5605-5610,
2004/09/01 2004.
[47] J. P. Diebold, "A unified, global model for the pyrolysis of cellulose," Biomass
and Bioenergy, vol. 7, pp. 75-85, // 1994.
[48] J. L. Banyasz, S. Li, J. Lyons-Hart, and K. H. Shafer, "Gas evolution and the
mechanism of cellulose pyrolysis," Fuel, vol. 80, pp. 1757-1763, 10// 2001.
[49] Y.-C. Lin, J. Cho, G. A. Tompsett, P. R. Westmoreland, and G. W. Huber,
"Kinetics and Mechanism of Cellulose Pyrolysis," The Journal of Physical
Chemistry C, vol. 113, pp. 20097-20107, 2009/11/19 2009.
[50] M. Balat, "Mechanisms of Thermochemical Biomass Conversion Processes. Part
1: Reactions of Pyrolysis," Energy Sources, Part A: Recovery, Utilization, and
Environmental Effects, vol. 30, pp. 620-635, 2008/03/03 2008.
[51] E.-J. Shin, M. R. Nimlos, and R. J. Evans, "Kinetic analysis of the gas-phase
pyrolysis of carbohydrates," Fuel, vol. 80, pp. 1697-1709, 10// 2001.
181
[52] F. J. K. a. A. Broido, "Speculations on the nature of cellulose pyrolysis," Pyro-
dynamics, vol. 2, pp. 151-163, 1965.
[53] W. F. Fassinou, L. Van de Steene, S. Toure, G. Volle, and P. Girard, "Pyrolysis
of Pinus pinaster in a two-stage gasifier: Influence of processing parameters and
thermal cracking of tar," Fuel Processing Technology, vol. 90, pp. 75-90, 1//
2009.
[54] J. F. González, S. Román, G. Engo, J. M. Encinar, and G. Martínez, "Reduction
of tars by dolomite cracking during two-stage gasification of olive cake,"
Biomass and Bioenergy, vol. 35, pp. 4324-4330, 10/15/ 2011.
[55] . Šulc, . Što dl, M. Richter, . Popelka, . Svoboda, . Smetana, et al.,
"Biomass waste gasification – Can be the two stage process suitable for tar
reduction and power generation?," Waste Management, vol. 32, pp. 692-700, 4//
2012.
[56] C. Wu, L. Wang, P. T. Williams, J. Shi, and J. Huang, "Hydrogen production
from biomass gasification with Ni/MCM-41 catalysts: Influence of Ni content,"
Applied Catalysis B: Environmental, vol. 108–109, pp. 6-13, 10/11/ 2011.
[57] X. Xiao, X. Meng, D. D. Le, and T. Takarada, "Two-stage steam gasification of
waste biomass in fluidized bed at low temperature: Parametric investigations
and performance optimization," Bioresource Technology, vol. 102, pp. 1975-
1981, 1// 2011.
[58] H. Yang, R. Yan, H. Chen, D. H. Lee, D. T. Liang, and C. Zheng, "Pyrolysis of
palm oil wastes for enhanced production of hydrogen rich gases," Fuel
Processing Technology, vol. 87, pp. 935-942, 2006.
[59] J. Herguido, J. Corella, and J. Gonzalez-Saiz, "Steam gasification of
lignocellulosic residues in a fluidized bed at a small pilot scale. Effect of the
type of feedstock," Industrial & Engineering Chemistry Research, vol. 31, pp.
1274-1282, 1992/05/01 1992.
[60] L. Devi, K. J. Ptasinski, and F. J. J. G. Janssen, "A review of the primary
measures for tar elimination in biomass gasification processes," Biomass and
Bioenergy, vol. 24, pp. 125-140, 2// 2003.
[61] M. Balat, "Mechanisms of Thermochemical Biomass Conversion Processes. Part
2: Reactions of Gasification," Energy Sources, Part A: Recovery, Utilization,
and Environmental Effects, vol. 30, pp. 636-648, 2008/03/03 2008.
[62] I. I. Ahmed and A. K. Gupta, "Sugarcane bagasse gasification: Global reaction
mechanism of syngas evolution," Applied Energy, vol. 91, pp. 75-81, 2012.
[63] C. Xu, J. Donald, E. Byambajav, and Y. Ohtsuka, "Recent advances in catalysts
for hot-gas removal of tar and NH3 from biomass gasification," Fuel, vol. 89,
pp. 1784-1795, 2010.
[64] P. Simell, E. Kurkela, P. Ståhlberg, and J. Hepola, "Catalytic hot gas cleaning of
gasification gas," Catalysis Today, vol. 27, pp. 55-62, 1996.
[65] J. Wang, B. Xiao, S. Liu, Z. Hu, P. He, D. Guo, et al., "Catalytic steam
gasification of pig compost for hydrogen-rich gas production in a fixed bed
reactor," Bioresource Technology.
[66] J. Corella, J. Herguido, J. Gonzalez-Saiz, F. J. Alday, and J. L. Rodriguez-
Trujillo, "Fluidized Bed Steam Gasification of Biomass with Dolomite and with
a Commercial FCC Catalyst," in Research in Thermochemical Biomass
Conversion, A. V. Bridgwater and J. L. Kuester, Eds., ed: Springer Netherlands,
1988, pp. 754-765.
[67] A. Olivares, M. P. Aznar, M. A. Caballero, J. Gil, E. Francés, and J. Corella,
"Biomass asification: Produced as Upgrading by In-Bed Use of Dolomite,"
182
Industrial & Engineering Chemistry Research, vol. 36, pp. 5220-5226,
1997/12/01 1997.
[68] S. Rapagnà, N. Jand, and P. U. Foscolo, "Catalytic gasification of biomass to
produce hydrogen rich gas," International Journal of Hydrogen Energy, vol. 23,
pp. 551-557, 1998.
[69] I. F. Elbaba and P. T. Williams, "High yield hydrogen from the pyrolysis–
catalytic gasification of waste tyres with a nickel/dolomite catalyst," Fuel, vol.
106, pp. 528-536, 2013.
[70] A. Corujo, L. Yermán, B. Arizaga, M. Brusoni, and J. Castiglioni, "Improved
yield parameters in catalytic steam gasification of forestry residue; optimizing
biomass feed rate and catalyst type," Biomass and Bioenergy, vol. 34, pp. 1695-
1702, 2010.
[71] P. H. Blanco, C. Wu, J. A. Onwudili, and P. T. Williams, "Characterization and
evaluation of Ni/SiO2 catalysts for hydrogen production and tar reduction from
catalytic steam pyrolysis-reforming of RDF," Applied Catalysis B:
Environmental.
[72] I. F. Elbaba, C. Wu, and P. T. Williams, "Hydrogen production from the
pyrolysis–gasification of waste tyres with a nickel/cerium catalyst,"
International Journal of Hydrogen Energy, vol. 36, pp. 6628-6637, 6// 2011.
[73] C. Wu, Z. Wang, J. Huang, and P. T. Williams, "Pyrolysis/gasification of
cellulose, hemicellulose and lignin for hydrogen production in the presence of
various nickel-based catalysts," Fuel, vol. 106, pp. 697-706, 2013.
[74] C. Wu and P. T. Williams, "A novel Ni–Mg–Al–CaO catalyst with the dual
functions of catalysis and CO2 sorption for H2 production from the pyrolysis–
gasification of polypropylene," Fuel, vol. 89, pp. 1435-1441, 7// 2010.
[75] S. Wang, "A Comprehensive Study on Carbon Dioxide Reforming of Methane
over Ni/γ-Al2O3 Catalysts," Industrial & Engineering Chemistry Research, vol.
38, pp. 2615-2625, 1999/07/01 1999.
[76] M. A. Goula, A. A. Lemonidou, and A. M. Efstathiou, "Characterization of
Carbonaceous Species Formed during Reforming of CH4with CO2over
Ni/CaO–Al2O3Catalysts Studied by Various Transient Techniques," Journal of
Catalysis, vol. 161, pp. 626-640, 1996.
[77] J. Sehested, "Four challenges for nickel steam-reforming catalysts," Catalysis
Today, vol. 111, pp. 103-110, 2006.
[78] P. Wang, E. Tanabe, K. Ito, J. Jia, H. Morioka, T. Shishido, et al., "Filamentous
carbon prepared by the catalytic pyrolysis of CH4 on Ni/SiO2," Applied
Catalysis A: General, vol. 231, pp. 35-44, 2002.
[79] S. Natesakhawat, R. B. Watson, X. Wang, and U. S. Ozkan, "Deactivation
characteristics of lanthanide-promoted sol–gel Ni/Al2O3 catalysts in propane
steam reforming," Journal of Catalysis, vol. 234, pp. 496-508, 2005.
[80] V. C. H. Kroll, H. M. Swaan, and C. Mirodatos, "Methane Reforming Reaction
with Carbon Dioxide Over Ni/SiO2Catalyst: I. Deactivation Studies," Journal of
Catalysis, vol. 161, pp. 409-422, 1996.
[81] L. ępiński, B. Stasińska, and T. Borowiecki, "Carbon deposition on Ni/Al2O3
catalysts doped with small amounts of molybdenum," Carbon, vol. 38, pp. 1845-
1856, 2000.
[82] D. L. Trimm, "Catalysts for the control of coking during steam reforming,"
Catalysis Today, vol. 49, pp. 3-10, 1999.
[83] C. Wu and P. T. Williams, "Investigation of coke formation on Ni-Mg-Al
catalyst for hydrogen production from the catalytic steam pyrolysis-gasification
183
of polypropylene," Applied Catalysis B: Environmental, vol. 96, pp. 198-207,
4/26/ 2010.
[84] L. Emami Taba, M. F. Irfan, W. A. M. Wan Daud, and M. H. Chakrabarti, "The
effect of temperature on various parameters in coal, biomass and CO-
gasification: A review," Renewable and Sustainable Energy Reviews, vol. 16,
pp. 5584-5596, 2012.
[85] Q. Xie, S. Kong, Y. Liu, and H. Zeng, "Syngas production by two-stage method
of biomass catalytic pyrolysis and gasification," Bioresource Technology, vol.
110, pp. 603-609, 4// 2012.
[86] S. Septien, S. Valin, C. Dupont, M. Peyrot, and S. Salvador, "Effect of particle
size and temperature on woody biomass fast pyrolysis at high temperature
(1000–1400°C)," Fuel, vol. 97, pp. 202-210, 2012.
[87] K. Qin, W. Lin, P. A. Jensen, and A. D. Jensen, "High-temperature entrained
flow gasification of biomass," Fuel, vol. 93, pp. 589-600, 2012.
[88] J. J. Hernández, R. Ballesteros, and G. Aranda, "Characterisation of tars from
biomass gasification: Effect of the operating conditions," Energy, vol. 50, pp.
333-342, 2013.
[89] L. Devi, K. J. Ptasinski, F. J. J. G. Janssen, S. V. B. van Paasen, P. C. A.
Bergman, and J. H. A. Kiel, "Catalytic decomposition of biomass tars: use of
dolomite and untreated olivine," Renewable Energy, vol. 30, pp. 565-587, 2005.
[90] V. Skoulou, A. Swiderski, W. Yang, and A. Zabaniotou, "Process characteristics
and products of olive kernel high temperature steam gasification (HTSG),"
Bioresource Technology, vol. 100, pp. 2444-2451, 2009.
[91] P. Lahijani and Z. A. Zainal, "Gasification of palm empty fruit bunch in a
bubbling fluidized bed: A performance and agglomeration study," Bioresource
Technology, vol. 102, pp. 2068-2076, 2011.
[92] C. Franco, F. Pinto, I. Gulyurtlu, and I. Cabrita, "The study of reactions
influencing the biomass steam gasification process," Fuel, vol. 82, pp. 835-842,
2003.
[93] J. Sehested, J. A. P. Gelten, I. N. Remediakis, H. Bengaard, and J. K. Nørskov,
"Sintering of nickel steam-reforming catalysts: effects of temperature and steam
and hydrogen pressures," Journal of Catalysis, vol. 223, pp. 432-443, 2004.
[94] J. Sehested, "Sintering of nickel steam-reforming catalysts," Journal of
Catalysis, vol. 217, pp. 417-426, 2003.
[95] J. Sehested, J. A. P. Gelten, and S. Helveg, "Sintering of nickel catalysts: Effects
of time, atmosphere, temperature, nickel-carrier interactions, and dopants,"
Applied Catalysis A: General, vol. 309, pp. 237-246, 2006.
[96] T. W. Hansen, A. T. DeLaRiva, S. R. Challa, and A. K. Datye, "Sintering of
Catalytic Nanoparticles: Particle Migration or Ostwald Ripening?," Accounts of
Chemical Research, 2013.
[97] I. F. Elbaba, C. Wu, and P. T. Williams, "Catalytic Pyrolysis-Gasification of
Waste Tire and Tire Elastomers for Hydrogen Production," Energy & Fuels, vol.
24, pp. 3928-3935, 2010/07/15 2010.
[98] X. Xiao, D. D. Le, K. Morishita, S. Zhang, L. Li, and T. Takarada, "Multi-stage
biomass gasification in Internally Circulating Fluidized-bed Gasifier (ICFG):
Test operation of animal-waste-derived biomass and parametric investigation at
low temperature," Fuel Processing Technology, vol. 91, pp. 895-902, 2010.
[99] X. Meng, W. de Jong, N. Fu, and A. H. M. Verkooijen, "Biomass gasification in
a 100 kWth steam-oxygen blown circulating fluidized bed gasifier: Effects of
184
operational conditions on product gas distribution and tar formation," Biomass
and Bioenergy, vol. 35, pp. 2910-2924, 2011.
[100] G. Hu, S. Xu, S. Li, C. Xiao, and S. Liu, "Steam gasification of apricot stones
with olivine and dolomite as downstream catalysts," Fuel Processing
Technology, vol. 87, pp. 375-382, 2006.
[101] X. T. Li, J. R. Grace, C. J. Lim, A. P. Watkinson, H. P. Chen, and J. R. Kim,
"Biomass gasification in a circulating fluidized bed," Biomass and Bioenergy,
vol. 26, pp. 171-193, 2004.
[102] M. K. Karmakar and A. B. Datta, "Generation of hydrogen rich gas through
fluidized bed gasification of biomass," Bioresource Technology, vol. 102, pp.
1907-1913, 2011.
[103] J. R. Rostrup-Nielsen, Steam Reforming Catalysts. Copenhagen: Danish
Technical Press, 1975.
[104] D. Duprez, M. C. DeMicheli, P. Marecot, J. Barbier, O. A. Ferretti, and E. N.
Ponzi, "Deactivation of steam-reforming model catalysts by coke formation: I.
Kinetics of the Formation of Filamentous Carbon in the Hydrogenolysis of
cyclopentane on Ni/Al2O3 Catalysts," Journal of Catalysis, vol. 124, pp. 324-
335, 1990.
[105] I. F. Elbaba and P. T. Williams, "Two stage pyrolysis-catalytic gasification of
waste tyres: Influence of process parameters," Applied Catalysis B:
Environmental, vol. 125, pp. 136-143, 8/21/ 2012.
[106] J. J. Hernández, G. Aranda-Almansa, and A. Bula, "Gasification of biomass
wastes in an entrained flow gasifier: Effect of the particle size and the residence
time," Fuel Processing Technology, vol. 91, pp. 681-692, 2010.
[107] S. Luo, B. Xiao, X. Guo, Z. Hu, S. Liu, and M. He, "Hydrogen-rich gas from
catalytic steam gasification of biomass in a fixed bed reactor: Influence of
particle size on gasification performance," International Journal of Hydrogen
Energy, vol. 34, pp. 1260-1264, 2009.
[108] Y. Wang and C. M. Kinoshita, "Kinetic model of biomass gasification," Solar
Energy, vol. 51, pp. 19-25, 1993.
[109] B. V. Babu and A. S. Chaurasia, "Modeling for pyrolysis of solid particle:
kinetics and heat transfer effects," Energy Conversion and Management, vol. 44,
pp. 2251-2275, 2003.
[110] J. Li, Y. Yin, X. Zhang, J. Liu, and R. Yan, "Hydrogen-rich gas production by
steam gasification of palm oil wastes over supported tri-metallic catalyst,"
International Journal of Hydrogen Energy, vol. 34, pp. 9108-9115, 2009.
[111] L. Wei, S. Xu, L. Zhang, H. Zhang, C. Liu, H. Zhu, et al., "Characteristics of
fast pyrolysis of biomass in a free fall reactor," Fuel Processing Technology,
vol. 87, pp. 863-871, 2006.
[112] J. M. Encinar, J. F. González, and J. González, "Steam gasification of Cynara
cardunculus L.: influence of variables," Fuel Processing Technology, vol. 75,
pp. 27-43, 2002.
[113] S. Rapagnà and A. Latif, "Steam gasification of almond shells in a fluidised bed
reactor: the influence of temperature and particle size on product yield and
distribution," Biomass and Bioenergy, vol. 12, pp. 281-288, 1997.
[114] W. Zou, C. Song, S. Xu, C. Lu, and Y. Tursun, "Biomass gasification in an
external circulating countercurrent moving bed gasifier," Fuel.
[115] R. Yin, R. Liu, J. Wu, X. Wu, C. Sun, and C. Wu, "Influence of particle size on
performance of a pilot-scale fixed-bed gasification system," Bioresource
Technology, vol. 119, pp. 15-21, 2012.

185
[116] C. Wu and P. T. Williams, "Effects of Gasification Temperature and Catalyst
Ratio on Hydrogen Production from Catalytic Steam Pyrolysis-Gasification of
Polypropylene," Energy & Fuels, vol. 22, pp. 4125-4132, 2008/11/19 2008.
[117] L. Wang, H. Lei, S. Ren, Q. Bu, J. Liang, Y. Wei, et al., "Aromatics and phenols
from catalytic pyrolysis of Douglas fir pellets in microwave with ZSM-5 as a
catalyst," Journal of Analytical and Applied Pyrolysis, vol. 98, pp. 194-200,
2012.
[118] C. Wu and P. T. Williams, "Pyrolysis–gasification of post-consumer municipal
solid plastic waste for hydrogen production," International Journal of Hydrogen
Energy, vol. 35, pp. 949-957, 2// 2010.
186
CHAPTER 6 CATALYST SELECTION &
PYROLYSIS/GASIFICATION OF BAGASSE
6.1 Introduction
Sugarcane bagasse is one of the major biomass wastes in sugarcane producing
countries. As mentioned in chapter 3, the proximate analysis of the three biomasses; rice
husk, bagasse and wheat straw showed that the bagasse contains the highest volatiles
with the lowest ash contents. This makes it a perfect biomass for production of
hydrogen from pyrolysis/gasification. In this chapter, two-stage pyrolysis/gasification of
bagasse was carried out with the aim to obtain higher hydrogen yield. In the two-stage
process, bagasse was pyrolysed at 950 °C in the first stage. Volatiles, liquids and tar
components evolving from the first stage were gasified in the presence of steam and
catalyst at higher temperature from 950 - 1000 °C.
Several Ni-based catalysts were prepared in the laboratory and tested for the production
of hydrogen. Fresh and reacted catalysts were characterized for catalytic activity and
stability using various techniques including scanning electron microscope (SEM),
transmission electron microscope (TEM), and X-ray diffraction (XRD). The surface
properties of fresh and reacted catalysts were also investigated using nitrogen
adsorption/desorption at 77 K. The best performing catalyst was chosen based on the
highest quantity of hydrogen produced for further investigation. In order to enhance the
catalytic activity and stability, the influence of Ni-loading and calcination temperature
on the catalyst was also investigated. The influence of process conditions i.e.
gasification temperature, water injection rate and catalyst to biomass sample ratio (C/S)
on hydrogen production was also investigated in this chapter.
The catalyst selection from various Ni-based catalysts included Ni-dolomite, Ni-MgO,
Ni-SiO2, Ni-Al2O3, and Ni-Ce-dolomite is outlined in section 6.2. The influence of
gasification temperature and Ni-loading is reported in section 6.3 and section 6.4
respectively. The influence of water injection rate from 6 - 35ml hr-1
is explained in
section 6.5. The effect of calcination temperature and catalyst to sample ratio is
mentioned in section 6.6 and 6.7.
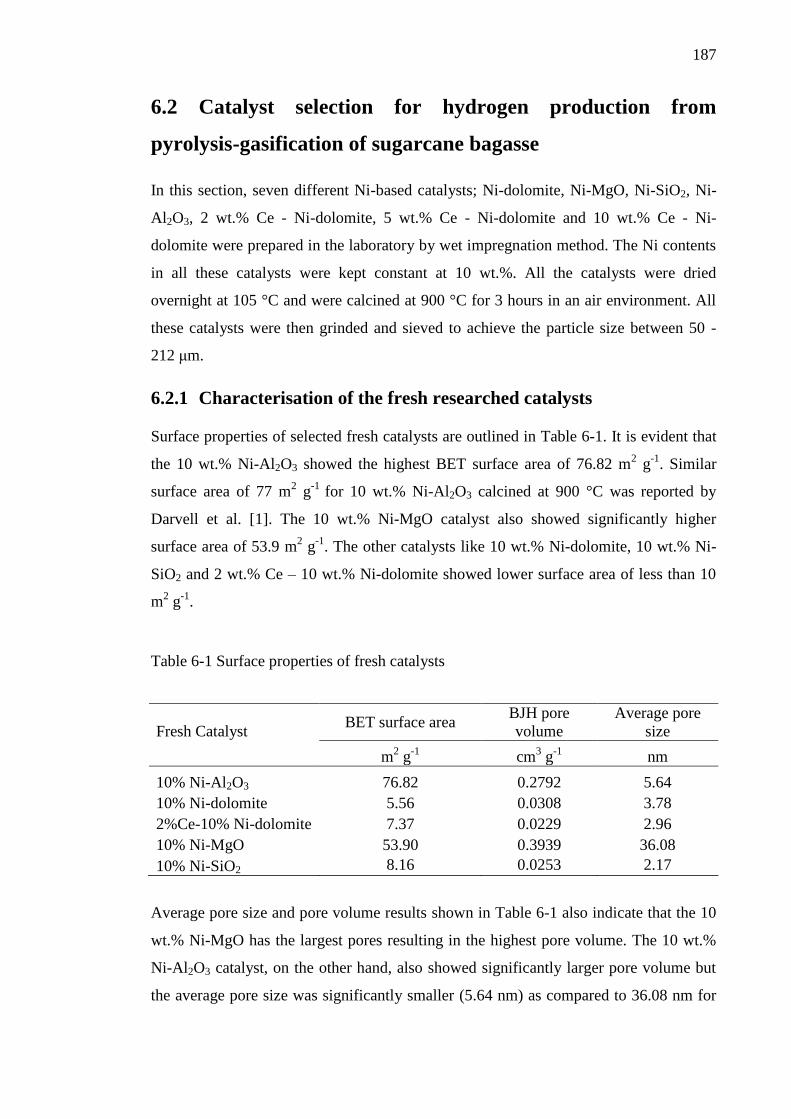
187
6.2 Catalyst selection for hydrogen production from
pyrolysis-gasification of sugarcane bagasse
In this section, seven different Ni-based catalysts; Ni-dolomite, Ni-MgO, Ni-SiO2, Ni-
Al2O3, 2 wt.% Ce - Ni-dolomite, 5 wt.% Ce - Ni-dolomite and 10 wt.% Ce - Ni-
dolomite were prepared in the laboratory by wet impregnation method. The Ni contents
in all these catalysts were kept constant at 10 wt.%. All the catalysts were dried
overnight at 105 °C and were calcined at 900 °C for 3 hours in an air environment. All
these catalysts were then grinded and sieved to achieve the particle size between 50 -
212 μm.
6.2.1 Characterisation of the fresh researched catalysts
Surface properties of selected fresh catalysts are outlined in Table 6-1. It is evident that
the 10 wt.% Ni-Al2O3 showed the highest BET surface area of 76.82 m2 g
-1. Similar
surface area of 77 m2 g
-1 for 10 wt.% Ni-Al2O3 calcined at 900 °C was reported by
Darvell et al. [1]. The 10 wt.% Ni-MgO catalyst also showed significantly higher
surface area of 53.9 m2 g
-1. The other catalysts like 10 wt.% Ni-dolomite, 10 wt.% Ni-
SiO2 and 2 wt.% Ce – 10 wt.% Ni-dolomite showed lower surface area of less than 10
m2 g
-1.
Table 6-1 Surface properties of fresh catalysts
Fresh Catalyst BET surface area
BJH pore
volume
Average pore
size
m2 g
-1 cm
3 g
-1 nm
10% Ni-Al2O3 76.82 0.2792 5.64
10% Ni-dolomite 5.56 0.0308 3.78
2%Ce-10% Ni-dolomite 7.37 0.0229 2.96
10% Ni-MgO 53.90 0.3939 36.08
10% Ni-SiO2 8.16 0.0253 2.17
Average pore size and pore volume results shown in Table 6-1 also indicate that the 10
wt.% Ni-MgO has the largest pores resulting in the highest pore volume. The 10 wt.%
Ni-Al2O3 catalyst, on the other hand, also showed significantly larger pore volume but
the average pore size was significantly smaller (5.64 nm) as compared to 36.08 nm for
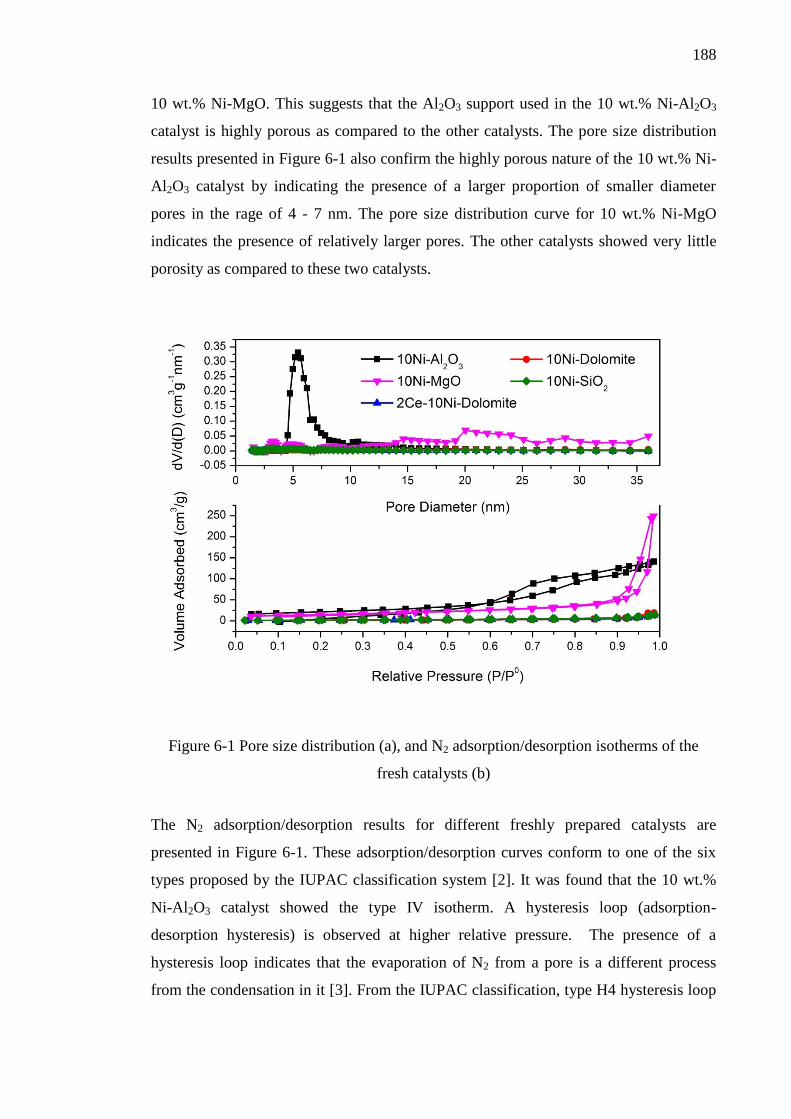
188
10 wt.% Ni-MgO. This suggests that the Al2O3 support used in the 10 wt.% Ni-Al2O3
catalyst is highly porous as compared to the other catalysts. The pore size distribution
results presented in Figure 6-1 also confirm the highly porous nature of the 10 wt.% Ni-
Al2O3 catalyst by indicating the presence of a larger proportion of smaller diameter
pores in the rage of 4 - 7 nm. The pore size distribution curve for 10 wt.% Ni-MgO
indicates the presence of relatively larger pores. The other catalysts showed very little
porosity as compared to these two catalysts.
Figure 6-1 Pore size distribution (a), and N2 adsorption/desorption isotherms of the
fresh catalysts (b)
The N2 adsorption/desorption results for different freshly prepared catalysts are
presented in Figure 6-1. These adsorption/desorption curves conform to one of the six
types proposed by the IUPAC classification system [2]. It was found that the 10 wt.%
Ni-Al2O3 catalyst showed the type IV isotherm. A hysteresis loop (adsorption-
desorption hysteresis) is observed at higher relative pressure. The presence of a
hysteresis loop indicates that the evaporation of N2 from a pore is a different process
from the condensation in it [3]. From the IUPAC classification, type H4 hysteresis loop
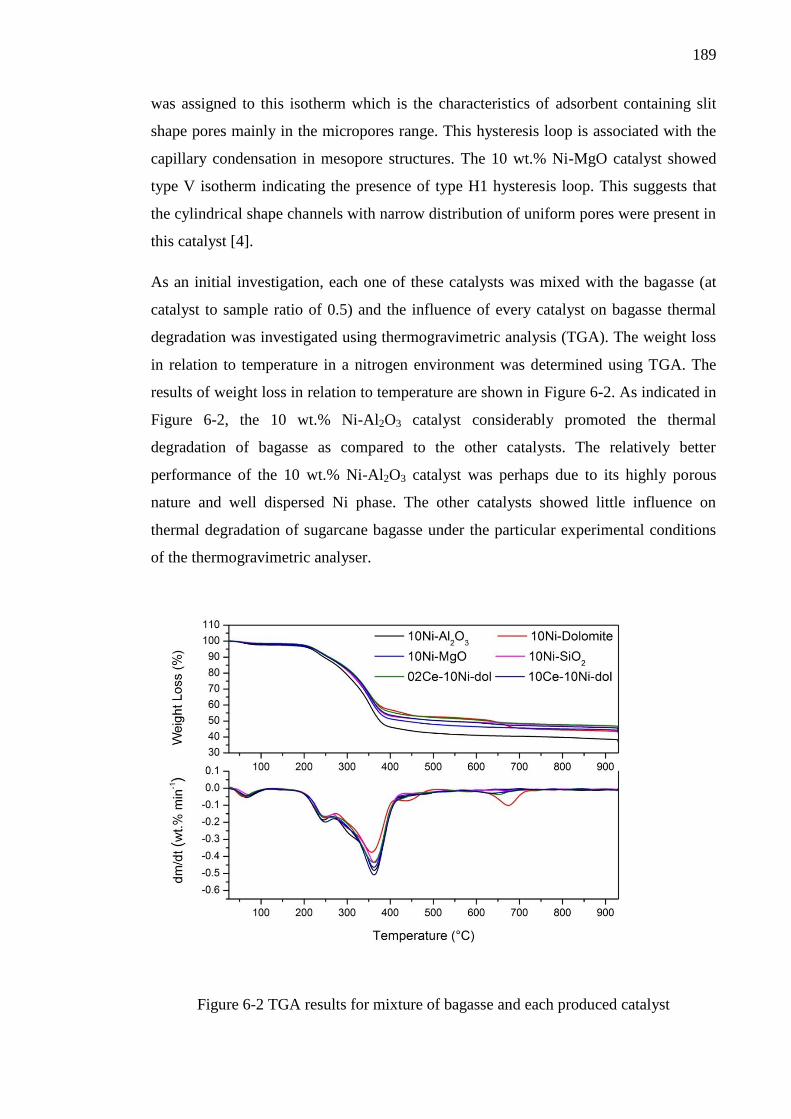
189
was assigned to this isotherm which is the characteristics of adsorbent containing slit
shape pores mainly in the micropores range. This hysteresis loop is associated with the
capillary condensation in mesopore structures. The 10 wt.% Ni-MgO catalyst showed
type V isotherm indicating the presence of type H1 hysteresis loop. This suggests that
the cylindrical shape channels with narrow distribution of uniform pores were present in
this catalyst [4].
As an initial investigation, each one of these catalysts was mixed with the bagasse (at
catalyst to sample ratio of 0.5) and the influence of every catalyst on bagasse thermal
degradation was investigated using thermogravimetric analysis (TGA). The weight loss
in relation to temperature in a nitrogen environment was determined using TGA. The
results of weight loss in relation to temperature are shown in Figure 6-2. As indicated in
Figure 6-2, the 10 wt.% Ni-Al2O3 catalyst considerably promoted the thermal
degradation of bagasse as compared to the other catalysts. The relatively better
performance of the 10 wt.% Ni-Al2O3 catalyst was perhaps due to its highly porous
nature and well dispersed Ni phase. The other catalysts showed little influence on
thermal degradation of sugarcane bagasse under the particular experimental conditions
of the thermogravimetric analyser.
Figure 6-2 TGA results for mixture of bagasse and each produced catalyst
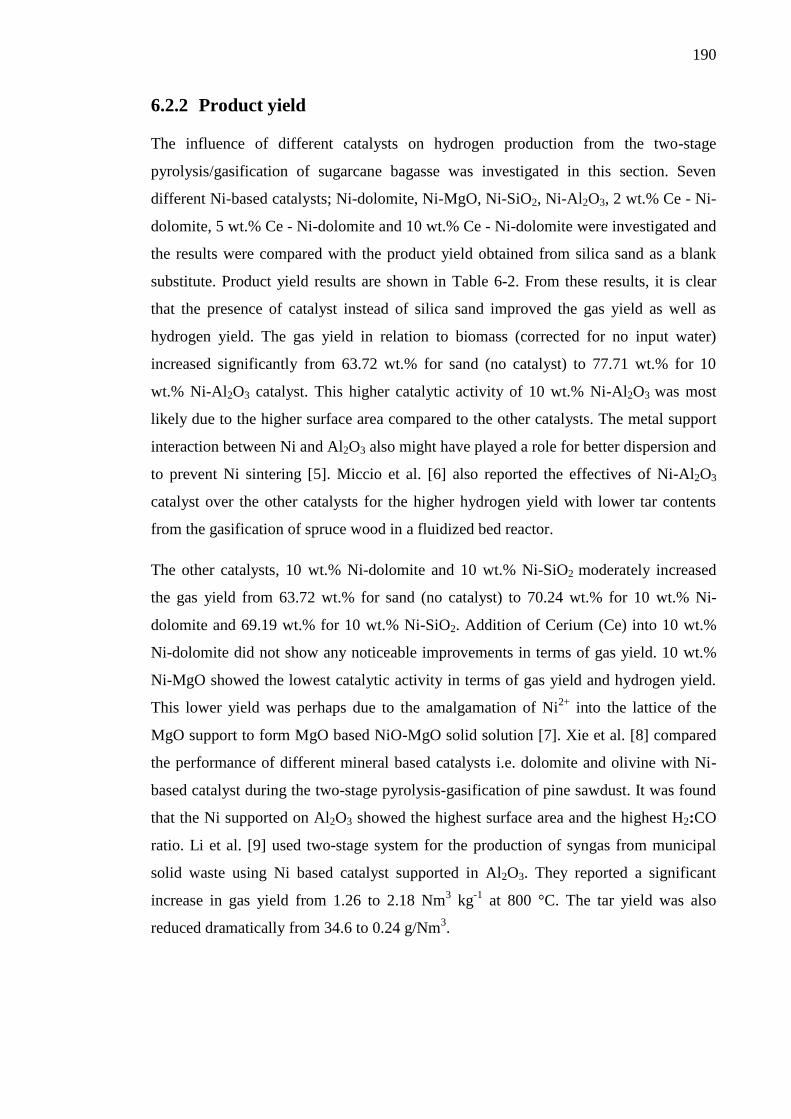
190
6.2.2 Product yield
The influence of different catalysts on hydrogen production from the two-stage
pyrolysis/gasification of sugarcane bagasse was investigated in this section. Seven
different Ni-based catalysts; Ni-dolomite, Ni-MgO, Ni-SiO2, Ni-Al2O3, 2 wt.% Ce - Ni-
dolomite, 5 wt.% Ce - Ni-dolomite and 10 wt.% Ce - Ni-dolomite were investigated and
the results were compared with the product yield obtained from silica sand as a blank
substitute. Product yield results are shown in Table 6-2. From these results, it is clear
that the presence of catalyst instead of silica sand improved the gas yield as well as
hydrogen yield. The gas yield in relation to biomass (corrected for no input water)
increased significantly from 63.72 wt.% for sand (no catalyst) to 77.71 wt.% for 10
wt.% Ni-Al2O3 catalyst. This higher catalytic activity of 10 wt.% Ni-Al2O3 was most
likely due to the higher surface area compared to the other catalysts. The metal support
interaction between Ni and Al2O3 also might have played a role for better dispersion and
to prevent Ni sintering [5]. Miccio et al. [6] also reported the effectives of Ni-Al2O3
catalyst over the other catalysts for the higher hydrogen yield with lower tar contents
from the gasification of spruce wood in a fluidized bed reactor.
The other catalysts, 10 wt.% Ni-dolomite and 10 wt.% Ni-SiO2 moderately increased
the gas yield from 63.72 wt.% for sand (no catalyst) to 70.24 wt.% for 10 wt.% Ni-
dolomite and 69.19 wt.% for 10 wt.% Ni-SiO2. Addition of Cerium (Ce) into 10 wt.%
Ni-dolomite did not show any noticeable improvements in terms of gas yield. 10 wt.%
Ni-MgO showed the lowest catalytic activity in terms of gas yield and hydrogen yield.
This lower yield was perhaps due to the amalgamation of Ni2+
into the lattice of the
MgO support to form MgO based NiO-MgO solid solution [7]. Xie et al. [8] compared
the performance of different mineral based catalysts i.e. dolomite and olivine with Ni-
based catalyst during the two-stage pyrolysis-gasification of pine sawdust. It was found
that the Ni supported on Al2O3 showed the highest surface area and the highest H2:CO
ratio. Li et al. [9] used two-stage system for the production of syngas from municipal
solid waste using Ni based catalyst supported in Al2O3. They reported a significant
increase in gas yield from 1.26 to 2.18 Nm3 kg
-1 at 800 °C. The tar yield was also
reduced dramatically from 34.6 to 0.24 g/Nm3.
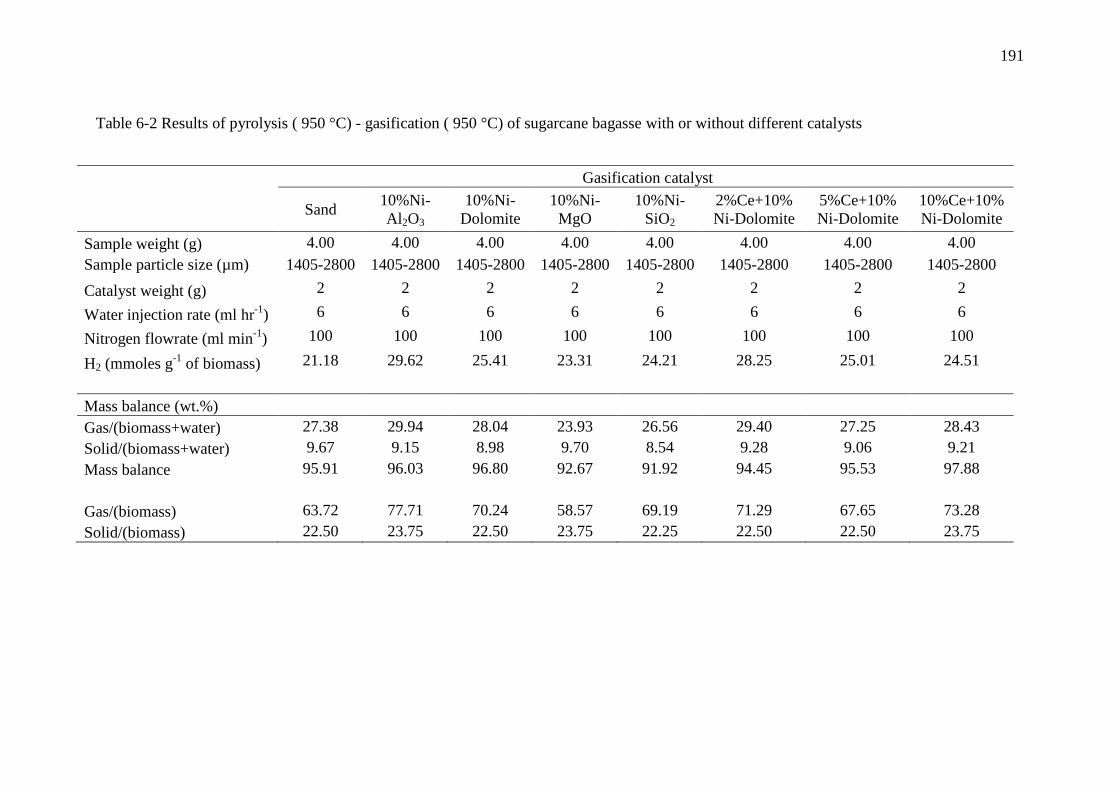
191
Table 6-2 Results of pyrolysis ( 950 °C) - gasification ( 950 °C) of sugarcane bagasse with or without different catalysts
Gasification catalyst
Sand
10%Ni-
Al2O3
10%Ni-
Dolomite
10%Ni-
MgO
10%Ni-
SiO2
2%Ce+10%
Ni-Dolomite
5%Ce+10%
Ni-Dolomite
10%Ce+10%
Ni-Dolomite
Sample weight (g) 4.00 4.00 4.00 4.00 4.00 4.00 4.00 4.00
Sample particle size (µm) 1405-2800 1405-2800 1405-2800 1405-2800 1405-2800 1405-2800 1405-2800 1405-2800
Catalyst weight (g) 2 2 2 2 2 2 2 2
Water injection rate (ml hr-1
) 6 6 6 6 6 6 6 6
Nitrogen flowrate (ml min-1
) 100 100 100 100 100 100 100 100
H2 (mmoles g-1
of biomass) 21.18 29.62 25.41 23.31 24.21 28.25 25.01 24.51
Mass balance (wt.%)
Gas/(biomass+water) 27.38 29.94 28.04 23.93 26.56 29.40 27.25 28.43
Solid/(biomass+water) 9.67 9.15 8.98 9.70 8.54 9.28 9.06 9.21
Mass balance 95.91 96.03 96.80 92.67 91.92 94.45 95.53 97.88
Gas/(biomass) 63.72 77.71 70.24 58.57 69.19 71.29 67.65 73.28
Solid/(biomass) 22.50 23.75 22.50 23.75 22.25 22.50 22.50 23.75
192
Table 6-3 The influence of different catalysts on product yield from pyrolysis ( 950 °C)
-gasification ( 1000 °C) of sugarcane bagasse
Gasification catalyst
Sand
10%Ni-
Al2O3
10%Ni-
Dolomite
2%Ce+10%Ni-
Dolomite
Sample weight (g) 4.00 4.00 4.00 4.00
Sample particle size (µm) 1405-2800 1405-2800 1405-2800 1405-2800
Catalyst weight (g) 2 2 2 2
Water injection rate (ml hr-1
) 6 6 6 6
Nitrogen flow rate (ml min-1
) 100 100 100 100
H2 (mmoles g-1
of biomass) 25.07 29.93 28.19 28.15
Mass balance (wt.%)
Gas/(biomass+water) 27.56 28.80 30.04 25.23
Solid/(biomass+water) 8.52 8.97 8.81 8.61
Mass balance 95.80 97.08 101.30 97.11
Gas/(biomass) 74.40 74.67 78.40 71.79
Solid/(biomass) 23.00 23.25 23.00 24.50
As a general trend, the higher gasification temperature of 1000 °C instead of 950 °C led
to enhanced gas yield as well as hydrogen yield. As shown in Table 6-3, with the
increase in gasification temperature from 950 to 1000 °C, the gas yield for the sand bed,
in relation to biomass (corrected for no input water) increased from 63.72 wt.% to 74.40
wt.%. This significant increase in gas yield for the sand bed indicated that the increase
in temperature promoted the thermal cracking and other gas phase endothermic
reactions. When 10 wt.% Ni-Al2O3 catalyst was used instead of the sand bed, the gas
yield slightly improved to 74.67 wt.%. This lower gas yield for 10 wt.% Ni-Al2O3
catalyst was most likely due to the loss of surface area (Table 6-4) caused by sintering
of the alumina support [10-12] as evident from SEM images in Section 6.3.3. For 10
wt.% Ni-dolomite catalyst, gas yield also increased from 70.24 wt.% to 78.40 wt.%.
However, for 2 wt.% Cerium (Ce) – dolomite catalyst, the increase in temperature from
950 to 1000 °C, did not improve the gas yield ( 71.29 wt.% to 71.79 wt.%).
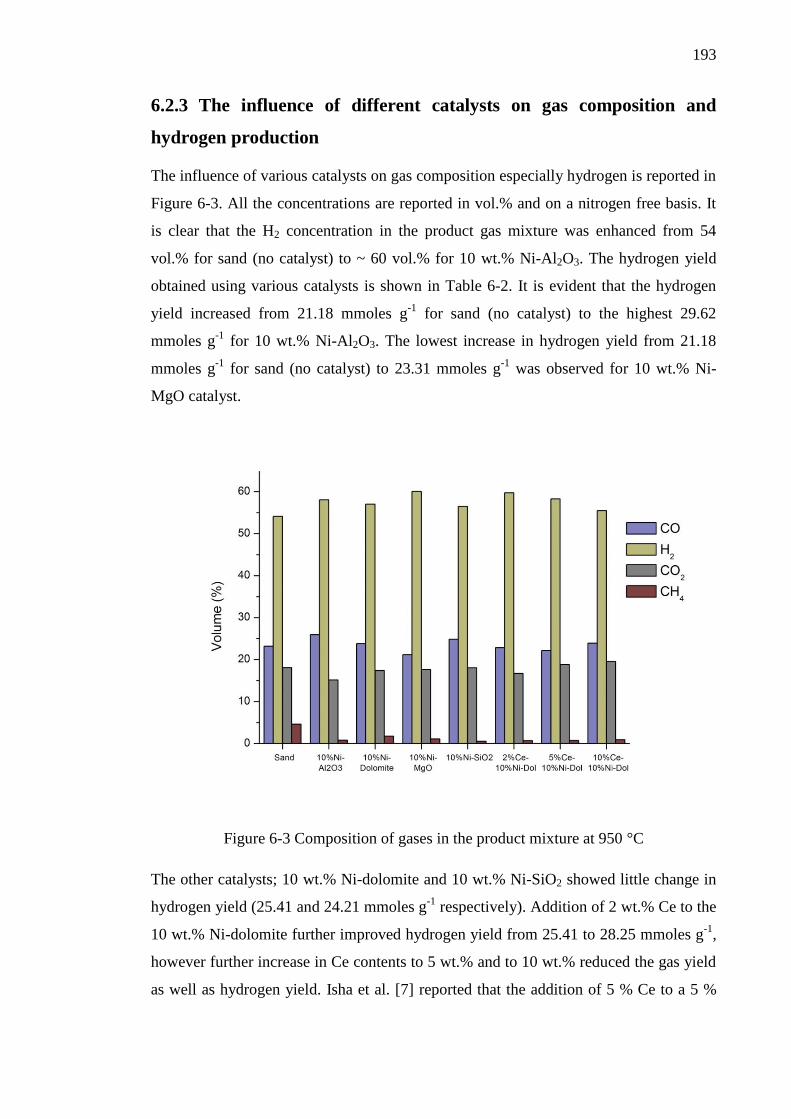
193
6.2.3 The influence of different catalysts on gas composition and
hydrogen production
The influence of various catalysts on gas composition especially hydrogen is reported in
Figure 6-3. All the concentrations are reported in vol.% and on a nitrogen free basis. It
is clear that the H2 concentration in the product gas mixture was enhanced from 54
vol.% for sand (no catalyst) to ~ 60 vol.% for 10 wt.% Ni-Al2O3. The hydrogen yield
obtained using various catalysts is shown in Table 6-2. It is evident that the hydrogen
yield increased from 21.18 mmoles g-1
for sand (no catalyst) to the highest 29.62
mmoles g-1
for 10 wt.% Ni-Al2O3. The lowest increase in hydrogen yield from 21.18
mmoles g-1
for sand (no catalyst) to 23.31 mmoles g-1
was observed for 10 wt.% Ni-
MgO catalyst.
Figure 6-3 Composition of gases in the product mixture at 950 °C
The other catalysts; 10 wt.% Ni-dolomite and 10 wt.% Ni-SiO2 showed little change in
hydrogen yield (25.41 and 24.21 mmoles g-1
respectively). Addition of 2 wt.% Ce to the
10 wt.% Ni-dolomite further improved hydrogen yield from 25.41 to 28.25 mmoles g-1
,
however further increase in Ce contents to 5 wt.% and to 10 wt.% reduced the gas yield
as well as hydrogen yield. Isha et al. [7] reported that the addition of 5 % Ce to a 5 %
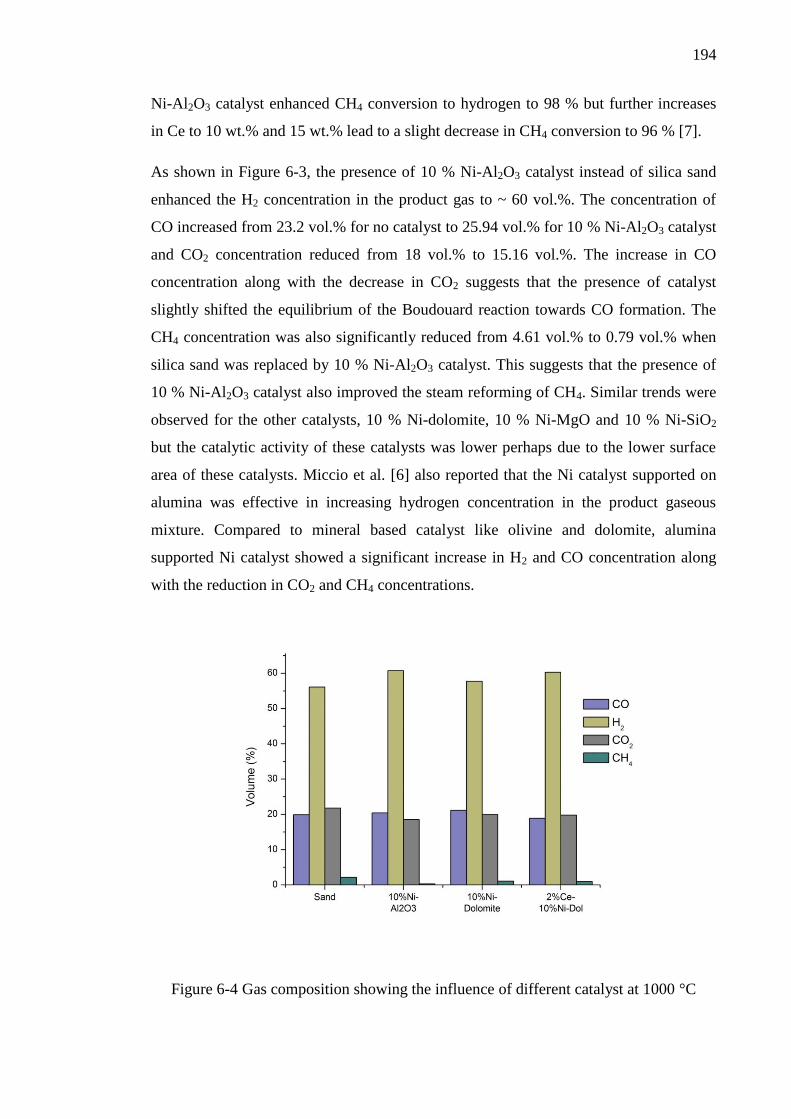
194
Ni-Al2O3 catalyst enhanced CH4 conversion to hydrogen to 98 % but further increases
in Ce to 10 wt.% and 15 wt.% lead to a slight decrease in CH4 conversion to 96 % [7].
As shown in Figure 6-3, the presence of 10 % Ni-Al2O3 catalyst instead of silica sand
enhanced the H2 concentration in the product gas to ~ 60 vol.%. The concentration of
CO increased from 23.2 vol.% for no catalyst to 25.94 vol.% for 10 % Ni-Al2O3 catalyst
and CO2 concentration reduced from 18 vol.% to 15.16 vol.%. The increase in CO
concentration along with the decrease in CO2 suggests that the presence of catalyst
slightly shifted the equilibrium of the Boudouard reaction towards CO formation. The
CH4 concentration was also significantly reduced from 4.61 vol.% to 0.79 vol.% when
silica sand was replaced by 10 % Ni-Al2O3 catalyst. This suggests that the presence of
10 % Ni-Al2O3 catalyst also improved the steam reforming of CH4. Similar trends were
observed for the other catalysts, 10 % Ni-dolomite, 10 % Ni-MgO and 10 % Ni-SiO2
but the catalytic activity of these catalysts was lower perhaps due to the lower surface
area of these catalysts. Miccio et al. [6] also reported that the Ni catalyst supported on
alumina was effective in increasing hydrogen concentration in the product gaseous
mixture. Compared to mineral based catalyst like olivine and dolomite, alumina
supported Ni catalyst showed a significant increase in H2 and CO concentration along
with the reduction in CO2 and CH4 concentrations.
Figure 6-4 Gas composition showing the influence of different catalyst at 1000 °C
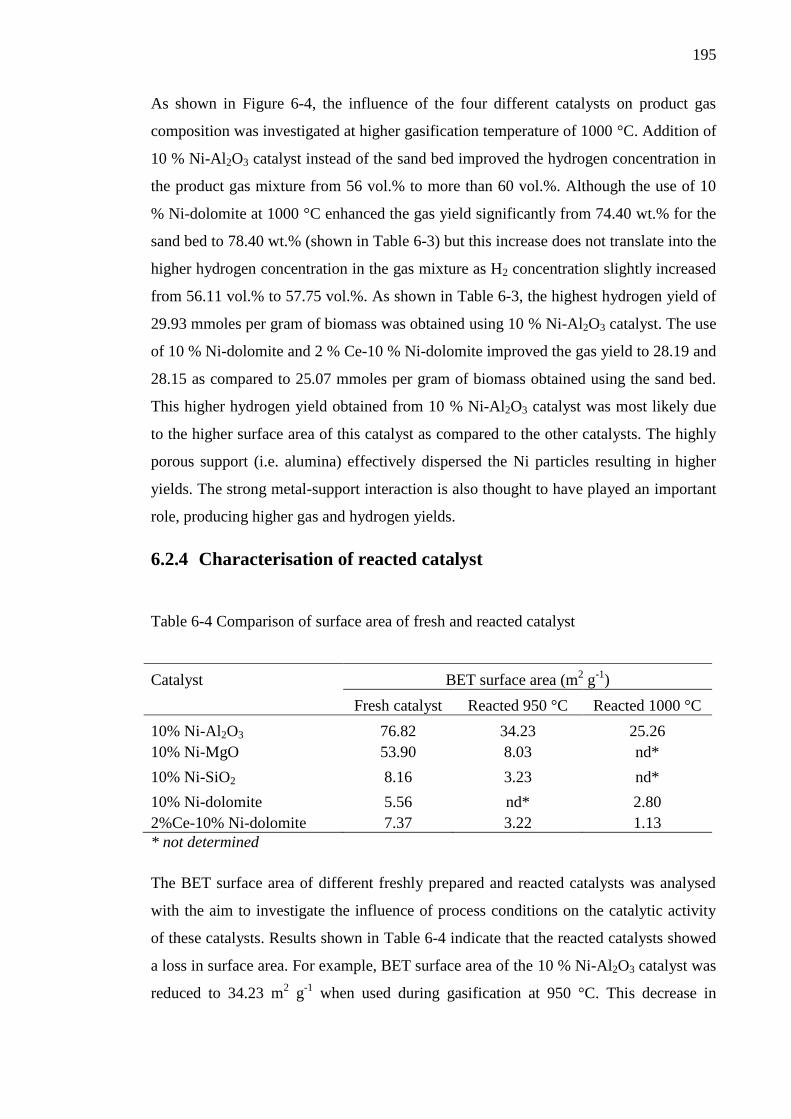
195
As shown in Figure 6-4, the influence of the four different catalysts on product gas
composition was investigated at higher gasification temperature of 1000 °C. Addition of
10 % Ni-Al2O3 catalyst instead of the sand bed improved the hydrogen concentration in
the product gas mixture from 56 vol.% to more than 60 vol.%. Although the use of 10
% Ni-dolomite at 1000 °C enhanced the gas yield significantly from 74.40 wt.% for the
sand bed to 78.40 wt.% (shown in Table 6-3) but this increase does not translate into the
higher hydrogen concentration in the gas mixture as H2 concentration slightly increased
from 56.11 vol.% to 57.75 vol.%. As shown in Table 6-3, the highest hydrogen yield of
29.93 mmoles per gram of biomass was obtained using 10 % Ni-Al2O3 catalyst. The use
of 10 % Ni-dolomite and 2 % Ce-10 % Ni-dolomite improved the gas yield to 28.19 and
28.15 as compared to 25.07 mmoles per gram of biomass obtained using the sand bed.
This higher hydrogen yield obtained from 10 % Ni-Al2O3 catalyst was most likely due
to the higher surface area of this catalyst as compared to the other catalysts. The highly
porous support (i.e. alumina) effectively dispersed the Ni particles resulting in higher
yields. The strong metal-support interaction is also thought to have played an important
role, producing higher gas and hydrogen yields.
6.2.4 Characterisation of reacted catalyst
Table 6-4 Comparison of surface area of fresh and reacted catalyst
Catalyst BET surface area (m2 g
-1)
Fresh catalyst Reacted 950 °C Reacted 1000 °C
10% Ni-Al2O3 76.82 34.23 25.26
10% Ni-MgO 53.90 8.03 nd*
10% Ni-SiO2 8.16 3.23 nd*
10% Ni-dolomite 5.56 nd* 2.80
2%Ce-10% Ni-dolomite 7.37 3.22 1.13
* not determined
The BET surface area of different freshly prepared and reacted catalysts was analysed
with the aim to investigate the influence of process conditions on the catalytic activity
of these catalysts. Results shown in Table 6-4 indicate that the reacted catalysts showed
a loss in surface area. For example, BET surface area of the 10 % Ni-Al2O3 catalyst was
reduced to 34.23 m2 g
-1 when used during gasification at 950 °C. This decrease in
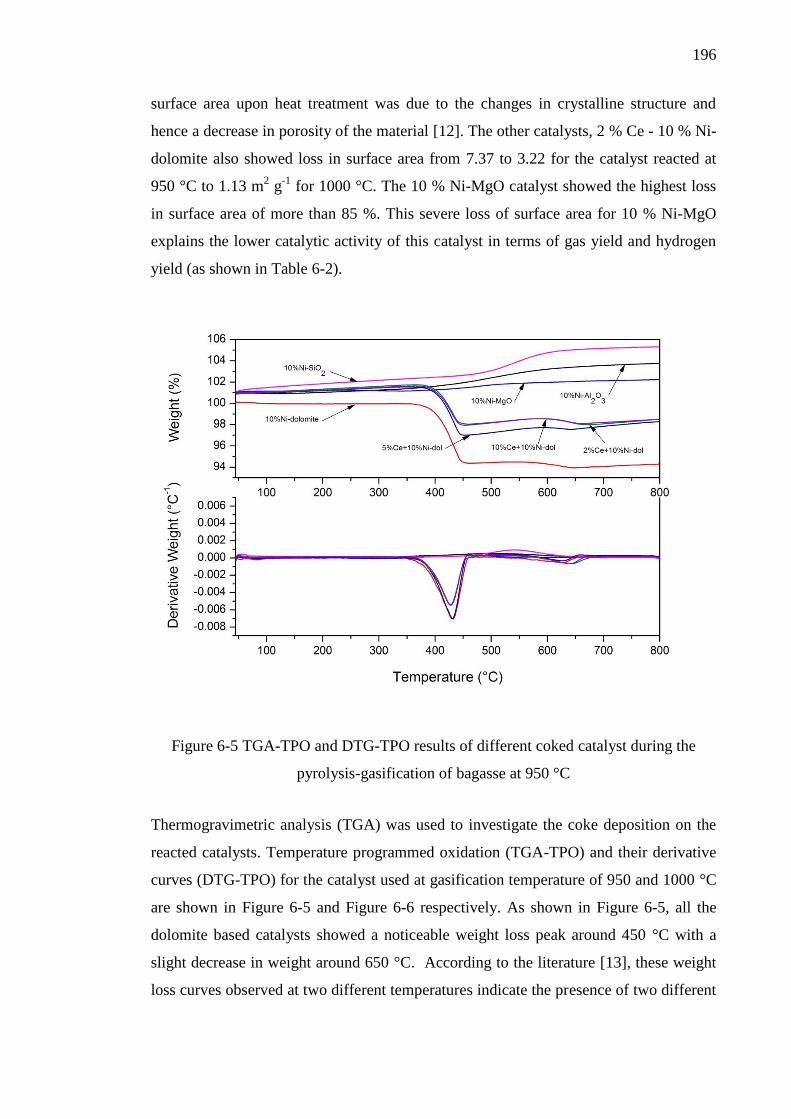
196
surface area upon heat treatment was due to the changes in crystalline structure and
hence a decrease in porosity of the material [12]. The other catalysts, 2 % Ce - 10 % Ni-
dolomite also showed loss in surface area from 7.37 to 3.22 for the catalyst reacted at
950 °C to 1.13 m2 g
-1 for 1000 °C. The 10 % Ni-MgO catalyst showed the highest loss
in surface area of more than 85 %. This severe loss of surface area for 10 % Ni-MgO
explains the lower catalytic activity of this catalyst in terms of gas yield and hydrogen
yield (as shown in Table 6-2).
Figure 6-5 TGA-TPO and DTG-TPO results of different coked catalyst during the
pyrolysis-gasification of bagasse at 950 °C
Thermogravimetric analysis (TGA) was used to investigate the coke deposition on the
reacted catalysts. Temperature programmed oxidation (TGA-TPO) and their derivative
curves (DTG-TPO) for the catalyst used at gasification temperature of 950 and 1000 °C
are shown in Figure 6-5 and Figure 6-6 respectively. As shown in Figure 6-5, all the
dolomite based catalysts showed a noticeable weight loss peak around 450 °C with a
slight decrease in weight around 650 °C. According to the literature [13], these weight
loss curves observed at two different temperatures indicate the presence of two different
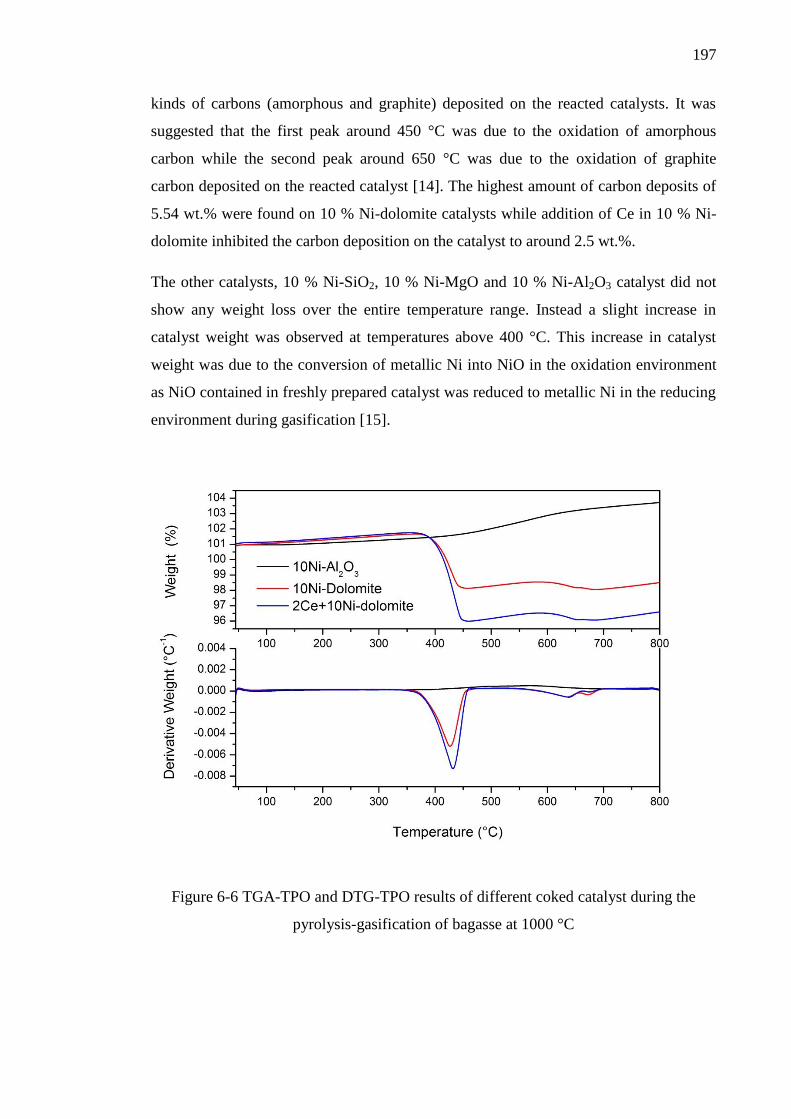
197
kinds of carbons (amorphous and graphite) deposited on the reacted catalysts. It was
suggested that the first peak around 450 °C was due to the oxidation of amorphous
carbon while the second peak around 650 °C was due to the oxidation of graphite
carbon deposited on the reacted catalyst [14]. The highest amount of carbon deposits of
5.54 wt.% were found on 10 % Ni-dolomite catalysts while addition of Ce in 10 % Ni-
dolomite inhibited the carbon deposition on the catalyst to around 2.5 wt.%.
The other catalysts, 10 % Ni-SiO2, 10 % Ni-MgO and 10 % Ni-Al2O3 catalyst did not
show any weight loss over the entire temperature range. Instead a slight increase in
catalyst weight was observed at temperatures above 400 °C. This increase in catalyst
weight was due to the conversion of metallic Ni into NiO in the oxidation environment
as NiO contained in freshly prepared catalyst was reduced to metallic Ni in the reducing
environment during gasification [15].
Figure 6-6 TGA-TPO and DTG-TPO results of different coked catalyst during the
pyrolysis-gasification of bagasse at 1000 °C
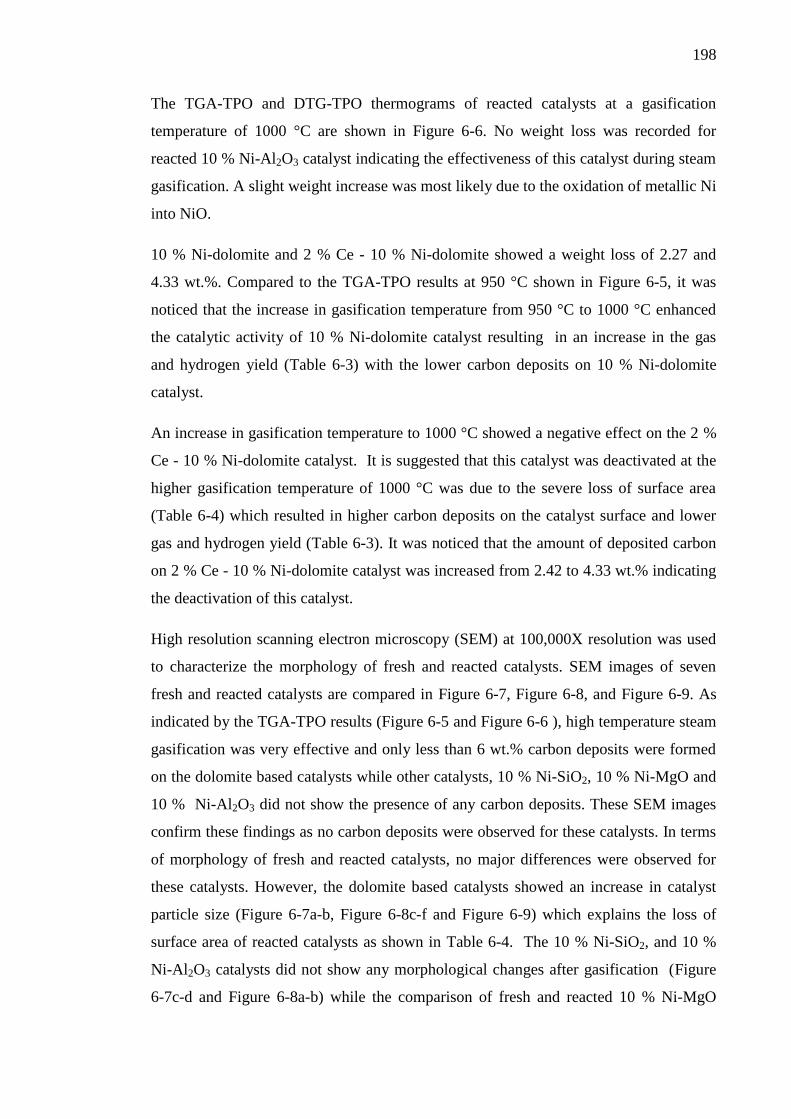
198
The TGA-TPO and DTG-TPO thermograms of reacted catalysts at a gasification
temperature of 1000 °C are shown in Figure 6-6. No weight loss was recorded for
reacted 10 % Ni-Al2O3 catalyst indicating the effectiveness of this catalyst during steam
gasification. A slight weight increase was most likely due to the oxidation of metallic Ni
into NiO.
10 % Ni-dolomite and 2 % Ce - 10 % Ni-dolomite showed a weight loss of 2.27 and
4.33 wt.%. Compared to the TGA-TPO results at 950 °C shown in Figure 6-5, it was
noticed that the increase in gasification temperature from 950 °C to 1000 °C enhanced
the catalytic activity of 10 % Ni-dolomite catalyst resulting in an increase in the gas
and hydrogen yield (Table 6-3) with the lower carbon deposits on 10 % Ni-dolomite
catalyst.
An increase in gasification temperature to 1000 °C showed a negative effect on the 2 %
Ce - 10 % Ni-dolomite catalyst. It is suggested that this catalyst was deactivated at the
higher gasification temperature of 1000 °C was due to the severe loss of surface area
(Table 6-4) which resulted in higher carbon deposits on the catalyst surface and lower
gas and hydrogen yield (Table 6-3). It was noticed that the amount of deposited carbon
on 2 % Ce - 10 % Ni-dolomite catalyst was increased from 2.42 to 4.33 wt.% indicating
the deactivation of this catalyst.
High resolution scanning electron microscopy (SEM) at 100,000X resolution was used
to characterize the morphology of fresh and reacted catalysts. SEM images of seven
fresh and reacted catalysts are compared in Figure 6-7, Figure 6-8, and Figure 6-9. As
indicated by the TGA-TPO results (Figure 6-5 and Figure 6-6 ), high temperature steam
gasification was very effective and only less than 6 wt.% carbon deposits were formed
on the dolomite based catalysts while other catalysts, 10 % Ni-SiO2, 10 % Ni-MgO and
10 % Ni-Al2O3 did not show the presence of any carbon deposits. These SEM images
confirm these findings as no carbon deposits were observed for these catalysts. In terms
of morphology of fresh and reacted catalysts, no major differences were observed for
these catalysts. However, the dolomite based catalysts showed an increase in catalyst
particle size (Figure 6-7a-b, Figure 6-8c-f and Figure 6-9) which explains the loss of
surface area of reacted catalysts as shown in Table 6-4. The 10 % Ni-SiO2, and 10 %
Ni-Al2O3 catalysts did not show any morphological changes after gasification (Figure
6-7c-d and Figure 6-8a-b) while the comparison of fresh and reacted 10 % Ni-MgO
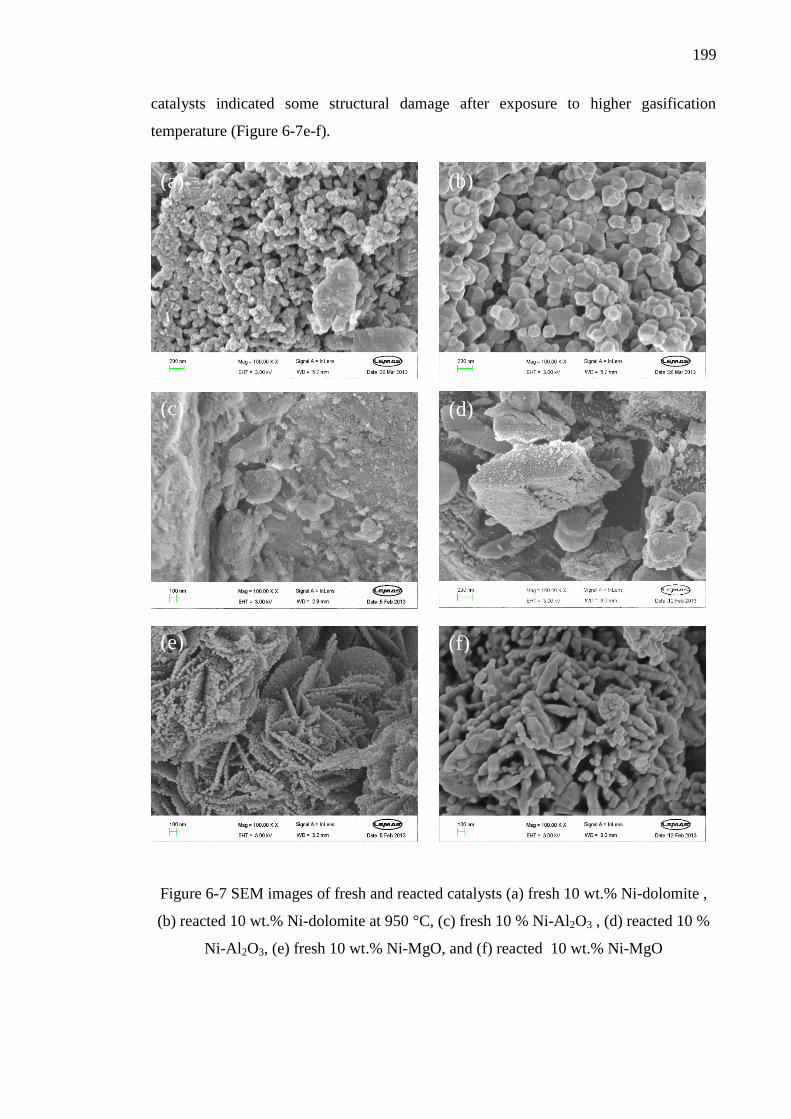
199
catalysts indicated some structural damage after exposure to higher gasification
temperature (Figure 6-7e-f).
Figure 6-7 SEM images of fresh and reacted catalysts (a) fresh 10 wt.% Ni-dolomite ,
(b) reacted 10 wt.% Ni-dolomite at 950 °C, (c) fresh 10 % Ni-Al2O3 , (d) reacted 10 %
Ni-Al2O3, (e) fresh 10 wt.% Ni-MgO, and (f) reacted 10 wt.% Ni-MgO
(d) (c)
(e) (f)
(a) (b)
(d)
200
Figure 6-8 SEM images of fresh and reacted catalysts (a) fresh 10 wt.%Ni-SiO2 , (b)
reacted 10 wt.% Ni- SiO2 at 950 °C, (c) fresh 2 % Ce -10 % Ni-dolomite , (d) reacted 2
% Ce - 10 % Ni-dolomite, (e) fresh 5 % Ce - 10 wt.% Ni-dolomite and (f) reacted 5 %
Ce - 10 wt.% Ni-dolomite
(d) (c)
(e) (f)
(a) (b)
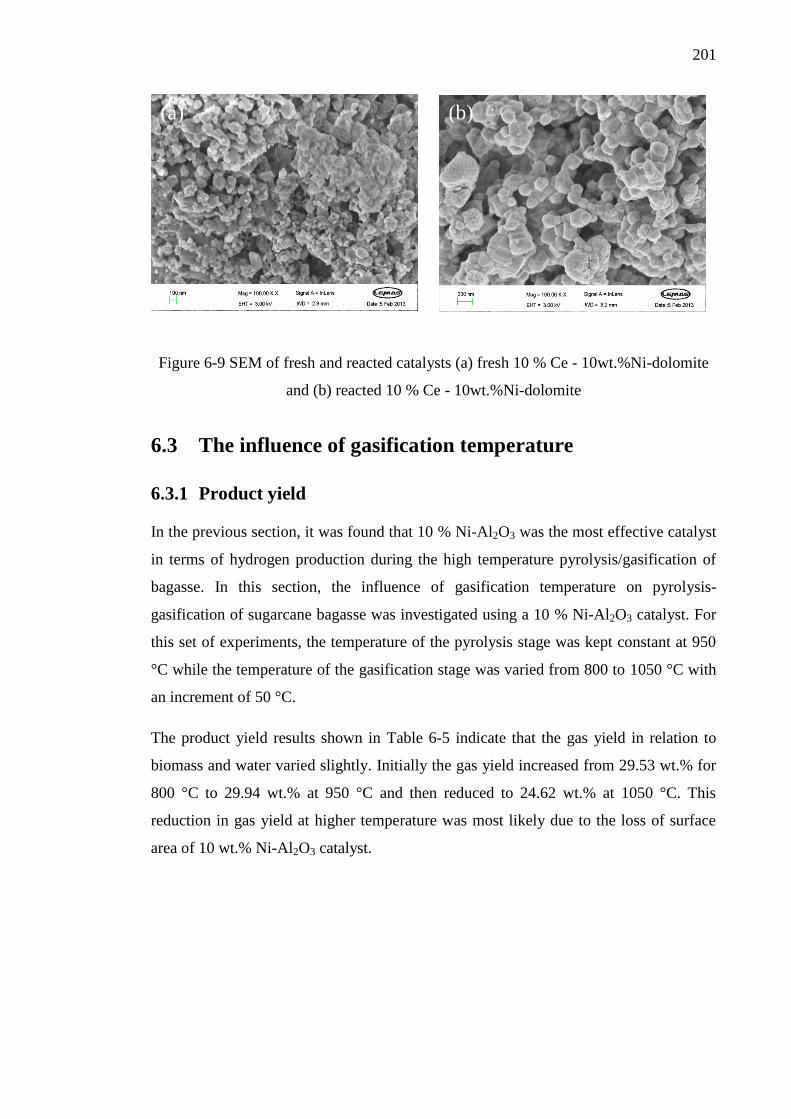
201
Figure 6-9 SEM of fresh and reacted catalysts (a) fresh 10 % Ce - 10wt.%Ni-dolomite
and (b) reacted 10 % Ce - 10wt.%Ni-dolomite
6.3 The influence of gasification temperature
6.3.1 Product yield
In the previous section, it was found that 10 % Ni-Al2O3 was the most effective catalyst
in terms of hydrogen production during the high temperature pyrolysis/gasification of
bagasse. In this section, the influence of gasification temperature on pyrolysis-
gasification of sugarcane bagasse was investigated using a 10 % Ni-Al2O3 catalyst. For
this set of experiments, the temperature of the pyrolysis stage was kept constant at 950
°C while the temperature of the gasification stage was varied from 800 to 1050 °C with
an increment of 50 °C.
The product yield results shown in Table 6-5 indicate that the gas yield in relation to
biomass and water varied slightly. Initially the gas yield increased from 29.53 wt.% for
800 °C to 29.94 wt.% at 950 °C and then reduced to 24.62 wt.% at 1050 °C. This
reduction in gas yield at higher temperature was most likely due to the loss of surface
area of 10 wt.% Ni-Al2O3 catalyst.
(a) (b)
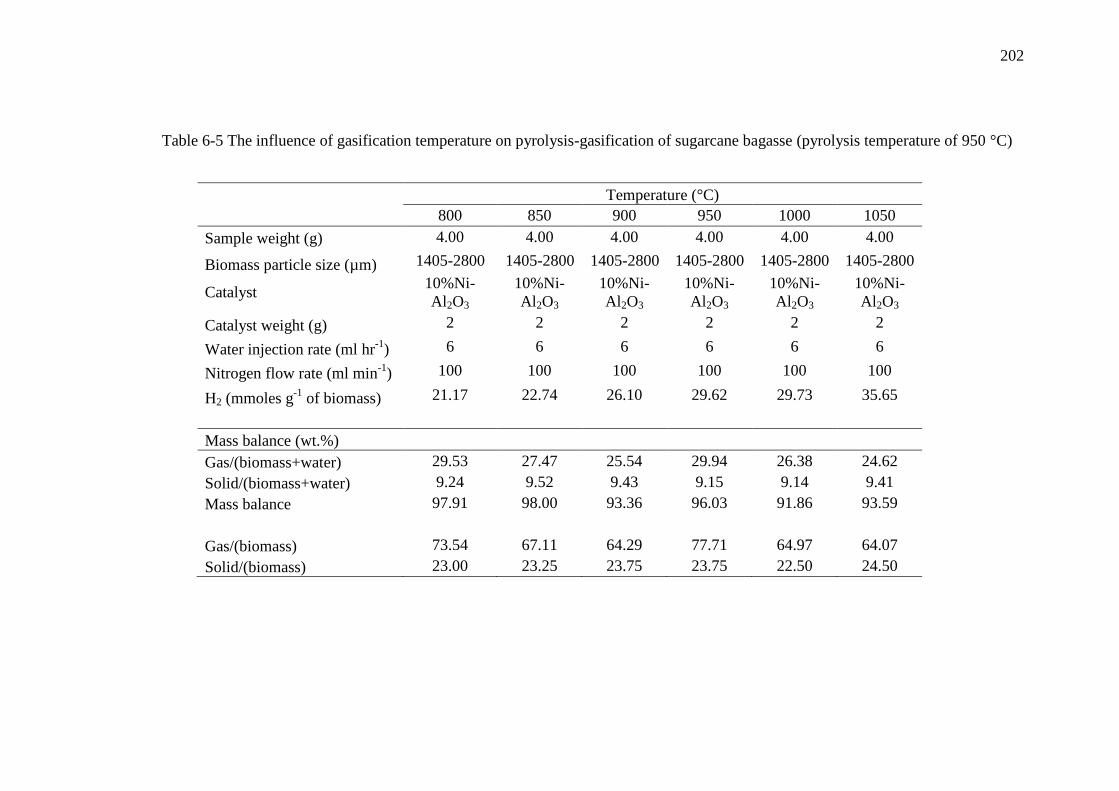
202
Table 6-5 The influence of gasification temperature on pyrolysis-gasification of sugarcane bagasse (pyrolysis temperature of 950 °C)
Temperature (°C)
800 850 900 950 1000 1050
Sample weight (g) 4.00 4.00 4.00 4.00 4.00 4.00
Biomass particle size (µm) 1405-2800 1405-2800 1405-2800 1405-2800 1405-2800 1405-2800
Catalyst 10%Ni-
Al2O3
10%Ni-
Al2O3
10%Ni-
Al2O3
10%Ni-
Al2O3
10%Ni-
Al2O3
10%Ni-
Al2O3
Catalyst weight (g) 2 2 2 2 2 2
Water injection rate (ml hr-1
) 6 6 6 6 6 6
Nitrogen flow rate (ml min-1
) 100 100 100 100 100 100
H2 (mmoles g-1
of biomass) 21.17 22.74 26.10 29.62 29.73 35.65
Mass balance (wt.%)
Gas/(biomass+water) 29.53 27.47 25.54 29.94 26.38 24.62
Solid/(biomass+water) 9.24 9.52 9.43 9.15 9.14 9.41
Mass balance 97.91 98.00 93.36 96.03 91.86 93.59
Gas/(biomass) 73.54 67.11 64.29 77.71 64.97 64.07
Solid/(biomass) 23.00 23.25 23.75 23.75 22.50 24.50
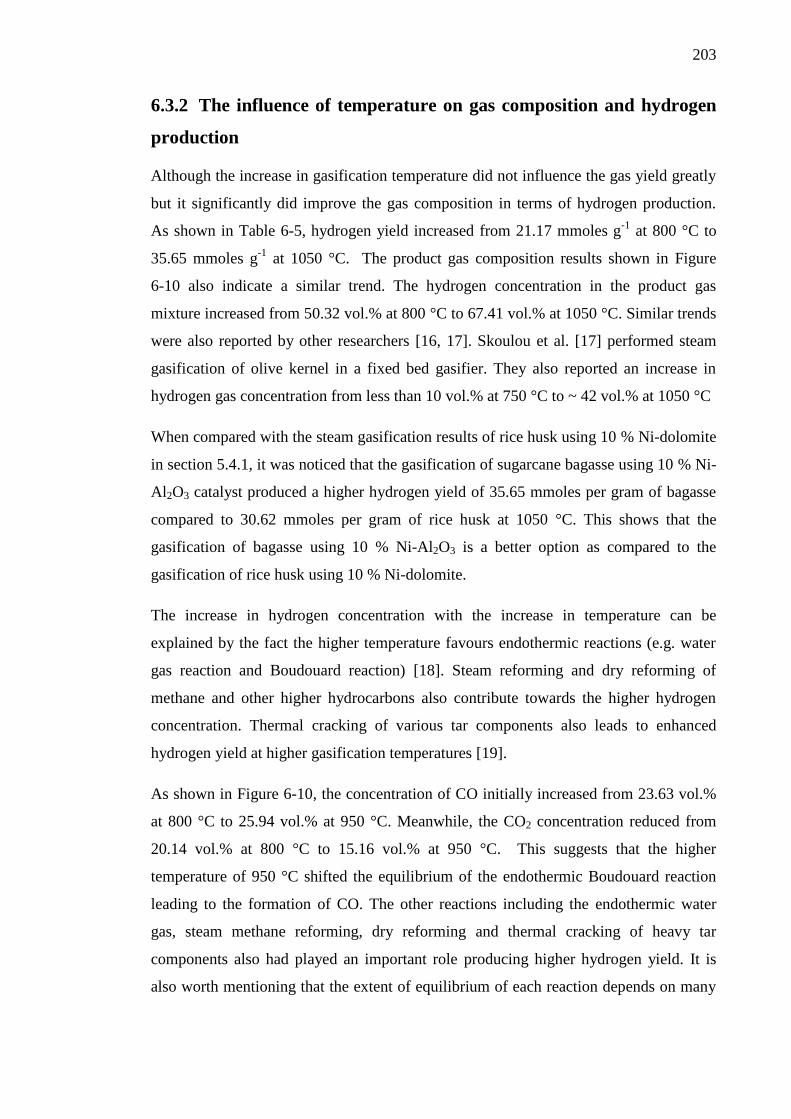
203
6.3.2 The influence of temperature on gas composition and hydrogen
production
Although the increase in gasification temperature did not influence the gas yield greatly
but it significantly did improve the gas composition in terms of hydrogen production.
As shown in Table 6-5, hydrogen yield increased from 21.17 mmoles g-1
at 800 °C to
35.65 mmoles g-1
at 1050 °C. The product gas composition results shown in Figure
6-10 also indicate a similar trend. The hydrogen concentration in the product gas
mixture increased from 50.32 vol.% at 800 °C to 67.41 vol.% at 1050 °C. Similar trends
were also reported by other researchers [16, 17]. Skoulou et al. [17] performed steam
gasification of olive kernel in a fixed bed gasifier. They also reported an increase in
hydrogen gas concentration from less than 10 vol.% at 750 °C to ~ 42 vol.% at 1050 °C
When compared with the steam gasification results of rice husk using 10 % Ni-dolomite
in section 5.4.1, it was noticed that the gasification of sugarcane bagasse using 10 % Ni-
Al2O3 catalyst produced a higher hydrogen yield of 35.65 mmoles per gram of bagasse
compared to 30.62 mmoles per gram of rice husk at 1050 °C. This shows that the
gasification of bagasse using 10 % Ni-Al2O3 is a better option as compared to the
gasification of rice husk using 10 % Ni-dolomite.
The increase in hydrogen concentration with the increase in temperature can be
explained by the fact the higher temperature favours endothermic reactions (e.g. water
gas reaction and Boudouard reaction) [18]. Steam reforming and dry reforming of
methane and other higher hydrocarbons also contribute towards the higher hydrogen
concentration. Thermal cracking of various tar components also leads to enhanced
hydrogen yield at higher gasification temperatures [19].
As shown in Figure 6-10, the concentration of CO initially increased from 23.63 vol.%
at 800 °C to 25.94 vol.% at 950 °C. Meanwhile, the CO2 concentration reduced from
20.14 vol.% at 800 °C to 15.16 vol.% at 950 °C. This suggests that the higher
temperature of 950 °C shifted the equilibrium of the endothermic Boudouard reaction
leading to the formation of CO. The other reactions including the endothermic water
gas, steam methane reforming, dry reforming and thermal cracking of heavy tar
components also had played an important role producing higher hydrogen yield. It is
also worth mentioning that the extent of equilibrium of each reaction depends on many
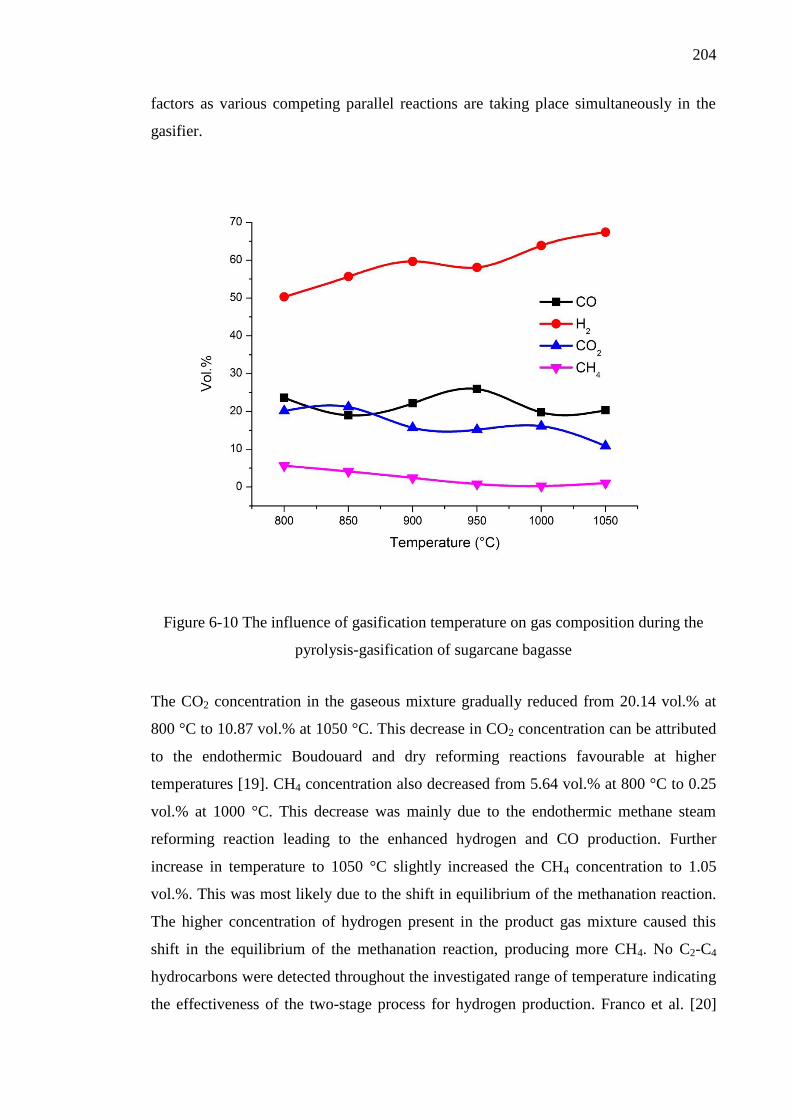
204
factors as various competing parallel reactions are taking place simultaneously in the
gasifier.
Figure 6-10 The influence of gasification temperature on gas composition during the
pyrolysis-gasification of sugarcane bagasse
The CO2 concentration in the gaseous mixture gradually reduced from 20.14 vol.% at
800 °C to 10.87 vol.% at 1050 °C. This decrease in CO2 concentration can be attributed
to the endothermic Boudouard and dry reforming reactions favourable at higher
temperatures [19]. CH4 concentration also decreased from 5.64 vol.% at 800 °C to 0.25
vol.% at 1000 °C. This decrease was mainly due to the endothermic methane steam
reforming reaction leading to the enhanced hydrogen and CO production. Further
increase in temperature to 1050 °C slightly increased the CH4 concentration to 1.05
vol.%. This was most likely due to the shift in equilibrium of the methanation reaction.
The higher concentration of hydrogen present in the product gas mixture caused this
shift in the equilibrium of the methanation reaction, producing more CH4. No C2-C4
hydrocarbons were detected throughout the investigated range of temperature indicating
the effectiveness of the two-stage process for hydrogen production. Franco et al. [20]
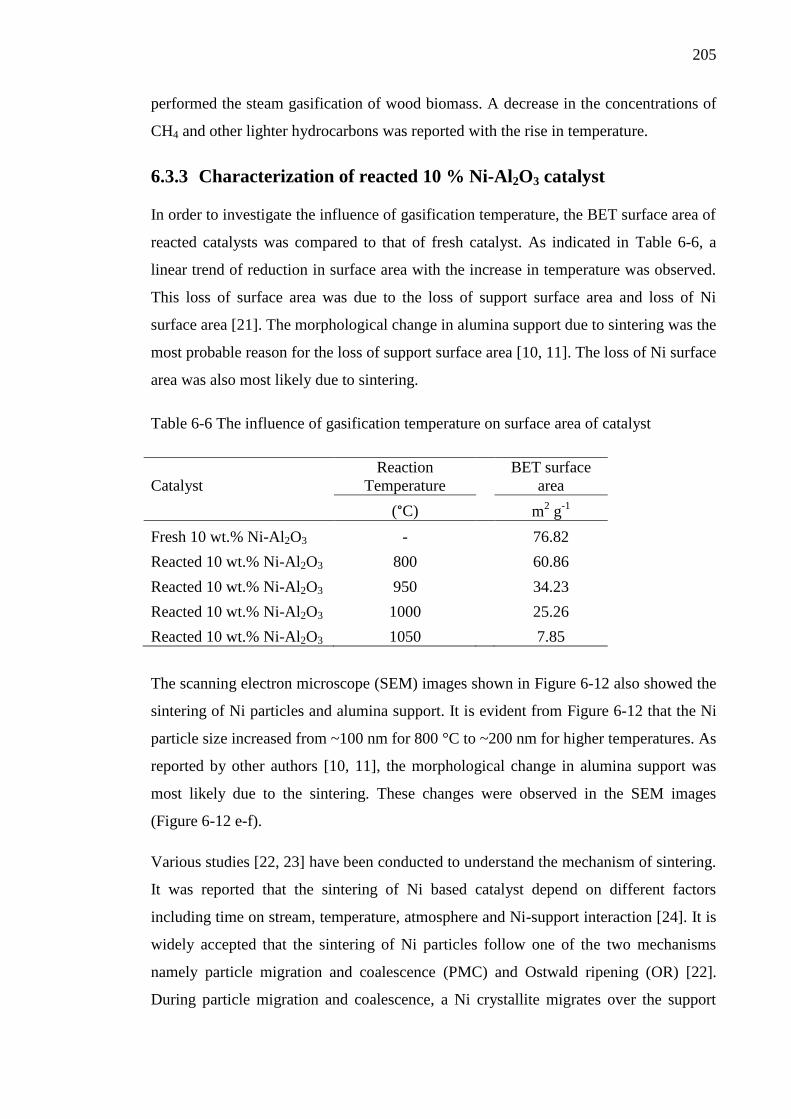
205
performed the steam gasification of wood biomass. A decrease in the concentrations of
CH4 and other lighter hydrocarbons was reported with the rise in temperature.
6.3.3 Characterization of reacted 10 % Ni-Al2O3 catalyst
In order to investigate the influence of gasification temperature, the BET surface area of
reacted catalysts was compared to that of fresh catalyst. As indicated in Table 6-6, a
linear trend of reduction in surface area with the increase in temperature was observed.
This loss of surface area was due to the loss of support surface area and loss of Ni
surface area [21]. The morphological change in alumina support due to sintering was the
most probable reason for the loss of support surface area [10, 11]. The loss of Ni surface
area was also most likely due to sintering.
Table 6-6 The influence of gasification temperature on surface area of catalyst
Catalyst
Reaction
Temperature
BET surface
area
(°C) m2 g
-1
Fresh 10 wt.% Ni-Al2O3 -
76.82
Reacted 10 wt.% Ni-Al2O3 800
60.86
Reacted 10 wt.% Ni-Al2O3 950
34.23
Reacted 10 wt.% Ni-Al2O3 1000
25.26
Reacted 10 wt.% Ni-Al2O3 1050 7.85
The scanning electron microscope (SEM) images shown in Figure 6-12 also showed the
sintering of Ni particles and alumina support. It is evident from Figure 6-12 that the Ni
particle size increased from ~100 nm for 800 °C to ~200 nm for higher temperatures. As
reported by other authors [10, 11], the morphological change in alumina support was
most likely due to the sintering. These changes were observed in the SEM images
(Figure 6-12 e-f).
Various studies [22, 23] have been conducted to understand the mechanism of sintering.
It was reported that the sintering of Ni based catalyst depend on different factors
including time on stream, temperature, atmosphere and Ni-support interaction [24]. It is
widely accepted that the sintering of Ni particles follow one of the two mechanisms
namely particle migration and coalescence (PMC) and Ostwald ripening (OR) [22].
During particle migration and coalescence, a Ni crystallite migrates over the support
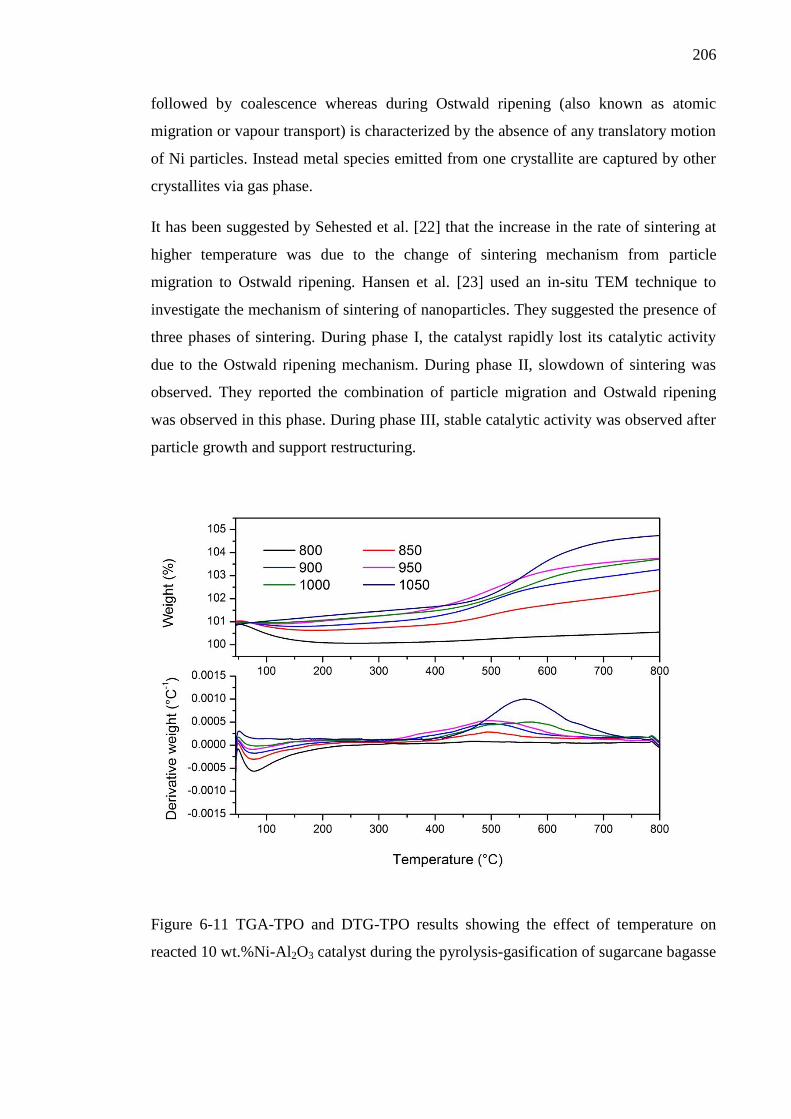
206
followed by coalescence whereas during Ostwald ripening (also known as atomic
migration or vapour transport) is characterized by the absence of any translatory motion
of Ni particles. Instead metal species emitted from one crystallite are captured by other
crystallites via gas phase.
It has been suggested by Sehested et al. [22] that the increase in the rate of sintering at
higher temperature was due to the change of sintering mechanism from particle
migration to Ostwald ripening. Hansen et al. [23] used an in-situ TEM technique to
investigate the mechanism of sintering of nanoparticles. They suggested the presence of
three phases of sintering. During phase I, the catalyst rapidly lost its catalytic activity
due to the Ostwald ripening mechanism. During phase II, slowdown of sintering was
observed. They reported the combination of particle migration and Ostwald ripening
was observed in this phase. During phase III, stable catalytic activity was observed after
particle growth and support restructuring.
Figure 6-11 TGA-TPO and DTG-TPO results showing the effect of temperature on
reacted 10 wt.%Ni-Al2O3 catalyst during the pyrolysis-gasification of sugarcane bagasse
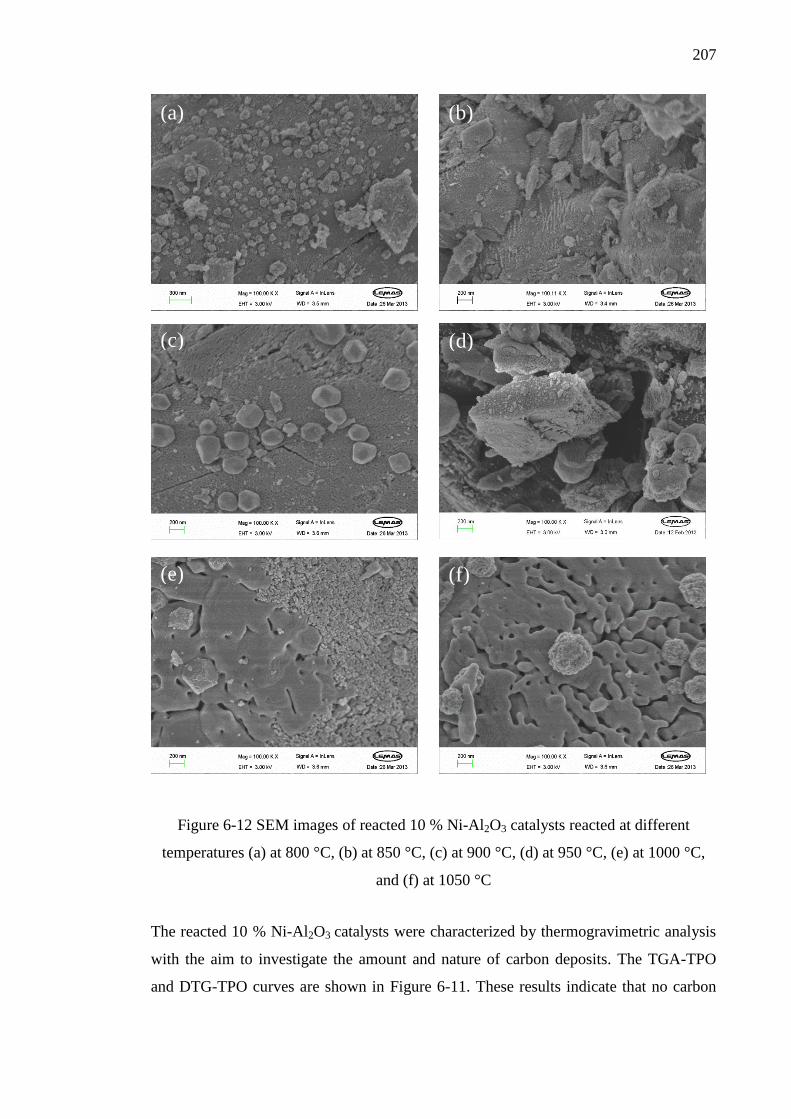
207
Figure 6-12 SEM images of reacted 10 % Ni-Al2O3 catalysts reacted at different
temperatures (a) at 800 °C, (b) at 850 °C, (c) at 900 °C, (d) at 950 °C, (e) at 1000 °C,
and (f) at 1050 °C
The reacted 10 % Ni-Al2O3 catalysts were characterized by thermogravimetric analysis
with the aim to investigate the amount and nature of carbon deposits. The TGA-TPO
and DTG-TPO curves are shown in Figure 6-11. These results indicate that no carbon
(d) (c)
(e) (f)
(a) (b)
(d)
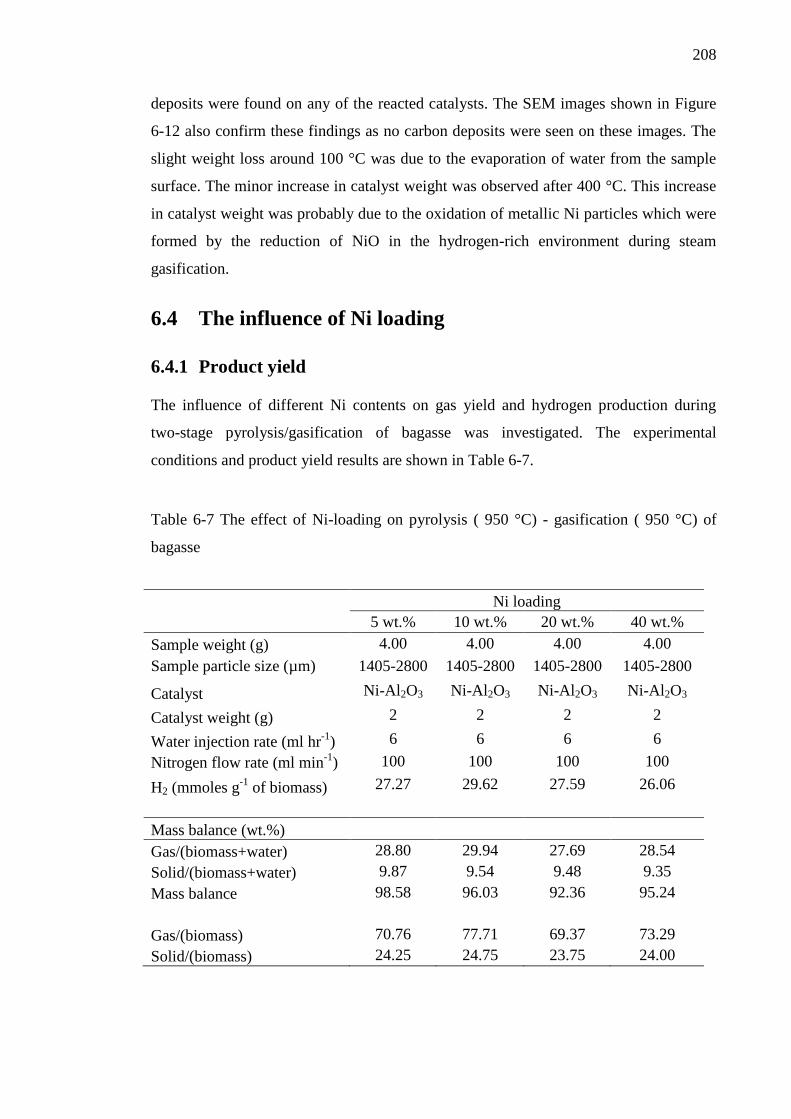
208
deposits were found on any of the reacted catalysts. The SEM images shown in Figure
6-12 also confirm these findings as no carbon deposits were seen on these images. The
slight weight loss around 100 °C was due to the evaporation of water from the sample
surface. The minor increase in catalyst weight was observed after 400 °C. This increase
in catalyst weight was probably due to the oxidation of metallic Ni particles which were
formed by the reduction of NiO in the hydrogen-rich environment during steam
gasification.
6.4 The influence of Ni loading
6.4.1 Product yield
The influence of different Ni contents on gas yield and hydrogen production during
two-stage pyrolysis/gasification of bagasse was investigated. The experimental
conditions and product yield results are shown in Table 6-7.
Table 6-7 The effect of Ni-loading on pyrolysis ( 950 °C) - gasification ( 950 °C) of
bagasse
Ni loading
5 wt.% 10 wt.% 20 wt.% 40 wt.%
Sample weight (g) 4.00 4.00 4.00 4.00
Sample particle size (µm) 1405-2800 1405-2800 1405-2800 1405-2800
Catalyst Ni-Al2O3 Ni-Al2O3 Ni-Al2O3 Ni-Al2O3
Catalyst weight (g) 2 2 2 2
Water injection rate (ml hr-1
) 6 6 6 6
Nitrogen flow rate (ml min-1
) 100 100 100 100
H2 (mmoles g-1
of biomass) 27.27 29.62 27.59 26.06
Mass balance (wt.%)
Gas/(biomass+water) 28.80 29.94 27.69 28.54
Solid/(biomass+water) 9.87 9.54 9.48 9.35
Mass balance 98.58 96.03 92.36 95.24
Gas/(biomass) 70.76 77.71 69.37 73.29
Solid/(biomass) 24.25 24.75 23.75 24.00
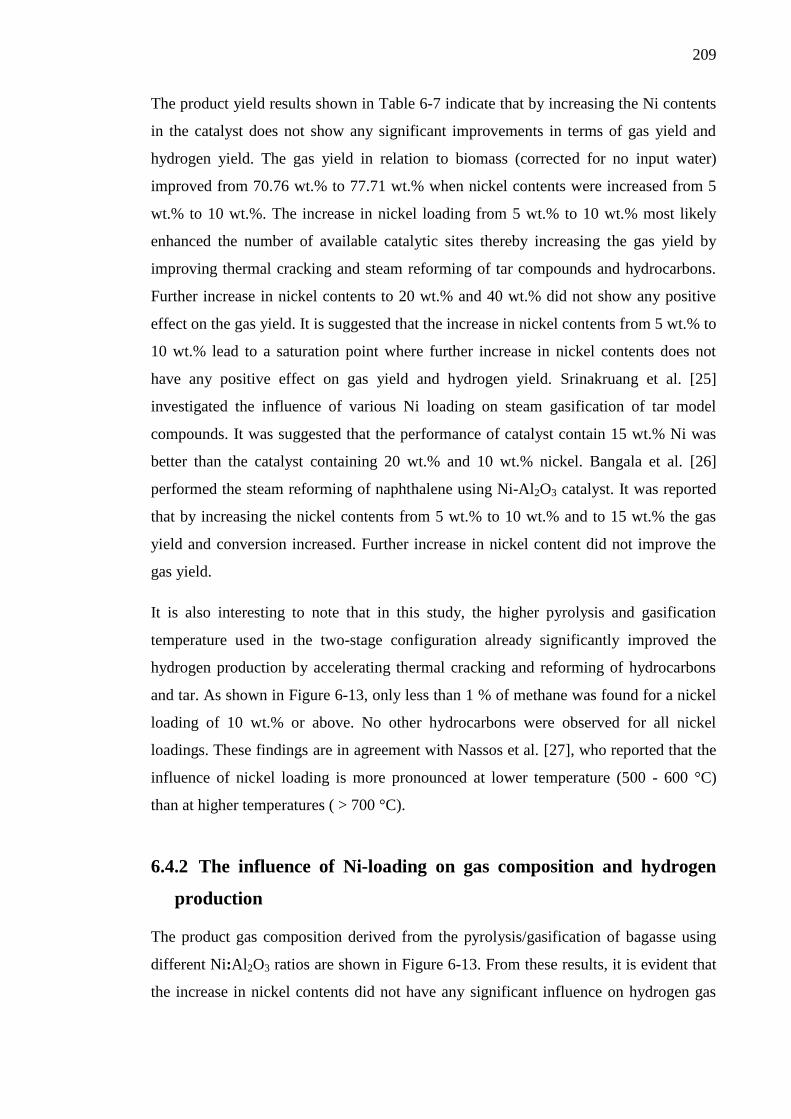
209
The product yield results shown in Table 6-7 indicate that by increasing the Ni contents
in the catalyst does not show any significant improvements in terms of gas yield and
hydrogen yield. The gas yield in relation to biomass (corrected for no input water)
improved from 70.76 wt.% to 77.71 wt.% when nickel contents were increased from 5
wt.% to 10 wt.%. The increase in nickel loading from 5 wt.% to 10 wt.% most likely
enhanced the number of available catalytic sites thereby increasing the gas yield by
improving thermal cracking and steam reforming of tar compounds and hydrocarbons.
Further increase in nickel contents to 20 wt.% and 40 wt.% did not show any positive
effect on the gas yield. It is suggested that the increase in nickel contents from 5 wt.% to
10 wt.% lead to a saturation point where further increase in nickel contents does not
have any positive effect on gas yield and hydrogen yield. Srinakruang et al. [25]
investigated the influence of various Ni loading on steam gasification of tar model
compounds. It was suggested that the performance of catalyst contain 15 wt.% Ni was
better than the catalyst containing 20 wt.% and 10 wt.% nickel. Bangala et al. [26]
performed the steam reforming of naphthalene using Ni-Al2O3 catalyst. It was reported
that by increasing the nickel contents from 5 wt.% to 10 wt.% and to 15 wt.% the gas
yield and conversion increased. Further increase in nickel content did not improve the
gas yield.
It is also interesting to note that in this study, the higher pyrolysis and gasification
temperature used in the two-stage configuration already significantly improved the
hydrogen production by accelerating thermal cracking and reforming of hydrocarbons
and tar. As shown in Figure 6-13, only less than 1 % of methane was found for a nickel
loading of 10 wt.% or above. No other hydrocarbons were observed for all nickel
loadings. These findings are in agreement with Nassos et al. [27], who reported that the
influence of nickel loading is more pronounced at lower temperature (500 - 600 °C)
than at higher temperatures ( > 700 °C).
6.4.2 The influence of Ni-loading on gas composition and hydrogen
production
The product gas composition derived from the pyrolysis/gasification of bagasse using
different Ni:Al2O3 ratios are shown in Figure 6-13. From these results, it is evident that
the increase in nickel contents did not have any significant influence on hydrogen gas
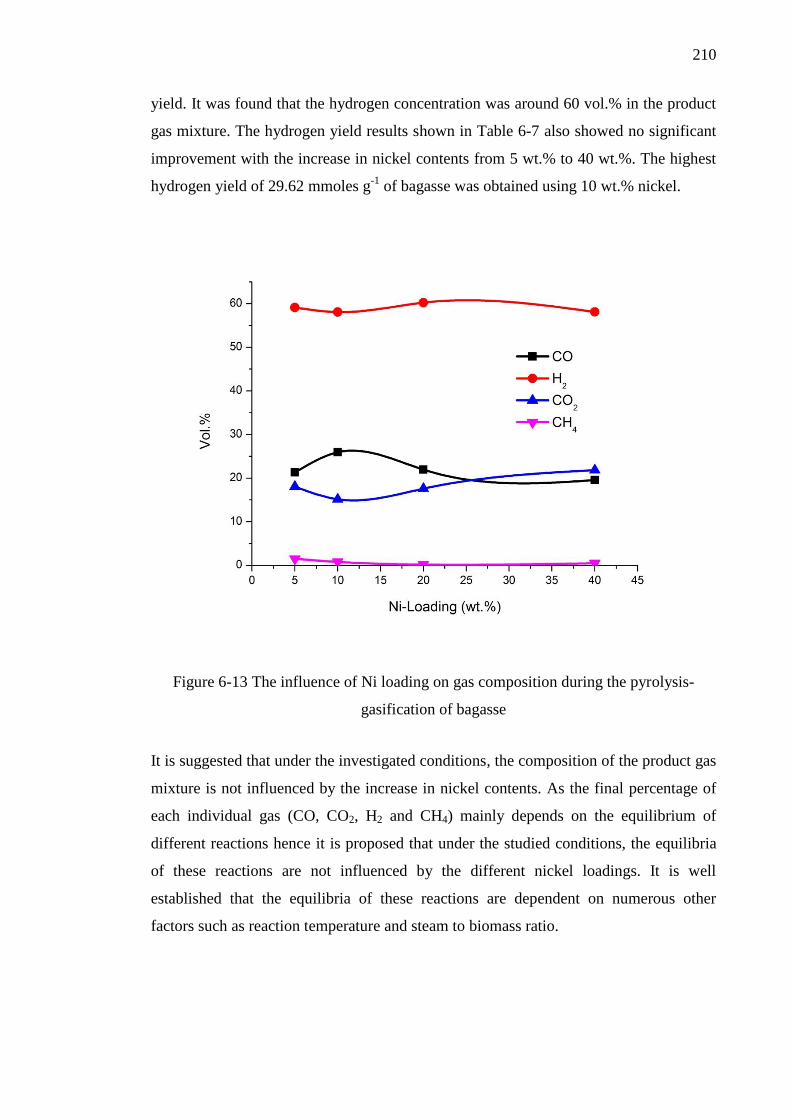
210
yield. It was found that the hydrogen concentration was around 60 vol.% in the product
gas mixture. The hydrogen yield results shown in Table 6-7 also showed no significant
improvement with the increase in nickel contents from 5 wt.% to 40 wt.%. The highest
hydrogen yield of 29.62 mmoles g-1
of bagasse was obtained using 10 wt.% nickel.
Figure 6-13 The influence of Ni loading on gas composition during the pyrolysis-
gasification of bagasse
It is suggested that under the investigated conditions, the composition of the product gas
mixture is not influenced by the increase in nickel contents. As the final percentage of
each individual gas (CO, CO2, H2 and CH4) mainly depends on the equilibrium of
different reactions hence it is proposed that under the studied conditions, the equilibria
of these reactions are not influenced by the different nickel loadings. It is well
established that the equilibria of these reactions are dependent on numerous other
factors such as reaction temperature and steam to biomass ratio.
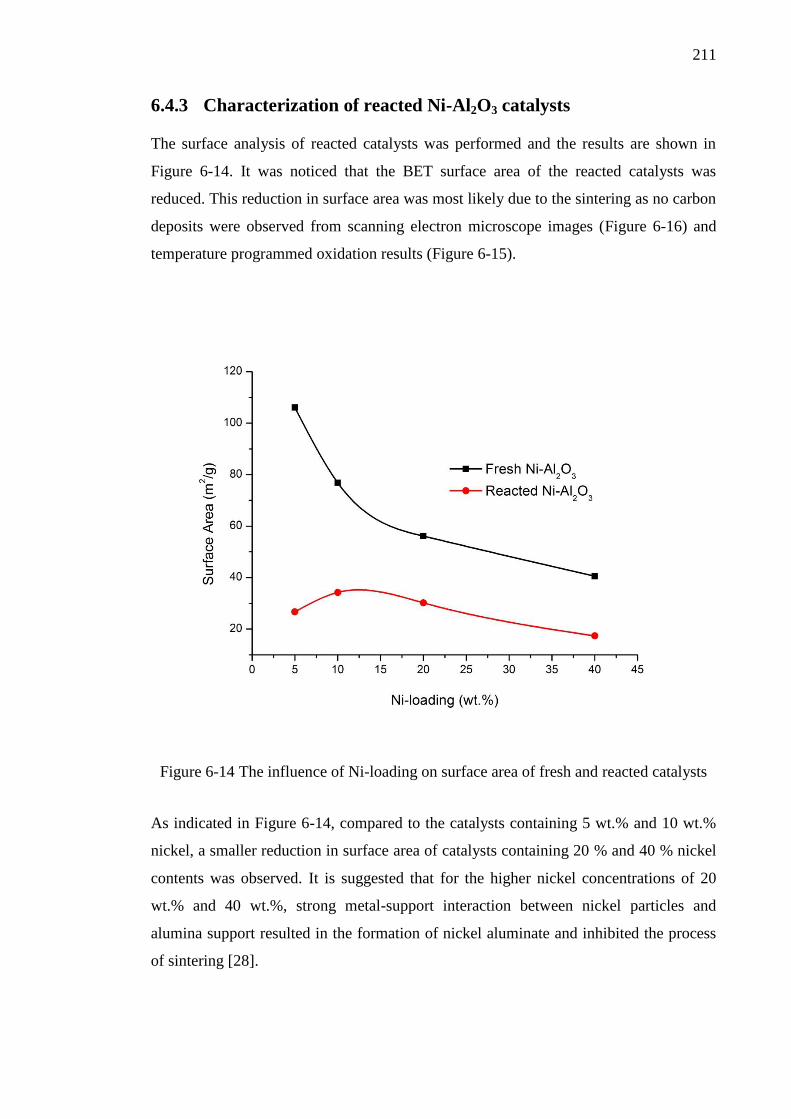
211
6.4.3 Characterization of reacted Ni-Al2O3 catalysts
The surface analysis of reacted catalysts was performed and the results are shown in
Figure 6-14. It was noticed that the BET surface area of the reacted catalysts was
reduced. This reduction in surface area was most likely due to the sintering as no carbon
deposits were observed from scanning electron microscope images (Figure 6-16) and
temperature programmed oxidation results (Figure 6-15).
Figure 6-14 The influence of Ni-loading on surface area of fresh and reacted catalysts
As indicated in Figure 6-14, compared to the catalysts containing 5 wt.% and 10 wt.%
nickel, a smaller reduction in surface area of catalysts containing 20 % and 40 % nickel
contents was observed. It is suggested that for the higher nickel concentrations of 20
wt.% and 40 wt.%, strong metal-support interaction between nickel particles and
alumina support resulted in the formation of nickel aluminate and inhibited the process
of sintering [28].
212
Figure 6-15 TGA-TPO and DTG-TPO results showing the effect of Ni-loading on
reacted Ni-alumina catalyst during the pyrolysis-gasification of bagasse
Temperature programmed oxidation of reacted catalysts was performed to investigate
the presence of any carbon deposits however no weight loss was observed from TGA-
TPO and DTG-TPO results (shown in Figure 6-15) indicate the absence of any carbon
deposits. The scanning electron microscope images (Figure 6-16) also confirm the
absence of any carbon deposits on the catalyst surface. A systematic increase in catalyst
weight with the increase in nickel loading suggest that the metallic nickel was oxidised
during temperature programmed oxidation as the higher oxidation curve was observed
for catalysts containing higher nickel contents.
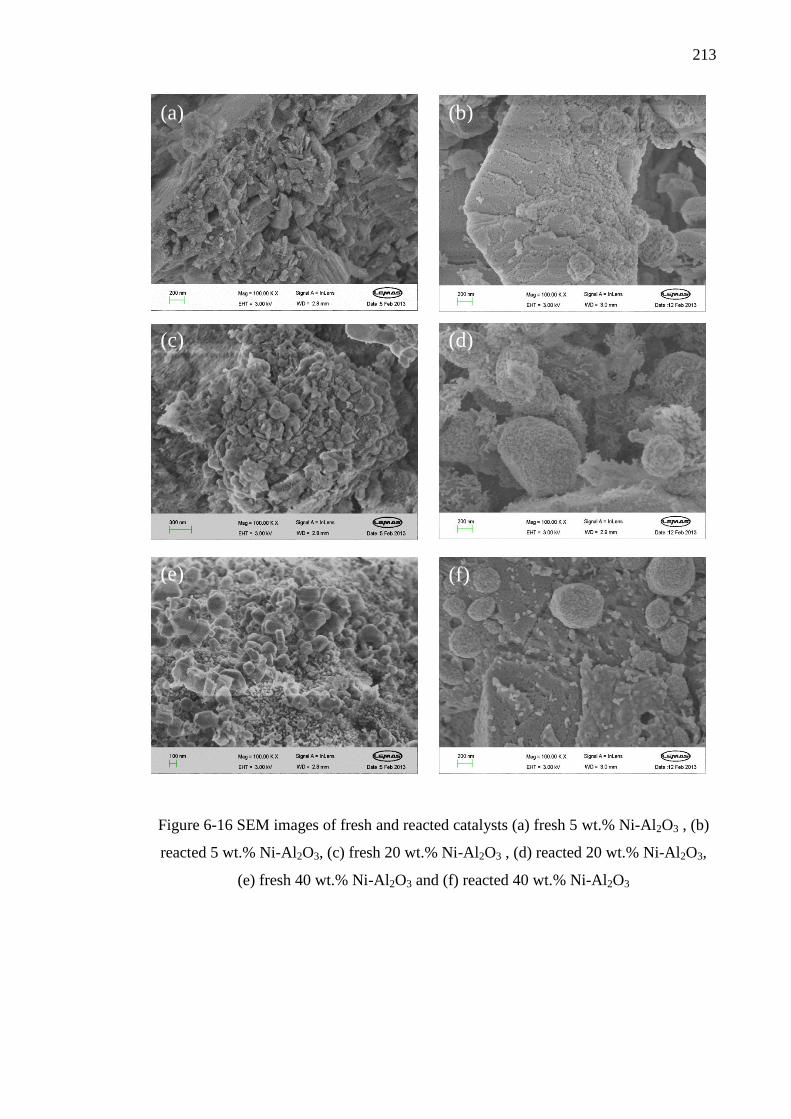
213
Figure 6-16 SEM images of fresh and reacted catalysts (a) fresh 5 wt.% Ni-Al2O3 , (b)
reacted 5 wt.% Ni-Al2O3, (c) fresh 20 wt.% Ni-Al2O3 , (d) reacted 20 wt.% Ni-Al2O3,
(e) fresh 40 wt.% Ni-Al2O3 and (f) reacted 40 wt.% Ni-Al2O3
(d) (c)
(e) (f)
(a) (b)
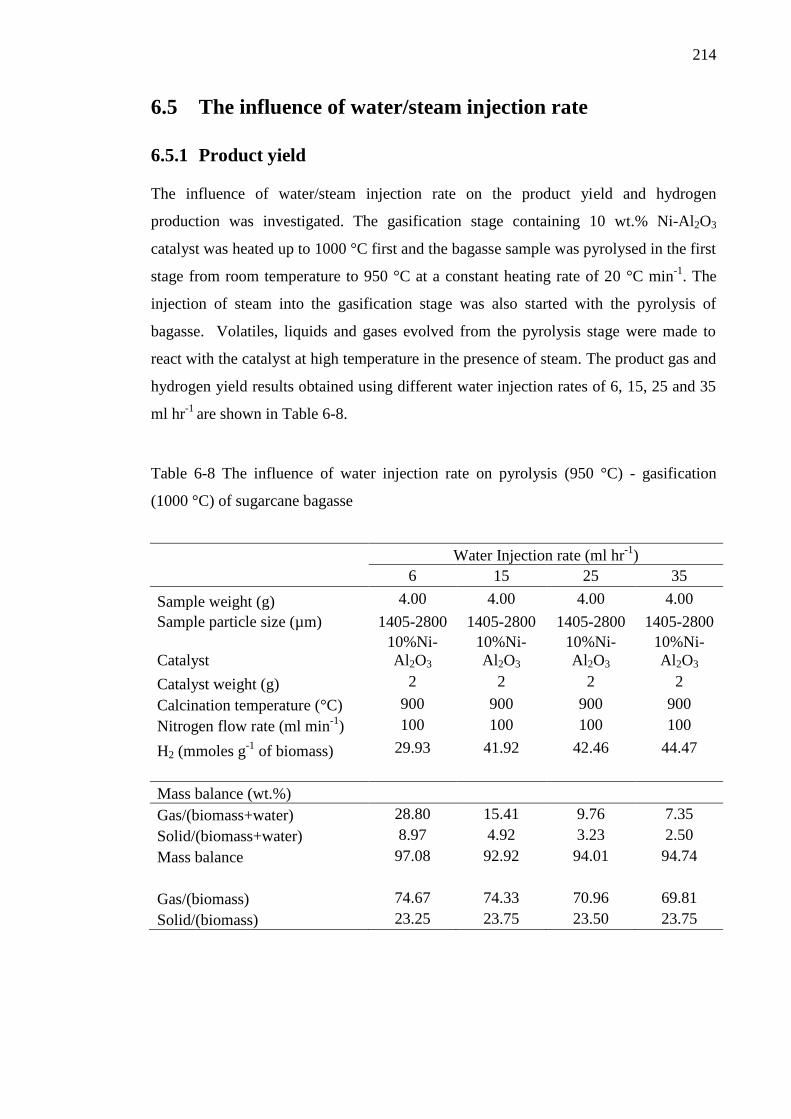
214
6.5 The influence of water/steam injection rate
6.5.1 Product yield
The influence of water/steam injection rate on the product yield and hydrogen
production was investigated. The gasification stage containing 10 wt.% Ni-Al2O3
catalyst was heated up to 1000 °C first and the bagasse sample was pyrolysed in the first
stage from room temperature to 950 °C at a constant heating rate of 20 °C min-1
. The
injection of steam into the gasification stage was also started with the pyrolysis of
bagasse. Volatiles, liquids and gases evolved from the pyrolysis stage were made to
react with the catalyst at high temperature in the presence of steam. The product gas and
hydrogen yield results obtained using different water injection rates of 6, 15, 25 and 35
ml hr-1
are shown in Table 6-8.
Table 6-8 The influence of water injection rate on pyrolysis (950 °C) - gasification
(1000 °C) of sugarcane bagasse
Water Injection rate (ml hr-1
)
6 15 25 35
Sample weight (g) 4.00 4.00 4.00 4.00
Sample particle size (µm) 1405-2800 1405-2800 1405-2800 1405-2800
Catalyst
10%Ni-
Al2O3
10%Ni-
Al2O3
10%Ni-
Al2O3
10%Ni-
Al2O3
Catalyst weight (g) 2 2 2 2
Calcination temperature (°C) 900 900 900 900
Nitrogen flow rate (ml min-1
) 100 100 100 100
H2 (mmoles g-1
of biomass) 29.93 41.92 42.46 44.47
Mass balance (wt.%)
Gas/(biomass+water) 28.80 15.41 9.76 7.35
Solid/(biomass+water) 8.97 4.92 3.23 2.50
Mass balance 97.08 92.92 94.01 94.74
Gas/(biomass) 74.67 74.33 70.96 69.81
Solid/(biomass) 23.25 23.75 23.50 23.75
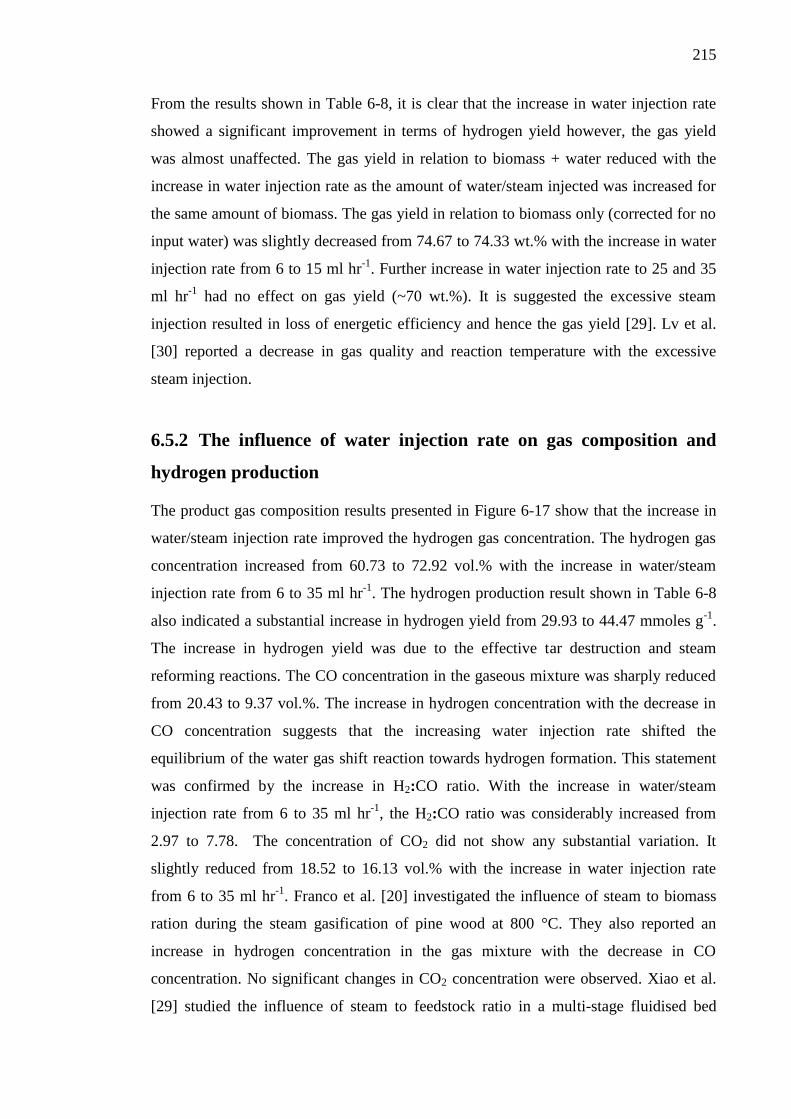
215
From the results shown in Table 6-8, it is clear that the increase in water injection rate
showed a significant improvement in terms of hydrogen yield however, the gas yield
was almost unaffected. The gas yield in relation to biomass + water reduced with the
increase in water injection rate as the amount of water/steam injected was increased for
the same amount of biomass. The gas yield in relation to biomass only (corrected for no
input water) was slightly decreased from 74.67 to 74.33 wt.% with the increase in water
injection rate from 6 to 15 ml hr-1
. Further increase in water injection rate to 25 and 35
ml hr-1
had no effect on gas yield (~70 wt.%). It is suggested the excessive steam
injection resulted in loss of energetic efficiency and hence the gas yield [29]. Lv et al.
[30] reported a decrease in gas quality and reaction temperature with the excessive
steam injection.
6.5.2 The influence of water injection rate on gas composition and
hydrogen production
The product gas composition results presented in Figure 6-17 show that the increase in
water/steam injection rate improved the hydrogen gas concentration. The hydrogen gas
concentration increased from 60.73 to 72.92 vol.% with the increase in water/steam
injection rate from 6 to 35 ml hr-1
. The hydrogen production result shown in Table 6-8
also indicated a substantial increase in hydrogen yield from 29.93 to 44.47 mmoles g-1
.
The increase in hydrogen yield was due to the effective tar destruction and steam
reforming reactions. The CO concentration in the gaseous mixture was sharply reduced
from 20.43 to 9.37 vol.%. The increase in hydrogen concentration with the decrease in
CO concentration suggests that the increasing water injection rate shifted the
equilibrium of the water gas shift reaction towards hydrogen formation. This statement
was confirmed by the increase in H2:CO ratio. With the increase in water/steam
injection rate from 6 to 35 ml hr-1
, the H2:CO ratio was considerably increased from
2.97 to 7.78. The concentration of CO2 did not show any substantial variation. It
slightly reduced from 18.52 to 16.13 vol.% with the increase in water injection rate
from 6 to 35 ml hr-1
. Franco et al. [20] investigated the influence of steam to biomass
ration during the steam gasification of pine wood at 800 °C. They also reported an
increase in hydrogen concentration in the gas mixture with the decrease in CO
concentration. No significant changes in CO2 concentration were observed. Xiao et al.
[29] studied the influence of steam to feedstock ratio in a multi-stage fluidised bed
216
reactor. It was observed that the increase in steam to biomass ratio resulted in an
increase in hydrogen concentration with a decrease in CO concentration.
Figure 6-17 The influence of water injection rate on gas composition
It is suggested that the presence of steam or increase in steam concentration affects the
equilibrium of various reactions. It is interesting to note that the increase in water/steam
injection rate from 6 to 35 ml hr-1
led to a slight increase in methane concentration from
0.32 to 1.58 vol.%. This increase in methane concentration at higher water injection rate
was most likely due to the shift of equilibrium of the methane formation reaction.
Franco et al. [20] also suggested that the increase in methane concentration at higher
steam to biomass ratios was due to the methanation reaction.
The TGA-TPO and DTG-TPO thermograms of reacted catalysts are plotted in Figure
6-18. From these results it is evident that the process of gasification was efficient under
these conditions and no carbon deposits were observed on the reacted catalysts. As the
higher gasification temperature of 1000 °C was used during this study, catalyst was
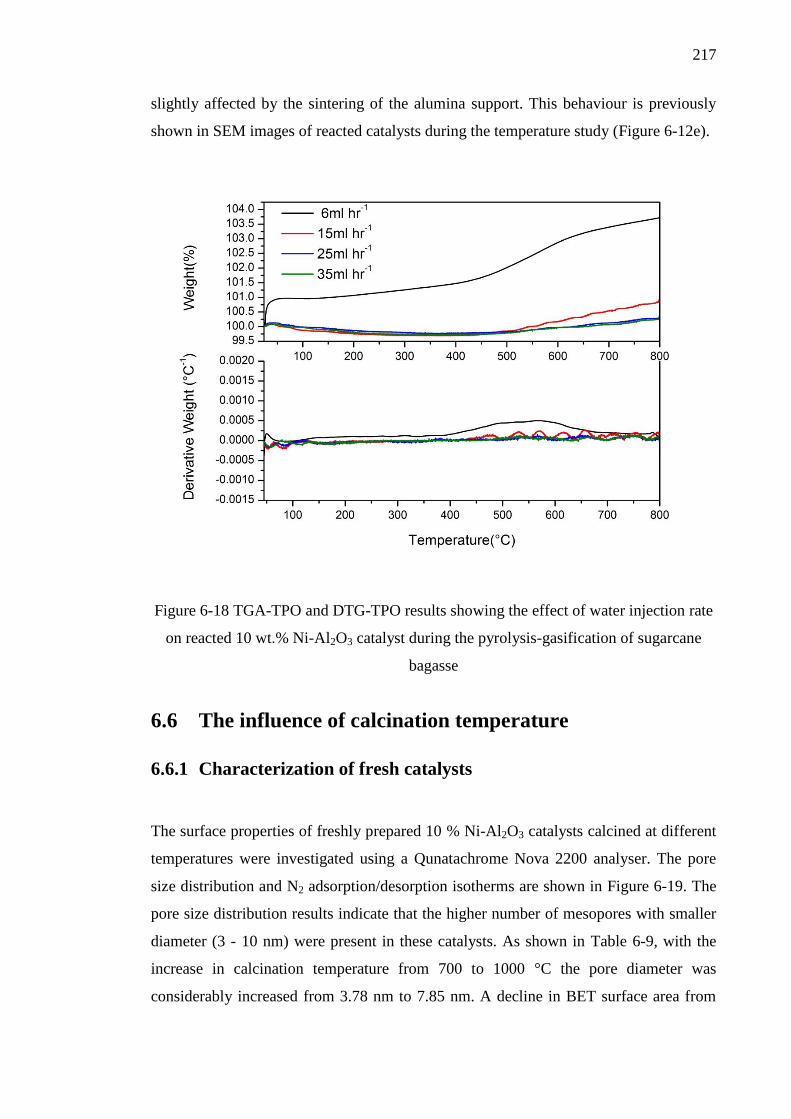
217
slightly affected by the sintering of the alumina support. This behaviour is previously
shown in SEM images of reacted catalysts during the temperature study (Figure 6-12e).
Figure 6-18 TGA-TPO and DTG-TPO results showing the effect of water injection rate
on reacted 10 wt.% Ni-Al2O3 catalyst during the pyrolysis-gasification of sugarcane
bagasse
6.6 The influence of calcination temperature
6.6.1 Characterization of fresh catalysts
The surface properties of freshly prepared 10 % Ni-Al2O3 catalysts calcined at different
temperatures were investigated using a Qunatachrome Nova 2200 analyser. The pore
size distribution and N2 adsorption/desorption isotherms are shown in Figure 6-19. The
pore size distribution results indicate that the higher number of mesopores with smaller
diameter (3 - 10 nm) were present in these catalysts. As shown in Table 6-9, with the
increase in calcination temperature from 700 to 1000 °C the pore diameter was
considerably increased from 3.78 nm to 7.85 nm. A decline in BET surface area from
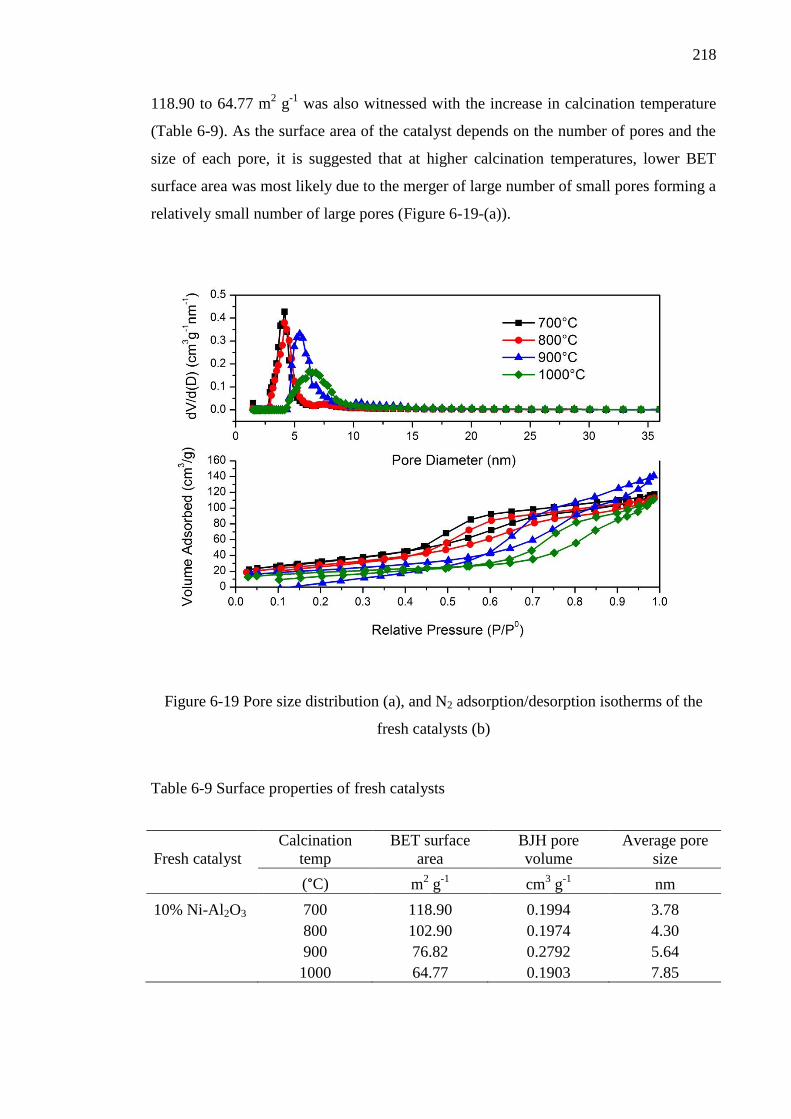
218
118.90 to 64.77 m2 g
-1 was also witnessed with the increase in calcination temperature
(Table 6-9). As the surface area of the catalyst depends on the number of pores and the
size of each pore, it is suggested that at higher calcination temperatures, lower BET
surface area was most likely due to the merger of large number of small pores forming a
relatively small number of large pores (Figure 6-19-(a)).
Figure 6-19 Pore size distribution (a), and N2 adsorption/desorption isotherms of the
fresh catalysts (b)
Table 6-9 Surface properties of fresh catalysts
Fresh catalyst
Calcination
temp
BET surface
area
BJH pore
volume
Average pore
size
(°C) m2 g
-1 cm
3 g
-1 nm
10% Ni-Al2O3 700 118.90 0.1994 3.78
800 102.90 0.1974 4.30
900 76.82 0.2792 5.64
1000 64.77 0.1903 7.85
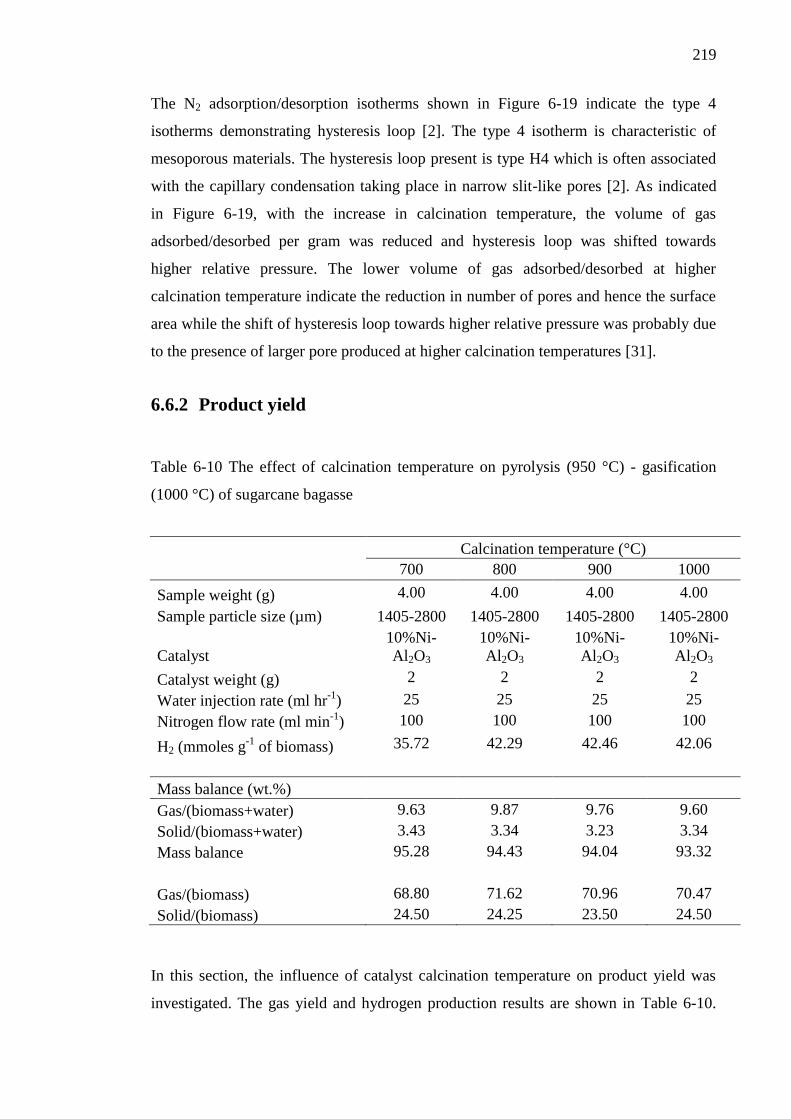
219
The N2 adsorption/desorption isotherms shown in Figure 6-19 indicate the type 4
isotherms demonstrating hysteresis loop [2]. The type 4 isotherm is characteristic of
mesoporous materials. The hysteresis loop present is type H4 which is often associated
with the capillary condensation taking place in narrow slit-like pores [2]. As indicated
in Figure 6-19, with the increase in calcination temperature, the volume of gas
adsorbed/desorbed per gram was reduced and hysteresis loop was shifted towards
higher relative pressure. The lower volume of gas adsorbed/desorbed at higher
calcination temperature indicate the reduction in number of pores and hence the surface
area while the shift of hysteresis loop towards higher relative pressure was probably due
to the presence of larger pore produced at higher calcination temperatures [31].
6.6.2 Product yield
Table 6-10 The effect of calcination temperature on pyrolysis (950 °C) - gasification
(1000 °C) of sugarcane bagasse
Calcination temperature (°C)
700 800 900 1000
Sample weight (g) 4.00 4.00 4.00 4.00
Sample particle size (µm) 1405-2800 1405-2800 1405-2800 1405-2800
Catalyst
10%Ni-
Al2O3
10%Ni-
Al2O3
10%Ni-
Al2O3
10%Ni-
Al2O3
Catalyst weight (g) 2 2 2 2
Water injection rate (ml hr-1
) 25 25 25 25
Nitrogen flow rate (ml min-1
) 100 100 100 100
H2 (mmoles g-1
of biomass) 35.72 42.29 42.46 42.06
Mass balance (wt.%)
Gas/(biomass+water) 9.63 9.87 9.76 9.60
Solid/(biomass+water) 3.43 3.34 3.23 3.34
Mass balance 95.28 94.43 94.04 93.32
Gas/(biomass) 68.80 71.62 70.96 70.47
Solid/(biomass) 24.50 24.25 23.50 24.50
In this section, the influence of catalyst calcination temperature on product yield was
investigated. The gas yield and hydrogen production results are shown in Table 6-10.
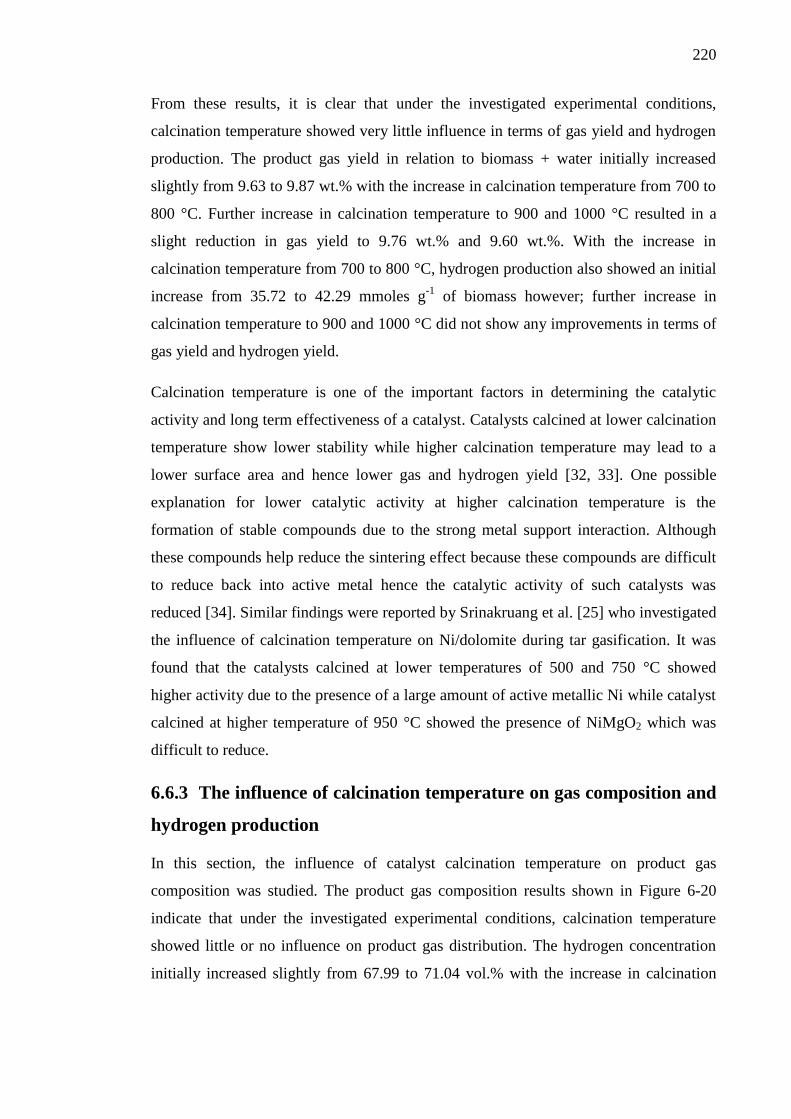
220
From these results, it is clear that under the investigated experimental conditions,
calcination temperature showed very little influence in terms of gas yield and hydrogen
production. The product gas yield in relation to biomass + water initially increased
slightly from 9.63 to 9.87 wt.% with the increase in calcination temperature from 700 to
800 °C. Further increase in calcination temperature to 900 and 1000 °C resulted in a
slight reduction in gas yield to 9.76 wt.% and 9.60 wt.%. With the increase in
calcination temperature from 700 to 800 °C, hydrogen production also showed an initial
increase from 35.72 to 42.29 mmoles g-1
of biomass however; further increase in
calcination temperature to 900 and 1000 °C did not show any improvements in terms of
gas yield and hydrogen yield.
Calcination temperature is one of the important factors in determining the catalytic
activity and long term effectiveness of a catalyst. Catalysts calcined at lower calcination
temperature show lower stability while higher calcination temperature may lead to a
lower surface area and hence lower gas and hydrogen yield [32, 33]. One possible
explanation for lower catalytic activity at higher calcination temperature is the
formation of stable compounds due to the strong metal support interaction. Although
these compounds help reduce the sintering effect because these compounds are difficult
to reduce back into active metal hence the catalytic activity of such catalysts was
reduced [34]. Similar findings were reported by Srinakruang et al. [25] who investigated
the influence of calcination temperature on Ni/dolomite during tar gasification. It was
found that the catalysts calcined at lower temperatures of 500 and 750 °C showed
higher activity due to the presence of a large amount of active metallic Ni while catalyst
calcined at higher temperature of 950 °C showed the presence of NiMgO2 which was
difficult to reduce.
6.6.3 The influence of calcination temperature on gas composition and
hydrogen production
In this section, the influence of catalyst calcination temperature on product gas
composition was studied. The product gas composition results shown in Figure 6-20
indicate that under the investigated experimental conditions, calcination temperature
showed little or no influence on product gas distribution. The hydrogen concentration
initially increased slightly from 67.99 to 71.04 vol.% with the increase in calcination
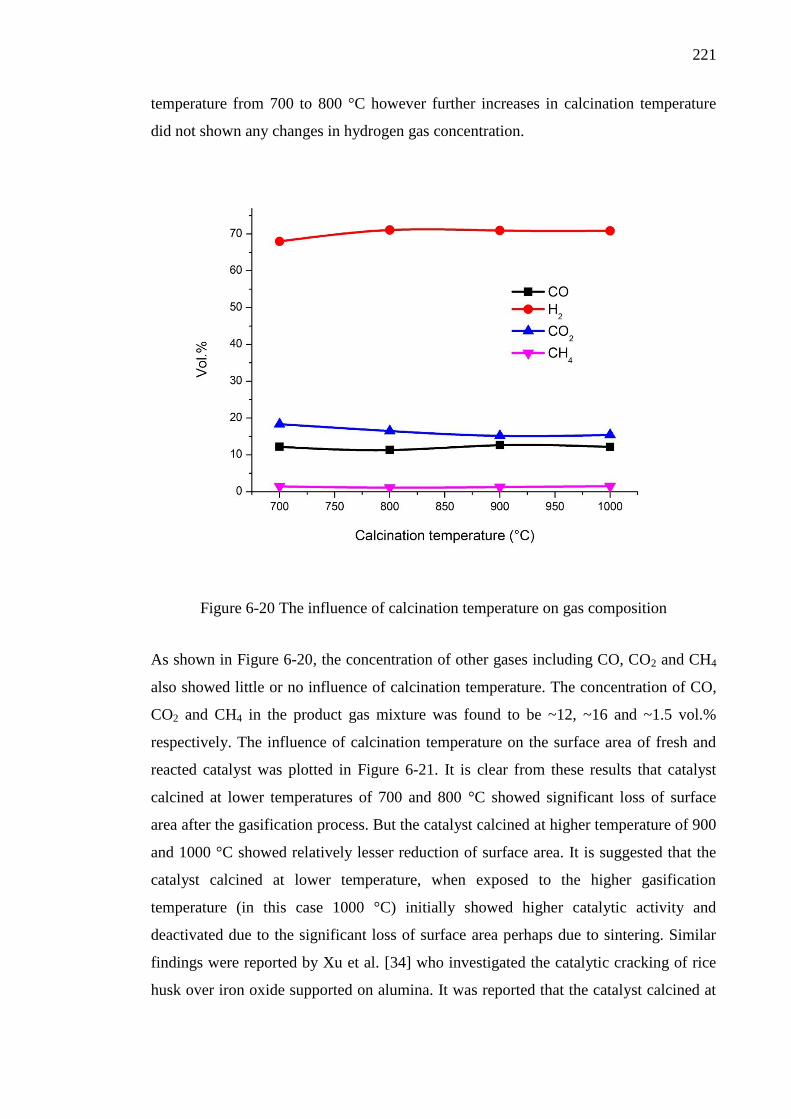
221
temperature from 700 to 800 °C however further increases in calcination temperature
did not shown any changes in hydrogen gas concentration.
Figure 6-20 The influence of calcination temperature on gas composition
As shown in Figure 6-20, the concentration of other gases including CO, CO2 and CH4
also showed little or no influence of calcination temperature. The concentration of CO,
CO2 and CH4 in the product gas mixture was found to be ~12, ~16 and ~1.5 vol.%
respectively. The influence of calcination temperature on the surface area of fresh and
reacted catalyst was plotted in Figure 6-21. It is clear from these results that catalyst
calcined at lower temperatures of 700 and 800 °C showed significant loss of surface
area after the gasification process. But the catalyst calcined at higher temperature of 900
and 1000 °C showed relatively lesser reduction of surface area. It is suggested that the
catalyst calcined at lower temperature, when exposed to the higher gasification
temperature (in this case 1000 °C) initially showed higher catalytic activity and
deactivated due to the significant loss of surface area perhaps due to sintering. Similar
findings were reported by Xu et al. [34] who investigated the catalytic cracking of rice
husk over iron oxide supported on alumina. It was reported that the catalyst calcined at
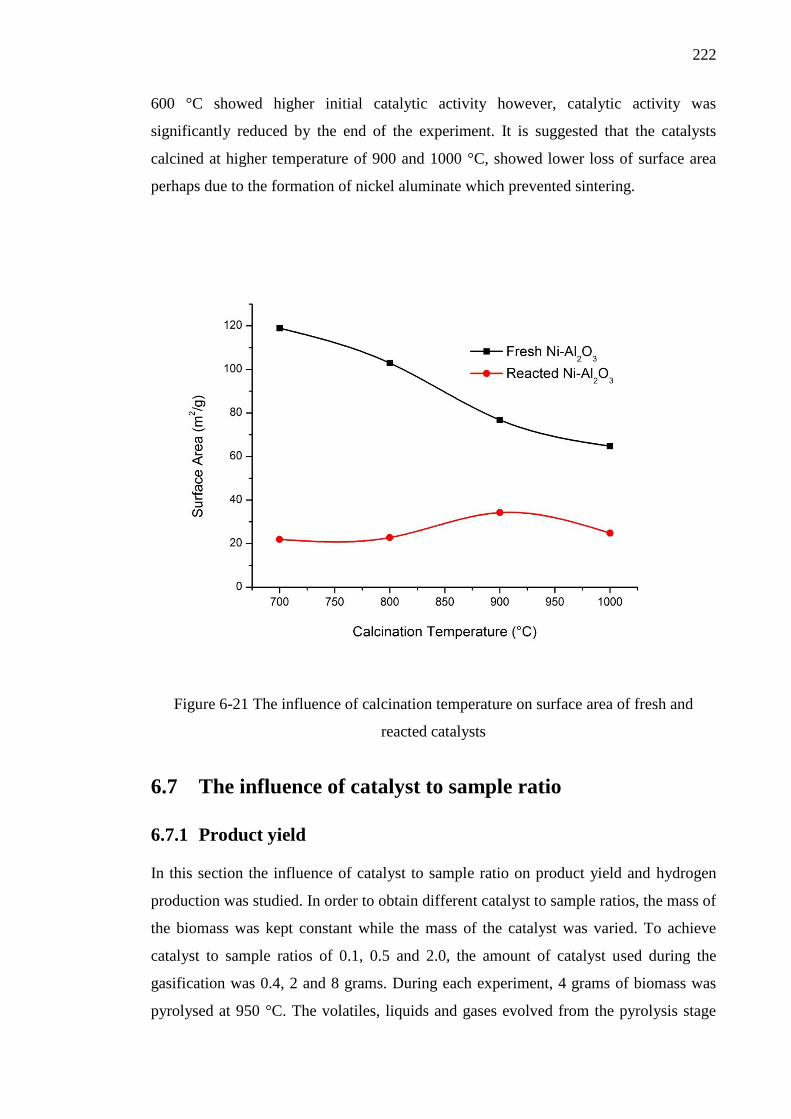
222
600 °C showed higher initial catalytic activity however, catalytic activity was
significantly reduced by the end of the experiment. It is suggested that the catalysts
calcined at higher temperature of 900 and 1000 °C, showed lower loss of surface area
perhaps due to the formation of nickel aluminate which prevented sintering.
Figure 6-21 The influence of calcination temperature on surface area of fresh and
reacted catalysts
6.7 The influence of catalyst to sample ratio
6.7.1 Product yield
In this section the influence of catalyst to sample ratio on product yield and hydrogen
production was studied. In order to obtain different catalyst to sample ratios, the mass of
the biomass was kept constant while the mass of the catalyst was varied. To achieve
catalyst to sample ratios of 0.1, 0.5 and 2.0, the amount of catalyst used during the
gasification was 0.4, 2 and 8 grams. During each experiment, 4 grams of biomass was
pyrolysed at 950 °C. The volatiles, liquids and gases evolved from the pyrolysis stage
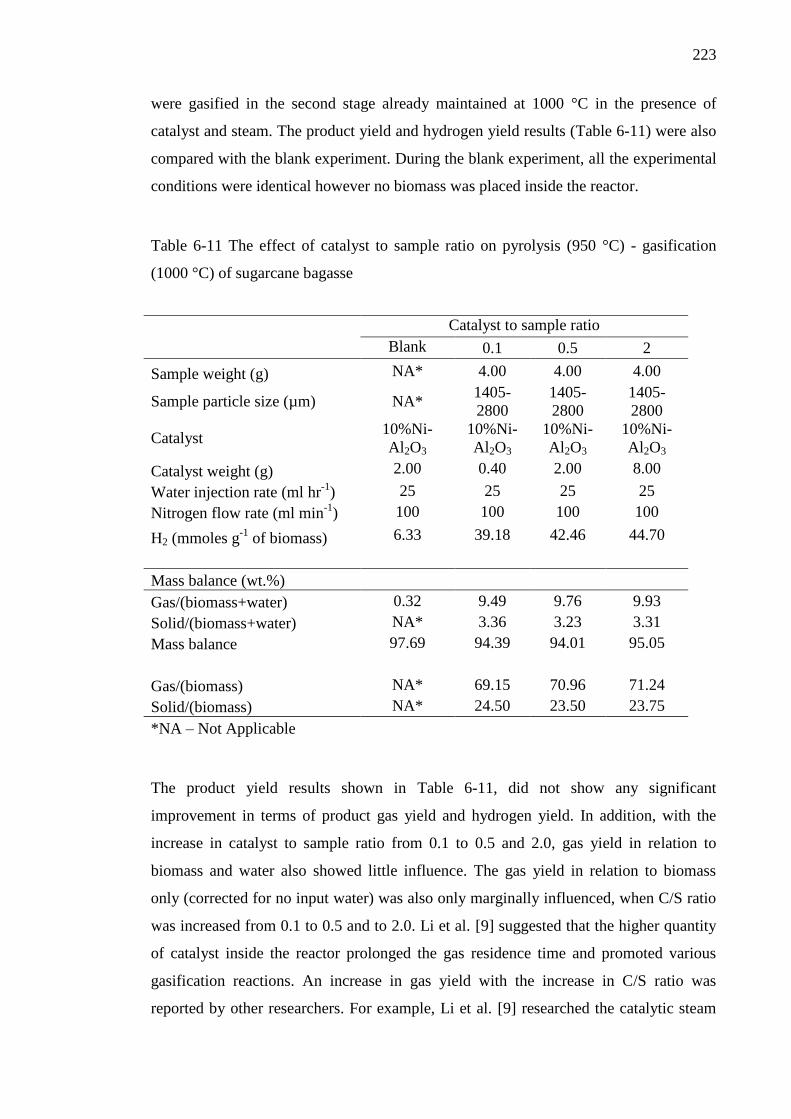
223
were gasified in the second stage already maintained at 1000 °C in the presence of
catalyst and steam. The product yield and hydrogen yield results (Table 6-11) were also
compared with the blank experiment. During the blank experiment, all the experimental
conditions were identical however no biomass was placed inside the reactor.
Table 6-11 The effect of catalyst to sample ratio on pyrolysis (950 °C) - gasification
(1000 °C) of sugarcane bagasse
Catalyst to sample ratio
Blank 0.1 0.5 2
Sample weight (g) NA* 4.00 4.00 4.00
Sample particle size (µm) NA* 1405-
2800
1405-
2800
1405-
2800
Catalyst 10%Ni-
Al2O3
10%Ni-
Al2O3
10%Ni-
Al2O3
10%Ni-
Al2O3
Catalyst weight (g) 2.00 0.40 2.00 8.00
Water injection rate (ml hr-1
) 25 25 25 25
Nitrogen flow rate (ml min-1
) 100 100 100 100
H2 (mmoles g-1
of biomass) 6.33 39.18 42.46 44.70
Mass balance (wt.%)
Gas/(biomass+water) 0.32 9.49 9.76 9.93
Solid/(biomass+water) NA* 3.36 3.23 3.31
Mass balance 97.69 94.39 94.01 95.05
Gas/(biomass) NA* 69.15 70.96 71.24
Solid/(biomass) NA* 24.50 23.50 23.75
*NA – Not Applicable
The product yield results shown in Table 6-11, did not show any significant
improvement in terms of product gas yield and hydrogen yield. In addition, with the
increase in catalyst to sample ratio from 0.1 to 0.5 and 2.0, gas yield in relation to
biomass and water also showed little influence. The gas yield in relation to biomass
only (corrected for no input water) was also only marginally influenced, when C/S ratio
was increased from 0.1 to 0.5 and to 2.0. Li et al. [9] suggested that the higher quantity
of catalyst inside the reactor prolonged the gas residence time and promoted various
gasification reactions. An increase in gas yield with the increase in C/S ratio was
reported by other researchers. For example, Li et al. [9] researched the catalytic steam
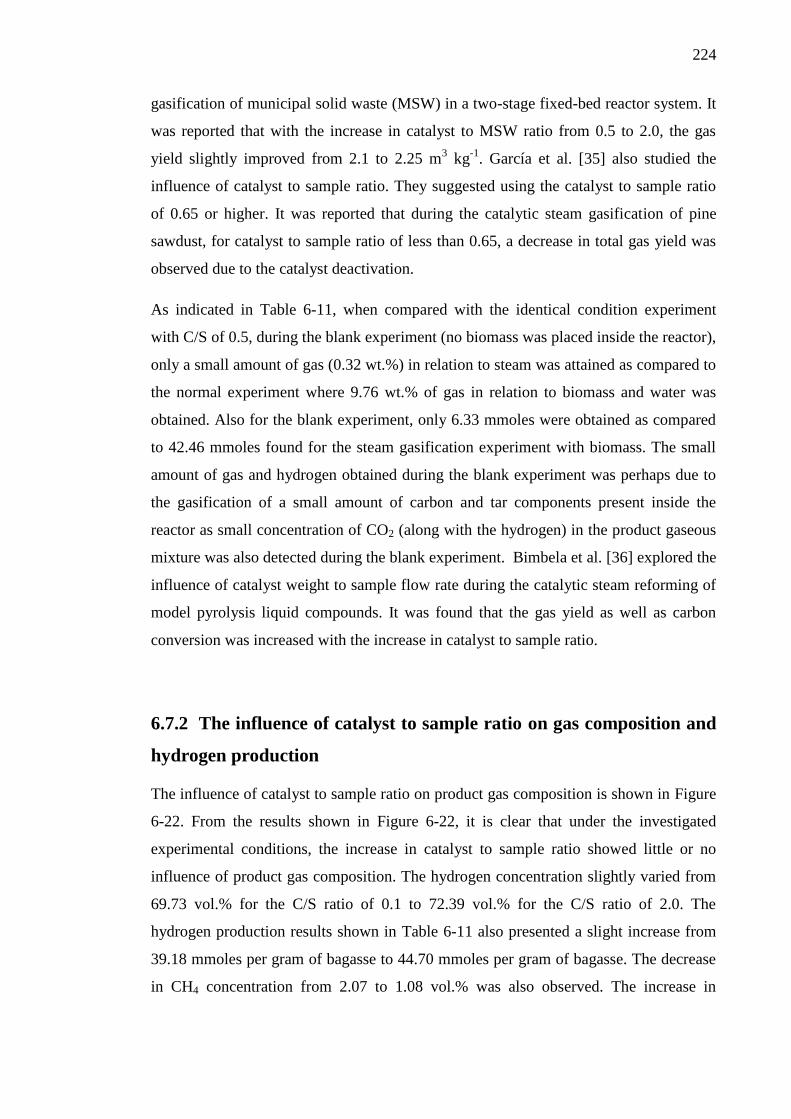
224
gasification of municipal solid waste (MSW) in a two-stage fixed-bed reactor system. It
was reported that with the increase in catalyst to MSW ratio from 0.5 to 2.0, the gas
yield slightly improved from 2.1 to 2.25 m3 kg
-1. García et al. [35] also studied the
influence of catalyst to sample ratio. They suggested using the catalyst to sample ratio
of 0.65 or higher. It was reported that during the catalytic steam gasification of pine
sawdust, for catalyst to sample ratio of less than 0.65, a decrease in total gas yield was
observed due to the catalyst deactivation.
As indicated in Table 6-11, when compared with the identical condition experiment
with C/S of 0.5, during the blank experiment (no biomass was placed inside the reactor),
only a small amount of gas (0.32 wt.%) in relation to steam was attained as compared to
the normal experiment where 9.76 wt.% of gas in relation to biomass and water was
obtained. Also for the blank experiment, only 6.33 mmoles were obtained as compared
to 42.46 mmoles found for the steam gasification experiment with biomass. The small
amount of gas and hydrogen obtained during the blank experiment was perhaps due to
the gasification of a small amount of carbon and tar components present inside the
reactor as small concentration of CO2 (along with the hydrogen) in the product gaseous
mixture was also detected during the blank experiment. Bimbela et al. [36] explored the
influence of catalyst weight to sample flow rate during the catalytic steam reforming of
model pyrolysis liquid compounds. It was found that the gas yield as well as carbon
conversion was increased with the increase in catalyst to sample ratio.
6.7.2 The influence of catalyst to sample ratio on gas composition and
hydrogen production
The influence of catalyst to sample ratio on product gas composition is shown in Figure
6-22. From the results shown in Figure 6-22, it is clear that under the investigated
experimental conditions, the increase in catalyst to sample ratio showed little or no
influence of product gas composition. The hydrogen concentration slightly varied from
69.73 vol.% for the C/S ratio of 0.1 to 72.39 vol.% for the C/S ratio of 2.0. The
hydrogen production results shown in Table 6-11 also presented a slight increase from
39.18 mmoles per gram of bagasse to 44.70 mmoles per gram of bagasse. The decrease
in CH4 concentration from 2.07 to 1.08 vol.% was also observed. The increase in
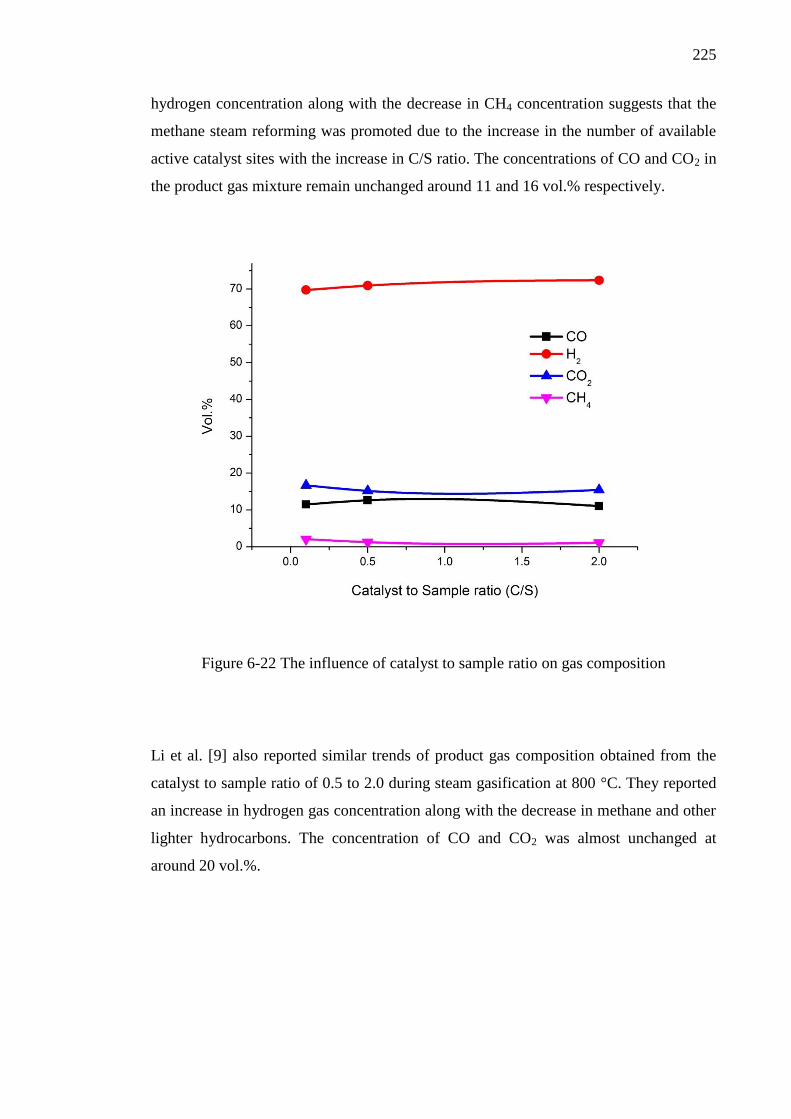
225
hydrogen concentration along with the decrease in CH4 concentration suggests that the
methane steam reforming was promoted due to the increase in the number of available
active catalyst sites with the increase in C/S ratio. The concentrations of CO and CO2 in
the product gas mixture remain unchanged around 11 and 16 vol.% respectively.
Figure 6-22 The influence of catalyst to sample ratio on gas composition
Li et al. [9] also reported similar trends of product gas composition obtained from the
catalyst to sample ratio of 0.5 to 2.0 during steam gasification at 800 °C. They reported
an increase in hydrogen gas concentration along with the decrease in methane and other
lighter hydrocarbons. The concentration of CO and CO2 was almost unchanged at
around 20 vol.%.
226
6.8 Conclusions
In this chapter catalyst selection and several other process conditions were researched
with the aim to maximize the hydrogen yield from two-stage pyrolysis/gasification of
sugarcane bagasse. The following conclusions can be made from this chapter.
During the catalyst selection process (Section 6.2), seven different Ni-based
catalysts; 10 % Ni-dolomite, 10 % Ni-MgO, 10 % Ni-SiO2, 10 % Ni-Al2O3, 2
wt.% Ce – 10 % Ni-dolomite, 5 wt.% Ce – 10 % Ni-dolomite and 10 wt.% Ce -
10 % Ni-dolomite were investigated. When compared with the silica sand as a
substitute, the 10 % Ni-Al2O3 catalyst produced the highest hydrogen yield of
29.62 mmoles per gram of bagasse (Table 6-2) at a gasification temperature of
950 °C. Compared to the other catalysts, the higher hydrogen yield obtained
using the 10 % Ni-Al2O3 catalyst was due to the higher surface area of this
catalyst. Hence the 10 % Ni-Al2O3 catalyst was selected for further investigation
of other process conditions like gasification temperature, water injection rate.
The gasification temperature showed a positive influence on hydrogen yield.
The hydrogen yield increased from 21.17 mmoles g-1
at 800 °C to 35.65 mmoles
g-1
at 1050 °C. It was noticed that the hydrogen concentration in the product gas
mixture was also increased from 50.31 vol.% at 800 °C to 67.40 vol.% at
1050 °C. The increase in hydrogen concentration with the increase in
gasification temperature was due to the enhanced thermal cracking and catalytic
reforming of tar and hydrocarbons. Higher gasification temperatures also
favoured different endothermic reactions resulting in higher gas yield and
hydrogen yield.
In section 6.4, the influence of nickel loading on Ni-Al2O3 catalyst was
researched. The amount of nickel in catalyst was increased from 5 wt.% to 10
wt.%, 20 wt.% and to 40 wt.%. The increase in nickel contents shows little or no
influence on hydrogen yield. The highest hydrogen yield of 29.62 mmoles g-1
was obtained using the 10 wt.% Ni-Al2O3 catalyst. The concentration of
hydrogen was also unchanged at around 60 vol.%.
227
Increasing water/steam injection rate dramatically improved hydrogen yield
from 29.93 mmoles g-1
using 6 ml hr-1
to 44.47 mmoles g-1
using 35 ml hr-1
. By
increasing water/steam injection rate, the equilibrium of the water gas shift
reaction was shifted towards hydrogen formation. The increase in water
injection rate also promoted steam reforming of methane and tar components. A
sharp increase in hydrogen concentration from 60.72 vol.% for 6 ml hr-1
to 72.92
vol.% for 35 ml hr-1
water injection rate was obtained. The increase in H2:CO
ratio from 2.97 to 7.78 confirmed the positive influence of water injection rate on
the water gas shift reaction.
In section 6.6, the influence of calcination temperature on hydrogen yield was
investigated. Initial characterization of fresh catalysts revealed that with the
increase in calcination temperature from 700 to 1000 °C, average pore size was
increased while BET surface area was reduced from 118.90 to 64.77 m2 g
-1.
Hydrogen yield was initially increased from 35.72 to 42.29 mmoles g-1
with the
increase in calcination temperature from 700 to 800 °C, however further
increase in calcination temperature to 900 and 1000 °C did not show any
improvements in hydrogen yield.
The increase in catalyst to biomass sample ratio slightly improved hydrogen
yield. With the increase in C/S ratio from 0.1 to 2.0, hydrogen yield was
increased from 39.18 to 44.70 mmoles per gram of bagasse. It was reported that
this increase in hydrogen yield along with the decrease in methane concentration
was due to the promotion of reforming reactions caused by the increase in the
number of available catalyst sites.
228
6.9 Chapter references
[1] L. I. Darvell, K. Heiskanen, J. M. Jones, A. B. Ross, P. Simell, and A. Williams,
"An investigation of alumina-supported catalysts for the selective catalytic
oxidation of ammonia in biomass gasification," Catalysis Today, vol. 81, pp.
681-692, 2003.
[2] K. Sing, D. Everett;, R. Haul;, L. M. ;, R. P. ;, J. R. ;, et al., "Reporting
Physisorption data for Gas/Solid systems with Special Reference to the
Determination of Surface Area and Porosity," Pure and Applied Chemistry, vol.
57, pp. 603-619, 1985.
[3] P. A. Webb, Orr, Clyde,, Analytical methods in fine particle technology:
Micromeritics Instrument Corporation, 1997.
[4] J. E. S. S. Lowell, Martin A. Thomas, Matthias Thommes, Characterization of
Porous Solids and Powders: Surface Area, Pore Size and Density: Springer
Netherlands, 2004.
[5] V. L. B. J. Requies, J. F. Cambra, M. B. Guemez, P. L. Arias, M. A. Pena, and J.
L. G. Fierro, "Methane Catalytic Wet Partial Oxidation Using Nickel Supported
on Basic Oxides," Journal of New Materials for Electrochemical Systems, vol.
12, pp. 161-166, 2009.
[6] F. Miccio, B. Piriou, G. Ruoppolo, and R. Chirone, "Biomass gasification in a
catalytic fluidized reactor with beds of different materials," Chemical
Engineering Journal, vol. 154, pp. 369-374, 2009.
[7] R. Isha and P. T. Williams, "Hydrogen production from catalytic steam
reforming of methane: influence of catalyst composition," Journal of the Energy
Institute, vol. 85, pp. 29-37, 2012.
[8] Q. Xie, S. Kong, Y. Liu, and H. Zeng, "Syngas production by two-stage method
of biomass catalytic pyrolysis and gasification," Bioresource Technology, vol.
110, pp. 603-609, 4// 2012.
[9] J. L. Jianfen Li, Shiyan Liao, Xiaorong Zhou, Rong Yan "Syn-Gas Production
from Catalytic Steam Gasification of Municipal Solid Wastes in a Combined
Fixed Bed Reactor," 2010, pp. 530-534.
[10] C. S. Nordahl and . L. Messing, "Sintering of α-Al2O3-seeded nanocrystalline
γ-Al2O3 powders," Journal of the European Ceramic Society, vol. 22, pp. 415-
422, 4// 2002.
[11] J.-P. Ahn, J.-K. Park, and H.-W. Lee, "Effect of compact structures on the phase
transition, subsequent densification and microstructure evolution during
sintering of ultrafine gamma alumina powder," Nanostructured Materials, vol.
11, pp. 133-140, 2// 1999.
[12] K. Hessam;, D. Trimm;, M. Wainwright;, and N. Cant, "Phase-transformation of
gamma-alumina to alpha-alumina as an industrial catalyst support,"
International Journal of Engineering, vol. 4, pp. 1-12, 1991.
[13] S. Wang and G. Q. Lu, "Role of CeO2 in Ni/CeO2–Al2O3 catalysts for carbon
dioxide reforming of methane," Applied Catalysis B: Environmental, vol. 19, pp.
267-277, 12/7/ 1998.
[14] C. Wu and P. T. Williams, "Hydrogen production by steam gasification of
polypropylene with various nickel catalysts," Applied Catalysis B:
Environmental, vol. 87, pp. 152-161, 4/7/ 2009.
[15] P. H. Blanco, C. Wu, J. A. Onwudili, and P. T. Williams, "Characterization and
evaluation of Ni/SiO2 catalysts for hydrogen production and tar reduction from
229
catalytic steam pyrolysis-reforming of refuse derived fuel," Applied Catalysis B:
Environmental, vol. 134–135, pp. 238-250, 2013.
[16] J. F. González, S. Román, G. Engo, J. M. Encinar, and G. Martínez, "Reduction
of tars by dolomite cracking during two-stage gasification of olive cake,"
Biomass and Bioenergy, vol. 35, pp. 4324-4330, 10/15/ 2011.
[17] V. Skoulou, A. Swiderski, W. Yang, and A. Zabaniotou, "Process characteristics
and products of olive kernel high temperature steam gasification (HTSG),"
Bioresource Technology, vol. 100, pp. 2444-2451, 2009.
[18] L. Emami Taba, M. F. Irfan, W. A. M. Wan Daud, and M. H. Chakrabarti, "The
effect of temperature on various parameters in coal, biomass and CO-
gasification: A review," Renewable and Sustainable Energy Reviews, vol. 16,
pp. 5584-5596, 2012.
[19] P. Lahijani and Z. A. Zainal, "Gasification of palm empty fruit bunch in a
bubbling fluidized bed: A performance and agglomeration study," Bioresource
Technology, vol. 102, pp. 2068-2076, 2011.
[20] C. Franco, F. Pinto, I. Gulyurtlu, and I. Cabrita, "The study of reactions
influencing the biomass steam gasification process," Fuel, vol. 82, pp. 835-842,
2003.
[21] J. Sehested, "Sintering of nickel steam-reforming catalysts," Journal of
Catalysis, vol. 217, pp. 417-426, 2003.
[22] J. Sehested, "Four challenges for nickel steam-reforming catalysts," Catalysis
Today, vol. 111, pp. 103-110, 2006.
[23] T. W. Hansen, A. T. DeLaRiva, S. R. Challa, and A. K. Datye, "Sintering of
Catalytic Nanoparticles: Particle Migration or Ostwald Ripening?," Accounts of
Chemical Research, 2013.
[24] J. Sehested, J. A. P. Gelten, and S. Helveg, "Sintering of nickel catalysts: Effects
of time, atmosphere, temperature, nickel-carrier interactions, and dopants,"
Applied Catalysis A: General, vol. 309, pp. 237-246, 2006.
[25] J. Srinakruang, K. Sato, T. Vitidsant, and K. Fujimoto, "Highly efficient sulfur
and coking resistance catalysts for tar gasification with steam," Fuel, vol. 85, pp.
2419-2426, 2006.
[26] D. N. Bangala, N. Abatzoglou, and E. Chornet, "Steam reforming of
naphthalene on Ni–Cr/Al2O3 catalysts doped with MgO, TiO2, and La2O3,"
AIChE Journal, vol. 44, pp. 927-936, 1998.
[27] S. Nassos, E. Elm Svensson, M. Boutonnet, and S. G. Järås, "The influence of
Ni load and support material on catalysts for the selective catalytic oxidation of
ammonia in gasified biomass," Applied Catalysis B: Environmental, vol. 74, pp.
92-102, 2007.
[28] A. Z. M. Mohammad Zangouei, Mehdi Arasteh "The influence of nickel loading
on reducibility of NiO/Al2O3 catalysts synthesized by sol-gel method,"
Chemical Engineering Research Bulletin, vol. 14, pp. 97-102, 2010.
[29] X. Xiao, D. D. Le, K. Morishita, S. Zhang, L. Li, and T. Takarada, "Multi-stage
biomass gasification in Internally Circulating Fluidized-bed Gasifier (ICFG):
Test operation of animal-waste-derived biomass and parametric investigation at
low temperature," Fuel Processing Technology, vol. 91, pp. 895-902, 2010.
[30] P. M. Lv, Z. H. Xiong, J. Chang, C. Z. Wu, Y. Chen, and J. X. Zhu, "An
experimental study on biomass air-steam gasification in a fluidized bed,"
Bioresource Technology, vol. 95, pp. 95-101, 2004.
230
[31] K. Sasaki, X. Qiu, Y. Hosomomi, S. Moriyama, and T. Hirajima, "Effect of
natural dolomite calcination temperature on sorption of borate onto calcined
products," Microporous and Mesoporous Materials, vol. 171, pp. 1-8, 2013.
[32] D. Sutton, B. Kelleher, and J. R. H. Ross, "Review of literature on catalysts for
biomass gasification," Fuel Processing Technology, vol. 73, pp. 155-173, 2001.
[33] C. Wu and P. T. Williams, "Ni/CeO2/ZSM-5 catalysts for the production of
hydrogen from the pyrolysis–gasification of polypropylene," International
Journal of Hydrogen Energy, vol. 34, pp. 6242-6252, 8// 2009.
[34] X. Xu, J. Enchen, W. Mingfeng, L. Bosong, and Z. Ling, "Hydrogen production
by catalytic cracking of rice husk over Fe2O3/γ-Al2O3 catalyst," Renewable
Energy, vol. 41, pp. 23-28, 5// 2012.
[35] S. M. GarcPSa L, Arauzo J, Bilbao R, "Catalytic steam gasification of pine
sawdust. Effect of catalyst weight/biomass flow rate and steam/biomass ratios
on gas production and composition," Energy and Fuels, vol. 13, pp. 851-9, 1999.
[36] F. Bimbela, M. Oliva, J. Ruiz, L. García, and J. Arauzo, "Catalytic steam
reforming of model compounds of biomass pyrolysis liquids in fixed bed: Acetol
and n-butanol," Journal of Analytical and Applied Pyrolysis, vol. 85, pp. 204-
213, 2009.
231
CHAPTER 7 CHAR GASIFICATION
7.1 Introduction
In chapter 5 and 6, two-stage pyrolysis/gasification of rice husk, sugarcane bagasse and
wheat straw was investigated at a pyrolysis temperature of 950 °C. Volatiles, liquids
and tar components evolving from the first stage were gasified in the second stage, in
the presence of steam and catalyst at higher temperature from 950 - 1000 °C. In this
chapter, the residual char from pyrolysis of these three biomass samples was researched.
The aim of this study is to enhance the hydrogen yield from per gram of biomass by
gasifying the residual char samples at higher temperature with and without catalysts.
During these experiments, the biomass char sample was mixed with the catalyst and
placed inside the gasification stage on a quartz-wool bed. The gasification stage was
heated up from room temperature to 950 °C in an inert atmosphere of nitrogen. Once
the desired temperature was achieved, steam injection using a syringe pump was started.
The unreacted steam was recovered using a glass condenser system. All non-
condensable gases were collected using a gas bag and were analysed offline using gas
chromatography.
Initially all three char samples (rice husk, sugarcane bagasse and wheat straw) were
investigated using thermogravimetric analysis and an elemental analyser (section 7.2).
The most suitable char sample was chosen in terms of higher carbon and lower ash
contents. In section 7.3, high temperature (950 °C) steam gasification of the chosen
biomass char was performed by mixing the char with different catalysts at catalyst to
sample ratio of 1. The catalysts investigated in this study were 10 % Ni-dolomite, 10 %
Ni-Al2O3 and 10 % Ni-MgO. The results were compared to the steam gasification of
char without any catalysts. The most suitable catalyst was chosen in terms of the highest
hydrogen yield for further investigation of other experimental conditions.
As the gasification temperature is one of the important parameters of char gasification,
the influence of gasification temperature on gas yield and particularly hydrogen yield
was investigated in section 7.4. The range of gasification temperature studied in this
research was from 750 - 1050 °C with an increment of 100 °C. The influence of
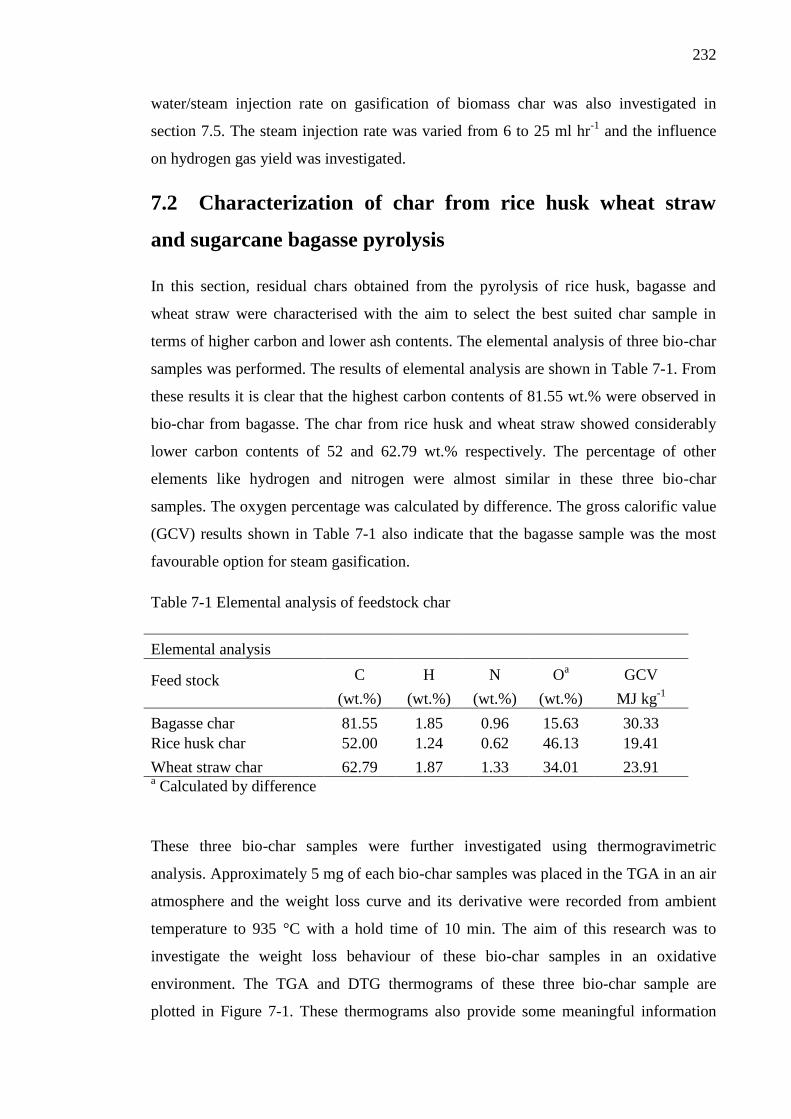
232
water/steam injection rate on gasification of biomass char was also investigated in
section 7.5. The steam injection rate was varied from 6 to 25 ml hr-1
and the influence
on hydrogen gas yield was investigated.
7.2 Characterization of char from rice husk wheat straw
and sugarcane bagasse pyrolysis
In this section, residual chars obtained from the pyrolysis of rice husk, bagasse and
wheat straw were characterised with the aim to select the best suited char sample in
terms of higher carbon and lower ash contents. The elemental analysis of three bio-char
samples was performed. The results of elemental analysis are shown in Table 7-1. From
these results it is clear that the highest carbon contents of 81.55 wt.% were observed in
bio-char from bagasse. The char from rice husk and wheat straw showed considerably
lower carbon contents of 52 and 62.79 wt.% respectively. The percentage of other
elements like hydrogen and nitrogen were almost similar in these three bio-char
samples. The oxygen percentage was calculated by difference. The gross calorific value
(GCV) results shown in Table 7-1 also indicate that the bagasse sample was the most
favourable option for steam gasification.
Table 7-1 Elemental analysis of feedstock char
Elemental analysis
Feed stock
C H N Oa GCV
(wt.%) (wt.%) (wt.%) (wt.%) MJ kg-1
Bagasse char 81.55 1.85 0.96 15.63 30.33
Rice husk char 52.00 1.24 0.62 46.13 19.41
Wheat straw char 62.79 1.87 1.33 34.01 23.91 a Calculated by difference
These three bio-char samples were further investigated using thermogravimetric
analysis. Approximately 5 mg of each bio-char samples was placed in the TGA in an air
atmosphere and the weight loss curve and its derivative were recorded from ambient
temperature to 935 °C with a hold time of 10 min. The aim of this research was to
investigate the weight loss behaviour of these bio-char samples in an oxidative
environment. The TGA and DTG thermograms of these three bio-char sample are
plotted in Figure 7-1. These thermograms also provide some meaningful information
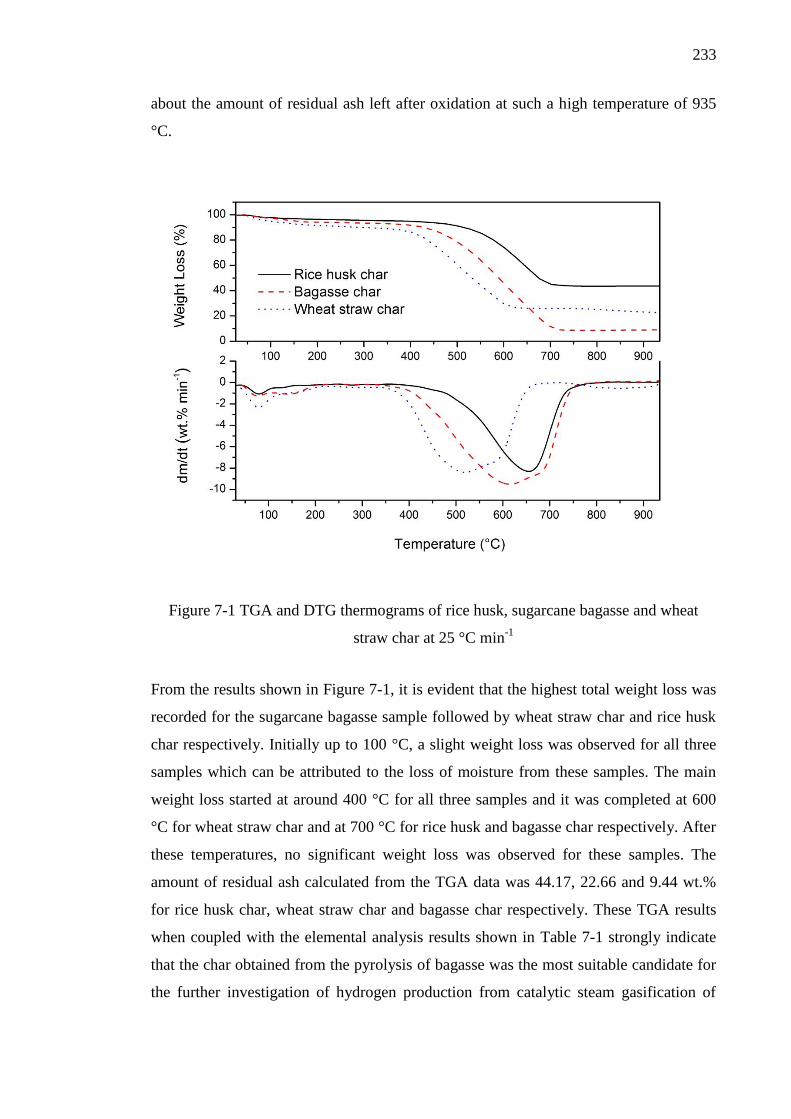
233
about the amount of residual ash left after oxidation at such a high temperature of 935
°C.
Figure 7-1 TGA and DTG thermograms of rice husk, sugarcane bagasse and wheat
straw char at 25 °C min-1
From the results shown in Figure 7-1, it is evident that the highest total weight loss was
recorded for the sugarcane bagasse sample followed by wheat straw char and rice husk
char respectively. Initially up to 100 °C, a slight weight loss was observed for all three
samples which can be attributed to the loss of moisture from these samples. The main
weight loss started at around 400 °C for all three samples and it was completed at 600
°C for wheat straw char and at 700 °C for rice husk and bagasse char respectively. After
these temperatures, no significant weight loss was observed for these samples. The
amount of residual ash calculated from the TGA data was 44.17, 22.66 and 9.44 wt.%
for rice husk char, wheat straw char and bagasse char respectively. These TGA results
when coupled with the elemental analysis results shown in Table 7-1 strongly indicate
that the char obtained from the pyrolysis of bagasse was the most suitable candidate for
the further investigation of hydrogen production from catalytic steam gasification of
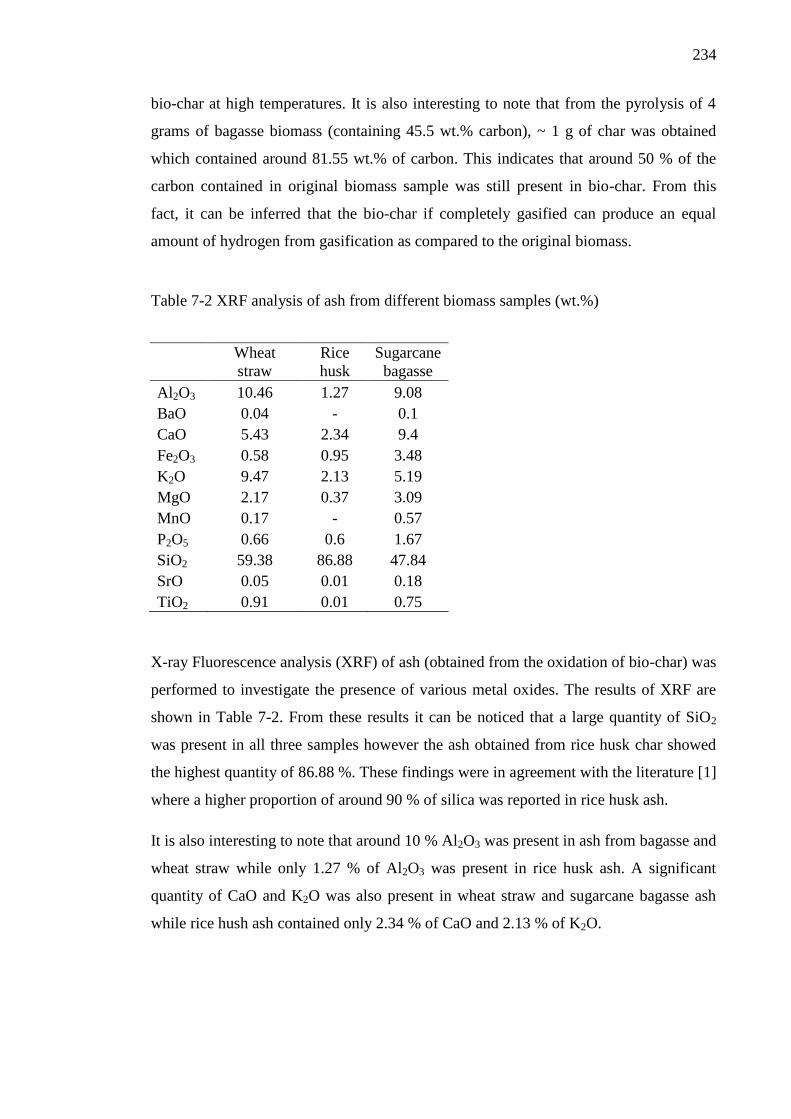
234
bio-char at high temperatures. It is also interesting to note that from the pyrolysis of 4
grams of bagasse biomass (containing 45.5 wt.% carbon), ~ 1 g of char was obtained
which contained around 81.55 wt.% of carbon. This indicates that around 50 % of the
carbon contained in original biomass sample was still present in bio-char. From this
fact, it can be inferred that the bio-char if completely gasified can produce an equal
amount of hydrogen from gasification as compared to the original biomass.
Table 7-2 XRF analysis of ash from different biomass samples (wt.%)
Wheat
straw
Rice
husk
Sugarcane
bagasse
Al2O3 10.46 1.27 9.08
BaO 0.04 - 0.1
CaO 5.43 2.34 9.4
Fe2O3 0.58 0.95 3.48
K2O 9.47 2.13 5.19
MgO 2.17 0.37 3.09
MnO 0.17 - 0.57
P2O5 0.66 0.6 1.67
SiO2 59.38 86.88 47.84
SrO 0.05 0.01 0.18
TiO2 0.91 0.01 0.75
X-ray Fluorescence analysis (XRF) of ash (obtained from the oxidation of bio-char) was
performed to investigate the presence of various metal oxides. The results of XRF are
shown in Table 7-2. From these results it can be noticed that a large quantity of SiO2
was present in all three samples however the ash obtained from rice husk char showed
the highest quantity of 86.88 %. These findings were in agreement with the literature [1]
where a higher proportion of around 90 % of silica was reported in rice husk ash.
It is also interesting to note that around 10 % Al2O3 was present in ash from bagasse and
wheat straw while only 1.27 % of Al2O3 was present in rice husk ash. A significant
quantity of CaO and K2O was also present in wheat straw and sugarcane bagasse ash
while rice hush ash contained only 2.34 % of CaO and 2.13 % of K2O.
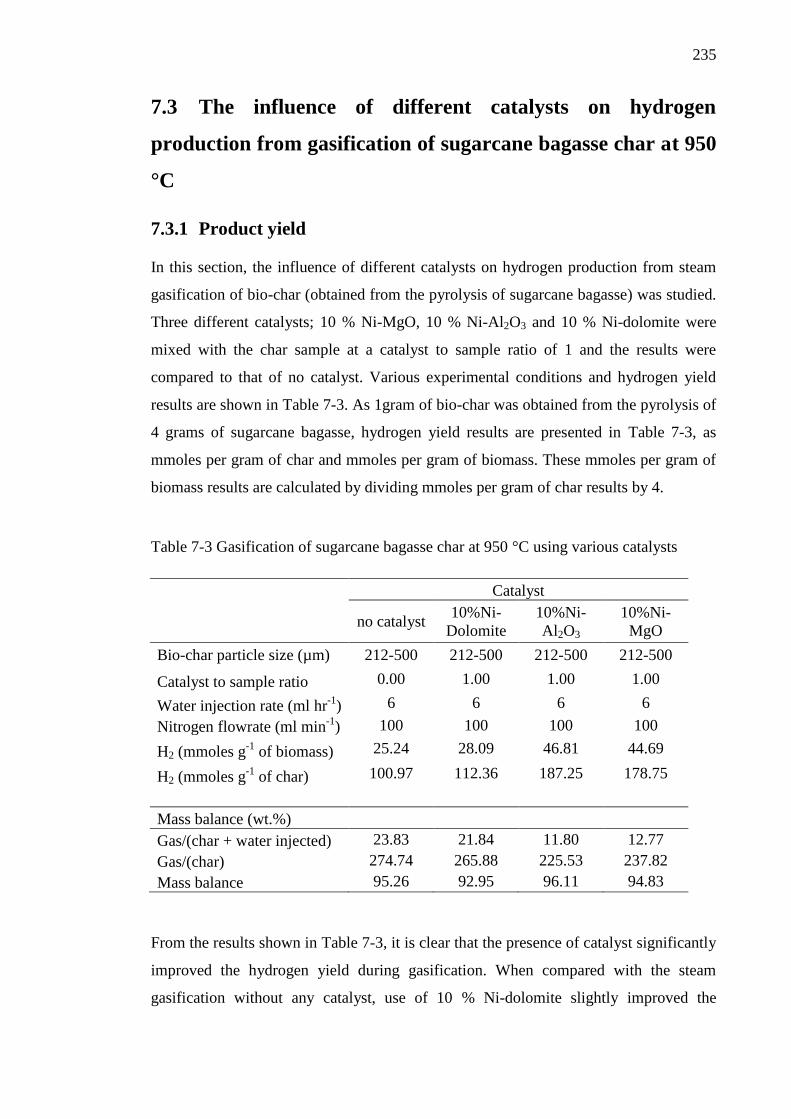
235
7.3 The influence of different catalysts on hydrogen
production from gasification of sugarcane bagasse char at 950
°C
7.3.1 Product yield
In this section, the influence of different catalysts on hydrogen production from steam
gasification of bio-char (obtained from the pyrolysis of sugarcane bagasse) was studied.
Three different catalysts; 10 % Ni-MgO, 10 % Ni-Al2O3 and 10 % Ni-dolomite were
mixed with the char sample at a catalyst to sample ratio of 1 and the results were
compared to that of no catalyst. Various experimental conditions and hydrogen yield
results are shown in Table 7-3. As 1gram of bio-char was obtained from the pyrolysis of
4 grams of sugarcane bagasse, hydrogen yield results are presented in Table 7-3, as
mmoles per gram of char and mmoles per gram of biomass. These mmoles per gram of
biomass results are calculated by dividing mmoles per gram of char results by 4.
Table 7-3 Gasification of sugarcane bagasse char at 950 °C using various catalysts
Catalyst
no catalyst
10%Ni-
Dolomite
10%Ni-
Al2O3
10%Ni-
MgO
Bio-char particle size (µm) 212-500 212-500 212-500 212-500
Catalyst to sample ratio 0.00 1.00 1.00 1.00
Water injection rate (ml hr-1
) 6 6 6 6
Nitrogen flowrate (ml min-1
) 100 100 100 100
H2 (mmoles g-1
of biomass) 25.24 28.09 46.81 44.69
H2 (mmoles g-1
of char) 100.97 112.36 187.25 178.75
Mass balance (wt.%)
Gas/(char + water injected) 23.83 21.84 11.80 12.77
Gas/(char) 274.74 265.88 225.53 237.82
Mass balance 95.26 92.95 96.11 94.83
From the results shown in Table 7-3, it is clear that the presence of catalyst significantly
improved the hydrogen yield during gasification. When compared with the steam
gasification without any catalyst, use of 10 % Ni-dolomite slightly improved the
236
hydrogen yield from 100.97 mmoles to 112.36 mmoles per gram of char. The addition
of 10 % Ni-MgO showed an increase of 78 % as compared to no catalyst. The highest
hydrogen yield of 187.25 mmoles per gram of char was obtained when the char sample
was mixed with the 10 % Ni-Al2O3 catalyst. It is suggested that the higher hydrogen
yield obtained using 10 % Ni-MgO and 10 % Ni-Al2O3 catalyst was most likely due to
the higher surface area of these two catalysts. As already mentioned in chapter 6, the 10
% Ni-MgO and 10 % Ni-Al2O3 catalysts exhibited a higher surface area of 53.90 and
76.82 m2 g
-1 respectively. The highly porous catalysts like 10 % Ni-MgO and 10 % Ni-
Al2O3 when mixed with the char provided not only larger surface area with the active Ni
sites but they also contributed towards shifting the chemical equilibria of various
reactions to improve the hydrogen yield. The positive influence of different catalysts on
char gasification has been reported in the literature. For example, Zhang et al. [2]
reported that the addition of Ca and Na in the coal sample resulted in an increase in char
conversion and hydrogen production. Kwon et al. [3] reported that the addition of
K2CO3, Na2CO3, Li2CO3 catalysts with the char sample resulted in a change of order of
reaction from one to zero. A significant improvement in terms of char conversion was
also reported.
It has been suggested that in order to obtain a higher hydrogen yield, gasification of
char containing higher fixed carbon and lower ash is recommended [4]. The catalytic
role of various alkali and alkaline earth metals (AAEMs) was also reported. For
example, Kajita et al. [5] investigated the steam gasification of a char sample obtained
from the pyrolysis of cedar and bamboo biomass. The comparison of as-received char
and acid-washed char revealed that the presence of AAEMs especially potassium
strongly influence the conversion and reactivity of char samples by catalysing the
various char conversion reactions. Otto et al. [6] also confirmed the catalytic effect of
various metals like Pt, Rh, Ru and Pd. They reported that the addition of these catalysts
strongly enhanced the gasification rate.
Moilanen et al. [7] reported the mechanism of gasification of solid a char particle. They
suggested that the process of gasification of char starts by the diffusion of gasifying
agent from atmosphere to particle surface and then to the inside of the particle resulting
in adsorption onto the surface followed by the actual chemical reaction. Then the
product gases desorbed from the reaction surface and diffuse back into the atmosphere.
It was reported that for larger particle size diffusion is a rate limiting step [8]. If particle
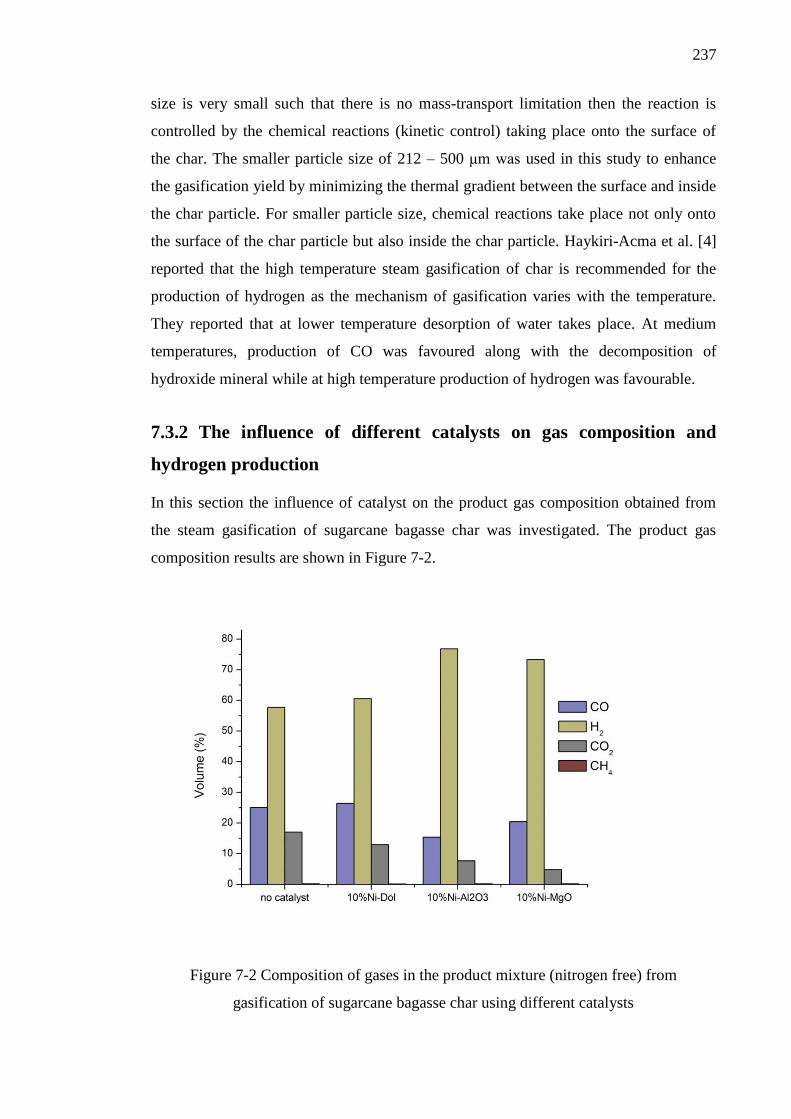
237
size is very small such that there is no mass-transport limitation then the reaction is
controlled by the chemical reactions (kinetic control) taking place onto the surface of
the char. The smaller particle size of 212 – 500 μm was used in this study to enhance
the gasification yield by minimizing the thermal gradient between the surface and inside
the char particle. For smaller particle size, chemical reactions take place not only onto
the surface of the char particle but also inside the char particle. Haykiri-Acma et al. [4]
reported that the high temperature steam gasification of char is recommended for the
production of hydrogen as the mechanism of gasification varies with the temperature.
They reported that at lower temperature desorption of water takes place. At medium
temperatures, production of CO was favoured along with the decomposition of
hydroxide mineral while at high temperature production of hydrogen was favourable.
7.3.2 The influence of different catalysts on gas composition and
hydrogen production
In this section the influence of catalyst on the product gas composition obtained from
the steam gasification of sugarcane bagasse char was investigated. The product gas
composition results are shown in Figure 7-2.
Figure 7-2 Composition of gases in the product mixture (nitrogen free) from
gasification of sugarcane bagasse char using different catalysts
238
These results shown in Figure 7-2, clearly indicate that the presence of catalyst
significantly improved the product gas composition in terms of H2 production. The
concentration of hydrogen was slightly improved from 57.74 vol.% for no catalyst to
60.54 vol.% for 10 % Ni-dolomite. Use of 10 % Ni-MgO further enhanced the hydrogen
concentration to 73.30 vol.%. The highest hydrogen concentration of 76.81 vol.% was
obtained when 10 % Ni-Al2O3 catalyst was used during gasification. It is interesting to
note that the gasification of bio-char was strongly influenced by the presence of
catalysts. It is suggested that these catalysts influenced the chemical equilibria of
various reactions taking place inside the gasifier. Yang et al. [9] also reported that the
hydrogen concentration was increased up to 1.8 times with the use of Au/Al2O3 catalyst
during the steam gasification of char derived from the pyrolysis of Dunaliella salina
biomass. Different chemical reactions taking place during the steam gasification of
biomass char are listed in Chapter 2.
As shown in Figure 7-2, the highest concentration of hydrogen (76.81 vol.%) was
achieved with the use of 10 % Ni-Al2O3 catalyst while a significant reduction in the
concentration of CO from ~25 vol.% for no catalyst to ~15 vol.% for 10 % Ni-Al2O3
catalyst was observed. It is suggested that the presence of 10 % Ni-Al2O3 improved the
hydrogen concentration by shifting the equilibrium of the water-gas shift reaction. The
H2:CO ratio was increased from 2.30 for no catalyst to 3.50 for 10 % Ni-MgO and to
5.00 for 10 % Ni-Al2O3 catalysts. The concentration of CO2 was also sharply reduced
from 17.05 vol.% for no catalyst to 7.67 vol.% for 10 % Ni-Al2O3 catalyst and to 4.77
vol.% for 10 % Ni-MgO catalyst. It is suggested that the higher gasifier temperature
promoted the endothermic Boudouard reaction resulting in reduction of CO2
concentration. The presence of catalyst does not seem to have any influence on the
methanation reaction as the concentration of methane in the product gaseous mixture
was almost constant at ~ 0.14 vol.% during all experiments.
7.4 The influence of temperature on char gasification
7.4.1 Product yield
In this section the effect of gasification temperature on catalytic steam gasification of
sugarcane bagasse char was researched. The char sample was mixed with the 10 % Ni-
Al2O3 catalyst placed inside the gasifier was heated up to the desired temperature from
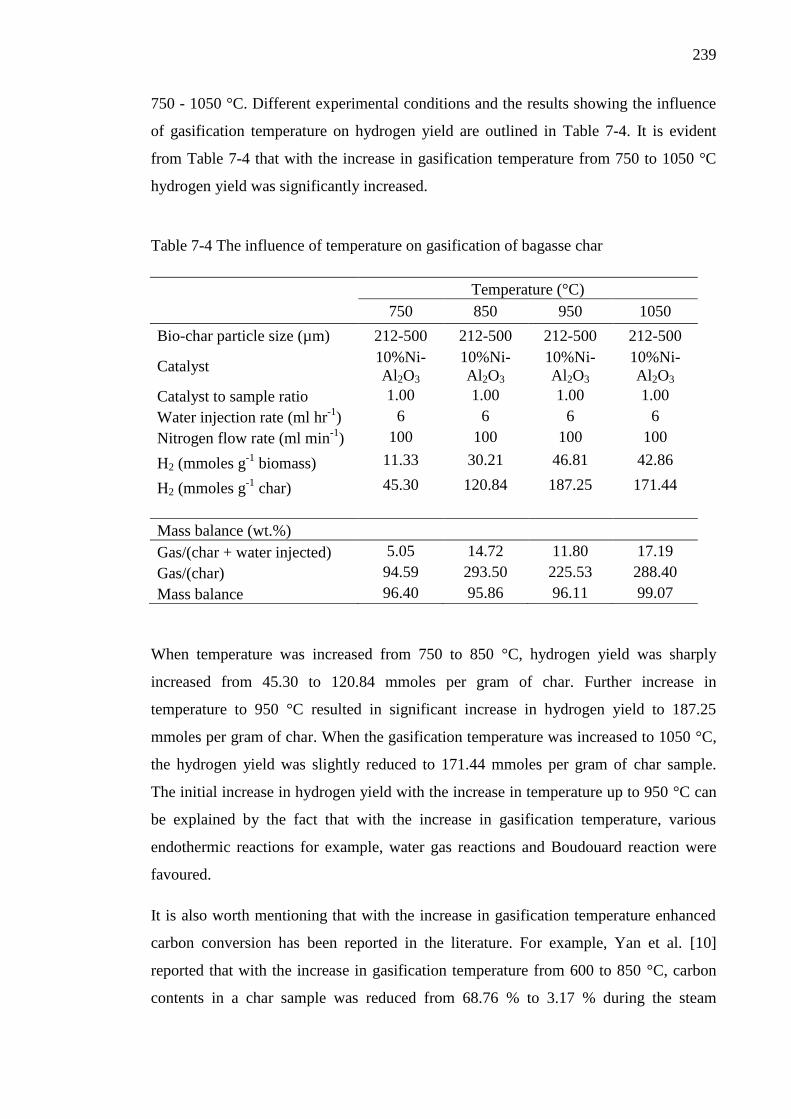
239
750 - 1050 °C. Different experimental conditions and the results showing the influence
of gasification temperature on hydrogen yield are outlined in Table 7-4. It is evident
from Table 7-4 that with the increase in gasification temperature from 750 to 1050 °C
hydrogen yield was significantly increased.
Table 7-4 The influence of temperature on gasification of bagasse char
Temperature (°C)
750 850 950 1050
Bio-char particle size (µm) 212-500 212-500 212-500 212-500
Catalyst 10%Ni-
Al2O3
10%Ni-
Al2O3
10%Ni-
Al2O3
10%Ni-
Al2O3
Catalyst to sample ratio 1.00 1.00 1.00 1.00
Water injection rate (ml hr-1
) 6 6 6 6
Nitrogen flow rate (ml min-1
) 100 100 100 100
H2 (mmoles g-1
biomass) 11.33 30.21 46.81 42.86
H2 (mmoles g-1
char) 45.30 120.84 187.25 171.44
Mass balance (wt.%)
Gas/(char + water injected) 5.05 14.72 11.80 17.19
Gas/(char) 94.59 293.50 225.53 288.40
Mass balance 96.40 95.86 96.11 99.07
When temperature was increased from 750 to 850 °C, hydrogen yield was sharply
increased from 45.30 to 120.84 mmoles per gram of char. Further increase in
temperature to 950 °C resulted in significant increase in hydrogen yield to 187.25
mmoles per gram of char. When the gasification temperature was increased to 1050 °C,
the hydrogen yield was slightly reduced to 171.44 mmoles per gram of char sample.
The initial increase in hydrogen yield with the increase in temperature up to 950 °C can
be explained by the fact that with the increase in gasification temperature, various
endothermic reactions for example, water gas reactions and Boudouard reaction were
favoured.
It is also worth mentioning that with the increase in gasification temperature enhanced
carbon conversion has been reported in the literature. For example, Yan et al. [10]
reported that with the increase in gasification temperature from 600 to 850 °C, carbon
contents in a char sample was reduced from 68.76 % to 3.17 % during the steam
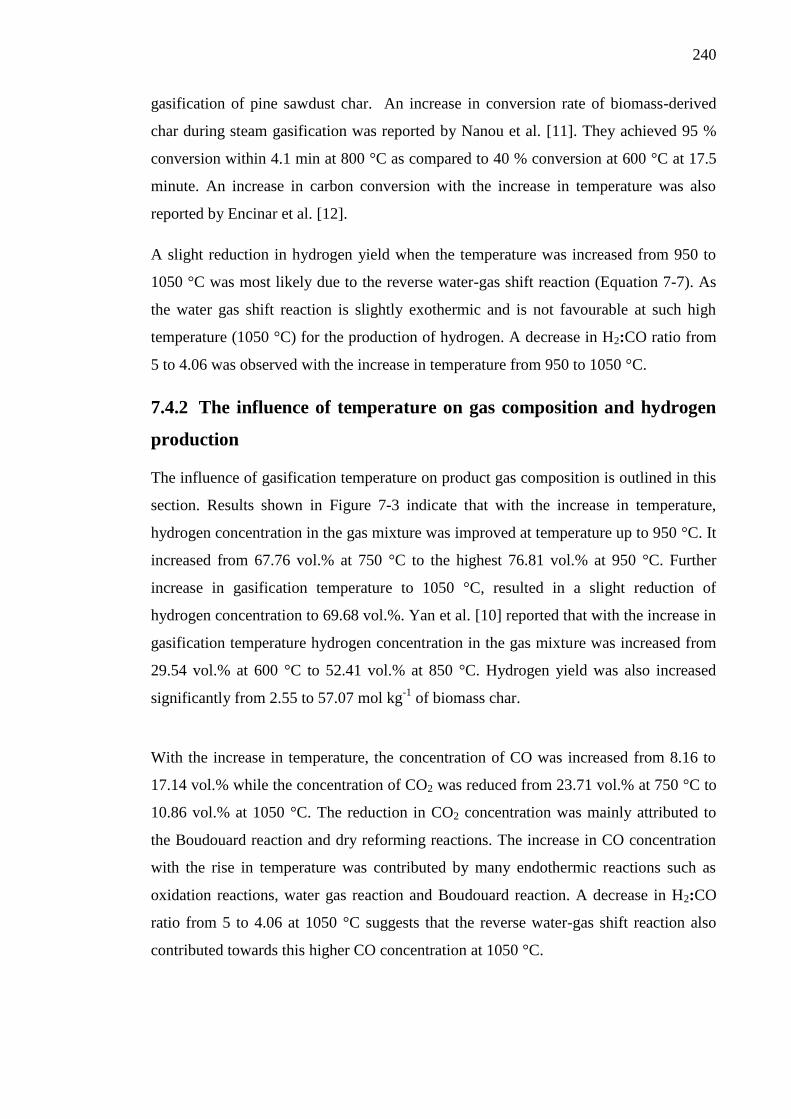
240
gasification of pine sawdust char. An increase in conversion rate of biomass-derived
char during steam gasification was reported by Nanou et al. [11]. They achieved 95 %
conversion within 4.1 min at 800 °C as compared to 40 % conversion at 600 °C at 17.5
minute. An increase in carbon conversion with the increase in temperature was also
reported by Encinar et al. [12].
A slight reduction in hydrogen yield when the temperature was increased from 950 to
1050 °C was most likely due to the reverse water-gas shift reaction (Equation 7-7). As
the water gas shift reaction is slightly exothermic and is not favourable at such high
temperature (1050 °C) for the production of hydrogen. A decrease in H2:CO ratio from
5 to 4.06 was observed with the increase in temperature from 950 to 1050 °C.
7.4.2 The influence of temperature on gas composition and hydrogen
production
The influence of gasification temperature on product gas composition is outlined in this
section. Results shown in Figure 7-3 indicate that with the increase in temperature,
hydrogen concentration in the gas mixture was improved at temperature up to 950 °C. It
increased from 67.76 vol.% at 750 °C to the highest 76.81 vol.% at 950 °C. Further
increase in gasification temperature to 1050 °C, resulted in a slight reduction of
hydrogen concentration to 69.68 vol.%. Yan et al. [10] reported that with the increase in
gasification temperature hydrogen concentration in the gas mixture was increased from
29.54 vol.% at 600 °C to 52.41 vol.% at 850 °C. Hydrogen yield was also increased
significantly from 2.55 to 57.07 mol kg-1
of biomass char.
With the increase in temperature, the concentration of CO was increased from 8.16 to
17.14 vol.% while the concentration of CO2 was reduced from 23.71 vol.% at 750 °C to
10.86 vol.% at 1050 °C. The reduction in CO2 concentration was mainly attributed to
the Boudouard reaction and dry reforming reactions. The increase in CO concentration
with the rise in temperature was contributed by many endothermic reactions such as
oxidation reactions, water gas reaction and Boudouard reaction. A decrease in H2:CO
ratio from 5 to 4.06 at 1050 °C suggests that the reverse water-gas shift reaction also
contributed towards this higher CO concentration at 1050 °C.
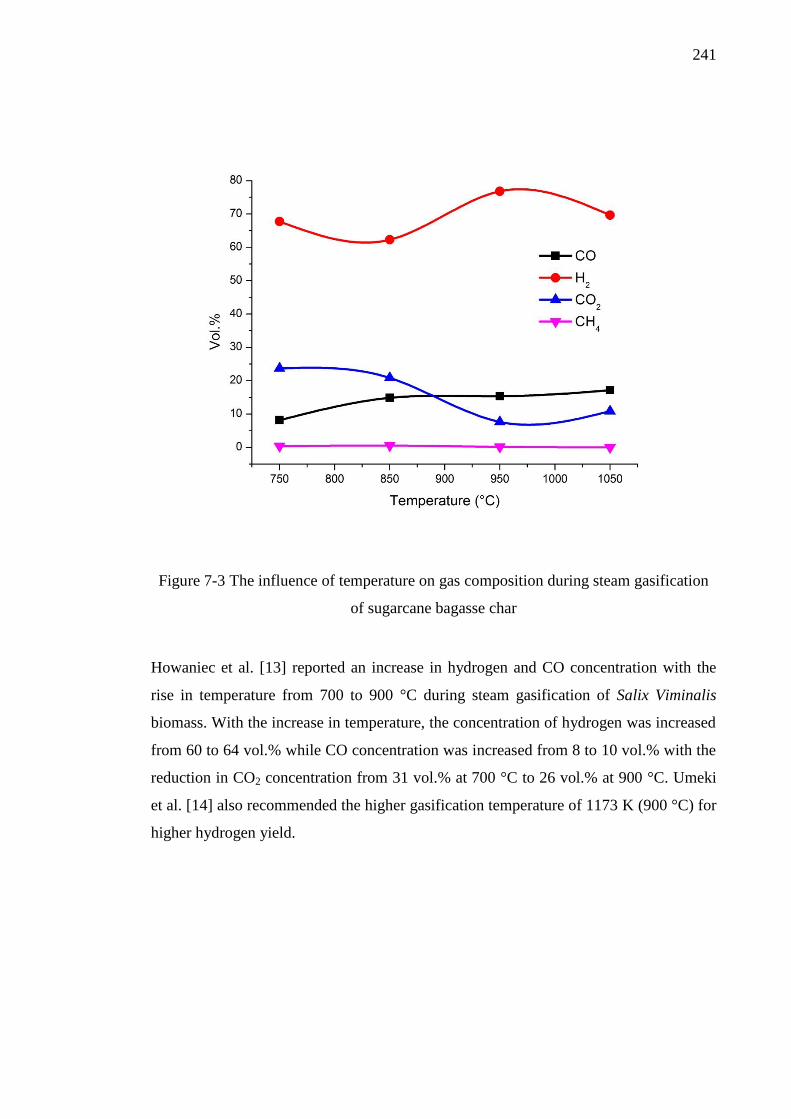
241
Figure 7-3 The influence of temperature on gas composition during steam gasification
of sugarcane bagasse char
Howaniec et al. [13] reported an increase in hydrogen and CO concentration with the
rise in temperature from 700 to 900 °C during steam gasification of Salix Viminalis
biomass. With the increase in temperature, the concentration of hydrogen was increased
from 60 to 64 vol.% while CO concentration was increased from 8 to 10 vol.% with the
reduction in CO2 concentration from 31 vol.% at 700 °C to 26 vol.% at 900 °C. Umeki
et al. [14] also recommended the higher gasification temperature of 1173 K (900 °C) for
higher hydrogen yield.
242
7.5 The influence of water/steam injection rate on
gasification of char
7.5.1 Product yield
Like temperature, steam flow rate is one of the most important parameters in
determining the overall gas yield and hence hydrogen yield. In order to enhance the
hydrogen yield from steam gasification of biomass char, the influence of water/steam
injection rate was researched in this section. Four different water/steam injection rates
of 6, 15, 20 and 25 ml hr-1
were investigated in this study. The hydrogen yield and mass
balance results are shown in Table 7-5. These results indicate that with the initial
increase in water injection rate from 6 to 15 ml hr-1
the hydrogen yield was increased
from 187.25 to 208.41 mmoles per gram of biomass char. However further increase in
water injection rate resulted in a decrease in hydrogen yield to 168.58 mmoles for 20 ml
hr-1
and to 174.20 mmoles for 25 ml hr-1
.
It is suggested that the initial increase in hydrogen yield was due to the promotion of the
water gas and the water gas shift reactions. Further increase in water injection rate lead
to a decrease in hydrogen concentration due to the fact that the amount of char available
was not sufficient for the amount of injected steam. Similar findings were reported by
Yan et al. [10]. They investigated the influence of steam flow rate on gasification of
pine sawdust char at 850 °C. They reported that initially with the increase in steam flow
rate from 0 to 0.165 g min-1
g-1
of biomass char, hydrogen yield increased from 2.15
mol kg-1
to 57.07 mol kg-1
. Further increase in steam flow rate to 0.357 g min-1
g-1
of
biomass char resulted in a decrease in hydrogen yield to 37.47 mol kg-1
.
By increasing the steam injection rate during gasification, extra oxygen and hydrogen
was made available into the system. Furthermore at high temperatures such as 950 °C,
by increasing the water injection rate the equilibrium of water-gas shift reaction can be
altered to enhance the hydrogen yield. Paviet et al. [15] investigated the kinetics of
steam gasification of wood char. They performed char gasification in a tubular kiln
reactor at various temperatures and steam flow rates. It was observed that with the
increase in steam molar fraction, the char consumption rate was increased due to the
lower diffusion resistance at higher steam flow rates.
243
Table 7-5 The influence of water injection rate on gasification of bagasse char
Water injection rate (ml hr-1
)
6 15 20 25
Bio-char particle size (µm) 212-500 212-500 212-500 212-500
Catalyst 10%Ni-
Al2O3
10%Ni-
Al2O3
10%Ni-
Al2O3
10%Ni-
Al2O3
Catalyst to sample ratio 1.00 1.00 1.00 1.00
Nitrogen flow rate (ml min-1
) 100 100 100 100
H2 (mmoles g-1
of biomass) 46.81 52.10 42.15 43.55
H2 (mmoles g-1
of char) 187.25 208.41 168.58 174.20
Mass balance (wt.%)
Gas/(char + water injected) 11.80 6.18 5.34 4.61
Gas/(char) 225.53 292.55 316.23 326.05
Mass balance 96.11 91.39 97.57 97.14
7.5.2 The influence of water injection rate on gas composition
The influence of increase in water injection rate on product gas composition is outlined
in Figure 7-4. It was observed that under the studied experimental conditions, water
injection rate was inversely proportional to the hydrogen concentration in the product
gas mixture. It was observed that with the increase in water/steam injection rate, the
concentration of hydrogen was gradually reduced. Initially it decreased slightly from
76.81 vol.% for 6ml hr-1
to 73.95 vol.% for 15ml hr-1
. Further increase in water
injection rate to 20 and to 25 ml hr-1
reduced hydrogen concentration to 68.30 and 67.86
vol.% respectively.
Contrary to the above trend, the concentration of CO2 was gradually increased from
7.67 to 14.13 vol.% with the increase in water injection rate. Yan et al. [10] also
reported an increase in CO2 concentration with the increase in steam flow rate. The
concentration of CO was almost constant at ~15 vol.%. A slight but noticeable increase
in CH4 concentration (perhaps due to methanation reaction) with the increase in water
injection rate was also observed. It increased from 0.16 to 0.21 to 0.25 and to 0.29
vol.% with the increase in water injection rate from 6 to 15, to 20 and to 25 ml hr-1
. It is
suggested that the increase in water injection rate favoured the oxidation of char and CO
which caused the increase in CO2 concentration. Although it was speculated that the
increase in water injection rate will favour the water gas shift reaction towards hydrogen
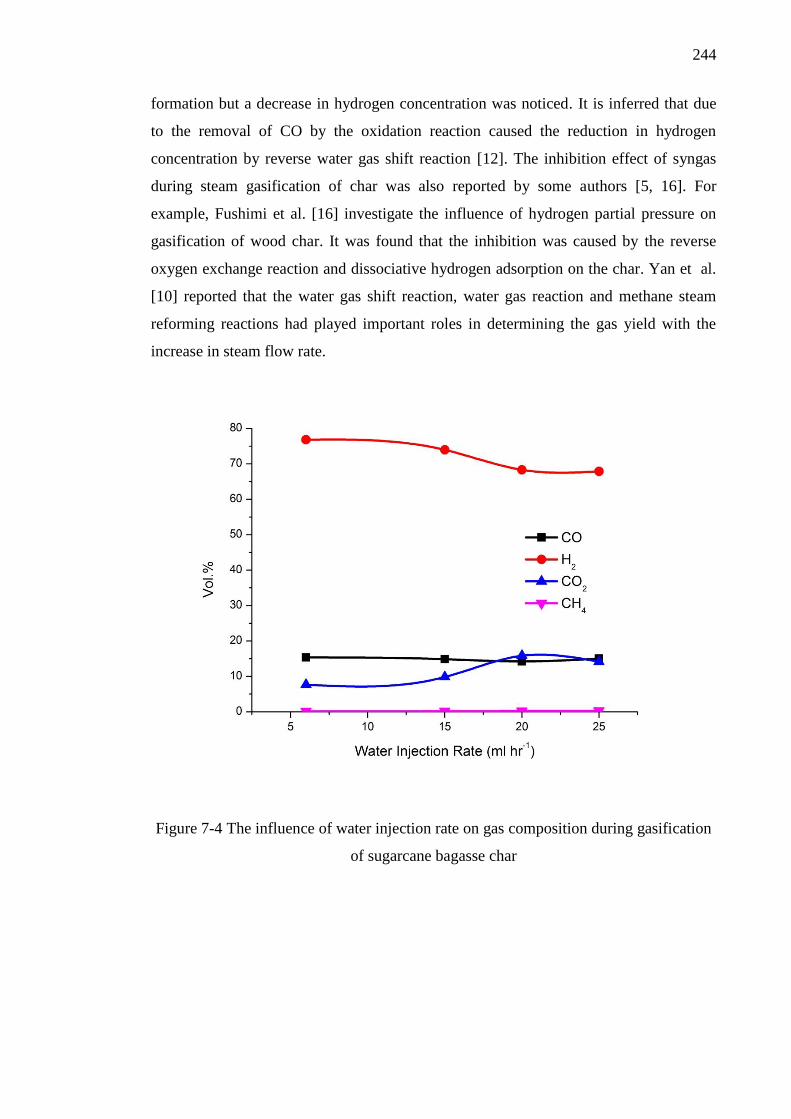
244
formation but a decrease in hydrogen concentration was noticed. It is inferred that due
to the removal of CO by the oxidation reaction caused the reduction in hydrogen
concentration by reverse water gas shift reaction [12]. The inhibition effect of syngas
during steam gasification of char was also reported by some authors [5, 16]. For
example, Fushimi et al. [16] investigate the influence of hydrogen partial pressure on
gasification of wood char. It was found that the inhibition was caused by the reverse
oxygen exchange reaction and dissociative hydrogen adsorption on the char. Yan et al.
[10] reported that the water gas shift reaction, water gas reaction and methane steam
reforming reactions had played important roles in determining the gas yield with the
increase in steam flow rate.
Figure 7-4 The influence of water injection rate on gas composition during gasification
of sugarcane bagasse char
245
7.6 Conclusions
In this chapter, steam gasification of biomass chars derived from the pyrolysis of
biomass was performed. The aim of this study was to enhance the hydrogen yield by
utilizing the residual char. The following conclusions can be made from this study.
Char samples obtained from the pyrolysis of three different biomass samples
namely rice husk, wheat straw and sugarcane bagasse were characterised to find
the most suitable char for further gasification studies. As compared to the rice
husk and wheat straw, char from sugarcane bagasse with the highest elemental
carbon of 81.55 wt.% and the lowest ash contents of less than 10 wt.% was the
most suitable candidate for further research.
In Section 7.3, steam gasification of bagasse char was carried out in the
presence of various catalysts. It was found that the highest hydrogen yield of
187.25 mmoles g-1
of char was obtained using 10 % Ni-Al2O3 catalyst. As
compared to no catalyst, the hydrogen concentration in the product gas was
increased from 57.74 to 76.81 vol.%. This higher hydrogen yield from 10 % Ni-
Al2O3 catalyst was attributed to the large surface area of this catalyst. Compared to
the no catalyst results, 87 % increase in hydrogen yield was recorded.
The influence of gasification temperature on hydrogen yield revealed that the
most suitable temperature to obtain the highest hydrogen yield was found to be
950 °C. Increase in gasification temperature from 750 to 950 °C favoured the
endothermic reactions causing significant increase in hydrogen yield from just
45.30 at 750 °C to 187.25 mmoles g-1
char at 950 °C.
The influence of water/steam injection rate on hydrogen yield from steam
gasification of bagasse char was studied in section 7.5. It was found that initially
with the increase in water injection rate from 6 to 15 ml hr-1 the hydrogen yield was
increased from 187.25 to 208.41 mmoles per gram of biomass char. However
further increase in water injection rate resulted in a decrease in hydrogen yield to
168.58 mmoles for 20ml hr-1 and to 174.20 mmoles for 25ml hr-1.
246
7.7 Chapter references
[1] S. V. Vassilev, D. Baxter, L. K. Andersen, and C. G. Vassileva, "An overview of
the chemical composition of biomass," Fuel, vol. 89, pp. 913-933, 2010.
[2] L.-x. Zhang, S. Kudo, N. Tsubouchi, J.-i. Hayashi, Y. Ohtsuka, and K.
Norinaga, "Catalytic effects of Na and Ca from inexpensive materials on in-situ
steam gasification of char from rapid pyrolysis of low rank coal in a drop-tube
reactor," Fuel Processing Technology, vol. 113, pp. 1-7, 2013.
[3] T. W. Kwon, J. R. Kim, S. D. Kim, and W. H. Park, "Catalytic steam
gasification of lignite char," Fuel, vol. 68, pp. 416-421, 1989.
[4] H. Haykiri-Acma, S. Yaman, and S. Kucukbayrak, "Gasification of biomass
chars in steam–nitrogen mixture," Energy Conversion and Management, vol. 47,
pp. 1004-1013, 2006.
[5] M. Kajita, T. Kimura, K. Norinaga, C.-Z. Li, and J.-i. Hayashi, "Catalytic and
Noncatalytic Mechanisms in Steam Gasification of Char from the Pyrolysis of
Biomass†," Energy & Fuels, vol. 24, pp. 108-116, 2010/01/21 2009.
[6] K. Otto and M. Shelef, "Catalytic steam gasification of graphite: Effects of
intercalated and externally added Ru, Rh, Pd and Pt," Carbon, vol. 15, pp. 317-
325, 1977.
[7] A. Moilanen, K. Saviharju, and T. Harju, "Steam Gasification Reactivities of
Various Fuel Chars," in Advances in Thermochemical Biomass Conversion, A.
V. Bridgwater, Ed., ed: Springer Netherlands, 1993, pp. 131-141.
[8] M. Luo and B. Stanmore, "The combustion characteristics of char from
pulverized bagasse," Fuel, vol. 71, pp. 1074-1076, 1992.
[9] C. Yang, L. Jia, S. Su, Z. Tian, Q. Song, W. Fang, et al., "Utilization of CO2 and
biomass char derived from pyrolysis of Dunaliella salina: The effects of steam
and catalyst on CO and H2 gas production," Bioresource Technology, vol. 110,
pp. 676-681, 2012.
[10] F. Yan, S.-y. Luo, Z.-q. Hu, B. Xiao, and G. Cheng, "Hydrogen-rich gas
production by steam gasification of char from biomass fast pyrolysis in a fixed-
bed reactor: Influence of temperature and steam on hydrogen yield and syngas
composition," Bioresource Technology, vol. 101, pp. 5633-5637, 2010.
[11] P. Nanou, H. E. Gutiérrez Murillo, W. P. M. van Swaaij, G. van Rossum, and S.
R. A. Kersten, "Intrinsic reactivity of biomass-derived char under steam
gasification conditions-potential of wood ash as catalyst," Chemical Engineering
Journal, vol. 217, pp. 289-299, 2013.
[12] . M. Encinar, . F. onz lez, . . Rodr guez, and M. a. . Ramiro, "Catalysed
and uncatalysed steam gasification of eucalyptus char: influence of variables and
kinetic study," Fuel, vol. 80, pp. 2025-2036, 2001.
[13] N. Howaniec, A. Smoliński, . Stańczyk, and M. Pichlak, "Steam co-
gasification of coal and biomass derived chars with synergy effect as an
innovative way of hydrogen-rich gas production," International Journal of
Hydrogen Energy, vol. 36, pp. 14455-14463, 2011.
[14] K. Umeki, T. Namioka, and K. Yoshikawa, "The effect of steam on pyrolysis
and char reactions behavior during rice straw gasification," Fuel Processing
Technology, vol. 94, pp. 53-60, 2012.
[15] F. Paviet, O. Bals, and G. Antonini, "The effects of diffusional resistance on
wood char gasification," Process Safety and Environmental Protection, vol. 86,
pp. 131-140, 2008.

247
[16] C. Fushimi, T. Wada, and A. Tsutsumi, "Inhibition of steam gasification of
biomass char by hydrogen and tar," Biomass and Bioenergy, vol. 35, pp. 179-
185, 1// 2011.
248
CHAPTER 8 CONCLUSIONS AND FUTURE
WORK
8.1 Introduction
In this research work, a two-stage, ultra-high temperature (up to 1050 °C),
pyrolysis/gasification reactor was designed and built to investigate the pyrolysis and
gasification of different biomass samples with the aim to produce high hydrogen yield.
Initially, biomass samples, sugarcane bagasse, rice husks and wheat straws were
characterised using thermogravimetric analysis to find the most suitable biomass for
hydrogen production. A comparative study of fast and slow pyrolysis conditions was
performed to investigate the influence of pyrolysis conditions on product yield and gas
composition. For all three biomass samples, pyrolysis, steam gasification and catalytic
steam gasification using calcined dolomite and nickel impregnated dolomite were
performed. The influence of various process conditions including temperature, steam
injection rate, carrier gas flow rate, biomass particle size, and catalyst to sample ratio on
pyrolysis/gasification of rice husk was investigated using 10 % Ni-dolomite catalyst.
In order to further enhance the hydrogen yield, the influence of seven different nickel
based catalysts on hydrogen production from pyrolysis/gasification of sugarcane
bagasse was researched. The key process parameters including gasification temperature,
steam injection rate were also investigated. The other variables of catalyst calcination
temperature and Ni loading were also studied. In order to get the maximum possible
hydrogen yield, residual biomass char left from the pyrolysis was also gasified in the
presence of steam and catalysts. Char samples from rice husks, bagasse and wheat straw
were initially characterised in terms of the amount of fixed carbon and residual ash. The
influence of catalyst, gasification temperature and steam injection rate was also
investigated. The combined hydrogen yield from the gasification of original biomass
and residual char showed that the two-stage gasification performed at ultra-high
temperatures (950 - 1000 °C) is a promising option to obtain high hydrogen yield.
249
8.2 Conclusions
8.2.1 Pyrolysis of waste biomass: Investigation of fast pyrolysis and
slow pyrolysis process conditions on product yield and gas composition
Slow pyrolysis of the wood, rice husks and forestry residue was markedly
different from that of fast pyrolysis. For wood, only 24.7 wt.% gas yield was
obtained from slow pyrolysis as compared to 78.63 wt.% from fast pyrolysis.
For rice husk 18.94 wt.% gas was obtained, for forestry residue 24.01 wt.% gas
was obtained compared to 66.61 wt.% and 73.91 wt.% from fast pyrolysis
respectively. There were correspondingly lower yields of oil and char from fast
pyrolysis whereas for slow pyrolysis oil and char yields were higher.
The composition of the product gases was also influenced by the heating rate.
The higher CO:CO2 ratio found for fast pyrolysis was due to the interaction of
CO2 present in the syngas with the solid particles present in the gas stream.
The gas yield was increased with the increase in fast pyrolysis temperature
between 750 – 1050 °C. A corresponding decreasing in char and oil yield was
noticed. Maximum gas yields, on an ash-free basis were 91.71 wt.% for wood,
98.36 wt.% for rice husk and 90.80 wt.% for forestry residue. The higher gas
yield at higher pyrolysis temperature was attributed to the enhanced thermal
cracking of oil and tar compounds. The strong interaction between syngas and
solid char must have played a role in enhanced gas yield.
Addition of steam to the fast pyrolysis of wood produced increased yields of
hydrogen. For example, hydrogen yield was 26.91 vol.% in the absence of
steam increasing to 44.13 vol.% in the presence of steam at the reaction
temperature of 750 °C. The presence of steam enhanced the hydrogen yield by
increased reforming of methane and other hydrocarbons. Presence of steam also
had some influence on the equilibrium of water gas reaction thereby increasing
hydrogen yield.
250
8.2.2 Characterization of rice husk, sugarcane bagasse and wheat
straw using thermogravimetric analysis
On an ash-free basis, the highest volatiles of ~83 wt.% were found for sugarcane
bagasse compared to rice husk and wheat straw. The rice husk biomass exhibited
the lowest volatiles of ~77 wt.% and the highest ash contents of ~17 wt.%.
However, the ultimate analysis results showed that highest carbon contents (~45
wt.%) were also present in bagasse. All three biomass samples showed hydrogen
contents of around 5 wt.%.
The study of heating rate indicated that with the increase in heating rate from 5
to 20 and to 40 °C min-1
, a lateral shift in the TGA thermograms was observed
for all three biomass samples. This shift in the TGA thermogram was due to the
heat transfer limitations at higher heating rates. Due to short reaction time at
higher heating rates, higher temperature was required for the evolution of
volatiles from biomass samples
The study of different biomass particle sizes revealed that as compared to the
smaller particles, higher char yield was obtained from the pyrolysis of larger
particles. This can be explained by the fact that increase in particle diameter
hinders the efficient heat transfer from the particle surface to the centre hence
leading to a temperature gradient between the surface and centre of the biomass
particle. The effect is minimal for smaller particle size but for the larger particles
more time is required for complete conversion
Kinetic parameters were calculated using Coats-Redfern method. For the main
weight loss curve, order of reaction for rice husk and bagasse was found to be
0.5 while for wheat straw; it was 0.5 for 5 and 20 °C min-1
heating rates. At
higher heating rate of 40 °C min-1
, the order of reaction was changed to 2.0.
251
8.2.3 Hydrogen production from ultra-high temperature pyrolysis,
steam gasification and catalytic steam gasification of rice husk,
sugarcane bagasse and wheat straw
Hydrogen yield was radically improved from ~2 mmoles g-1
for pyrolysis to ~
21 mmoles g-1
of biomass during two-stage pyrolysis/gasification in the
presence of steam at 950 °C. The presence of steam enhanced the hydrogen
yield by increased reforming of methane, lighter hydrocarbons and tar. Presence
of steam also had some influence on the equilibrium of water gas reaction
thereby increasing hydrogen yield.
The use of calcined dolomite and 10 % Ni-dolomite catalysts in second stage
further increased gas yield and hydrogen yield. The hydrogen yield of 25.44
mmoles g-1
of biomass was obtained from the pyrolysis/gasification of rice husk
using 10 % Ni-dolomite. The highest hydrogen concentration in the gas mixture
was found to be 59.14 vol.%.
10 wt.% Ni dolomite catalyst used in this study was characterized using TGA-
TPO, SEM and TEM techniques. TGA-TPO results showed that the
significantly lower carbon deposits of less than 10 wt.% were found on reacted
10 wt.% Ni dolomite catalyst.
8.2.4 The influence of various process conditions on ultra-high
temperature catalytic steam gasification of rice husk using 10 wt.% Ni-
dolomite catalyst at 950 °C
With the increase in temperature from 850 °C to 1050 °C, hydrogen yield was
significantly increased from 20.03 to 30.62 mmoles per gram of rice husk.
Hydrogen concentration in the gas mixture was increased from 53.95 vol.% to
65.18 vol.%. The amount of deposited coke on catalyst was also reduced from
2.46 wt.% for 850 °C to zero at 1000 °C. Higher gasification temperature
favoured endothermic reactions. Steam reforming of hydrocarbons and tar was
also improved at higher gasification temperatures leading to higher gas yield and
hydrogen yield.
With the increase in water injection rate from 2 ml hr-1
to 10 ml hr-1
, hydrogen
yield was considerably increased from 22.31 to 27.86 mmoles per gram of rice
252
husk. Hydrogen concentration in the gas mixture was also improved from 56.29
vol.% to 61.88 vol.%. The increase in water injection rate shifted the
equilibrium of the water gas shift reaction thereby enhancing the hydrogen yield.
The influence of biomass particle size on hydrogen production was also
investigated. It was found that with the decrease in particle size from the range
of 2800 - 3350 to 212 - 500 μm, hydrogen yield was improved from 25.05 to
29.13 mmoles per gram of rice husk. Hydrogen concentration in the product gas
mixture was increased from 59.45 vol.% to 63.12 vol.%. With the reduction in
particle size, surface area to volume ratio of the particles was improved. This
resulted in larger surface area available for pyrolysis/gasification thereby
enhancing the gas and hydrogen yield.
No significant differences in hydrogen yield and gas yield were observed when
C/S ratio was varied from 0.25 to 2.0. Hydrogen yield was almost constant at
25.90 mmoles per gram of rice husk. Hydrogen concentration was also constant
at around 60 vol.%.
The carrier gas (nitrogen) flow rate was varied from 50 to 400 ml min-1
. No
significant difference in product gas yield and hydrogen yield was observed with
the increase in carrier gas flow rate, over the range investigated.
8.2.5 The influence of catalyst and other process conditions on ultra-
high temperature catalytic steam gasification of sugarcane bagasse
Seven different Ni-based catalysts; 10 % Ni-dolomite, 10 % Ni-MgO, 10 % Ni-
SiO2, 10 % Ni-Al2O3, 2 wt.% Ce - 10 % Ni-dolomite, 5 wt.% Ce - 10 % Ni-
dolomite and 10 wt.% Ce – 10 % Ni-dolomite were compared with silica sand in
terms of hydrogen yield from two-stage pyrolysis/gasification of bagasse. The
10 % Ni-Al2O3 catalyst produced the highest hydrogen yield of 29.62 mmoles
per gram of bagasse at gasification temperature of 950 °C.
The gasification temperature showed a positive influence on the two-stage
pyrolysis/gasification of bagasse. The hydrogen yield was increased from 21.17
mmoles g-1
at 800 °C to 35.65 mmoles g-1
at 1050 °C using 10 % Ni-Al2O3
catalyst. The hydrogen concentration in the product gas mixture was also
increased from 50.31 vol.% at 800 °C to 67.40 vol.% at 1050 °C.
253
The amount of nickel in Ni-Al2O3 catalyst was increased from 5 wt.% to 10
wt.%, 20 wt.% and to 40 wt.%. The increase in nickel contents shows little or no
influence on hydrogen yield. This suggests that the presence of small amount of
Ni (~10 wt.%) was sufficient to carry out the pyrolysis/gasification of biomass
under the researched high temperature conditions. The highest hydrogen yield of
29.62 mmoles g-1
was obtained. The concentration of hydrogen was also
unchanged at around 60 vol.%.
Increasing water/steam injection rate dramatically improved hydrogen yield
from 29.93 mmoles g-1
using 6 ml hr-1
to 44.47 mmoles g-1
using 35 ml hr-1
. A
sharp increase in hydrogen concentration from 60.72 vol.% for 6 ml hr-1
to 72.92
vol.% for 35 ml hr-1
water injection rate was obtained. The increase in H2:CO
ratio from 2.97 to 7.78 confirmed the positive influence of water injection rate
on the water gas shift reaction.
With the increase in catalyst calcination temperature from 700 to 1000 °C,
average pore size was increased while the BET surface area was reduced from
118.90 to 64.77 m2 g
-1. This suggests that the lower calcination temperature of
700 - 800 °C was favourable for biomass gasification as large proportion of
smaller particles was available at lower calcination temperature thereby
producing a catalyst of higher surface area. The hydrogen yield was initially
increased from 35.72 mmoles g-1
for 700 °C to 42.29 mmoles g-1
for 800 °C.
However further increase in calcination temperature to 900 and 1000 °C did not
show any improvements in hydrogen yield.
The increase in catalyst to sample ratio (C/S) improved hydrogen yield. With the
increase in C/S ratio from 0.1 to 2.0, hydrogen yield was increased from 39.18
to 44.70 mmoles per gram of bagasse.
In this research work, the highest hydrogen yield of 44.47 mmoles g-1
was
obtained using 35 ml hr-1
water injection rate from the two-stage
pyrolysis/gasification of sugarcane bagasse in the presence of 10 % Ni-Al2O3
catalyst at gasification temperature of 1000 °C. However this two-stage
pyrolysis/gasification process can be optimised to further enhance the hydrogen
yield.
254
8.2.6 Catalytic steam gasification of residual biomass char
Thermogravimetric and elemental analysis of three char samples (obtained from
the pyrolysis of rice husk, bagasse and wheat straw) revealed that the sugarcane
bagasse was the most suitable candidate with 81.55 wt.% elemental carbon and
less than 10 wt.% ash.
Compared to the 10 % Ni-dolomite and 10 % Ni-MgO, the highest hydrogen
yield of 187.25 mmoles g-1
of char was obtained using 10 % Ni-Al2O3 catalyst.
When compared with the no catalyst results, addition of 10 % Ni-Al2O3 catalyst
increased the hydrogen yield by 87 %. The highly porous catalyst, 10 % Ni-
Al2O3 when mixed with the char provided not only larger surface area with the
active Ni sites but also contributed towards shifting the chemical equilibria of
various reactions to improve the hydrogen yield.
The increase in gasification temperature from 750 to 950 °C favoured the
endothermic reactions causing significant increase in hydrogen yield from just
45.30 at 750 °C to 187.25 mmoles g-1
char at 950 °C.
With the increase in water injection rate from 6 to 15 ml hr-1
the hydrogen yield
was increased from 187.25 to 208.41 mmoles per gram of bagasse char.
However further increase in water injection rate to 20 ml and 25 ml hr-1
did not
improve the hydrogen yield. The initial increase in hydrogen yield was due to
the promotion of the water gas and the water gas shift reactions. Further increase
in water injection rate did not improve the hydrogen concentration due to the
fact that the amount of char available was not sufficient for the amount of
injected steam.
The highest hydrogen yield of 208.41 mmoles g-1
of char was obtained from the
catalytic steam gasification of sugarcane bagasse char at 950 °C using 10 % Ni-
Al2O3 catalyst with steam injection rate of 15 ml hr-1
. As ~1 gram of bio-char was
obtained from the pyrolysis of 4 grams of sugarcane bagasse. The hydrogen yield in
mmoles per gram of biomass was calculated by dividing mmoles per gram of char
results by 4. Hence the maximum of 52.10 mmoles of hydrogen were obtained in
terms of per gram of biomass.
As mentioned in section 8.2.5, the highest hydrogen yield of 44.47 mmoles g-1
was obtained from the two-stage pyrolysis/gasification of sugarcane bagasse. By
combining these results with the char gasification results (52.10 mmoles g-1
255
biomass), a total of 96.57 mmoles of hydrogen per gram of biomass can be
obtained. In other words, from the results of current research work ~ 200 g
hydrogen yield can be obtained from 1 kg of sugarcane bagasse sample which is
around 4 times higher than the original amount of hydrogen present (~ 50 grams
per kg of biomass at 5 wt.%) in the biomass sample.
8.3 Future work
After the current research work, the following further investigations are suggested in the
area of high temperature biomass gasification for hydrogen production.
The process of high temperature pyrolysis/gasification can be optimised to
obtain even higher hydrogen yield by converting the remaining CO into H2. For
example, even after obtaining the high hydrogen yield of ~ 200 g kg-1
of
biomass, around 10 vol.% and 15 vol.% CO is still present in the product gas
mixture from the gasification of biomass and char respectively. Hydrogen yield
can increase up to 250 g kg-1
of biomass. The hydrogen concentration in the gas
mixture can also be increased to above 90 vol.% by converting CO into H2
using the water gas shift reaction and further absorption of CO2 in CaO at ~ 700
°C.
A four stage reactor is proposed to further enhance the hydrogen yield from the
process by controlling the temperature of each zone independently. Zone 1
(from top to bottom) for pyrolysis of biomass at ~750 °C. Zone 2 for thermal
cracking and catalytic steam gasification at ~1000 °C. Zone 3 for CO2
absorption by CaO at ~700 °C. Zone 4 at ~250 - 450 °C to convert any
remaining CO into H2 by the water gas shift reaction. Reactor temperatures,
steam injection rates, and different catalysts are recommended to be
investigated in the above mentioned configuration.
Further investigations on different catalyst preparation methods (For example,
sol-gel method) are suggested. The research on different variables during
catalyst preparation process, e.g. addition of different metals, solution stirring
time, pH of the solution is also recommended to further optimise the catalyst.

256
A mathematical model based on feed forward neural networks can be developed
to estimate and predict the product gas composition from gasification of
biomass under different process conditions. Once developed, the accuracy of
such model can be enhanced by training these neural networks.
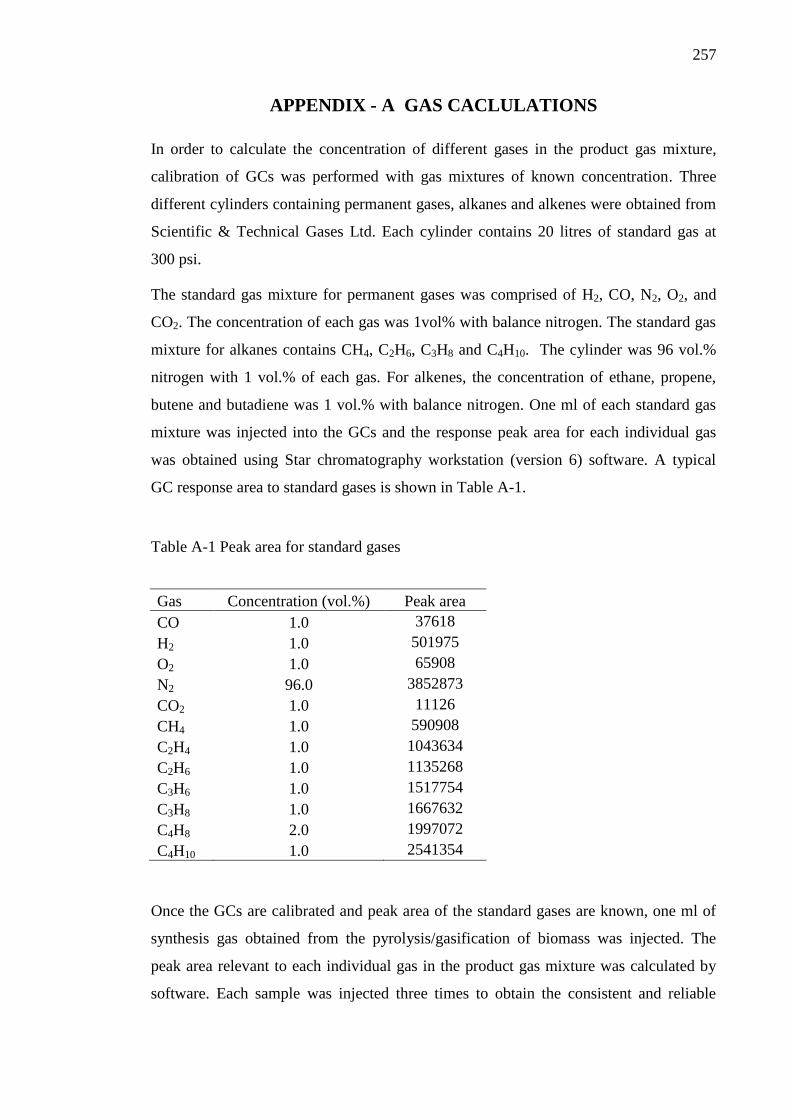
257
APPENDIX - A GAS CACLULATIONS
In order to calculate the concentration of different gases in the product gas mixture,
calibration of GCs was performed with gas mixtures of known concentration. Three
different cylinders containing permanent gases, alkanes and alkenes were obtained from
Scientific & Technical Gases Ltd. Each cylinder contains 20 litres of standard gas at
300 psi.
The standard gas mixture for permanent gases was comprised of H2, CO, N2, O2, and
CO2. The concentration of each gas was 1vol% with balance nitrogen. The standard gas
mixture for alkanes contains CH4, C2H6, C3H8 and C4H10. The cylinder was 96 vol.%
nitrogen with 1 vol.% of each gas. For alkenes, the concentration of ethane, propene,
butene and butadiene was 1 vol.% with balance nitrogen. One ml of each standard gas
mixture was injected into the GCs and the response peak area for each individual gas
was obtained using Star chromatography workstation (version 6) software. A typical
GC response area to standard gases is shown in Table A-1.
Table A-1 Peak area for standard gases
Gas Concentration (vol.%) Peak area
CO 1.0 37618
H2 1.0 501975
O2 1.0 65908
N2 96.0 3852873
CO2 1.0 11126
CH4 1.0 590908
C2H4 1.0 1043634
C2H6 1.0 1135268
C3H6 1.0 1517754
C3H8 1.0 1667632
C4H8 2.0 1997072
C4H10 1.0 2541354
Once the GCs are calibrated and peak area of the standard gases are known, one ml of
synthesis gas obtained from the pyrolysis/gasification of biomass was injected. The
peak area relevant to each individual gas in the product gas mixture was calculated by
software. Each sample was injected three times to obtain the consistent and reliable
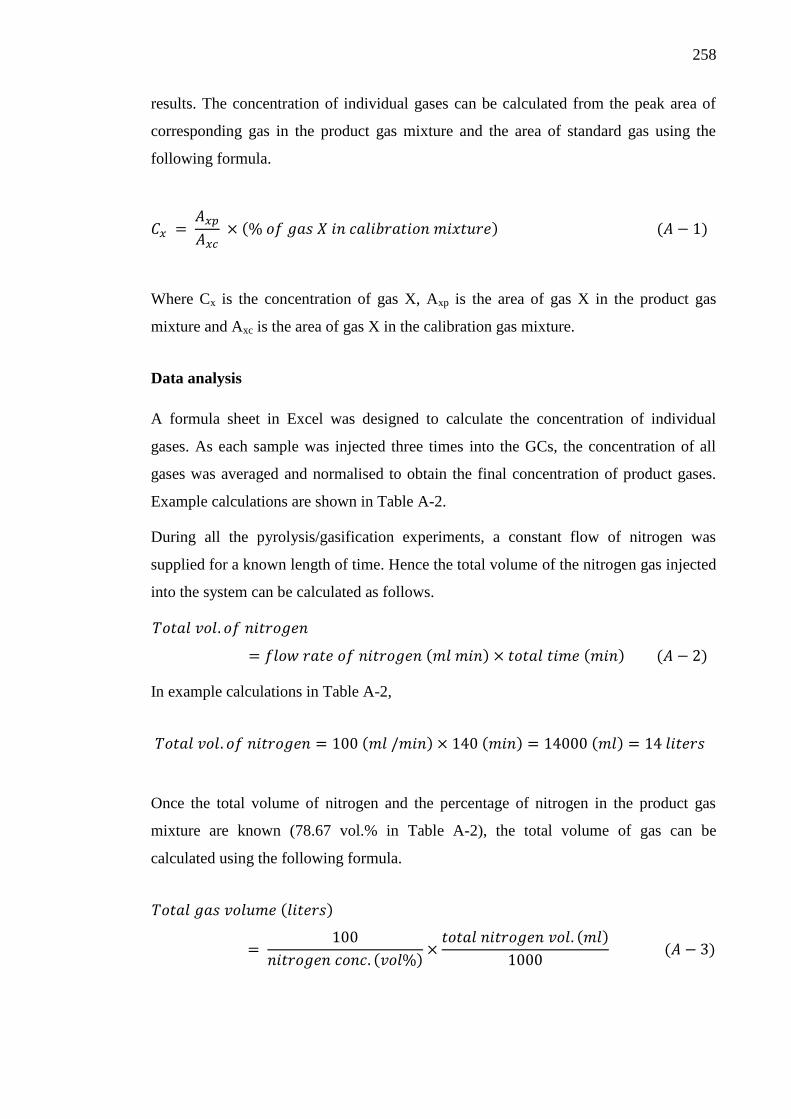
258
results. The concentration of individual gases can be calculated from the peak area of
corresponding gas in the product gas mixture and the area of standard gas using the
following formula.
( ) ( )
Where Cx is the concentration of gas X, Axp is the area of gas X in the product gas
mixture and Axc is the area of gas X in the calibration gas mixture.
Data analysis
A formula sheet in Excel was designed to calculate the concentration of individual
gases. As each sample was injected three times into the GCs, the concentration of all
gases was averaged and normalised to obtain the final concentration of product gases.
Example calculations are shown in Table A-2.
During all the pyrolysis/gasification experiments, a constant flow of nitrogen was
supplied for a known length of time. Hence the total volume of the nitrogen gas injected
into the system can be calculated as follows.
( ) ( ) ( )
In example calculations in Table A-2,
( ) ( ) ( )
Once the total volume of nitrogen and the percentage of nitrogen in the product gas
mixture are known (78.67 vol.% in Table A-2), the total volume of gas can be
calculated using the following formula.
( )
( ) ( )
( )
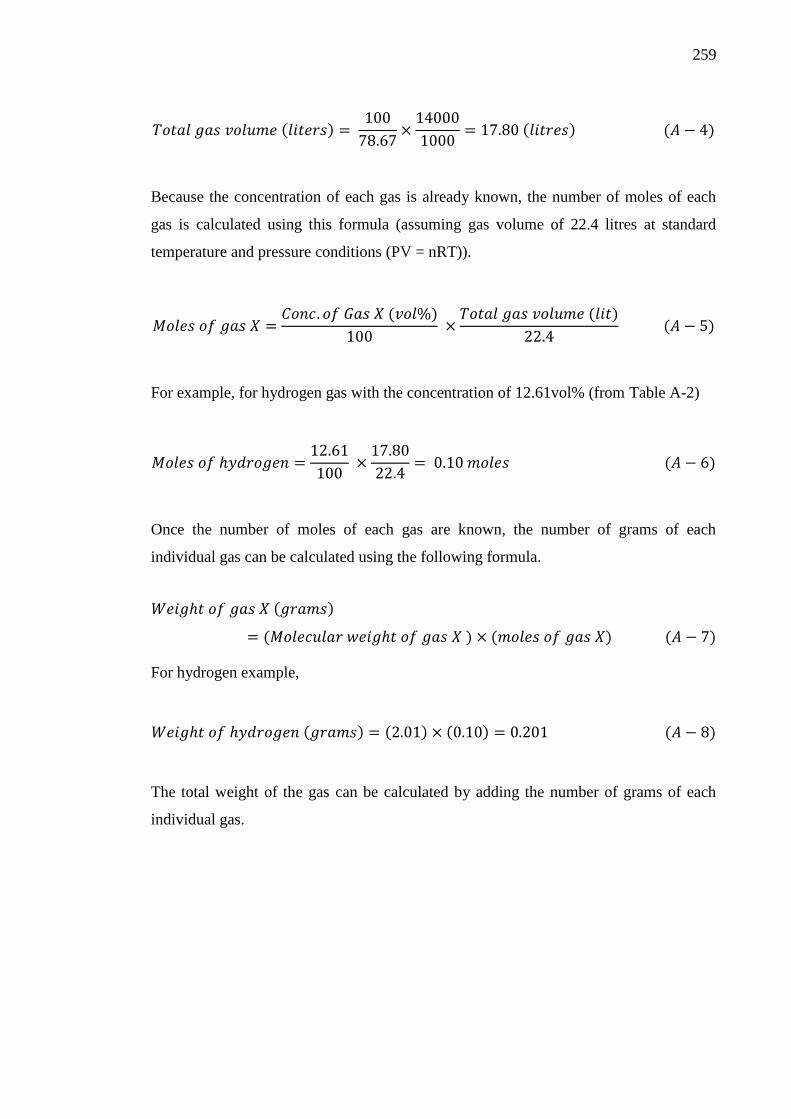
259
( )
( ) ( )
Because the concentration of each gas is already known, the number of moles of each
gas is calculated using this formula (assuming gas volume of 22.4 litres at standard
temperature and pressure conditions (PV = nRT)).
( )
( )
( )
For example, for hydrogen gas with the concentration of 12.61vol% (from Table A-2)
( )
Once the number of moles of each gas are known, the number of grams of each
individual gas can be calculated using the following formula.
( )
( ) ( ) ( )
For hydrogen example,
( ) ( ) ( ) ( )
The total weight of the gas can be calculated by adding the number of grams of each
individual gas.
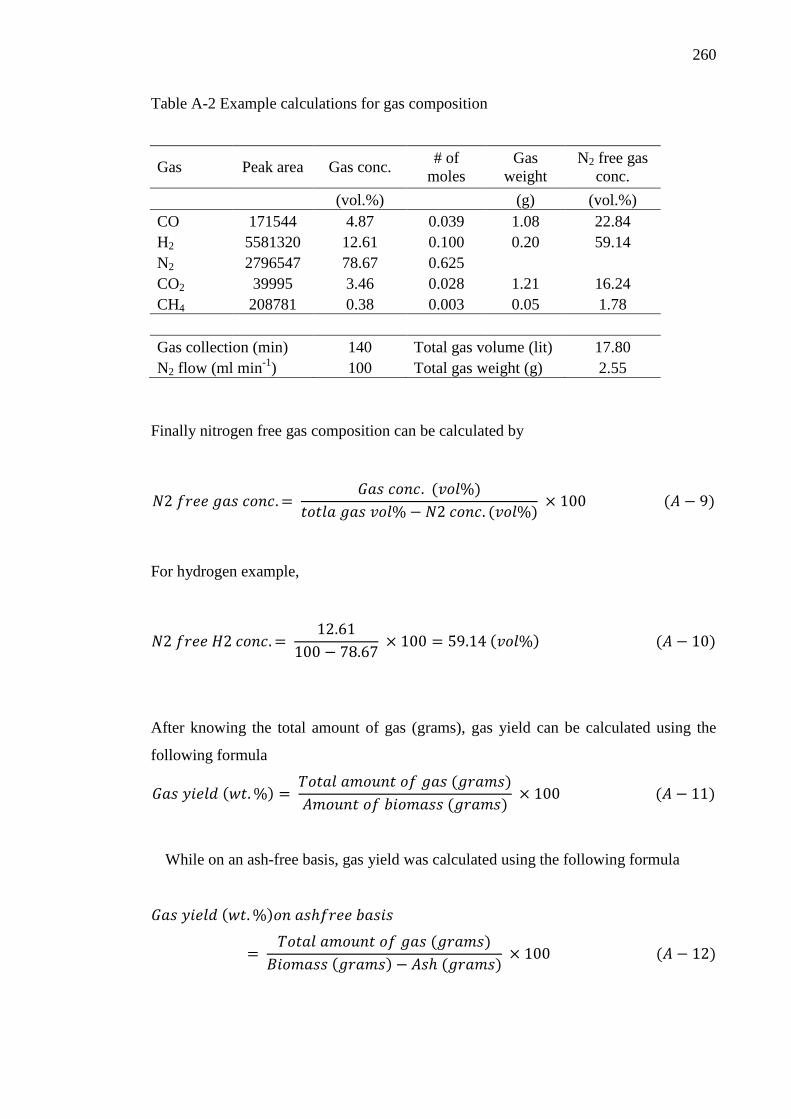
260
Table A-2 Example calculations for gas composition
Gas Peak area Gas conc. # of
moles
Gas
weight
N2 free gas
conc.
(vol.%) (g) (vol.%)
CO 171544 4.87 0.039 1.08 22.84
H2 5581320 12.61 0.100 0.20 59.14
N2 2796547 78.67 0.625
CO2 39995 3.46 0.028 1.21 16.24
CH4 208781 0.38 0.003 0.05 1.78
Gas collection (min) 140 Total gas volume (lit) 17.80
N2 flow (ml min-1
) 100 Total gas weight (g) 2.55
Finally nitrogen free gas composition can be calculated by
( )
( ) ( )
For hydrogen example,
( ) ( )
After knowing the total amount of gas (grams), gas yield can be calculated using the
following formula
( ) ( )
( ) ( )
While on an ash-free basis, gas yield was calculated using the following formula
( )
( )
( ) ( ) ( )
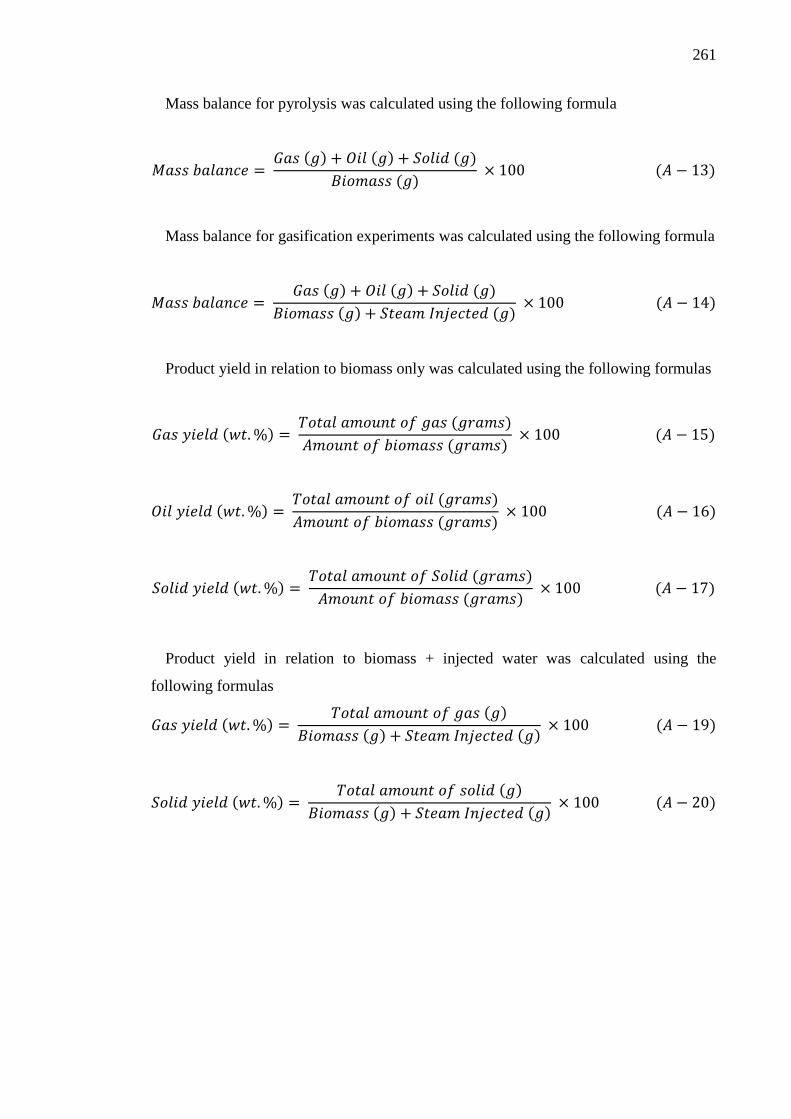
261
Mass balance for pyrolysis was calculated using the following formula
( ) ( ) ( )
( ) ( )
Mass balance for gasification experiments was calculated using the following formula
( ) ( ) ( )
( ) ( ) ( )
Product yield in relation to biomass only was calculated using the following formulas
( ) ( )
( ) ( )
( ) ( )
( ) ( )
( ) ( )
( ) ( )
Product yield in relation to biomass + injected water was calculated using the
following formulas
( ) ( )
( ) ( ) ( )
( ) ( )
( ) ( ) ( )
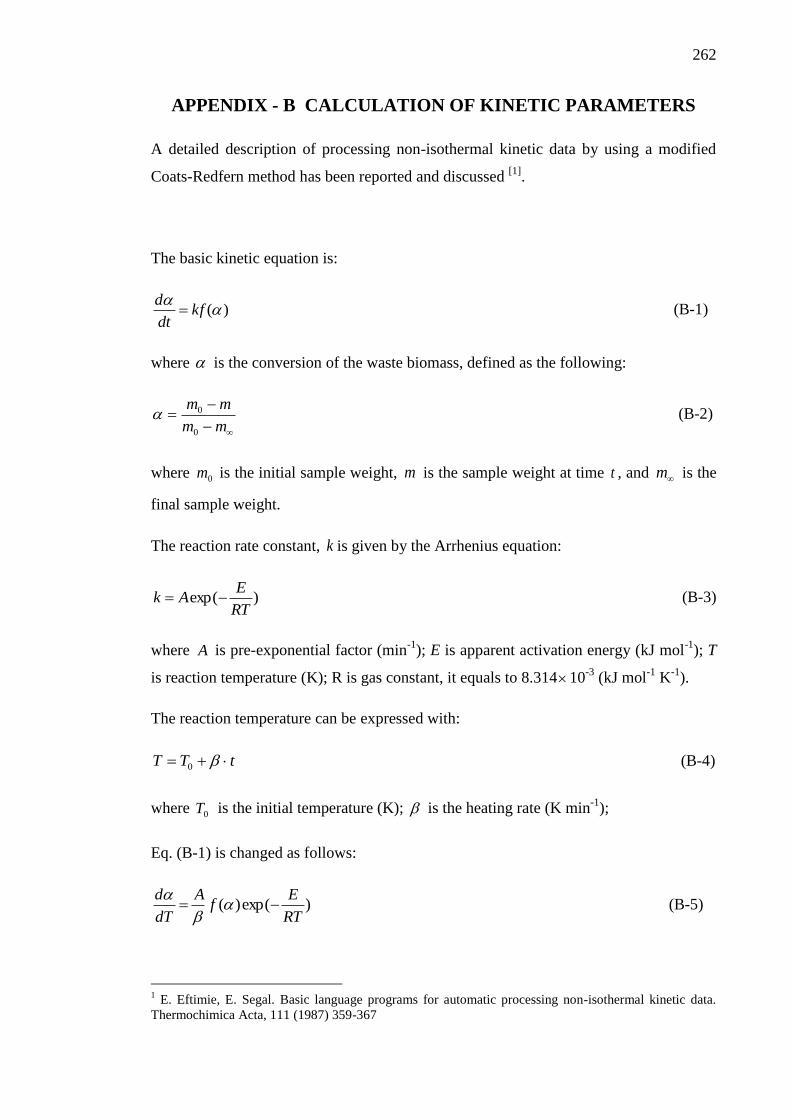
262
APPENDIX - B CALCULATION OF KINETIC PARAMETERS
A detailed description of processing non-isothermal kinetic data by using a modified
Coats-Redfern method has been reported and discussed [1]
.
The basic kinetic equation is:
)(
kfdt
d (B-1)
where is the conversion of the waste biomass, defined as the following:
mm
mm
0
0 (B-2)
where 0m is the initial sample weight, m is the sample weight at time t , and m is the
final sample weight.
The reaction rate constant, k is given by the Arrhenius equation:
)exp(RT
EAk (B-3)
where A is pre-exponential factor (min-1
); E is apparent activation energy (kJ mol-1
); T
is reaction temperature (K); R is gas constant, it equals to 8.31410-3
(kJ mol-1
K-1
).
The reaction temperature can be expressed with:
tTT 0 (B-4)
where 0T is the initial temperature (K); is the heating rate (K min-1
);
Eq. (B-1) is changed as follows:
)exp()(RT
Ef
A
dT
d
(B-5)
1 E. Eftimie, E. Segal. Basic language programs for automatic processing non-isothermal kinetic data.
Thermochimica Acta, 111 (1987) 359-367
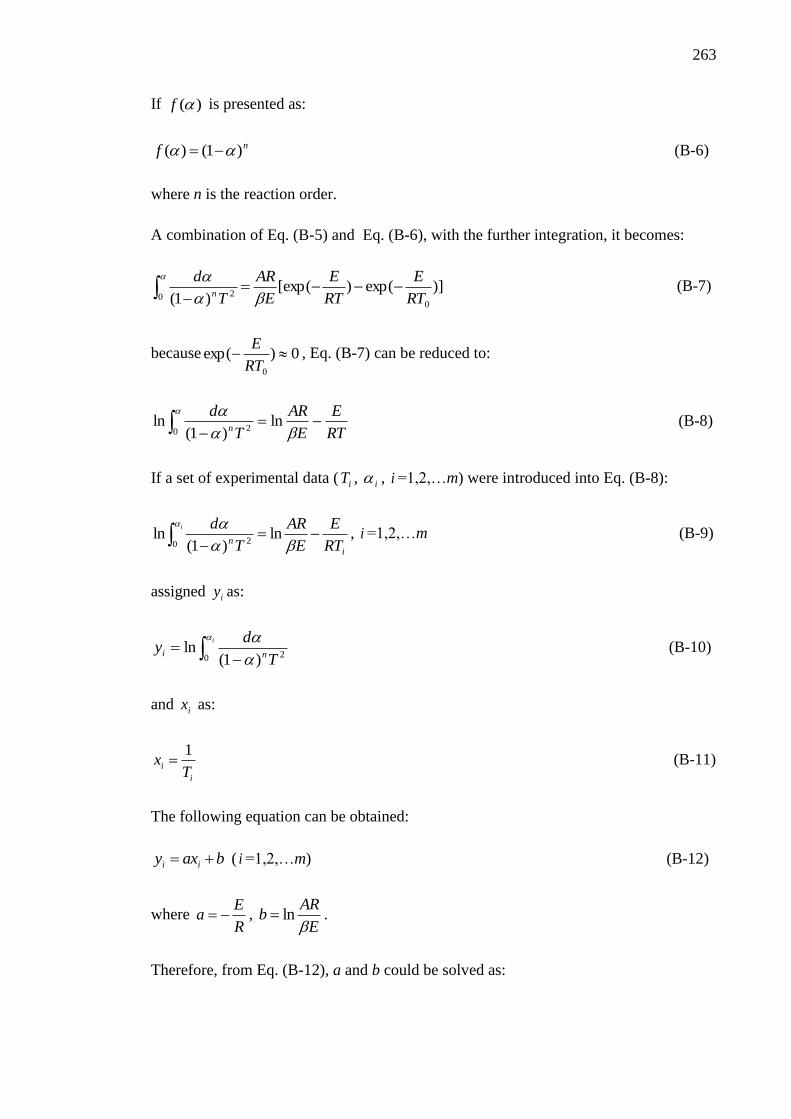
263
If )(f is presented as:
nf )1()( (B-6)
where n is the reaction order.
A combination of Eq. (B-5) and Eq. (B-6), with the further integration, it becomes:
)]exp()[exp()1( 0
0 2 RT
E
RT
E
E
AR
T
dn
(B-7)
because 0)exp(0
RT
E, Eq. (B-7) can be reduced to:
RT
E
E
AR
T
dn
ln)1(
ln0 2
(B-8)
If a set of experimental data ( iT , i , i =1,2,…m) were introduced into Eq. (B-8):
i
n RT
E
E
AR
T
di
ln)1(
ln0 2
, i =1,2,…m (B-9)
assigned iy as:
i
T
dy
ni
0 2)1(
ln (B-10)
and ix as:
i
iT
x1
(B-11)
The following equation can be obtained:
baxy ii ( i =1,2,…m) (B-12)
where R
Ea ,
E
ARb
ln .
Therefore, from Eq. (B-12), a and b could be solved as:
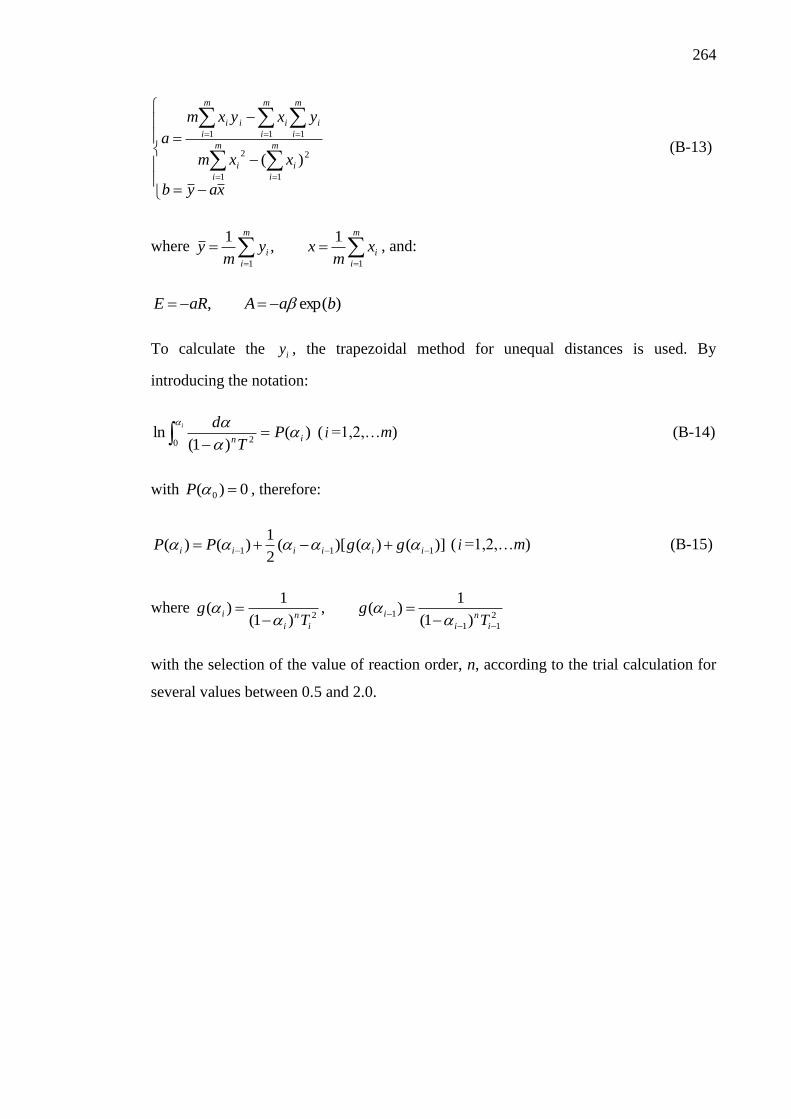
264
xayb
xxm
yxyxm
am
i
m
i
ii
m
i
m
i
ii
m
i
ii
1 1
22
1 11
)( (B-13)
where
m
i
i
m
i
i xm
xym
y11
1,
1, and:
)exp(, baAaRE
To calculate the iy , the trapezoidal method for unequal distances is used. By
introducing the notation:
)()1(
ln0 2 in
PT
di
( i =1,2,…m) (B-14)
with 0)( 0 P , therefore:
)]()()[(2
1)()( 111 iiiiii ggPP ( i =1,2,…m) (B-15)
where 2
11
12 )1(
1)(,
)1(
1)(
i
n
i
i
i
n
i
iT
gT
g
with the selection of the value of reaction order, n, according to the trial calculation for
several values between 0.5 and 2.0.
265
APPENDIX – C GLOSSARY OF COMMONLY USED TERMS
Pyrolysis
Pyrolysis is the process of conversion of biomass and waste materials into useful liquid,
gaseous fuels and char. The process is carried out in the absence of oxygen. Thermal
breakdown of biomass produces varying proportion of char, liquid oils and gaseous
fuel. Depending upon the heating rate pyrolysis can be categorized into slow, fast or
flash pyrolysis.
Slow pyrolysis
During slow pyrolysis, heating rate varies from 5 - 7 ˚C min-1
. This slow heating rate
produces more solid char and lesser amounts of liquid oils and gaseous fuels. Output of
the process varies with the increase in reaction temperature. Increasing temperature
produces more oils up to 550 - 600 ˚C and less char.
Fast pyrolysis
A higher heating rate of around 300 ˚C min-1
is used in fast pyrolysis. It favours
production of more oils and less char. Fast pyrolysis is more successful with fluidized
bed reactor in producing more oil yield.
Flash pyrolysis
Flash pyrolysis employs very high heating rates of > 100 ˚C s-1
with reaction time of
only few seconds or even less. Due to high heating rate and low reaction time, particle
size is an important factor. Particle size from 105 - 250 µm is favourable for flash
pyrolysis.
Gasification
Gasification is the process of conversion of biomass or organic waste feedstock into a
combustible gas. This process is carried out at substoichiometric conditions typically at
temperature varying from 500 - 850 ˚C.
266
Combustion
During combustion, biomass is burnt in an open atmosphere in the presence of excess
amount of oxygen to produce carbon dioxide, water and heat. Heat generated from
combustion of biomass can be used in various ways especially for electricity generation.
Temperature programmed oxidation
The temperature programmed oxidation (TPO) technique is used to characterise the
reacted catalysts using a thermogravimetric analyser (TGA). This technique is used to
investigate the amount of coke deposited on the spent catalyst from the process of
pyrolysis/gasification. Around 15 mg of reacted catalyst is placed inside the crucible of
the TGA and heated from room temperature to 800 °C at a heating rate of 15 °C min-1
in
an air atmosphere (50 ml min-1
). The weight loss of the sample is recorded in relation
to time and temperature.
Synthesis gas or syngas
Mixture of gases produced during gasification of biomass is known as synthesis gas or
syngas. It is a combination of hydrogen, carbon monoxide, carbon dioxide and methane
and lighter hydrocarbons including ethane, ethene, propane, propene, butane, butene
and butadiene.
Residence time
Residence time is the reactor volume divided by the carrier gas flow rate.
Fixed bed reactor
Fixed bed reactors are stationery reactors which are relatively easy to design and
operate. In a fixed bed reactor the sample is normally introduced from the top of the
reactor while the product gases leaves either from the top or from the bottom depending
upon up draft or down draft configuration. These types of reactors are suitable for small
to medium applications. Due to the absence of mixing medium, achieving a uniform
temperature is difficult at large scale.

267
Fluidised bed reactor
Fluidised bed reactors use a moving bed of inert material such as sand or silica.
Feedstock is introduced from the bottom of the reactor and fluidised using air, nitrogen,
steam, recycled product gases or a combination. Product gases leave the reactor from
the upper part. Due to the fluidisation, heat transfer increases which in turn leads to
better reaction rates and improved conversion efficiency. Fluidised bed reactors are
suitable for medium to large applications and they can be easily scaled to megawatt
applications.
Related Documents