1 Ultimate Shear Behaviour of Hybrid Reinforced Concrete 1 Beam-to-Steel Column Assemblages 2 D. V. Bompa and A. Y. Elghazouli 3 Department of Civil and Environmental Engineering, Imperial College London, UK 4 ABSTRACT 5 This paper examines the shear transfer mechanisms and ultimate behaviour of hybrid systems 6 consisting of reinforced concrete beams connected to structural steel columns. A series of five 7 large scale tests on structural assemblages, in which steel shear-arms are welded directly to the 8 steel columns and embedded in the reinforced concrete beams, is presented. After describing 9 the experimental arrangement and specimen details, the main results and observations obtained 10 from the tests are provided and discussed. The test results offer a direct evaluation of the 11 ultimate shear behaviour of such hybrid systems. The experimental findings also enable a 12 comparison with the strength predictions obtained from analytical models which are commonly 13 used in the design of conventional reinforced concrete members. The discussions and 14 comparative assessments presented in this paper provide an insight into the influence of various 15 shear transfer mechanisms including transverse reinforcement, compressive zones, residual 16 tensile stresses, aggregate interlock, and dowel action, in addition to the interfacial bond 17 between the steel profile and concrete. The activation and contribution of the key shear transfer 18 mechanisms are assessed in light of the experimentally-monitored crack growth, path and 19 pattern, as well as in comparison with widely-adopted analytical approaches. The results show 20 that the contribution of each transfer mechanism is a function of the crack kinematics and 21 corresponding level of applied load. Finally, modifications to existing analytical approaches for 22 conventional reinforced concrete elements are proposed in order to provide a reliable 23 evaluation of the ultimate shear capacity of such hybrid systems. The suggested expressions 24 account for the influence of the shear-arms’ characteristics on the ultimate shear strength, and 25 offer a more realistic prediction of the behaviour in comparison with conventional reinforced 26 concrete design provisions. 27 28 Keywords 29 Hybrid systems; reinforced-concrete/steel assemblages; shear transfer mechanisms; shear 30 behaviour; shear design 31

Welcome message from author
This document is posted to help you gain knowledge. Please leave a comment to let me know what you think about it! Share it to your friends and learn new things together.
Transcript

1
Ultimate Shear Behaviour of Hybrid Reinforced Concrete 1
Beam-to-Steel Column Assemblages 2
D. V. Bompa and A. Y. Elghazouli 3
Department of Civil and Environmental Engineering, Imperial College London, UK 4
ABSTRACT 5
This paper examines the shear transfer mechanisms and ultimate behaviour of hybrid systems 6
consisting of reinforced concrete beams connected to structural steel columns. A series of five 7
large scale tests on structural assemblages, in which steel shear-arms are welded directly to the 8
steel columns and embedded in the reinforced concrete beams, is presented. After describing 9
the experimental arrangement and specimen details, the main results and observations obtained 10
from the tests are provided and discussed. The test results offer a direct evaluation of the 11
ultimate shear behaviour of such hybrid systems. The experimental findings also enable a 12
comparison with the strength predictions obtained from analytical models which are commonly 13
used in the design of conventional reinforced concrete members. The discussions and 14
comparative assessments presented in this paper provide an insight into the influence of various 15
shear transfer mechanisms including transverse reinforcement, compressive zones, residual 16
tensile stresses, aggregate interlock, and dowel action, in addition to the interfacial bond 17
between the steel profile and concrete. The activation and contribution of the key shear transfer 18
mechanisms are assessed in light of the experimentally-monitored crack growth, path and 19
pattern, as well as in comparison with widely-adopted analytical approaches. The results show 20
that the contribution of each transfer mechanism is a function of the crack kinematics and 21
corresponding level of applied load. Finally, modifications to existing analytical approaches for 22
conventional reinforced concrete elements are proposed in order to provide a reliable 23
evaluation of the ultimate shear capacity of such hybrid systems. The suggested expressions 24
account for the influence of the shear-arms’ characteristics on the ultimate shear strength, and 25
offer a more realistic prediction of the behaviour in comparison with conventional reinforced 26
concrete design provisions. 27
28
Keywords 29
Hybrid systems; reinforced-concrete/steel assemblages; shear transfer mechanisms; shear 30
behaviour; shear design 31

2
1. Introduction 1
Situations in which reinforced concrete floor elements need to be combined with vertical steel 2
members often arise in multi-storey buildings, either due to loading and performance 3
constraints or as a result of practical and constructional considerations. However, the design of 4
such ‘hybrid reinforced concrete/steel members’ often poses various uncertainties related to the 5
direct applicability of codified rules which are typically developed and validated for 6
conventional reinforced concrete or structural steel configurations. 7
Many previous studies have examined the performance of various forms of hybrid 8
steel/concrete elements. For example, various investigations have been carried out on the 9
performance of composite steel coupling beams connected to reinforced concrete wall elements 10
[1-4], and on the behaviour of connections between steel beams and reinforced concrete 11
columns [5-7]. Several recent studies have also examined the performance of flat slab-to-12
tubular steel or composite column connections [8-11] by means of embedded shear-arms. 13
Nevertheless, there is a dearth of fundamental assessments on the shear transfer mechanisms 14
and ultimate behaviour of hybrid reinforced concrete beam-to-steel column systems. 15
The presence of an embedded steel element within a reinforced concrete member creates a 16
discontinuity within two distinct regions (i.e. composite and non-composite), and results in 17
more complex behavioural characteristics than those occurring in conventional reinforced 18
concrete members. A number of failure modes can occur within the two regions of the hybrid 19
member, either in flexure or shear, with the latter involving more intricate inter-dependent 20
behavioural mechanisms. In a recent numerical study by the authors [12], typical shear failure 21
mechanisms involving diagonal tension or shear crushing that can occur in hybrid beams, were 22
explored. As expected, early stages of behaviour are described by flexural cracking. When 23
flexural failure is not governing and high shear forces are mobilised in the section, diagonal 24
cracking occurs. Shear failure takes place when stresses cannot be transferred through the crack 25
interfaces and the member divides into two rigid bodies rotating along a fixed point located at 26
the crack tip in the compression zone. Shear transfer can include contributions from several 27
mechanisms including the concrete compressive zone, aggregate interlock, dowel action and 28
transverse reinforcement [13-26], as well as the interfacial bond between the steel member and 29
surrounding concrete [27-29]. The activation of each mechanism depends on the material 30
strength, reinforcement details and member size. 31

3
Taylor [14,15] carried out investigations focusing on the distribution of shear stresses in the 1
compression zone of reinforced concrete beams by monitoring the strains using a detailed 2
arrangement of electrical strain gauges. The results showed that, before cracking, the shear 3
stress distribution is nearly parabolic and the force carried by the compression zone increases 4
slowly up to 20-40% of the total shear force until the beam approaches failure. It was reported 5
that the tension zone of the beam can carry up to 75% of the total shear force, with the transfer 6
through aggregate interlock contributing up to 33-50% of the total shear and the dowel action 7
in the range of 15-25%; the latter two mechanisms decrease significantly when stirrups are 8
present. The results presented by Swamy et al [22] are also in agreement with the above, and 9
showed that shear transferred through aggregate interlock decreases with the increase in load. 10
Several models have been proposed to estimate the contribution of aggregate interlock to the 11
ultimate shear strength [e.g. 16,17,19,22,30]. The model proposed by Walraven and Reinhard 12
[16] and Walraven [17] accounts for the physical behaviour of the interlocking crack faces and 13
is based on a cumulative distribution function of the aggregates in the crack plane. Modified 14
approaches incorporating other width-to-slip relationships have also been proposed by Ulaga et 15
al [31] and Guidotti et al [32]. On the other hand, Dei Poli et al [19] adopted an idealised crack 16
model where the aggregate interlock contribution was assessed by assuming that the reinforced 17
concrete beam behaves as a plane truss with shear and confinement stresses along the diagonal 18
cracks. In general, shear transfer through aggregate interlock is often examined together with 19
dowel action since they are strongly linked. Based on experimental observations, statistical 20
assessments were carried out to estimate the interdependency between aggregate interlock and 21
dowel action [22]. It was shown that the shear carried by the interface depends on the amount 22
of longitudinal reinforcement, transverse reinforcement (spacing, intersection with governing 23
crack and longitudinal reinforcement), concrete strength and moment-to-shear ratio. 24
Various investigations were also carried out to assess the capacity of a dowel in shear. For 25
example, based on experimental observations from tests involving ribbed bars, Dei Poli et al 26
[20] developed formulations based on the subgrade stiffness of the concrete embedment. 27
Several other models assumed that the dowel action can be assessed using an analogy with a 28
beam on elastic foundation [33,34]. At ultimate state however, other studies [e.g. 20,35] 29
indicate that this assumption is inaccurate owing to the non-linear behaviour of steel 30
reinforcement and concrete within the embedment region. The non-linear behaviour can be 31
captured by relating dowel bending to deformation by means of limit analysis as investigated 32

4
by Paulay and Loeber [18], Chana [23] and more recently by Campana et al. [26]. On the other 1
hand, the transfer through the fracture process zone was assessed by several researchers using 2
the theory on fracture mechanics. The transfer of residual stresses through the cracked 3
interfaces follows a non-linear post-peak curve that is defined by a stress-crack opening 4
relationship, the maximum crack width and uni-axial tensile strength of concrete [38].. It is also 5
worth noting that the contribution of the shear transferred by friction at the steel profile-6
concrete in composite members could be significant, but it depends on the surface properties, 7
embedded length, concrete strength, and concrete cover. Wium and Lebet [28] showed that the 8
resistance is highly depended on the size of the embedded steel section. 9
This paper focuses on examining the fundamental shear transfer mechanisms in hybrid 10
structural systems consisting of reinforced concrete beams connected to steel columns by 11
means of embedded ‘shear-arms’ (or ‘shear-keys’) which are directly welded to the steel 12
columns and fully embedded in the reinforced concrete beams. A full account of the results of a 13
series of five large scale tests on hybrid reinforced concrete beam-to-steel column assemblages 14
is given. The tests are part of a wider European collaborative project which aims at providing a 15
unified design procedure for various hybrid steel/concrete structural configurations. Based on 16
detailed measurements of crack growth and propagation at various load levels approaching 17
failure, the contribution of each shear transfer mechanism to the ultimate shear strength is 18
quantified. Using the experimental results and observations, the paper also assesses the 19
adequacy of strength predictions obtained from analytical models which are adopted in the 20
design of conventional reinforced concrete members, with emphasis on European and North 21
American provisions. Finally,an analytical approach, based primarily on the procedures 22
employed in Eurocode 2, is proposed in order to predict the ultimate shear behaviour of hybrid 23
members of the form investigated in this paper. 24
25

5
2. Experimental Programme 1
2.1 Testing Arrangement 2
The layout of the testing arrangement is shown schematically in Figure 1(a), whilst Figure 1(b) 3
provides a general view of the test set-up. The test rig was designed to enable realistic 4
experimental assessment of the ultimate behaviour of the large-scale hybrid beam/column 5
specimens up to failure. The rig consisted of a main loading frame, on which an actuator of 6
1000 kN capacity was mounted, and two reaction frames which provided the support points at 7
both ends of the beam. Loading was applied by the actuator through a pinned connection at the 8
top of the steel column section in the upward vertical direction, hence simulating vertical 9
downward reaction loads at the two ends of the beam. The reactions between the specimen 10
ends and the supporting frames were transferred through two steel rollers of 100 mm diameter. 11
Two steel plates 180 mm wide and 20 mm thick were positioned between the rollers and the 12
specimen to avoid local effects at the supports. All tests were carried out in the displacement 13
control mode of the actuator in order to enable detailed observation and measurement 14
particularly at the ultimate stages of the response. 15
Besides the displacement and load measurements provided directly by the actuator, a number 16
of independent displacement transducers were attached throughout the length of the specimen. 17
In addition, detailed measurement of the initiation, growth and pattern of cracks was obtained 18
by means of ‘Demec’ mechanical dial gauges. The Demec recordings were verified at several 19
locations of the grid using a crack microscope. The crack pattern was captured by a digital 20
camera at the load stages at which Demec measurements were taken. Strain gauges were 21
additionally placed at various locations within the specimens. Procedures for monitoring crack 22
development and strain gauge measurements are described in more detail in subsequent 23
sections of this paper. 24
25
2.2 Specimen Details 26
A series of five specimens were tested, and the main parameters varied were the embedded 27
length of the shear-key (embedded length-to-steel member depth lv/hv=1.0-3.6), the presence of 28
transverse reinforcement (four specimens had stirrups with ρw=0.19% and one without) and the 29
stiffness ratio between the member and the shear-key; this ratio is represented by η=EcIc/EvIv 30
which is dependent on the elastic concrete modulus Ec assessed by means of the Eurocode 2 31

6
approach [39], the elastic moment of inertia of the concrete cross-section Ic, the elastic steel 1
modulus Ev obtained from material tests and the moment of inertia of the shear-key Iv. 2
Figure 2 shows a typical elevation (for half the tested element) and typical cross-sections for 3
the specimens, whilst Table 1 summarises the details of the tested models. The dimensions of 4
the specimens were selected based on practical ranges as well as experimental constraints, with 5
the aim of achieving shear failure involving yielding of stirrups or concrete crushing. The 6
specimens replicate the joint region of a hybrid frame structure that is made of steel columns 7
and reinforced concrete beams. The joint region is represented by a steel column stub and two 8
hybrid RC-composite cantilevers. The position of the supports depict the zero bending moment 9
section of a continuous beam with moment span of about 6m. A column section HEB240 was 10
used in all five specimens. In four of the specimens (B25-R10-W20-S8, B10-R10-W20-S8, 11
B36-R10-W20-S8 and B25-R10-W0-S8), HEB200 shear-keys were fully welded 12
symmetrically on both sides of the column. The span used for these four members was Ls=2600 13
mm.The fifth specimen (B25-R12-W20-S16) had a UC152 shear-key and a shorter moment 14
span Ls=2300 mm. The total length of all reported specimens was L=3750mm. The embedded 15
length of the shear-keys lv varied between 200 mm and 720 mm as indicated in Table 1. 16
The typical arrangement of longitudinal reinforcement consisted of 2ϕ25 bars crossing the steel 17
column and 2ϕ20 bars positioned outside the column perimeter (Figures 2b and 2c). The 18
reinforcement ratio (ρl) was 1.09% for the first four specimens (i.e. B25-R10-W20-S8, B10-19
R10-W20-S8, B36-R10-W20-S8, and B25-R10-W0-S8) and 1.21% for B25-R12-W20-S16. 20
Four ϕ12 bars were placed at the bottom in all specimens to ensure continuity. The transverse 21
reinforcement included equally-spaced two-legged stirrups of ϕ8 mm. The spacing between the 22
stirrups was sw1=150 mm within the moment span region and sw2=70 mm outside the moment 23
span region. The actual effective depths of the specimens were determined by means of saw 24
cuts throughout the depth of the specimens, and are given in Table 1. Material tests have been 25
carried out in order to assess the strength and ductility characteristics of the steel used in the 26
shear-keys and reinforcement bars. The average values of their properties based on a minimum 27
three material tests are depicted in Table 2. 28
Ready mix concrete of Grade C25/30 with a maximum aggregate size of 10 mm was used in all 29
specimens. A set of twelve samples were prepared to obtain the hardened concrete properties at 30
28 days and three samples to assess the strength on the day of testing. The samples used to 31
determine the 28 day strength were immersed in water, whereas the others were maintained 32

7
next to the test specimens. The compressive strength of concrete (fc) obtained from cylinders 1
on the day of testing varied from 27.3 to 34.3 MPa (Table 1), whilst the strength at 28 days 2
(fc,28d) varied from 29.9 to 38.7 MPa. The concrete compressive strength determined from 3
cubes (fc,cube) varied from 33.3 to 44.8 MPa, and the splitting tensile strength fct,sp varied from 4
2.14 to 2.87 MPa. 5
6
2.3 Monitoring of Cracks and Strains 7
Detailed measurements of cracks were made at critical loading steps depending on the crack 8
initiation, growth and pattern by means of a ‘Demec’ mechanical dial gauge. The Demec 9
system incorporates a digital dial gauge and an Invar bar. A conical fixed point was mounted at 10
one of the ends of the Invar bar and a pivoting point at the other end. The distance between the 11
two conical points was 150 mm. In addition to strain gauges, strain measurements were also 12
made by placing the two conical points in the holes within the steel discs which were attached 13
to the concrete surface with adhesive. Each steel disc represented a relative measurement point. 14
The number of Demec points varied from 74 to 82 representing a ‘diamond’ grid of 178 to 198 15
lines as indicated in Figure 2. A purpose built program was developed in order to collect the 16
data from the digital dial gauge via a COM PC port. Careful tracking of the recordings was 17
followed in order to avoid the introduction of any spurious data. The first collection of data was 18
performed at the initial configuration when the specimen was in the testing position (i.e. 19
carrying only its own weight and the weight of the rollers). Table 3 presents the loading step 20
when the Demec data collection was carried out, as discussed in more detail in subsequent 21
parts of this paper. Each measurement was further processed to obtain the strain in various 22
regions of the specimen. The instrumented load stages for each specimen, as a fraction of 23
ultimate recorded load, were: 100% of Pu,test for B25-R10-W0-S8, 83% of Pu,test for B10-R10-24
W20-S8, 99% of Pu,test for B25-R10-W20-S8, 90% of Pu,test for B36-R10-W20-S8 and 94% of 25
Pu,test for B25-R12-W20-S16. 26
3. Experimental Results and Observations 27
3.1 Load-Displacement Response 28
The load (Pi) versus applied mid-span displacement (Δ) curves for all five specimens are 29
shown in Figure 3. On the other hand, Figure 4 depicts a mapping of the crack pattern at 30

8
failure. The specimen without transverse reinforcement B25-R10-W0-S8 showed the lowest 1
capacity (Pu,test=350 kN). The three specimens with the same cross-sectional ratio (i.e. 2
B360x455 and HEB200 shear-key) showed an increase in ultimate strength with the increase in 3
embedded length. The specimen with the shortest shear-key, B10-R10-W20-S8, showed a peak 4
load of Pu,test=647 kN. The reference specimen with intermediate embedment length, B25-R10-5
W20-S8, failed at Pu,test=710kN, whereas in the case of that provided with the highest 6
embedment length, B36-R10-W20-S8, the failure was recorded at Pu,test=788kN. The strength 7
of the fifth specimen reported herein, that had the same embedded length to depth ratio lv/hv but 8
smaller concrete and shear-key cross-sections, failed at Pu,test=653kN. 9
In the case of the specimen without shear reinforcement (B25-R10-W0-S8), flexural cracking 10
was observed at about 24% of Pu,test. With increasing load, the struts forming between flexural 11
cracks started to rotate and produced inclined cracking on the right-hand side of the specimen. 12
Diminished propagation of cracking was observed on the opposite side. Failure occurred on the 13
left-hand side due to the development of an inclined shear crack connecting the support and the 14
tip of the column, and passing below the shear-key (Figure 4a). 15
The specimens provided with shear reinforcement (i.e. B10-R10-W20-S8, B25-R10-W20-16
S8,B36-R10-W20-S8, B25-R12-W20-S16) exhibited similar behaviour throughout the loading 17
process. The first flexural cracks were observed in the region of maximum bending moment at 18
load levels around 10% of the ultimate load Pu,test. The flexural cracks had the tendency to form 19
in the vicinity of transverse reinforcement at nearly uniform spacing. With increasing load, the 20
flexural cracks located at the boundary between the reinforced concrete region and composite 21
region gradually rotated, intersecting the tip of the bottom flange of the shear-key. 22
In the case of the specimen with the shortest shear-key, B10-R10-W20-S8, the first diagonal 23
crack was observed at about 40% of Pu,test on the right hand side of the specimen. A diagonal 24
crack with an inclination of 42o governed the behaviour up to load levels close to ultimate 25
strength. The failure was characterized as mixed flexure-shear since high levels of strain were 26
recorded in the longitudinal reinforcement (Figures 4b and 5b). In the case of the Reference 27
Specimen B25-R10-W20-S8, the first flexural cracks were recorded at about 7% of Pu,test and 28
inclined cracks propagated from the flexural ones at nearly 28.5% of Pu,test. Diagonal cracking 29
due to direct formation of struts, developing from the edge of the support plate to the bottom 30
tip of the shear-key, was observed at around 56% of Pu,test. Nearly symmetric cracks occurred 31
on both sides of the specimen. The crack widths recorded during the test showed slightly larger 32

9
values for the right hand side. However, failure occurred due to the development of a diagonal 1
shear crack on the left-hand side of the specimen, starting from the support plate to the face of 2
the column, joining a flexural crack and crossing below the bottom flange of the shear-key (see 3
Figures 4c and 5a). Failure was attributed to the yielding of the stirrups crossing the governing 4
shear crack with an average inclination of 36o. 5
For the other extreme case, Specimen B36-R10-W20-S8 with the longest shear-key, diagonal 6
cracking was recorded at 35% of Pu,test. The crack firstly developed from the tip of the shear-7
key towards the support at an inclination of 44o. The governing shear crack followed an elbow-8
shaped pattern developing below the shear-key and reaching the steel column (Figure 4d). On 9
the right side of the specimen, parallel inclined cracks were observed at load levels between 10
278 and 649 kN in the shear-key region suggesting a composite action in shear. Failure 11
attributed to shear initiated from the reinforced concrete section (outer region) between the 12
support and tip of the shear-key. One stirrup fractured as observed after the removal of the 13
concrete cover (Figure 5d). 14
In the case of B25-R12-W20-S16, the first flexural cracks followed the line of the column 15
flange and further growth was recorded with the increase in load. Diagonal cracks, firstly 16
observed at 38%Pu,test, formed gradually in a relatively symmetrical pattern to the column axis 17
on the monitored side of the beam. The governing shear crack developing at 37o commenced 18
from the column edge in the compression zone, joining the tip of the shear-key. The final crack 19
pattern was characterized by three cracks joining the root of the column to the support plate. 20
Failure was attributed to the fracture of the nearest stirrup to the tip of the shear-key (Figures 21
4e and 5c). 22
3.2 Shear Transfer Mechanisms 23
This section deals with the assessment of shear transfer mechanisms (STM) based on detailed 24
test measurements using the mechanical dial gauges. As noted previously, and as described in 25
Figure 6, the crack width and crack slip were calculated accounting for the local crack 26
inclination and the geometry of the grid. The direct result of using the ‘Demec’ mechanical 27
gauge system is that accurate results regarding the development of the compression and tension 28
stress fields in one-way specimens can be obtained. For example, this is illustrated in Figure 7 29
which depicts a qualitative distribution of stress fields across the monitored face of the 30
Reference Specimen B25-R10-W20-S8 at three loading stages. The geometry of the stress 31
fields changes in agreement with the crack path and growth, showing an exact match between 32

10
the crack path captured by the digital camera and stress fields by means of Demec 1
measurements (Figure 4c and plot corresponding to 0.99Pu in Figure 7). With the aid of the 2
detailed test measurements, the following sub-sections offer an assessment of aggregate 3
interlock, dowel action, shear carried by the compressive zone, contribution of transverse 4
reinforcement, composite slip between the steel shear-key and the concrete free body, as well 5
as the transfer mobilised through the fracture process zone. The Demec measurements, used to 6
determine the contribution of each shear transfer mechanism, were taken at the following 7
loading stages: 100% of Pu,test for B25-R10-W0-S8, 83% of Pu,test for B10-R10-W20-S8, 99% 8
of Pu,test for B25-R10-W20-S8, 90% of Pu,test for B36-R10-W20-S8 and 94% of Pu,test for B25-9
R12-W20-S16. 10
3.2.1 Aggregate Interlock�11
As illustrated in Figure 8a, as the crack width and slip increase, the edges of the aggregates 12
protrude to the opposite face of the crack resulting in plastic deformations in the cement paste 13
which, for normal strength concrete, has lower strength than the aggregates (Figure 8b) [16,17]. 14
The aggregate interlock contribution is dependent on the roughness of the crack interface, 15
aggregate type, their embedment depth in the cement paste, the magnitude of the slip, and the 16
opening of the two interfaces .In the current investigation, the model developed by Walraven 17
[16,17] is employed (Figure 8a). 18
Accounting for the embedment of the aggregate in the cement paste, the model considers the 19
following contact phases between the aggregate particle and the cement matrix: growing 20
contact phase, maximum contact phase and no contact. The shear and normal stresses acting on 21
the crack interface are defined by the following: 22
agg pu s wA A (1a) 23
agg pu w sA A (1b) 24
The contact areas As and Aw depend on the crack width w, crack slip Δs, the maximum 25
aggregate diameter dg and the total aggregate volume per unit volume of the concrete ρk. The 26
matrix compressive strength σpu is related to the concrete compressive strength and the 27
coefficient of friction µ=0.5 (Figure 8b), as follows: 28
0.635.83pu cf (2) 29

11
The general formulation, dependent on the contact phase (magnitude of crack slip and crack 1
width) of the contact areas, is given by Equation (3). 2
2
1
,
4,
d
i k k sgd
DA F G w D dD
d
(i = w,s) (3) 3
The simplified model in [16,17] accounts for maximum aggregate dimensions between 16 and 4
32 mm. In the current study, concrete with a maximum aggregate dimension dg,max=10mm is 5
used, therefore Equation (3) was employed to obtain the contact areas Aw and As. It can be 6
observed that the contact areas Aw and As, and consequently the interfacial stresses, decrease 7
with the increase of crack width and slip. On the other hand, the maximum dimension of the 8
aggregate has a significant influence on the analytical prediction for large crack widths and 9
crack slip. For the extreme cases (w=1.0 mm; Δs=2.0mm), the contact areas for dg=10mm is 10
about half that in the case of dg=32mm (Figure 9a). 11
The contribution of this shear transfer mechanism was accounted for using an average 12
distribution of stresses over the governing shear crack at the instrumented loading stage (Figure 13
9c). The normal and tangential stresses acting on the crack interface are based on the detailed 14
local recordings. It can be seen that for loading stages close to ultimate strength, the crack 15
widths and slips show larger values, therefore the contribution is modest (e.g. 6% of the 16
estimated shear transfer at 99% Vu,test for B25-R10-W20-S8). On the other hand, at early 17
loading stages the contribution is significant (e.g. 28% of the total shear transfer at 83% of 18
Vu,test for B10-R10-W20-S8) (Table 4). The contribution of this mechanism reduces as the 19
specimen reaches the ultimate limit state. In specimens without shear reinforcement, narrower 20
crack widths are expected, therefore the contribution becomes significant (e.g. 32% of the 21
determined shear transfer at failure for B25-R10-W0-S8). 22
3.2.2 Dowel Action�23
One of the main instigators for shear failures in beams without transverse reinforcement is the 24
cracking initiation and splitting of concrete at the level of the longitudinal reinforcement bars 25
[24]. In cases with large stirrup spacing, similar behaviour occurs as well. When transverse 26
reinforcement is present, failure develops in a more controlled fashion; splitting is blocked and 27
the beam remains stable up to the yielding of the stirrups or yielding of flexural reinforcement. 28
Activation of dowel action requires a level of dowel displacement Δdow involving a combined 29
set of effects in the crack region, such as bending of the dowel as well as secondary effects 30

12
(concrete breakout and concrete spalling at ultimate limit state) (Figure 10a). The dowel force 1
depends on the diameter of the bar, layout of the tension bars, width of the dowel failure 2
surface and the concrete tensile strength. The relationship between dowel bending and dowel 3
displacement can be determined by means of limit analysis. Dowel bending occurs as a 4
consequence of the application of two concentrated forces separated by the dowel span ldow 5
(Figure 10b). Accounting for the moment equilibrium at the centreline of the dowel span and 6
for the level of stress in the dowel bar, the ultimate dowel force (as result of formation of two 7
plastic hinges) is given by Equation (4). Dowel bending takes place as the load increases. 8
Concrete breakout occurs for thick concrete covers, typified by the dislocation of small cones 9
under the reinforcement bars, whereas spalling occurs for thin concrete covers. The 10
contribution of these two mechanisms depends on the tensile stresses in the concrete in the 11
vicinity of the dowel (Figure 10a). It can be shown that the shape of the breakout cone is 12
mainly attributed to the dowel diameter. The depth of the cone (radius) is about 0.5db and the 13
height is 1.5db (Figure 10c [20]). The required force to produce concrete breakout can be 14
approximated by Equation (5), and the force leading to spalling by Equation (6). The total 15
contribution of the dowel action at ultimate state is predicted by the sum of the primary and 16
secondary mechanisms related to the dowel bending as given by Equation (7). 17
3
,
1 cos
3
s dowb ys
ys dow
dow udow
ld f
fV
l
(4) 18
2, 0.5 2.75
4dow br b ctV d f
(5) 19
, 1 cotdow sp ctV c f (6) 20
, , ,dow dow u dow br dow spV V V V (7) 21
Figure 10d plots the relationship between the dowel span ldow and the dowel action Vdow 22
accounting for the flexural reinforcement existing in the test specimens (i.e. 2×ϕ25 + 2×ϕ20). 23
The contribution of the dowel action to the shear transfer is significant for small dowel spans. 24
As the dowel span increases, the dowel action diminishes (e.g. the case of B10-R10-W20-S8 25
where ldow=616mm). Accounting for Equation (4), the magnitude of the dowel action is 26
dependent on the dowel stress. For stress levels approaching the yield strength, the dowel 27
action tends to be non-existent (e.g. the case of B25-R10-W20-S8, where σs/fys=0.99). All 28
specimens provided with transverse reinforcement showed stress levels in the longitudinal 29

13
reinforcement higher than 80% of its yield strength. Consequently, in such configuration, the 1
dowel action becomes rather insignificant with respect to the total shear transfer. The 2
secondary mechanisms are not accounted for in the shear transfer for these members since they 3
are only activated at ultimate state, and the measurements were taken prior to that point. 4
However, in the case of B25-R10-W0-S8, the stress in the reinforcement was σs/fys=0.31, the 5
dowel span ldow = 177 mm, and the measurements were taken at failure (at 350 kN, whereas the 6
ultimate strength based on the load recorded by the load cell was Pu,B25-R10-W0-S8=350.06 kN); 7
the contribution is therefore high as it accounts for primary (dowel bending) and secondary 8
(concrete breakout and spalling) mechanisms – as indicated in Table 4. 9
3.2.3 Concrete Compressive Zone 10
The shear carried by the concrete compressive zone is dependent on the member size, neutral 11
axis position and internal force distributions. The compressive strength of concrete affects the 12
state of stresses and shear strength. The current investigation assesses the transfer through the 13
concrete compressive zone by considering a series of internal equilibrium equations on the free 14
body diagram in Figure 11. The forces involved in the shear transfer Vtot are the transfer 15
through the compressive zone Vch, dowel action Vdow, aggregate interlock Vagg, concrete 16
residual stresses Vres, composite slip Vv and transverse bars intersected by the governing shear 17
crack ΣVsw,i (Equation 8). 18
,tot ch dow agg res v sw iV V V V V V V (8) 19
Accounting for the moment equilibrium about the rigid body rotation point (Figures 11 and 20
12): 21
, , 0.5 0sw i sw i dow dow agg dow res res v v ch tot iV a V a V a V a V a N d c V a (9) 22
The shear stresses in the compression zone are in the form of a parabola at early loading stages 23
(elastic stage – νch,max at the neutral axis), whereas at stages near ultimate, the maximum shear 24
stress νch,max is found to be above the neutral axis in the compressive block [15]. For simplicity, 25
the current study accounts for a uniform distribution of shear and normal stresses in the 26
concrete compression zone (Figure 13), as follows: 27
chch
V
b c
(10a) and ch
ch
N
b c
(10b) 28

14
Under the applied load Pi, the shear stresses and the normal stresses in the shear critical zone 1
increase proportionally. Consequently, they can be related to a proportionality constant λK 2
[36,37] as follows: 3
ch K ch (11a) 4
where , / K x crl c (11b) 5
in which ,x crl is the length of the horizontal projection of the diagonal shear crack. 6
The horizontal projection of the shear crack results from the recorded crack pattern at the 7
instrumented loading stage. On the other hand, the depth of the compression zone is estimated 8
with due account for the linear distribution of strains between the tension and compression 9
zones, using the test measurements based on the Demec grid and visual observations at the 10
corresponding loading stage. 11
For Specimen B10-R10-W20-S8, the depth of the compression zone was estimated as 65mm 12
corresponding to an applied load Pi=535kN. Limited flexural cracking was observed in the 13
shear span, hence the inclined compressive stress field was not disturbed - maintaining its 14
elastic configuration throughout nearly the entire loading process. The contribution of shear 15
transfer via the concrete compression zone to the total shear is significant (up to 41% of the 16
shear force). The Reference Specimen B25-R10-W20-S8 showed a similar behaviour. The 17
depth of the compression zone was found to be c=70mm at 99% of the ultimate strength. Due 18
to the large contribution of the stirrups, accounting for the equilibrium conditions indicates that 19
24% of the shear is transferred through the compressive zone. The specimen with the longest 20
shear-key (B36-R10-W20-S8) shows a reduced transfer through the compressive zone (29% of 21
the estimated shear force for c=83mm) at 90% of the ultimate strength. For tests where the 22
measurements were taken near the ultimate limit state, the contribution reduces considerably 23
since the neutral axis drops to very low values and shear is predominantly carried by stirrups. 24
3.2.4 Transverse Reinforcement�25
The total amount of shear force carried by the transverse reinforcement is determined by the 26
level of stress, bar diameter and bond characteristics. Reinforcement forces were calculated 27
according to bar diameter and rebar stresses. Demec measurements were converted into strains 28
by considering the 150 mm Demec gauge length and local crack inclinations. Accounting for 29

15
material properties as reported in Table 2, the reinforcement stress was determined assuming 1
bi-linear constitutive laws. 2
The strain in a transverse bar is given by the strain resulting from the governing shear crack 3
intersecting the bar. In the tests presented herein, the stirrups were intersected by a number of 4
inclined cracks besides the governing one (Figure 14a). The peak strain in the stirrup εsw,i, as 5
predicted by Equation (12), is given by the width of the governing shear crack wcr intersecting 6
the stirrup (accounting for its inclination; with reference to the maximum crack widths plotted 7
in Figure 12 for each specimen at the instrumented load stage). The cracking strain is 8
subtracted in the calculations (, /ct cr ct cf E ) from the direct test recordings. 9
,,
crsw i
sw i
w
l (12) 10
The contribution of one transverse bar is given by: 11
2, ,4sw i b sw sw iV d E
(13) 12
The specimens in this study were reinforced with closed stirrups with each branch of dbw=8mm 13
(Asw,i=2ϕ8mm) spaced at sw=150mm. The material properties of the stirrup steel materials are 14
reported in Table 2. The post-yield modulus considered for the hardening branch of the bilinear 15
stress-strain diagram used in the investigations is Eshw=1518 MPa (Figure 14b). Accounting for 16
the total length of the stirrup lsw=402 mm, the average crack width at yielding of the two 17
branches of one stirrup is w2.4mm. 18
The contribution of the transverse reinforcement is dependent on the crack kinematics (pattern 19
and width). The inclination of the shear crack (Table 3) is one of the governing parameters: a 20
steeper crack intersects a reduced number of stirrups (2 stirrups in case of B10-R10-W20-S8 21
and B36-R10-W20-S8), whereas the presence of a flatter crack results in the activation of an 22
increased number of stirrups (4 stirrups for B25-R10-W20-S8 and B25-R12-W20-S16). 23
Therefore, the contribution of stirrups to the total shear transfer is high for B25-R10-W20-S8 24
and B25-R12-W20-S16 (61% and 53%, respectively) and relatively lower for B10-R10-W20-25
S8 and B36-R10-W20-S8 (12% and 25%, respectively), as indicated in Table 4. 26

16
3.2.5 Shear-key Contribution�1
In the elastic and flexural cracking stages, the bottom flange of the shear-key acts as support 2
for the governing strut. In case of isolated specimens, as those reported in this paper, the 3
embedment length influences the specimen behaviour in the sense that the strut inclination 4
depends on the composite shear span (i.e. the distance between shear-key tip to the support). In 5
case of long embedment lengths, direct transfer in the composite span is likely to occur. On the 6
other hand, in case of short shear-key, the direct transfer reduces as the composite shear span 7
increases. An increase in loading leads to higher stress in the strut and eventually to the 8
development of a diagonal crack below it. In some cases, the governing shear crack intersects 9
the shear-key just below the inclined strut (Specimens B10-R10-W20-S8, B36-R10-W20-S8, 10
B25-R12-W20-S16). At ultimate state, the rigid body rotation axis drops below the bottom 11
flange of the shear-key. As a result of the rotation, the body slips from the shear-key (Figure 12
15a). The amount of force necessary to produce the slip is directly related to the shear crack 13
width. After slip occurs, a residual amount of bond exists between the two interfaces (a typical 14
bond-slip relationship is depicted in Figure 15b). 15
The influence of the cross-sectional size of the shear-key was investigated by modifying the 16
stiffness ratio η as explained in Section 2.2. The section size varied from HEB200 for 17
Specimen B25-R10-W20-S8 to UC152 for Specimen B25-R12-W20-S16. For both specimens, 18
the embedment length-to-shear-key depth ratio (lv/hv=2.5) and moment span-to-effective depth 19
ratio (Ls/d) were maintained constant. Both the flexural and shear reinforcement ratios were 20
similar (refer to Table 1). As depicted in Figure 3, the stiffness response of the two specimens 21
is similar, whereas the ultimate strengths differ by 8%. Both specimens showed similar 22
response up to ultimate, failing in shear. At the instrumented load stage (99% of Pu for 23
specimen with HEB200 and 94% of Pu for specimen with UC152 shear-key), the governing 24
shear crack intersected four stirrups with at least one stirrup yielding. The strain levels in the 25
shear-key flange were in the elastic regime. At ultimate, the peak strain, located in the vicinity 26
of the steel column, reached values of 37% of the yield strain for the specimen with HEB200 27
shear-key and 75% of the yield strain for the specimen with UC152 shear-key. Despite the fact 28
that the flexibility of the shear-key was not investigated here, it is likely that for low stiffness 29
ratios η (i.e. small shear-key section size-to-beam cross-section), inelastic behaviour of the 30
shear-key could govern the behaviour leading to a more flexible beam response than the one 31
observed in the current test programme. 32

17
Based on the experimental database reported by Roeder et al [29] (Figure 15c), the maximum 1
bond stress accounted for in practice is smaller than the measured range. In the current study, a 2
lower bound of the maximum bond stress is accounted for in Equation (15); a value consistent 3
with the published results [28] for HEB200 profiles embedded in concrete was adopted. A 4
simple Coulomb criterion is applied to estimate the frictional resistance of the shear-key 5
against the concrete body. Accounting for a linear interaction between the frictional resistance 6
and slip (crack width) for a smooth steel interface embedded into a concrete body, the shear 7
transfer owing to the composite action between the shear-key and concrete is given by 8
Equation (14). The friction coefficient accounted for in this study is μ=0.8 according to values 9
reported in previous studies [27,28]. 10
,2 cot v b v v vV b c (14) 11
, ,max 0.5b v MPa (15) 12
, ,max 0.1v b v mm (16) 13
The shear-friction contribution between the concrete free body and the shear-key is determined 14
by accounting for the total slip across the inclined cracks intersecting the flanges of the shear-15
key for Specimens B25-R10-W20-S8, B10-R10-W20-S8, B25-R10-W0-S8 and B25-R12-16
W20-S16. This mechanism was not accounted for in Specimen B25-R10-W0-S8 since no 17
inclined crack intersected the shear-key (Figure 12d). Considering Equation 14, the 18
contribution of the ‘composite slip’ mechanism varies from 3% to 15% of the total shear force. 19
3.2.6 Concrete Residual Stresses�20
Shear cracks extend when the concrete is unable to transfer elastic stresses at the crack tip 21
(σct≥fct). Even if the concrete tensile strength is attained, stresses can be transferred through the 22
fracture process zone as long as the corresponding crack width is small. According to fracture 23
mechanics concepts [38], the crack propagation in concrete is modelled by a fictitious crack 24
defined by a region where aggregate interlock is activated and a true traction-free crack in a 25
unique crack plane. 26
27

18
4. Comparative Assessments 1
4.1. Contribution of Shear Transfer Mechanisms 2
Evaluation of the detailed experimental results, in the above sections, provided in-depth 3
insights into the contribution of different shear transfer mechanisms. The contribution of each 4
mechanism, as summarised in Figure 16 for the five large-scale specimens, varies according to 5
the crack pattern and kinematics and also with the magnitude of applied load. The crack pattern 6
and kinematics are clearly influenced by the presence of stirrups, amount of flexural 7
reinforcement and length of the shear-key. The presence of a steel insert in the RC section 8
alters the shear behaviour (in comparison with a typical RC member), largely by reducing the 9
shear span and increasing the direct strutting action. 10
As the transferred force increases, the dowel forces acting at the crack produce bending of the 11
tension reinforcement causing separation of the concrete cover from the dowel (at ultimate 12
state). Due to the increase in stress in the inclined strut, the perpendicular strain exceeds the 13
cracking strain of concrete. As a result, the diagonal crack grows further towards the 14
compression zone causing instantaneous failure in beams without shear reinforcement (i.e. in 15
Specimen B25-R10-W0-S8). When transverse reinforcement is provided, failure takes place in 16
a controlled fashion. The stirrups carry the load up to yield (e.g. in Specimens B25-R10-W20-17
S8 and B25-R12-W20-S16). At early loading stages (e.g. serviceability state) a higher shear is 18
transferred by the compressive zone since the neutral axis is closer to the median axis. In the 19
case of Specimen B10-R10-W20-S8, the compressive zone carries 41% of the shear at 83% of 20
the ultimate strength Vu,test. In the case of other specimens, the contribution of this mechanism 21
decreases substantially up to 14% for B25-R12-W20-S16 at 94% of its ultimate strength. 22
Transverse reinforcement, when available, carries significant levels of shear. The contribution 23
is dependent on the inclination and pattern of the shear crack. Specimens B10-R10-W20-S8 24
and B36-R10-W20-S8 showed steeper cracks (42o and 44o, respectively); therefore, the shear 25
crack intersected two stirrups. The level of shear transferred by the stirrups is 12% for B10-26
R10-W20-S8 and 25% for B36-R10-W20-S8. A notable increase in the fraction of shear 27
carried by transverse reinforcement occurs when the cracks show flatter inclination. Specimen 28
B25-R10-W20-S8 exhibited a crack inclination of 36o that intersected four stirrups. The level 29
of shear transferred by stirrups is 61% of the shear force at 99% of the ultimate strength. 30
Similarly, the shear carried by this mechanism in the case of B25-R12-W20-S16 is 53% at 94% 31
of the ultimate strength. 32

19
The interlocking between the protruding aggregates at the crack interface show various 1
contributions depending on the crack width and slip, and the consequent contact phase. As the 2
crack width increases (at subsequent loading stages) the contribution reduces. In the case of 3
B25-R10-W20-S8, the measurement was taken at 99% of Vu,test (wmax=3.83mm) (Figure 12a); this 4
mechanism contributes 6% to the shear transfer. In contrast, for smaller crack widths, either 5
due to measurement at earlier loading stages (B10-R10-W20-S8) or absence of transverse 6
reinforcement (B25-R10-W0-S8) the contribution is higher. Up to 28% of the shear is carried 7
by the aggregate interlock. The contribution is however modest, partly since the maximum 8
aggregate used in this study was 10 mm (See Section 3.2.1 and Figure 9a). On the other hand, 9
the transfer of residual stresses through the crack interface is not assessed in this study as noted 10
before, but this is expected to be negligible due to reduced dimensions of the fracture process 11
zone. Accounting for a maximum crack width of wcu=0.16mm for transfer of the residual 12
stresses [38] for horizontal crack tips, the shear carried by this mechanism would be below 13
1kN. 14
Besides its implicit contribution to the moment and shear capacity, the shear-key acts as 15
support for the governing strut. In some cases, the opening of the governing shear crack 16
produces free body rotation that results in slipping behaviour between the surrounding concrete 17
and the shear-key. The assessment of this mechanism by means of simple shear-friction 18
relationships show that a small fraction of shear is carried by this mechanism. The contribution 19
varies between 3% and 15% (B25-R10-W20-S8, B10-R10-W20-S8, B36-R10-W20-S8 and 20
B25-R12-W20-S16) and depends on the position of the shear cracks to the tip of the bottom 21
flange of the shear-key. For B25-R10-W0-S8, the shear crack developed below the shear-key, 22
and hence this mechanism was not activated. 23
The dowel bending is one of the principal shear transfer mechanisms for members without 24
shear reinforcement (i.e. B25-R20-W0-S8). The shear carried by this mechanism is 47%, 25
accounting for the secondary dowel mechanisms. This is backed up by small dowel spans and 26
low stresses in the dowel. On the other hand, for large dowel spans (i.e. B10-R10-W20-S8) the 27
contribution is 1%, and for high stresses in the dowel it is nearly non-existent (under 1%). The 28
behaviour of the dowel is also heavily influenced by the thickness of the concrete cover. In this 29
study, the actual cover exceeded 40mm, therefore the bending of the dowel was restrained up 30
to large applied loads. 31

20
The sum of the contributions of each shear transfer mechanism remains under that recorded by 1
means of the load cell during testing (ΣVi<Vi,test). At early loading stages, the results show 2
higher contribution of the aggregate interlock because the aggregates are in the growing contact 3
phase (crack width and slip within the limits to assure contact). The contribution of the 4
mechanism decreases once the cracks widen and contact between aggregates is lost. The dowel 5
action is significant in case of low stresses in the dowel and small dowel spans. Once these 6
values increase, the dowel action becomes non-existent (i.e. in B25-R10-W20-S8). Secondary 7
dowel mechanisms (cone breakout or concrete splitting) can be accounted for when the 8
measurements are made at ultimate state (i.e. B25-R10-W0-S8). 9
The shear carried by the compressive zone decreases with increasing load and becomes 10
minimal for low positions of the neutral axis. At early loading stages, a large fraction of the 11
shear is transferred through the compressive zone. The contribution of the transverse 12
reinforcement can be extensive when the failure is governed by large crack widths and stresses 13
in the stirrup exceed the yield strength. The shear transfer due to composite slip is considered 14
as a secondary mechanism in this study. It depends on the governing shear crack path and its 15
relation to the flange-tip of the shear-key. A clear contribution of this mechanism would be 16
observed when failure occurs due to crushing of the governing strut. On the other hand, for 17
cracks developing in the outer connection area, the contribution is negligible. 18
19
4.2 Predictions of Codified Approaches 20
At present, no specific design provisions are available for assessing the shear capacity of 21
hybrid RC beam/steel column configurations of the type examined in this study. The design of 22
such hybrid forms is not directly covered by any of the existing procedures. These systems are 23
not conventional RC structures as covered by Eurocode 2:2004 [39] or ACI318-08 [40], nor 24
traditional composite steel-concrete members treated in Eurocode 4:2004 [41] or AISC2010 25
[42]. However, the detailed assessment of shear transfer mechanisms (STM), described in this 26
study, shows that the shear failure modes exhibited by the specimens resemble those observed 27
in reinforced concrete members. Accordingly, in the absence of specific guidance on hybrid 28
components, the predictions of the expressions available in Eurocode 2 [39], ACI318-08 [40] 29
and fib Model Code 2010 (Level 3 Approximation) [43] are examined and compared with 30
those from the STM assessment. Additionally, a cumulative method that accounts for summed 31

21
contributions of concrete and transverse reinforcement, to the shear strength of a hybrid 1
member, is proposed below. 2
According to Eurocode 2 [39] provisions, the shear strength of a reinforced concrete member 3
without shear reinforcement is dependent on the concrete strength fc, flexural reinforcement 4
ratio ρl and the size effect k (Equation 17a). On the other hand, the American code considers 5
the shear strength to be dependent only on the compressive strength fc (Equation 17b), whereas 6
the fib Model Code offers three levels of approximation depending on the level of refinement 7
required in design (Equation 17c). The shear strength depends on the kv parameter defined by 8
the angle of the critical shear crack θcr, longitudinal strain at mid-depth of the member εx and, 9
for members without shear reinforcement, the maximum aggregate size dg (Equation 17d). 10
11
1/3
, 2 0.18 1 200 / 100 c EC l cV d f bd (17a) 12
, 0.17c ACI cV f bd (17b) 13
, 2010c MC v cV k f bz (17c) 14
1/2
[0.4 / (1 1500 )] [1300 / (1000 0.7 )] 0
0.4 / (1 1500 ) 0.08 /
x dg w
v
x w c ys
k zk
f f
(17d) 15
In case of members requiring shear reinforcement, Eurocode 2 [39] accounts only for the 16
transverse bars crossing the governing shear crack θcr, their geometry and yield strength 17
(Equation 18a). ACI318-14 [40] and MC2010 LoA3 [43] consider a cumulative contribution 18
(Equation 18b) between Equations 17b and 18c and Equations 17c and 18d, respectively. In 19
both codified provisions the contribution of transverse bars is function of geometry and yield 20
strength. Limitations exist for the yield strength considered in ACI318-14 [40] 21
(fyw,eff=420MPa) and Eurocode2 (fyw,eff=0.8fyw). 22
, 2 cotswsw EC yw cr
w
AV zf
s (18a) 23
R c swV V V (18b)24
,sw
sw ACI yww
AV f d
s (18c) 25

22
, 2010 cotswsw MC yw cr
w
AV zf
s (18d) 1
The maximum shear strength in the presence of transverse reinforcement is dependent on 2
geometry, angle of inclined struts and concrete strength (Equations 19a-d). 3
max, 2 0.5 sin 2EC c crV bzf (19a) 4
0.6 for normal strength concrete 5
6
max, 0.83ACI cV f bd (19b) 7
8
max, 2010 0.5 sin 2MC c c crV k bzf (19c) 9
1/30.55 30 / 0.55c ck f (19d) 10
Inclination angles of the governing shear crack can be computed on the basis of the rearranged 11
Equation 19a (see Eq. 20a) for EC2 [39] provisions and according to Equation 20b in the case 12
of Level III of Approximation of Model Code 2010 [43]. 13
14
1, 2 0.5sin / 0.5cr EC R cV bzf (20a) 15
, 2010 29 7000cr MC x (20b) 16
In the current investigation, the yield strength obtained from material tests (fyw=592MPa), the 17
concrete strength assessed on cylinder material tests, and longitudinal strains εx, required for 18
application of MC2010 LoA3 [43] provisions, as obtained from test measurements, were used. 19
The effective crack inclinations θcr (as reported in Table 3) and those prescribed by design 20
codes were accounted for in calculations. 21
The results in Table 5 show the shear strengths as predicted by the design codes, and Table 6 22
depicts the statistical parameters as the ratio between the strength obtained from tests and that 23
predicted by Equations (17-20). The results of the shear transfer mechanism assessments 24
(STM) are also reported in the same tables. The shear carried by the compressive zone, 25
aggregate interlock, dowel action and composite slip are summed under the term Vc, and the 26
contribution of stirrups is represented by Vsw. The predicted strengths are multiplied by a load 27
proportionality factor λ that accounts for the ratio between the load at instrumented stages and 28

23
Vu,test (λ B25-R10-W20-S8 =0.99, λB10-R10-W20-S8 =0.83, λB36-R10-W20-S8=0.90, λB25-R10-W0-S8 =1.00, λB25-1
R12-W20-S16=0.94). Ratios between the test strength and those predicted exceeding unity 2
represent conservative estimates (λVtest/ λVR,method>1), whereas values below unity represent 3
unsafe estimates. Both the crack inclinations, as predicted by design codes and reported from 4
the test programme, are used to enable a uniform and transparent comparison between codes 5
and STM. 6
In the case of the specimen without transverse reinforcement, B25-R10-W0-S8, all codified 7
predictions show safe estimates. Eurocode 2 [39] seem to show the highest accuracy, whereas 8
Model Code 2010 (LoA3) [43] appears to be the most conservative. Predictions for members 9
requiring transverse reinforcement provide conservative estimates of shear strength when the 10
test shear crack inclinations are used for calculations. According to Table 6, the American 11
design code shows the most accurate results both on average and coefficient of variance. When 12
crack inclinations as predicted by codified provision are used for assessment, Eurocode 2 [39] 13
shows better results (Avg.=0.99, COV=0.08). However, the code gives over conservative 14
results for the member with long shear-key (lv/hv=3.6) and unsafe values for the specimen with 15
shortest embedment length (lv/hv=1.0). Model Code 2010 (LoA3) [43] is able to predict most 16
closely the phenomenological response of the specimens. The predicted crack inclinations are 17
similar to those observed in tests. Consequently, the statistical parameters resulting from using 18
θcr,test and θcr,code, show more uniform predictions when compared to Eurocode 2 [39]. Overall, 19
based on the average values and variance, all codified provisions seem to provide over-20
conservative estimations for Specimen B36-R10-W20-S8 (lv/hv=3.6). It can be also be observed 21
that the accuracy increases with the reduction in embedment length lv (Table 6). 22
The STM assessment shows the smallest variance between the results. A detailed comparison 23
between the results of the codified provisions and the shear transfer actions STM assessment of 24
all tested specimens is plotted in Figures 17a-c. The comparison is made with respect to the 25
total reinforcement ratio tot that accounts for the presence of the shear-key and its embedment 26
length in the member (Equation 21). Based on the plot trend lines, it can be observed that all 27
design codes show a tendency of over-estimating the shear strength for members with long 28
embedded shear-keys. Considering that for the STM assessment, the term Vc in Table 5 29
includes the cumulative contribution of aggregate interlock, dowel action, composite slip and 30
transfer through compressive zone, it can be observed that when compared to codified 31
provisions the results seem to be conservative. On the other hand, the contribution of transverse 32

24
reinforcement Vsw shows scatter since for intermediate embedment lengths (lv/hv=2.5) it is 1
underestimated and for the extreme cases (i.e. lv/hv=1.0 and lv/hv=3.6) it is conservative. 2
4.3 Predictions of Proposed Method 3
The following section introduces a method to assess the shear strength of hybrid members 4
locally provided with shear-keys as those described in Section 2 of the paper. Test observations 5
and STM assessments are used as a basis for modification of Equations 17a-d in order to 6
account for the contribution and influence of the shear-key on the shear strength of the 7
members. The rationale behind the method proposed in Equations 21-22 is to account for a 8
cumulative contribution of the shear transfer through the compressive zone, aggregate 9
interlock, dowel action and composite slip, grouped under the term Vc, and separately, for the 10
contribution of the transverse bars Vsw. The strength of a hybrid member is given by the sum of 11
the two terms VR=Vc+Vsw (Equation 18b). 12
The presence of a steel beam in a reinforced concrete member increases locally the strength 13
and stiffness. The behaviour in the shear-key region is similar to a fully encased composite 14
member. When the member is subjected to flexurural and shear action, the neutral axis drops 15
towards the extreme compressed fibre. Consequently, the flexural reinforcement bars and part 16
or the entire shear-key are in tension. Strain gauge records showed levels of about 75% of the 17
yield strain on the top flange of the shear-key. Figure 13 emphasizes the sectional equilibrium 18
of the composite region of the hybrid member. The plastic moment of the composite section is 19
dependent on the lever arms z1 and zv and cross-sectional characteristics of the reinforcing steel 20
(flexural bars and shear-key). Implicitly, the stiffness response of the member is dependent on 21
the shear-key section size and amount of flexural reinforcement. 22
In fully composite members, the presence of the steel member contributes to the total 23
reinforcement ratio of the member (Equation 21a). However, the presence of the steel element 24
is local within the length of the member. Hence, its influence on the ultimate strength is 25
dependent on its embedded length (increase in strength with increase in embedded length as 26
depicted in Figure 3 and Table 3). This aspect is captured by multiplying the contribution of the 27
shear-key to the total reinforcement ratio with a factor λv that depends on the embedded length 28
lv which is related to the half-span of the member rs (Equation 21b). The total reinforcement 29
ratio is embedded in Equation 22a for shear strength assessment of hybrid members without 30
transverse reinforcement. 31

25
For the configuration considered, based on limit analysis, the position of the neutral axis is 1
found to be in the region of the bottom flange of the composite region and in a lower position 2
in the conventional RC case. As observed in the tests, failure occurs at the interface region 3
where the neutral axis is found to be mid-way between the two. The lever arm accounted for in 4
shear calculations (i.e z=0.9d) in typical reinforced concrete members, seems to be slightly 5
higher than that in the hybrid members investigated here. Hence, a representation of the lever 6
arm corresponding to 75% of the effective depth leads to a more satisfactory estimation of the 7
contribution of the stirrups to shear strength of hybrid members with transverse reinforcement 8
(Equation 22b). The shear strength of hybrid members with transverse reinforcement is given 9
by the cumulative contribution of Equations 22a and 22b. 10
When crushing failure occurs, the governing strut is supported on the bottom flange of the 11
shear-key. Therefore, the vertical projection of the strut reduces when compared to a typical 12
RC member. Similar to the case when the contribution of the transverse reinforcement is 13
estimated, the lever arm z, as typically used for RC members is reduced. In the case of shear 14
failure resulting from strut crushing, the ‘hybrid’ lever arm zv becomes the distance between 15
the top face of the bottom flange of the shear-key and the centroid of the longitudinal 16
reinforcement (Figure 13 and Equation 22c). 17
The governing shear crack inclinations observed during the tests vary between 36 to 44 18
degrees. In design, crack inclinations should be determined starting from elastic stress 19
distribution (45o) which will give the most conservative result since the number of transverse 20
bars intersected by the crack is minimal or, by accounting for a compatible strut and tie 21
mechanism considering that the governing strut is supported by the tip of the shear-key and 22
joins the first stirrup located at a distance equal or higher than 0.75d from the tip of the shear-23
key. Alternatively, the semi-empirical Equation 22d adapted from [44] by considering the test 24
results reported in Table 3 could be used to assess the inclination of the governing shear crack. 25
tot l v v (21a) 26
where 3/ v v sl r (21b) 27
and / v v c vA b d (21c) 28
1/3
3
, 0.18 1 200 / 100 vc prop l v c
s
lV d f bd
r
(22a) 29

26
, ,0.75 cotswsw prop yw cr prop
w
AV d f
s (22b) 1
max, ,0.5 sin 2prop v c cr propV bz f (22c) 2
1/2
,tan 0.61600
yscr prop tot
c
f d
f
and ,
2tan 1
3 cr prop (22d) 3
Tables 5, 6 and Figure 17d depict the strength estimations using Equations 22a-b, and the 4
shear crack inclinations observed in tests and reported in Table 3. The influence of the shear-5
key on the shear strength is accounted for by a series of modifications to Equations 17a-c as 6
result of test observations and STM assessments. In the case of the member without transverse 7
reinforcement and intermediate embedment length of the shear-key, the proposed method 8
shows the best estimation when compared to codified provisions (λVtest/ λVR,Eq.22 =1.03). In the 9
case of members provided with transverse reinforcement, the prediction is more uniform 10
showing lower scatter between results (Average=1.13 and COV=0.07). The comparison 11
between the STM, codified approaches and proposed Equations 22 illustrate that conventional 12
reinforced concrete code approaches tend to provide over-conservative predictions for both 13
relatively high and relatively low total reinforcement ratios. In contrast, the assessments based 14
on the proposed modified expressions in Equations 22 offer more realistic predictions, and are 15
able to capture faithfully the influence of the embedded length of the shear-key on the ultimate 16
shear strength for hybrid members of the type investigated in this paper. 17
The predicted results show good agreement with those obtained from tests for members with 18
various shear-key embedment lengths (lv/hv=1.0-3.6), with stiffness ratios that involve rigid 19
behaviour of the shear-key, using normal concrete, and provided with intermediate flexural 20
reinforcement ratios for the bare reinforced concrete region. More conservative estimations 21
could be obtained if design safety factors are used. Overall, short embedment lengths of the 22
shear-key seem to be more effective from the practical point of view.A ratio of lv/hv=1.0 23
appears to be sufficient to ensure a smooth transfer of forces between the reinforced concrete 24
beam and steel column, and a stiff response of the shear-key. The structural response of a 25
hybrid member with a short shear-key resembles a typical reinforced concrete member, hence 26
may be a desirable solution in practice. 27

27
5. Concluding Remarks 1
This paper focuses on examining the fundamental shear transfer mechanisms in hybrid 2
structural systems consisting of reinforced concrete beams connected to steel columns by 3
means of embedded shear-keys. A full account of the results of a series of five large scale tests 4
on hybrid reinforced concrete beam-to-steel column assemblages is presented. In addition to 5
providing detailed test results which can be used for future complementary studies, the 6
experimental findings provide an in-depth insight into the contributions of various shear 7
transfer mechanisms. Based on detailed measurements of crack growth and propagation at 8
various load levels approaching failure, the contribution of each shear transfer mechanism to 9
the ultimate shear strength is quantified. It is shown that the behaviour at ultimate shear 10
strength of the hybrid members is characterised by the development of a governing shear crack 11
in the vicinity of the tip of the bottom flange of the shear-key. The ultimate shear strength is 12
primarily dependent on the embedded length of the shear-key, reinforcement layout and ratios, 13
and the concrete strength. The typical shear failure of hybrid members resembles that of 14
reinforced concrete elements: crushing of the governing strut (supported by the bottom flange 15
of the shear-key) or diagonal tension (controlled failure in the presence of transverse 16
reinforcement). At loading stages prior to ultimate limit state, the main benefit from the 17
presence of the embedded shear-keys is that it shifts the weak section away from the maximum 18
demand region, both in terms of bending moment and shear (for continuous beams), hence 19
delaying the failure. 20
The study illustrates that analytical models for predicting the contribution of shear transfer 21
mechanisms can be adopted to assess the shear strength by means of detailed measurements of 22
crack patterns and kinematics. The summed contribution of all shear transfer mechanisms 23
shows close agreement, within a coefficient of variation of 6%, with the recorded shear force 24
during the tests for members with transverse reinforcement. Before reaching the ultimate limit 25
state, shear is carried by a combination of aggregate interlock, dowel action, stirrups and the 26
compressive zone. Their magnitude is highly influenced by the applied load and consequently 27
by the crack pattern, width and slip. Secondary shear transfer mechanisms such as composite 28
action between the shear-key and the concrete interface can contribute up to 15% of the total 29
shear transfer. The crack inclination also influences the contribution of each transfer 30
mechanism. For flatter cracks, the contribution of the transverse reinforcement is significant, 31
whereas the aggregate interlock provides a comparatively lower contribution. On the other 32
hand, for steeper cracks the number of transverse bars intersected is reduced and their 33

28
contribution is consequently smaller, whereas the aggregate interlock contribution is higher. In 1
the case of specimens without shear reinforcement, the main transfer mechanisms are the 2
aggregate interlock and dowel actions since the stresses in the dowel remain at low levels at 3
failure. The crack inclinations observed in tests vary from 36o to 44o. 4
Using the experimental results and observations, the paper also assesses the adequacy of 5
strength predictions obtained from analytical models which are adopted in the design of 6
conventional reinforced concrete members, with emphasis on European and North American 7
provisions. It is shown that these procedures can be used to provide overly conservative 8
predictions for evaluating the shear strength of hybrid members. An analytical approach is 9
therefore proposed in order to provide a more realistic prediction of the ultimate shear 10
behaviour of hybrid members of the form investigated in this paper. The suggested procedure 11
accounts for the influence of the characteristics of the shear-keys on the ultimate shear strength, 12
and offers a more realistic prediction of the behaviour in comparison with conventional 13
reinforced concrete design provisions. 14
15
Acknowledgements 16
The financial support of the Research Fund for Coal and Steel of the European Community 17
within the project SMARTCOCO: “Smart Composite Components - Concrete Structures 18
Reinforced by Steel Profiles”, Grant No RFSR-CT-2012-00031, for the tests described in this 19
paper is gratefully acknowledged. The authors would also like to thank the technical staff of 20
the Structures Laboratories at Imperial College London, particularly Mr. T. Stickland and Mr. 21
R. Millward, for their assistance with the experimental work. 22
23

29
References 1
2
[1] Harries KA, Gong B, Shahrooz BM – Behaviour and Design of Reinforced Concrete, 3
Steel and Steel-Concrete Coupling Beams, Earthquake Spectra, Volume 16, No.4, 4
November 2000 5
[2] Gong B, Shahrooz BM, Concrete-Steel Composite Coupling Beams, I: Component 6
Testing Journal of Structural Engineering, Vol. 127, No. 6, June, 2001, 625-631 7
[3] Shahrooz BM, Gong B, Tunc G and Deason JT, An overview of reinforced concrete 8
core wall-steel frame hybrid structures Prog. Struct. Engng Mater. 2001; 3: 149-158 9
[4] Su RKL, Lam WY, Pam HJ, Experimental Study of Plate-Reinforced Composite Deep-10
Coupling Beams, Struct. Design Tall Spec. Build. 18, 235–257 (2009) 11
[5] Sheikh TM, Deierlein GG, Yura JA, Jirsa JO, Beam-Column Moment Connections for 12
Composite Frames: Part 1” Journal of Structural Engineering, Vol. 115, No. 11, 13
November, 1989, 2858-2876 14
[6] Chou CC, Uang CM, Cyclic performance of a type of steel beam to steel-encased 15
reinforced concrete column moment connection, Journal of Constructional Steel 16
Research 58 (2002) 637–663 17
[7] Cheng CT, Chen CC, Seismic behavior of steel beam and reinforced concrete column 18
connections, Journal of Constructional Steel Research 61 (2005) 587–606 19
[8] Lee CH, Kim JW, Song JG - Punching shear strength and post-punching behavior of 20
CFT column to RC flat plate connections, Journal of Constructional Steel Research 64 21
(2008) 418–428 22
[9] Kim JW, Lee CH, Kang THK, Shearhead Reinforcement for Concrete Slab to 23
Concrete-Filled Tube Column Connections, ACI Structural Journal, Vol. 111, No. 3, 24
May-June 2014 25
[10] Eder MA, Vollum RL, Elghazouli AY, 2012, Performance of ductile RC flat slab to 26
steel column connections under cyclic loading, Engineering Structures, Vol:36, 27
Pages:239-257 28
[11] Eder MA, Vollum RL, Elghazouli AY, 2011, Inelastic behaviour of tubular column-to-29
flat slab connections, Journal of Constructional Steel Research, Vol:67, Pages:1164-30
1173 31
[12] Bompa DV, Elghazouli AY, Force Transfer Mechanisms Between Steel Columns and 32
RC Beams by Means of Shearkeys, Proceedings of Eurosteel 2014 Conference, 2014 33
[13] Kani GNJ, Basic Facts Concerning Shear Failure, ACI Journal Proceedings, 63(3), 34
1966, 675-692 35
[14] Taylor HPJ, The Fundamental Behaviour of Reinforced Concrete Beams In Bending 36
and Shear, ACI Special Publication SP42-3, 1974, pp43-77 37
[15] Taylor HPJ, Further Tests to Determine Shear Stresses in Reinforced Concrete Beams, 38
Technical Report, TRA 438, February 1970, Cement and Concrete Association UK 39

30
[16] Walraven JC, Reinhard HW, Theory and Experiments on the Mechanical Behaviour of 1
Cracks in Plain and Reinforced Concrete Subjected to Shear Loading, Heron, 26(1a), 5-2
68, 1981 3
[17] Walraven JC, Aggregate Interlock: A theoretical and experimental analysis, Technical 4
Report 1628-481-7, Delft University Press, 1980 5
[18] Paulay T. and Loeber P.J., Shear Transfer By Aggregate Interlock, ACI Special 6
Publication SP-42, Vol 42, 1-16, DOI: 10.14359/17277 7
[19] Dei Poli S, Gambarova PG, Karakoc C, Aggregate Interlock Role in RC Thin-Webbed 8
Beams in Shear Journal of Structural Engineering, Vol. 113, No. 1, January, 1987. 9
ASCE 10
[20] Dei Poli S, Di Prisco M, Gambarova P (1992) Shear Response, Deformations, and 11
Subgrade Stiffness of a Dowel Bar Embedded in Concrete, ACI Structural Journal 12
89(6): 665-675 13
[21] Swamy RN, Qureshi S A, An ultimate shear strength theory for reinforced concrete T 14
beams with web reinforcement, ICE Proceedings, Volume 57, Issue 1, 01 March 1974 , 15
pages 21 –34 16
[22] Swamy RN, Andriopoulos AD, Contribution of Aggregate Interlock and Dowel Forces 17
to the Shear Resistance of Reinforced Beams with Web Reinforcement” ACI Special 18
Publication SP42-6, 1975, pp129-166 19
[23] Chana PS, Analytical and Experimental Studies of Shear Failures in Reinforced 20
Concrete Beams, Proc. Inst. Civ. Engrs, Part 2, 1988, 85, Dec., 609-628 21
[24] Chana PS, Investigation of the Mechanism of Shear Failure of Reinforced Concrete 22
Beams, Magazine of Concrete Research, Vol. 39, No. 141, December 1987 23
[25] Sagaseta J, Vollum RL, Influence of aggregate fracture on shear transfer through cracks 24
in reinforced concrete Magazine of Concrete Research, 2011, 63(2), 119–137 25
[26] Campana S., Fernández Ruiz M., Anastasi A., Muttoni A., Analysis of shear-transfer 26
actions on one-way RC members based on measured cracking pattern and failure 27
kinematics, Magazine of Concrete Research, Vol. 56, No. 6, UK, 2013, pp. 386-404 28
[27] Wium, J. A. (1992). "A composite columns: force transfer from steel section to concrete 29
encasement," PhD Thesis Swiss Federal Inst. of Tech., Lausanne, Switzerland. 30
[28] Wium JA, Lebet JP, Simplified Calculation Method for Force Transfer in Composite 31
Columns’ Journal of Structural Engineering, Vol. 120, No. 3, March,1994, 728-746 32
[29] Roeder CW, Chmielowski R, Brown CB, Shear Connector Requirements for Embedded 33
Steel Sections, Journal of Structural Engineering, Vol. 125, No. 2, February, 1999, 142-34
151 35
[30] Mattock H, – Shear Transfer in Reinforced Concrete – Recent Research, PCI Journal, 36
March, 1972 37
[31] Ulaga T, Betonbauteile mit Stab und Lamellenbewehrung: Verbund- und 38
Zuggliedmodellierung, Doctorate thesis ETH Zürich Nr. 15062, 2003 39

31
[32] Guidotti R, Poinçonnement des planchers-dalles avec colonnes superposées fortement 1
sollicitées, EPF Lausanne, Doctorate thesis 4812, 2010 2
[33] Soroushian P, Obaseki K, Rojas M, Bearing Strength and Stiffness of Concrete under 3
Reinforcing Bars, ACI Materials Journal, May-June 1987, 84(3), 179-184 4
[34] Dulacska H, “Dowel Action of Reinforcement Crossing Cracks in Concrete” ACI 5
Journal, Proceedings 69(12), Dec. 1972, 754-757 6
[35] Mirazei Y, Post-Punching Behaviour of Reinforced Concrete Slabs, Doctorate thesis, 7
EPFLausanne, No. 4613 (2010). 8
[36] Hsu, T.T.C, Mau, S.T, Chen, B “Theory on Shear Transfer Strength of Reinforced 9
Concrete” ACI Structural Journal, V.84, No.2, Mar-Apr 1987. pp. 149-160 10
[37] Hsu TTC “Softened Truss Model Theory for Shear and Torsion” ACI Structural 11
Journal, Nov-Dec 1988, pp 624-635 12
[38] Hillerborg A, Analysis of Crack Formation and Crack Growth in Concrete by Means of 13
Fracture Mechanics and Finite Elements, Cement and Concrete Research , Vol. 6, pp. 14
773-782, 1976 15
[39] EN 1992-1-2 - Eurocode 2: Design of concrete structures - Part 1: General rules and 16
rules for buildings, European Committee for Standardization, Brussels, December 2004 17
[40] ACI 318M-08 Building Code Requirements for Structural Concrete (ACI 318M-08) 18
and Commentary American Concrete Institute, June 2008 19
[41] EN 1994-1-1 Eurocode 4: Design of composite steel and concrete structures – Part 1-1: 20
General rules and rules for buildings, European Committee for Standardization, 21
Brussels, December 2004 22
[42] AISC 2010. Specification for Structural Steel Buildings, (ANSI/AISC 360-10), 23
American Institute of Steel Construction, Chicago, IL. 24
[43] Model Code 2010 – final draft Vol.1 & Vol. 2, fib Bulletins 65 & 66, March 2012, 25
Lausanne. 26
[44] Bompa DV and Oneţ T, Punching shear strength of RC flat slabs at interior connections 27
to columns, Magazine of Concrete Research, http://dx.doi.org/10.1680/macr.14.00402 28
29

32
List of Notations 1
2
Greek letters θ, θcr – crack inclination Δ – deflection Δdow – dowel displacement Δs – crack slip εi – strain η – stiffness ratio (EcIc/EvIv) λ – shape of the compression block factor, load proportionality factor λv – embedded length factor λK – proportionality constant μ – friction coefficient ρk – ratio between volume of aggregates to concrete ρl - flexural renforcement ratio ρv - composite renforcement ratio ρw - shear reinforcement ratio σi – normal stress σpu – compressive strength of cement matrix τb,i – bond stress τi – tangential stress ψ – rotation νi – shear stress Lowercase Latin letters a – shear span av – composite shear span ai – lever arm aw, as – contact areas (for aggregate interlock action) b – concrete section width c – depth of the compression zone cnom – concrete cover d – effective depth db – bar diameter dg,i – aggregate dimension e’ - eccentricity fc – concrete cylinder strength fct – concrete tensile strength fy,i – yield strength of steel ft,i – ultimate strength steel h – concrete section depth hc,v – column depth
hv – depth of the shear-key ldow – dowel span lv – embedded length lx,cr – horizontal projection of the shear crack rs – clear half span (from column face) sw – spacing of transverse reinforcement zi – lever arm wi – crack width wmax – maximum crack width x,y,z – coordinates Uppercase Latin letters As,i – reinforcement sectional area Aw, As – contact areas (aggregate interlock action) Av – shearkey cross sectional area Ei – modulus of elasticity Ii – moment of inertia Ls – moment span L – length Ni – axial force Mi – bending moment Pi – applied load Vi – shear force Subscripts agg – aggregate interlock ch – concrete compressive zone b - bond c – concrete cr - crack s – longitudinal steel dow – dowel action max – maximum res – concrete residual stresses sw,i; sw; w – transverse reinforcement STM – values from detailed assessment test – test values u – ultimate v – composite slip, shearkey

33
List of Figures 1
Figure 1. Testing arrangement: a) test-rig layout, b) general view of test set-up 2
Figure 2. Geometrical configuration, reinforcement layout and measurement system: a) 3
elevation view; Cross sectional views within a) composite and b) non-composite sections 4
Figure 3. Load versus mid-span deflection response for the tested specimens 5
Figure 4. Crack pattern at failure for the tested specimens: a) B25-R10-W0-S8, b) B10-R10-6
W20-S8, c) B25-R10-W20-S8 d) B36-R10-W20-S8 e) B25-R12-W20-S16 7
Figure 5. a) Governing shear crack in B25-R10-W20-S8, b) Governing shear crack in B10-8
R10-W20-S8, c) Transverse bar fracture, d) Flexure-shear failure e) Saw-cut through specimen 9
Figure 6. a) Detail of the Demec measurement grid and intersecting shear crack, b) Detail of 10
shear crack width w and slip Δs assessed from recorded horizontal displacement Δ1 11
Figure 7. Qualitative damage maps for Specimen B25-R10-W20-S8 at various loading stages 12
Figure 8. a) Aggregate interlock mechanism b) State of stresses in the cement paste due to the 13
interlock with an aggregate particle and rigid plastic stress-strain diagram for cement matrix 14
Figure 9. Contact areas according to Walraven [16,17]: a) influence of aggregate size on the 15
contact areas, b) influence of crack width and shear displacement over the contact areas for 16
dg,max=10mm, c) aggregate interlock distribution according to test measurements and assumed 17
one for B25-R10-W20-S8 18
Figure 10. Dowel action: a) mechanisms involved, b) limit analysis, c) dimensions of the 19
breakout cone according to Dei Poli (1992) [20], d) Contribution of dowel bending and 20
potential secondary mechanisms to the dowel action. 21
Figure 11. Free body diagram (general case) 22
Figure 12. Free bodies and maximum crack width at the instrumented load step of the tested 23
specimens: a) B25-R10-W0-S8, , b) B10-R10-W20-S8, c) B25-R10-W20-S8 d) B36-R10-24
W20-S8, e) B25-R12-W20-S16 25
Figure 13. Assumed stress distribution in the compressive zone 26
Figure 14. a) Stirrup subjected to traction as a consequence of crack opening, b) bi-linear 27
stress-strain relationship for steel 28
Figure 15. a) Contribution of the friction resistance between shear-key and concrete body to 29
total shear, b) bi-linear bond-slip relationship for smooth interfaces embedded in concrete 30
subjected to traction, c) Relationship between concrete tensile strength and maximum average 31
bond stress - adapted from the database reported by Roeder (1999) [29] 32
Figure 16. Comparative contributions of shear transfer mechanisms 33
Figure 17 Comparison between estimated shear transfer (STM) and codified predictions a) 34
Eurocode 2, b) Model Code 2010 LoA3, c) ACI318; c) Comparison between estimated shear 35
transfer (STM) and proposed Equations (22) 36

34
List of Tables 1 2
Table 1. Specimen details 3
Table 2. Steel properties 4
Table 3. Test measurements 5
Table 4. Shear transfer mechanisms results 6
Table 5. Strength predictions for tested specimens and results from the detailed assessment 7
Table 6. Comparison between code predictions, STM assessments and test results 8 9

35
Tables 1
2
Table 1. Specimen details 3
Specimen Shearkey
RC cross section
lv (mm)
Ls (mm)
d (mm)
ρl
(%) ρw (%) fc
(MPa) fc,28d
(MPa) Age
(days) B25-R10-W0- S8 HEB20
0 B360x455 500 2600 409 1.09 - 28.6 29.1 39
B10-R10-W20-S8
HEB200
B360x455 200 2600 412 1.09 0.19 27.3 29.1 28
B25-R10-W20-S8
HEB200
B360x460 500 2600 410 1.09 0.19 34.3 37.1 31
B36-R10-W20-S8
HEB200
B360x455 720 2600 408 1.10 0.19 29.9 29.1 35
B25-R12-W20-S16
UC152 B340x435 400 2300 391 1.21 0.20 28.7 29.1 50
4
5
Table 2. Steel properties 6
Specimen fy0,2% (MPa) ft,i (MPa) εu (%) HEB200 – flange 401 530 14.5 HEB200 – web 396 517 14.3 UC152 – flange 369 493 26.4
8 mm rebar 592 695 6.39 12 mm rebar 545 594 13.7 20 mm rebar 583 704 12.0 25 mm rebar 628 729 13.8
Notes: 7
Es = Elastic modulus, fy0,2% = 0.2% proof stress, fu = tensile strength and εu = the elongation 8
after fracture; 9
Cross-sectional dimensions: 10
For HEB 200: b×tf / d×tw / Av = 200mm×15mm / 200mm×9mm / 7810 mm2; 11
For UC152: b×tf / d×tw / Av = 154.4mm×11.5mm / 161.8mm×8mm / 4719 mm2 12
13
Table 3. Test measurements 14
Specimen Shearkey lv /hv
(mm) av/d
(mm) Pu
(kN) ΔPu
(mm) % Pu
Vtot (kN)
θcr (o)
Failuremode
B25-R10-W0- S8 HEB200 2.5 1.44 350 5.50 100 175 40 o S B10-R10-W20-S8 HEB200 1.0 2.16 647 18.6 83 261 42 o FS B25-R10-W20-S8 HEB200 2.5 1.44 710 15.3 99 351 36o S B36-R10-W20-S8 HEB200 3.6 0.91 788 15.2 90 356 44 o S B25-R12-W20-S16 UC152 2.5 1.38 653 12.5 94 353 37o S 15
16

36
1
Table 4 Shear transfer mechanisms assessment results 2
3
Aggregate interlock
Dowel action
Composite slip Shear reinforcement
Compressive zone
ΣVi (kN)
Vu,test
(kN) ΣVi/ Vu,test
Vsw1 Vsw2 Vsw3 Vsw4
B25-R10-W20-S8
Vi (kN) 20.1 0.27 21.9 59.5 59.4 59.5 37.2 83.8 342 351 0.97 Ni (kN) 18.5 977 27.4 - - - - 583 xi (mm) 708 935 633 486 640 795 943 232 yi (mm) 205 392 133 - - - - 35
B10-R10-W20-S8
Vi (kN) 72.3 2.56 7.78 25.3 6.55 - - 107 225 267 0.84 Ni (kN) 81.4 827 9.72 - - - - 669 xi (mm) 404 594 303 349 498 - - 232 yi (mm) 265 411 151 - - - - 32.5
B36-R10-W20-S8
Vi (kN) 75.2 12.1 53.3 59.6 29.9 - - 103 337 356 0.95 Ni (kN) 48.7 824 63.2 - - - - 447 xi (mm) 786 970 685 695 845 - - 706 yi (mm) 222 408 159 - - - - 41.5
B25-R10-W0- S8
Vi (kN) 49.0 71.6* - - - - - 30.9 152 175 0.87 Ni (kN) 57.7 363 - - - - - 187 xi (mm) 882 1000 - - - - - 676 yi (mm) 205 414 - - - - - 42.3
B25-R12-W20-S16
Vi (kN) 56.7 12.6 11.6 35.8 40.7 59.7 39.2 44.3 305 326 0.93 Ni (kN) 38.2 786 7.22 - - - - 578 xi (mm) 474 770 444 198 4321 467 611 196 yi (mm) 282 397 133 - - - - 27.5
*accounts for the secondary transfer mechanisms (at 1.00Vu) 4
5

37
1
Table 5. Strength predictions for tested specimens and results from the detailed 2
assessment 3
Specimen Strength EC2 θcr,test
EC2 θcr,code
ACI318
MC-LoAII
I θcr,test
MC -LoAII
I θcr,code
STM Eqs. (22a-
c)
λBi Vi,tes
t
B25-R10-W0-S8
λBiVc 143 - 135 98 -
152 169 175
B10-R10-W20-S8
Vc - - 130 105 105 193 141
268 Vsw 162 364 162 162 196 32 135 λBiVR 134 302 243 222 250 225 229 λBiVmax 894 620 529 769 740 - 634
B25-R10-W20-S8
Vc - - 147 103 103 126 179
351 Vsw 202 366 163 202 185 216 168 λBiVR 199 362 307 302 285 342 343 λBiVmax 1287 933 710 1026 1050 - 901
B36-R10-W20-S8
Vc - - 137 113 113 248 207
356 Vsw 151 364 162 151 198 89 126 λBiVR) 136 328 269 237 280 337 299 λBiVmax 1067 736 600 890 849 - 745
B25-R12-W20-S16
Vc - - 123 102 76 125 148
327 Vsw 188 354 158 188 167 194 157 λBiVR 177 333 264 248 228 325 286 λBiVmax 945 678 564 799 821 - 621
*All values in kN, Load Proportionality Factor -> λB25-R10-W0-S8=0.94, λB10-R10-W20-S8=0.83, λB25-4
R10-W20-S8=0.99, λB36-R10-W20-S8=0.90, λB25-R12-W20-S16=1.00, 5
6
Table 6. Comparison between code predictions, STM assessments and test results 7
Member without transverse reinforcement
λVi,test/λVRmethod EC2
ACI318 MC2010-LoAIII
STM
Eqs. (22a-c)
B25-R10-W0-S8 1.23 1.29 1.78 1.15 1.03 Members with transverse reinforcement
λVi,test/λVRmethod EC2 θcr,test
EC2 θcr,cod
e ACI318
MC2010- LoAIII θcr,test
MC2010 - LoAIII θcr,code
STM Eqs.
(22a-c) θcr,test
B10-R10-W20-S8 1.99 0.89 1.10 1.21 1.07 1.19 1.17 B25-R10-W20-S8 1.76 1.02 1.15 1.16 1.23 1.03 1.02 B36-R10-W20-S8 2.62 1.09 1.33 1.50 1.27 1.06 1.19 B25-R12-W20-S16 1.85 0.98 1.24 1.32 1.43 1.07 1.14
Average 2.05 0.99 1.20 1.30 1.25 1.09 1.13 COV 0.19 0.08 0.08 0.12 0.12 0.06 0.07
8

38
Figures 1
a) 2
b) 3
Figure 1 Testing arrangement: a) test-rig layout, b) general view of test set-up 4
5

39
1
Figure 2 Geometrical configuration, reinforcement layout and measurement system: a) 2
elevation view; Cross sectional views within b) composite and c) non-composite sections 3
4
5
6
Figure 3. Load versus mid-span deflection response for the tested specimens 7
8

40
a) 1
b)2
c) 3
d) 4
e) 5
Figure 4 Crack pattern at failure for the tested specimens: a) B25-R10-W0-S8, b) B10-R10-6
W20-S8, c) B25-R10-W20-S8 d) B36-R10-W20-S8 e) B25-R12-W20-S16 7
8

41
1
Figure 5 a) Governing shear crack in B25-R10-W20-S8, b) Governing shear crack in B10-2
R10-W20-S8, c) Transverse bar fracture, d) Flexure-shear failure e) Saw-cut through specimen 3
4
5
6
7 Figure 6 a) Detail of the Demec measurement grid and intersecting shear crack, b) Detail of 8
shear crack width w and slip Δs assessed from recorded horizontal displacement Δ1 9
10

42
1 Figure 7. Qualitative damage maps for Specimen B25-R10-W20-S8 at various loading stages 2
3
4
5
6 Figure 8 a) Aggregate interlock mechanism b) State of stresses in the cement paste due to the 7
interlock with an aggregate particle and rigid plastic stress-strain diagram for cement matrix 8
9

43
1 Figure 9. Contact areas according to Walraven [16,17]: a) influence of aggregate size on the 2
contact areas, b) influence of crack width and shear displacement over the contact areas for 3
dg,max=10mm, c) aggregate interlock distribution according to test measurements and assumed 4
one for B25-R10-W20-S8 5
6
7

44
1 Figure 10. Dowel action: a) mechanisms involved, b) limit analysis, c) dimensions of the 2
breakout cone according to Dei Poli (1992) [20], d) Contribution of dowel bending and 3
potential secondary mechanisms to the dowel action. 4
5
6
7 8
Figure 11. Free body diagram (general case) 9
10

45
a) 1
b) 2
c) 3
d) 4
e) 5
Figure 12. Free bodies and maximum crack width at the instrumented load step of the tested 6
specimens: a) B25-R10-W0-S8, b) B10-R10-W20-S8, c) B25-R10-W20-S8, d) B36-R10-W20-7
S8, e) B25-R12-W20-S16 8
9
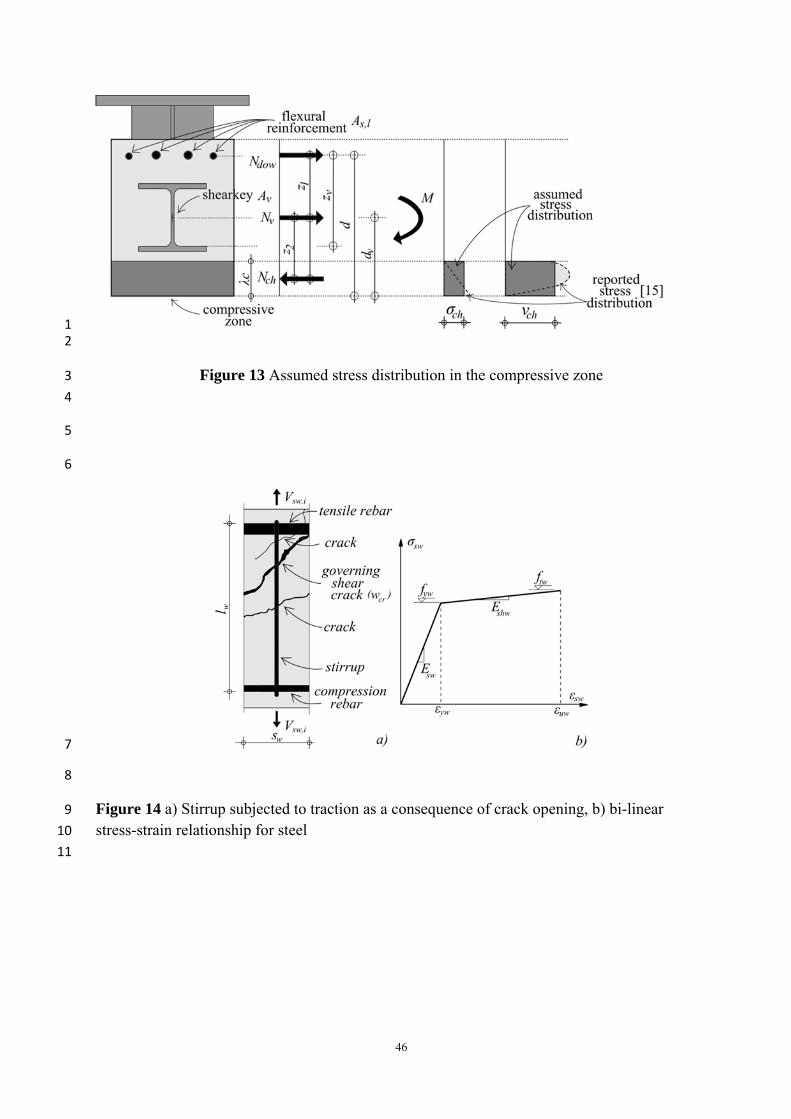
46
1 2
Figure 13 Assumed stress distribution in the compressive zone 3
4
5
6
7
8
Figure 14 a) Stirrup subjected to traction as a consequence of crack opening, b) bi-linear 9
stress-strain relationship for steel 10
11

47
1
Figure 15 a) Contribution of the friction resistance between shear-key and concrete body to 2
total shear, b) bi-linear bond-slip relationship for smooth interfaces embedded in concrete 3
subjected to traction, c) Relationship between concrete tensile strength and maximum average 4
bond stress - adapted from the database reported by Roeder (1999) [29] 5
6
7
8
9
10
Figure 16 Comparative contributions of shear transfer mechanisms, 11
12

48
1
2
Figure 17 Comparison between estimated shear transfer (STM) and codified predictions a) 3
Eurocode 2, b) Model Code 2010 LoA3, c) ACI318; c) Comparison between estimated shear 4
transfer (STM) and proposed Equations (22) 5
6
7
Related Documents


