W. W. SANDERS, JR. H. A. ELLEBV F. W. KLAIBER SEPTEMBER 1975 Summary Report ISU-ERI-Ames-76035 ULTIMATE LOAD BEHAVIIBW OF FULL-SCALE HIGHWAY TRUSS BRIDGES Highway Division-lowa Department of Transportation ERI Project 1 118s

Welcome message from author
This document is posted to help you gain knowledge. Please leave a comment to let me know what you think about it! Share it to your friends and learn new things together.
Transcript
W. W. SANDERS, JR. H. A. ELLEBV F. W. KLAIBER SEPTEMBER 1975
Summary Report ISU-ERI-Ames-76035
ULTIMATE LOAD BEHAVIIBW OF FULL-SCALE HIGHWAY TRUSS BRIDGES
Highway Division-lowa Department of Transportation
ERI Project 1 118s
DOT 1700.18 7/25/69
T E C H N I C A L R E P O R T S T A N D A R D T I T L E P A G E
Engineering Research Institute Iowa State University Ames, Iowa 50011
12. s ~ ~ ~ B ~ ~ ~ ~ . A ~ . " ~ ~ N .~ . and ~dd..., Summary Report Iowa Department of Transportation Apr. 1, '74-Sept. 30,'75 Highway Division Ames, Iowa 50010
1. Rep,,, N..
7 , ~ , thb,c , i
W. GI. Sanders, Jr., H. A. Elleby, 1.'. W. Klaiber 9 . Psr lormlnp O r g m i r o l i o n Nemo ond Address
16 Abnbroct
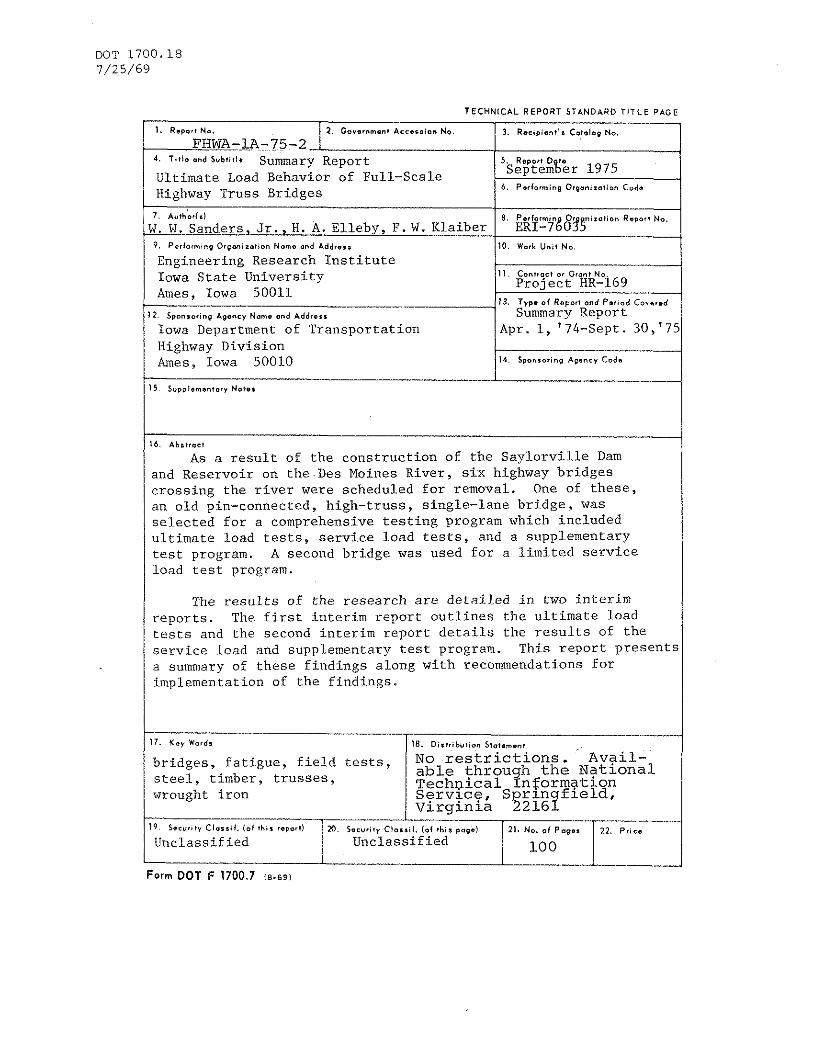
As a result of the construction of the Saylorville Dam and Reservoir on the Des Moines River, six highway bridges crossing the river were scheduled for removal. One of these, an old pin-connected, high-truss, single-lane bridge, was selected for a comprehensive testing program which included ultimate load tests, service load tests, and a supplementary test program. A second bridge was used for a limited service load test program.
8 . Porformin n i z o t i o n R.po.t NO. ERI-768%
10. Work U n i f No .
The results of the research are detailed in two interim reports. The first interim report outlines the ul-timate load tests and the second interim report details the results of the service load and supplementary test program. This report presents a summary of these findings along with recommendations for implementation of the findings.
2. Cov..nm.nt Arcs 's ion No. 3. R s c i p i o n t ' s C.tolop No.
FHWA-L.A-75-2 4. T i l l . vnd S u b l i ~ i r Summary Report Ultimate Load Behavior of Full-scale Highway Truss Bridges
5 . Reporf D to septem%er 1975
6 . Performing Orp.niration c o d e
17 K e y Words
bridges, fatigue, field tests, steel, timber, trusses, wrought iron
I I I I Form DOT F 1700.7 i a - 6 s )
18. O ~ s t r s b v t ~ o n Stovamanf
NO r e s t r i c t i o n s . Avai l - a b l e through t h e Nat iona l T e c h ~ i c a l In#ormation S e r v i c e , S r i n f i e l d ,
! V i r g i n i a 2216? -7
1 9 Sscuc~ty C l a s s i t . (01 this roper81
Unclassified M , S.cuiity Cio* , i l . 1.1 this p o ~ s )
Unclassified 21. No. o i
100
RESEARCH
RESEARCH
RESEARCH
RESEARCH
RESEARCH
SUMMARY REPORT
ULTIMATE LOAD BEHAVIOR OF FULL-SCALE HIGHWAY TRUSS BRIDGES
W. W. Sanders, Jr. H. A. Elleby F. W. Klaiber September 3975
Sponsored by the Highway Division- Iowa DeparPment of TransporPation In Cooperation with the U. S. Deparltment of Transpofiation FEDERAL HIGHWAY ADMlMlSVRATlOM
ISU-ERI-Ames-76035 ERI Project 11 18s
E N G I N E E R I N G WESEWRCH I M S T I T U ' I E
I O W A S T A T E UHl lVEWSiTY A M E S
TAl3l.I? 011 CONTENTS
LIST OF FIGURES
LIST OF TABLES
CHAPTER 1. INTRODUCTION
O b j e c t i v e s G e n e r a l T e s t Program
CHAPTER 2 . THE TEST BRIDGES
T r u s s D e s c r i p t i o n s A. Hubby B r i d g e B. C h e s t n u t Ford B r i d g e
P h y s i c a l P r o p e r t i e s
CHAPTER 3. FIELD TESTS AND TEST PROCEDURE
F i e l d T e s t s - Ultimate Timber Deck T e s t T r u s s T e s t F loorbeam T e s t S e r v i c e Load T e s t s
CHAPTER 4. LABORATORY TESTS AND TEST PROCEDURE
F a t i g u e T e s t s S t a t i c T e s t s
CHAPTER 5. TEST RESULTS AND ANALYSIS
Timber Deck T e s t T r u s s T e s t F loo rbeam T e s t R a t i n g S e r v i c e Load T e s t s - T r u s s e s S e r v i c e Load T e s t s - Floorbeams and Timber Deck F a t i g u e T e s t s S t a t i c T e s t s
iii

Ultimate Load T e s t s S e r v i c e Load a n d S u p p l e m e n t a r y T e s t s
CHAPTER 7. CONCLUSIONS
Ultimate Load T e s t s S e r v i c e Load T e s t s
CHAPTER 8. PROJECT FINDINGS
REFERENCES
ACKNOWLEDGMENTS
FIGURES

LIST OF FIGURES
Fig.
Fig.
Fig.
Fig.
Fig.
Fig.
Fig.
Fig.
Fig.
Fig.
Fig.
Fig.
Fig.
Fig.
Fig.
Fig.
Fig.
Fig.
Fig.
Fig.
Fig.
Fig.
La. Photographs of the Hubby Bridge.
1b. Photographs of the Chestnut Ford Bridge.
2a. Details of the Hubby Bridge.
2b. Details of the Chestnut Ford Bridge.
3. Timber deck layout - Hubby Bridge. 4. Timber deck layout - Chestnut Ford Bridge.
5. Load location for deck test 1 (plan view).
6. Photograph of deck test 1 setup.
7. Load location for deck test 2 (plan view)
8. Photograph of deck test 2 setup.
9. Load history for deck test 1.
10. Load history for deck test 2.
11. Loading system details (elevation view).
12. Loading system details (end view).
13. Photograph showing location of failure of member L M
5 5'
14. Photograph of fracture.
15. Photograph of damaged member after collapsing upon itself.
16. Photograph of floorbeam test setup.
17. Floorbeam test setup (elevation view).
18. Photograph of buckling of compression flange of floorbeam 5.
19. Description of truck for Hubby Bridge testing.
20. Description of truck for Chestnut Ford Bridge testing.
Fig. 21. Photograph of fatigue apparatus.
Fig. 22. Load-deflection for deck test 1.
Fig. 23. Load-deflection for deck test 2.
Fig. 24. Deflection cross section at mid-span of deck panel for deck test 1 at various loads.
Fig. 25. Deflection cross section at mid-span of deck panel for deck test 2 at various loads.
Fig. 26. Total load-vertical deflection at L for truss test - Span 2 , Hubby Bridge.
5
Fig. 27. Total load-force in member L M - Span 2 , Hubby Bridge. 5 5
Fig. 28. Load-deflection for floorbeam test at L4.
Fig. 29. Load-deflection for floorbeam test at L 5'
Fig. 30. Influence lines - Span 1, llubby Bridge.
Fig. 31. Influence lines - Span 2 , Hubby Bridge.
Fig. 32. Influence lines - Chestnut Fotd Bridke, truck 2' from left edge.
Fig. 33a. Moment for floorbeams at L3, Lq, L5, L6 - truck on centerline.
Fig. 33b. Moment for floorbeams at L3, L4, L5, L6 - truck on left edge.
page
8 0
81
8 2
Fig. 33c. Moment for floorbeams at L 3, L4, L5, L6 - truck on right edge.
iii
LIST OF TABLES
Table . Physical p rope r t i e s .
Table 2. Wheel loadings of t rucks .
Table 3. Ultimate loads.
Table 4. Experimental percentage of the load d i s t r i b u t e d t o t h e most heav i ly loaded s t r i n g e r and t h e equivalent d i s t r i b u t i o n f a c t o r f o r deck test 1.
Table 5. Experimental percentage of the load d i s t r i b u t e d t o the most heav i ly loaded s t r i n g e r and t h e equivalent d i s t r i b u t i o n f a c t o r f o r deck t e s t 2.
Table 6. Bridge r a t i n g s (opera t ing) .
Table 7. Load d i s t r i b u t i o n f a c t o r s .
Table 8. Resul t s of f a t i g u e t e s t s on undamaged eyebars .
Table 9. Resul t s of f a t i g u e t e s t s on damaged and repa i red eyebars.
Table 10. Resul t s of s t a t i c t e s t s on undamaged eyebars.
Table 11. Summary - s t a t i c t e s t r e s u l t s .
Table 12. Resul t s of s t a t i c t e s t s on damaged and repa i red eyebars.
CHAPTER 1. INTRODUCTION
The construction of the Saylorville Dam and Reservoir on the
Des Moines River created an ideal opportunity to study bridge behavior.
Due to the dam and reservoir construction, six highway bridges
crossing the river were scheduled for removal. Five of these are old
pin-connected, high-truss, single-lane bridges and are typical of
many built around the turn of the century throughout Iowa and the country.
Only limited information on their design and construction is available
because these bridges were built circa 1900. Because there is an
increasing need to determine the strength and behavior characteristics
of all bridges, the removal of these five was invaluable by allowing
the study of bridge behavior through testing actual prototype bridges
rather than physical or mathematical models. The purpose of this
testing program was to relate design and rating procedures presently
used in bridge design to the observed field behavior of this type of
truss bridge.
A study to determine the feasibility of performing these load tests
1 was conducted several years ago by Iowa State University . Included in
the study findings was a recommendation that a broad range of programs
beconductedon several of the truss bridges involved in the removal
program. The first truss bridge to be replaced, the Hubby Bridge, was
available for testing in June 1974. A research program was developed
and undertaken by Iowa State University to conduct a number of the
recommended tests. Previous detailed the research and
findings of the first phase of the program which covered the ultimate
load behavior of the high truss bridge and the second phase of the
program which covered the service load testing of the Hubby Bridge
and the Chestnut Ford Bridge. The tests on the Chestnut Ford Bridge
were performed while the bridge was still open to traffic. Also
included in the study were several supplemental programs, including
the fatigue and static testing of bars obtained from both of the
above mentioned bridges. This report is a summary report on the
entire project and includes an outline of the results of the program
and recommendations for implementation of the findings.
Objectives
Specifications and manuals adopted by the American Association of
State Highway and Transportation Officials (AASHTO)~'~ contain criteria
used in the design and rating of highway bridges in the United States.
These criteria are based on rational structural analysis, actual
experimental investigations, and engineering judgment. These criteria
also attempt to take into account actual bridge behavior to assure
safe and serviceable structures. However, as a result of the
catastrophic collapse of several old bridges in the last 10 years,
considerable interest has been generated in determining the actual
load-carrying capacity of bridges. The load capacity of newer
bridges can generally be obtained from existing plans and specifications
that can be supplemented by field examinations and, if necessary,
actual field tests. However, for the old pin-connected, high-truss
bridges, there are generally no technical data available. There
is also a complete lack of field load test data at service load
levels or at ultimate load capacity. The general objective of the
program was to provide data on the behavior of this bridge type in

t h e s e r v i c e load range and up t o u l t ima te capaci ty , a s w e l l a s d a t a
on the remaining f a t i g u e l i f e of t h e tens ion members i n the t r u s s .
A s engineers undertake the a n a l y s i s and r a t i n g of these br idges ,
many ques t ions a r i s e . These inc lude t h e condit ion of t h e j o i n t s ,
t h e s t r e n g t h of the eyes ( inc luding forgings) i n t h e tens ion ba r s , and
the behavior of t h e floorbeams and deck. The r e s u l t s repor ted he re
a r e l imi t ed t o the two br idges t e s t e d , bu t the r e s u l t s should never the less
provide an ind ica t ion of poss ib le answers t o t h e ques t ions posed above.
The s p e c i f i c ob jec t ives of t h i s load t e s t program were:
1. Relate appropr ia te AASHTO c r i t e r i a t o t h e a c t u a l br idge
behavior a s determined from tests on the a v a i l a b l e t r u s s
bridges.
2 . Determine an es t imate of t h e remaining f a t i g u e l i f e of t h e
br idge components.
3. Determine t h e e f f e c t of r e p a i r s on t h e remaining f a t i g u e
l i f e of t h e bridge components.
The r e s u l t s of the research w i l l provide a b e t t e r understanding of
t h e a c t u a l s t r eng th of the hundreds of o ld high-truss br idges e x i s t i n g
throughout Iowa a s wel l a s t h e country a s a whole.
General Test Program
The f i r s t phase of the t e s t program cons is ted of u l t i m a t e load
t e s t i n g of one span of t h e Hubby Bridge i n Boone County, u l t i m a t e load
t e s t i n g of two I-shaped floorbeams of t h e bridge, and u l t ima te load
t e s t i n g of two panels of i ts timber deck. The t r u s s span was t e s t e d i n
an "as is" condit ion with loads s imulat ing a c t u a l t ruck loading. Af ter
i n i t i a l f a i l u r e the t r u s s was damaged and r e t e s t e d i n t h i s condit ion.
The floorbeams were tested with loads to simulate an axle loading. One
of the floorbeams had some initial crookedness, while the other was
essentially straight. The loads were applied using hydraulic jacks
and dead weights in both the truss test and the floorbeam tests. One
of the timber deck tests was performed with loads simulating a truck
centered on the deck panel and the other with loads placed three ft.
off center to simulate a truck on the edge of the deck panel.
The second phase of the test program consisted of field service
load testing of the west two spans of the Hubby Bridge and of the
west span of the Chestnut Ford Bridge in Dallas County. The tests
were conducted using loaded county gravel trucks to simulate a
standard H truck loading. The trucks were driven along the center-
line and along the edges of the roadway of each bridge.
In addition, during the removal of the two bridges, a number of
tension eyebars were salvaged for use in a supplementary fatigue
testing program. The laboratory tests that were conducted consisted
of fatigue testing 23 eyebars in their original condition and 9
eyebars after they had been damaged and then subsequently repaired.
Static tests were conducted on 19 eyebars in their original condition
and on three eyebars that had been purposefully damaged in the
laboratory and then subsequently repaired. Three different types of
damage and repair were used which simulated the possible types of
damage in the forgings and in the eyes of the bars.

CHAPTER 2. THE TEST BRIDGES
The highway bridges selected for testing were located on the
Des Moines River northwest of Des Moines, Iowa, in an area which will
be included in the Saylorville Reservoir. One of the high truss
bridges selected was the Hubby Bridge built in 1909 (Figs. 1 and 2),
located in southern Boone County about 25 miles northwest of Des Moines.
It was composed of four modified Parker type high-truss simple-spans,
each 165 ft. long.
The other bridge selected was the Chestnut Ford Bridge (Figs. 1
and 2) . located in northern Dallas County about 20 miles northwest of
Des Moines and five miles south of the Hubby Bridge. This bridge was
built circa 1900 and was composed of four high-truss simple-spans.
The first, third and fourth spans, from east to west, were modified
Pratt-type trusses each 150 ft. long, and the second span was a Pratt
truss 180 ft. long. Testing was conducted in the fourth, or west, span.
Truss Descriptions
A. Hubby Bridge
The trusses consisted of tension eyebars of both square and rec-
tangular cross sections, built-up laced channels for the end posts and
upper chord compression members, and laced channels for the other
compression members. The square tension eyebars were used for truss
hangers and diagonals and the rectangular tension eyebars were used
for the truss lower chords and diagonals. The eyes for these two types
of eyebars were formed by bending a bar around to form a tear-drop

shaped eye. This tear-shaped eye was then forged t o a bar t o form
one end of the eyebar.
The deck was bu i l t of timber s t r ingers , timber crossbeams, and
timber f loor planks. The s t r ingers stood on edge and were supported
by rol led I-shaped floorbeams. A typical deck panel consisted of
15 s t r ingers , 8 crossbeams, and 16 f loor planks a s shown i n Fig. 3:
The floorbeams were standard I-sections 12 in. deep and were
connected t o the t r u s s with c l i p angles.
B. Chestnut Ford Bridge
The t e s t t ru s s consisted of tension eyebars of c i rcu la r , square,
or rectangular cross section for tension members, of built-up laced
channels for end posts and upper chord compression members and of
laced channels f o r the remaining compression members. Qne inch square
tension eyebars were used for the t ru s s hangers. Rectangular tension
eyebars were used for the t russ lower chords and for some of the
diagonals with round bars being used for the other t russ diagonals.
The eyes f o r the square, round and the smaller rectangular eyebars
were formed by bending the end of the bar around t o form a tear-shaped
eye and then forging i t t o the continuing bar. The eyes for the la rger
tension eyebars were machined from a p la te t o form a round-shaped
eye and then forged t o the bar.
The deck was b u i l t of timber s t r i nge r s and timber f loor planks.
The s t r i nge r s stood on edge with t he i r longest dimension pa ra l l e l
t o the length of the bridge and were supported by rol led I-shaped
floorbeams. The cross f loor planks were laminated together with
bo l t s and were spiked to the s t r i nge r s every two f t . A typ ica l

panel consisted of 13 stringers with the continuous floor planking
as shown in Fig. 4.
Physical Properties
Chemical analysis and physical property tests were made of several
sections from each of the bridges. The results of the analyses and
tests are shown in Table 1. The tension eye-bars were determined
to be made of wrought iron and the other members of steel. The timber
members in the Hubby Bridge were made from Douglas Fir and pressure-
treated in accordance with Iowa State Highway Commission Standards.
Typical stress-strain curves for the wrought iron and steel and the
load deflection curve for the timber beams can be found in the interim
2,3 reports .
Table 1. Physical properties.
a. Chemical Properties
Carbon Manganese Phosphorus Sulfur
Element
Nickel Chromium Molybdenum Copper
Hubby Bridge hestnut Ford Bridge
Percentage in Percentag Percentage in Wrought Iron in Steel Wrought Iron
Aluminum Vanadium Silicon Cobalt
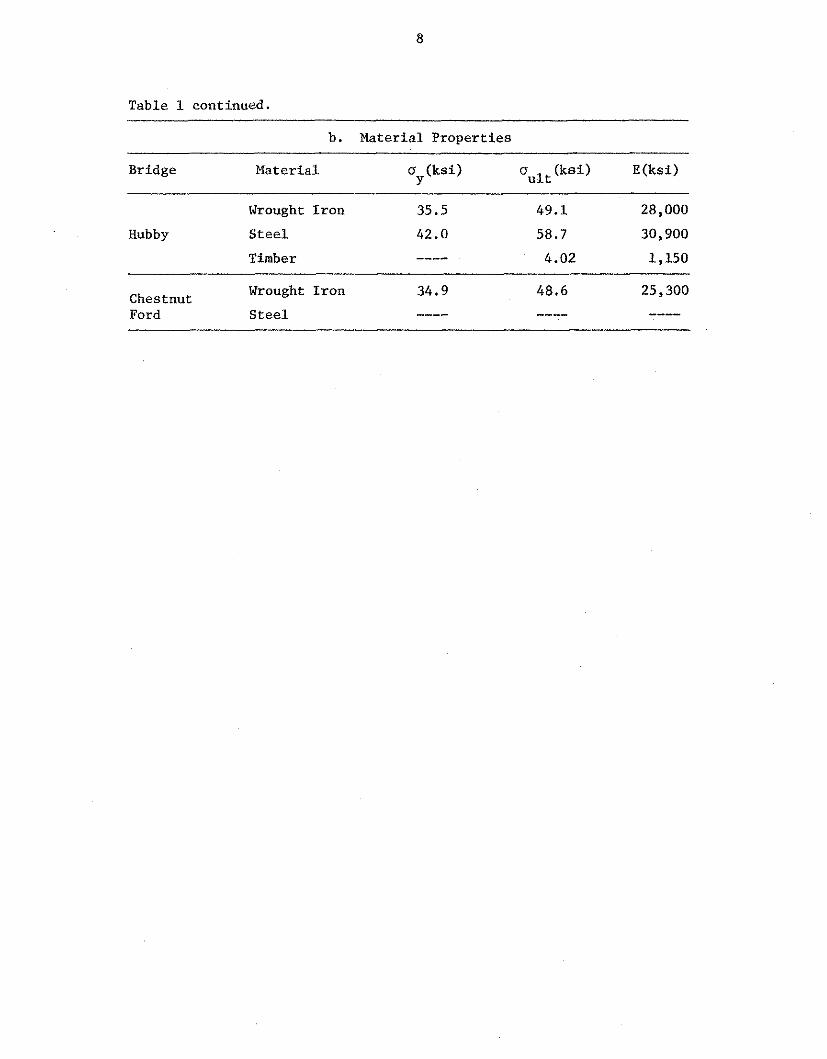
Table 1 continued.
b. Material Properties
Bridge Material U (ksi) u (ksi) ult
E (ksi) Y
Hubby
Wrought Iron
Steel
Timber
Chestnut Ford
Wrought Iron
Steel

CHAPTER 3. FIELD TESTS AND TEST PROCEDURE
This section summarizes the spec i f ic t e s t s and events which
occurred during the conduct of the f i e l d tes t s . Each tes t ing program
( i . . , timber deck t e s t , t r u s s t e s t , floorbeam t e s t , and service
load t e s t s ) w i l l be discussed separately. In t h i s section, only the
occurrences w i l l be discussed, and the analysis of the behavior w i l l
be presented i n Chapter 5.
Field Tests - Ultimate
The t e s t procedure for each t e s t was to
1. Apply the f i r s t load increment,
2. Hold the load u n t i l the appropriate instrumentation
readings could be taken,
3. Record any behavioral indications,
4. Increase the load by the pre-established increment, and
5. Repeat s teps 2-4 u n t i l f a i l u r e occurs.
Timber Deck Test
The timber deck i n two d i f fe ren t panels on span 2 was the f i r s t
par t of the Hubby Bridge t o be tes ted. Each of the panels was
tes ted t o f a i l u r e using a simulated axle load applied by hydraulic
jacks . The f i r s t t e s t was conducted on the panel between L and Lg 8
with the loads centered on the panel a s shown i n Figs. 5 and 6.
The second t e s t was conducted on the panel between L and L with 2 3
the loads eccentrically placed so tha t the center of the axle was
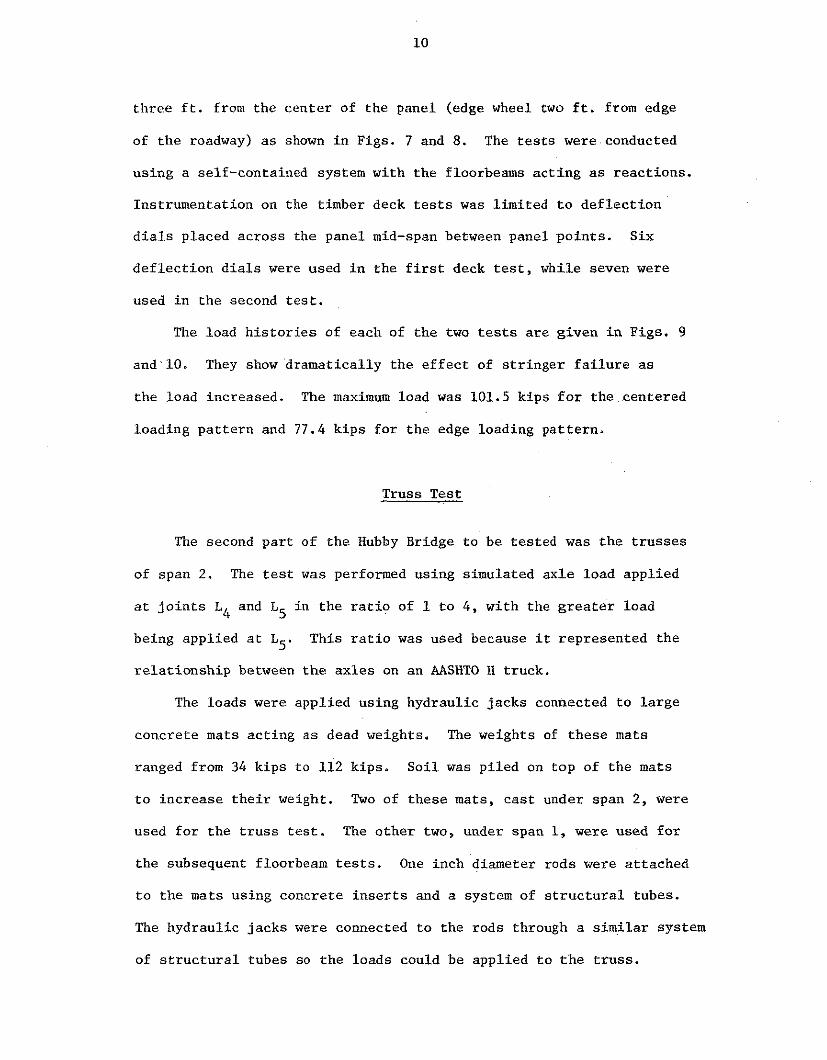
thrce ft. from the center of the panel (edge wheel two ft. from edge
of the roadway) as shown in Figs. 7 and 8. The tests were conducted
using a self-contained system with the floorbeams acting as reactions.
Instrumentation on the timber deck tests was limited to deflection
dials placed across the panel mid-span between panel points. Six
deflection dials were used in the first deck test, while seven were
used in the second test.
The load histories of each of the two tests are given in Figs. 9
and 10. They show dramatically the effect of stringer failure as
the load increased. The maximum load was 101.5 kips for the centered
loading pattern and 77.4 kips for the edge loading pattern.
Truss Test
The second part of the Hubby Bridge to be tested was the trusses
of span 2. The test was performed using simulated axle load applied
at joints L and L5 in the ratio of 1 to 4 , with the greater load 4
being applied at L5. This ratio was used because it represented the
relationship between the axles on an AASHTO H truck.
The loads were applied using hydraulic jacks connected to large
concrete mats acting as dead weights. The weights of these mats
ranged from 34 kips to 112 kips. Soil was piled on top of the mats
to increase their weight. Two of these mats, cast under span 2, were
used for the truss test. The other two, under span 1, were used for
the subsequent floorbeam tests. One inch diameter rods were attached
to the mats using concrete inserts and a system of structural tubes.
The hydraulic jacks were connected to the rods through a similar system
of structural tubes so the loads could be applied to the truss.
Sketches of the loading system are shown in Figs. 11 and 12. The
instrumentation on the truss tests consisted mainly of strain gages
on the truss members.
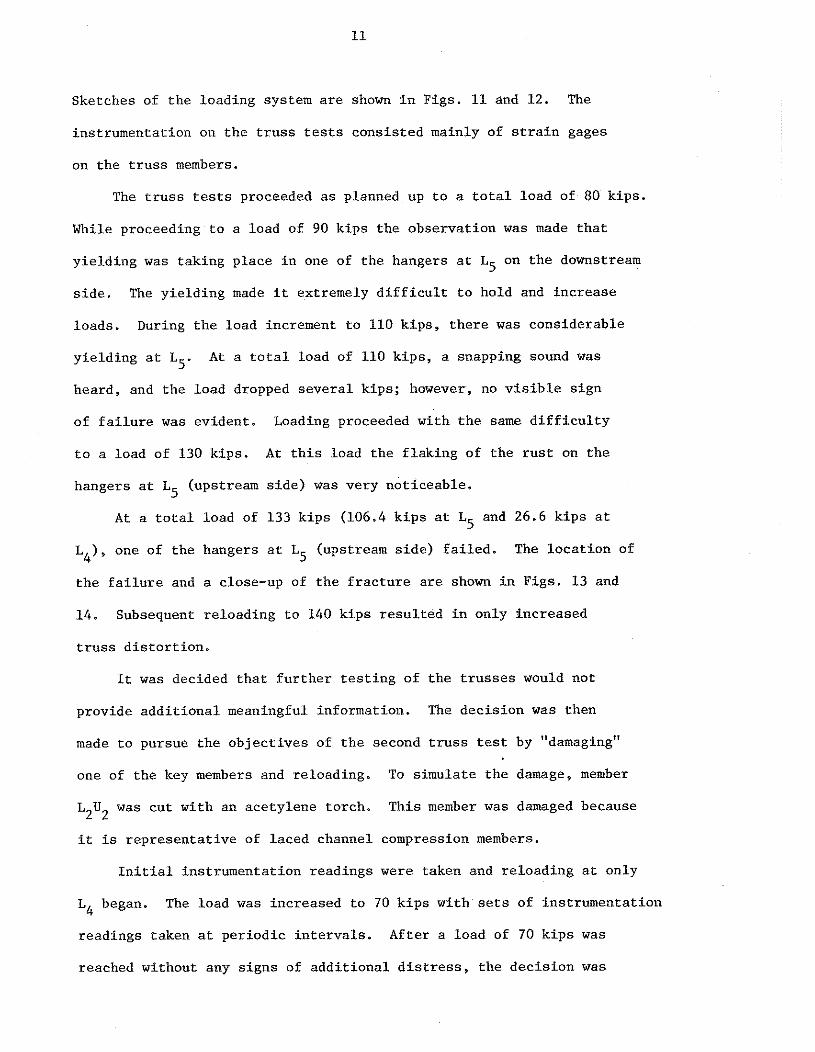
The truss tests proceeded as planned up to a total load of DO kips.
While proceeding to a load of 90 kips the observation was made that
yielding was taking place in one of the hangers at L5 on the downstream
side. The yielding made it extremely difficult to hold and increase
loads. During the load increment to 110 kips, there was considerable
yielding at L5. At a total load of 110 kips, a snapping sound was
heard, and the load dropped several kips; however, no visible sign
of failure was evident. Loading proceeded with the same difficulty
to a load of 130 kips. At this load the flaking of the rust on the
hangers at L (upstream side) was very noticeable. 5
At a total load of 133 kips (106,4 kips at L5 and 26.6 kips at
L ), one of the hangers at L5 (upstream side) failed. The location of 4
the failure and a close-up of the fracture are shown in Figs. 13 and
14. Subsequent reloading to 140 kips resulted in only increased
truss distortion.
It was decided that further testing of the trusses would not
provide additional meaningful information. The decision was then
made to pursue the objectives of the second truss test by "damaging"
one of the key members and reloading. To simulate the damage, member
L U was cut with an acetylene torch. This member was damaged because 2 2
it is representative of laced channel compression members.
Initial instrumentation readings were taken and reloading at only
L began. The load was increased to 70 kips with sets of instrumentation 4
readings taken at periodic intervals. After a load of 70 kips was
reached without any signs of additional distress, the decision was

made t o c u t t h e o the r channel comprising member,L U t o o b t a i n a f a i l u r e 2 2)
of t h e t r u s s . The load was again applied a t L4 with t h e load reaching
39 k i p s before t h e member col lapsed upon i t s e l f (forming a complete
but s h o r t e r member) a t t h e cu t l o c a t i o n (Fig. 15) . Th i s r e s u l t e d i n
a s l i g h t drop i n load. The load was then increased t o 72 k i p s wi th
no f u r t h e r d i s t r e s s of t h e t r u s s . The load was removed and a l l
t e s t i n g terminated because of p o t e n t i a l danger of co l l apse during
any a d d i t i o n a l member damage.
Floorbeam Test
The f i n a l por t ion of t h e u l t ima te t e s t program w a s t h e t e s t i n g
of two floorbeams i n span 1. They were both t e s t e d t o f a i l u r e us ing
a load appl ied by hydraul ic jacks and s imula t ing a t ruck ax le . The
f i r s t t e s t was conducted on t h e floorbeam a t L5. The compression
f lange of t h i s floorbeam was approximately 1 3 / 1 6 i n . o u t of l i n e
h o r i z o n t a l l y a t mid-span. The second t e s t was conducted on t h e
floorbeam at L4. The compression f l ange of t h i s beam was i n i t i a l l y
s t r a i g h t (within al lowable to l e rances ) . The t e s t s e tup and load
placement on t h e floorbeam a r e shown i n Figs. 16 and 17. A s can be
seen from t h e s e two f i g u r e s , each floorbeam was loaded us ing a system
s i m i l a r t o t h a t employed f o r t h e t r u s s t e s t .
Instrumentat ion cons i s t ed of s t r a i n gages on the two floorbeams
t e s t e d , a s wel l a s on t h e ad jacent floorbeams. S t r a i n gages were
a l s o placed on s e l e c t e d t r u s s members. Def lec t ion d i a l s were used
t o measure t h e displacement of t h e t e s t beams a t the c e n t e r l i n e and
q u a r t e r po in t s .
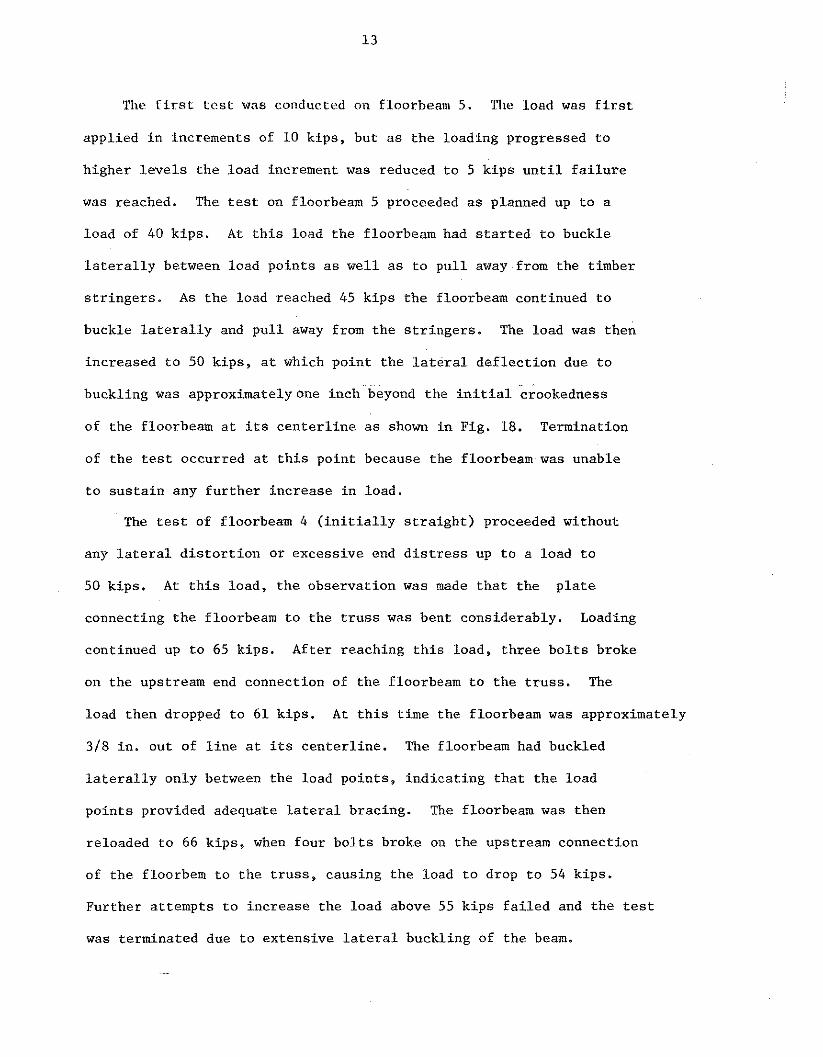
Tltr Cirst test was conducted on floorbeam 5 . The load was first
applied in increments of 10 kips, but as the loading progressed to
higher levels the load increment was reduced to 5 kips until failure
was reached. The test on floorbeam 5 proceeded as planned up to a
load of 40 kips. At this load the floorbeam had started to buckle
laterally between load points as well as to pull away from the timber
stringers. As the load reached 45 kips the floorbeam continued to
buckle laterally and pull away from the stringers. The load was then
increased to 50 kips, at which point the lateral deflection due to
buckling was approximately one inch beyond the initial c;ookedness
of the floorbeam at its centerline as shown in Fig. 18. Termination
of the test occurred at this point because the floorbeam was unable
to sustain any further increase in load.
The test of floorbeam 4 (initially straight) proceeded without
any lateral distortion or excessive end distress up to a load to
50 kips. At this load, the observation was made that the plate
connecting the floorbeam to the truss was bent considerably. Loading
continued up to 65 kips. After reaching this load, three bolts broke
on the upstream end connection of the floorbeam to the truss. The
load then dropped to 61 kips. At this time the floorbeam was approximately
3/8 in. out of line at its centerline. The floorbeam had buckled
laterally only between the load points, indicating that the load
points provided adequzte lateral bracing. The floorbeam was then
reloaded to 66 kips, when four bolts broke on the upstream connection
of the floorbem to the truss, causing the load to drop to 54 kips.
Further attempts to increase the load above 55 kips failed and the test
was terminated due to extensive lateral buckling of the beam.
Service Load Tests
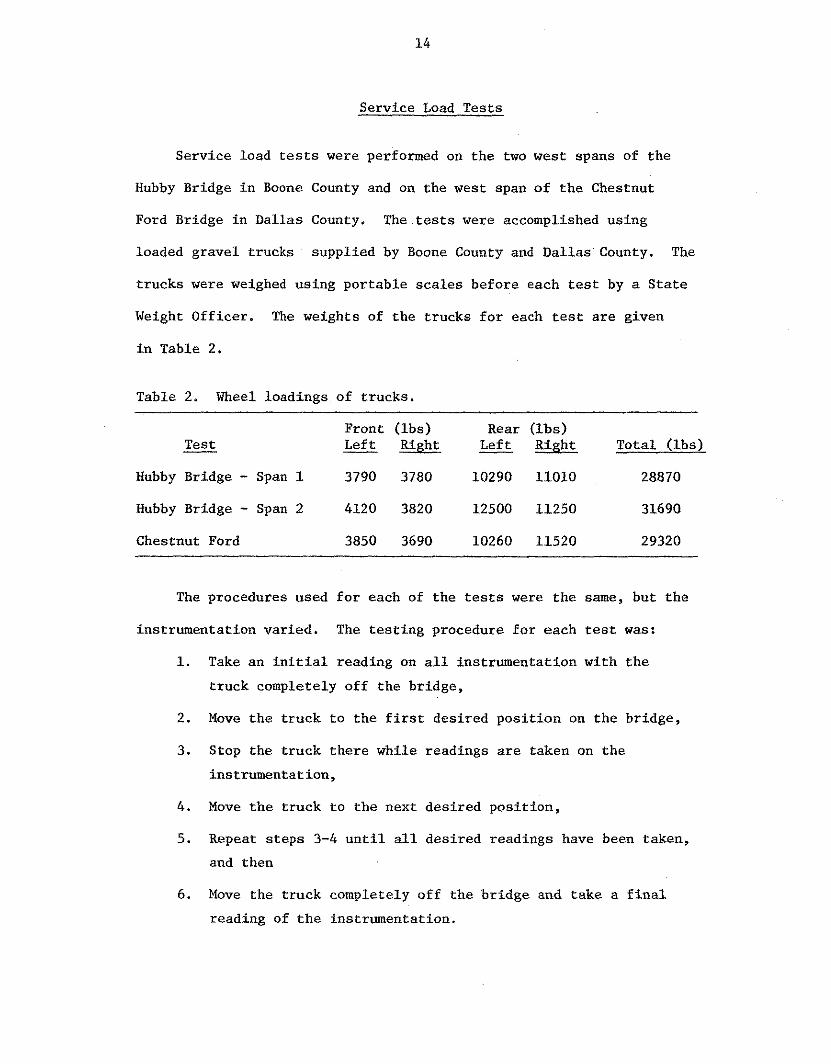
Service load tests were performed on the two west spans of the
Hubby Bridge in Boone County and on the west span of the Chestnut
Ford Bridge in Dallas County. The tests were accomplished using
loaded gravel trucks supplied by Boone County and Dallas County. The
trucks were weighed using portable scales before each test by a State
Weight Officer. The weights of the trucks for each test are given
in Table 2.
Table 2. Wheel loadings of trucks.
Test - Front (lbs) Rear (lbs) Left - Left Total (lbs)
Hubby Bridge - Span 1 3790 3780 10290 11010 28870
Hubby Bridge - Span 2 4120 3820 12500 11250 31690
Chestnut Ford 3850 3690 10260 11520 29320
The procedures used for each of the tests were the same, but the
instrumentation varied. The testing procedure for each test was:
1. Take an initial reading on all instrumentation with the
truck completely off the bridge,
2. Move the truck to the first desired position on the bridge,
3. Stop the truck there while readings are taken on the
instrumentation,
4. Move the truck to the next desired position,
5. Repeat steps 3-4 until all desired readings have been taken,
and then
6 . Move the truck completely off the bridge and take a final
reading of the instrumentation.
The instrumentation for Hubby Bridge span 1 consisted of 108
strain gages and five deflection dials. The deflection dials were
located at the centerline, quarter points, and near the ends of the
floorbeams at L- Of the 108 strain gages, 76 were mounted on selected 5'
truss members and 32 were mounted on floorbeams 3, 4, 5, and 6.
The strain gages on the floorbeams were mounted on the compression
and tension flanges of the floorbeams. They were located at the
centerline, third points, and also near the ends of the floorbeams
4 and 5 and at the centerline and near the ends of floorbeams 3 and
6. The truck was driven down thecenterline of the bridge first,
stopping with its rear wheels in line with the panel points. The
truck was then driven down each side, with the center of the wheels
approximately two ft. from the edge of the roadway, stopping only . at L3, L4, L5? and L6.
The instrumentation for the Hubby Bridge span 2 test consisted
of 116 strain gages and 6 deflection dials. Eight gages were mounted
on the compression and tension flanges at the centerline of the floor-
beams at L 2 L3$ L8, and L and the remaining 108 were mounted 9
on the truss members.
The truck was driven down the centerline of the bridge first,
stopping with its rear wheels in line with the panel points. The
truck was then driven down each side stopping only at L5 and halfway
between L2 and L 3 '
The instrumentation for the Chestnut Ford Bridge consisted of 15
strain gages mounted on the north truss of the west span. The strain
gages were mounted on tension members only. The truck was driven
down the centerline of the bridge and then down one side of the bridge
stopping at each panel point.
After this part of the test was completed the truck was located on
the bridge with its rear wheels halfway between panel points. Deflection
measurements of the deck were taken while the truck was at the center of
the bridge roadway and at eccentric positions on the left and right sides
of the bridge roadway.
CHAPTER 4. LABORATORY TESTS AND TEST PROCEDURE
The service load field tests were completed in September 1974
and the bridges were removed in January 1975. The contract for the
salvage of the bridges stated that the east span of the Hubby Bridge
and the west span of the Chestnut Ford Bridge were to be removed as
if they were to be reconstructed. Over LOO eyebars from these spans
were shipped to the laboratory.
This section outlines tests that were performed in the
laboratory.
Fatigue Tests
The main thrust of the laboratory testing program was the fatigue
testing of 30 eyebars. The fatigue tests were accomplished using a
special apparatus design so that loads could be applied to the
eyebars through pins placed in the eyes (Fig. 21). The pins
used were actual pins taken from the test bridges. The pin used in
the eye of an eyebar was not necessarily the one that was originally
in that particular eye, but it was nevertheless a pin of the same
size. The eyebars were inspected for dimensions, flaws, and peculiarities
before they were tested.
The cyclic loads that were imposed on the eyebars varied from
a minimum oftwoksi to a maximum of 16-22 ksi. All of the fatigue
tests were run with a cyclic frequency of three to four hertz.
Some of the tests were performed on undamaged bars and some of
the tests were performed on bars that had been purposefully damaged
in the laboratory and then repaired. Three types of damage and repair
were investigated:
1. The first type of damage simulated a fracture in the forging
area near a turnbuckle. Two eyebars were cut at a forging near a
turnbuckle and were then welded back together. Two pieces of cold-
rolled bar stock of the same dimensions as the eyebar were spliced
onto the eyebar over the fracture. The splices extended for at
least two ft. in each direction from the fracture.
2. The second type of damage simulated a fracture in the neck
of an eye. Four bars were cut in the neck of an eye and were then
welded back together. Pieces of cold-rolled bar stock were spliced
on over the fracture. The splices extended as far into the eye as
possible and at least two ft. along the bar past the fracture.
3. The third type of damage simulated a fracture in the eye.
In this case, the eye was cut off completely and a new eye was formed
out of cold-rolled bar stock. The eye was formed by heating the bar
stock cherry red and bending it into a tear-shape. This new eye
was then welded onto the original bar.
Static Tests
The second part of the laboratory testing program consisted of
the static testing of specimens taken from 22 eyebars. The specimens
were cut from the ends of the eyebars and consisted of the eye plus
three ft. of the bar, except for three specimens which included only
a turnbuckle section. Nineteen specimens were tested in the original
condition and three specimens were tested after being repaired.
CHAPTER 5. TEST RESULTS AND ANALYSIS
I n Chapters 3 and 4 a summary of t h e t e s t program and t h e ac tua l
events which occurred during t h e conduct of t h e t e s t were indica ted .
In subsequent paragraphs i n t h i s chapter t h e r e s u l t s of t h e best
and an a n a l y s i s of t h e i r s ign i f i cance w i l l be presented. Each t e s t
program w i l l be discussed sepa ra t e ly ,
Timber Deck Tes t
The u l t i m a t e load and equivalent H t r u c k f o r each of t h e t e s t s
a r e shown i n Table 3. The equivalent H t r u c k f o r t h e deck tests was
determined by p lac ing t h e equivalent r e a r a x l e of t h e t r u c k a t mid-span
of t h e deck panel . The t o t a l u l t ima te load f o r deck t e s t 1 (load
centered on roadway) was 101.5 k ips and f o r deck t e s t 2 ( load placed
e c c e n t r i c a l l y ) i t was 7 7 . 4 k ips , It should be noted t h a t a l though
the loads were applied t r ansve r se ly a t s ix- foot c e n t e r s (wheel t r a c k
spac ing) , t h e r e were two equal loads spaced l o n g i t u d i n a l l y a t t h e
th i rd-poin ts . These loads , however, can be r e l a t e d t o o t h e r behavior
by determining t h e equiva lent AASHTO t ruck . For deck t e s t 1 (centered
load\, f a i l u r e occurred a t an equiva lent H 42 t r u c k and f o r t e s t 2
( e c c e n t r i c loadk a t a H 32 t ruck .
The primary behavioral i n d i c a t o r f o r t h e deck t e s t s was t h e
d e f l e c t i o n readings taken across t h e width of the panel a t mid-span
of the panel. The load-deflect ion curves of t h e two deck t e s t s a t
va r ious p o i n t s t r ansve r se ly ac ross t h e s e c t i o n a re shown i n Figs. 22
and 23. These curves, along with t h e u l t i m a t e load da ta , i n d i c a t e
the behavior of t h e deck throughout t h e t e s t t o f a i l u r e .
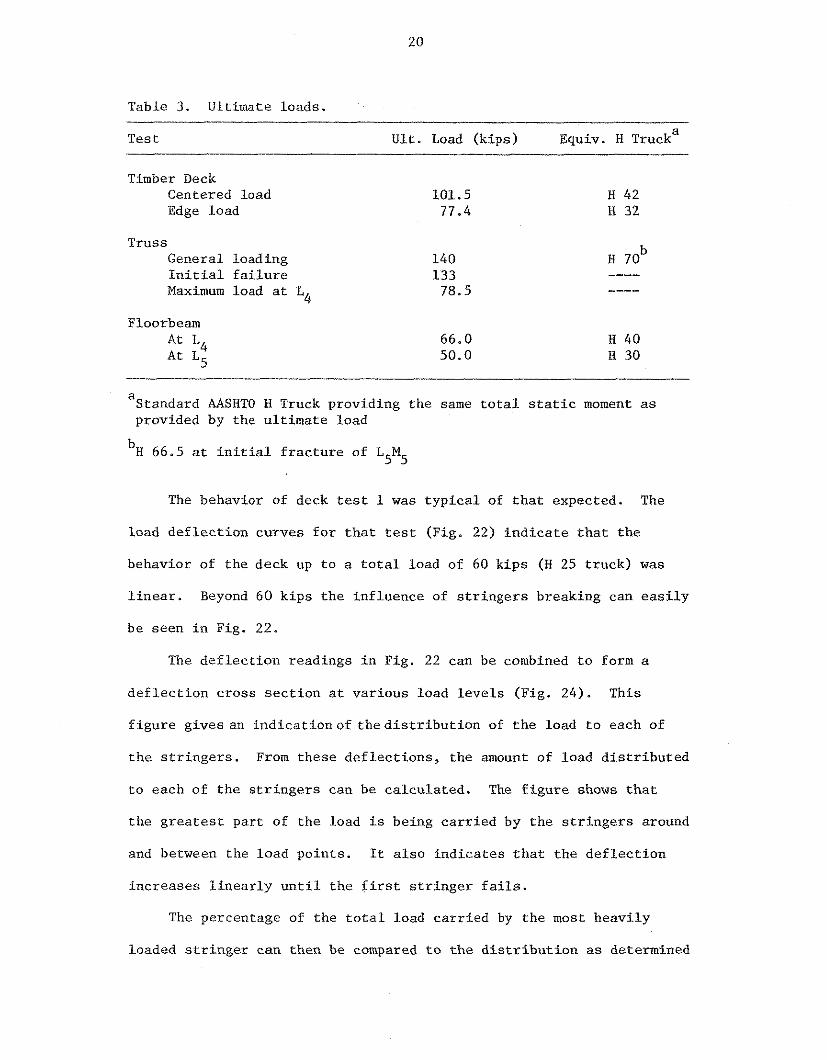
Table 3 . Ultimate loads.
Test U l t . Load (k ips) Equiv. H Trucka
Timber Deck Centered load Edge load
Truss General loading 140 I n i t i a l f a i l u r e 133 Maximum load a t L 4 78.5
Floorbeam A t L4 A t L5
a Standard AASHTO H Truck providing the same t o t a l s t a t i c moment a s provided by the u l t ima te load
'H 66.5 a t i n i t i a l f r a c t u r e of L M 5 5
The behavior of deck t e s t 1 was t y p i c a l of t h a t expected. The
load d e f l e c t i o n curves f o r t h a t test (Fig. 22) i n d i c a t e t h a t the
behavior of t h e deck up t o a t o t a l Load of 60 k ips (H 25 t ruck) w a s
l i n e a r . Beyond 60 k i p s t h e inf luence of s t r i n g e r s breaking can e a s i l y
be seen i n Fig. 22.
The d e f l e c t i o n readings i n Fig. 22 can be combined t o form a
d e f l e c t i o n c ross s e c t i o n a t var ious load l e v e l s (Fig. 24). This
f i g u r e g ives an i n d i c a t i o n o f t h e d i s t r i b u t i o n of t h e load t o each of
t h e s t r i n g e r s . From these d e f l e c t i o n s , t he amount of load d i s t r i b u t e d
t o each of t h e s t r i n g e r s can be ca lcula ted . The f i g u r e shows t h a t
the g r e a t e s t pa r t of t h e load is being c a r r i e d by t h e s t r i n g e r s around
and between the load poin ts . It a l s o ind ica te s t h a t t h e d e f l e c t i o n
inc reases l i n e a r l y u n t i l t he f i r s t s t r i n g e r f a i l s .
The percentage of the t o t a l load c a r r i e d by t h e most heavi ly
loaded s t r i n g e r can then be compared t o t h e d i s t r i b u t i o n a s determined
2 from the AASHTO Specifications . The AASHTO distribution is given
as 514 wheels in Sec. 1.3.1, where S is the average stringer spacing
in feet. For deck testl, the percentage of the total load distributed
in the most heavily loaded stringer is, according to the Specifications,
14 percent.
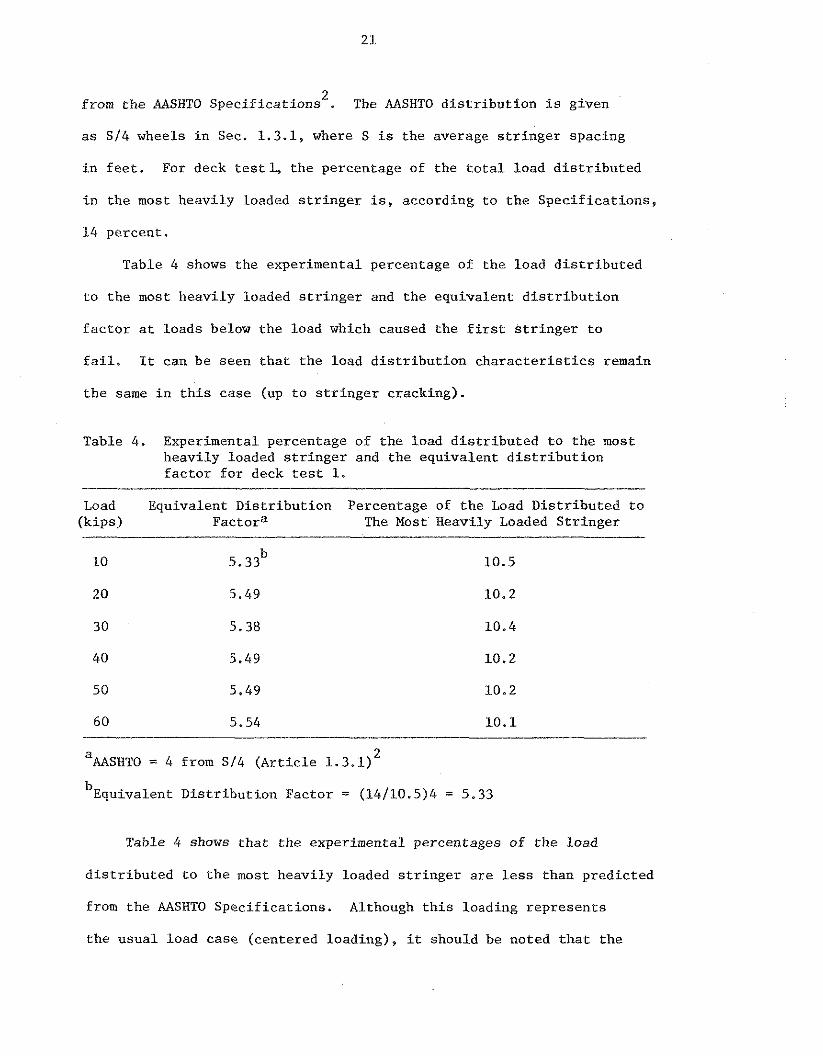
Table 4 shows the experimental percentage of the load distributed
to the most heavily loaded stringer and the equivalent distribution
factor at loads below the load which caused the first stringer to
fail. It can be seen that the load distribution characteristics remain
the same in this case (up to stringer cracking).
Table 4. Experimental percentage of the load distributed to the most heavily loaded stringer and the equivalent distribution factor for deck test 1.
Load Equivalent Distribution Percentage of the Load Distributed to (kips) Factora The Most Heavily Loaded Stringer
a AASHTO = 4 from Sf4 (Article 1.3.1) 2
b~quivalent Distribution Factor = (14/10.5)4 = 5.33
Table 4 shows that the experimental percentages of the load
distributed to the most heavily loaded stringer are less than predicted
from the AASHTO Specifications. Although this loading represents
the usual load case (centered loading), it should he noted that the
e c c e n t r i c Loading ( t ruck near roadway edge) c a s e is more c r i t i c a l
and w l l i rosi i l t i n the edge s t r i n g e r s r ece iv ing more load. The
S p e c i f i c a t i o n s cover the most c r i t i c a . 1 case, and thus i t would be
expected t h a t t h e centered load (deck t e s t I ) would be conserva t ive .
The t h e o r e t i c a l capac i ty of t h e deck f o r deck t e s t 1 was
determined, us ing d a t a from t e s t s of s t r i n g e r s removed from t h e br idge ,
t o be 104.7 k i p s . Thus, t h e a c t u a l capac i ty of t h e deck (101.5 k ips )
is very c lose t o t h e t h e o r e t i c a l capac i ty .
The behavior of deck t e s t 2 ( e c c e n t r i c loading) was a l s o t y p i c a l
of t h a t expected. The load-def lec t ion curves f o r t h a t test (Fig. 23)
i n d i c a t e t h a t t h e behavior of t h e deck was l i n e a r up t o a t o t a l load
of 40 k i p s (W 1 7 t ruck) . The behavior of the deck shown by Figs. 23a and
23b is not r e a l l y i n d i c a t i v e of behavior of t h e e n t i r e deck because these
two d e f l e c t i o n d i a l s were near t h e edge of t h e panel oppos i te t h e
loading. This por t ion of t h e deck underwent only u p l i f t and very
small d e f l e c t i o n s .
The d e f l e c t i o n readings i n Fig. 23 a r e combined i n t h e same manner
a s Fig. 22 t o form a d e f l e c t i o n c r o s s sec t ion a t va r ious loads (Fig. 25).
Figure 25 g ives an ind ica t ion of t h e d i s t r i b u t i o n of t h e load t o each
of the s t r i n g e r s . This f i g u r e a l s o i n d i c a t e s t h a t t h e major po r t ion
of t h e load is being c a r r i e d by t h e s t r i n g e r s on t h e loaded s i d e of
t h e panel and t h a t t h e d e f l e c t i o n inc reases l i n e a r l y up t o a t o t a l
load of 40 k ips .
A s i n deck t e s t 1 , t h e percentage of the t o t a l load c a r r i e d by
t h e most heav i ly loaded s t r i n g e r can be compared t o t h e d i s t r i b u t i o n
2 a s determined by t h e Spec i f i ca t ions . For deck t e s t 2 t h e percentage
of t h e t o t a l load d i s t r i b u t e d t o t h e most heav i ly loaded s t r i n g e r i s
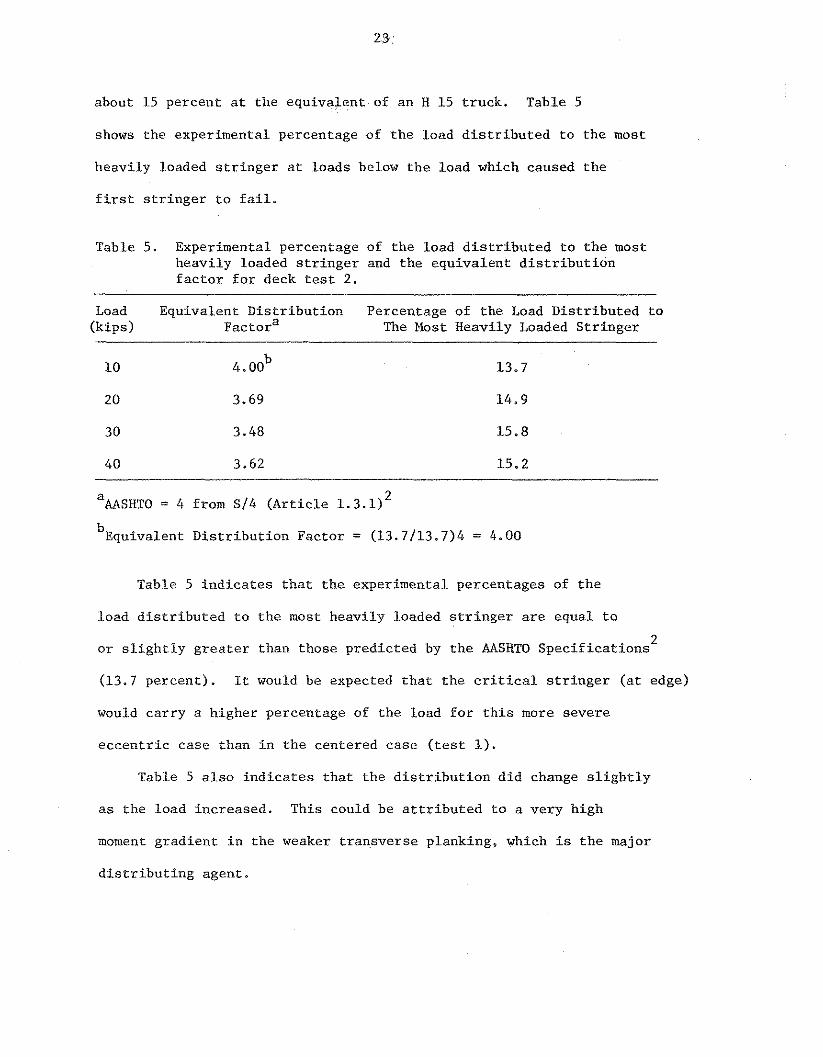
about 15 percent a t t he equivalent of an H 15 t ruck . Table 5
shows the experimental percentage of the load d i s t r i b u t e d t o the most
heavily loaded s t r i n g e r a t loads below t h e load which caused t h e
f i r s t s t r i n g e r t o f a i l .
Table 5. Experimental percentage of t h e load d i s t r i b u t e d t o t h e most heavi ly loaded s t r i n g e r and t h e equivalent d i s t r i b u t i o n f a c t o r f o r deck t e s t 2.
Load Equivalent Di s t r ibu t ion Percentage of the Load Dis t r ibuted t o (kips) actor^ The Most Heavily Loaded S t r inge r
a MSHTO = 4 from S/4 (Ar t i c l e 1.3.1)
2
b ~ q u i v a l e n t D i s t r i b u t i o n Factor = (13.7/13.7)4 = 4.00
Table 5 i n d i c a t e s t h a t t h e experimental percentages of t h e
load d i s t r i b u t e d t o t h e most heavily loaded s t r i n g e r a r e equal t o
o r s l i g h t l y g r e a t e r than those predicted by t h e AASHTO s p e c i f i c a t i o n s L
(13.7 percent ) . It would be expected t h a t the c r i t i c a l s t r i n g e r ( a t edge)
would ca r ry a higher percentage of t h e load f o r t h i s more severe
e c c e n t r i c case than i n t h e centered case ( t e s t 1).
Table 5 a l s o i n d i c a t e s t h a t the d i s t r i b u t i o n d id change s l i g h t l y
a s the load increased. This could be a t t r i b u t e d t o a very high
moment gradient i n t h e weaker t ransverse planking, which is t h e major
d i s t r i b u t i n g agent .
The theoret ical capacity of the deck f o r deck t e s t 2 was
determined t o be 78.5 kips. This is extremely close t o the actual
capacity of the deck (77.4 kips).
The r e su l t s from both deck t e s t s indicate a high degree of
va l id i ty for both the d i s t r ibu t ion procedure indicated by AASHTO 2
and the calculations for deck capacity. It should be noted, however,
that the timber deck used i n the bridge consisted of heavy transverse
planks t o a s s i s t d is t r ibut ion. Distribution charac te r i s t ics could
vary s ign i f ican t ly for other deck types. Thus, although there is a
good comparison i n t h i s case, there is a poss ib i l i ty of need for
consideratian of various deck configurations i n d i s t r ibu t ion
determination.
Truss Test
The i n i t i a l f a i l u re of the t russ took place a t a load of 133 kips.
This f a i l u re was the breaking of one of the hangers which made up
member L5M5. The applied loading was 106 kips and 27 kips a t L5 and
=&* respectively. Additional load w a s applied i n an attempt t o
cause addit ional members to f a i l . A large d i s to r t i on of the lower
chord of the t r u s s near the load a t L5 occurred under t h i s higher
loading without any f a i l u re . The maximum load under t h i s general
loading was 140 kips; 112 kips a t L5 and 28 kips a t L4. The maximum
v e r t i c a l deflection a t L5 a t t h i s time was15 in .
After adjustment of the loading system, a l l load was applied
a t L with the maximum load being 78.5 kips. The t e s t program then 4
included damaging a member. After member L2U2 was cut completely
through, a load of 39 kips produced a f a i l u r e of the t russ . This
resulted in a vertical displacement of the member at the cut
locat ion.
The behavioral indicators for the truss test were the deflection
readings at mid-span and at the three-tenths points and the forces
in the truss members as computed from the strain gage readings taken
during the test. The experimental strains were converted to stresses
assuming that both the wrought iron and steel were elastic-perfectly
plastic materials. The materials were assumed elastic up to the
yield strain computed from appropriate values of yield stress and
modulus of elasticity in Table 1 and assuming no increase in stress
beyond the yield strain. The areas of each individual member were
used to convert the stresses to forces in the individual members.
Figure 26, the theoretical and experimental load-deflection curves
for the vertical deflection at mid-span, indicates that yielding
began to occur in member L M at a total load of approximately 80 5 5
kips. The curve was relatively linear at loads less than 80 kips
and above 80 kips the slope of the curve decreases,indicating yielding
of member L M The theoretical and experimental load-deflection 5 5'
curves for the vertical deflection at L and L also indicate no 3 7
yielding or nonlinearity up to the maximum load at which readings
were taken.
Figure 27, the total load-force in truss member L M curve, 5 5
indicates, for this truss, approximately the same behavior as the
total load-vertical deflection curve at L5 (Fig. 26). Curves that
illustrate total load-force in other truss members also indicate linear
behavior up to the maximum load at which readings were taken.
The t h e o r e t i c a l fo rces used i n P i g s . 26 and 27 were obtained
from a s t r u c t u r a l ana lys i s of the t r u s s assuming t h a t a l l of t h e
members were held together by p ins a t the j o i n t s . Most of t h e
experimental fo rces determined from s t r a i n gage readings agree q u i t e
c lose ly with the t h e o r e t i c a l fo rces determined from ana lys i s . Some
of the experimental d a t a f o r the v e r t i c a l members is e r r a t i c o r
d i f f e r s considerably i n magnitude from the t h e o r e t i c a l curve, but
the s lope o f the curve is very s i m i l a r t o t h a t of t h e t h e o r e t i c a l
curve. This behavior i s due t o t h e "frozen" condi t ion of t h e t r u s s
j o i n t s r e s u l t i n g from the rus ted members and pins.
Thus, although the a c t u a l condit ions i n the j o i n t s a r e unknown,
considering the t r u s s t o be pin-connected does provide a r e a l i s t i c
method of t r u s s a n a l y s i s f o r these o ld bridges. The tremendous
f l e x i b i l i t y of t h e members t h a t al lows accommodation of any j o i n t
r e s t r a i n t c o n t r i b u t e s t o t h i s conclusion.
The capaci ty of t h e hangers a t L3 a s ca lcu la t ed using d a t a
from coupon t e s t s was 110 k ips . This w a s j u s t a few k i p s g r e a t e r
than the load t h a t a c t u a l l y caused the f r a c t u r e of one of these
hangers. The a c t u a l s t r e s s a t f r a c t u r e was 47.4 k ips l squa re i n .
This i n d i c a t e s t h a t the "lap," near where t h e f r a c t u r e occurred,
was about 97 percent e f f e c t i v e . An examination of t h e f r a c t u r e
(Fig. 14) i n d i c a t e s a l s o t h a t only a very small po r t ion of the sec t ion
was not fused. The cu r ren t p r a c t i c e i s t o assume t h e "lap" only
40 percent e f f e c t i v e , which is much lower than the a c t u a l capaci ty
of t h e member.
Floorbeam Test
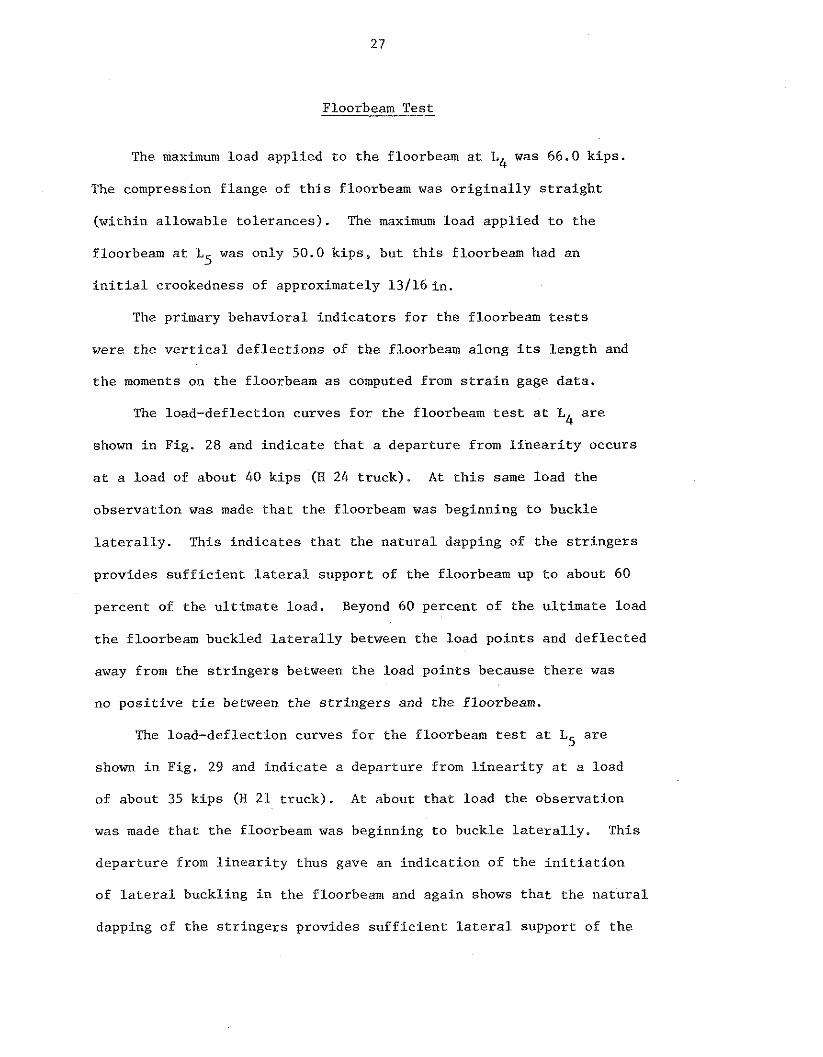
The maximum load applied to the floorbeam at L4 was 66.0 kips.
The compression flange of this floorbeam was originally straight
(within allowable tolerances). The maximum load applied to the
floorbeam at L5 was only 50.0 kips, but this floorbeam had an
initial crookedness of approximately 13/16 in.
The primary behavioral indicators for the floorbeam tests
were the vertical deflections of the floorbeam along its length and
the moments on the floorbeam as computed from strain gage data.
The load-deflection curves for the floorbeam test at L4 are
shown in Fig. 28 and indicate that a departure from linearity occurs
at a load of about 40 kips (H 24 truck). At this same load the
observation was made that the floorbeam was beginning to buckle
laterally. This indicates that the natural dapping of the stringers
provides sufficient Lateral support of the floorbeam up to about 60
percent of the ultimate load. Beyond 60 percent of the ultimate load
the floorbeam buckled laterally between the load points and deflected
away from the stringers between the load points because there was
no positive tie between the stringers and the floorbeam.
The load-deflection curves for the floorbeam test at L5 are
shown in Fig. 29 and indicate a departure from linearity at a load
of about 35 kips (H 21 truck). At about that load the observation
was made that the floorbeam was beginning to buckle laterally. This
departure from linearity thus gave an indication of the initiation
of lateral buckling in the floorbeam and again shows that the natural
dapping of the stringers provides sufficient lateral support of the

floorbeam up to about 70 percent of the ultimate load. Beyond
70 percent of the ultimate load the floorbeam buckled laterally
between the load points due to the lack of a positive tie between
the stringers and the floorbeam.
The theoretical capacity of the floorbeam (initially straight)
was calculated at 62.4 kips. This was based on the assumption that
the load was uniformly distributed to the floorbeam and that the
ends were partially fixed. This agrees quite closely with the actual
capacity of the floorbeam (65 kips) that was initially straight (within
allowable tolerances). The theoretical capacity of the floorbeam
(initially crooked) will be somewhat less than that of the initially
straight floorbeam. Thus, the actual capacity of the initially
crooked floorbeam will agree quite closely with its theoretical
capacity.
The final configuration of each of the floorbeams was evidenced
by a large amount of lateral buckling of the floorbeam, as was
anticipated. The compression flanges of each floorbeam were tilted
and severely deformed (Fig. 18). The floorbeam had also pulled
away from the timber stringers above it.
Rating
One of the significant portions of this study was the rating of
the test span (span 2) and the comparison of that rating with the
actual capacity.
The field inspection used as the basis for the rating calculations
was made by the Maintenance Department of the Iowa State Highway
Commission. This information was forwarded to the agencies cooperating

3
i n t h i s phasc of Lhc s tudy. These agencies were Lhe U.S. Army - Corps
of Engineers, t h e Highway Division, Iowa Dept. of Transpor ta t ion and
Iowa S t a t e Universi ty. Using t h i s d a t a a s a base, each agency computed
5 the r a t i n g of t h e br idge us ing t h e AASHTO Maintenance Manual
Rat ings were requested f o r each of t h e t h r e e s e p a r a t e po r t ions
of t h e t r u s s t e s t e d , i . e . , t h e deck, t h e floorbeams, and t h e t r u s s e s .
The r e s u l t s of t h e r a t i n g s a r e shown i n Table 6.
Rat ings were requested f o r each of t h e t h r e e s e p a r a t e po r t ions
of t h e t r u s s t e s t e d , i . e . , t h e deck, t h e floorbeams, and t h e t r u s s e s .
The r e s u l t s of the r a t i n g s a r e shown i n Table 6.
Table 6. Bridge r a t i n g s (opera t ing) .
Deck H 13.1 H 8.2 H 9 .4 H 32
Floorbeam H 2.4a H 7.4 H 6.7 H 30
Truss H 11.4 H 12.7 H 11.9 H 66.5b
Bridge Por t ion
a Did not consider beam l a t e r a l l y supported
b ~ n i t i a l f r a c t u r e of L M 5 5
It can be seen t h a t t h e r a t i n g s a r e q u i t e c o n s i s t e n t f o r t h e t r u s s .
However, t h e r e i s a v a r i a t i o n i n t h e r a t i n g s f o r t h e f l o o r system. I n
t h e case of t h e floorbeams, t h e assumptions r e l a t e d t o l a t e r a l support
of t h e compression f lange a r e c r i t i c a l . Table 6 shows t h e e f f e c t of
t h i s assumption i n t h e r a t i n g of t h e floorbeam.
Also shown i n Table 6 a r e the c a p a c i t i e s a s determined from
the f i e l d t e s t s . It can be seen t h a t t h e c r i t i c a l member a s determined
Agency
1 2 3
Test Capacity (Table 2)

by t l ~ c r n c l n g s (floorbeam) is a l s o the c r i t i c a l member a s found from
t i l t , LCSLH.
The r e l a t i o n s h i p of t h e r a t i n g s a t ope ra t ing l e v e l s t o t h e
u l t ima te capaci ty range from r a t i n g s of only seven percent of u l t ima te
capaci ty f o r t h e floorbeam (assuming no l a t e r a l support) t o about
40 percent f o r t h e deck. Except f o r t h e one floorbeam r a t i n g , t h e
r a t i n g s a r e about 25 percent of capaci ty . However, i t should be
5 noted t h a t t h e Manual used f o r r a t i n g i n d i c a t e s a y i e l d poin t of
30 k s i f o r s t e e l made a t t h e time of cons t ruc t ion of t h e Hubby
Bridge, whereas t h e a c t u a l y i e l d s t r e n g t h of t h e steel and wrought
i r o n was 42 k s i and 35 k s i , r e spec t ive ly . Since t h e r a t i n g s do
consider dynamic e f f e c t s and minimum m a t e r i a l p r o p e r t i e s and a r e
a t t h e h igher l e v e l (opera t ing) , t h e r a t i n g s appear t o be q u i t e
conservat ive.
The r e s u l t s do, however, emphasize t h e need t o accura t e ly
determine t h e r e a l l a t e r a l support condi t ions f o r t h e beam, t h e
r e a l i s t i c load d i s t r i b u t i o n i n t h e deck, and t h e a c t u a l ma te r i a l
p rope r t i e s . Although, i n t h i s case , t h e r e were no p o s i t i v e suppor ts ,
t h e n a t u r a l dapping of t h e s t r i n g e r s d i d provide t h i s l a t e r a l support.
Serv ice Load Tes ts - Trusses
F igures 30-32 i l l u s t r a t e t y p i c a l experimental and t h e o r e t i c a l
i n f luence l i n e s obtained from t h e r e s u l t s of t h e s e r v i c e load t e s t s
f o r t r u s s members of the Hubby Bridge and Chestnut Ford Bridge.
The experimental inf luence l i n e s were found by c a l c u l a t i n g t h e
f o r c e s in t h e bar us ing t h e s t r a i n measurements t h a t were recorded f o r
each p o s i t i o n of t h e t ruck. The t h e o r e t i c a l i n f luence l i n e s were

determined by p lac ing a t h e o r e t i c a l t r u c k of t h e same conf igu ra t ion
a s t h e experimental t ruck (Figs. 19 and 20), a t each panel po in t
and c a l c u l a t i n g t h e r e s u l t a n t bar f o r c e us ing determinate a n a l y s i s .
Each of t h e graphs shows t h e t h e o r e t i c a l inf luence Line f o r t h e member
a s a s o l i d l i n e . I n t h e t e s t i n g of t h e two spans of t h e Hubby
Bridge, both t h e nor th and t h e south t r u s s were instrumented. The
experimental inf luence l i n e s f o r both t r u s s e s a r e shown a s broken
l i n e s . Only t h e inf luence l i n e s f o r a t ruck on t h e c e n t e r l i n e of
t h e br idge a r e shown. I n t h e t e s t i n g of t h e one span of t h e
Chestnut Ford Bridge only t h e n o r t h t r u s s was instrumented. The
experimental inf luence l i n e s a r e shown a s broken l i n e s .
The r e s u l t s showed t h a t i n most cases f o r t h e Hubby Bridge and
i n a l l ca ses f o r t h e Chestnut Ford Bridge, t h e experimental r e s u l t s
agree c l o s e l y with t h e t h e o r e t i c a l values. The gene ra l shape of t h e
experimental inf luence l i n e is t h e same a s t h e shape of t h e
t h e o r e t i c a l inf luence l i n e al though t h e magnitude of t h e experimental
va lues is l e s s than t h e magnitude of t h e t h e o r e t i c a l va lues . This
d i f f e r e n c e is due i n p a r t t o the p a r t i a l con t inu i ty of the deck
which was not taken i n t o account i n t h e t h e o r e t i c a l a n a l y s i s , t h e
condi t ion of t h e j o i n t s , a s we l l a s problems i n t h e ins t rumenta t ion .
I n t h e s e r v i c e load t e s t s of both spans of t h e Hubby Bridge t h e mult iple-
channel d a t a a c q u i s i t i o n system was not a v a i l a b l e due t o t e c h n i c a l
problems and, t hus , t h e s t r a i n measurements were taken us ing o l d e r equip-
ment. This requi red a longer time period and meant t h a t va r i ances i n t h e
power l i n e vol tage t o t h e s t r a i n i n d i c a t o r s , i n d i c a t o r d r i f t , and t h e changing
temperature i n t h e br idge members occurred. These changes had an indeterminable
e f f e c t on t h e s t r a i n measurements and r e su l t ed i n unusual behavior i n
s e v e r a l members.
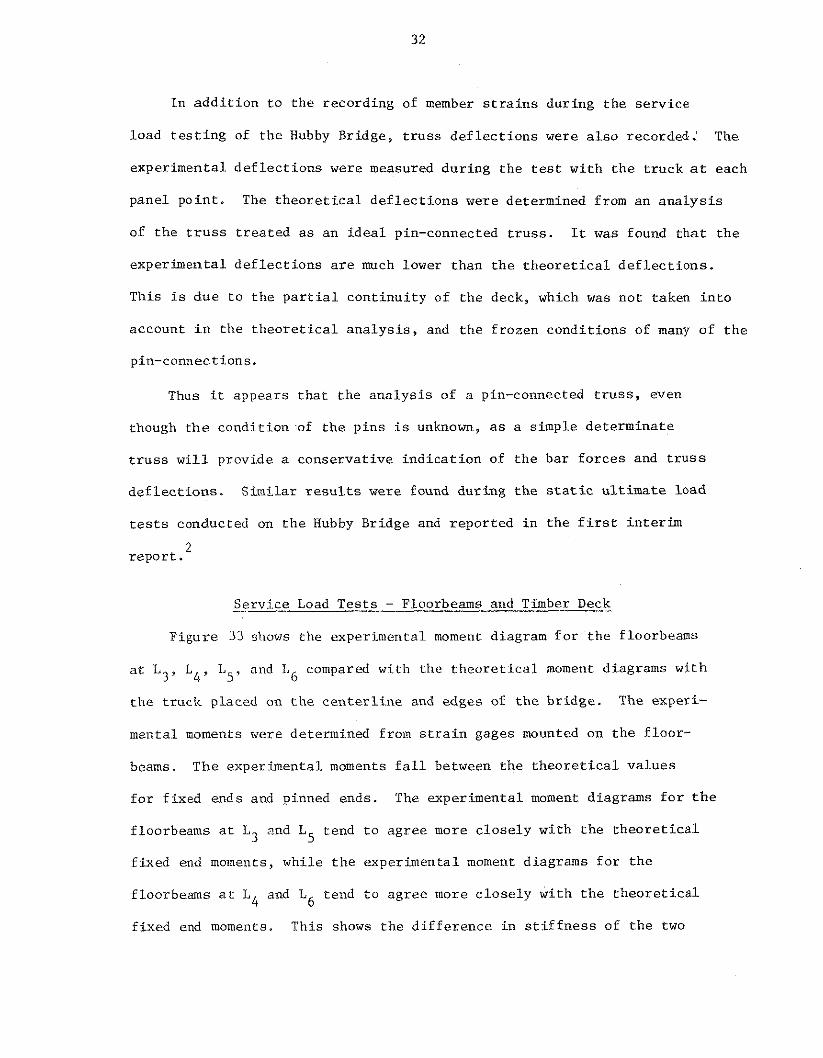
In a d d i t i o n t o t h e recording of member s t r a i n s during t h e se rv ice
load t e s t i n g of t h e Hubby Bridge, t r u s s d e f l e c t i o n s were a l s o recorded. The
experimental d e f l e c t i o n s were measured dur ing t h e t e s t w i th t h e t ruck at each
panel poin t . The t h e o r e t i c a l d e f l e c t i o n s were determined from an a n a l y s i s
of the t r u s s t r e a t e d a s an i d e a l pin-connected t r u s s . It was found t h a t t h e
experimental d e f l e c t i o n s a r e much lower than t h e t h e o r e t i c a l d e f l e c t i o n s .
This is due t o t h e p a r t i a l con t inu i ty of t h e deck, which was not taken i n t o
account i n t h e t h e o r e t i c a l a n a l y s i s , and t h e f rozen condi t ions of many of t h e
pin-connections.
Thus i t appears t h a t the a n a l y s i s of a pin-connected t r u s s , even
though t h e condi t ion of t h e p ins is unknown, a s a simple de terminate
t r u s s w i l l provide a conserva t ive i n d i c a t i o n of t h e bar f o r c e s and t r u s s
d e f l e c t i o n s . S imi lar r e s u l t s were found dur ing t h e s t a t i c u l t i m a t e load
t e s t s conducted on t h e Hubby Bridge and r epor t ed i n t h e f i r s t i n t e r im
r e p o r t . 2
Serv ice Load T e s t s - Floorbeams and Timber Deck
F igure 33 sl~ows t h e experimental moment diagram f o r t h e floorbeams
a t 1, 1, and 1. compared with the t h e o r e t i c a l moment diagrams with 3' L4' 5' 6
t h e t ruck placed on t h e c e n t e r l i n e and edges of t h e br idge . The experi-
mental moments were determined from s t r a i n gages mounted on t h e f l o o r -
beams. The experimental moments f a l l between t h e t h e o r e t i c a l va lues
f o r f ixed ends and pinned ends. The experimental moment diagrams f o r t h e
floorbeams a t L3 nnd L5 tend t o agree more c l o s e l y wi th t h e t h e o r e t i c a l
f ixed end moments, while t h e experimental moment diagrams f o r t h e
floorbeams a t L4 and L tend t o ag ree more c l o s e l y wi th t h e t h e o r e t i c a l 6
f ixed end moments. This shows t h e d i f f e r e n c e i n s t i f f n e s s of t h e two
d i f f e r e n t types of j o i n t s . These r e s u l t s agree wi th t h e r e s u l t s repor ted
i n t h e f i r s t i n t e r im repor t . 2 The r e s u l t s he re a l s o show t h e exceLlent
d i s t r i b u t i o n p r o p e r t i e s of t h e deck.
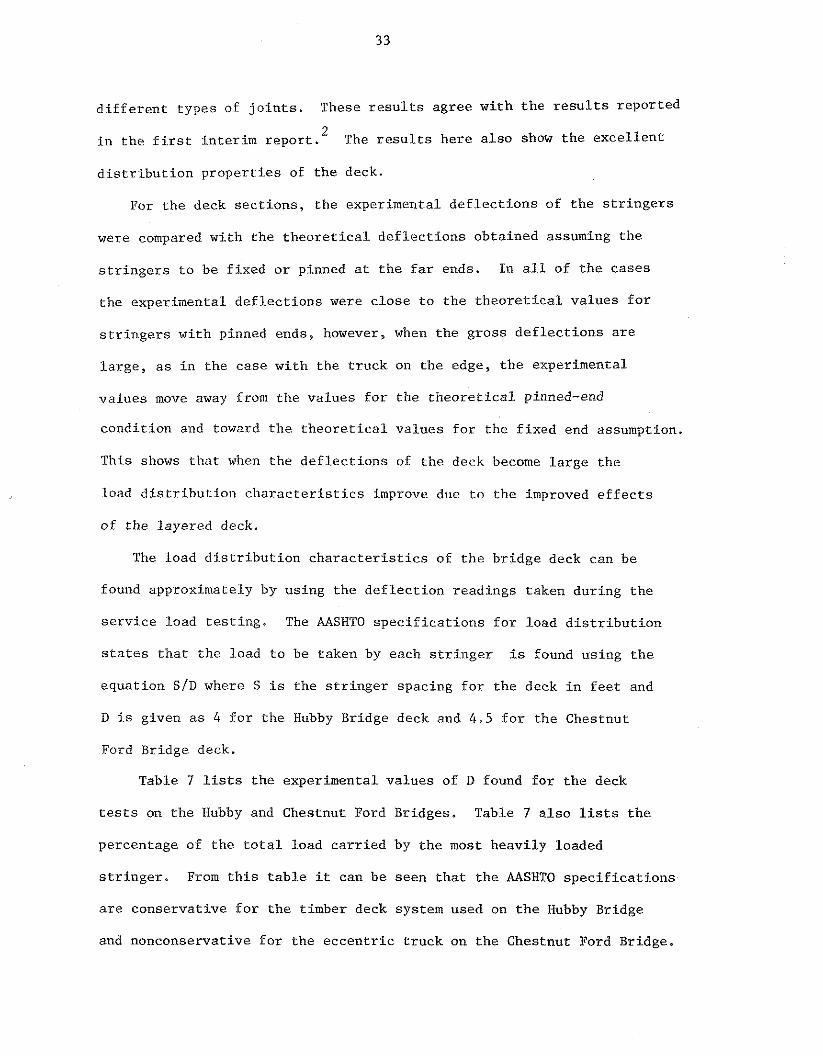
For t h e deck s e c t i o n s , t h e experimental d e f l e c t i o n s of t h e s t r i n g e r s
were compared wi th t h e t h e o r e t i c a l d e f l e c t i o n s obta ined assuming t h e
s t r i n g e r s t o be f ixed o r pinned a t t h e f a r ends. In a l l of t h e cases
t h e experimental d e f l e c t i o n s were c l o s e t o t h e t h e o r e t i c a l va lues f o r
s t r i n g e r s wi th pinned ends, however, when t h e gross d e f l e c t i o n s a r e
l a r g e , a s i n t h e case wi th t h e t r u c k on t h e edge, t h e experimental
va lues move away from t h e va lues f o r the t h e o r e t i c a l pinned-end
condi t ion and toward t h e t h e o r e t i c a l va lues f o r t h e f i x e d end assumption.
This shows t h a t when t h e d e f l e c t i o n s of t h e deck become l a r g e t h e
load d i s t r i b u t i o n c h a r a c t e r i s t i c s improve due t o t h e improved e f f e c t s
of t h e layered deck.
The load d i s t r i b u t i o n c h a r a c t e r i s t i c s of t h e b r idge deck can he
found approximately by using t h e d e f l e c t i o n readings taken dur ing t h e
s e r v i c e load t e s t i n g . The AASHTO s p e c i f i c a t i o n s f o r load d i s t r i b u t i o n
s t a t e s t h a t t h e load t o be taken by each s t r i n g e r is found us ing t h e
equat ion S/D where S i s t h e s t r i n g e r spacing f o r t h e deck i n f e e t and
D is given a s 4 f o r t h e Hubby Bridge deck and 4.5 f o r t h e Chestnut
Ford Bridge deck.
Table 7 l ists t h e experimental va lues of D found f o r t h e deck
t e s t s on t h e Hubby and Chestnut Ford Bridges. Table 7 a l s o lists t h e
percentage of t h e t o t a l load c a r r i e d by t h e most heav i ly loaded
s t r i n g e r . From t h i s t a b l e it can be seen t h a t t h e AASHTO s p e c i f i c a t i o n s
a r e conserva t ive f o r t h e timber deck system used on t h e Hubby Bridge
and nonconservative f o r t h e e c c e n t r i c t ruck on t h e Chestnut Ford Bridge.
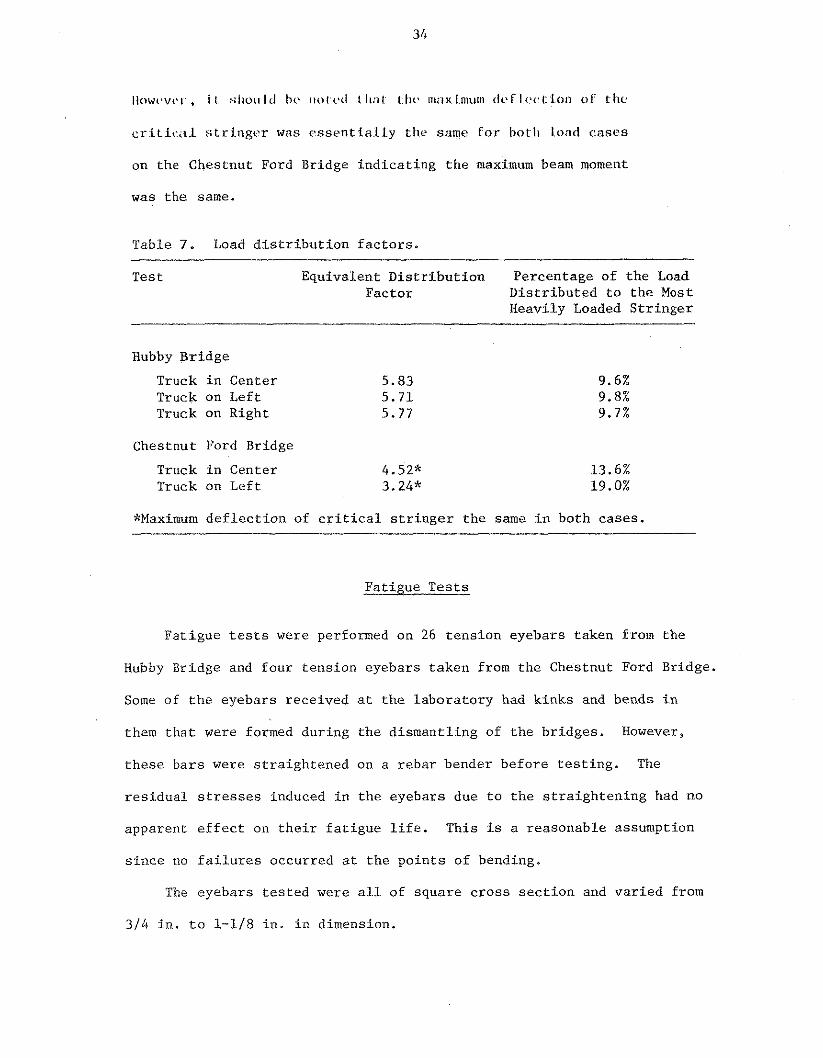
i l < ~ w < . v t . ~ . , i I s l l o i ~ Id ht. I I O I < * ( I l11:11 1:111, III;IX t n ~ u l l ~ c lvf l cv:C 1011 0 1 the.
cri t ici t .1 s t r i n g e r was essentia.L.ly the sixme f o r both load cases
on the Chestnut Ford Bridge ind ica t ing t h e maximum beam moment
was the same.
Table 7. Load d i s t r i b u t i o n f a c t o r s .
Test Equivalent D i s t r i b u t i o n Percentage of the Load Factor Di s t r ibu ted t o the Most
Heavily Loaded S t r i n g e r
Hubby Bridge
Truck i n Center Truck on Lef t Truck on Right
Chestnut Ford Bridge
Truck i n Center 4.52" Truck on Left 3.24"
"Maximum d e f l e c t i o n of c r i t i c a l s t r i n g e r t h e same i n both cases.
Fat igue T e s t s
Fa t igue t e s t s were performed on 26 tens ion eyebars taken from the
Hubby Bridge and four tens ion eyehars taken from the Chestnut Ford Bridge.
Some of t h e eyebars received a t t h e labora tory had k inks and bends i n
them t h a t were formed during the dismantl ing of the bridges. However,
t hese b a r s were s t ra ightened on a rebar bender before t e s t i n g . The
r e s i d u a l s t r e s s e s induced i n t h e eyebars due t o the s t r a igh ten ing had no
apparent e f f e c t on t h e i r f a t i g u e l i f e . This is a reasonable assumption
s i n c e no f a i l u r e s occurred a t t h e po in t s of bending.
The eyebars t e s t e d were a l l of square c ross s e c t i o n and va r i ed from
314 i n . t o 1-118 i n . i n dimension.
Twenty-three of the eyebars were t e s t e d i n t h e i r undamaged (except
f o r s t r a igh ten ing) condit ion. The maximum s t r e s s f o r the t e s t s va r i ed
from 16 t o 24 k s i with a uniform minimum s t r e s s of two k s i . A l l of
t h e eyebars were t e s t e d a t a c y c l i c r a t e of three-four her tz . The
r e s u l t s of the f a t i g u e t e s t s on undamaged eyebars can be found i n
Table 8. This t a b l e lists t h e i d e n t i f i c a t i o n number of the eyebar,
i t s loca t ion on the t r u s s , t he dimensions of t h e ba r s , t he stress
range t h a t t h e bar was subjected to , t he number of cyc les requi red
t o f a i l t he eyebar, and a diagram i l l u s t r a t i n g t h e loca t ion of the
f a i l u r e .
Two of t h e 23 undamaged eyebars f r ac tu red i n one o f the forg ings
jo in ing t h e turnbuckle t o the eyebar. These two eyebars i n i t i a l l y
had l a r g e cracks a t t he poin t of f r a c t u r e p r i o r t o t h e beginning
of the f a t i g u e tests.
The remaining 21 eyebars each f r ac tu red i n one of the eyes of
the eyebar. The f r a c t u r e s i n t h e eyes occurred i n two d i f f e r e n t
places: 1 ) a t the t i p , and 2) a t t he s i d e of the eye. A c a r e f u l
study of Table 8 w i l l show t h a t d i f f e r e n t bar s i z e s gene ra l ly behaved
i n t h e same way except f o r the 718 i n . ba r s which a l l f a i l e d a t
s i g n i f i c a n t l y lower number of s t r e s s cycles . This t a b l e a l s o shows
t h a t t h e two f r a c t u r e s near the turnbuckles occurred a t much lower
numbers of s t r e s s cycles than d id t h e f r a c t u r e s i n t h e eyes.
It is assumed i n the inspect ion and r a t i n g of br idges t h a t t h e
c r i t i c a l s e c t i o n of the eyebar is the s e c t i o n a t a forg ing , where
many small c racks e x i s t . Since i t is impossible t o determine t h e
ex ten t of these cracks by inspect ion , consul tants i n Iowa usua l ly
assume, f o r r a t i n g purposes, t h a t t h e r e i s a reduct ion i n s t r e n g t h

' I 'ohlc 8 . K e s i ~ l L s of 1,111g11~ t ~ ~ s t s on und;im:~grd 1.yvh.1rs.
S t r e s s Number Location Idenei f i c a t i o n Range of of
Number* Pfember Dimensions (ks i ) Cycles Fr~lcture
lee x 1" 14
lrV x 1" 16
1" x 1" 16
Ir' x 1" 16
1" x 1" 18
1" x 1" 18
PVq x 1" 18
1" x Its 20
1" X 1" 20
x 1" 20
1" x 1" 22
* .Prefix 6: indfcaees ehat ehe eyebar came Prom the Chesenue Ford Bridge. A Bndieaees Hubby Bridge,
** Subscript ind ica te s the order o f the t @ e t s on a sin~lgle eyebar.

of the bar of up t o 60 percent. In other words, the forging is
assumed t o be only 40 percent of the strength of the bar.
In the fa t igue t e s t s i t was found that the forgings are usually
not the c r i t i c a l points for fracture. Twenty-one of the 23 eyebars
tes ted fractured i n the eyes and not i n the forgings. This indicates
t ha t the repeated flexing occurring i n the eyes i s the c r i t i c a l
factor determining the remaining fatigue strength of the bar.
Fatigue t e s t s were performed on nine eyebars taken from the Hubby
Bridge i n order t o determine the e f f ec t , i f any, of repa i r s on the i r
fa t igue l i f e . The minimum s t r e s s and maximum s t r e s s f o r a l l of
the t e s t s were two k s i and 18 ks i , respectively ( s t r e s s range of 16 ks i ) .
A l l of the t e s t s were run a t cycl ic r a t e of three-four her tz . The
r e s u l t s of the fatigue t e s t s on these damaged and repaired eyebars
a r e shown i n Table 9.
One of the nine damaged and repaired eyebars tes ted was a bar
tha t was damaged and repaired a t the bridge s i t e an estimated 40 years
ago (Table 9; H 4) . The bar had fractunred a t the forging connecting
the eye t o the bar and the repair consisted of welding the pieces
back together with two addit ional sp l ice bars (one on each s ide) .
The design of the repair was inadequate since the sp l i ce did not
extend very f a r onto the eye. In addition, the weld was of very
poor qual i ty with very l i t t l e penetration in to the base metal. The
fa t igue f a i l u r e occurred a t the point of repair .
Six of the eyebars were damaged and repaired i n the laboratory.
Four of these simulated fractures near an eye and two simulated
fractures near a turnbuckle. The methods of repair f o r these f ractures
were given i n Chapter 4. These repairs proved t o be a t l ea s t a s

Table 9. Resul t s of f a t i g u e t e s t s on dama~ed and repa i red evebars.
Iden t i - Type of S t r e s s f i c a t i o n Repai r Range Number
Number ** Member Dimensions ( k s i ) of Cycles Locat ion o f F rac tu re
* Subsc r ip t i n d i c a t e s t h e o rde r of tes ts on an eyebar.
** 1 i n d i c a t e s damage and r e p a i r t o a f o r g i n g near a turnbuckle. 2 i n d i c a t e s damage and r e p a i r t o a f o r g i n g a t an eye. 3 i n d i c a t e s damage and r e p a i r t o an eye.
t The f r a c t u r e d i d not occur near t h e r e p a i r .
t t T h i s member was damaged and r e p a i r e d i n t h e f i e l d .
strong as the bars since no failures occurred near the repairs.
Upon testing, five of the eyebars fractured in the eyes, and one of
the eyebars fractured in the forging near the eye at the end opposite
from the repaired end.
Table 10 shows the results of the tests of damaged and repaired
eyehars. It can be seen from this table that only two eyehars
repaired in the laboratory fractured due to the presence of a weld.
These fractures occurred at well over 1,000,000 cycles (many more than
could be expected in a normal remaining bridge life) in eyebars that
had been repaired three times. Thus, any of these repair methods
appears to be appropriate for field use. Care, however, should be
taken to provide good quality welding.
Static Tests
Static tests were performed on 17 specimens from eyebars taken
from the Hubby Bridge and the Chestnut Ford Bridge. The specimens
consisted of an eye plus two-four ft. of bar. The bars were of
square, round, and rectangular cross section with seven, four, and
six bars of each size tested, respectively. In addition to these
specimens, two static tests were conducted on specimens consisting
of round bars with turnbuckles. The results of the static tests
are shown in Table 10.
As can be seen in Table 10 all of the round eyebars, including
the two specimens with turnbuckles, fractured in the bars and not in
the eyes or forgings. Of the seven square eyebars tested, four fractured
in the bar and three fractured in the forgings. All of the rectangular
eyebars fractured in the forgings.
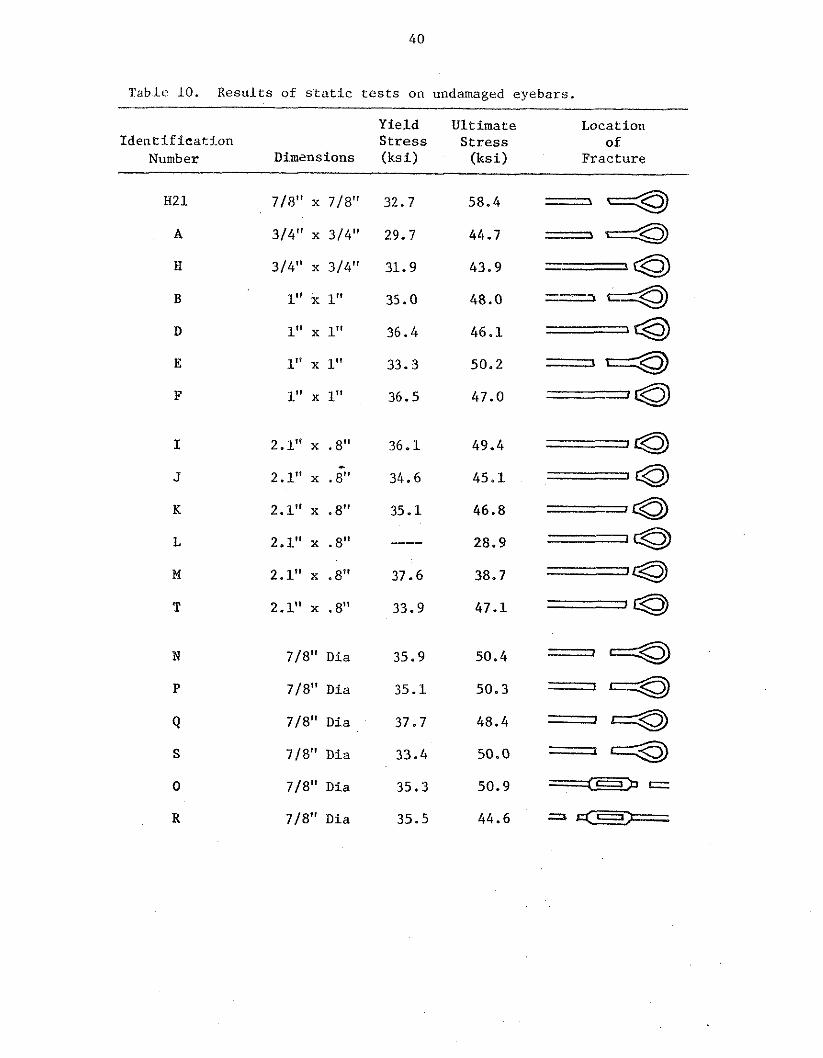
Table 10. Results of static tests on undamaged eyebars.
Yield Ultimate Location Identification Stress Stress of
Number Dimensions (ksi) (ksi) Fracture
718" Dia
718" Dia
718" Dia
718" Dia
718" Dia
718'' Dia
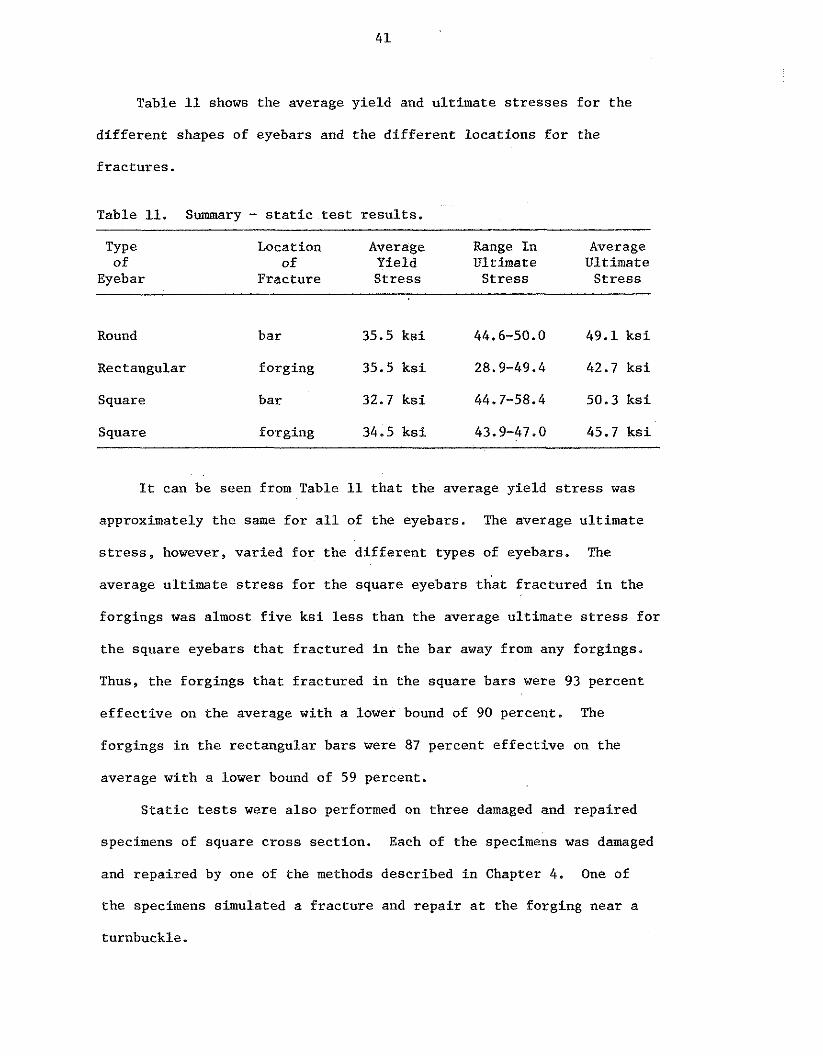
Table 11 shows the average yield and ultimate s t resses fo r the
different shapes of eyebars and the different locations f o r the
f ractures .
Table 11. Summary - s t a t i c t e s t resu l t s .
TYPe Location Average Range In Average of of Yield Ultimate Ultimate
Eyebar Fracture Stress Stress Stress
Round bar 35.5 k s i 44.6-50.0 49.1 k s i
Rectangular forging 35.5 k s i 28.9-49.4 42.7 k s i
Square bar 32.7 ks i 44.7-58.4 50.3 k s i
Square forging 34.5 k s i 43.9-47.0 45.7 k s i
It can be seen from Table 11 tha t the average yield s t r e s s was
approximately the same for a l l of the eyebars. The average ultimate
s t r e s s , however, varied for the d i f fe ren t types of eyebars. The
average ult imate s t r e s s fo r the square eyebars tha t fractured i n the
forgings was almost f i v e k s i l e s s than the average ult imate s t r e s s for
the square eyebars that fractured i n the bar away from any forgings.
Thus, the forgings tha t fractured i n the square bars were 93 percent
e f fec t ive on the average with a lower bound of 90 percent. The
forgings i n the rectangular bars were 87 percent effect ive on the
average with a lower bound of 59 percent.
S t a t i c t e s t s were a lso performed on three damaged and repaired
specimens of square cross section. Each of the specimens was damaged
and repaired by one of the methods described i n Chapter 4. One of
the specimens simulated a f racture and repair a t the forging near a
The r e s u l t s of t h e s t a t i c t e s t s on damaged and r epa i r ed eyebars
arc. sliom~ i n Table 12. I t can be seen from t h i s t a b l e t h a t i f r e p a i r s
LO ~lnrnngi~tl bars a r e n~ildf s i ~ n i l n r l y t o those uscd i n these t e s t s , then
t h e u l t ima te s t r e n g t h of the bar w i l l be unaffected by t h e r e p a i r .
The u l t ima te s t r e n g t h of the bar i s s l i g h t l y l e s s than t h a t
l i s t e d i n Table 1 because t h e stress i n t h e eyebars was c a l c u l a t e d
us ing t h e gross c r o s s s e c t i o n of t h e bar . This shows t h a t a f t e r
s e v e r a l yea r s of r u s t i n g and corroding, t h e b a r s a r e s t i l l a nominal
94 percent e f f e c t i v e .

Tab
le
12
. R
esu
lts
of
sta
tic
te
sts
on
dam
aged
an
d r
ep
air
ed
ey
eb
ars
.
Ide
nti
fic
ati
on
T
ype
of
Yie
ld S
tre
ss
Ult
ima
te S
tre
ss
U
ltim
ate
Fo
rce
Lo
cati
on
of
Num
ber
Rep
air*
D
imen
sio
ns
(ksi
) (k
si)
(kip
s)
Fra
ctu
re
* 1 i
nd
ica
tes
dam
age
and
rep
air
to
a f
org
ing
ne
ar
a t
urn
bu
ck
le
2 in
dic
ate
s da
mag
e an
d
rep
air
to
a f
org
ing
at
an e
ye
3 in
dic
ate
s da
mag
e an
d
rep
air
to
an
ey
e
CHAPTER 6. S W Y
As a result of the construction of the Saylorville Dam and
Reservoir on the Des Moines River, six highway bridges were scheduled
for removal. Two of these, old high-truss pin-connected single-lane
bridges, were selected for a testing program which included ultimate
and service load tests in the field and fatigue and static tests on
tension eyeharsin the laboratory.
Ultimate Load Tests
The purpose of the ultimate load tests was to relate design and
rating procedures presently used in bridge design to the field
behavior of this type of truss bridge. The general objective of the
test program was to provide data on the behavior of this bridge type
in the overload range up to collapse.
The information available on overload and ultimate behavior of
actual bridges is limited mainly to beam-and-slab type bridges.
No information is available on the behavior of the old high-truss
bridges typical of those found in Iowa and throughout other parts
of the country. This load test program is intended to provide that
information on the ultimate load carrying capability through the
testing of a typical old truss bridge.
The test program consisted of ultimate load testing of one span
of the bridge, ultimate load testing of two I-shaped floorbeams, and
ultimate load testing of two panels of the timber deck. The truss
span was tested in an "as is" condition with loads simulating actual
truck loading. After initial failure the truss was damaged and
r e t e s t e d i n t h i s condition. The floorbeams were t e s t e d with loads
t o s imula te an a x l e loading. One of t h e floorbeams had some i n i t i a l
crookedness, while the o ther was e s s e n t i a l l y s t r a i g h t . One of t h e
timber deck t e s t s was performed with loads s imula t ing a t ruck
centered on t h e deck panel and t h e o ther with loads placed th ree f t .
o f f cen te r t o s imulate a t ruck on t h e edge of the deck panel.
The t o t a l u l t ima te load f o r deck t e s t 1 (load centered on
roadway) was 101.5 k ips and f o r deck t e s t 2 (load placed e c c e n t r i c a l l y )
i t was 77.4 k ips . For deck t e s t 1 t h i s i s equivalent t o a load of
25.4 k ips a t each of the load po in t s , wi th t h e corresponding maximum
moment on t h e t o t a l deck panel at 279.4 f t - k i p s o r 17.5 f t -k ips pe r
f o o t of width of t h e deck panel. For deck t e s t 2 t h e equivalent
l o a d and moments a r e 19.4 k i p s , 212.8 f t -k ips , and 13.3 f t -kips pe r
f o o t of width, respect ive ly . It should be noted t h a t although t h e
loads were applied t ransverse ly at 6-foot c e n t e r s (wheel t r ack spacing) ,
t h e r e were two equal loads spaced long i tud ina l ly a t t h e th i rd-poin ts .
The loads, however, can be r e l a t e d t o o ther behavior by determining
t h e equivalent AASHTO H t ruck. For deck test 1 (centered load)
f a i l u r e occurred a t an equivalent H 42 t r u c k and f o r test 2 ( eccen t r i c
load) a t a H 32 truck.
The behavior of t h e deck a t loads up t o f a i l u r e of one of t h e
s t r i n g e r s compared q u i t e w e l l wi th t h a t p red ic t ed by t h e AASHTO
2 S p e c i f i c a t i o n s . The cu r ren t load d i s t r i b u t i o n c r i t e r i a i n d i c a t e
t h a t each s t r i n g e r should be designed f o r about 14 percent of t h e
t o t a l load on t h e bridge. The test r e s u l t s gave only about 10 percent
f o r a centered load, but f o r the e c c e n t r i c severe loading, t h e most
heav i ly loaded s t r i n g e r c a r r i e d about 15 percent of the t o t a l load.
The initial failure of the truss took place at n load of 133 kips.
This failure was the breaking of one of the hangers which made up
member L M The applied loading was 106 kips and 27 kips at L5 5 5'
and L4, respectively. Additional load was applied in an attempt to
get additional members to fail. A large distortion of the lower
chord of the truss near the load at L5 occurred under this higher
loading without any failure. The maximum load under this general
loading was 140 kips (H 70 truck), 112 kips at L5, and 28 kips at L4.
The maximum vertical deflection at L5 at this time was 15 inches.
The fracture load for the vertical failure was 97 percent of the
calculated load based on the full section. The fracture section
confirmed that the section was nearly fully fused. This compares
to the "40 percent effective" used by many designers in evaluating
structures of this type.
After adjustment of the loading system, all load was applied at
L4 with the maximum load being 78.5 kips. The test program then
included damaging a member. After member L U was cut completely 2 2
through, a load of 39 kips produced failure of the truss. This
resulted in a vertical displacement of the member at the cut location.
The maximum load applied to the floorbeam at L4 was 66.0 kips.
The compression flange of this floorbeam was originally straight
(within allowable tolerances). This load was approximately equal
to that determined from theory.
The maximum load applied to the floorbeam at L5 was 50.0 kips.
This floorbeam had an initial crookedness of approximately 13/16 in.

Service Load and Supplementary Tests
The purpose of the service load tests was to relate design and
rating procedures presently used to the field behavior of this type
of truss bridge. Another objective of this phase of the program was
to provide data on the behavior of this bridge type in the service
load range and also, data on the remaining fatigue life of the
tension members in the truss.
The information available on service-load behavior of actual
bridges is limited mainly to beam-and-slab type bridges. This test
program was intended to provide information on the behavior of high-
truss bridges.
The test program consisted of service load testing two spans of
the Hubby Bridge plus one span of the Chestnut Ford Bridge, and fatigue
and static testing of eyebars received from the above mentioned
bridges. The service load tests were performed using loaded county
gravel trucks (approximately H 15) to apply the loads to the bridges.
Strain readings were taken to determine the forces in members
of the trusses. Also, deflection readings were taken of the trusses
in one span and of the deck and strain readings in the floorbeams to
determine the moments.
The experimental forces in the members of the truss agreed with
the forces found theoretically using a determinate analysis. There
were some discrepancies but these were mainly due to problems in
the instrumentation. The experimental deflections of the trusses in
one span were found to be much smaller than the theoretical deflections.
This was due t o the p a r t i a l con t inu i ty of the deck which was not
taken i n t o account i n t h e t h e o r e t i c a l ana lys i s , and a l s o due t o
t h e p a r t i a l r i g i d i t y of t h e j o i n t s .
Deck d e f l e c t i o n s were measured a t t h e middle of t h e pane l s with
t h e t ruck on the c e n t e r l i n e of the bridge and on the edges of the
bridge. The experimental d e f l e c t i o n s were between t h e t h e o r e t i c a l
va lues f o r s t r i n g e r s assuming f ixed ends and assuming pinned ends.
The behavior of t h e deck compared q u i t e we l l with t h a t predic ted by
4 t h e AASHTO Spec i f i ca t ions . The current load d i s t r i b u t i o n c r i t e r i a ,
assuming S / 4 a s the d i s t r i b u t i o n f ac to r , i n d i c a t e s t h a t f o r t h e
Hubby Bridge each s t r i n g e r should be designed f o r about 14 percent
of t h e t o t a l weight of t h e t ruck (28 percent of a wheel load, f ron t
and r e a r ) . The t e s t r e s u l t s indica ted a d i s t r i b u t i o n va lue of 10
percent t o each s t r i n g e r f o r both t h e centered load and t h e e c c e n t r i c
load. For t h e Chestnut Ford Bridges, however, t h e cu r ren t load
d i s t r i b u t i o n c r i t e r i a , assuming S l 4 . 5 a s the d i s t r i b u t i o n f a c t o r ,
i n d i c a t e s t h a t each s t r i n g e r should be designed f o r 14 percent of the
t o t a l weight of t h e t ruck. The t e s t r e s u l t s i n d i c a t e a va lue of 14
percent f o r the centered load and 19 percent f o r t h e e c c e n t r i c load.
Moment c ross s e c t i o n s f o r the floorbeams were found experimental ly
with the r e a r a x l e of t h e t ruck located over the floorbeams. The
experimental r e s u l t s were between the t h e o r e t i c a l va lues f o r a floorbeam
assumed f ixed a t t he ends and assumed pinned a t t h e ends. Floorbeams
3 and 5 from the Hubby Bridge tended t o behave more c l o s e l y t o the
pinned end assumption while floorheams 4 and 6 tended t o ag ree more
c l o s e l y with the f ixed end assumption.
In the f a t i g u e t e s t s of the tens ion eyebars i t was found t h a t
t h e eye of t h e bar tended t o be more susceptable t o f a t i g u e f a i l u r e
than the forg ings a t t he i n t e r s e c t i o n between the eye and t h e bar.
Twenty-one of t h e 23 undamaged b a r s f r ac tu red i n t h e eye while t h e
remaining two eyebars f r ac tu red i n forg ings , where l a r g e i n i t i a l
c racks were present . Of t h e n ine eyebars t h a t were damaged and repa i red
and then t e s t e d i n f a t igue , only one eyebar f a i l e d i n the f irst
r e p a i r and i t was a r e p a i r t h a t had been made i n t h e f i e l d over 40
yea r s ago.
I n t h e s t a t i c t e s t s d i f f e r e n t types of eyebars were found t o
f a i l i n d i f f e r e n t fashions b u t cons i s t en t f o r the p a r t i c u l a r type.
A l l of t h e rec tangular eyebars f r ac tu red i n the forg ings whi le a l l
of the round eyebars f r ac tu red i n t h e b a r s away from t h e forg ings .
The square b a r s f r ac tu red both i n t h e forg ings a s we l l as i n the
bars . The minimum percentage of e f f e c t i v e n e s s found i n the tests
was 59 percent . This compares with the 40 percent e f f e c t i v e r u l e
usua l ly assumed f o r r a t i n g of eyebars a s commonly used i n Iowa.
The f a t i g u e s t r e n g t h of the eyebars var ied over a wide range,
but it was seen t h a t f o r a stress range of 14 k s i , t h e f a t i g u e l i f e
of t h e ba r s was approaching 2,000,000 cycles. I n the Hubby Bridge,
an H 10.7 t ruck , i n the eccen t r i c p o s i t i o n with an included impact
f a c t o r of 30 percent w i l l produce a l i v e load s t r e s s range i n a
hanger of 14 k s i s t r e s s range. For t h e Chestnut Ford Bridge an H 18.3
w i l l produce t h e same stress range. Assuming 10 loaded t r u c k s of
t h i s type a day, every day of t h e year , i t would take 28 yea r s t o
reach 100,000 cycles.

It can be seen from this that the weight of this type of truck
is substentially more than that usually carried by the bridges and
~hus, it would noL be expected that there would be any reduction in
the fatigue life of the members. This was observed in the overall
results of the fatigue study.
CHAPTER 7 . CONCLUSIONS
As a result of the tests performed on these two bridges, the
following conclusions were reached.
Ultimate Load Tests
1. The behavior of the timber deck was linear up to about
one-half of the ultimate load for each deck test.
2. For deck test 1 (centered load) the design percentage of the
total load distributed to the most heavily loaded stringer,
based on the AASHTO Specifications, is greater than the
experimental percentage of the load distributed to the most
heavily loaded stringer based on the deck deflection at all
load levels for which this is valid.
3 . The theoretical capacity of the deck for deck test 1 is
approximately equal to the experimentally determined capacity of
the deck.
4. For deck test 2 (eccentric load) the design percentage of the
total load distributed to the must heavily loaded stringers,
based on the AASHTO Specifications, is equal to or less than
the experimental percentage of the load distributed to the most
heavily loaded stringers based on the deck deflection at all
load levels for which this is valid.
5. The theoretical capacity of the deck for deck test 2 is
approximately equal to the experimentally determined capacity
of the deck.
6. The deflections of the timber deck for both tests generally
lie within the theoretical bounds.
7. The experimentally determined forces for the truss members agree
closely with the forces for the same members from analysis. This
indicates that the assumption of pinned end members is valid for
this particular truss.
8. The theoretical capacity of the hangers at L5 agrees quite
closely with the load that actually caused the fracture of one
of these hangers.
9 . The current practice of assuming the "lap" of an eye-bar to
be only 40 percent effective is quite conservative. (Additional
tests are required before any recommendation on changing this
assumption is warranted).
10. The natural dapping of the stringers provides sufficient lateral
support of the floorbeam up to approximately 60 percent of the
ultimate load.
11. The theoretical capacity of each floorbeam was approximately
equal to the actual capacity of each floorbeam.
12. The ratings of the bridge and its components average about 25
percent of capacity. The ratings were fairly consistent except
for the floorbeams, where the assumption on lateral support
conditions for the compression flange caused considerable
variation
Service Load Tests
1. Fatigue fractures tend to be governed by the characteristics
of the eye while the static fractures tend to be governed
by the quality of the forgings.
2. The fatigue life of the eyebars after being damaged and
repaired was not appreciably different from that of an
undamaged eyebar.
3. The experimentally determined forces of the truss members
for both the Hubby Bridge and Chestnut Ford Bridge agree
closely with the forces found from the theoretical analysis
assuming pinned connections, this indicates that the assumption
of pinned end members is valid for these particular trusses.
4. Since the truck used for the experimental loading was
approximately an H 15 and all ratings for the critical bridge

2 components provided by the cooperating agencies were less
than H 15 (ranged from H 2 - H 13), the results show that
dctermi~lacc methods are va:Iid for analyzing the bridgc Eor
loads :in the range of rating levels.
5. The current practice of assuming the "lap", or forging, in
an eyebar to be only 40 percent effective is conservative.
The minimum found during testing was 59 percent.
6. The current AASHTO Load Distribution criteria for the Hubby
Bridge of S/4 is more than adequate (514.5 could be used
if it is considered to be a multiple layer bridge deck.)
7. The current AASHTO Load Distribution criteria for the Chest-
nut Ford Bridge deck of 514.5 (strip type deck) agrees very
closely to the centrally loaded truck but does not agree
with the truck when in the eccentric position. This may
be misleading in that the maximum deflection measured in
each case was essentially the same i.., the same maximum
moment).
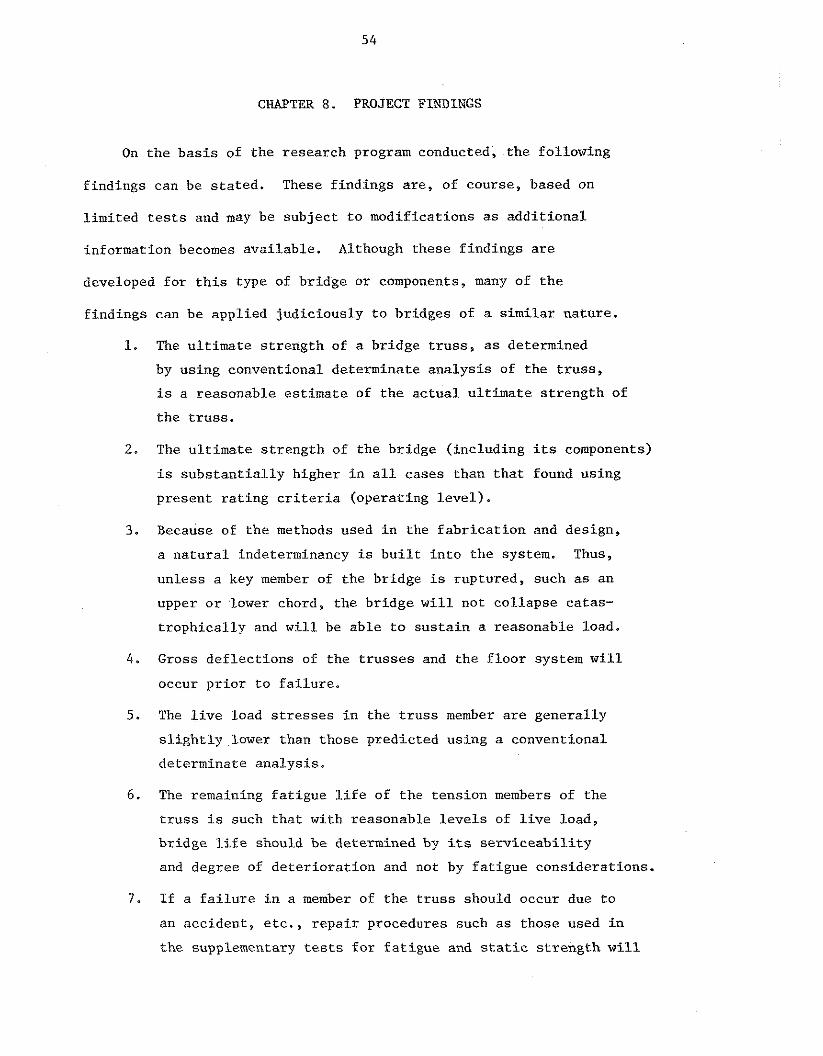
CHAPTER 8. PROJECT FINDINGS
On the basis of the research program conducted, the following
findings can be stated. These findings are, of course, based on
limited tests and may be subject to modifications as additional
information becomes available. Although these findings are
developed for this type of bridge or components, many of the
findings can be applied judiciously to bridges of a similar nature.
1. The ultimate strength of a bridge truss, as determined
by using conventional determinate analysis of the truss,
is a reasonable estimate of the actual ultimate strength of
the truss.
2. The ultimate strength of the bridge (including its components)
is substantially higher in all cases than that found using
present rating criteria (operating level).
3. Because of the methods used in the fabrication and design,
a natural indeterminancy is built into the system. Thus,
unless a key member of the bridge is ruptured, such as an
upper or lower chord, the bridge will not collapse catas-
trophically and will be able to sustain a reasonable load.
4. Gross deflections of the trusses and the floor system will
occur prior to failure.
5. The live load stresses in the truss member are generally
slightly lower than those predicted using a conventional
determinate analysis.
6. The remaining fatigue life of the tension members of the
truss is such that with reasonable levels of live load,
bridge life should be determined by its serviceability
and degree of deterioration and not by fatigue considerations.
7. If a failure in a member of the truss should occur due to
an accident, etc., repair procedures such as those used in
the supplementary tests for fatigue and static strength will
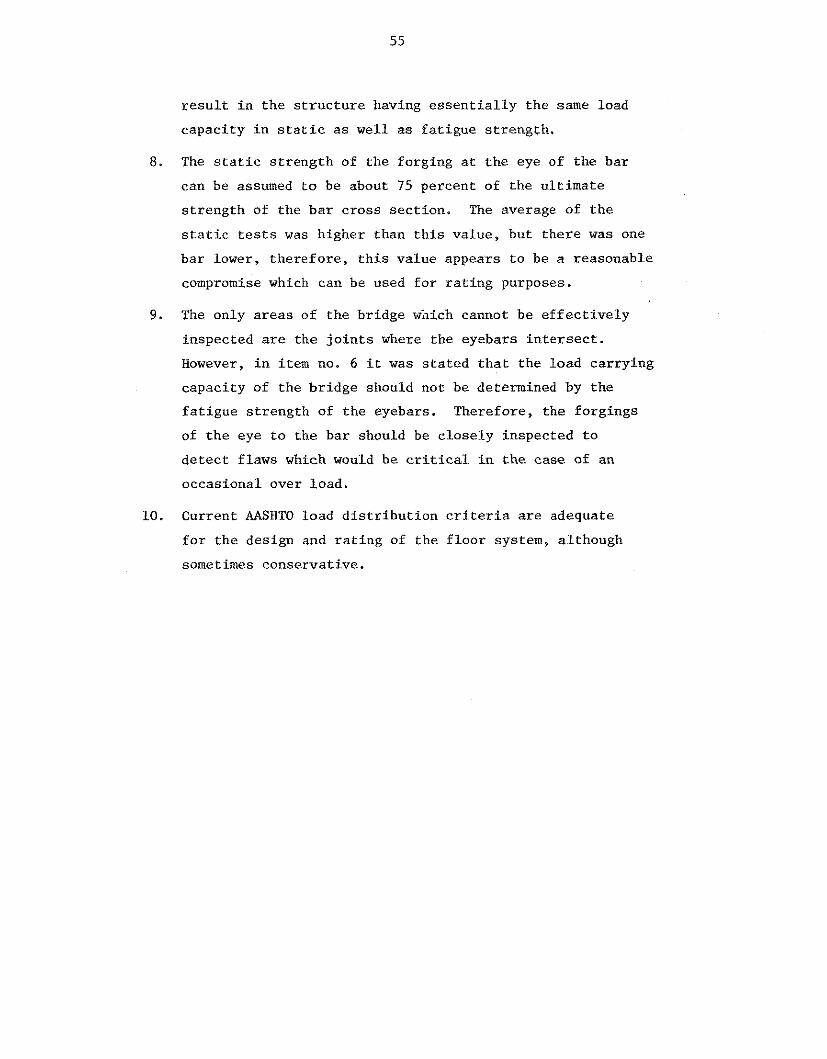
r e s u l t i n t h e s t r u c t u r e having e s s e n t i a l l y the same load
capaci ty i n s t a t i c a s wel l a s f a t i g u e s t r eng th ,
8. The s t a t i c s t r e n g t h of t h e forging a t t h e eye of the bar
can be assumed to be about 75 percent of t h e u l t ima te
s t r e n g t h of the b a r c ross sec t ion . The average of t h e
s t a t i c t e s t s was higher than t h i s va lue , but the re was one
bar lower, t he re fo re , t h i s value appears t o be a reasonable
compromise which can be used f o r r a t i n g purposes.
9. The only a r e a s of the bridge which cannot be e f f e c t i v e l y
inspected a r e t h e j o i n t s where the eyebars i n t e r s e c t .
However, i n item no. 6 i t was s t a t e d t h a t the load car ry ing
capaci ty of t h e b r idge should not be determined by the
f a t i g u e s t r eng th of the eyebars. Therefore, t he forg ings
of t h e eye t o the bar should be c lose ly inspected t o
d e t e c t f laws which would be c r i t i c a l i n t h e case of an
occas ional over load.
10. Current AASIlTO load d i s t r i b u t i o n c r i t e r i a a r e adequate
f o r the design and r a t i n g of the f l o o r system, al though
sometimes conservat ive.

REFERENCES
1. Sanders, W. W., Jr. and H. A. Elleby. " F e a s i b i l i t y Study of Dynamic Overload and Ult imate Load T e s t s of Full-Scale Highway Bridges." F i n a l r epor t t o Iowa S t a t e Highway Comiss ion , Engineering Research I n s t i t u t e , Iowa S t a t e Univers i ty , Ames, January 1973.
2. Sanders, W. W . , Jr . , F. W. Kla iber , H. A. Elleby and L. W. Timm, "Ultimate Load Behavior of Ful l-Scale Highway Truss Bridges: Phase I - Ultimate Load T e s t s of t h e Hubby Bridge - Boone County." In ter im repor t t o Iowa S t a t e Highway Commission, Engineering Research I n s t i t u t e , Iowa S t a t e Un ive r s i ty , Ames, A p r i l 1975.
3. Sanders, W. W . , Jr., H. A. El leby, F. W. Klaiber and M. D. Reeves, "Ultimate Load Behavior of Ful l-Scale Highway Truss Bridges: Phase I1 - Serv ice Load and Supplementary Tests ." In t e r im r e p o r t t o Iowa Department of Transpor ta t ion , Engineering Research I n s t i t u t e , Iowa S t a t e Univers i ty , Ames, August 1975.
4. American Associa t ion of S t a t e Highway O f f i c i a l s . Standard S p e c i f i c a t i o n s f o r Highway Bridges - Eleventh Edi t ion . American Associa t ion of S t a t e Highway O f f i c i a l s , Washington, D.C., 1973.
5. American Associa t ion of S t a t e Highway O f f i c i a l s . Manual For Maintenance Inspec t ion of Bridges. American Associa t ion of S t a t e Highway O f f i c i a l s , Washington, D.C. , 1970.

ACKNOWLEDGMENTS
This report summarizes the results of a research program designed
to study the service load and ultimate load behavior of full-scale
highway truss bridges. The program is being conducted by the
Engineering Research Institute of Iowa State University and is funded
by the Highway Division - Iowa Department of Transportation and the
Federal Highway Administration with supplemental funding by the
Engineering Research Institute. In addition to these direct sponsors,
services were provided for the research by Boone County (County
Engineer's Office), Dallas County (County Engineer's Office), and the
U.S. Army - Corps of Engineers. The Hubby Bridge and the Chestnut
Ford Bridge were provided through the cooperation of these agencies.
The staff for the University were all from the Structural Engineering
Section of the Department of Civil Engineering. The principal staff
included Dr. W. W. Sanders, Jr. (Project Investigator), Dr. H. A. Elleby
(Co-Investigator), and Dr. F. W. Klaiber. Assisting in the research
were faculty members (Dr. M. L. Porter, Dr. L. F. Greimann and Professor
D. D. Girton), graduate students (L. W. Timm, M. D. Reeves, J. P.
Sorensen, L. P. Selberg, and K. A. McDowell), and undergraduate students
(T. C. Wilson and J. W. Coleman).
An Advisory Committee was formed to assist and guide the research
program. The committee consisted of representatives of the affected
agencies and included:
W. W. Sanders, Jr., Iowa State University (Chairman) H. A. Elleby, Iowa State University S. E. Roberts, Iowa Department of Transportation J. P. Harkin, Iowa Department of Transportation E. J. O'Conner, Iowa Department of Transportation
W. D. Ashton, U.S. Army - Corps of Engineers S. S. Bhala, Federal Highway Administration C. F. Schnoor, Boone County (County Engineer) G. R. Hardy, Dallas County (County Engineer) R. E. Van Gundy, Polk County (County Engineer)
The authors wish to express their appreciation to their University
colleagues, the members of the Advisory Committee, and the representatives
of all cooperating agencies for their support and efforts during this
research. Appreciation is also due C. F. Galambos of the Office of
Research, FHWA, for his encouragement and comments. Special appreciation
is expressed to C. F. Schnoor, Boone County Engineer, G. R. Hardy,
Dallas County Engineer, and W. D. Ashton, U. S, Army - Corps of Engineers, for their support in making this program a success. We also wish to
thank Mrs. Janet R. Peterson, Secretary, for her efforts during the
conduct of the research and the preparation of this report.

59
FIGURES
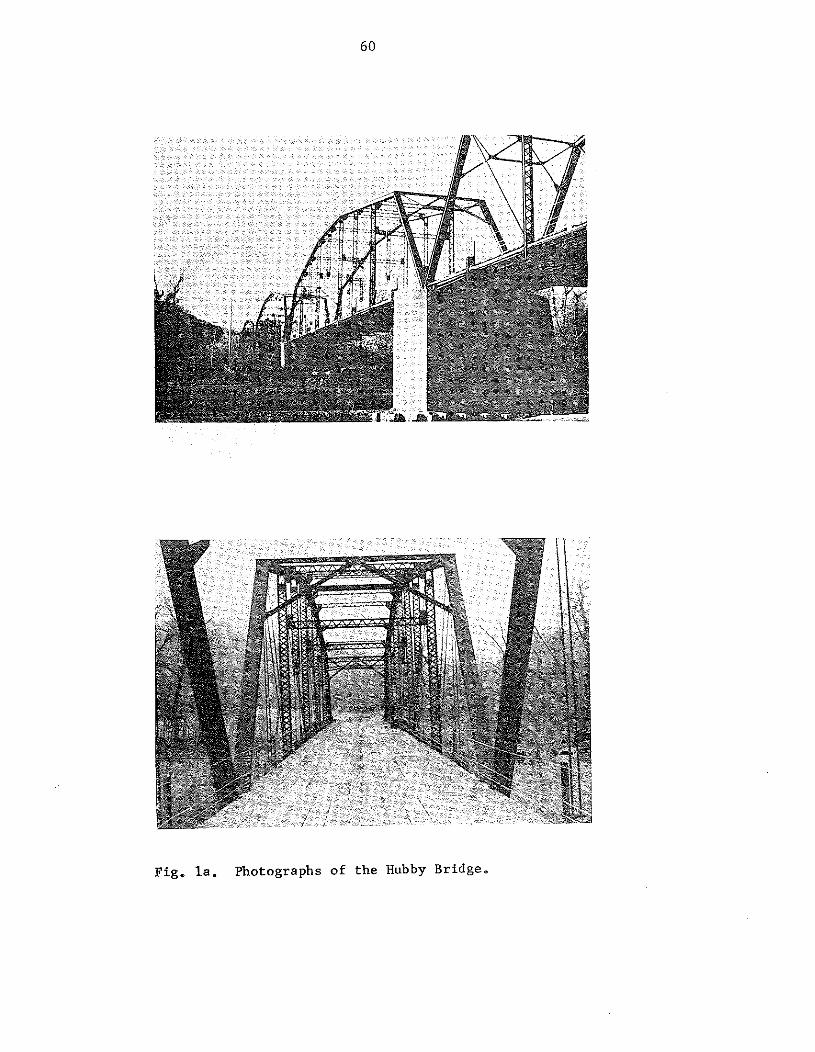
Fig. l a , Photographs o f t h e Hubby Bridge.
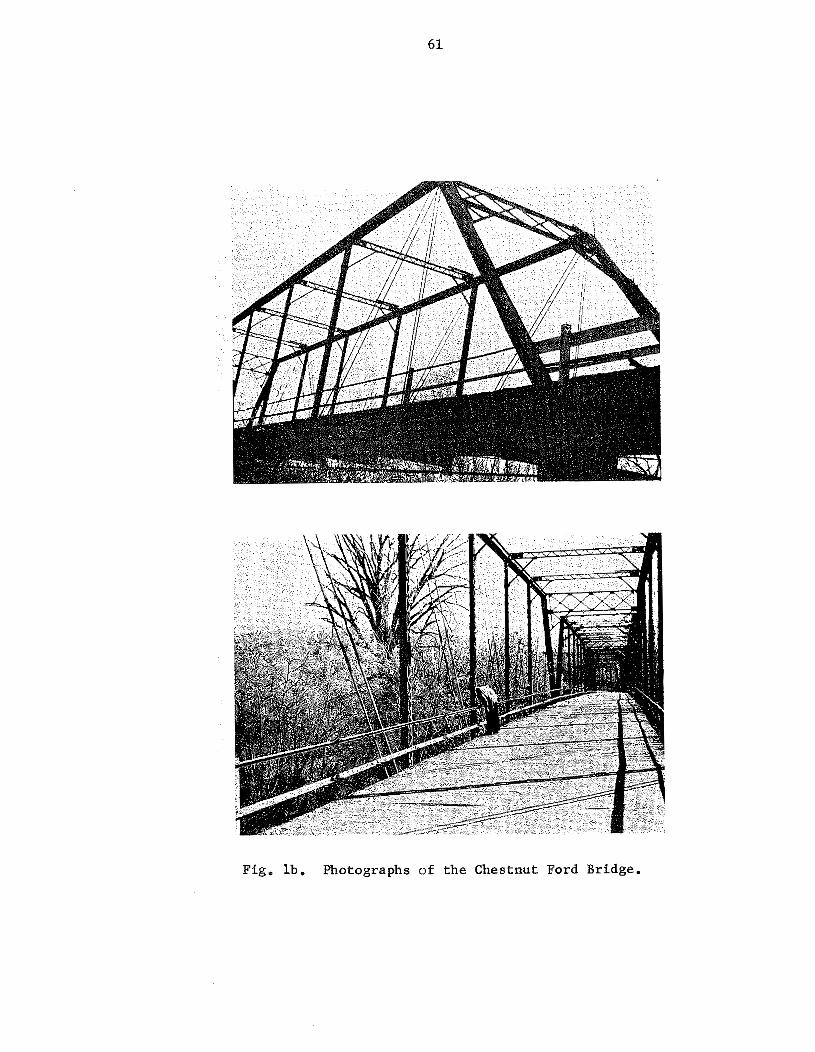
Fig. l b . Photographs of the Chestnut Ford Bridge.
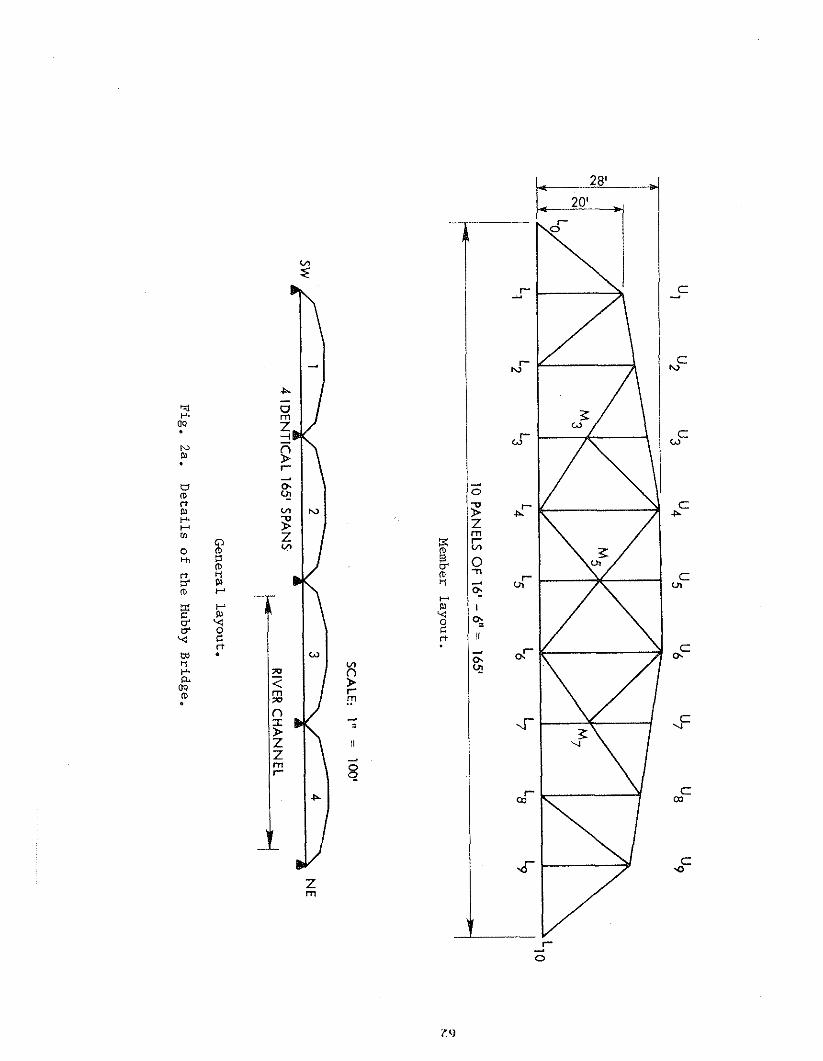
10 PA
NE
LS O
F 16' - 6" =
165' *
5- M
ember
lay
ou
t. s
SCA
LE: 1"
=
100'
1 SW
N
E A
4 IDE
NT
ICA
L 165' S
PA
NS
i- RIVER C
HA
NN
EL
- -
Gen
eral
lay
ou
t.
Fig
. 2
a.
De
tails o
f th
e H
ubby B
ridg
e.


SCALE: I " = 3'
a, Elevat ion view.
SCALE: 1" = 4'
b. End view.
Fig. 3 . Timber deck layout - Hubby Bridge.
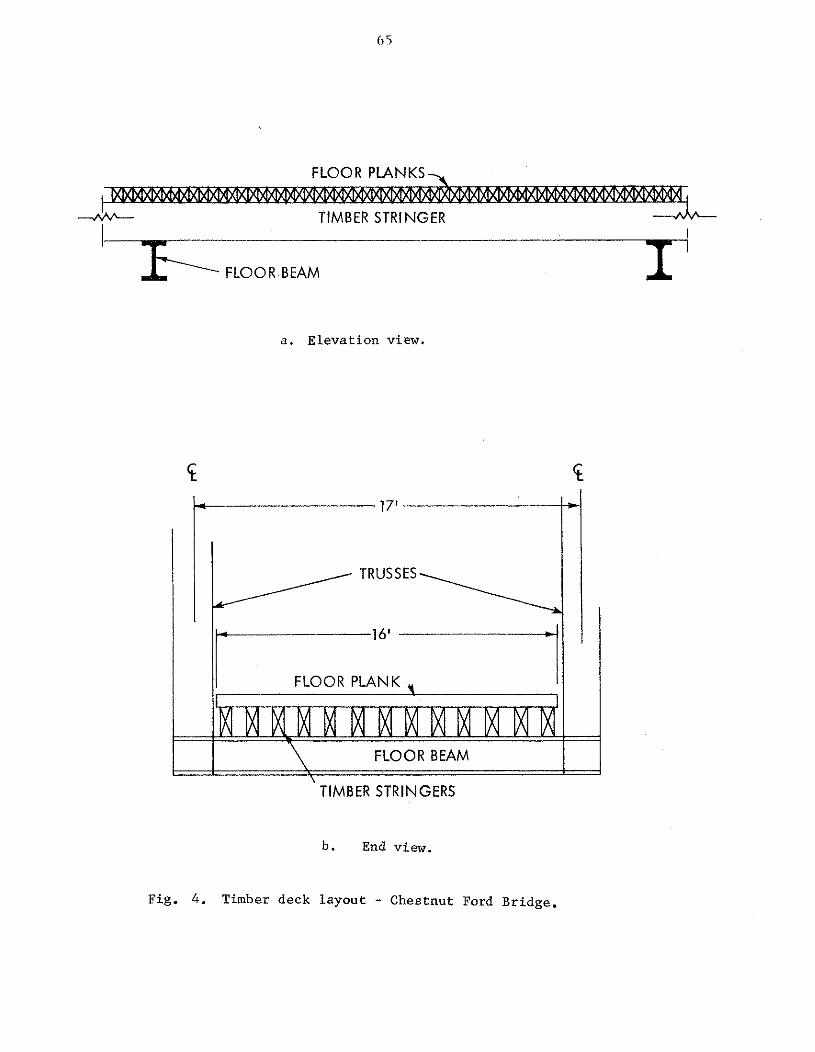
FLOOR PLANKS-
TIMBER STRINGER ---&
'KooR BEAM I' a. Elevation view.
TIMBER STRINGERS
b. End view.
Fig. 4. Timber deck layout - Chestnut Ford Bridge.
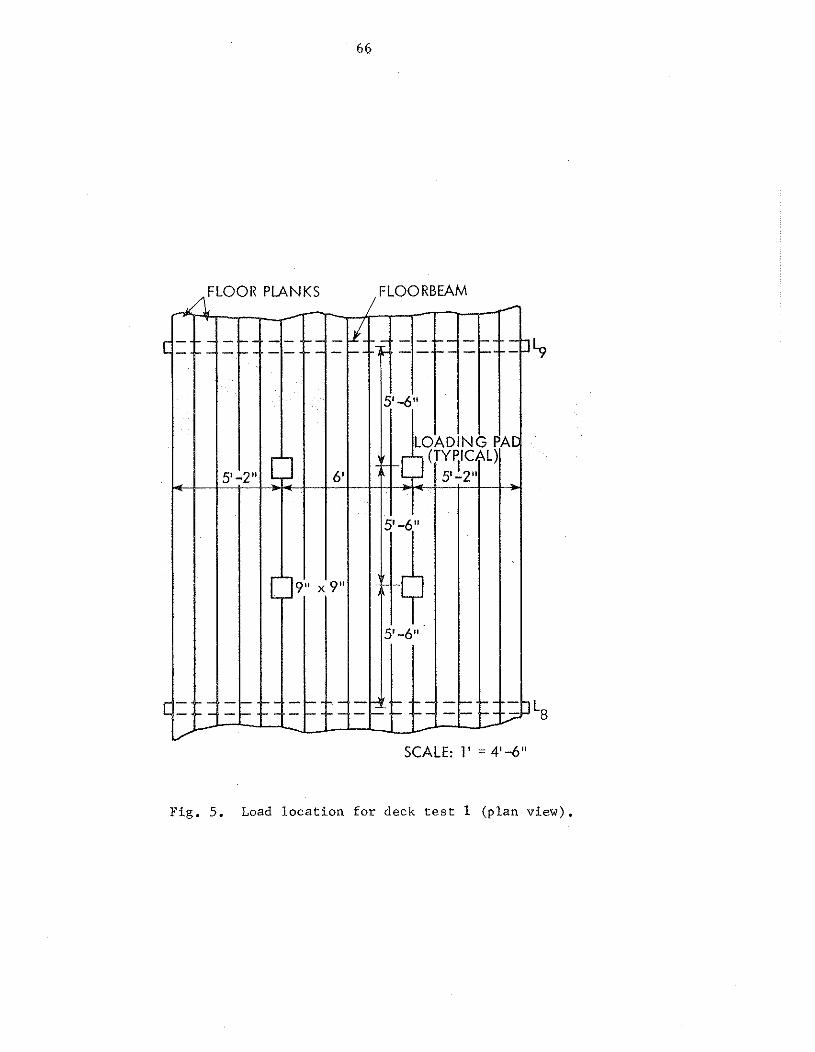
Fig . 5. Load l o c a t i o n f o r deck tes t 1 (p lan view).
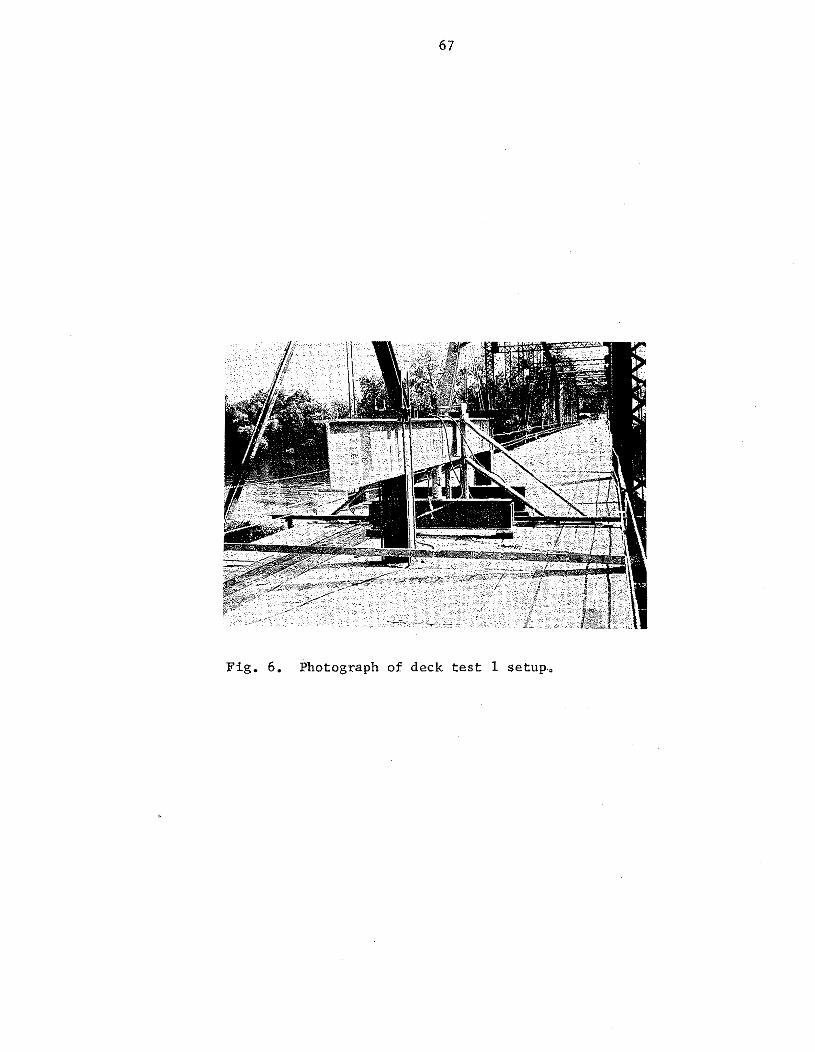
Fig. 6 . Photograph of deck t e s t 1 setup.,
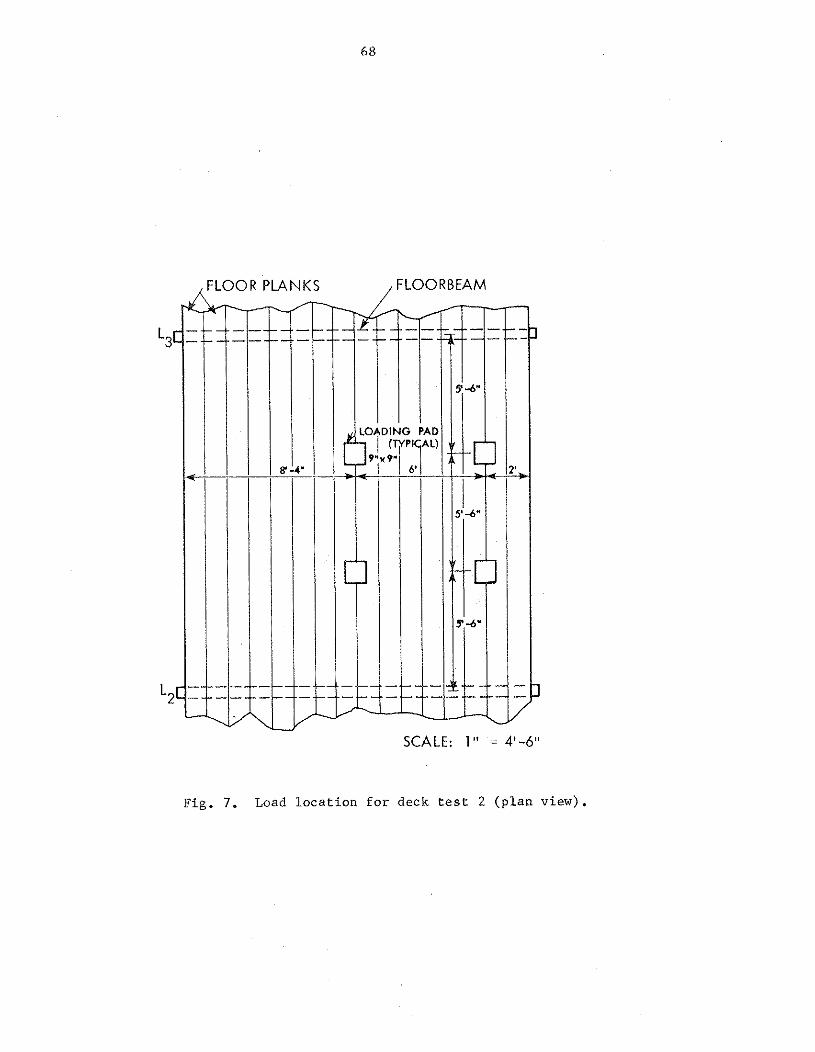
Fig. 7. Load l o c a t i o n f o r deck t e s t 2 ( p l a n view).
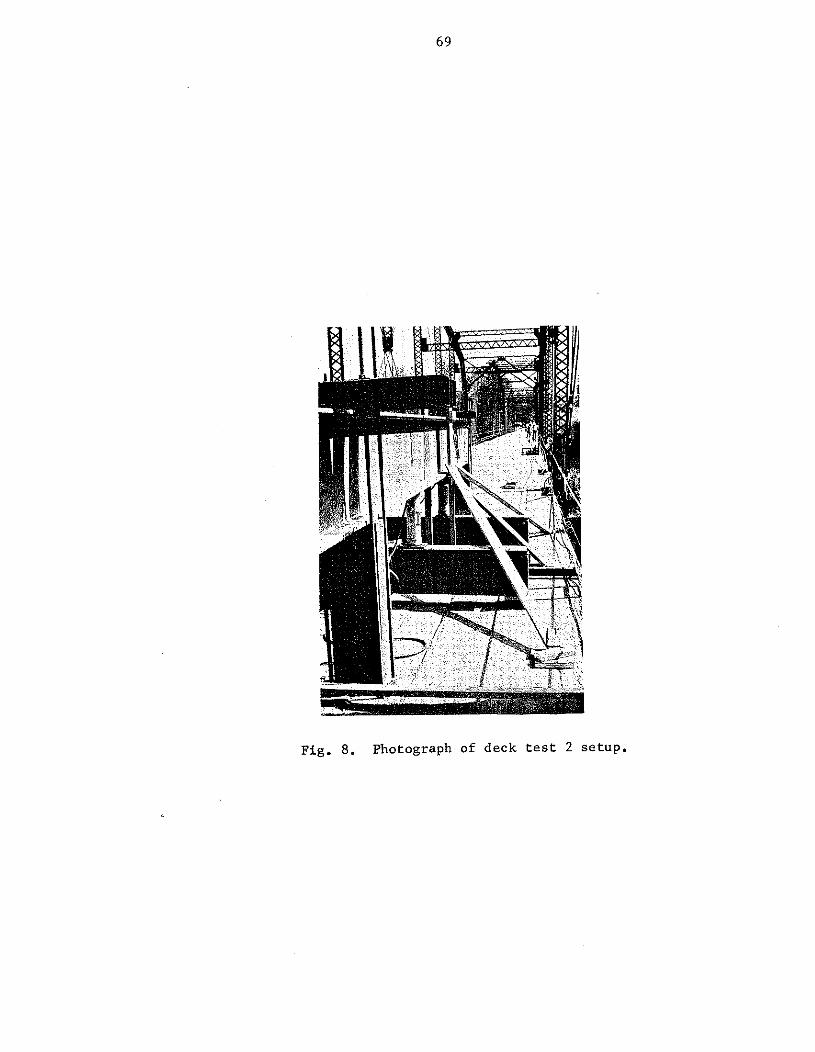
Fig. 8. Photograph of deck test 2 setup.
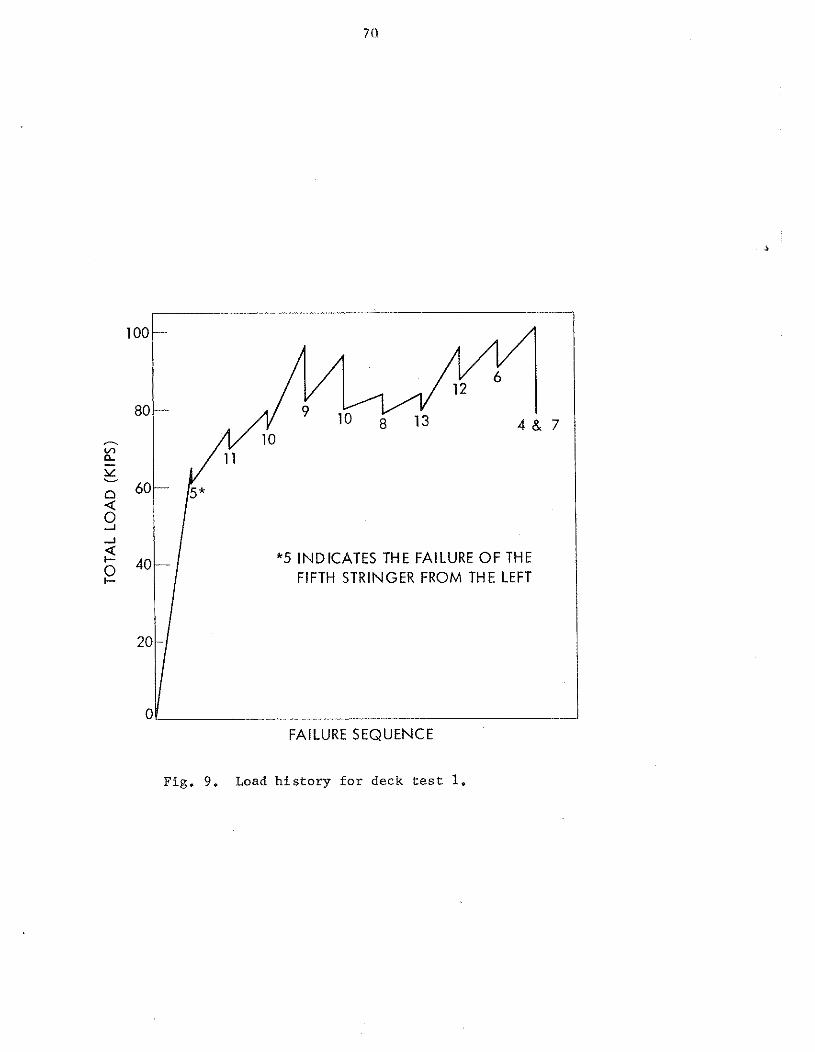
-I
-I
40 *5 INDICATES THE FAILURE OF THE 0 + FIFTH STRINGER FROM THE LEFT
FAILURE SEQUENCE
Fig. 9. Load h i s t o r y f o r deck t e s t 1.

80 -- --
60 - - lA 1 1 Y - D
"15 INDICATES THE FAILURE OF THE FIFTEENTH STRINGER FROM THE LEFT
-- FAILURE SEQUENCE
P i g . 10. Load h f a t o r y l o r deck t e a t 1 .
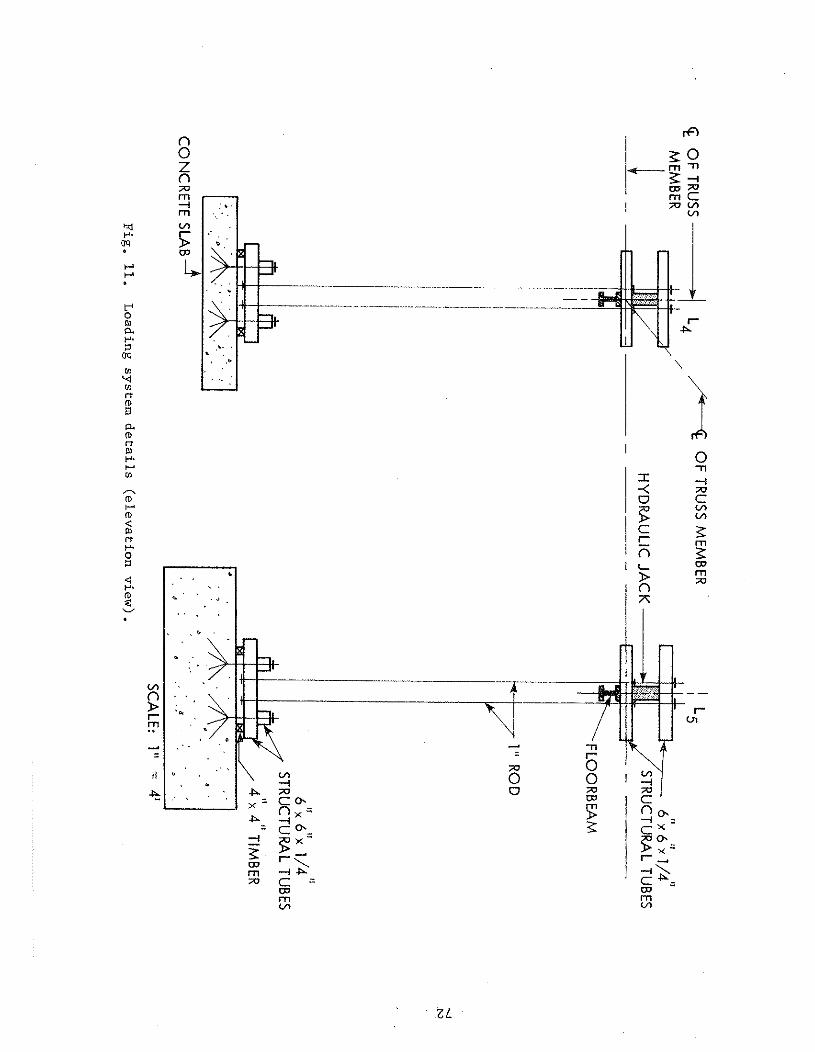


Fig.
Fig.
Photograph o f f a i l u r e
showing loca t ion of member L M
5 5'
Photograph of f r ac tu re .

Fig. , Photograph of damaged member a f t e r co l l aps ing upon i t s e l f .
i g . Photograph floorbeam t se tup .

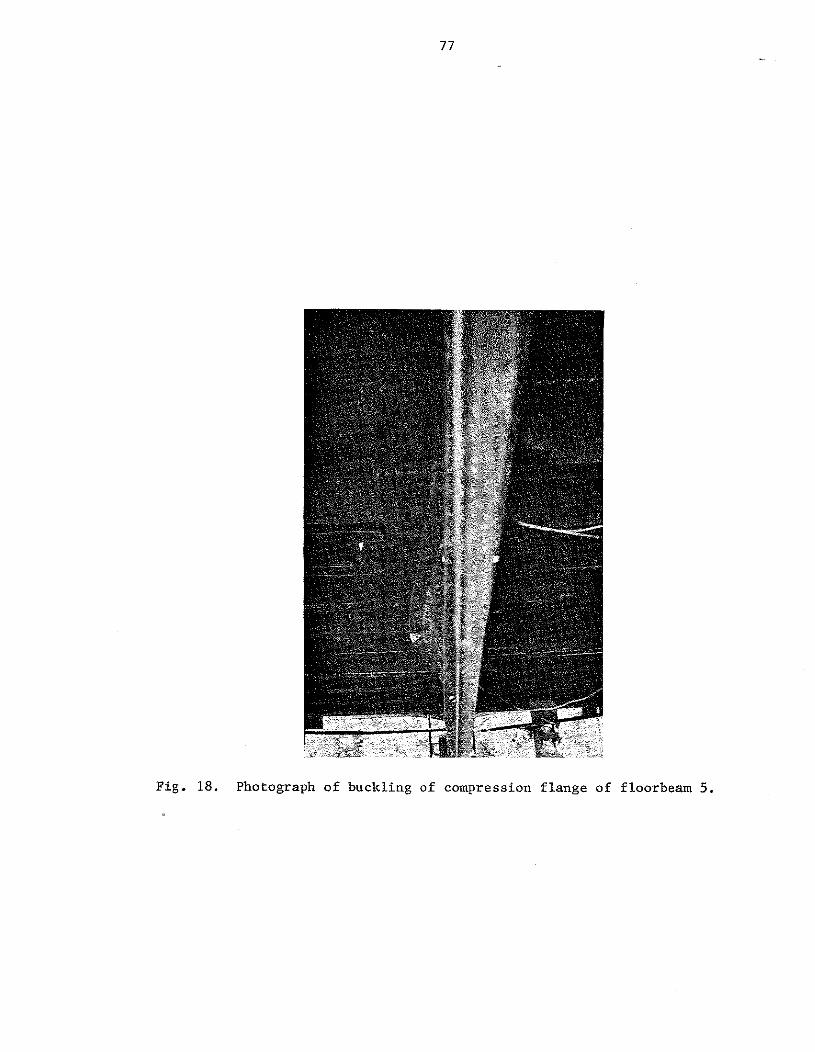
Fig. 18. Photograph of buckling of compression flange of floorbeam 5.
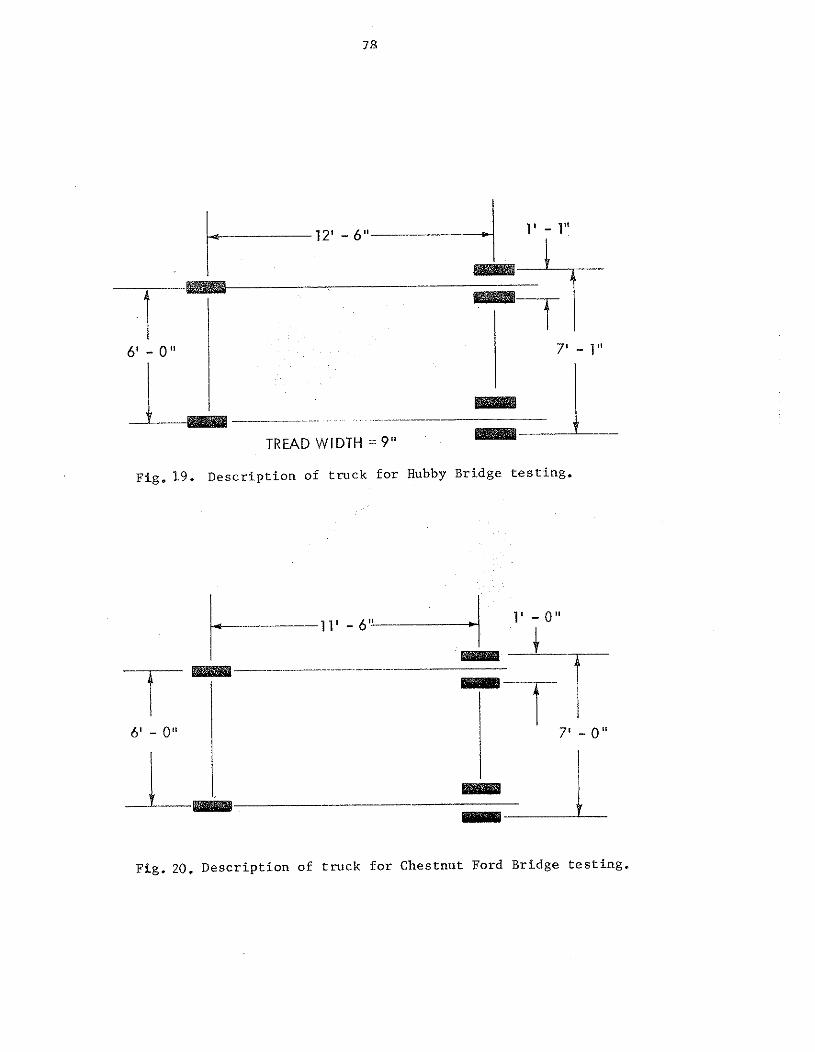
TREAD WIDTH = 9"
F i g . 1 9 . D e s c r i p t i o n of t r u c k f o r Hubby Bridge t e s t i n g .
Fig . 20. D e s c r i p t i o n of t r u c k f o r Ches tnu t Ford Br idge t e s t i n g .
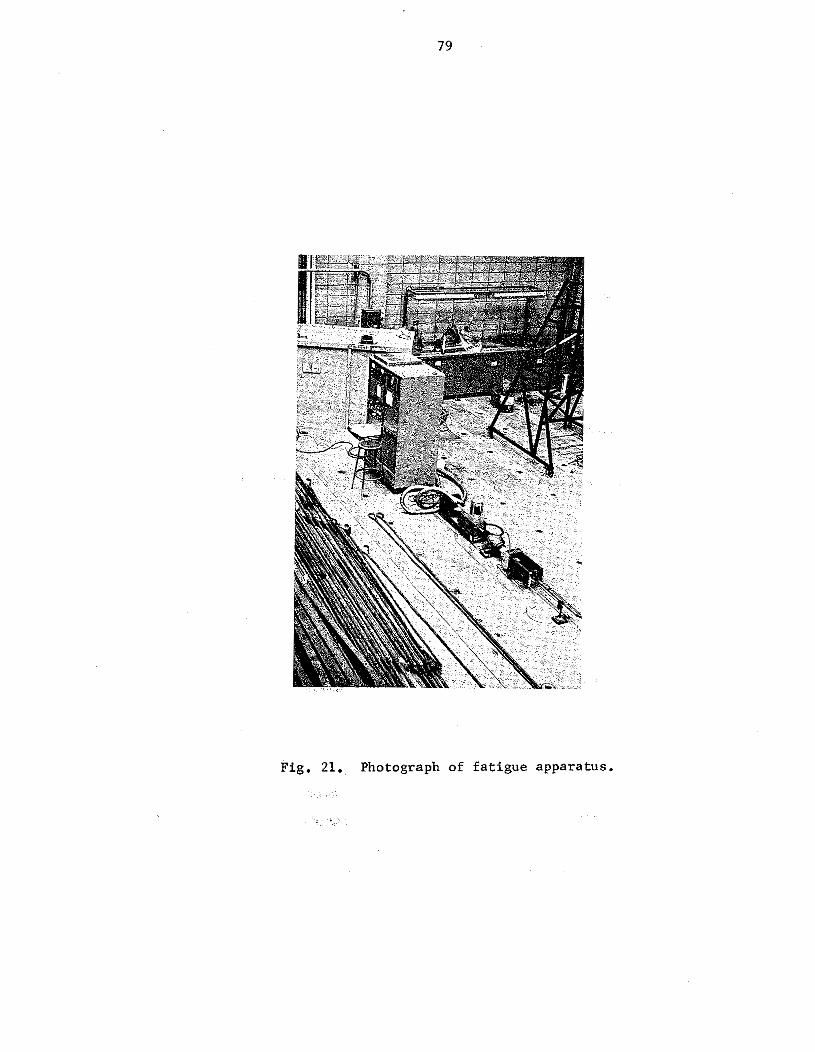
Fig. 21. Photograph of fat igue apparatus.
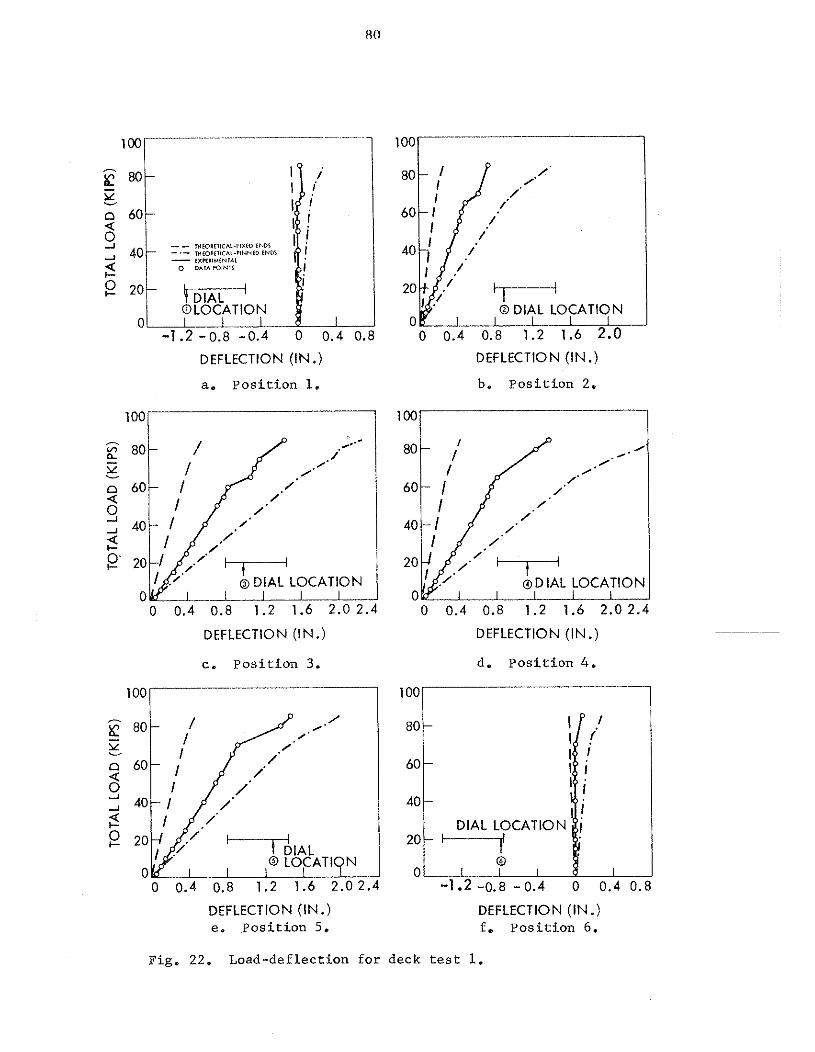
DEFLECTION ( IN .)
a. P o s i t i o n 1.
DEFLECTION (IN.)
c. P o s i t i o n 3.
100 1
DEFLECTION ( I N .) e. P o s i t i o n 5.
DEFLECTION (IN.)
b. P o s i t i o n 2.
DEFLECTION (IN.)
d. P o s i t i o n 4.
loo]/
DEFLECTION ( I N .) f. P o s i t i o n 6 .
Fig. 22. Load-deflection f o r deck t e s t 1.

U 0.4 -0.8 0.4 0 0.4 t L t C I I O N (IN.) DEFLECTION (IN.)
d. P o s i t i o n 4.
40 / 40
0 0.4 O.H 1.2 1.6 2.0 0 0.4 0.8 1.2 1.6 2.0 DEFLECTION ( IN . ) DEFLECTION (IN.)
e. P o s i t i o n 5. f . P o s i t i o n 6. .̂ ^ .. ---- THEORETICAL-FIXED ENDS
THEORETICAL-PINNED ENDS EXPERIMENTAL
0 DATA POINTS
DIAL LOCATION
DEFLECTION ( IN . )
g. P o s i t i o n 7.
Fig, 23. Load-deflect ion f o r deck t e s t 2.

,
1.25
Z - -
SIN
CE
LO
AD
ING
WA
S S
YM
ME
TRIC
AL,
_I
W
DE
FLE
CT
ION
RE
AD
ING
S FR
OM
THE R
IGH
T
SIDE W
ERE PLO
TTED
WIT
H TH
OS
E FR
OM
= 1 .oo 2
THE LEFT S
lDE
TO
FOR
M A
FU
LL CR
OSS
Y
z a 8 0.75 w
8 Z
0.50 Q
C
z -f LL 0.25 0 8'
6' 4'
2' 2'
4' 6'
8'
U.S.
DIS
TA
NC
E F
RO
M $
O
F B
RID
GE
D
.S.
Fig. 24.
De
flec
tion
cro
ss
se
ctio
n a
t m
id-sp
an
of
deck
p
an
el
fo
r d
eck
te
st 1
a
t va
riou
s lo
ad
s.
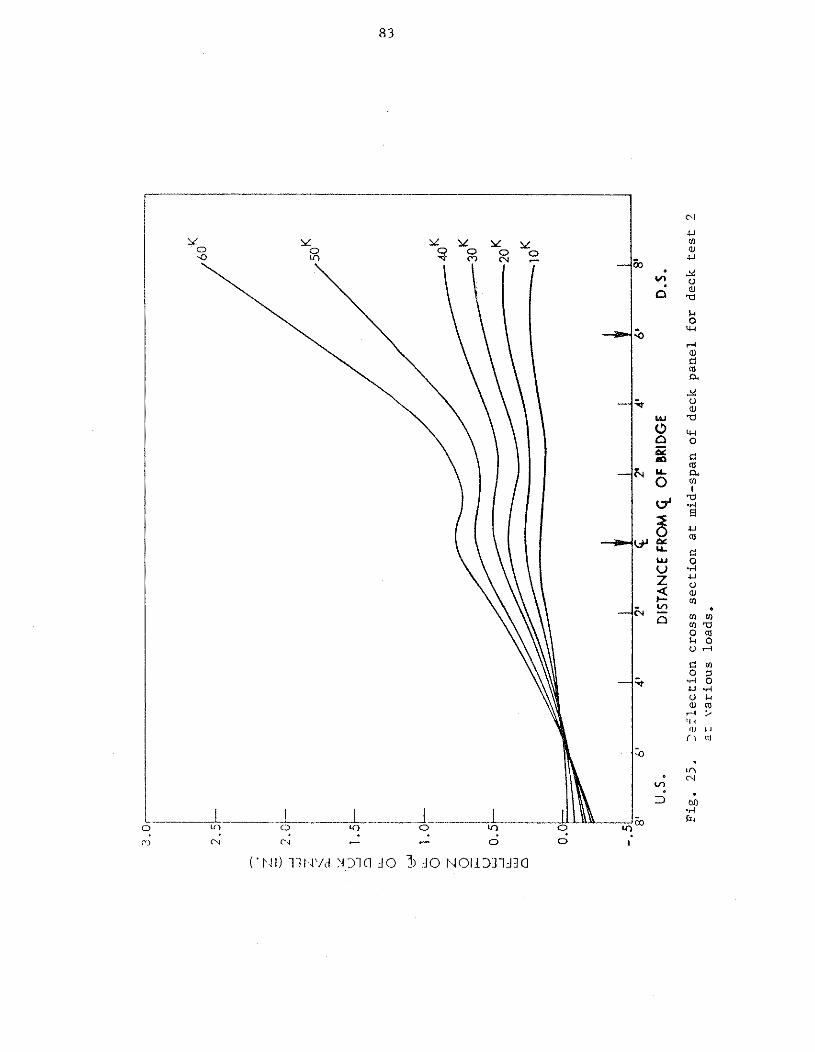
U.S
. D
ISTA
NC
E F
ROM
OF
BRID
GE
D.S
.
Fig
. 2
5.
'+il
ec
tio
n
cro
ss
se
cti
on
at
mid
-sp
an
of
de
ck
pa
ne
l fo
r d
ec
k
tes
t 2
zr
va
rio
us
lo
ad
s.
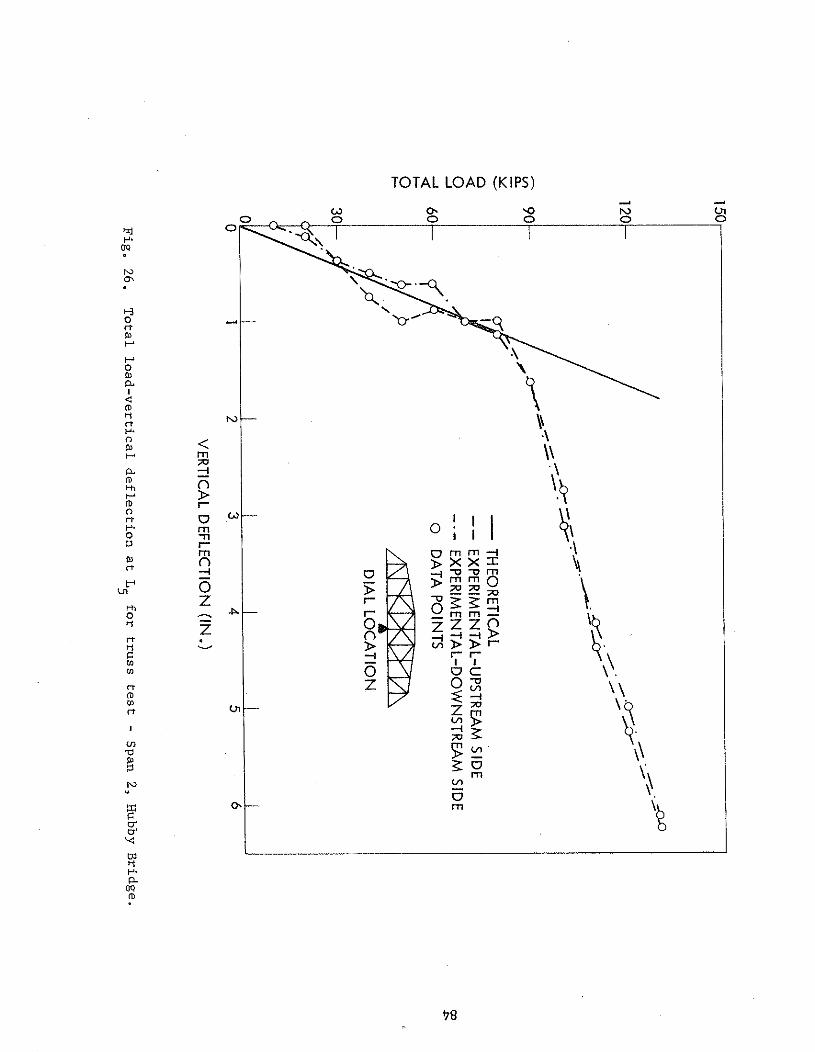

FORCE IN MEMBER (KIPS)
F i g . 27. T o t a l load- fo rce i n member L M - Span 2 , Elubby Br idge . 5 5
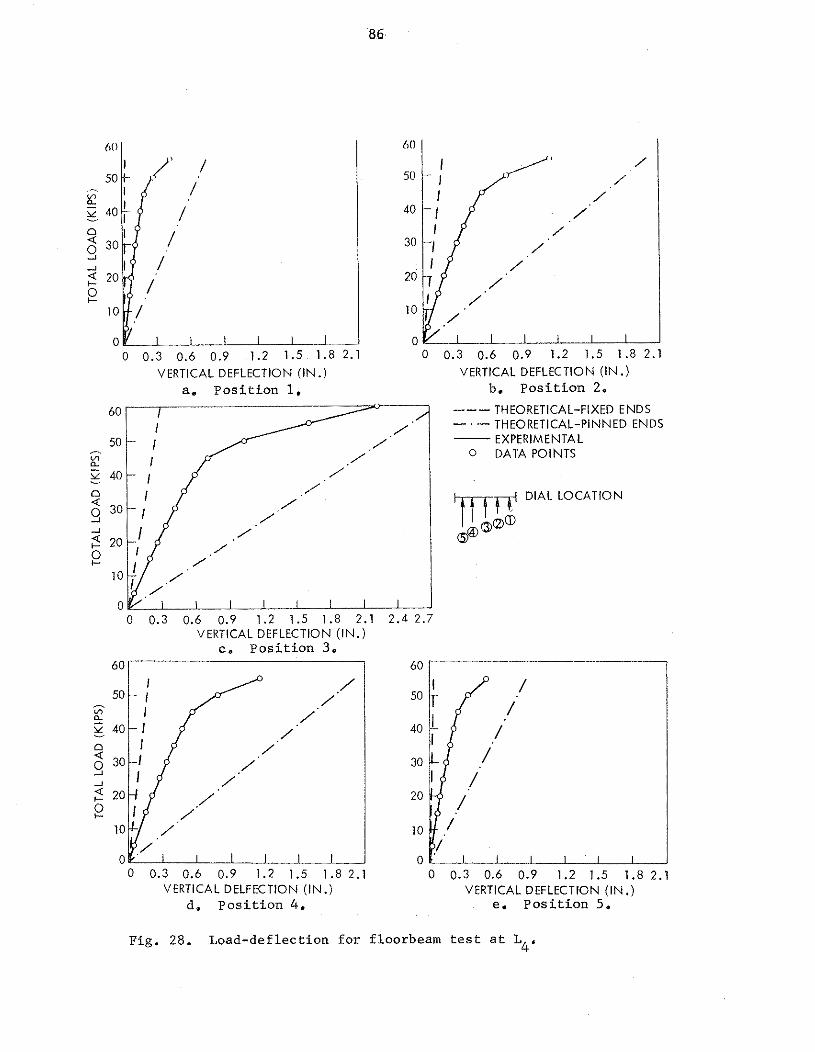
/
0 0.3 0.6 0.9 1.2 1.5 1.8 2.1 0 0.3 0.6 0.9 1.2 1.5 1.8 2.1 VERTICAL DEFLECTION (IN.) VERTICAL DEFLECTION (IN.)
a, P o s i t i o n 1. b. P o s i t i o n 2. --- THEORETICAL-FIXED ENDS
THEORETICAL-PINNED ENDS - EXPERIMENTAL
0 DATA POINTS
$ DIAL LOCATION
a@
c . P o s i t i o n 3.
0 0.3 0.6 0.9 1.2 1.5 1.8 2.1 0 0.3 0.6 0.9 1.2 1.5 1.8 2.1 VERTICAL DELFECTION (IN.) VERTICAL DEFLECTION ( I N .)
d. P o s i t i o n 4. e. P o s i t i o n 5 .
Fig. 28. Load-deflection f o r floorbeam t e s t a t L4.
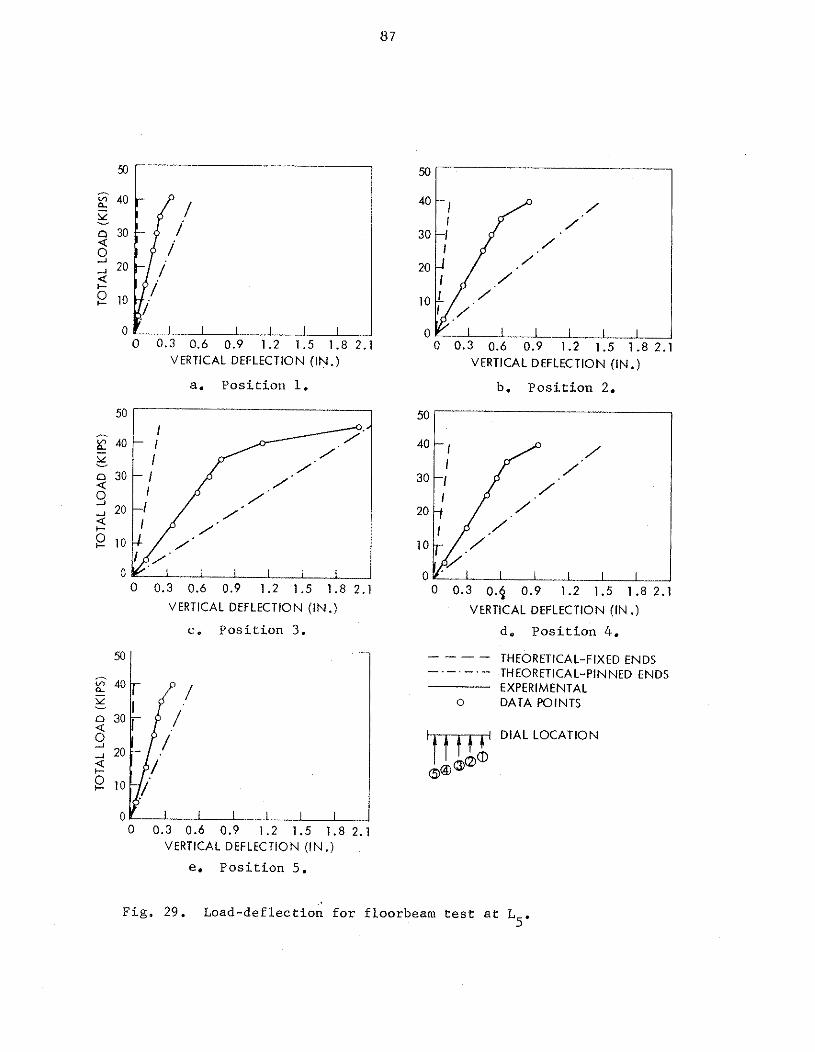
VERTICAL DEFLECTION (IN.)
a. Position 1.
VERTICAL DEFLECTION (IN.)
b. Position 2.
VERTICAL DEFLECTION (IN.) VERTICAL DEFLECTION (IN .)
c. Position 3. d. Position 4.
Fig. 29. Load-deflection for floorbeam test at L 5'
M ' -
/
I I I I I
---- THEORETICAL-FIXED ENDS - . - . - . - THEORETICAL-PINNED ENDS
EXPERIMENTAL o DATA POINTS
I DIAL LOCATION
@@
0 0.3 0.6 0.9 1 .2 1 .5 1.8 2.1 VERTICAL DEFLECTION (IN.)
e. Position 5.
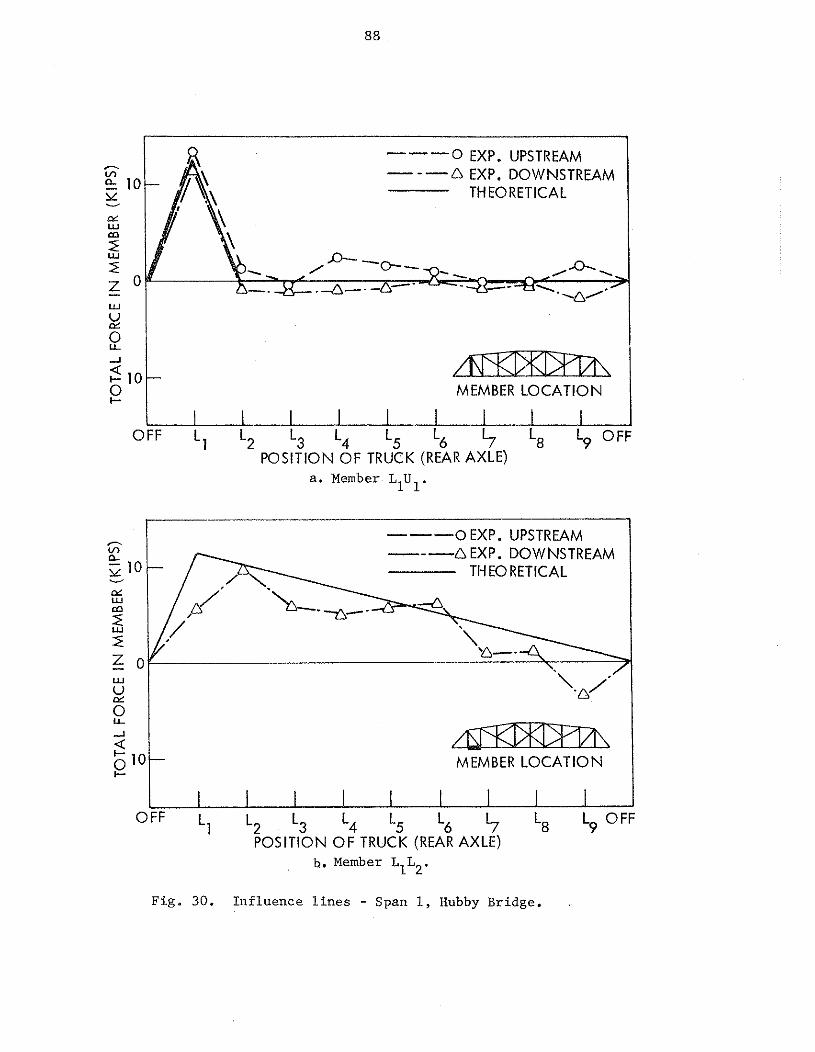
.--- v, a- 10
EXP. DOWNSTREAM Y - THEORETICAL
& W m 2 W
2 z o - W
2 0 LL
-I
2 10 0 i-
MEMBER LOCATION
I I I I 1 OFF L,
L2 L3 L4 L5 L6 '7 L9 OFF POSITION OF TRUCK (REAR AXLE)
a. Member LIU1.
--- ,-. 0 EXP. UPSTREAM V) -- a- -A EXP. DOWNSTREAM u 10 - THEORETICAL & LU
2 W
2 z 0 W
k2 0 LL
-I
g 10 I-
I 0 FF
L1 L2 L3 L4 L5 L6 '7 L9 OFF
POSITION O F TRUCK (REAR AXLE) b. Member L L
1 2'
Fig. 30. Inf luence l i n e s - Span 1, Hubby Bridge.
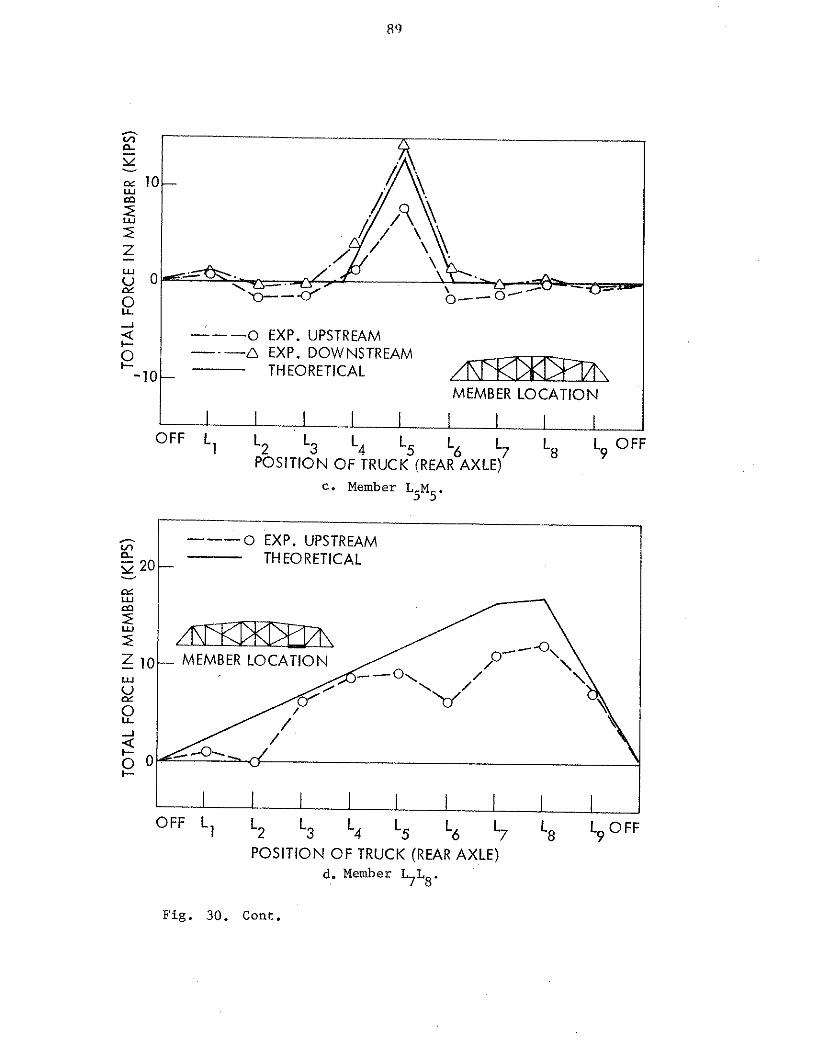
.-. V)
ft Y -
10
5 W
2 z - z 0 E
0 LL -1
3 --- 0 EXP. UPSTREAM
0 1-
D EXP. DOWNSTREAM
-10 THEORETICAL
MEMBER LOCATION
OFF L1 L2 L3 L4 L5 L6 L7 L8 L9 OFF POSITION OF TRUCK (REAR AXLE)
c. Member L M 5 5'
0 EXP. UPSTREAM
20 THEORETICAL
aL W m 2 W
2 Z 10- MEMBER LOCATION W
2 0 LL -I
5 0 1-
OFF L, L2 L3 L4 L5 L6 L7 L8 L9 OFF POSITION OF TRUCK (REAR AXLE)
d. Member L L 7 8'
Fig. 30. Cont.
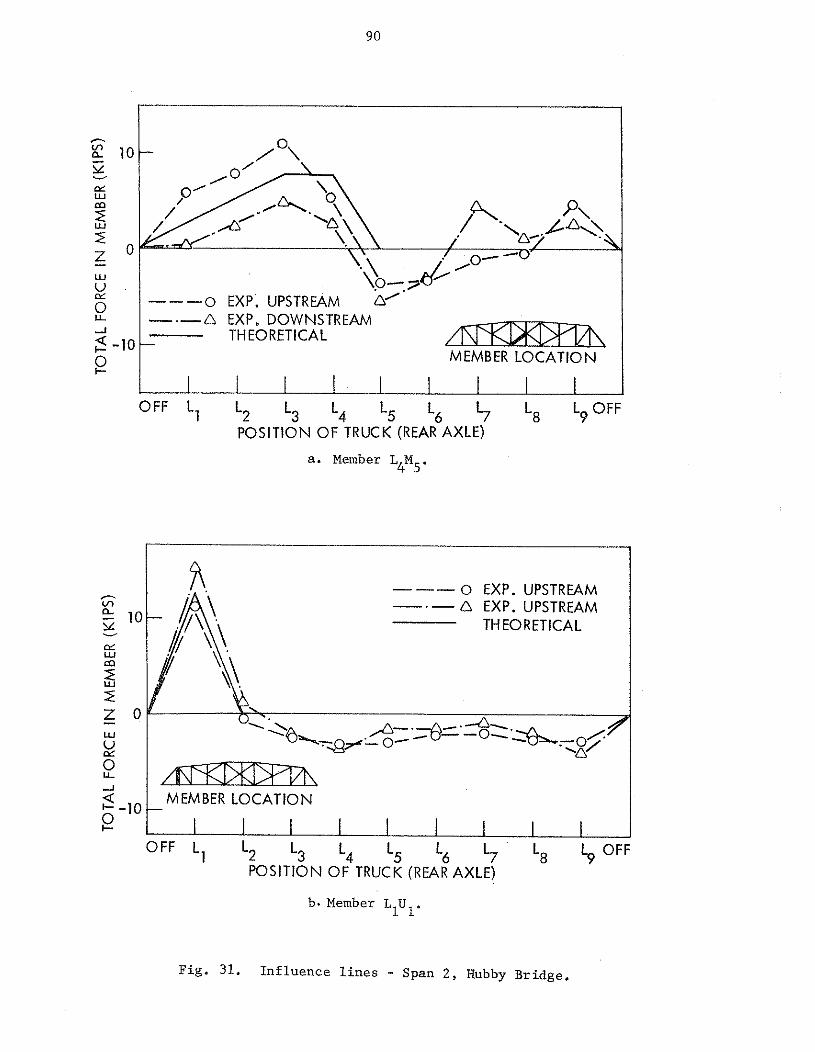
,-. ln a, 10 Y - C*L W rn z W
= 0 z - W
z 0
--- 0 EXP. UPSTREAM LL -I
---.-A EXP. DOWNSTREAM
3 -10 THEORETICAL
Q OFF L1
L2 L3 L4 L5 L6 L7 L8 Lp OFF POSITION OF TRUCK (REAR AXLE)
a. Member L M 4 5'
--- - 0 EXP. UPSTREAM ln a -.- A EXP. UPSTREAM - 10 Y - THEORETICAL
W
W
Z 0 - W
2 0 LL
;i ' -10 MEMBER LOCATION
Q OFF L1 L2 L3 L4 L5 L6 L7 L8 $ OFF
POSITION OF TRUCK (REAR AXLE)
--- 0 EXP. UPSTREAM -.- A EXP. UPSTREAM THEORETICAL
b. Member L U 1 1'
Fig. 31. Inf luence l i n e s - Span 2 , Hubby Bridge.

c. M e m b e r L3M3.
W
2 0 LL
-1 -10 5 0 I-
A EXP. DOWNSTREAM
POSITION OF TRUCK (REAR AXLE)
d. M e m b e r U U 4 5' Fig. 31. C o n t . -
-- 0 EXP. UPSTREAM --- A EXP. DOWNSTREAM
- - THEORETICAL MEMBER LOCATION
L I 1 OFF
. .
L1 L2 L3 L4 L5 L6 L7 L__L_. L8 Lp OF
POSITION OF TRUCK (REAR AXLE)
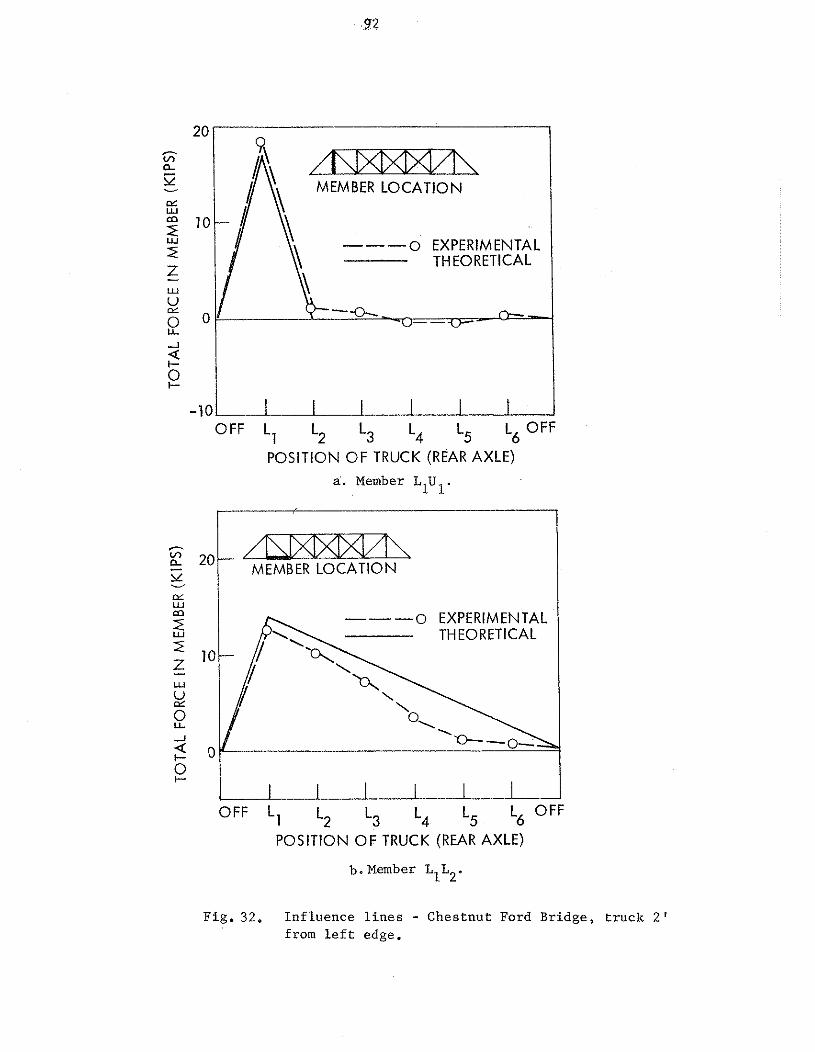
L U - ln a 52 - MEMBER LOCATION & W
10 W
2 --- 0 EXPERIMENTAL
z - LU
2 0 0
OFF L1 L2 L3 L4 L5 L6 OFF
POSITION OF TRUCK (REAR AXLE) a. Member L U
1 1'
--- 0 EXPERIMENTAL THEORETICAL
10
OFF L, L2 L3 L4 L5
L6 OFF
POSITION O F TRUCK (REAR AXLE)
b. Member L L 1 2'
Fig.32. Influence lines - Chestnut Ford Bridge, truck 2' from left edge.
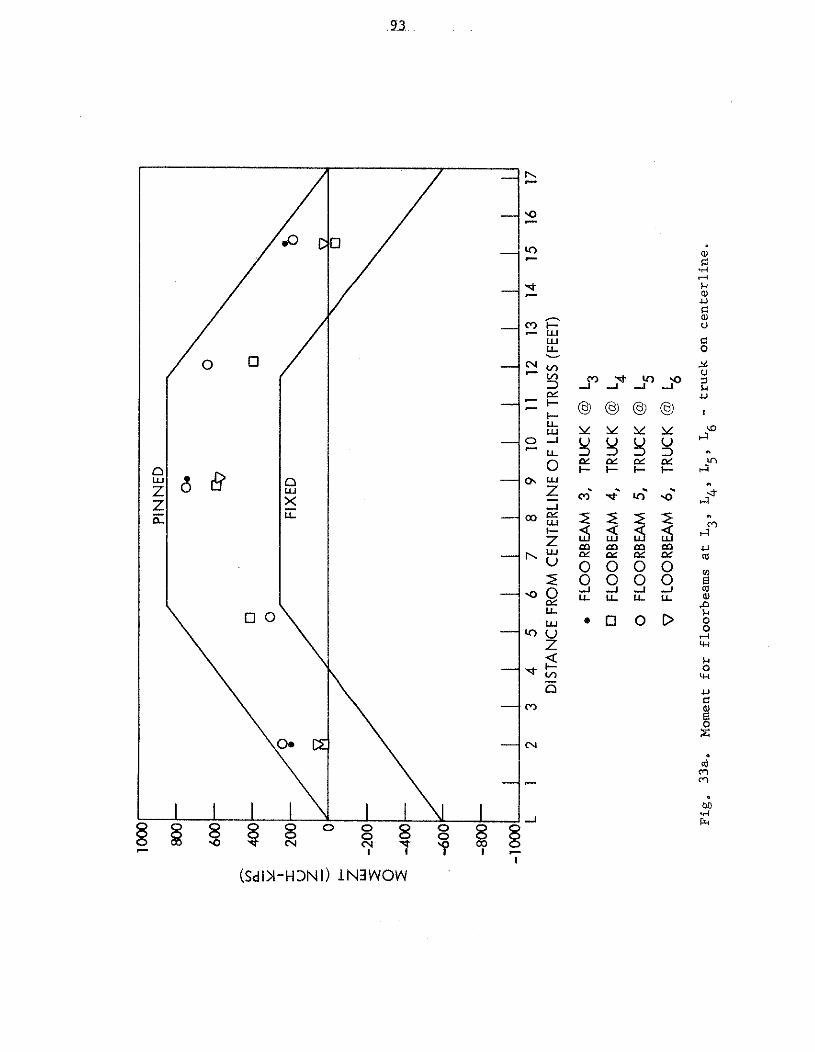
FIX
ED
-800
-100
0 L
1 2
3 4
5 6
7 8
9 10
11
12
13
14
15
16
17
D
IST
AN
CE
FR
OM
CE
NTE
RLI
NE
OF
LEF
T TR
USS
(FE
ET)
e
FLO
OR
BE
AM
3,
TRU
CK
@
L3
FLO
OR
BE
AM
4,
TRU
CK
@
L4
0
FLO
OR
BE
AM
5,
TR
UC
K
@
L5
V
FLO
OR
BE
AM
6,
TRU
CK
@
L6
Fig
. 33a.
Mom
ent
for
flo
orb
eam
s a
t L
3,
Lq,
L5, L6 -
tru
ck
on
ce
nte
rlin
e.
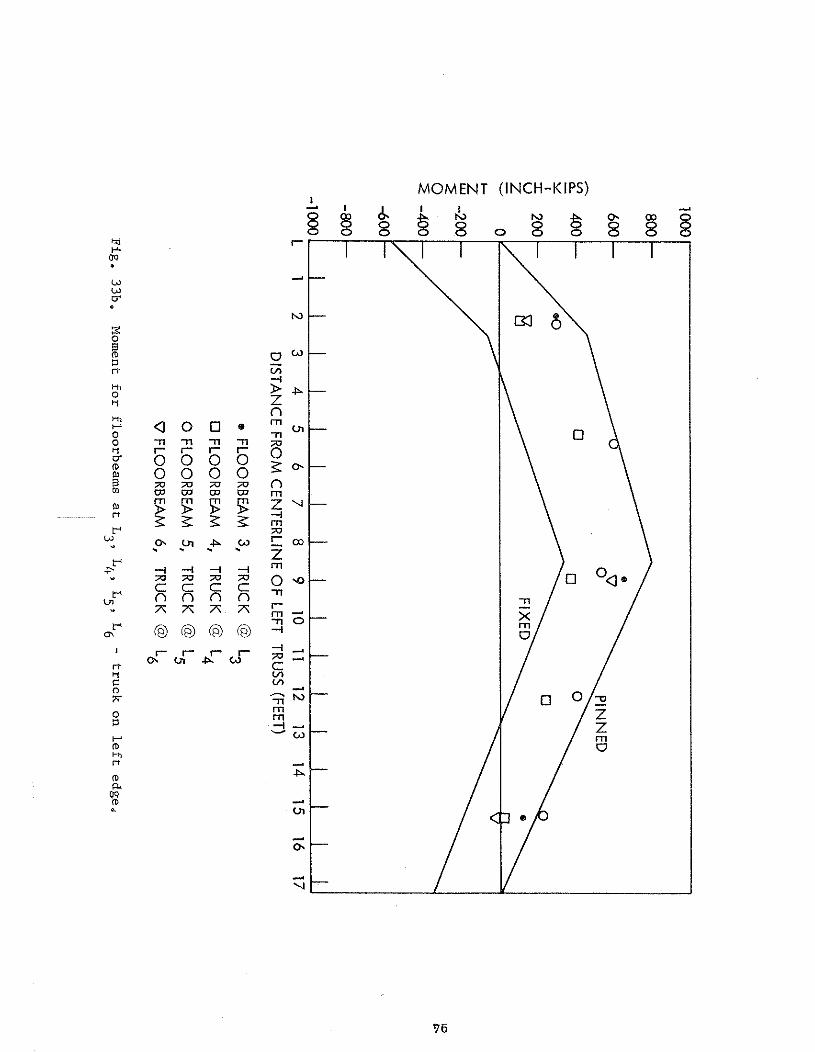

DIS
TAN
CE
FR
OM
CE
NTE
RLI
NE
OF
LEF
T TR
USS
(FEE
T)
- FLOO
RB
EA
M
3,
TRU
CK
@
L3
FLO
OR
BE
AM
4,
TRU
CK
@
L4
0 F
LOO
RB
EA
M
5, TR
UC
K @
L5
V F
LOO
RB
EA
M 6
, TR
UC
K @
L6
Fig
. 33
c,
Mom
ent
for
flo
orb
eam
s a
t L
3,
Lq,
L
5, L6 -
tru
ck
on
rig
ht
edg
e.
Related Documents