Ulster Bank Northern Ireland Purchasing Managers Index (PMI) Includes analysis of Global, Eurozone, UK, UK Regions, NI & Republic of Ireland economic performance by sector March 2017 Survey Update Issued 11 th April 2017 Richard Ramsey Chief Economist Northern Ireland www.ulstereconomix.com [email protected] Twitter @UB_Economics

Welcome message from author
This document is posted to help you gain knowledge. Please leave a comment to let me know what you think about it! Share it to your friends and learn new things together.
Transcript

Ulster Bank Northern Ireland Purchasing Managers Index (PMI)
Includes analysis of Global, Eurozone, UK, UK Regions, NI & Republic of Ireland economic performance by sector
March 2017 Survey Update
Issued 11th April 2017
Richard RamseyChief Economist Northern Ireland
Twitter @UB_Economics

PMI SurveysPurchasing Managers’ Indexes (PMIs) are monthly surveys of private sector companies which provide an advance indication of what is happening in the private sector economy by tracking variables such as output, new orders, employment and prices across different sectors.
Index numbers are calculated from the percentages of respondents reporting an improvement, no change or decline on the previous month. These indices vary from 0 to 100 with readings of 50.0 signalling no change on the previous month. Readings above 50.0 signal an increase or improvement; readings below 50.0 signal a decline or deterioration. The greater the divergence from 50.0 the greater the rate of change (expansion or contraction). The indices are seasonally adjusted to take into consideration expected variations for the time of year, such as summer shutdowns or holidays.
< 50.0 = Contraction 50.0 = No Change > 50.0 = Expansion
Data at a sector level are more volatile and 3-month moving averages have been used to more accurately identify the broad trends.

• Global output growth just shy of January’s 13-mth high• Growth accelerates in UK, EZ, Russia, Japan & India• Chinese composite PMI slows to a 6-month low (52.1)• Emerging Markets Composite PMI at a 31-month high• Eurozone composite PMI (56.4) hits a 6-yr high • French & German PMIs post strongest growth since May-11• Global input price inflation eases from recent 63-mth high• Developed Market manufacturing PMI just shy of recent 35-
mth high with Emerging Markets at a 32-mth highs• UK composite PMI (54.7) rebounds from 5-mth low due to
services while growth slows for manufacturing & construction• RoI business activity slows to a 4-mth low (57.0)• NI firms’ output growth accelerates to 53.9 but new orders
growth slows to a 5-mth low (53.2)
March 2017 PMIs – Key highlights
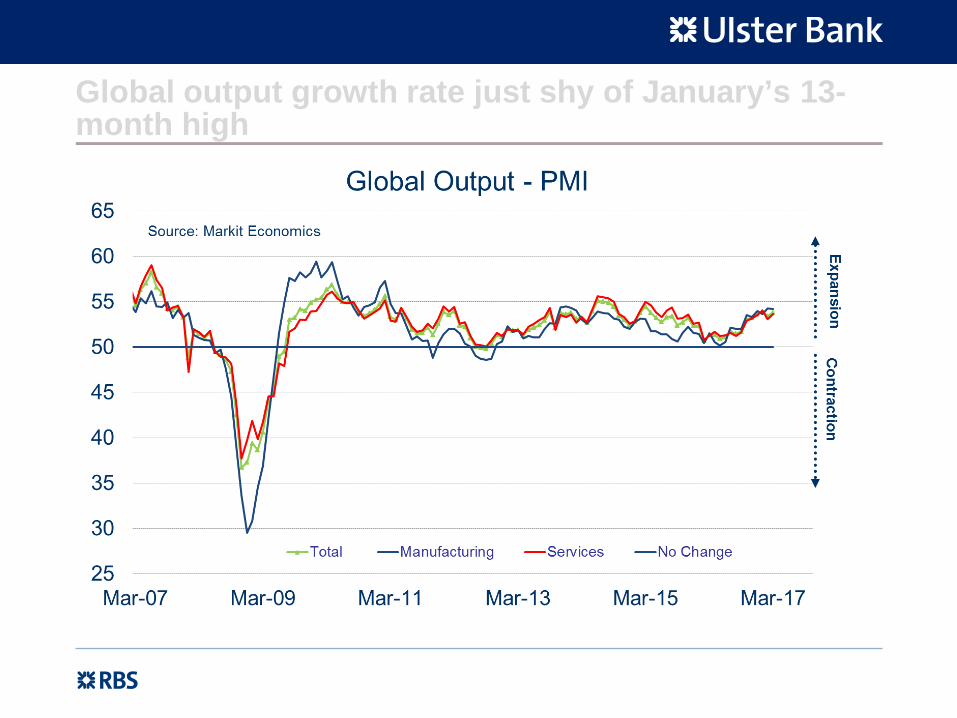
Global output growth rate just shy of January’s 13-month high

Growth accelerates in the EZ, UK & Japan. While the US & China post slower rates of growth in March

Developed Markets PMI growth continues while Emerging Markets rises to a 31-month high

Emerging Markets’ PMI remains in expansion mode with growth accelerating in India & Russia

Chinese services PMI hits a 6-month low with manufacturing activity slowing too

Strong manufacturing growth ‘Down Under’

France & Germany report their fastest rates of growth since May-11 with growth rates slowing elsewhere

Growth in EZ services, manufacturing & construction output at or close to 6-year highs

GDP growth accelerating with PMI suggesting an even stronger Q1

Ireland, France, Spain & Russia top the service sector growth league with Brazil still contracting

Euro-zone manufacturing bucks the wider trend with activity accelerating towards a near 6-year high

Developed Markets remains just below recent 35-month high with Emerging Markets hitting a 32-month high

NI & UK firms report faster rates of growth in March but Q1’s growth rate is still below that of Q4
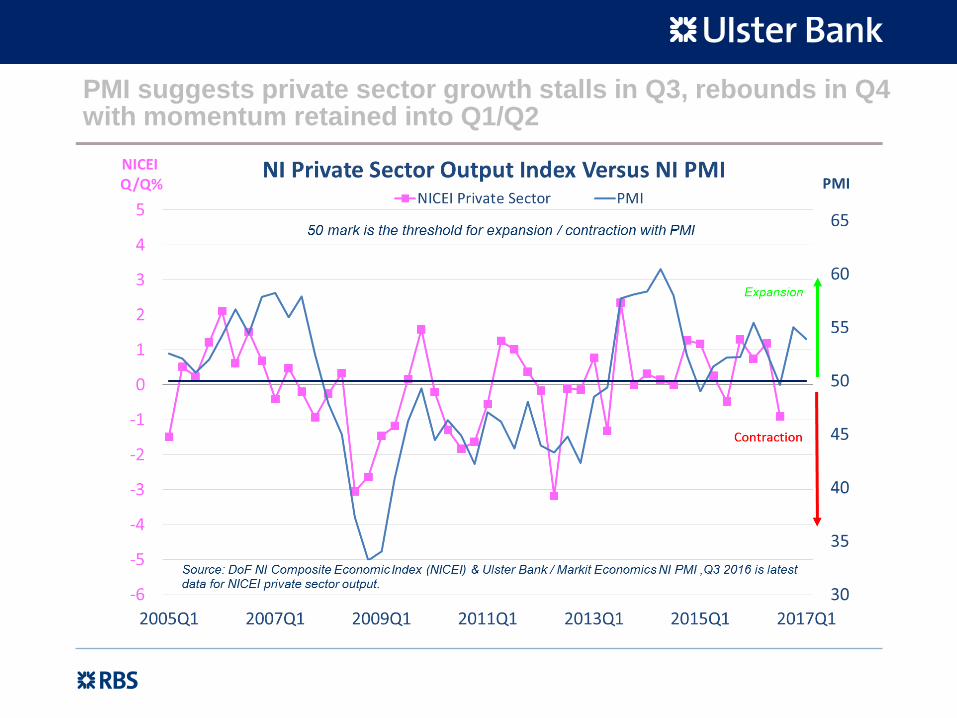
PMI suggests private sector growth stalls in Q3, rebounds in Q4 with momentum retained into Q1/Q2

2014 was the 1st year in 7 years that the 4 main indicators recorded expansion, repeated in 2015 & 2016 (& Q1 2017)

Output, orders (incl. exports) growth rates slow in Q1 relative to Q4 but pace of job creation quickens

NI firms report a marginal pick-up in output growth while the rate of growth eases for new orders & jobs

RoI firms’ orders growing at a robust rate while UK & NI firms signal divergence. NI orders growth at a 5-mth low

UK & NI firms no longer report rising backlogs
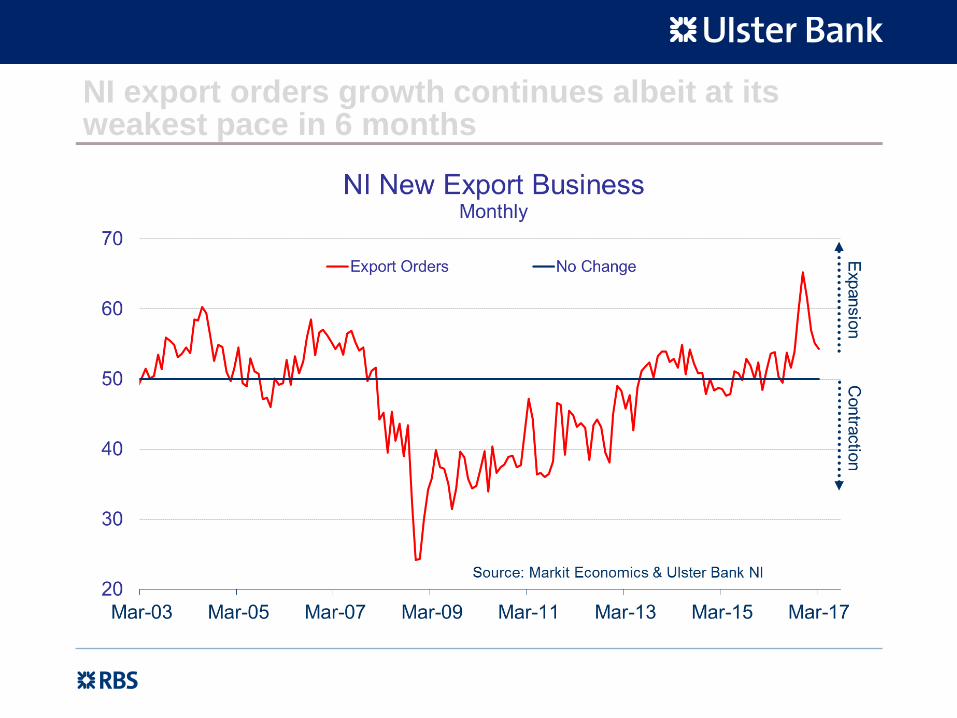
NI export orders growth continues albeit at its weakest pace in 6 months

NI’s rate of employment growth exceeds the UK for 2nd
month in a row. Both NI & UK lag behind the RoI

Input cost inflation in Q1-17 hits its highest level since Q2-11. Output prices rise at their fastest rate since Q3-08

Regional Comparisons
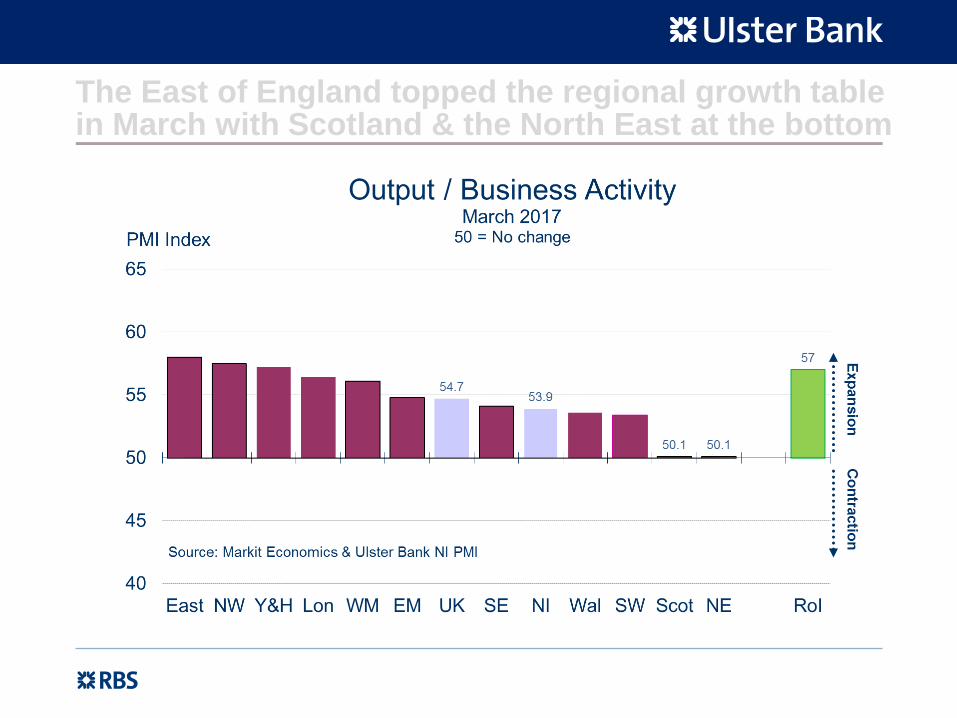
The East of England topped the regional growth table in March with Scotland & the North East at the bottom

Scotland, the North East & NI post the weakest growth rates of all the UK regions in Q1 2017

The RoI reported the fastest growth rate in business activity over the last year with Scotland stagnating

NI reports the 5th fastest rate of job creation in the UK with the North East reporting job losses

NI private sector employment growth broadly in line with the UK average

Scotland & the North East (job losses) have reported the weakest rates of jobs growth over the last year

SectoralComparisons

UK output growth rates for manufacturing and services moving in different directions

The UK’s growth rate remained relatively strong in Q4 at 0.7% q/q which was firmer than PMI suggested

Construction was the only sector in the RoI to report a pick-up in the rate of growth in March

NI firms within retail, services & construction all post faster rates of growth in Q1 but not manufacturers

Subdued service sector growth with retail strong. Construction recovering & manufacturing slowing

Construction and manufacturing firms report a pick-up in staffing levels in Q1 following a weak Q4

NI’s manufacturing firms report slower rates of output & orders growth in Q1 but pace of job creation accelerates

Manufacturing output growth slowing in Q1 2017 particularly for Northern Ireland firms

NI manufacturing output growth decelerates back below its pre-downturn long-term average

New order growth rates slowing but for NI firms holding up better than output

RoI manufacturing output growth eases with Greece contracting and Italy surging towards a 6-year high

Sterling weakness exacerbating input cost inflation in NI & UK relative to elsewhere

Input cost inflation hits a record high in Q1 with firms raising prices at a record rate too
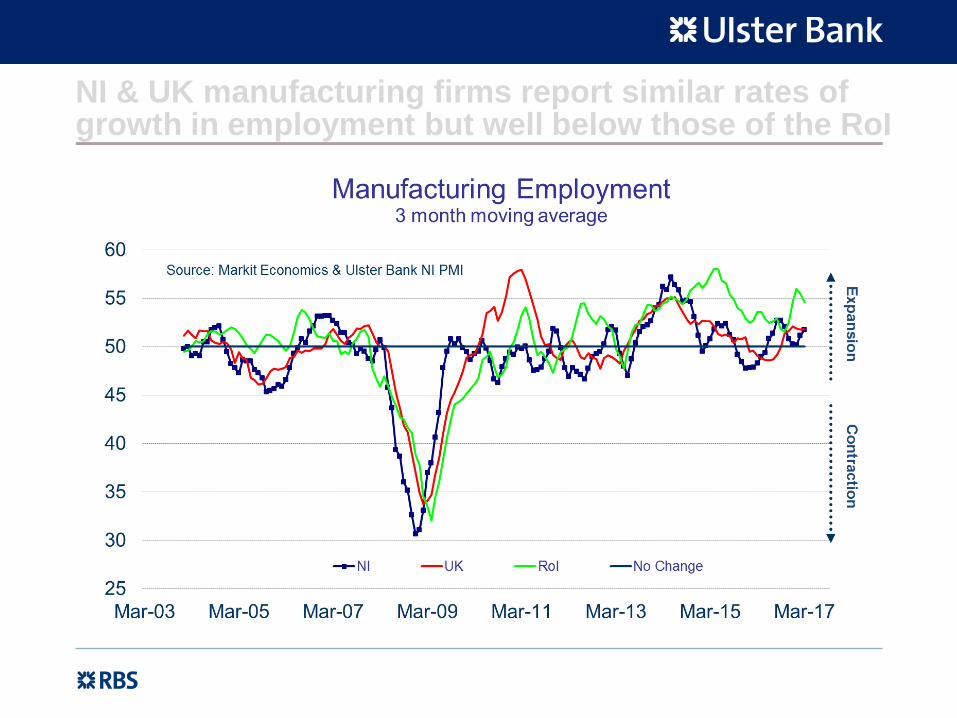
NI & UK manufacturing firms report similar rates of growth in employment but well below those of the RoI
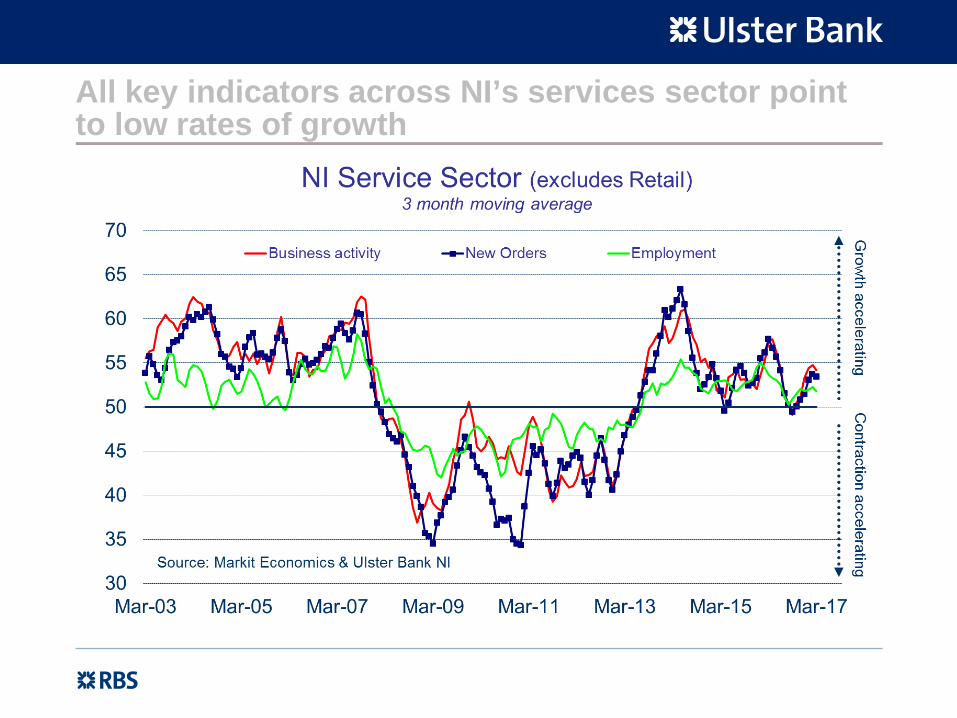
All key indicators across NI’s services sector point to low rates of growth

NI & UK’s services sector output growth eases in Q1 accelerates in Q1 & still lags behind the RoI

The growth rate in NI’s services sector remains relatively subdued & well below its pre-downturn long-term average

New orders growth up sharply for RoI firms & eases for UK firms. NI order books expand in Q1
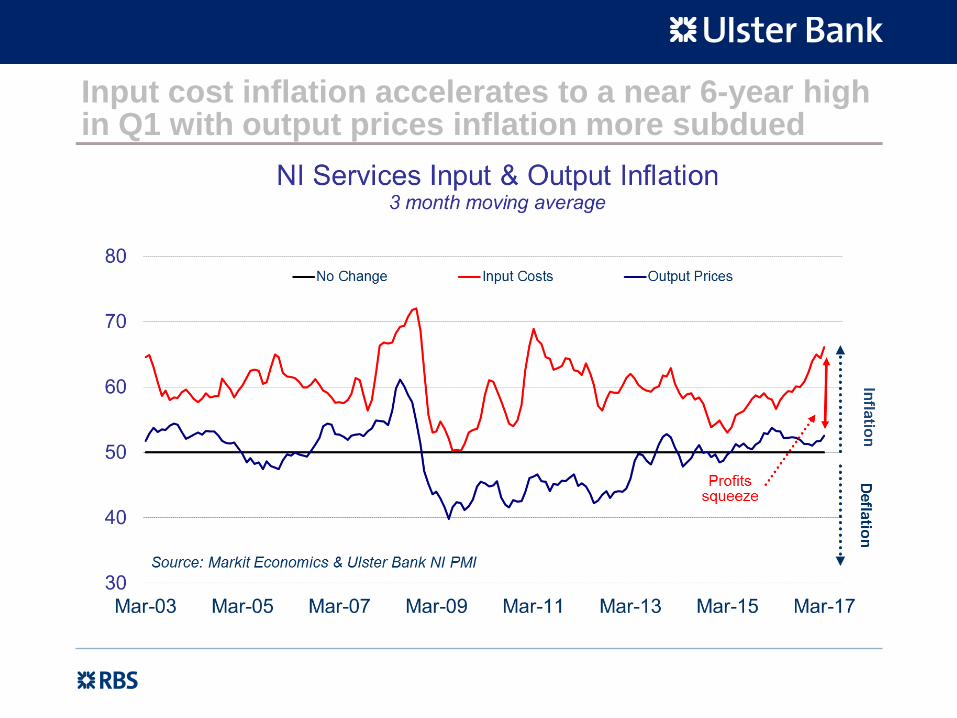
Input cost inflation accelerates to a near 6-year high in Q1 with output prices inflation more subdued

NI & UK firms report similar rates of service sector jobs growth with RoI’s rate accelerating

NI retailers are still recruiting staff at a significant rate with sales and orders growth slowing

NI retailers report elevated rates of input cost inflation while output price inflation hits a record high in Q1
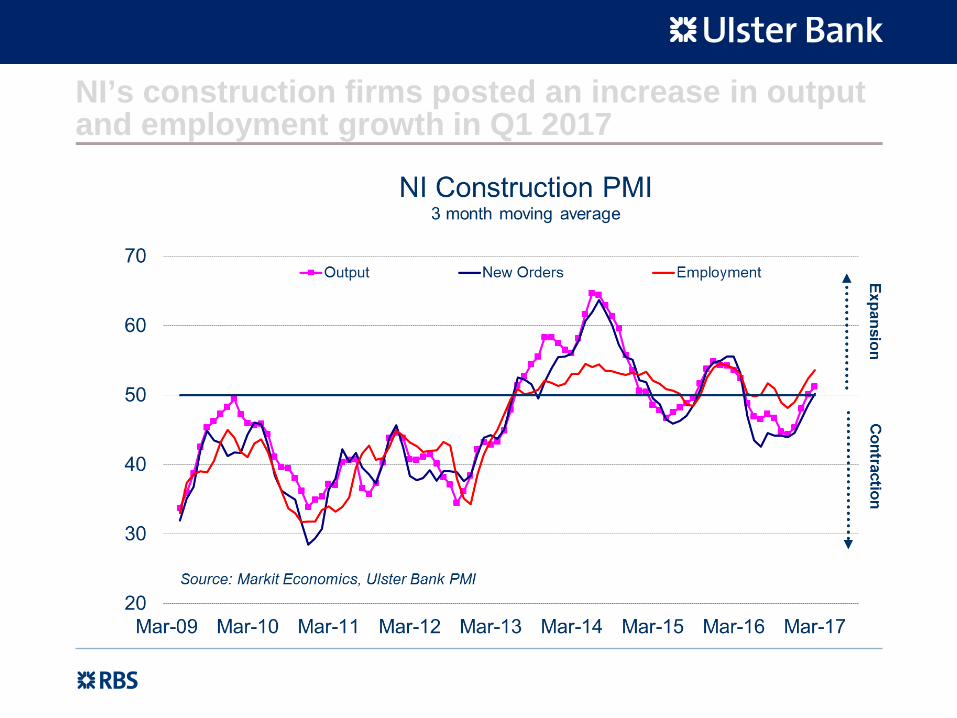
NI’s construction firms posted an increase in output and employment growth in Q1 2017

Input cost inflation accelerating at a rapid rate with firms increasing prices at a much weaker rate

NI firms report their 2nd consecutive month of growth in March but still lags behind its UK & RoI counterparts

NI firms report stagnant orders growth whilst growth continues (albeit slowing) for UK & RoI firms

UK firms report increased activity for commercial & civil engineering but housing activity slows

Construction sector still reporting a shortage of sub-contractors

Optimism amongst UK construction firms is broadly in line with its long-term average

RoI housing and commercial construction activity has been improving while engineering output falls

RoI’s construction industry still reporting a decrease in the availability of sub-contractors & rising rates of pay
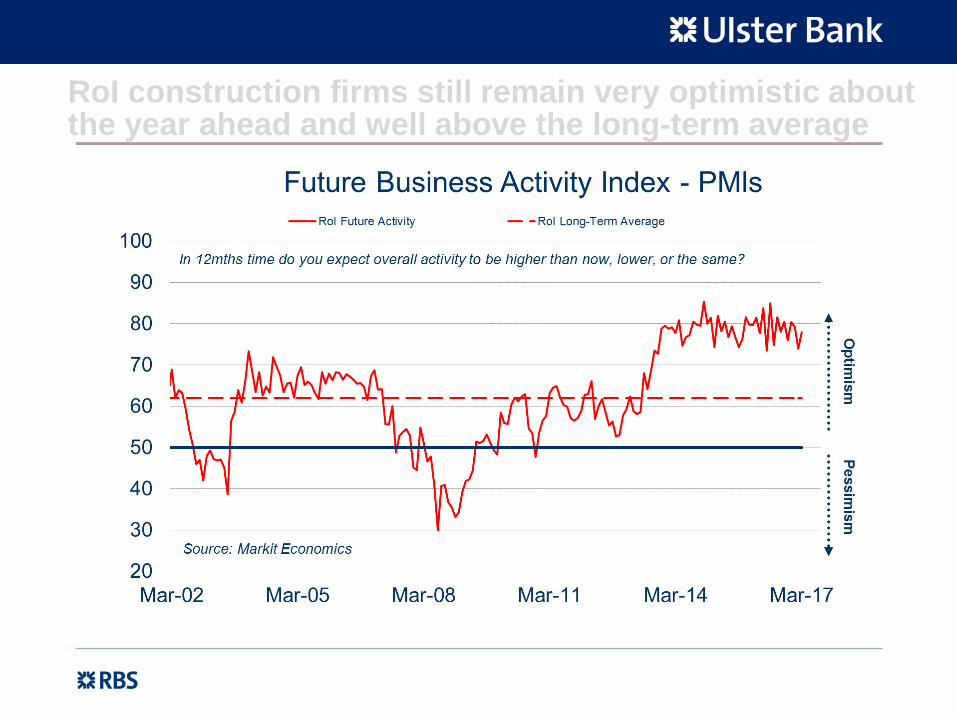
RoI construction firms still remain very optimistic about the year ahead and well above the long-term average

Slide 66
Disclaimer
This document is intended for clients of Ulster Bank Limited and Ulster Bank Ireland Limited (together and separately, "Ulster Bank") and is not intended for any other person. It does not constitute an offer or invitation to purchase or sell any instrument or to provide any service in any jurisdiction where the required authorisation is not held. Ulster Bank and/or its associates and/or its employees may have a position or engage in transactions in any of the instruments mentioned.
The information including any opinions expressed and the pricing given, is indicative, and constitute our judgement at time of publication and are subject to change without notice. The information contained herein should not be construed as advice, and is not intended to be construed as such.
This publication provides only a brief review of the complex issues discussed and recipients should not rely on information contained here without seeking specific advice on matters that concern them. Ulster Bank make no representations or warranties with respect to the information and disclaim all liability for use the recipient or their advisors make of the information.
Over-the-counter (OTC) derivatives can involve a number of significant and complex risks which are dependent on the terms of the particular transaction and your circumstances. In the event the market has moved against the transaction you have undertaken, you may incursubstantial costs if you wish to close out your position.
Calls may be recorded.
Related Documents