Welcome message from author
This document is posted to help you gain knowledge. Please leave a comment to let me know what you think about it! Share it to your friends and learn new things together.
Transcript
7/29/2019 Ulsab Final Report (1).Ashx
http://slidepdf.com/reader/full/ulsab-final-report-1ashx 1/62
7/29/2019 Ulsab Final Report (1).Ashx
http://slidepdf.com/reader/full/ulsab-final-report-1ashx 2/62
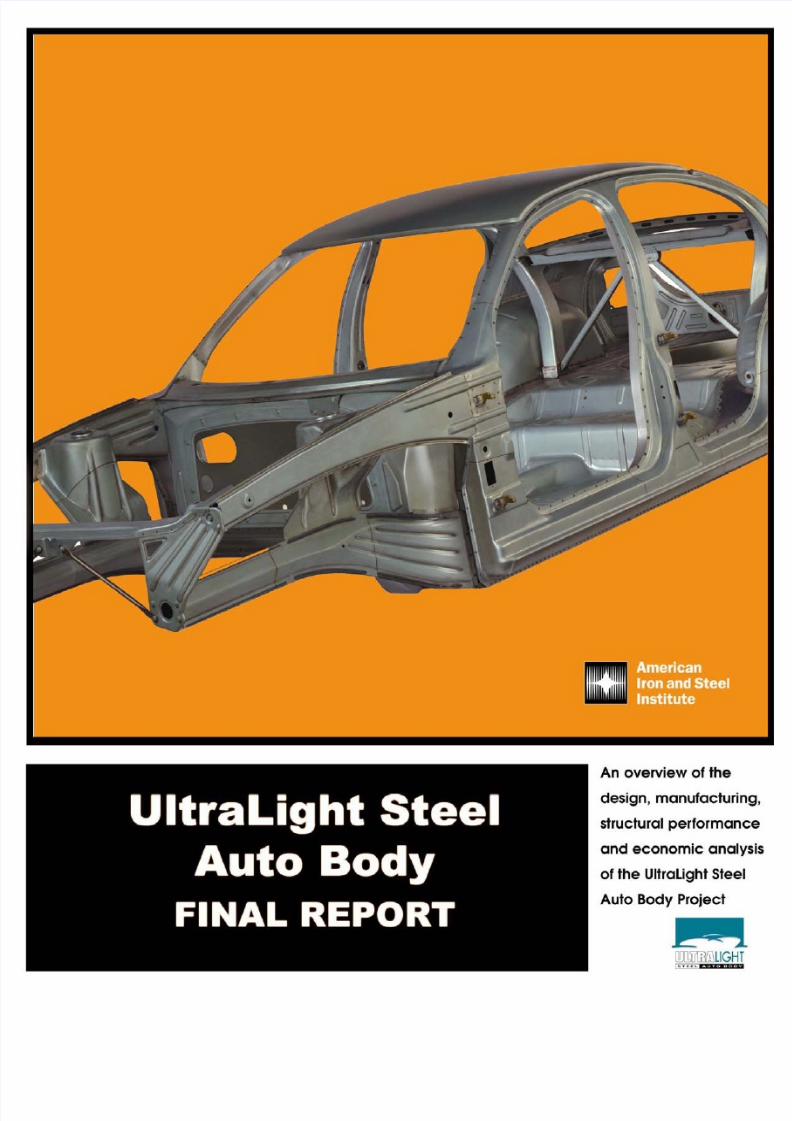
UltraLight Steel Auto Body Final Report
Research conducted by the UltraLight Steel Auto Body Consortium. This Final Reportpublished by American Iron and Steel Institute.
First Edition
American Iron and Steel InstituteWashington, D.C.
7/29/2019 Ulsab Final Report (1).Ashx
http://slidepdf.com/reader/full/ulsab-final-report-1ashx 3/62i
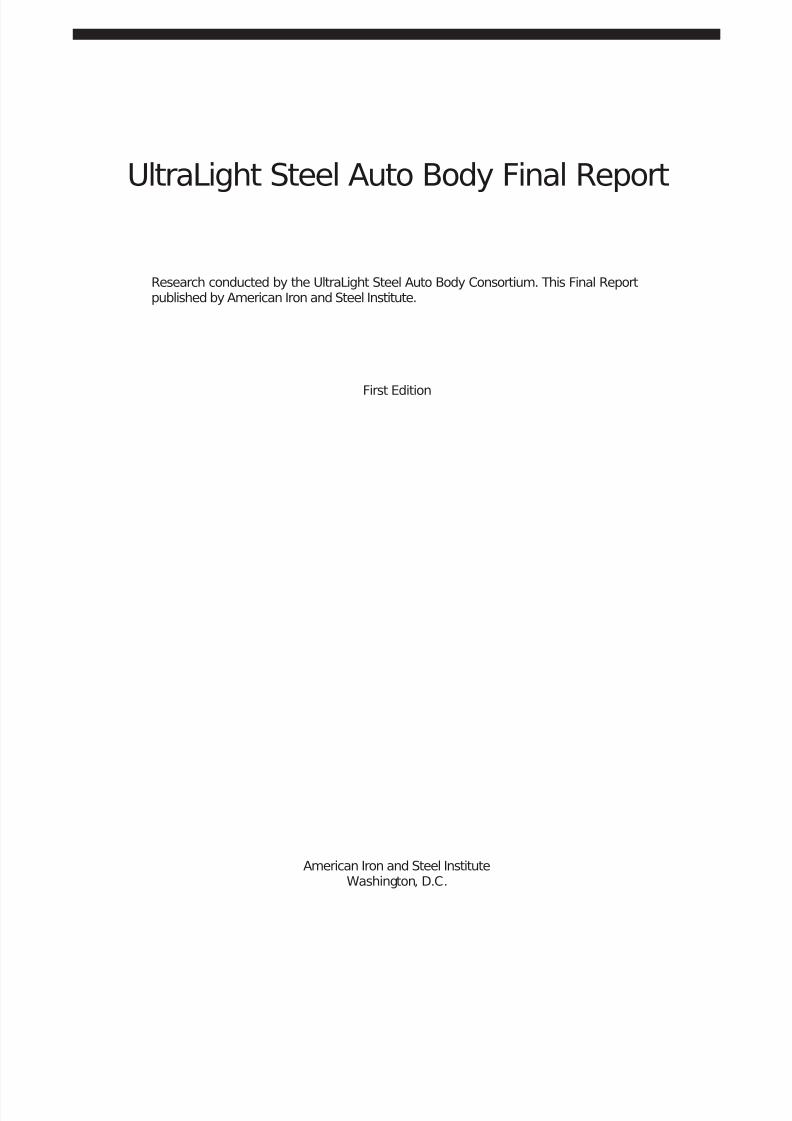
Copyright ©American Iron & Steel Institute
This publication is for general information only. The information init should not be used without first securing competent advice withrespect to its suitability for any given application. The publicationof the information is not intended as a representation or warrantyon the part of the American Iron and Steel Institute - or any otherperson named herein - that the information is suitable for anygeneral or particular use of freedom from infringement of anypatent or patents. Anyone making use of the information assumesall liability arising from such use.
March, 1998
7/29/2019 Ulsab Final Report (1).Ashx
http://slidepdf.com/reader/full/ulsab-final-report-1ashx 4/62
Contents
Preface v
Introduction vii
UltraLight Steel Auto Body Consortium ix
1. Design 1
1.1 Benchmarking 1
1.2 Design philosophy and architecture 3
1.3 Packaging 3
1.4 Styling 6
1.5 Material selection 7
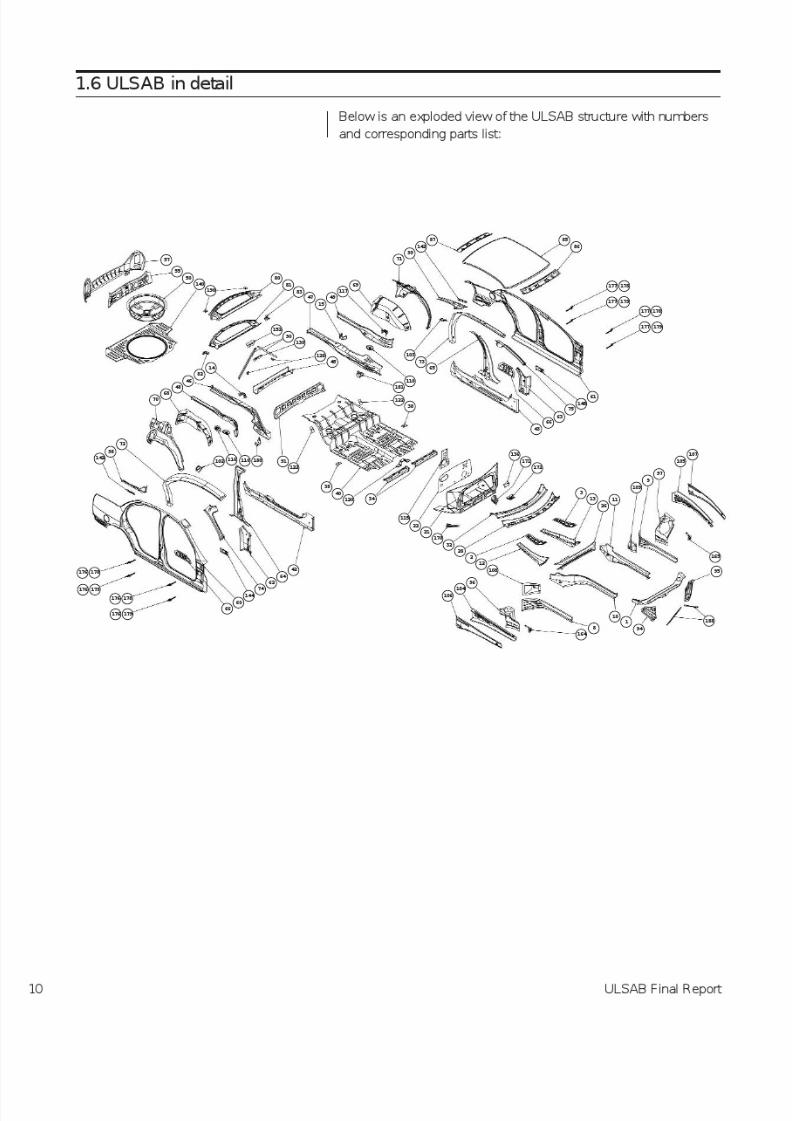
1.6 ULSAB in detail 10
2. Materials and Processes 15
2.1 Materials 15
2.1.1 High strength steel 15
2.1.2 Tailored blanks 16
2.1.3 Steel sandwich 19
2.2 Processes 19
2.2.1 Hydroforming 19
2.2.2 Assembly laser welding 21
3. Manufacturing 23
3.1 Early involvement 23
3.2 Tooling 23
3.3 Analysis 23
3.4 Part validation 243.5 Assembly 24
3.5.1 Sequence 24
3.5.2 Adhesive bonding 27
7/29/2019 Ulsab Final Report (1).Ashx
http://slidepdf.com/reader/full/ulsab-final-report-1ashx 5/62
4. Structural Performance 29
4.1 Validation 29
4.2 CAE Analysis 29
4.2.1 Static and modal analysis 30
4.2.2 Crash analysis 304.3 Physical testing 39
4.3.1 Static torsion test 39
4.3.2 Static bending test 39
4.3.3 Modal test 40
4.4 Results and prediction 41
4.5 Structural performance 42
4.6 Body structure 42
5. Economic Analysis 43
5.1 General inputs 44
5.2 Production costs 44
5.2.1 Fabrication 44
5.2.2 Assembly 44
5.3 Model scope 45
5.4 ULSAB results 45
5.4.1 Fabrication breakdown 46
5.4.2 Assembly breakdown 46
5.4.3 Investments 47
5.5 Sensitivity analysis 47
5.6 Comparison 48
5.7 Conclusion 50
iv
7/29/2019 Ulsab Final Report (1).Ashx
http://slidepdf.com/reader/full/ulsab-final-report-1ashx 6/62
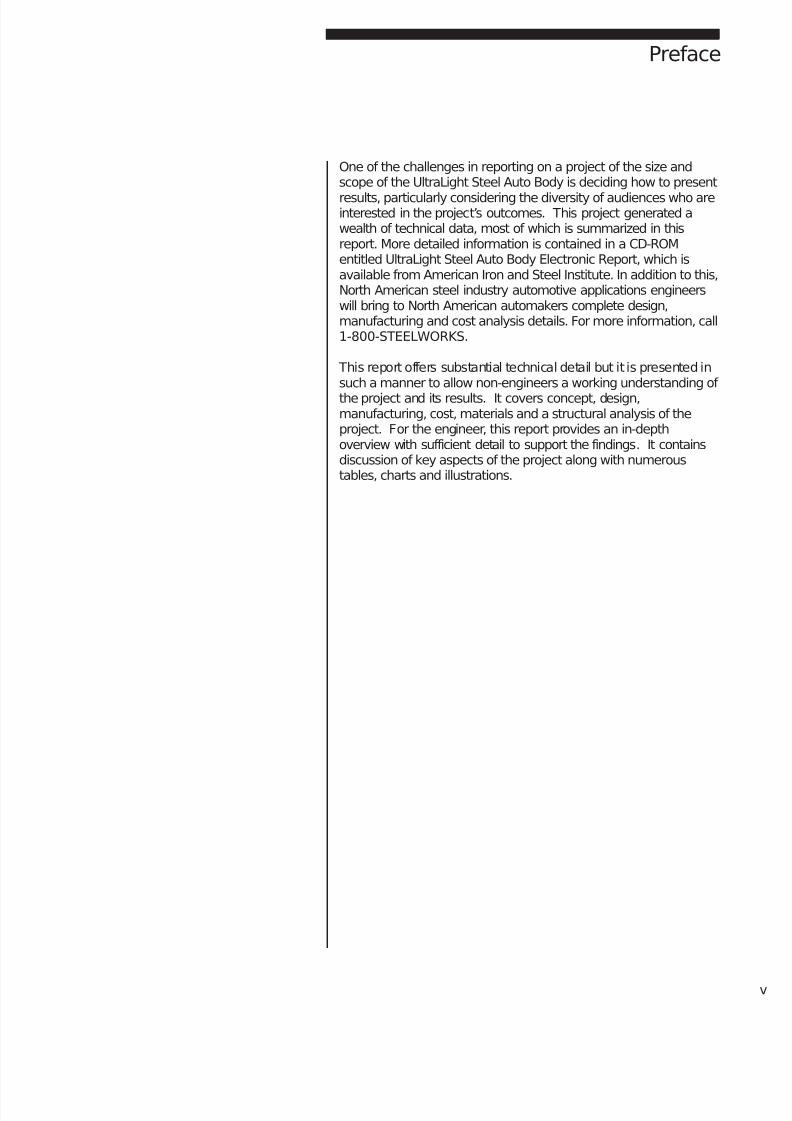
One of the challenges in reporting on a project of the size andscope of the UltraLight Steel Auto Body is deciding how to present
results, particularly considering the diversity of audiences who areinterested in the project’s outcomes. This project generated awealth of technical data, most of which is summarized in thisreport. More detailed information is contained in a CD-ROMentitled UltraLight Steel Auto Body Electronic Report, which isavailable from American Iron and Steel Institute. In addition to this,North American steel industry automotive applications engineerswill bring to North American automakers complete design,manufacturing and cost analysis details. For more information, call1-800-STEELWORKS.
This report offers substantial technical detail but it is presented insuch a manner to allow non-engineers a working understanding of the project and its results. It covers concept, design,manufacturing, cost, materials and a structural analysis of theproject. For the engineer, this report provides an in-depthoverview with sufficient detail to support the findings. It containsdiscussion of key aspects of the project along with numeroustables, charts and illustrations.
Preface

7/29/2019 Ulsab Final Report (1).Ashx
http://slidepdf.com/reader/full/ulsab-final-report-1ashx 7/62vi
7/29/2019 Ulsab Final Report (1).Ashx
http://slidepdf.com/reader/full/ulsab-final-report-1ashx 8/62
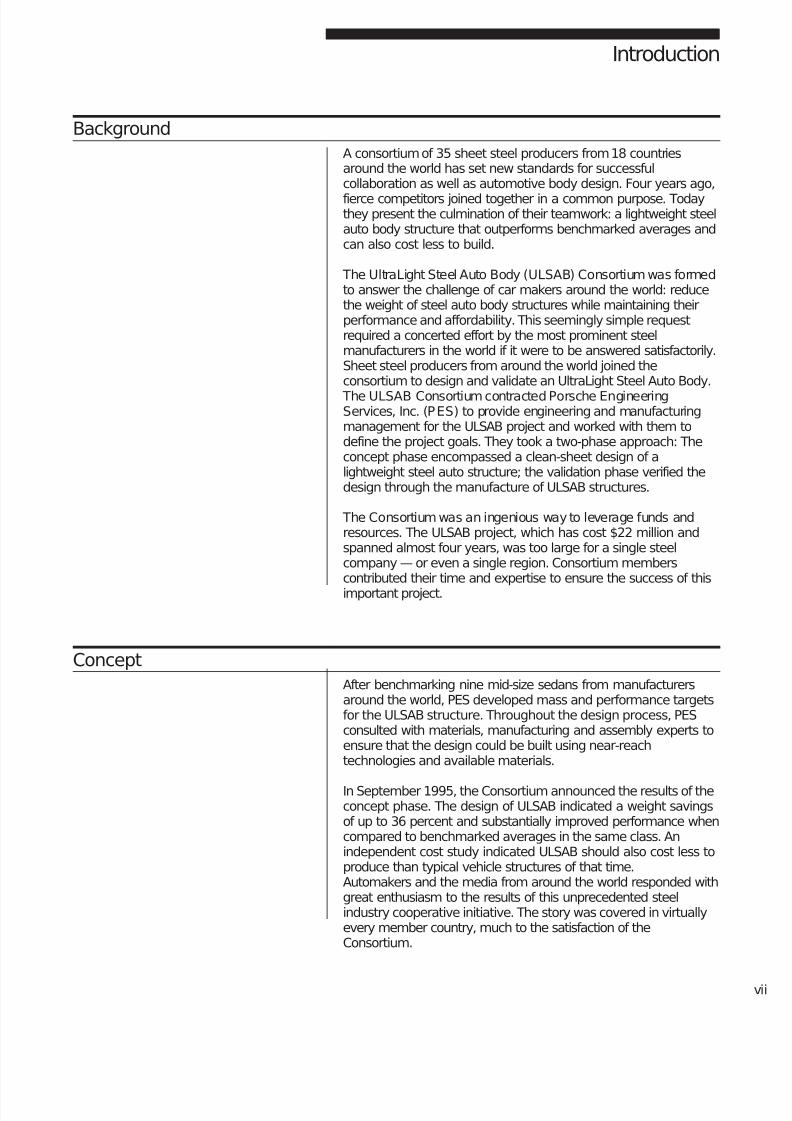
BackgroundA consortium of 35 sheet steel producers from 18 countriesaround the world has set new standards for successfulcollaboration as well as automotive body design. Four years ago,
fierce competitors joined together in a common purpose. Todaythey present the culmination of their teamwork: a lightweight steelauto body structure that outperforms benchmarked averages andcan also cost less to build.
The UltraLight Steel Auto Body (ULSAB) Consortium was formedto answer the challenge of car makers around the world: reducethe weight of steel auto body structures while maintaining theirperformance and affordability. This seemingly simple requestrequired a concerted effort by the most prominent steelmanufacturers in the world if it were to be answered satisfactorily.Sheet steel producers from around the world joined theconsortium to design and validate an UltraLight Steel Auto Body.
The ULSAB Consortium contracted Porsche EngineeringServices, Inc. (PES) to provide engineering and manufacturingmanagement for the ULSAB project and worked with them todefine the project goals. They took a two-phase approach: Theconcept phase encompassed a clean-sheet design of alightweight steel auto structure; the validation phase verified thedesign through the manufacture of ULSAB structures.
The Consortium was an ingenious way to leverage funds andresources. The ULSAB project, which has cost $22 million andspanned almost four years, was too large for a single steelcompany — or even a single region. Consortium memberscontributed their time and expertise to ensure the success of this
important project.
ConceptAfter benchmarking nine mid-size sedans from manufacturersaround the world, PES developed mass and performance targetsfor the ULSAB structure. Throughout the design process, PESconsulted with materials, manufacturing and assembly experts toensure that the design could be built using near-reachtechnologies and available materials.
In September 1995, the Consortium announced the results of theconcept phase. The design of ULSAB indicated a weight savingsof up to 36 percent and substantially improved performance whencompared to benchmarked averages in the same class. Anindependent cost study indicated ULSAB should also cost less toproduce than typical vehicle structures of that time.Automakers and the media from around the world responded withgreat enthusiasm to the results of this unprecedented steelindustry cooperative initiative. The story was covered in virtuallyevery member country, much to the satisfaction of theConsortium.
Introduction
7/29/2019 Ulsab Final Report (1).Ashx
http://slidepdf.com/reader/full/ulsab-final-report-1ashx 9/62
Validation
During the validation phase in late fall 1995, design andengineering of the ULSAB body structure were refined andfinalized. The Consortium then approved a $20 million bodystructure build phase to validate the concept. Strategies weredeveloped to communicate the progress during and at the
conclusion of the project.
Exterior styling was developed to create a recognizable look forthe auto structure. Consortium members provided material for theparts, and component fabricators were selected to build thecomponents. Assembly and testing of the body structures tookplace at Porsche in Germany. Also, a Porsche-led team of analysts conducted an in-depth economic analysis of the cost of ULSAB.
ResultsResults of the validation of ULSAB were announced to the worldin March 1998: The ULSAB structure weighs merely 203 kg, orup to 36 percent less than the heaviest of the benchmarkedvehicles. Physical tests of the structure reveal similar remarkableresults: torsion and bending tests showed improvements overbenchmark of 80 percent and 52 percent, respectively, and 1stbody structure mode indicates a 58 percent improvement.Analyses also show ULSAB satisfies mandated crashrequirements, even at speeds exceeding some of therequirements. In addition to reduced weight and superior
performance, ULSAB costs no more to build than typical autobody structures in its class and can even yield potential costsavings, according to economic analysis.
The ULSAB project employs many techniques and processes thatwere unique and deemed patentable by international attorneys.
The Consortium chose to make all patentable features along withother project results freely available to its customers and to thepublic. All intellectual property generated by ULSAB has beenplaced in the public domain.
ULSAB is a vivid example of the power of international, inter-
industry cooperation. The cooperative efforts of design engineers,steel producers, component fabricators, assembly experts andeconomists who worked on the project illustrate that automakerscan retain the benefits of steel while realizing substantial massreductions and increasing the performance of auto structures.
viii
7/29/2019 Ulsab Final Report (1).Ashx
http://slidepdf.com/reader/full/ulsab-final-report-1ashx 10/62
ACERALIA Corporación Siderurgica, S.A.AK Steel CorporationBethlehem Steel CorporationBHP SteelBritish Steel plcCockerill Sambre, S.A.Companhia Siderurgica Nacional (CSN)Dofasco Inc.Hoogovens Stahl BVInland Steel CompanyKawasaki Steel CorporationKobe Steel, Ltd.Krupp Hoesch Stahl AG/Krupp Hoesch Automotive GmbHLTV Steel Company, Inc.National Steel CorporationNippon Steel Corporation
NKK CorporationPohang Iron and Steel Co., Ltd. (POSCO)Preussag Stahl AGPT Krakatau SteelRouge Steel CompanySIDERAR S.A.I.C.SIDMAR NVSOLLAC - Usinor Sacilor GroupSSAB Tunnplät ABStelco Inc.Sumitomo Metal Industries, Ltd.
The Tata Iron and Steel Company, Ltd. (TISCO)
Thyssen Stahl AGU.S. Steel Group (USX Corporation)Usinas Siderurgicas de Minas Gerais (USIMINAS)VOEST-ALPINE STAHL LINZ GmbHVSZ a.s. KosiceWCI Steel, Inc.Weirton Steel Corporation
UltraLight Steel Auto Body Consortium

7/29/2019 Ulsab Final Report (1).Ashx
http://slidepdf.com/reader/full/ulsab-final-report-1ashx 11/62x

7/29/2019 Ulsab Final Report (1).Ashx
http://slidepdf.com/reader/full/ulsab-final-report-1ashx 12/62ULSAB Final Report
The first objective of the UltraLight Steel Auto Body (ULSAB)Consortium was to design a lightweight steel body structure that
would meet increased functional and structural performancetargets while remaining affordable. The consortium also specifiedthat, while the design should be leading edge, it must also befeasible using near-reach manufacturing processes.
1.1 Benchmarking
Porsche Engineering Services, Inc. (PES) benchmarked ninemid-sized sedans to determine current performance againstwhich to measure ULSAB. PES also established package
constraints through this benchmarking process. To determine an“average base model,” 32 different cars that represent varyingworldwide customer requirements were selected for packagebenchmarking. Benchmarking considered curb weight;wheelbase; overall length and width; leg, head and shoulderroom; passenger compartment; and cargo volume. Benchmarkingestablished the following package specifications:
Package benchmark specifications
body type 4-door sedan headroom 960/940 mm
front/rearwheelbase 2700 mm leg room 1060/890 mm
front/rear
overall length 4800 mm shoulder 1420/1400 mm
room f/r
overall width 1800 mm cargo volume 425 liters
curb weight 1350 kg engine type V6
passenger 5 drive front
1. Design
For structural benchmarking (static torsion, static bending, 1st
body structure mode), PES used a cross section of nine cars thatrepresented current performance standards. These vehiclesincluded the:
Acura Legend BMW 5-series Chevrolet Lumina Ford Taurus Honda Accord
Lexus LS 400 Mazda 929 Mercedes 190 E Toyota Cressida
7/29/2019 Ulsab Final Report (1).Ashx
http://slidepdf.com/reader/full/ulsab-final-report-1ashx 13/62ULSAB Final Report2
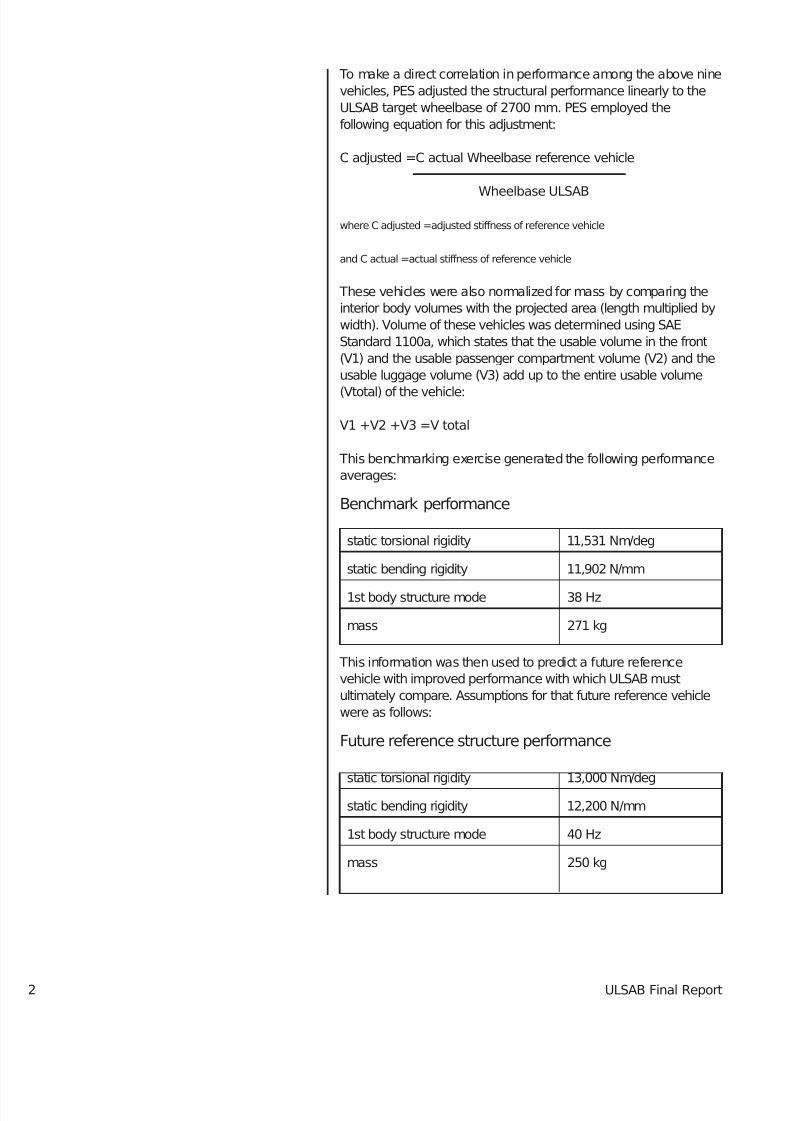
To make a direct correlation in performance among the above ninevehicles, PES adjusted the structural performance linearly to theULSAB target wheelbase of 2700 mm. PES employed thefollowing equation for this adjustment:
C adjusted =C actual Wheelbase reference vehicle
Wheelbase ULSAB
where C adjusted =adjusted stiffness of reference vehicle
and C actual =actual stiffness of reference vehicle
These vehicles were also normalized for mass by comparing theinterior body volumes with the projected area (length multiplied bywidth). Volume of these vehicles was determined using SAEStandard 1100a, which states that the usable volume in the front(V1) and the usable passenger compartment volume (V2) and theusable luggage volume (V3) add up to the entire usable volume
(Vtotal) of the vehicle:
V1 +V2 +V3 =V total
This benchmarking exercise generated the following performanceaverages:
Benchmark performance
static torsional rigidity 11,531 Nm/deg
static bending rigidity 11,902 N/mm
1st body structure mode 38 Hz
mass 271 kg
This information was then used to predict a future referencevehicle with improved performance with which ULSAB mustultimately compare. Assumptions for that future reference vehiclewere as follows:
Future reference structure performance
static torsional rigidity 13,000 Nm/deg
static bending rigidity 12,200 N/mm
1st body structure mode 40 Hz
mass 250 kg
7/29/2019 Ulsab Final Report (1).Ashx
http://slidepdf.com/reader/full/ulsab-final-report-1ashx 14/62ULSAB Final Report
1.2 Design philosophy and architecture
PES determined to employ an holistic philosophy toward design
early in the design process. This holistic approach treats the
body structure as an integrated system rather than an assembly
of individual components, emphasizing total body analysis.
Through each iterative step, sophisticated computer re-analysis
confirms the effectiveness of the latest optimizations. The holisticapproach also allows evaluation of how other areas are affected
by these changes and where future optimization opportunities
exist. This approach promotes weight savings and improved
structural integrity by enabling engineers to reduce weight in
certain areas while strengthening strategic locations. The net
effect is the creation of a more efficient structure.
PES investigated various concepts to develop the optimum
ULSAB body structure. Some of these included full frame, space
frame, unibody and hybrid solutions. Criteria for the structures
under consideration were significant weight savings potential,opportunity to achieve performance targets and assembly
possibilities in future full volume production body shops.
Early in the project PES engineers eliminated the full frame
concept because it offered no significant mass saving
opportunities. They also doubted that the full frame would meet
ULSAB’s structural performance criteria and were concerned
about high investment costs for assembly. Although a
spaceframe was considered, it was ultimately eliminated
because it was not considered as mass efficient as other
approaches. The PES team ultimately narrowed its investigation
to two structures—a unibody and a hydroform-intensive body
structure—finally settling on creating a unibody or monocoque
vehicle with key hydroformed parts.
1.3 Packaging
The first step in packaging was to define the vehicle concept
type, exterior and interior dimensions and main components.
With these package definitions, package drawings were created
and structural hard points defined. ULSAB did not save massthrough downsizing: its wheelbase is 2700 mm; vehicle width is
1819 mm; and vehicle length is 4714 mm.
7/29/2019 Ulsab Final Report (1).Ashx
http://slidepdf.com/reader/full/ulsab-final-report-1ashx 15/62ULSAB Final Report4
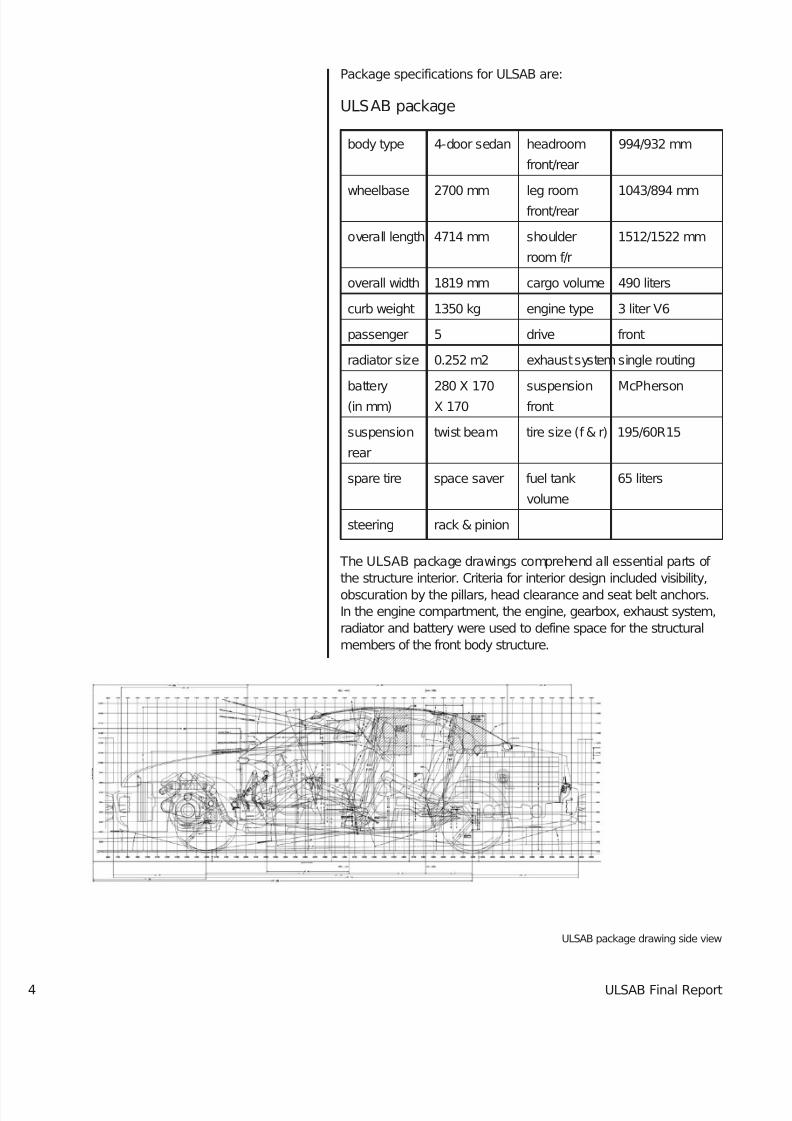
Package specifications for ULSAB are:
ULSAB package
body type 4-door sedan headroom 994/932 mm
front/rear
wheelbase 2700 mm leg room 1043/894 mmfront/rear
overall length 4714 mm shoulder 1512/1522 mm
room f/r
overall width 1819 mm cargo volume 490 liters
curb weight 1350 kg engine type 3 liter V6
passenger 5 drive front
radiator size 0.252 m2 exhaust systemsingle routing
battery 280 X 170 suspension McPherson(in mm) X 170 front
suspension twist beam tire size (f & r) 195/60R15
rear
spare tire space saver fuel tank 65 liters
volume
steering rack & pinion
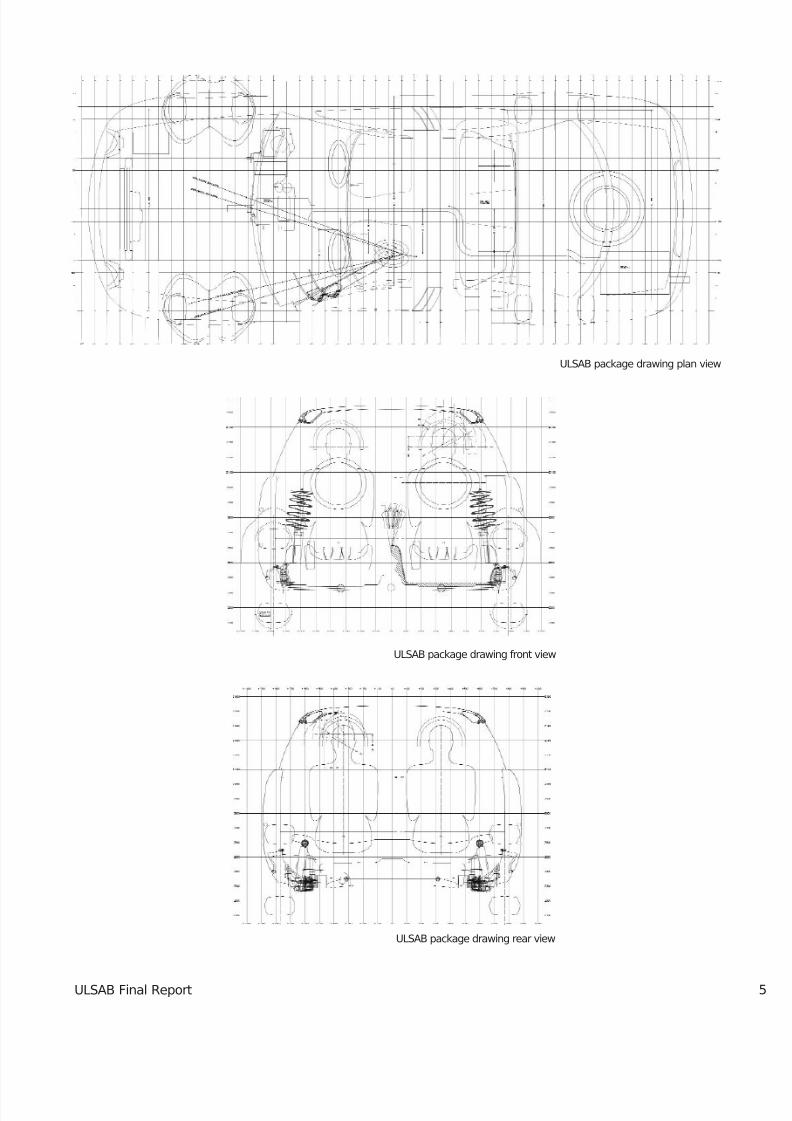
The ULSAB package drawings comprehend all essential parts of the structure interior. Criteria for interior design included visibility,
obscuration by the pillars, head clearance and seat belt anchors.In the engine compartment, the engine, gearbox, exhaust system,radiator and battery were used to define space for the structuralmembers of the front body structure.
ULSAB package drawing side view
7/29/2019 Ulsab Final Report (1).Ashx
http://slidepdf.com/reader/full/ulsab-final-report-1ashx 16/62ULSAB Final Report
ULSAB package drawing front view
ULSAB package drawing rear view
ULSAB package drawing plan view
7/29/2019 Ulsab Final Report (1).Ashx
http://slidepdf.com/reader/full/ulsab-final-report-1ashx 17/62ULSAB Final Report6
1.4 Styling
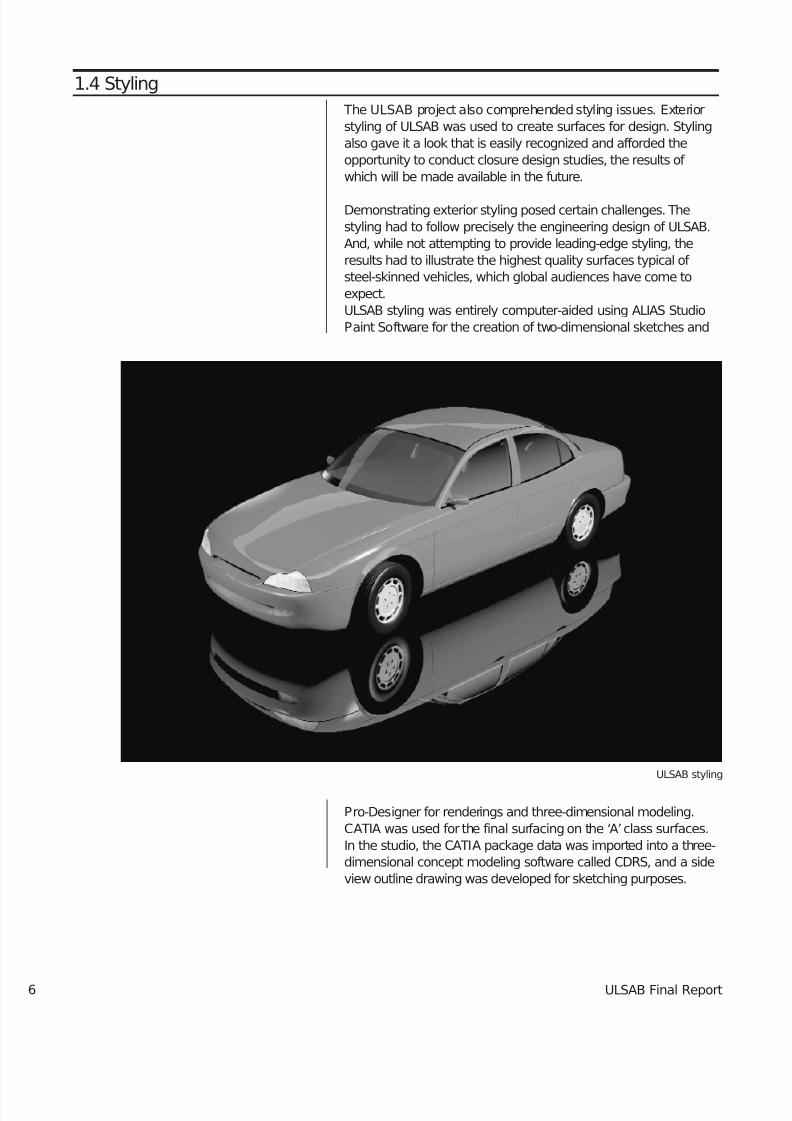
The ULSAB project also comprehended styling issues. Exteriorstyling of ULSAB was used to create surfaces for design. Stylingalso gave it a look that is easily recognized and afforded theopportunity to conduct closure design studies, the results of which will be made available in the future.
Demonstrating exterior styling posed certain challenges. Thestyling had to follow precisely the engineering design of ULSAB.And, while not attempting to provide leading-edge styling, theresults had to illustrate the highest quality surfaces typical of steel-skinned vehicles, which global audiences have come toexpect.ULSAB styling was entirely computer-aided using ALIAS StudioPaint Software for the creation of two-dimensional sketches and
Pro-Designer for renderings and three-dimensional modeling.CATIA was used for the final surfacing on the ‘A’class surfaces.In the studio, the CATIA package data was imported into a three-dimensional concept modeling software called CDRS, and a sideview outline drawing was developed for sketching purposes.
ULSAB styling
7/29/2019 Ulsab Final Report (1).Ashx
http://slidepdf.com/reader/full/ulsab-final-report-1ashx 18/62ULSAB Final Report
1.5 Material selection
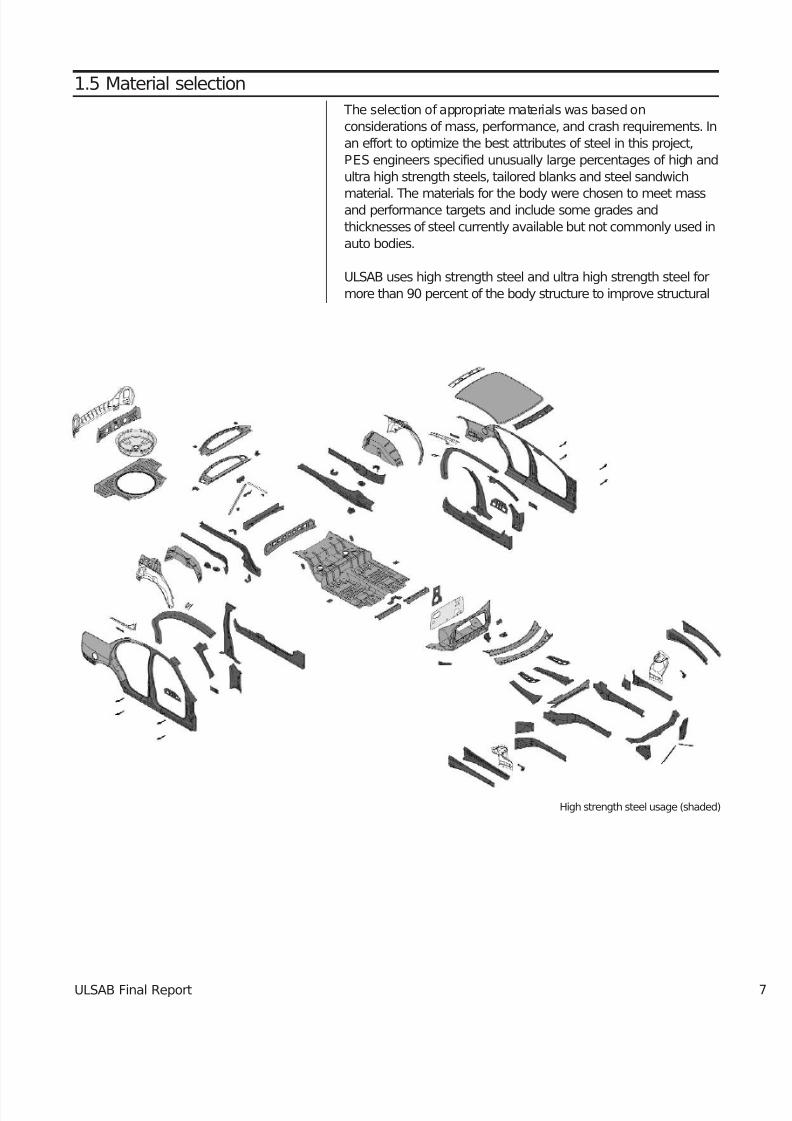
The selection of appropriate materials was based onconsiderations of mass, performance, and crash requirements. Inan effort to optimize the best attributes of steel in this project,PES engineers specified unusually large percentages of high andultra high strength steels, tailored blanks and steel sandwich
material. The materials for the body were chosen to meet massand performance targets and include some grades andthicknesses of steel currently available but not commonly used inauto bodies.
ULSAB uses high strength steel and ultra high strength steel formore than 90 percent of the body structure to improve structural
High strength steel usage (shaded)
7/29/2019 Ulsab Final Report (1).Ashx
http://slidepdf.com/reader/full/ulsab-final-report-1ashx 19/62ULSAB Final Report8
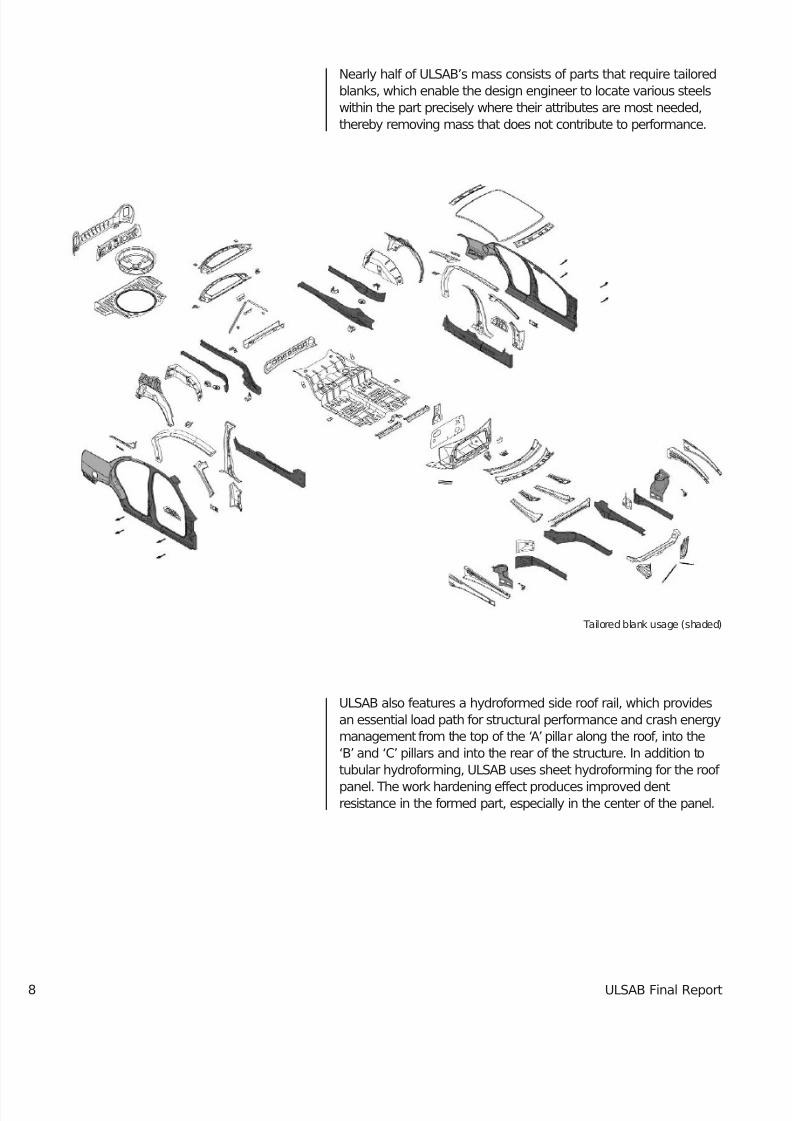
Nearly half of ULSAB’s mass consists of parts that require tailoredblanks, which enable the design engineer to locate various steelswithin the part precisely where their attributes are most needed,thereby removing mass that does not contribute to performance.
ULSAB also features a hydroformed side roof rail, which providesan essential load path for structural performance and crash energymanagement from the top of the ‘A’pillar along the roof, into the‘B’ and ‘C’ pillars and into the rear of the structure. In addition totubular hydroforming, ULSAB uses sheet hydroforming for the roof
panel. The work hardening effect produces improved dentresistance in the formed part, especially in the center of the panel.
Tailored blank usage (shaded)
7/29/2019 Ulsab Final Report (1).Ashx
http://slidepdf.com/reader/full/ulsab-final-report-1ashx 20/62ULSAB Final Report
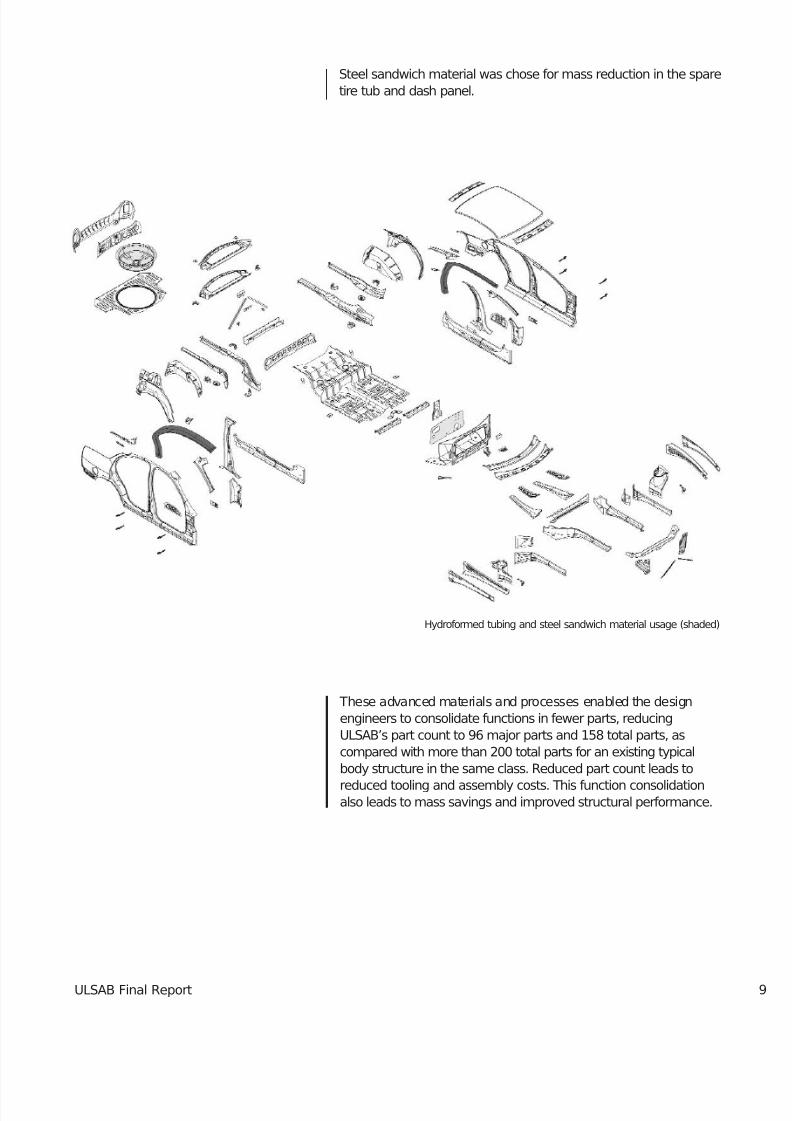
Steel sandwich material was chose for mass reduction in the sparetire tub and dash panel.
These advanced materials and processes enabled the designengineers to consolidate functions in fewer parts, reducingULSAB’s part count to 96 major parts and 158 total parts, ascompared with more than 200 total parts for an existing typicalbody structure in the same class. Reduced part count leads to
reduced tooling and assembly costs. This function consolidationalso leads to mass savings and improved structural performance.
Hydroformed tubing and steel sandwich material usage (shaded)
7/29/2019 Ulsab Final Report (1).Ashx
http://slidepdf.com/reader/full/ulsab-final-report-1ashx 21/62
7/29/2019 Ulsab Final Report (1).Ashx
http://slidepdf.com/reader/full/ulsab-final-report-1ashx 22/62ULSAB Final Report
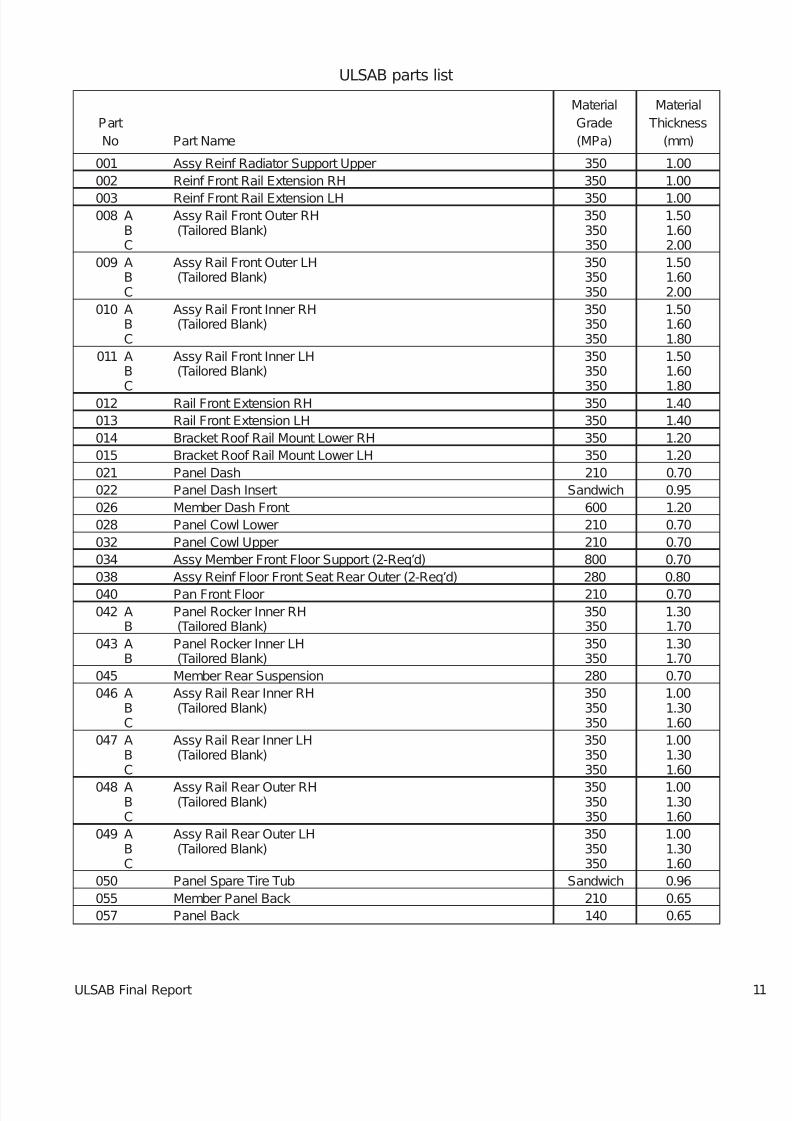
ULSAB parts list
Material Material
Part Grade Thickness
No Part Name (MPa) (mm)
001 Assy Reinf Radiator Support Upper 350 1.00
002 Reinf Front Rail Extension RH 350 1.00
003 Reinf Front Rail Extension LH 350 1.00008 A Assy Rail Front Outer RH 350 1.50
B (Tailored Blank) 350 1.60C 350 2.00
009 A Assy Rail Front Outer LH 350 1.50B (Tailored Blank) 350 1.60C 350 2.00
010 A Assy Rail Front Inner RH 350 1.50B (Tailored Blank) 350 1.60C 350 1.80
011 A Assy Rail Front Inner LH 350 1.50B (Tailored Blank) 350 1.60
C 350 1.80012 Rail Front Extension RH 350 1.40
013 Rail Front Extension LH 350 1.40
014 Bracket Roof Rail Mount Lower RH 350 1.20
015 Bracket Roof Rail Mount Lower LH 350 1.20
021 Panel Dash 210 0.70
022 Panel Dash Insert Sandwich 0.95
026 Member Dash Front 600 1.20
028 Panel Cowl Lower 210 0.70
032 Panel Cowl Upper 210 0.70
034 Assy Member Front Floor Support (2-Req’d) 800 0.70
038 Assy Reinf Floor Front Seat Rear Outer (2-Req’d) 280 0.80
040 Pan Front Floor 210 0.70042 A Panel Rocker Inner RH 350 1.30
B (Tailored Blank) 350 1.70
043 A Panel Rocker Inner LH 350 1.30B (Tailored Blank) 350 1.70
045 Member Rear Suspension 280 0.70
046 A Assy Rail Rear Inner RH 350 1.00B (Tailored Blank) 350 1.30C 350 1.60
047 A Assy Rail Rear Inner LH 350 1.00B (Tailored Blank) 350 1.30C 350 1.60
048 A Assy Rail Rear Outer RH 350 1.00B (Tailored Blank) 350 1.30C 350 1.60
049 A Assy Rail Rear Outer LH 350 1.00B (Tailored Blank) 350 1.30C 350 1.60
050 Panel Spare Tire Tub Sandwich 0.96
055 Member Panel Back 210 0.65
057 Panel Back 140 0.65
7/29/2019 Ulsab Final Report (1).Ashx
http://slidepdf.com/reader/full/ulsab-final-report-1ashx 23/62ULSAB Final Report12
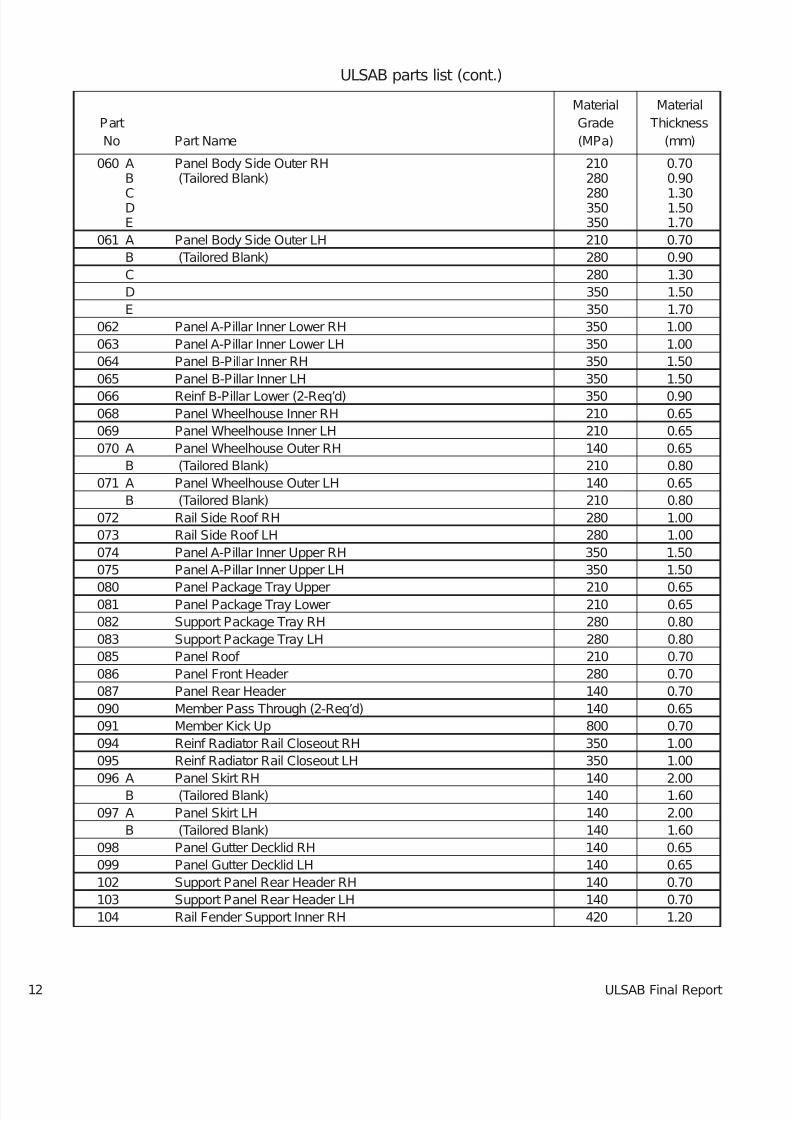
ULSAB parts list (cont.)
Material Material
Part Grade Thickness
No Part Name (MPa) (mm)
060 A Panel Body Side Outer RH 210 0.70B (Tailored Blank) 280 0.90
C 280 1.30D 350 1.50E 350 1.70
061 A Panel Body Side Outer LH 210 0.70
B (Tailored Blank) 280 0.90
C 280 1.30
D 350 1.50
E 350 1.70
062 Panel A-Pillar Inner Lower RH 350 1.00
063 Panel A-Pillar Inner Lower LH 350 1.00
064 Panel B-Pillar Inner RH 350 1.50
065 Panel B-Pillar Inner LH 350 1.50
066 Reinf B-Pillar Lower (2-Req’d) 350 0.90068 Panel Wheelhouse Inner RH 210 0.65
069 Panel Wheelhouse Inner LH 210 0.65
070 A Panel Wheelhouse Outer RH 140 0.65
B (Tailored Blank) 210 0.80
071 A Panel Wheelhouse Outer LH 140 0.65
B (Tailored Blank) 210 0.80
072 Rail Side Roof RH 280 1.00
073 Rail Side Roof LH 280 1.00
074 Panel A-Pillar Inner Upper RH 350 1.50
075 Panel A-Pillar Inner Upper LH 350 1.50
080 Panel Package Tray Upper 210 0.65081 Panel Package Tray Lower 210 0.65
082 Support Package Tray RH 280 0.80
083 Support Package Tray LH 280 0.80
085 Panel Roof 210 0.70
086 Panel Front Header 280 0.70
087 Panel Rear Header 140 0.70
090 Member Pass Through (2-Req’d) 140 0.65
091 Member Kick Up 800 0.70
094 Reinf Radiator Rail Closeout RH 350 1.00
095 Reinf Radiator Rail Closeout LH 350 1.00
096 A Panel Skirt RH 140 2.00
B (Tailored Blank) 140 1.60
097 A Panel Skirt LH 140 2.00
B (Tailored Blank) 140 1.60
098 Panel Gutter Decklid RH 140 0.65
099 Panel Gutter Decklid LH 140 0.65
102 Support Panel Rear Header RH 140 0.70
103 Support Panel Rear Header LH 140 0.70
104 Rail Fender Support Inner RH 420 1.20
7/29/2019 Ulsab Final Report (1).Ashx
http://slidepdf.com/reader/full/ulsab-final-report-1ashx 24/62ULSAB Final Report
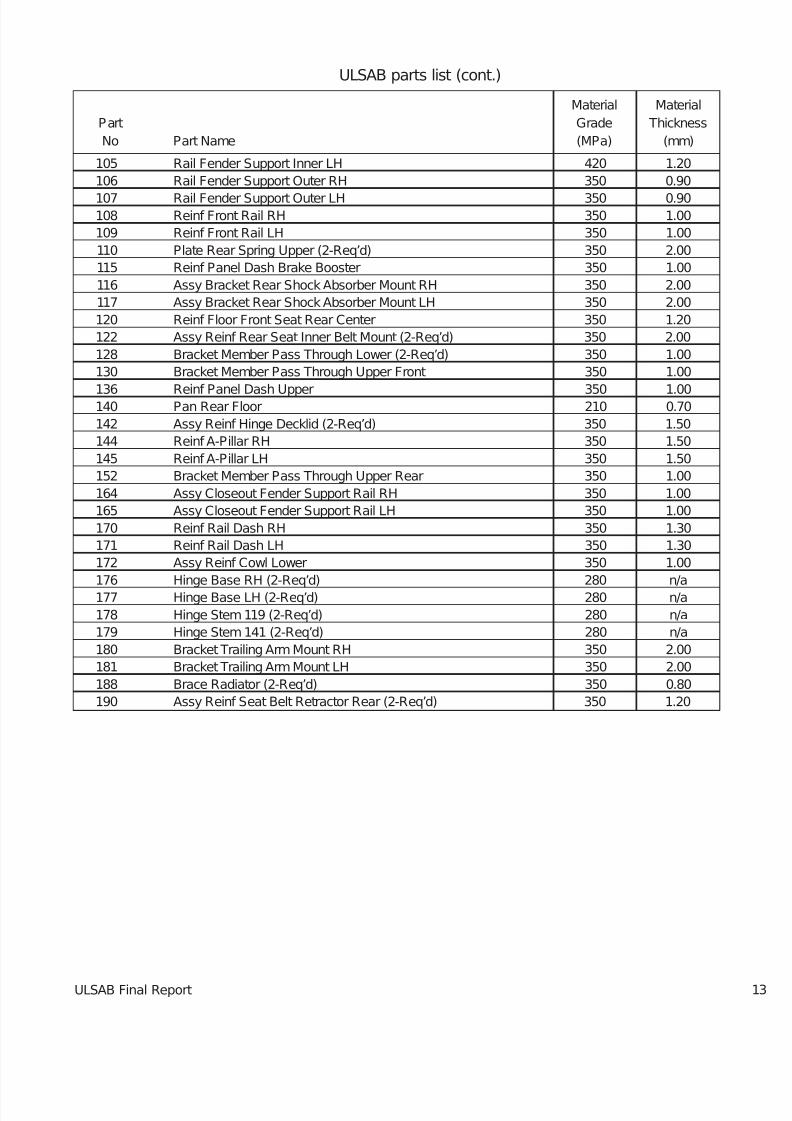
ULSAB parts list (cont.)
Material Material
Part Grade Thickness
No Part Name (MPa) (mm)
105 Rail Fender Support Inner LH 420 1.20
106 Rail Fender Support Outer RH 350 0.90
107 Rail Fender Support Outer LH 350 0.90108 Reinf Front Rail RH 350 1.00
109 Reinf Front Rail LH 350 1.00
110 Plate Rear Spring Upper (2-Req’d) 350 2.00
115 Reinf Panel Dash Brake Booster 350 1.00
116 Assy Bracket Rear Shock Absorber Mount RH 350 2.00
117 Assy Bracket Rear Shock Absorber Mount LH 350 2.00
120 Reinf Floor Front Seat Rear Center 350 1.20
122 Assy Reinf Rear Seat Inner Belt Mount (2-Req’d) 350 2.00
128 Bracket Member Pass Through Lower (2-Req’d) 350 1.00
130 Bracket Member Pass Through Upper Front 350 1.00
136 Reinf Panel Dash Upper 350 1.00140 Pan Rear Floor 210 0.70
142 Assy Reinf Hinge Decklid (2-Req’d) 350 1.50
144 Reinf A-Pillar RH 350 1.50
145 Reinf A-Pillar LH 350 1.50
152 Bracket Member Pass Through Upper Rear 350 1.00
164 Assy Closeout Fender Support Rail RH 350 1.00
165 Assy Closeout Fender Support Rail LH 350 1.00
170 Reinf Rail Dash RH 350 1.30
171 Reinf Rail Dash LH 350 1.30
172 Assy Reinf Cowl Lower 350 1.00
176 Hinge Base RH (2-Req’d) 280 n/a
177 Hinge Base LH (2-Req’d) 280 n/a
178 Hinge Stem 119 (2-Req’d) 280 n/a
179 Hinge Stem 141 (2-Req’d) 280 n/a
180 Bracket Trailing Arm Mount RH 350 2.00
181 Bracket Trailing Arm Mount LH 350 2.00
188 Brace Radiator (2-Req’d) 350 0.80
190 Assy Reinf Seat Belt Retractor Rear (2-Req’d) 350 1.20

7/29/2019 Ulsab Final Report (1).Ashx
http://slidepdf.com/reader/full/ulsab-final-report-1ashx 25/62ULSAB Final Report14
7/29/2019 Ulsab Final Report (1).Ashx
http://slidepdf.com/reader/full/ulsab-final-report-1ashx 26/62ULSAB Final Report
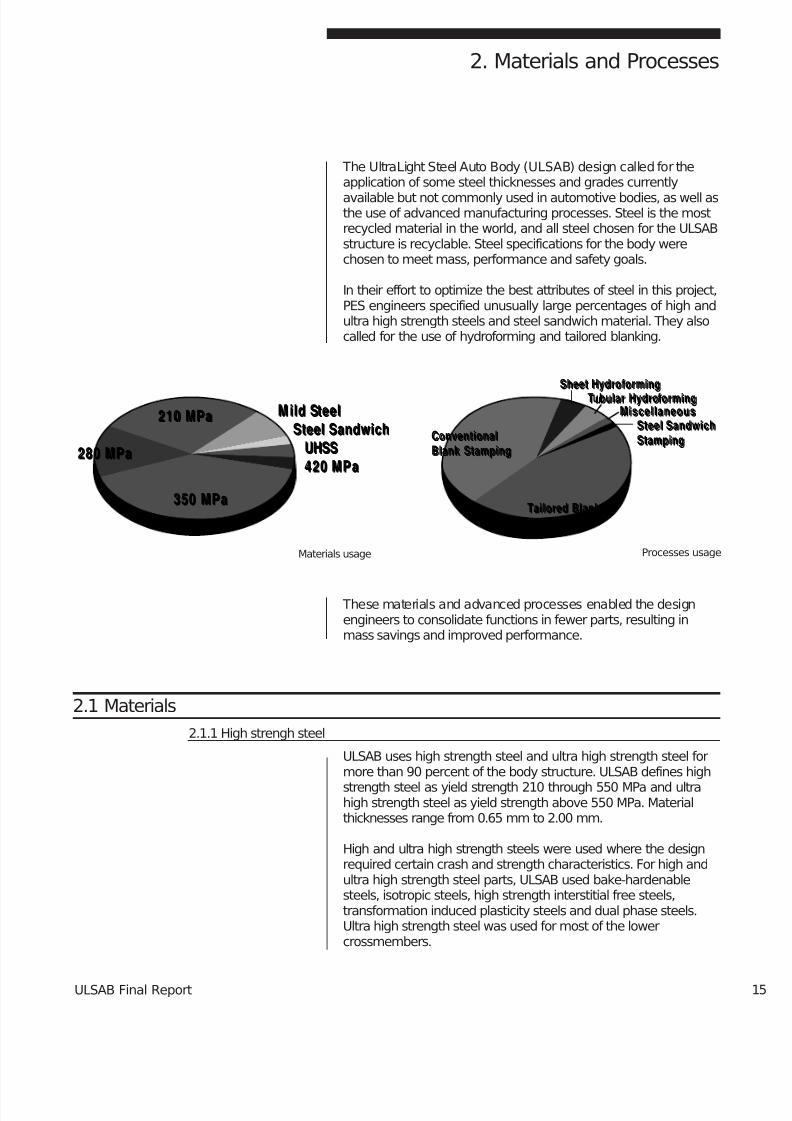
The UltraLight Steel Auto Body (ULSAB) design called for theapplication of some steel thicknesses and grades currently
available but not commonly used in automotive bodies, as well asthe use of advanced manufacturing processes. Steel is the mostrecycled material in the world, and all steel chosen for the ULSABstructure is recyclable. Steel specifications for the body werechosen to meet mass, performance and safety goals.
In their effort to optimize the best attributes of steel in this project,PES engineers specified unusually large percentages of high andultra high strength steels and steel sandwich material. They alsocalled for the use of hydroforming and tailored blanking.
2. Materials and Processes
These materials and advanced processes enabled the designengineers to consolidate functions in fewer parts, resulting inmass savings and improved performance.
2.1 Materials
2.1.1 High strengh steel
ULSAB uses high strength steel and ultra high strength steel formore than 90 percent of the body structure. ULSAB defines high
strength steel as yield strength 210 through 550 MPa and ultrahigh strength steel as yield strength above 550 MPa. Materialthicknesses range from 0.65 mm to 2.00 mm.
High and ultra high strength steels were used where the designrequired certain crash and strength characteristics. For high andultra high strength steel parts, ULSAB used bake-hardenablesteels, isotropic steels, high strength interstitial free steels,transformation induced plasticity steels and dual phase steels.Ultra high strength steel was used for most of the lowercrossmembers.
210 MPa210 MPa
280 MPa280 MPa
350 MPa350 MPa
M ild SteelSteel Sandwich
UHSS420 MPa
M ild Steel
Steel SandwichUHSS
420 MPa
Materials usage
Sheet HydroformingSheet Hydroforming
MiscellaneousMiscellaneousTubular HydroformingTubular Hydroforming
Steel Sandwich
Stamping
Steel Sandwich
Stamping
Tailored Blank
Stamping
Tailored Blank
Stamping
Conventional
Blank Stamping
Conventional
Blank Stamping
Processes usage
7/29/2019 Ulsab Final Report (1).Ashx
http://slidepdf.com/reader/full/ulsab-final-report-1ashx 27/62ULSAB Final Report16
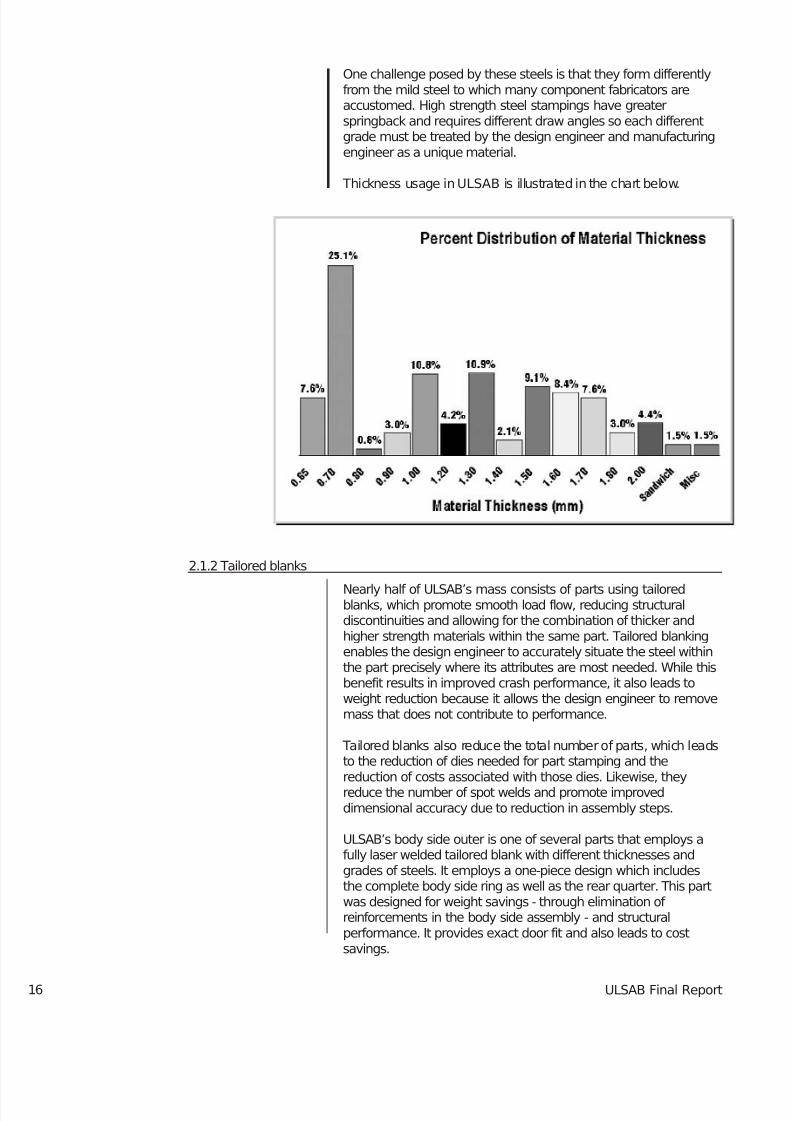
One challenge posed by these steels is that they form differentlyfrom the mild steel to which many component fabricators areaccustomed. High strength steel stampings have greaterspringback and requires different draw angles so each differentgrade must be treated by the design engineer and manufacturingengineer as a unique material.
Thickness usage in ULSAB is illustrated in the chart below.
2.1.2 Tailored blanks
Nearly half of ULSAB’s mass consists of parts using tailoredblanks, which promote smooth load flow, reducing structuraldiscontinuities and allowing for the combination of thicker andhigher strength materials within the same part. Tailored blankingenables the design engineer to accurately situate the steel withinthe part precisely where its attributes are most needed. While thisbenefit results in improved crash performance, it also leads toweight reduction because it allows the design engineer to removemass that does not contribute to performance.
Tailored blanks also reduce the total number of parts, which leadsto the reduction of dies needed for part stamping and thereduction of costs associated with those dies. Likewise, theyreduce the number of spot welds and promote improveddimensional accuracy due to reduction in assembly steps.
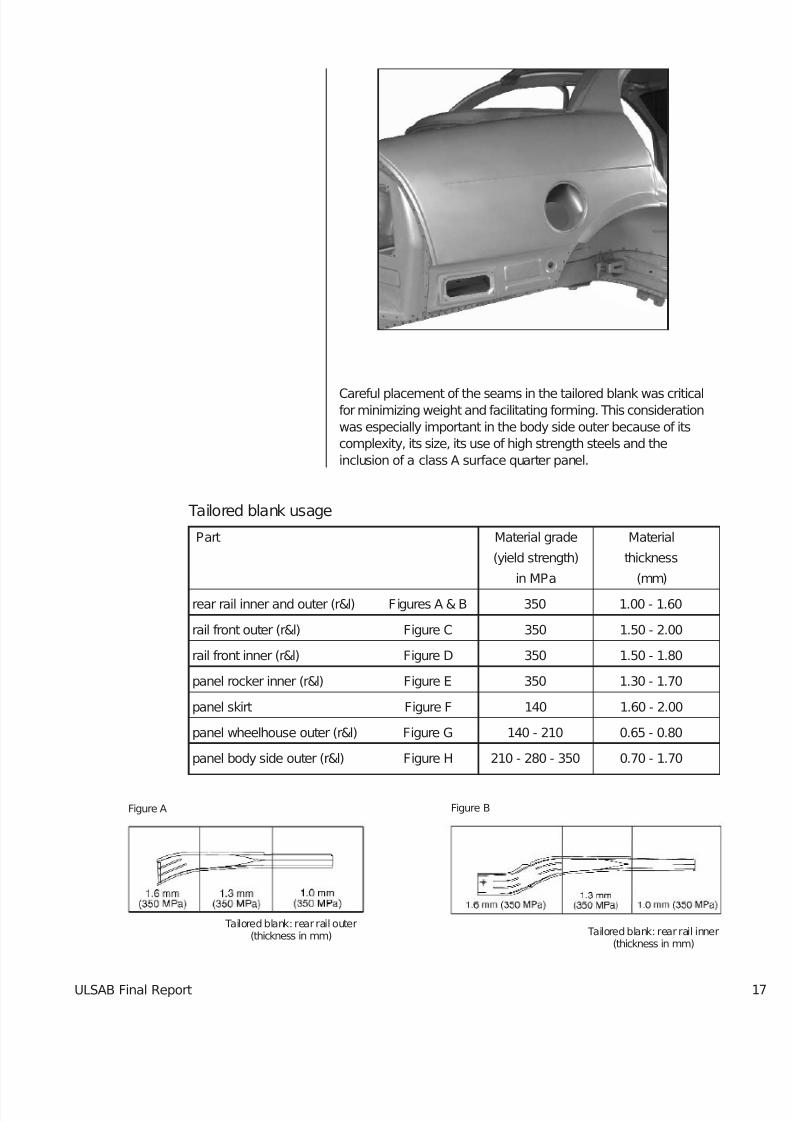
ULSAB’s body side outer is one of several parts that employs afully laser welded tailored blank with different thicknesses andgrades of steels. It employs a one-piece design which includesthe complete body side ring as well as the rear quarter. This partwas designed for weight savings - through elimination of reinforcements in the body side assembly - and structuralperformance. It provides exact door fit and also leads to costsavings.
7/29/2019 Ulsab Final Report (1).Ashx
http://slidepdf.com/reader/full/ulsab-final-report-1ashx 28/62ULSAB Final Report
Careful placement of the seams in the tailored blank was criticalfor minimizing weight and facilitating forming. This considerationwas especially important in the body side outer because of itscomplexity, its size, its use of high strength steels and theinclusion of a class A surface quarter panel.
Tailored blank: rear rail outer(thickness in mm) Tailored blank: rear rail inner
(thickness in mm)
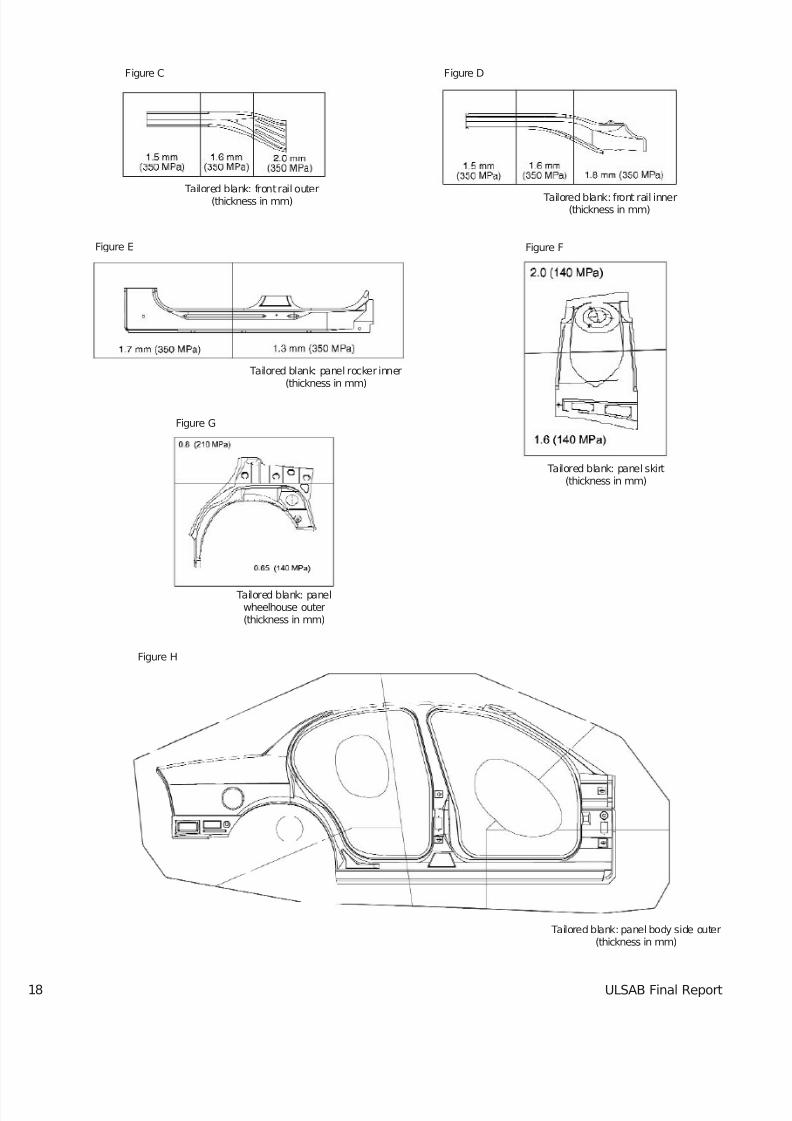
Tailored blank usage
Part Material grade Material
(yield strength) thickness
in MPa (mm)
rear rail inner and outer (r&l) Figures A & B 350 1.00 - 1.60
rail front outer (r&l) Figure C 350 1.50 - 2.00
rail front inner (r&l) Figure D 350 1.50 - 1.80
panel rocker inner (r&l) Figure E 350 1.30 - 1.70
panel skirt Figure F 140 1.60 - 2.00
panel wheelhouse outer (r&l) Figure G 140 - 210 0.65 - 0.80
panel body side outer (r&l) Figure H 210 - 280 - 350 0.70 - 1.70
Figure A Figure B
7/29/2019 Ulsab Final Report (1).Ashx
http://slidepdf.com/reader/full/ulsab-final-report-1ashx 29/62ULSAB Final Report18
Tailored blank: front rail outer(thickness in mm) Tailored blank: front rail inner
(thickness in mm)
Tailored blank: panel rocker inner(thickness in mm)
Tailored blank: panel skirt(thickness in mm)
Tailored blank: panelwheelhouse outer(thickness in mm)
Tailored blank: panel body side outer(thickness in mm)
Figure C Figure D
Figure E
Figure G
Figure F
Figure H
7/29/2019 Ulsab Final Report (1).Ashx
http://slidepdf.com/reader/full/ulsab-final-report-1ashx 30/62ULSAB Final Report
2.1.3 Steel sandwich
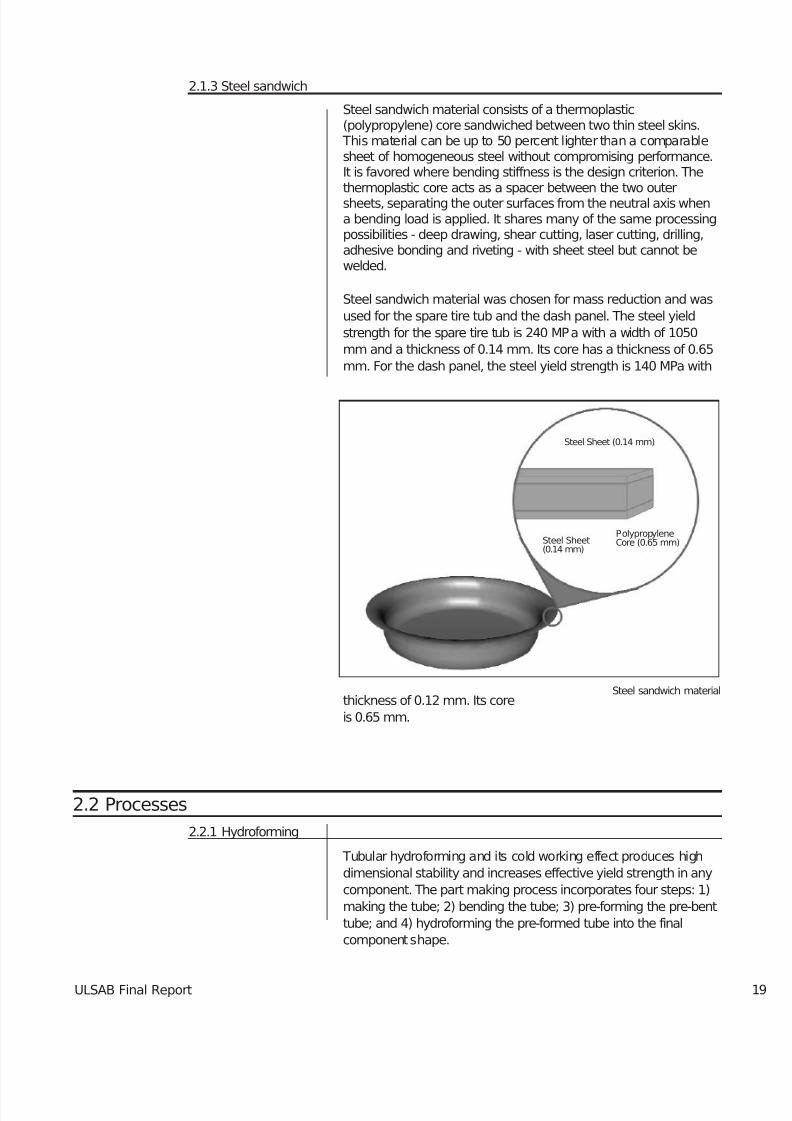
Steel sandwich material consists of a thermoplastic(polypropylene) core sandwiched between two thin steel skins.
This material can be up to 50 percent lighter than a comparablesheet of homogeneous steel without compromising performance.It is favored where bending stiffness is the design criterion. Thethermoplastic core acts as a spacer between the two outersheets, separating the outer surfaces from the neutral axis whena bending load is applied. It shares many of the same processingpossibilities - deep drawing, shear cutting, laser cutting, drilling,adhesive bonding and riveting - with sheet steel but cannot bewelded.
Steel sandwich material was chosen for mass reduction and wasused for the spare tire tub and the dash panel. The steel yieldstrength for the spare tire tub is 240 MPa with a width of 1050mm and a thickness of 0.14 mm. Its core has a thickness of 0.65mm. For the dash panel, the steel yield strength is 140 MPa with
thickness of 0.12 mm. Its coreis 0.65 mm.
2.2 Processes
2.2.1 Hydroforming
Tubular hydroforming and its cold working effect produces highdimensional stability and increases effective yield strength in anycomponent. The part making process incorporates four steps: 1)making the tube; 2) bending the tube; 3) pre-forming the pre-benttube; and 4) hydroforming the pre-formed tube into the finalcomponent shape.
Steel sandwich material
Steel Sheet (0.14 mm)
Steel Sheet(0.14 mm)
PolypropyleneCore (0.65 mm)
7/29/2019 Ulsab Final Report (1).Ashx
http://slidepdf.com/reader/full/ulsab-final-report-1ashx 31/62ULSAB Final Report20
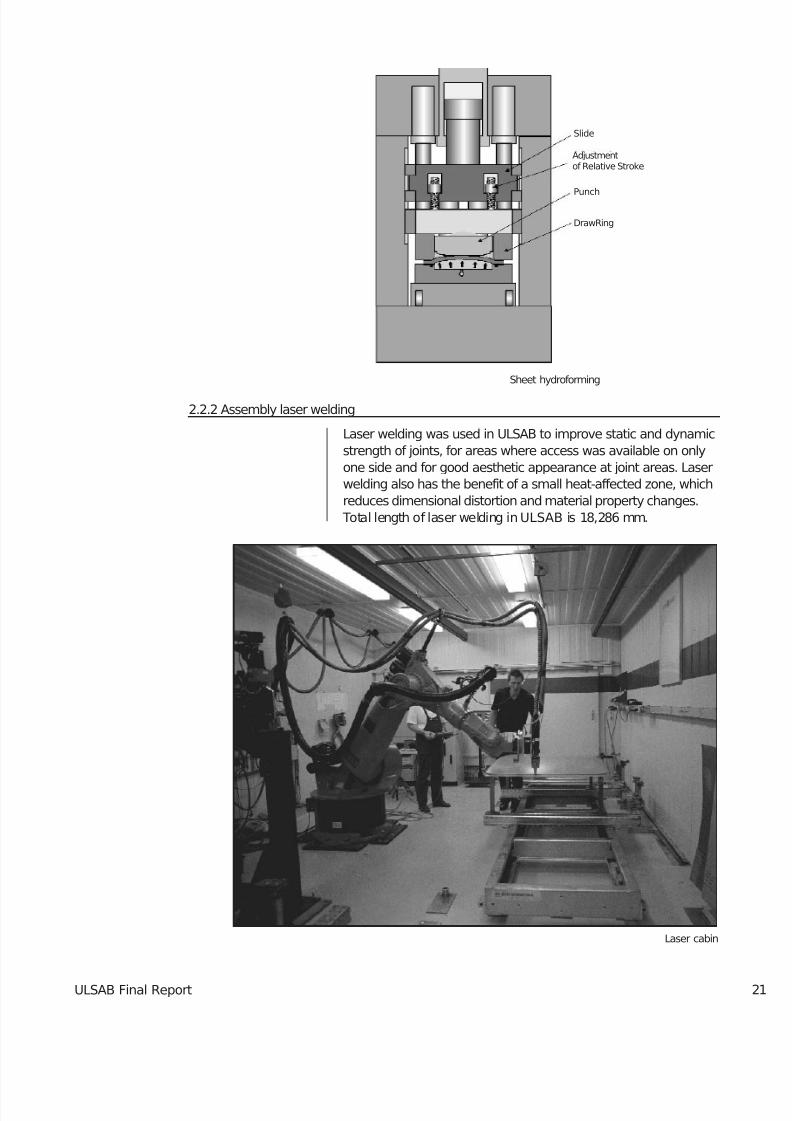
Sheet hydroforming was chosen for the roof panel for weightreduction. This process provided the opportunity to manufacturethe roof panel at a thinner gauge and still achieve a workhardening effect, especially in the center area where the degreeof stretch is normally minimal.
With sheet hydroforming, the work hardening effect is achieved byusing fluid pressure to stretch the blanks in the opposite directiontowards the punch. This plastic elongation causes a workhardening effect in the center area of the blank. In the secondstep, the punch forms the panel towards controlled fluid pressureachieving excellent part quality because there is no metal-to-metalcontact on the outer part surface. The roof panel is manufacturedin 0.70 mm high strength isotropic steel with a yield strength of 210 MPa.
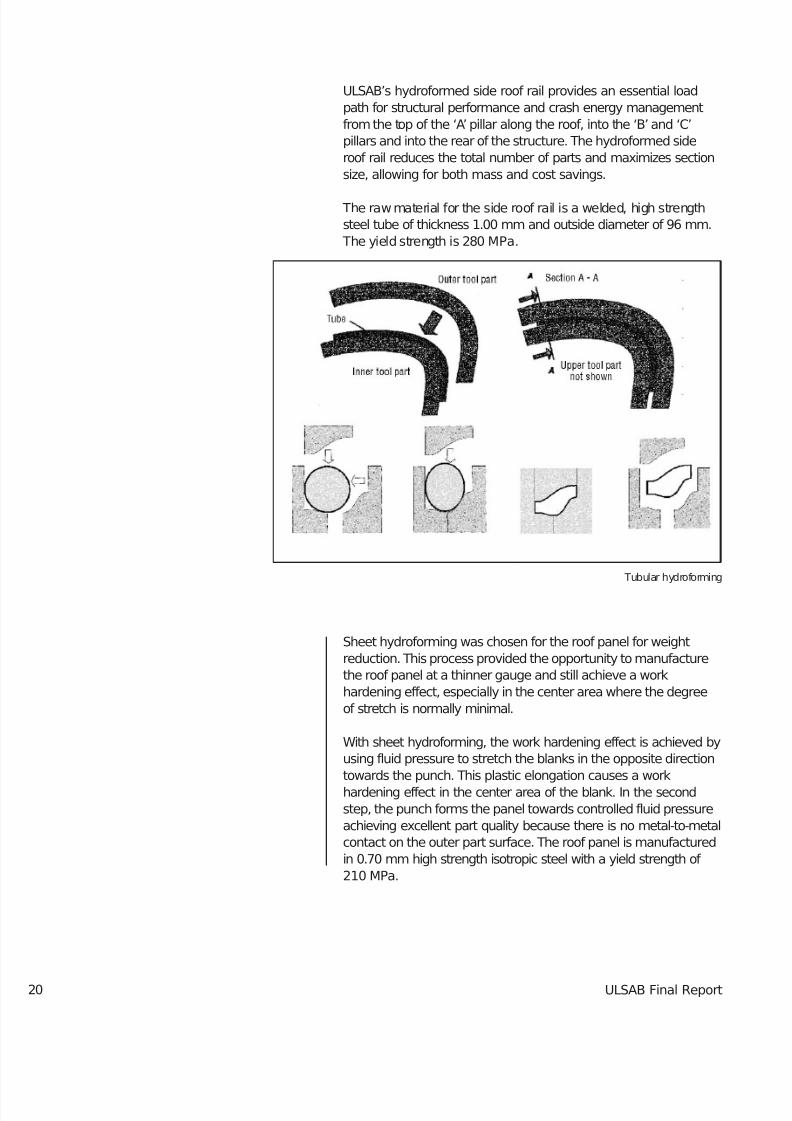
ULSAB’s hydroformed side roof rail provides an essential loadpath for structural performance and crash energy managementfrom the top of the ‘A’ pillar along the roof, into the ‘B’ and ‘C’pillars and into the rear of the structure. The hydroformed sideroof rail reduces the total number of parts and maximizes sectionsize, allowing for both mass and cost savings.
The raw material for the side roof rail is a welded, high strengthsteel tube of thickness 1.00 mm and outside diameter of 96 mm.
The yield strength is 280 MPa.
Tubular hydroforming
7/29/2019 Ulsab Final Report (1).Ashx
http://slidepdf.com/reader/full/ulsab-final-report-1ashx 32/62ULSAB Final Report
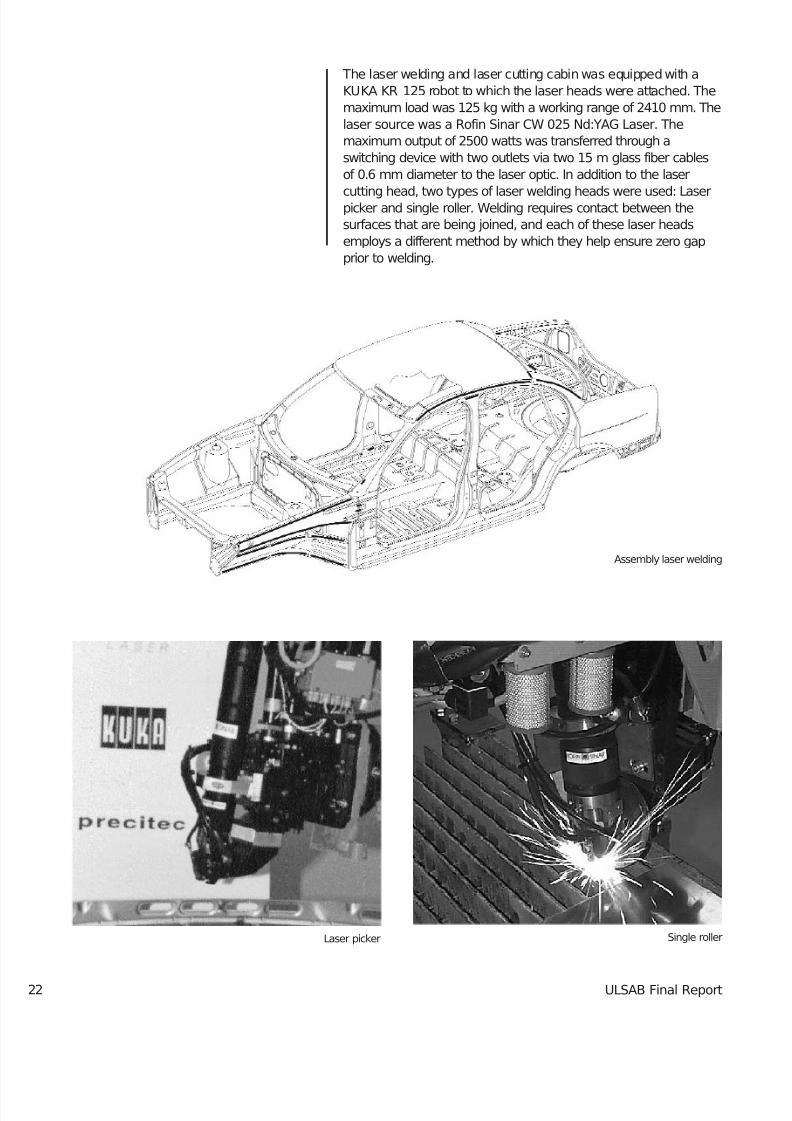
2.2.2 Assembly laser welding
Laser welding was used in ULSAB to improve static and dynamicstrength of joints, for areas where access was available on onlyone side and for good aesthetic appearance at joint areas. Laserwelding also has the benefit of a small heat-affected zone, whichreduces dimensional distortion and material property changes.
Total length of laser welding in ULSAB is 18,286 mm.
Laser cabin
Sheet hydroforming
Slide
Punch
DrawRing
Adjustmentof Relative Stroke
7/29/2019 Ulsab Final Report (1).Ashx
http://slidepdf.com/reader/full/ulsab-final-report-1ashx 33/62ULSAB Final Report22
Laser picker Single roller
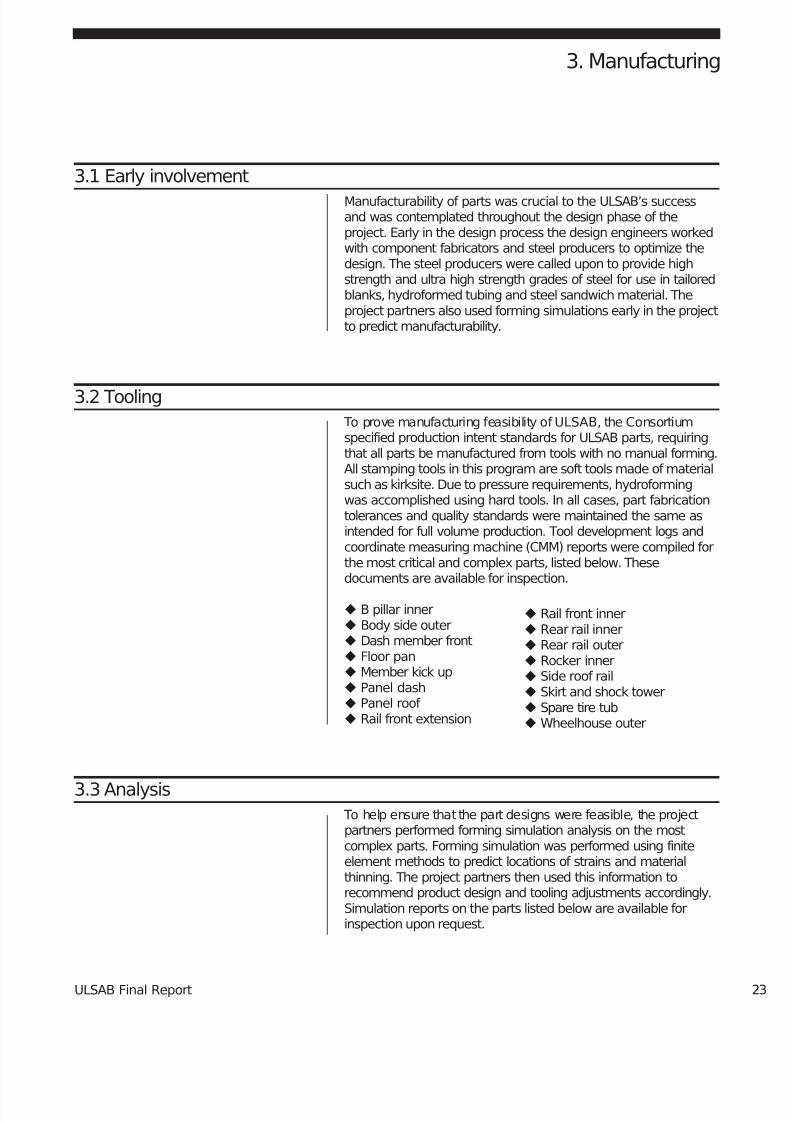
Assembly laser welding
The laser welding and laser cutting cabin was equipped with aKUKA KR 125 robot to which the laser heads were attached. Themaximum load was 125 kg with a working range of 2410 mm. Thelaser source was a Rofin Sinar CW 025 Nd:YAG Laser. Themaximum output of 2500 watts was transferred through aswitching device with two outlets via two 15 m glass fiber cablesof 0.6 mm diameter to the laser optic. In addition to the laser
cutting head, two types of laser welding heads were used: Laserpicker and single roller. Welding requires contact between thesurfaces that are being joined, and each of these laser headsemploys a different method by which they help ensure zero gapprior to welding.
7/29/2019 Ulsab Final Report (1).Ashx
http://slidepdf.com/reader/full/ulsab-final-report-1ashx 34/62ULSAB Final Report
3. Manufacturing
3.1 Early involvement
Manufacturability of parts was crucial to the ULSAB’s successand was contemplated throughout the design phase of theproject. Early in the design process the design engineers workedwith component fabricators and steel producers to optimize thedesign. The steel producers were called upon to provide highstrength and ultra high strength grades of steel for use in tailoredblanks, hydroformed tubing and steel sandwich material. Theproject partners also used forming simulations early in the projectto predict manufacturability.
3.2 Tooling To prove manufacturing feasibility of ULSAB, the Consortiumspecified production intent standards for ULSAB parts, requiringthat all parts be manufactured from tools with no manual forming.All stamping tools in this program are soft tools made of materialsuch as kirksite. Due to pressure requirements, hydroformingwas accomplished using hard tools. In all cases, part fabricationtolerances and quality standards were maintained the same asintended for full volume production. Tool development logs andcoordinate measuring machine (CMM) reports were compiled forthe most critical and complex parts, listed below. Thesedocuments are available for inspection.
B pillar inner Body side outer Dash member front Floor pan Member kick up Panel dash Panel roof Rail front extension
3.3 Analysis To help ensure that the part designs were feasible, the projectpartners performed forming simulation analysis on the mostcomplex parts. Forming simulation was performed using finiteelement methods to predict locations of strains and materialthinning. The project partners then used this information torecommend product design and tooling adjustments accordingly.Simulation reports on the parts listed below are available forinspection upon request.
Rail front inner Rear rail inner Rear rail outer Rocker inner Side roof rail Skirt and shock tower Spare tire tubWheelhouse outer
7/29/2019 Ulsab Final Report (1).Ashx
http://slidepdf.com/reader/full/ulsab-final-report-1ashx 35/62ULSAB Final Report24
B pillar inner Body side outer Floor pan Panel roof
3.4 Part validationUpon completion of tooling, the component fabricatorsmanufactured the parts and evaluated them using circle gridstrain analysis to confirm that they were formed to full volumemanufacturing standards. Confirmation was also establishedthrough measurement of key part dimensions and the use of checking fixtures. Complete information to support partmanufacturing feasibility was documented and includes materialcharacteristics, press conditions, forming limit diagrams, processsheets and tolerance measurements. These reports comprehendall parts listed under section “Tooling” in this report and areavailable for inspection upon request.
3.5 Assembly
3.5.1 Sequence
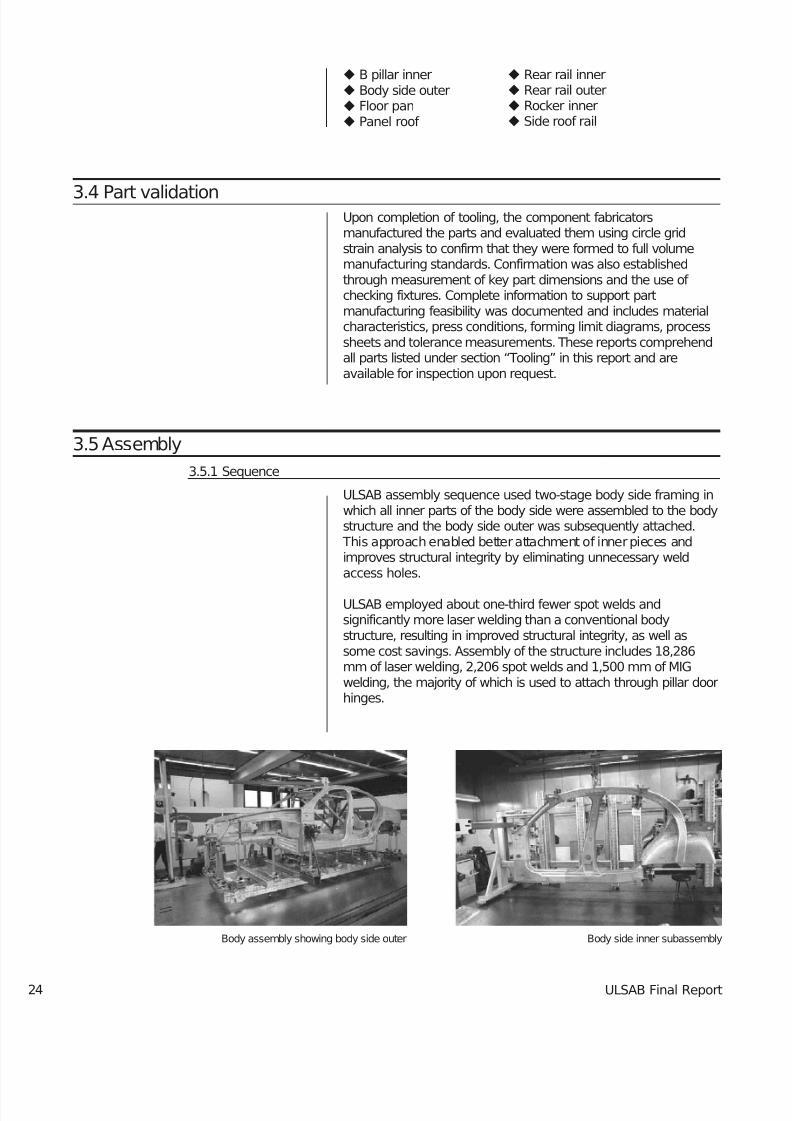
ULSAB assembly sequence used two-stage body side framing inwhich all inner parts of the body side were assembled to the bodystructure and the body side outer was subsequently attached.
This approach enabled better attachment of inner pieces andimproves structural integrity by eliminating unnecessary weldaccess holes.
ULSAB employed about one-third fewer spot welds andsignificantly more laser welding than a conventional bodystructure, resulting in improved structural integrity, as well assome cost savings. Assembly of the structure includes 18,286mm of laser welding, 2,206 spot welds and 1,500 mm of MIGwelding, the majority of which is used to attach through pillar doorhinges.
Rear rail inner Rear rail outer Rocker inner Side roof rail
Body assembly showing body side outer Body side inner subassembly
7/29/2019 Ulsab Final Report (1).Ashx
http://slidepdf.com/reader/full/ulsab-final-report-1ashx 36/62ULSAB Final Report
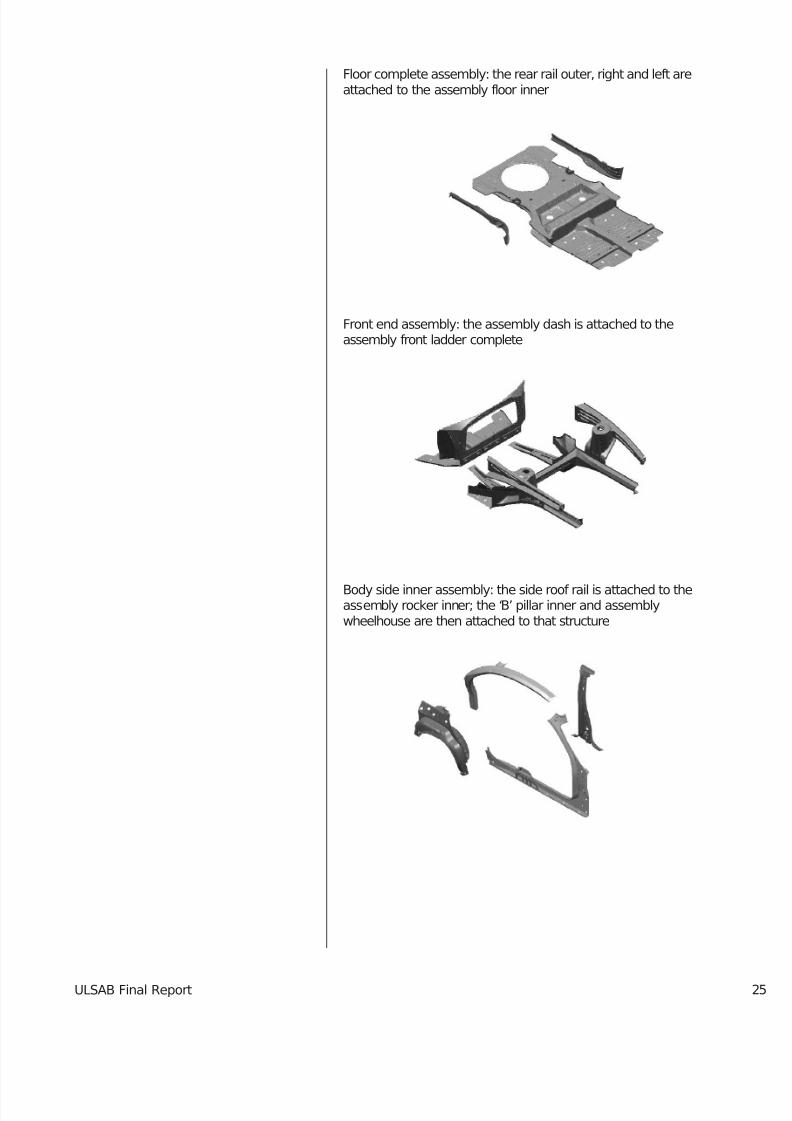
Floor complete assembly: the rear rail outer, right and left areattached to the assembly floor inner
Front end assembly: the assembly dash is attached to theassembly front ladder complete
Body side inner assembly: the side roof rail is attached to theassembly rocker inner; the ‘B’ pillar inner and assemblywheelhouse are then attached to that structure
7/29/2019 Ulsab Final Report (1).Ashx
http://slidepdf.com/reader/full/ulsab-final-report-1ashx 37/62ULSAB Final Report
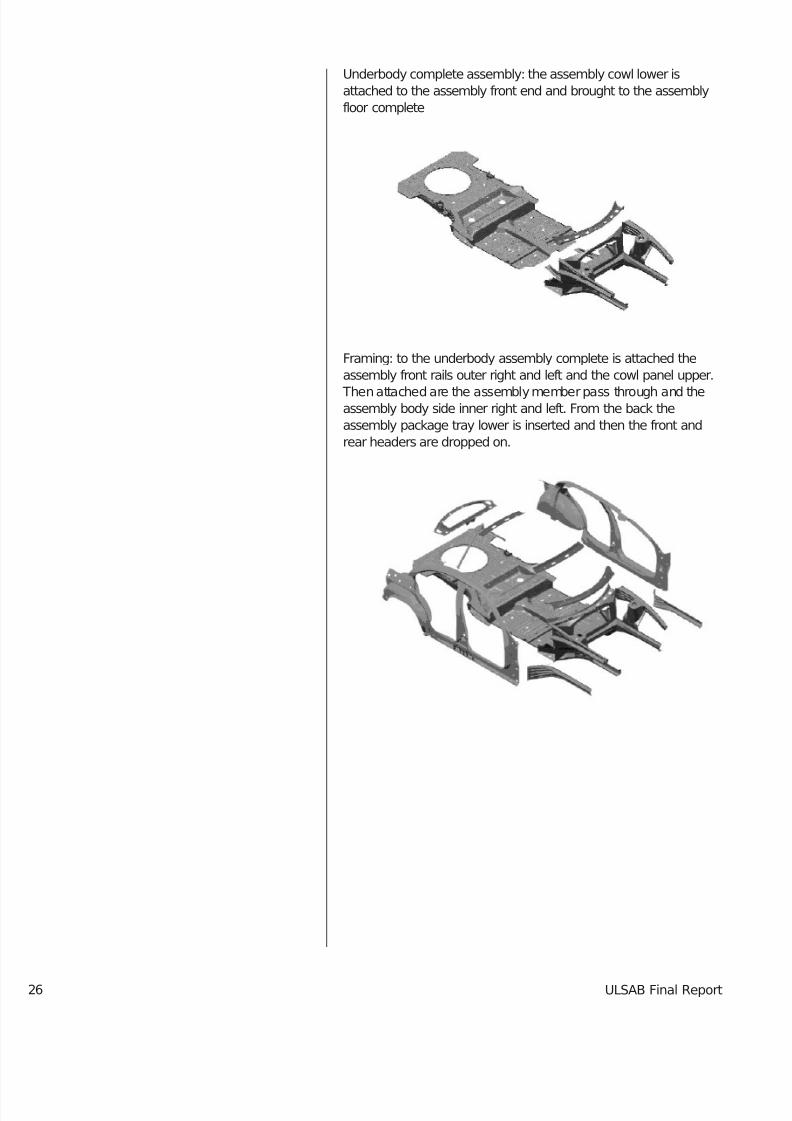
Underbody complete assembly: the assembly cowl lower isattached to the assembly front end and brought to the assemblyfloor complete
Framing: to the underbody assembly complete is attached theassembly front rails outer right and left and the cowl panel upper.
Then attached are the assembly member pass through and theassembly body side inner right and left. From the back theassembly package tray lower is inserted and then the front andrear headers are dropped on.
26
7/29/2019 Ulsab Final Report (1).Ashx
http://slidepdf.com/reader/full/ulsab-final-report-1ashx 38/62ULSAB Final Report
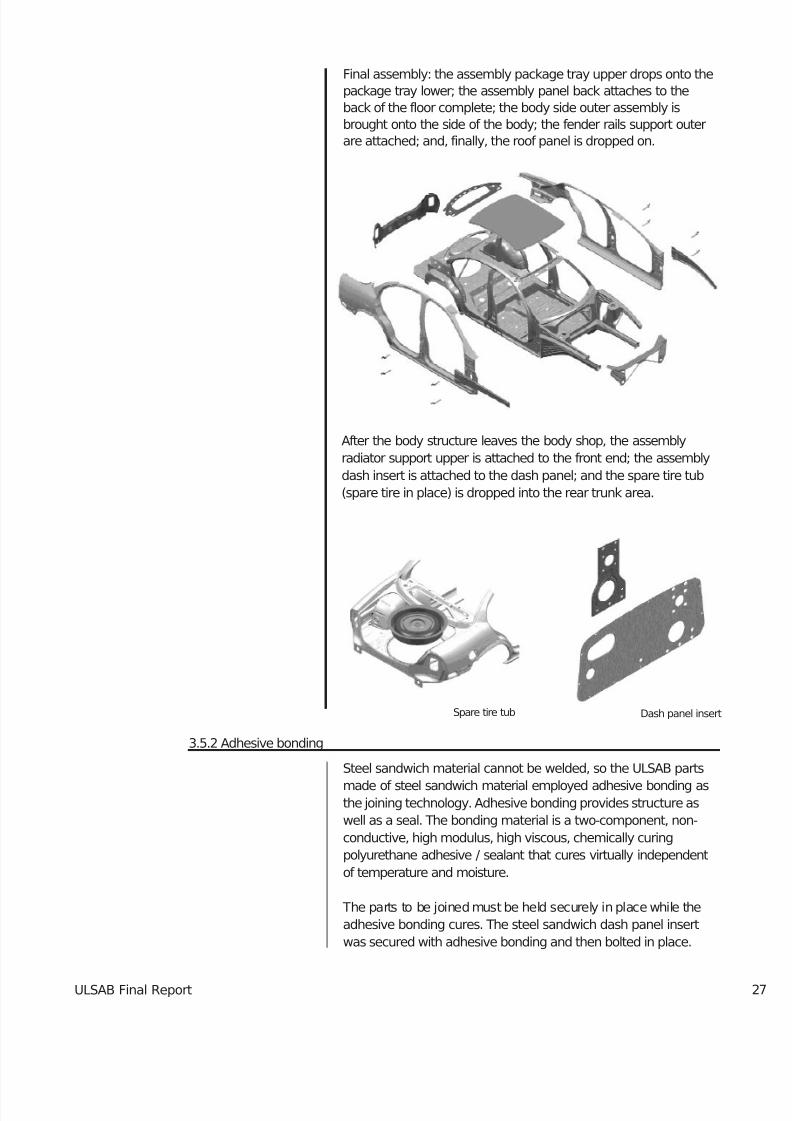
After the body structure leaves the body shop, the assembly
radiator support upper is attached to the front end; the assembly
dash insert is attached to the dash panel; and the spare tire tub
(spare tire in place) is dropped into the rear trunk area.
3.5.2 Adhesive bonding
Steel sandwich material cannot be welded, so the ULSAB parts
made of steel sandwich material employed adhesive bonding asthe joining technology. Adhesive bonding provides structure as
well as a seal. The bonding material is a two-component, non-
conductive, high modulus, high viscous, chemically curing
polyurethane adhesive / sealant that cures virtually independent
of temperature and moisture.
The parts to be joined must be held securely in place while the
adhesive bonding cures. The steel sandwich dash panel insert
was secured with adhesive bonding and then bolted in place.
Final assembly: the assembly package tray upper drops onto thepackage tray lower; the assembly panel back attaches to theback of the floor complete; the body side outer assembly isbrought onto the side of the body; the fender rails support outerare attached; and, finally, the roof panel is dropped on.
Dash panel insertSpare tire tub
7/29/2019 Ulsab Final Report (1).Ashx
http://slidepdf.com/reader/full/ulsab-final-report-1ashx 39/62ULSAB Final Report28
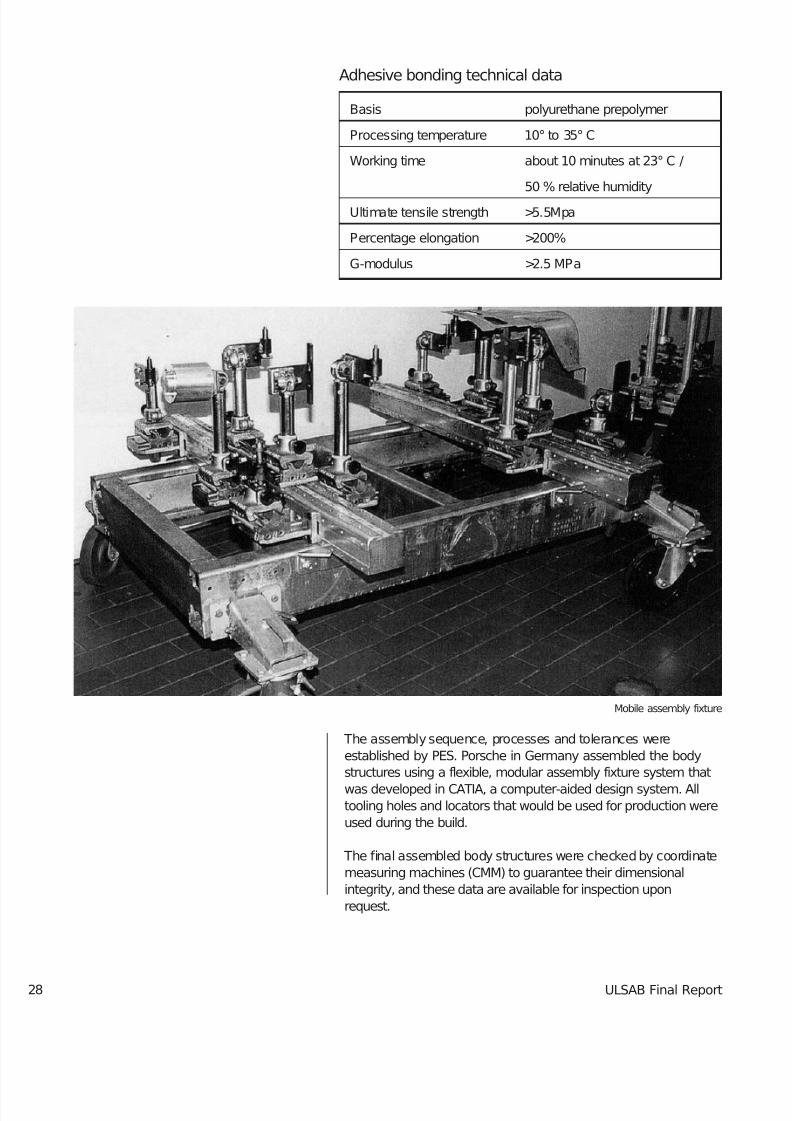
The assembly sequence, processes and tolerances wereestablished by PES. Porsche in Germany assembled the bodystructures using a flexible, modular assembly fixture system that
was developed in CATIA, a computer-aided design system. Alltooling holes and locators that would be used for production wereused during the build.
The final assembled body structures were checked by coordinatemeasuring machines (CMM) to guarantee their dimensionalintegrity, and these data are available for inspection uponrequest.
Adhesive bonding technical data
Basis polyurethane prepolymer
Processing temperature 10° to 35° C
Working time about 10 minutes at 23° C /
50 % relative humidity
Ultimate tensile strength >5.5Mpa
Percentage elongation >200%
G-modulus >2.5 MPa
Mobile assembly fixture
7/29/2019 Ulsab Final Report (1).Ashx
http://slidepdf.com/reader/full/ulsab-final-report-1ashx 40/62ULSAB Final Report
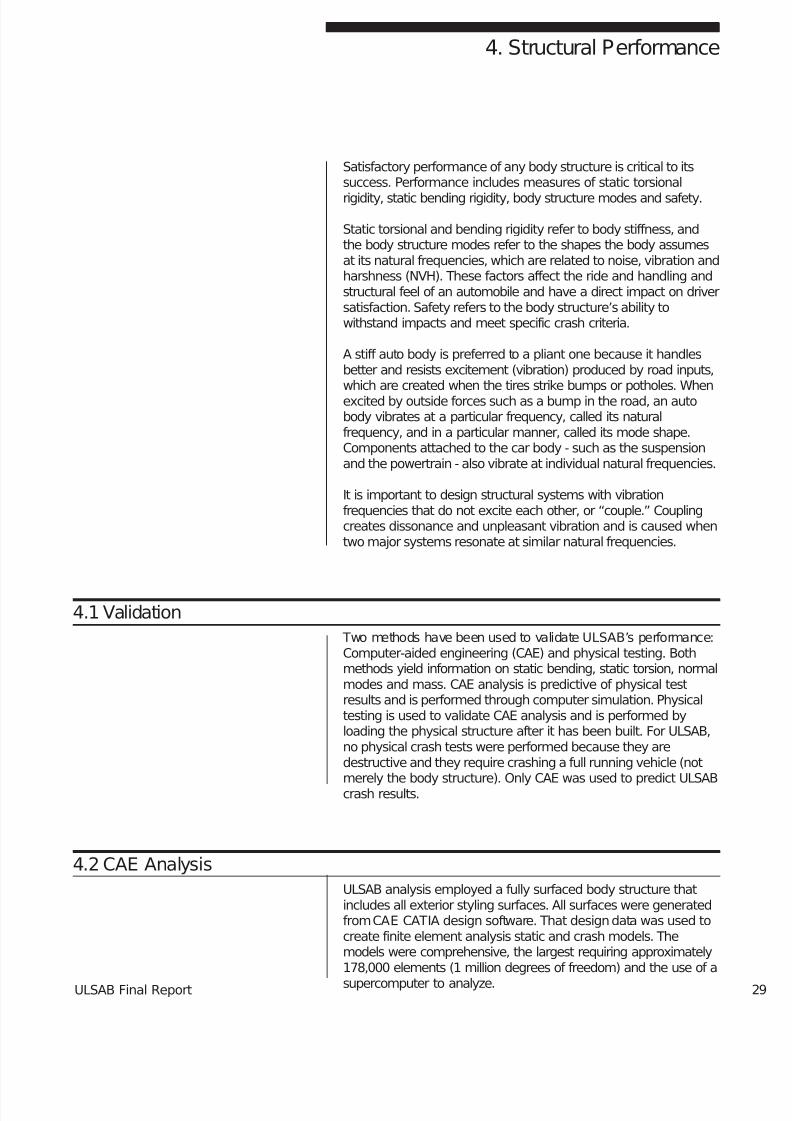
Satisfactory performance of any body structure is critical to itssuccess. Performance includes measures of static torsional
rigidity, static bending rigidity, body structure modes and safety.
Static torsional and bending rigidity refer to body stiffness, andthe body structure modes refer to the shapes the body assumesat its natural frequencies, which are related to noise, vibration andharshness (NVH). These factors affect the ride and handling andstructural feel of an automobile and have a direct impact on driversatisfaction. Safety refers to the body structure’s ability towithstand impacts and meet specific crash criteria.
A stiff auto body is preferred to a pliant one because it handlesbetter and resists excitement (vibration) produced by road inputs,
which are created when the tires strike bumps or potholes. Whenexcited by outside forces such as a bump in the road, an autobody vibrates at a particular frequency, called its naturalfrequency, and in a particular manner, called its mode shape.Components attached to the car body - such as the suspensionand the powertrain - also vibrate at individual natural frequencies.
It is important to design structural systems with vibrationfrequencies that do not excite each other, or “couple.” Couplingcreates dissonance and unpleasant vibration and is caused whentwo major systems resonate at similar natural frequencies.
4.1 Validation Two methods have been used to validate ULSAB’s performance:Computer-aided engineering (CAE) and physical testing. Bothmethods yield information on static bending, static torsion, normalmodes and mass. CAE analysis is predictive of physical testresults and is performed through computer simulation. Physicaltesting is used to validate CAE analysis and is performed byloading the physical structure after it has been built. For ULSAB,no physical crash tests were performed because they aredestructive and they require crashing a full running vehicle (notmerely the body structure). Only CAE was used to predict ULSABcrash results.
4.2 CAE AnalysisULSAB analysis employed a fully surfaced body structure thatincludes all exterior styling surfaces. All surfaces were generatedfrom CAE CATIA design software. That design data was used tocreate finite element analysis static and crash models. Themodels were comprehensive, the largest requiring approximately178,000 elements (1 million degrees of freedom) and the use of a
supercomputer to analyze.
4. Structural Performance
7/29/2019 Ulsab Final Report (1).Ashx
http://slidepdf.com/reader/full/ulsab-final-report-1ashx 41/62ULSAB Final Report
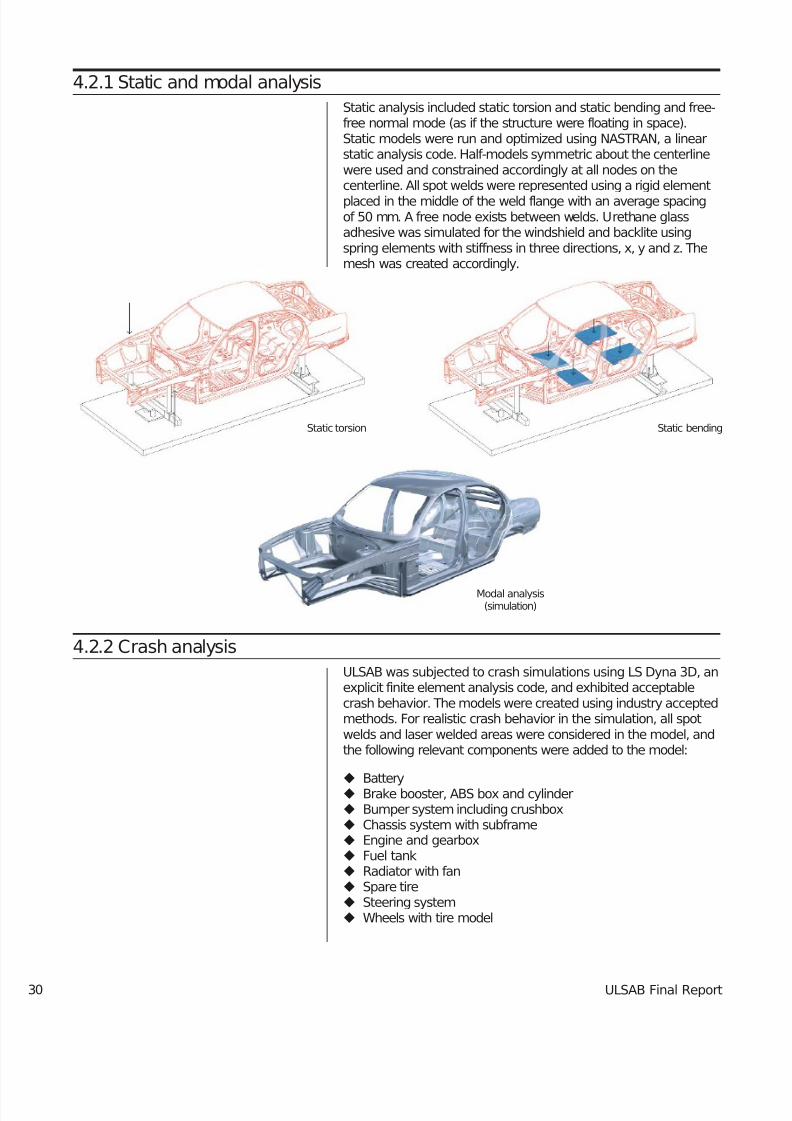
4.2.1 Static and modal analysis
Static analysis included static torsion and static bending and free-free normal mode (as if the structure were floating in space).Static models were run and optimized using NASTRAN, a linearstatic analysis code. Half-models symmetric about the centerlinewere used and constrained accordingly at all nodes on thecenterline. All spot welds were represented using a rigid elementplaced in the middle of the weld flange with an average spacingof 50 mm. A free node exists between welds. Urethane glassadhesive was simulated for the windshield and backlite usingspring elements with stiffness in three directions, x, y and z. Themesh was created accordingly.
4.2.2 Crash analysis
ULSAB was subjected to crash simulations using LS Dyna 3D, anexplicit finite element analysis code, and exhibited acceptablecrash behavior. The models were created using industry acceptedmethods. For realistic crash behavior in the simulation, all spotwelds and laser welded areas were considered in the model, andthe following relevant components were added to the model:
Battery Brake booster, ABS box and cylinder Bumper system including crushbox Chassis system with subframe Engine and gearbox Fuel tank Radiator with fan Spare tire Steering system Wheels with tire model
30
Static torsion
Modal analysis(simulation)
Static bending
7/29/2019 Ulsab Final Report (1).Ashx
http://slidepdf.com/reader/full/ulsab-final-report-1ashx 42/62ULSAB Final Report
All simulations were run to their completion. Test and full vehiclemass was assumed to be 1612 kg, which included luggage at 113kg and occupants at 149 kg.
Analysis was performed with models of the following size:
ULSAB was designed to meet five crash requirements:
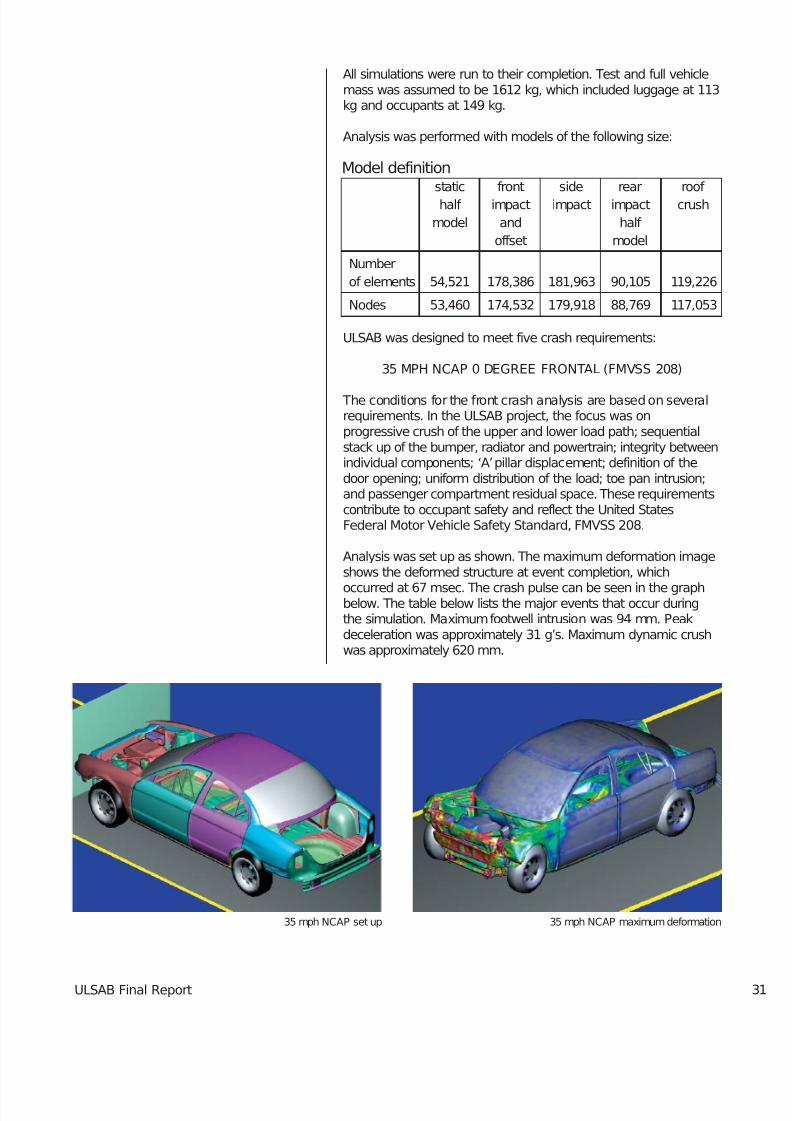
35 MPH NCAP 0 DEGREE FRONTAL (FMVSS 208)
The conditions for the front crash analysis are based on severalrequirements. In the ULSAB project, the focus was onprogressive crush of the upper and lower load path; sequentialstack up of the bumper, radiator and powertrain; integrity betweenindividual components; ‘A’pillar displacement; definition of thedoor opening; uniform distribution of the load; toe pan intrusion;and passenger compartment residual space. These requirementscontribute to occupant safety and reflect the United StatesFederal Motor Vehicle Safety Standard, FMVSS 208.
Analysis was set up as shown. The maximum deformation imageshows the deformed structure at event completion, which
occurred at 67 msec. The crash pulse can be seen in the graphbelow. The table below lists the major events that occur duringthe simulation. Maximum footwell intrusion was 94 mm. Peakdeceleration was approximately 31 g’s. Maximum dynamic crushwas approximately 620 mm.
Model definitionstatic front side rear roof
half impact impact impact crush
model and half
offset model
Number
of elements 54,521 178,386 181,963 90,105 119,226
Nodes 53,460 174,532 179,918 88,769 117,053
35 mph NCAP set up 35 mph NCAP maximum deformation
7/29/2019 Ulsab Final Report (1).Ashx
http://slidepdf.com/reader/full/ulsab-final-report-1ashx 43/62ULSAB Final Report
35 mph NCAP simulation behavior
32
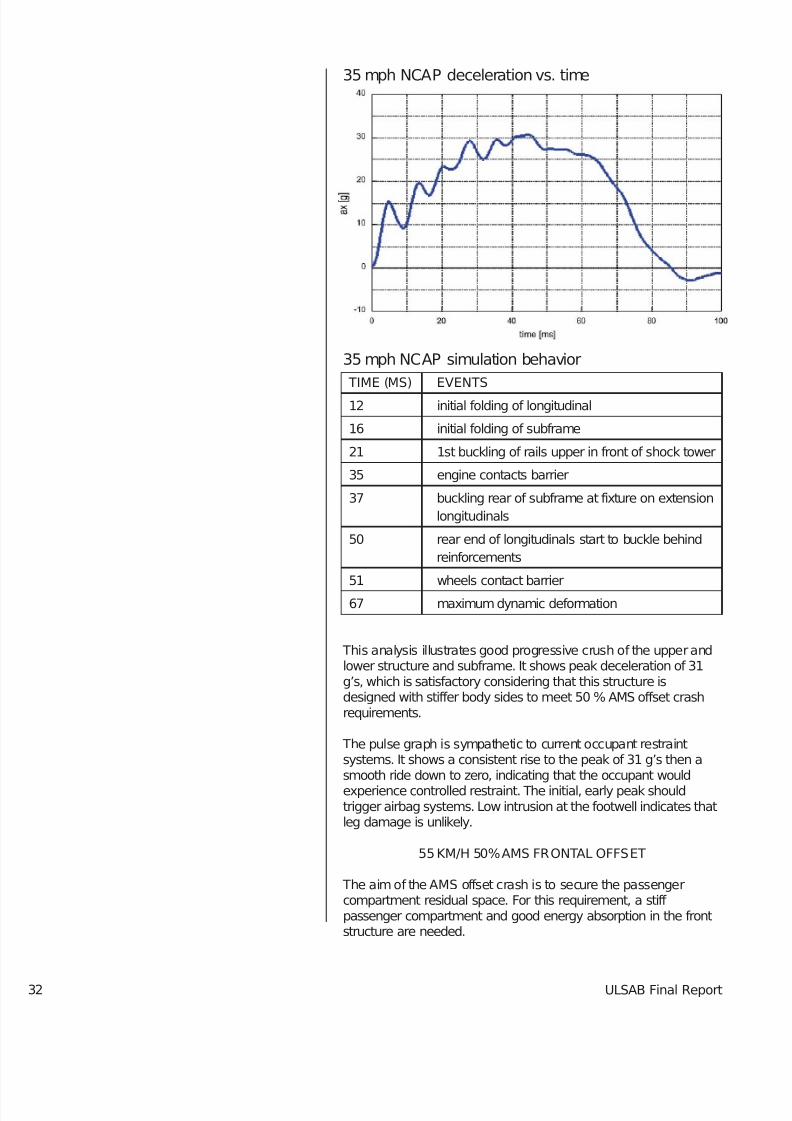
35 mph NCAP deceleration vs. time
TIME (MS) EVENTS
12 initial folding of longitudinal
16 initial folding of subframe
21 1st buckling of rails upper in front of shock tower
35 engine contacts barrier
37 buckling rear of subframe at fixture on extension
longitudinals
50 rear end of longitudinals start to buckle behind
reinforcements
51 wheels contact barrier
67 maximum dynamic deformation
This analysis illustrates good progressive crush of the upper andlower structure and subframe. It shows peak deceleration of 31g’s, which is satisfactory considering that this structure isdesigned with stiffer body sides to meet 50 % AMS offset crashrequirements.
The pulse graph is sympathetic to current occupant restraintsystems. It shows a consistent rise to the peak of 31 g’s then asmooth ride down to zero, indicating that the occupant wouldexperience controlled restraint. The initial, early peak shouldtrigger airbag systems. Low intrusion at the footwell indicates thatleg damage is unlikely.
55 KM/H 50% AMS FRONTAL OFFSET
The aim of the AMS offset crash is to secure the passengercompartment residual space. For this requirement, a stiff passenger compartment and good energy absorption in the frontstructure are needed.
7/29/2019 Ulsab Final Report (1).Ashx
http://slidepdf.com/reader/full/ulsab-final-report-1ashx 44/62ULSAB Final Report
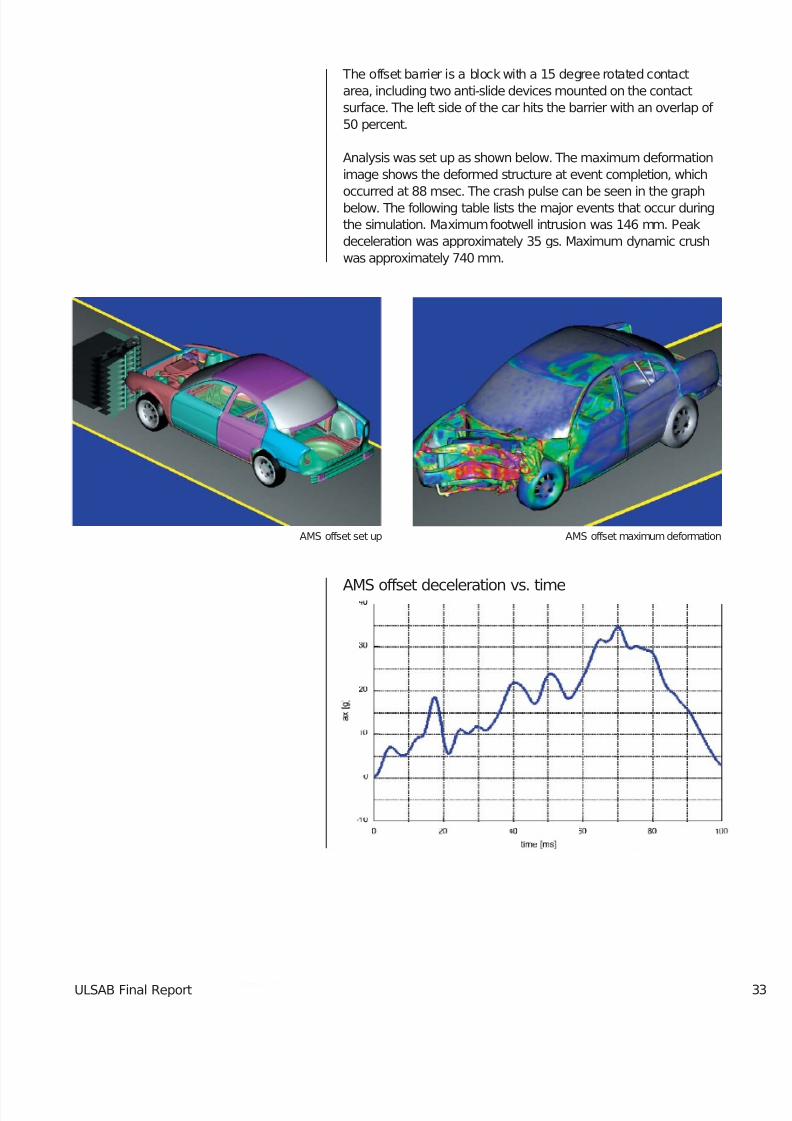
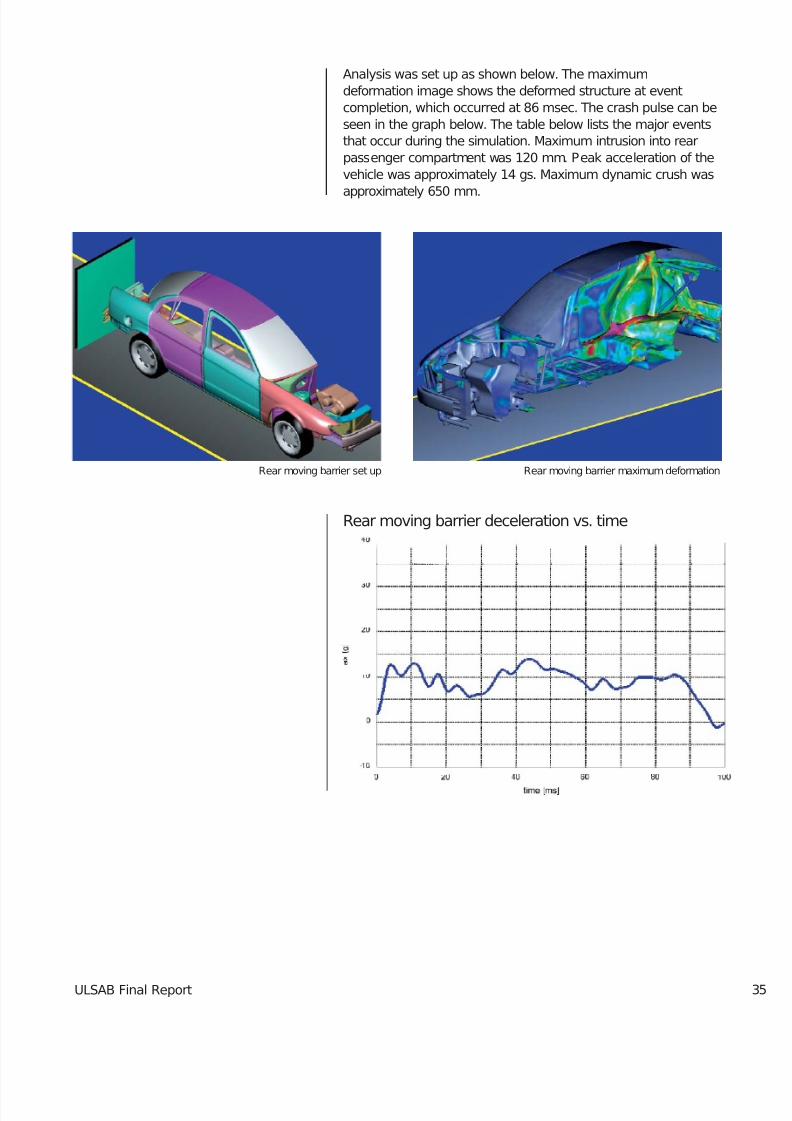
The offset barrier is a block with a 15 degree rotated contactarea, including two anti-slide devices mounted on the contactsurface. The left side of the car hits the barrier with an overlap of 50 percent.
Analysis was set up as shown below. The maximum deformationimage shows the deformed structure at event completion, which
occurred at 88 msec. The crash pulse can be seen in the graphbelow. The following table lists the major events that occur duringthe simulation. Maximum footwell intrusion was 146 mm. Peakdeceleration was approximately 35 gs. Maximum dynamic crushwas approximately 740 mm.
AMS offset deceleration vs. time
AMS offset set up AMS offset maximum deformation
7/29/2019 Ulsab Final Report (1).Ashx
http://slidepdf.com/reader/full/ulsab-final-report-1ashx 45/62ULSAB Final Report
AMS offset simulation behavior
34
TIME (MS) EVENTS
12 initial folding of longitudinal left hand side
16 initial folding of subframe
18 1st buckling of upper rails in front of shock tower
36 wheels left hand side contact barrier
40 engine contacts barrier; start of vehicle rotation
around Z axis
44 subframe front totally deformed; left hand
longitudinal rail moves rearward, causing
deformation in front floor; buckling of longitudinal
rail in area of shock tower
48 2nd buckling of upper rails left hand side behind
shock tower
52 buckling of rear end of subframe at fixture on
extension longitudinals
60 buckling of brace cowl to shock tower left hand
side; engine hits steering gear
68 gearbox mounting contacts brake booster
70 wheel left hand side contacts hinge pillar
88 maximum dynamic deformation
This analysis shows good progressive crush on the barrier side(left), as well as crush on the right, indicating transfer of load to
the right side of the structure. This transfer means that the barrierside is not relied upon solely to manage the crash event.
This transfer also contributes to the preservation of the occupantcompartment. The intrusion of 146 mm into the footwell is minimalgiven the severity of this event.
The initial, early peak shown in the pulse graph should triggerairbag systems.
35 MPH REAR MOVING BARRIER (FMVSS 301)
The conditions for rear impact analysis are based on United
States Rear Moving Barrier test FMVSS 301. The test specificallyaddresses fuel system integrity during rear impact. Automotivecompanies also specify goals for structural integrity andpassenger compartment volume.
The impacting barrier is designed to represent a rigid body with amass of 1830 kg that contacts the vehicle at zero degrees relativeto the vehicle longitudinal axis. FMVSS 301 specifies the velocityof the rear moving barrier to be 30 mph at the time of impact.ULSAB ran its analysis at a velocity of 35 mph, which represents36 percent more kinetic energy.
7/29/2019 Ulsab Final Report (1).Ashx
http://slidepdf.com/reader/full/ulsab-final-report-1ashx 46/62ULSAB Final Report
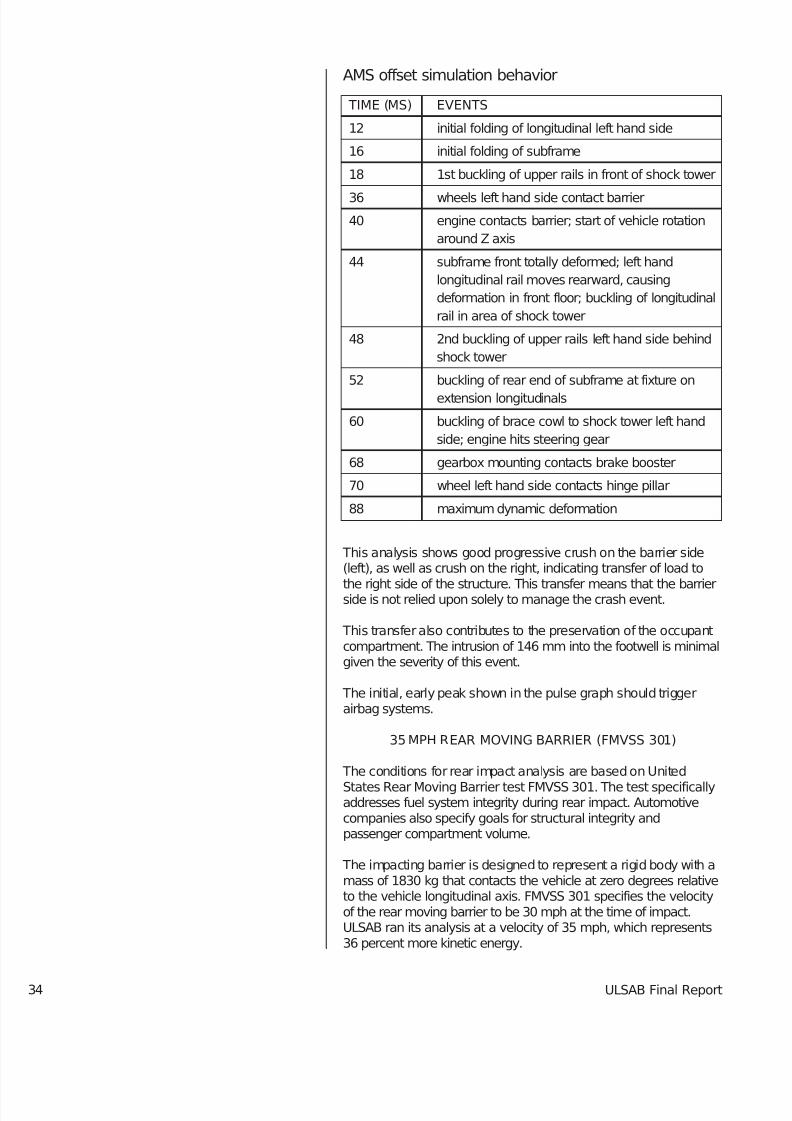
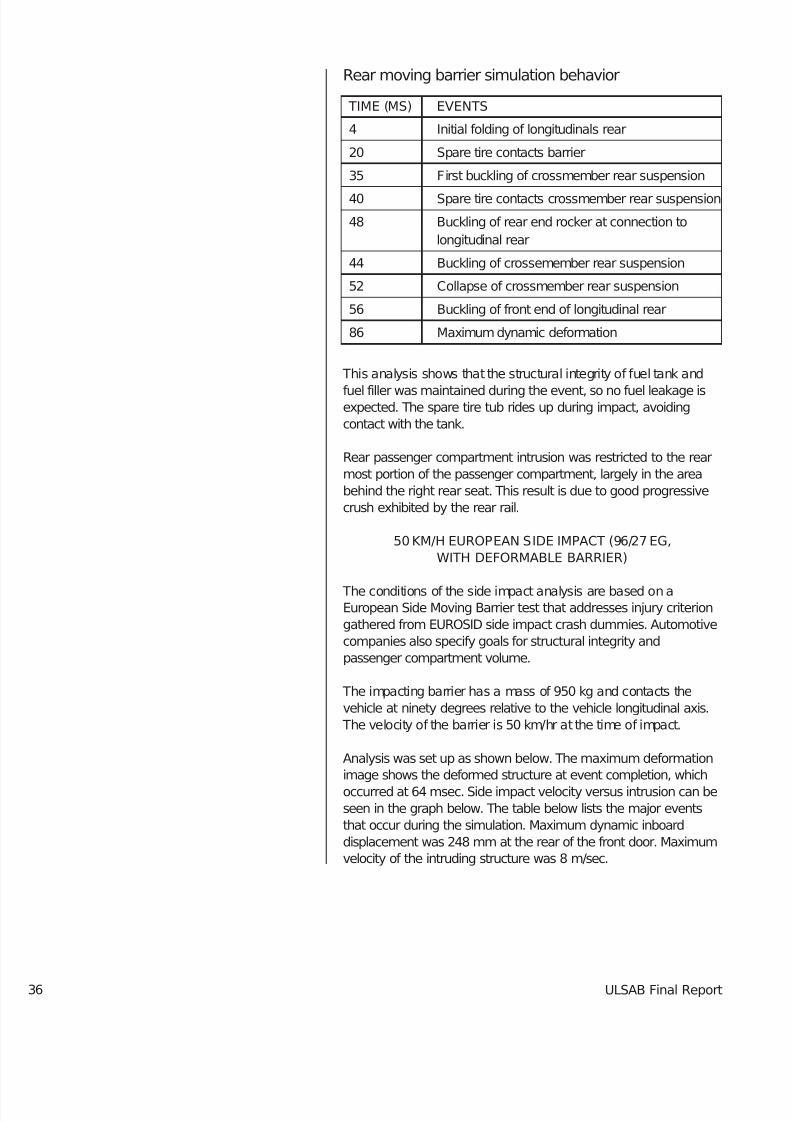
Analysis was set up as shown below. The maximumdeformation image shows the deformed structure at eventcompletion, which occurred at 86 msec. The crash pulse can beseen in the graph below. The table below lists the major eventsthat occur during the simulation. Maximum intrusion into rearpassenger compartment was 120 mm. Peak acceleration of thevehicle was approximately 14 gs. Maximum dynamic crush was
approximately 650 mm.
Rear moving barrier set up Rear moving barrier maximum deformation
Rear moving barrier deceleration vs. time
7/29/2019 Ulsab Final Report (1).Ashx
http://slidepdf.com/reader/full/ulsab-final-report-1ashx 47/62ULSAB Final Report
This analysis shows that the structural integrity of fuel tank and
fuel filler was maintained during the event, so no fuel leakage isexpected. The spare tire tub rides up during impact, avoidingcontact with the tank.
Rear passenger compartment intrusion was restricted to the rearmost portion of the passenger compartment, largely in the areabehind the right rear seat. This result is due to good progressivecrush exhibited by the rear rail.
50 KM/H EUROPEAN SIDE IMPACT (96/27 EG,WITH DEFORMABLE BARRIER)
The conditions of the side impact analysis are based on aEuropean Side Moving Barrier test that addresses injury criteriongathered from EUROSID side impact crash dummies. Automotivecompanies also specify goals for structural integrity andpassenger compartment volume.
The impacting barrier has a mass of 950 kg and contacts thevehicle at ninety degrees relative to the vehicle longitudinal axis.
The velocity of the barrier is 50 km/hr at the time of impact.
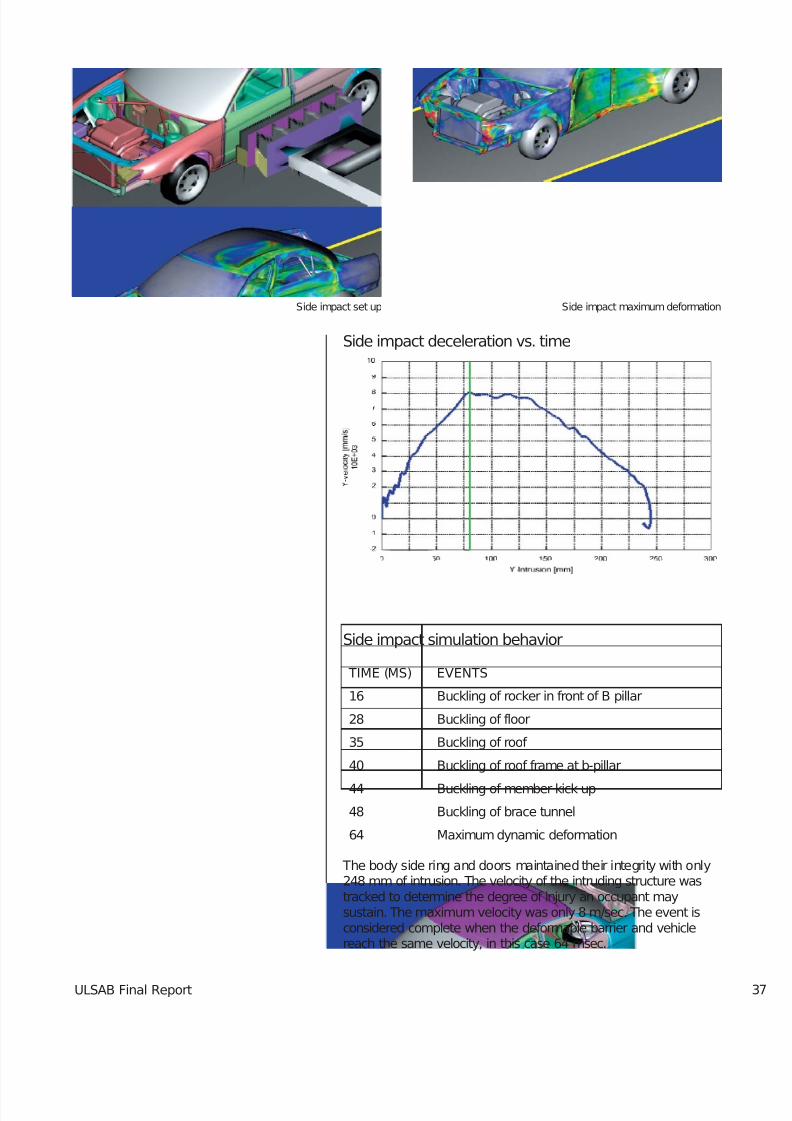
Analysis was set up as shown below. The maximum deformationimage shows the deformed structure at event completion, whichoccurred at 64 msec. Side impact velocity versus intrusion can beseen in the graph below. The table below lists the major eventsthat occur during the simulation. Maximum dynamic inboarddisplacement was 248 mm at the rear of the front door. Maximumvelocity of the intruding structure was 8 m/sec.
36
Rear moving barrier simulation behavior
TIME (MS) EVENTS
4 Initial folding of longitudinals rear
20 Spare tire contacts barrier
35 First buckling of crossmember rear suspension
40 Spare tire contacts crossmember rear suspension
48 Buckling of rear end rocker at connection to
longitudinal rear
44 Buckling of crossemember rear suspension
52 Collapse of crossmember rear suspension
56 Buckling of front end of longitudinal rear
86 Maximum dynamic deformation
7/29/2019 Ulsab Final Report (1).Ashx
http://slidepdf.com/reader/full/ulsab-final-report-1ashx 48/62ULSAB Final Report
Side impact simulation behavior
Side impact set up Side impact maximum deformation
Side impact deceleration vs. time
TIME (MS) EVENTS
16 Buckling of rocker in front of B pillar
28 Buckling of floor
35 Buckling of roof
40 Buckling of roof frame at b-pillar
44 Buckling of member kick up
48 Buckling of brace tunnel
64 Maximum dynamic deformation
The body side ring and doors maintained their integrity with only248 mm of intrusion. The velocity of the intruding structure wastracked to determine the degree of injury an occupant maysustain. The maximum velocity was only 8 m/sec. The event isconsidered complete when the deformable barrier and vehiclereach the same velocity, in this case 64 msec.
7/29/2019 Ulsab Final Report (1).Ashx
http://slidepdf.com/reader/full/ulsab-final-report-1ashx 49/62ULSAB Final Report
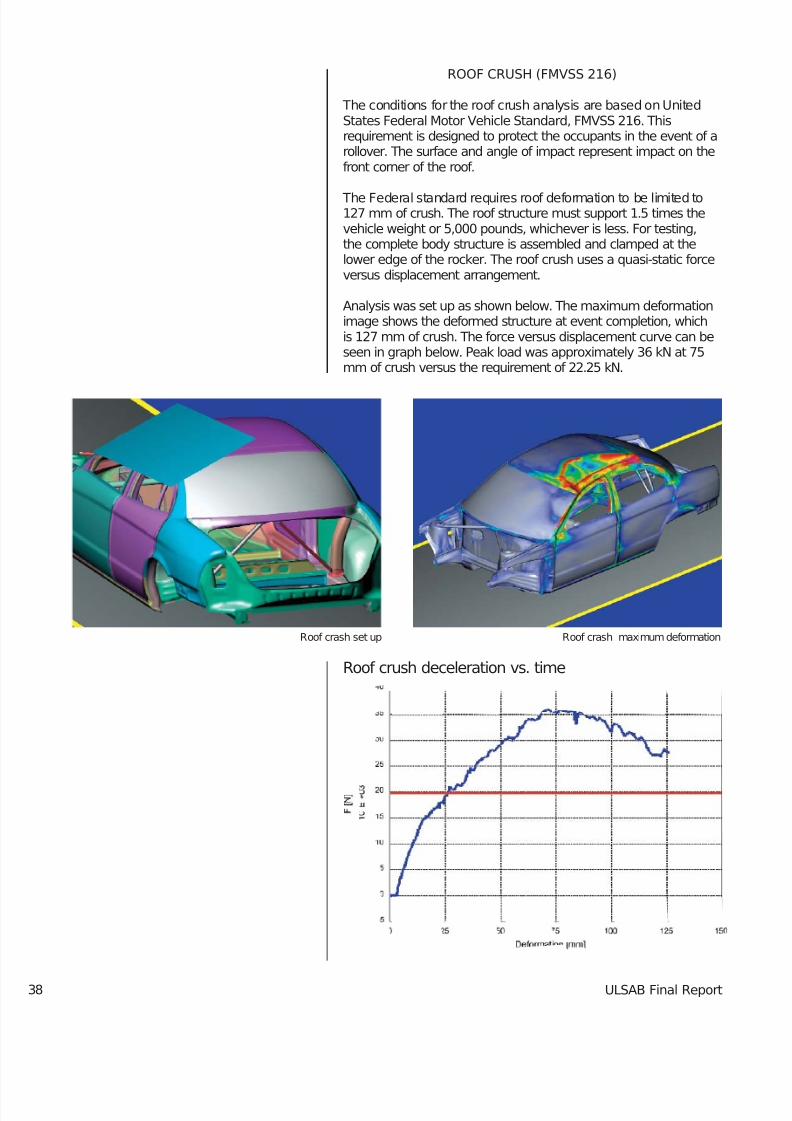
ROOF CRUSH (FMVSS 216)
The conditions for the roof crush analysis are based on UnitedStates Federal Motor Vehicle Standard, FMVSS 216. Thisrequirement is designed to protect the occupants in the event of arollover. The surface and angle of impact represent impact on thefront corner of the roof.
The Federal standard requires roof deformation to be limited to127 mm of crush. The roof structure must support 1.5 times thevehicle weight or 5,000 pounds, whichever is less. For testing,the complete body structure is assembled and clamped at thelower edge of the rocker. The roof crush uses a quasi-static forceversus displacement arrangement.
Analysis was set up as shown below. The maximum deformationimage shows the deformed structure at event completion, whichis 127 mm of crush. The force versus displacement curve can beseen in graph below. Peak load was approximately 36 kN at 75mm of crush versus the requirement of 22.25 kN.
38
Roof crash set up Roof crash maximum deformation
Roof crush deceleration vs. time
7/29/2019 Ulsab Final Report (1).Ashx
http://slidepdf.com/reader/full/ulsab-final-report-1ashx 50/62ULSAB Final Report
Analysis showed that 22.25 kN was reached within 30 mm of crush. The structure resisted the applied load all the way up itspeak of 36 kN and continued to maintained it quite well even afterpeak, when it dropped to about 28 kN at 127 mm. The load waswell distributed through the ‘A,’ ‘B’ and ‘C’ pillars and down intothe rear rail.
4.3Physical testing
Physical tests were used to validate static torsion, static bendingand normal modes. Normal mode testing was performed bysuspending the body structure on a test rack with rubber strapswhile exciting it at all four corners using electrodynamic shakers.
To validate mass, the ULSAB structure was weighed.4.3.1Static torsion test
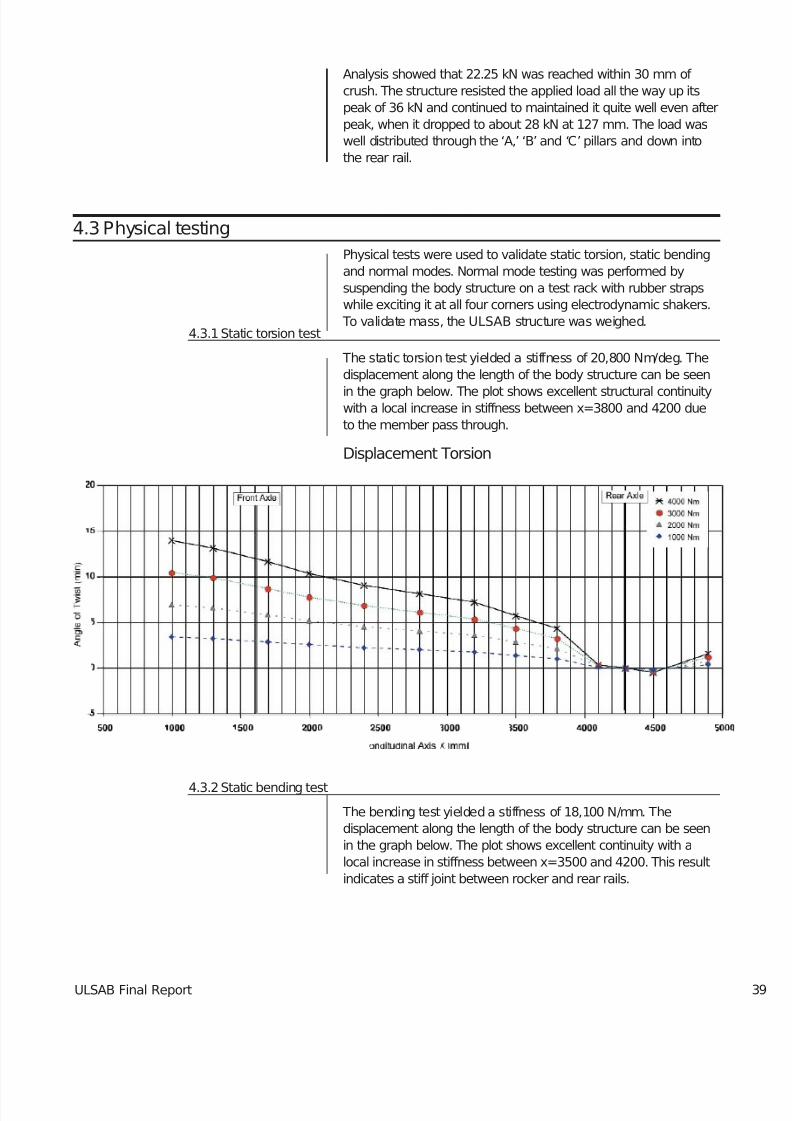
The static torsion test yielded a stiffness of 20,800 Nm/deg. Thedisplacement along the length of the body structure can be seen
in the graph below. The plot shows excellent structural continuitywith a local increase in stiffness between x=3800 and 4200 dueto the member pass through.
Displacement Torsion
4.3.2Static bending test
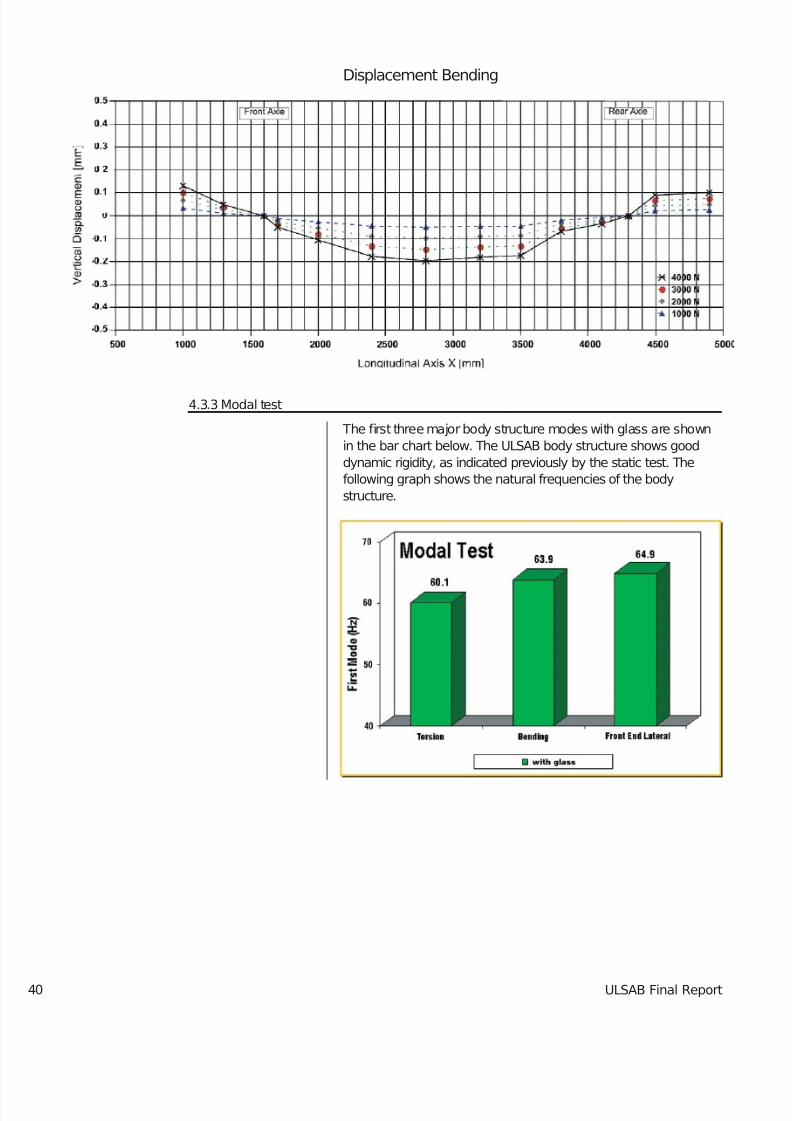
The bending test yielded a stiffness of 18,100 N/mm. Thedisplacement along the length of the body structure can be seenin the graph below. The plot shows excellent continuity with alocal increase in stiffness between x=3500 and 4200. This resultindicates a stiff joint between rocker and rear rails.
7/29/2019 Ulsab Final Report (1).Ashx
http://slidepdf.com/reader/full/ulsab-final-report-1ashx 51/62ULSAB Final Report
Displacement Bending
40
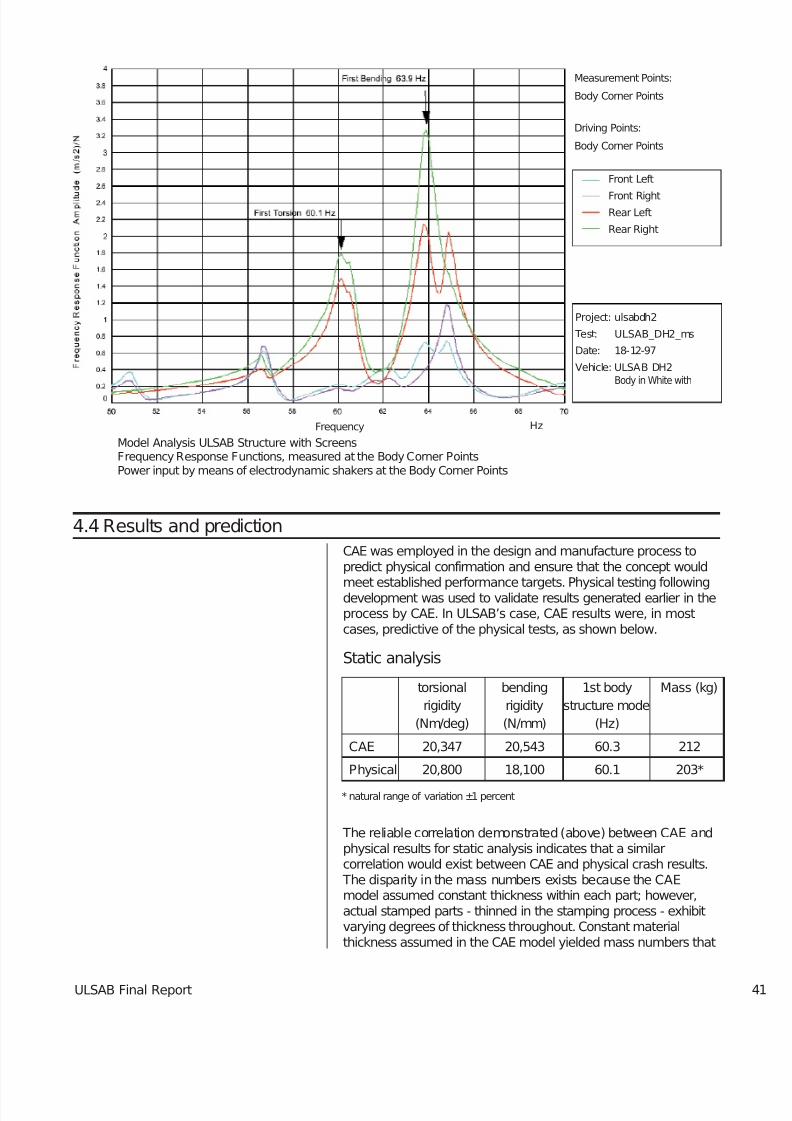
4.3.3 Modal test
The first three major body structure modes with glass are shownin the bar chart below. The ULSAB body structure shows gooddynamic rigidity, as indicated previously by the static test. Thefollowing graph shows the natural frequencies of the bodystructure.
7/29/2019 Ulsab Final Report (1).Ashx
http://slidepdf.com/reader/full/ulsab-final-report-1ashx 52/62ULSAB Final Report
4.4 Results and predictionCAE was employed in the design and manufacture process topredict physical confirmation and ensure that the concept would
meet established performance targets. Physical testing followingdevelopment was used to validate results generated earlier in theprocess by CAE. In ULSAB’s case, CAE results were, in mostcases, predictive of the physical tests, as shown below.
Static analysis
torsional bending 1st body Mass (kg)
rigidity rigidity structure mode
(Nm/deg) (N/mm) (Hz)
CAE 20,347 20,543 60.3 212
Physical 20,800 18,100 60.1 203*
* natural range of variation ±1 percent
The reliable correlation demonstrated (above) between CAE andphysical results for static analysis indicates that a similarcorrelation would exist between CAE and physical crash results.
The disparity in the mass numbers exists because the CAEmodel assumed constant thickness within each part; however,actual stamped parts - thinned in the stamping process - exhibitvarying degrees of thickness throughout. Constant materialthickness assumed in the CAE model yielded mass numbers that
Model Analysis ULSAB Structure with ScreensFrequency Response Functions, measured at the Body Corner PointsPower input by means of electrodynamic shakers at the Body Corner Points
Measurement Points:
Body Corner Points
Driving Points:
Body Corner Points
Front Left
Front RightRear Left
Rear Right
Project: ulsabdh2
Test: ULSAB_DH2_ms
Date: 18-12-97
Vehicle: ULSAB DH2Body in White with
Frequency Hz
7/29/2019 Ulsab Final Report (1).Ashx
http://slidepdf.com/reader/full/ulsab-final-report-1ashx 53/62ULSAB Final Report
4.5 Structural performance
Physical tests and CAE results show ULSAB to exceed allconcept phase benchmarked averages.
Structural performance comparison
42
ULSAB Benchmark Future reference
structure structure average structure
Performance
torsion (Nm/deg) 20,800 11,531 13,000
bending (N/mm) 18,100 11,902 12,200
1st body structure
mode (Hz) 60 38 40
Mass (in kg) 203* 271 250
* natural range of variation ±1 percent
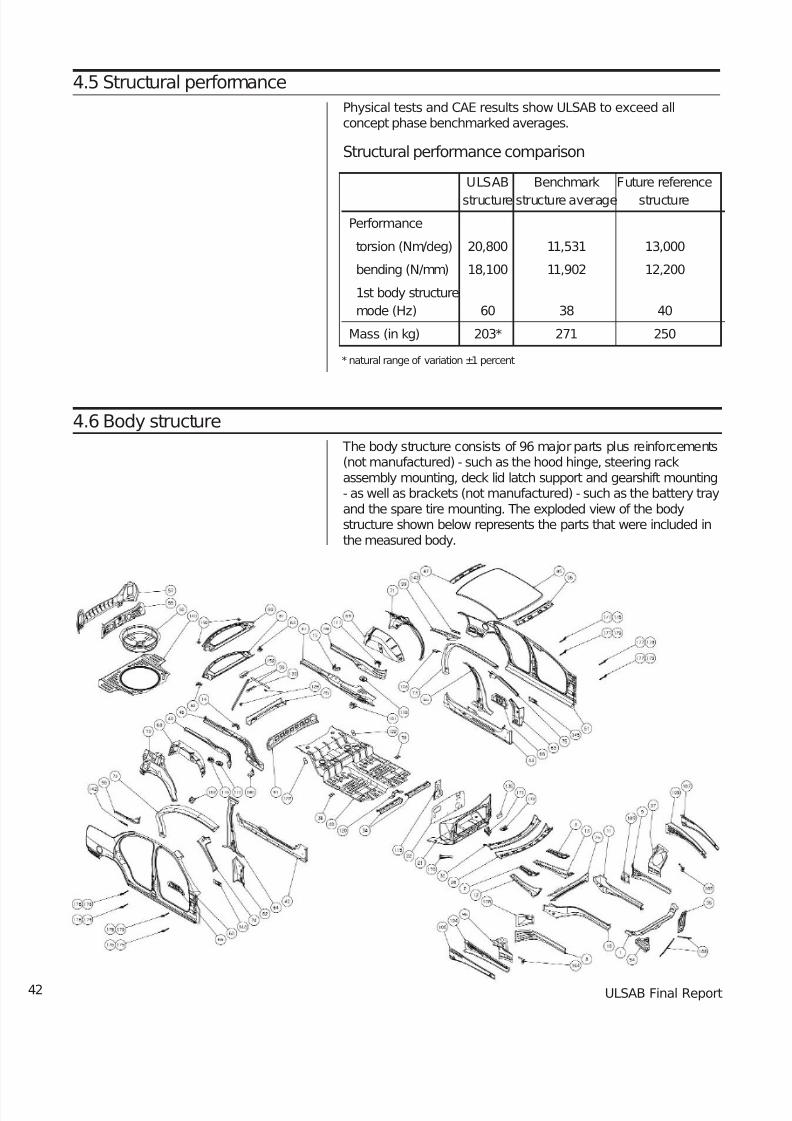
4.6 Body structure
The body structure consists of 96 major parts plus reinforcements(not manufactured) - such as the hood hinge, steering rackassembly mounting, deck lid latch support and gearshift mounting- as well as brackets (not manufactured) - such as the battery trayand the spare tire mounting. The exploded view of the bodystructure shown below represents the parts that were included inthe measured body.
7/29/2019 Ulsab Final Report (1).Ashx
http://slidepdf.com/reader/full/ulsab-final-report-1ashx 54/62ULSAB Final Report
Although lightweighting without sacrificing performance wasULSAB’s priority, affordability was also important. Early in
ULSAB’s concept phase the Consortium commissioned aneconomic analysis to establish a reference by which to compareULSAB. At that time, IBIS Associates estimated a cost of $1116each to manufacture current, typical body structures for vehiclesin the same class as ULSAB. The North American manufacturingcosts calculated during the concept phase of the projectrepresent the estimated cost to manufacture a typical bodystructure in the same class as ULSAB at the time of the project’sinception in 1994.
In the validation phase, the cost issue was revisited morethoroughly. The ULSAB Consortium’s primary objective was to
provide a cost model that automotive customers could use toanalyze ULSAB costs in comparison with other options and couldalso be used to generate costs associated with alternativedesigns. The cost model should allow auto companies to usetheir own manufacturing and business environment assumptionsto compare with the assumptions used for ULSAB. This costestimation tool should permit the user to easily adapt variousinput parameters, allowing cost investigations for any design on aconsistent basis.A Porsche-led team of analysts developed the detailed costmodel that includes all aspects of fabrication and assembly. Thismodel comprehends United States manufacturing costs, includinginvestments for both plant and tooling, piece fabrication costs and
assembly costs, through to the end of the body shop. Theanalysts used these details to generate a part-specific cost modelfor ULSAB. This particular analysis showed part manufacturingand assembly costs for the ULSAB body structure to be $947each.
Using the same cost model, the team also created assumptionsabout a future typical four-door sedan (Year 2000) reference bodystructure with which to compare ULSAB. Basic economicassumptions were identical for both ULSAB and the Year 2000structure; however, inputs about specific parts and assemblysteps are not directly comparable because the Year 2000structure represents an average of typical vehicle structures inthe same class as ULSAB. For the Year 2000 structure, the studyidentified part groupings — instead of individual parts as withULSAB — and assumed significantly improved fabrication andassembly techniques as compared to the concept stagereference. The cost model with these inputs showed partmanufacturing and assembly costs for the Year 2000 structure tobe $979 each.
The team began analysis by establishing general inputs orassumptions for the cost model. Then they established productioncosts, which include part fabrication and assembly. And finallythey created the model scope, which comprehends direct
manufacturing costs. The cost model examines the 158-part, 203
5. Economic Analysis

7/29/2019 Ulsab Final Report (1).Ashx
http://slidepdf.com/reader/full/ulsab-final-report-1ashx 55/62ULSAB Final Report
5.2 Production costs
Production costs comprise fabrication and assembly of ULSAB’s158 parts, which include brackets and reinforcements.
5.2.1 Fabrication
To calculate costs for part fabrication, the team established apress line time requirement based on the machine clean runningrate, line downtimes, line side scrap and total annual productionvolume. They then used that press line time requirement tocalculate the total number of each press line type needed toproduce ULSAB. This calculation specified 15 press lines and fiveblanking lines to produce all necessary parts and blanks.
5.2.2 Assembly
Assembly costs include equipment and tooling investments,assembly plant area and labor force. Additional assembly inputsconsider material, energy, overhead labor and maintenance. Theassembly line was designed for a net line rate of 60 jobs per hour,
as well as a specific number of spot and length of laser welds.Any change in practice of these two operations necessitates achange in the investment inputs for accurate estimates at otherproduction volumes. Also, because the line was designed for oneline speed, the model cannot adjust the investment based ondifferent rates.
44
5.1 General inputs
The first step in economic analysis began with the formulation of general inputs that may vary for different locations. Inputs usedfor this project are as follows:
General inputs
Input
Production volume 60 jobs per hour
(225,000 vehicles per year)
Working days per year 240 (2 shifts)
Production location mid-west USA
Wage including benefits $44.00 per hour
Interest rate 12%
Production life 5 years
Equipment life 20 years
Building life 25 years
7/29/2019 Ulsab Final Report (1).Ashx
http://slidepdf.com/reader/full/ulsab-final-report-1ashx 56/62ULSAB Final Report
5.3 Model scope
This cost model accounts for economic and technical processesused in the manufacture and assembly of the body structure.Data for stamping include blanking, welding of tailored blanksand stamping for all parts; data for hydroforming include bending,pre-forming and final hydroforming; and data for assembly
include spot welding, MIG welding, laser welding and adhesivebonding.
This model is limited to direct manufacturing costs, which includefabrication and assembly of the body structure. Indirectmanufacturing costs — executive salaries, marketing and sales,shipping and purchasing, research and development, profits - arenot considered.
Cost is assigned to each unit operation from a process flowdiagram and then those operations are separated into individualelements. Fixed cost elements include equipment, tooling,building maintenance, overhead labor and cost of capital;
variable cost elements include materials, labor and energy.
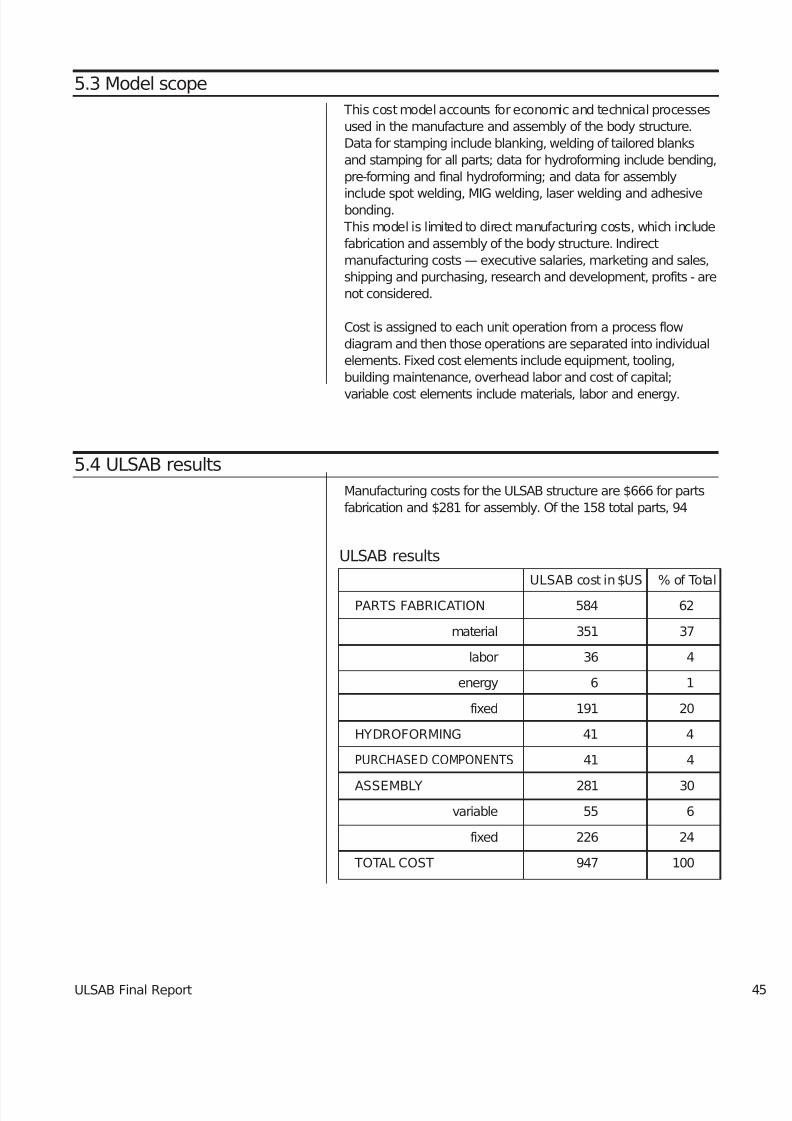
5.4 ULSAB results
Manufacturing costs for the ULSAB structure are $666 for partsfabrication and $281 for assembly. Of the 158 total parts, 94
ULSAB results
ULSAB cost in $US % of Total
PARTS FABRICATION 584 62
material 351 37
labor 36 4
energy 6 1
fixed 191 20
HYDROFORMING 41 4
PURCHASED COMPONENTS 41 4
ASSEMBLY 281 30
variable 55 6
fixed 226 24
TOTAL COST 947 100
7/29/2019 Ulsab Final Report (1).Ashx
http://slidepdf.com/reader/full/ulsab-final-report-1ashx 57/62ULSAB Final Report
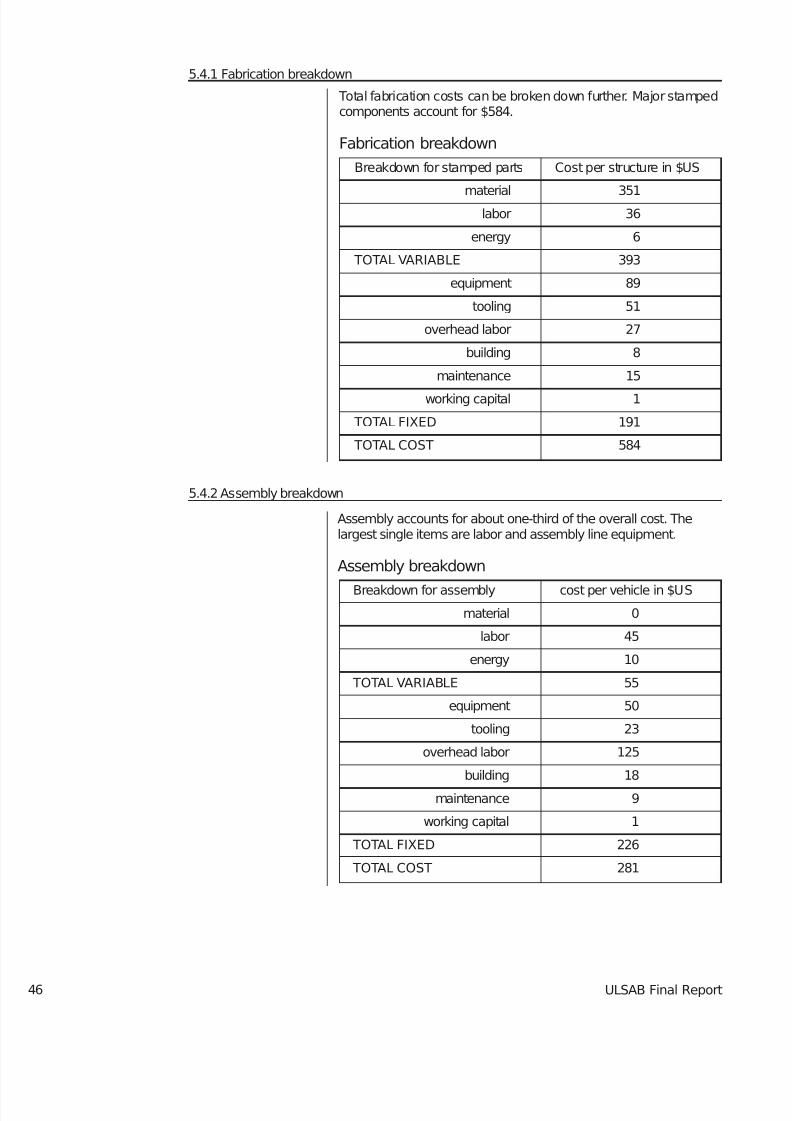
Assembly accounts for about one-third of the overall cost. Thelargest single items are labor and assembly line equipment.
Assembly breakdown
Breakdown for assembly cost per vehicle in $US
material 0
labor 45
energy 10
TOTAL VARIABLE 55
equipment 50
tooling 23
overhead labor 125
building 18
maintenance 9
working capital 1
TOTAL FIXED 226
TOTAL COST 281
Total fabrication costs can be broken down further. Major stampedcomponents account for $584.
Fabrication breakdown
Breakdown for stamped parts Cost per structure in $US
material 351labor 36
energy 6
TOTAL VARIABLE 393
equipment 89
tooling 51
overhead labor 27
building 8
maintenance 15
working capital 1
TOTAL FIXED 191
TOTAL COST 584
46
5.4.1 Fabrication breakdown
5.4.2 Assembly breakdown
7/29/2019 Ulsab Final Report (1).Ashx
http://slidepdf.com/reader/full/ulsab-final-report-1ashx 58/62ULSAB Final Report
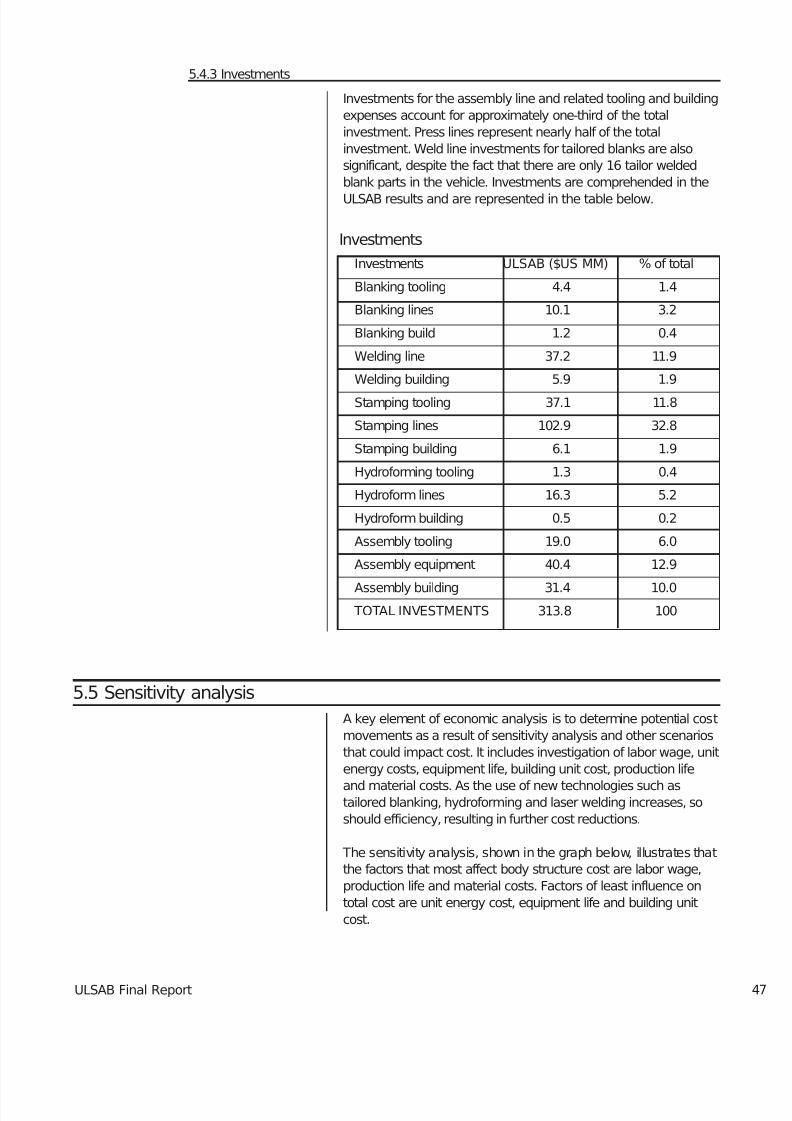
5.4.3 Investments
Investments for the assembly line and related tooling and buildingexpenses account for approximately one-third of the totalinvestment. Press lines represent nearly half of the totalinvestment. Weld line investments for tailored blanks are alsosignificant, despite the fact that there are only 16 tailor weldedblank parts in the vehicle. Investments are comprehended in the
ULSAB results and are represented in the table below.
Investments
Investments ULSAB ($US MM) % of total
Blanking tooling 4.4 1.4
Blanking lines 10.1 3.2
Blanking build 1.2 0.4
Welding line 37.2 11.9
Welding building 5.9 1.9
Stamping tooling 37.1 11.8
Stamping lines 102.9 32.8
Stamping building 6.1 1.9
Hydroforming tooling 1.3 0.4
Hydroform lines 16.3 5.2
Hydroform building 0.5 0.2
Assembly tooling 19.0 6.0
Assembly equipment 40.4 12.9
Assembly building 31.4 10.0 TOTAL INVESTMENTS 313.8 100
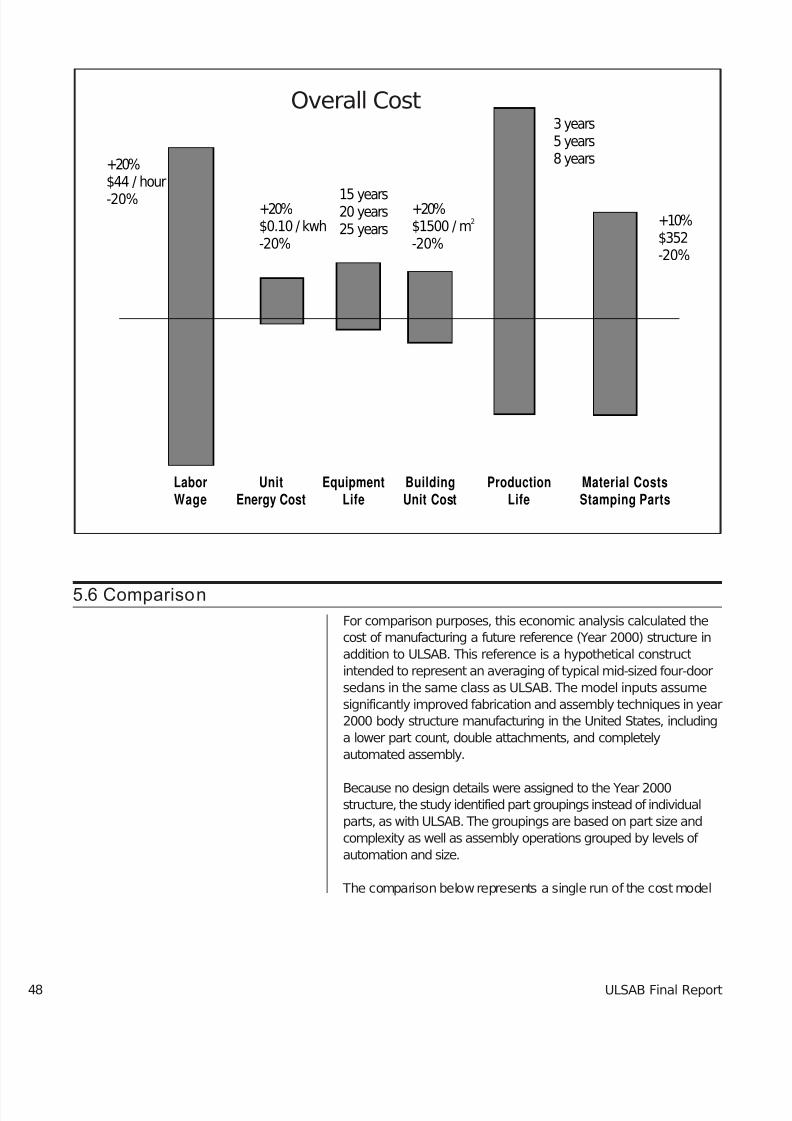
5.5 Sensitivity analysis
A key element of economic analysis is to determine potential costmovements as a result of sensitivity analysis and other scenariosthat could impact cost. It includes investigation of labor wage, unitenergy costs, equipment life, building unit cost, production life
and material costs. As the use of new technologies such astailored blanking, hydroforming and laser welding increases, soshould efficiency, resulting in further cost reductions.
The sensitivity analysis, shown in the graph below, illustrates thatthe factors that most affect body structure cost are labor wage,production life and material costs. Factors of least influence ontotal cost are unit energy cost, equipment life and building unitcost.
7/29/2019 Ulsab Final Report (1).Ashx
http://slidepdf.com/reader/full/ulsab-final-report-1ashx 59/62ULSAB Final Report48
Material CostsStamping Parts
UnitEnergy Cost
LaborWage
EquipmentLife
BuildingUnit Cost
ProductionLife
+20%$44 / hour
-20% +20%$0.10 / kwh-20%
15 years20 years25 years
+20%$1500 / m
2
-20%
3 years5 years8 years
+10%$352-20%
Overall Cost
5.6 Comparison
For comparison purposes, this economic analysis calculated thecost of manufacturing a future reference (Year 2000) structure inaddition to ULSAB. This reference is a hypothetical constructintended to represent an averaging of typical mid-sized four-doorsedans in the same class as ULSAB. The model inputs assumesignificantly improved fabrication and assembly techniques in year2000 body structure manufacturing in the United States, includinga lower part count, double attachments, and completelyautomated assembly.
Because no design details were assigned to the Year 2000structure, the study identified part groupings instead of individualparts, as with ULSAB. The groupings are based on part size andcomplexity as well as assembly operations grouped by levels of automation and size.
The comparison below represents a single run of the cost model
Overall Cost
7/29/2019 Ulsab Final Report (1).Ashx
http://slidepdf.com/reader/full/ulsab-final-report-1ashx 60/62ULSAB Final Report
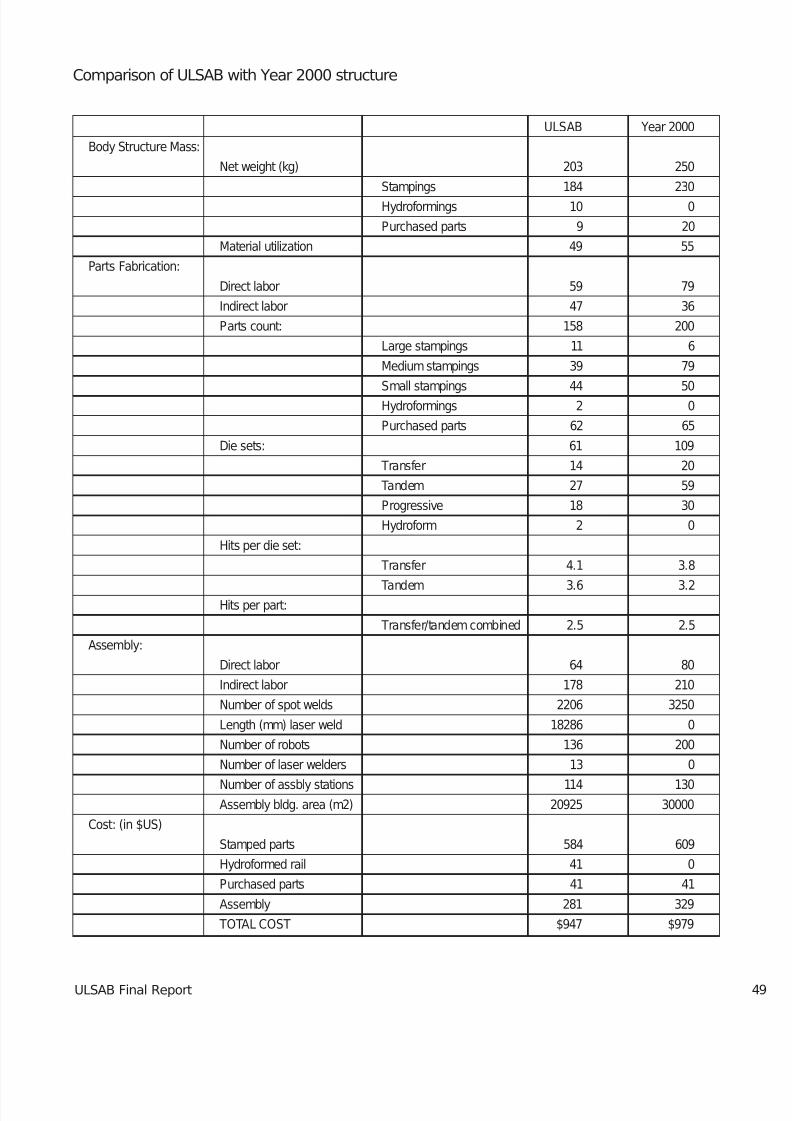
Comparison of ULSAB with Year 2000 structure
ULSAB Year 2000
Body Structure Mass:
Net weight (kg) 203 250
Stampings 184 230
Hydroformings 10 0
Purchased parts 9 20
Material utilization 49 55
Parts Fabrication:
Direct labor 59 79
Indirect labor 47 36
Parts count: 158 200
Large stampings 11 6
Medium stampings 39 79
Small stampings 44 50Hydroformings 2 0
Purchased parts 62 65
Die sets: 61 109
Transfer 14 20
Tandem 27 59
Progressive 18 30
Hydroform 2 0
Hits per die set:
Transfer 4.1 3.8
Tandem 3.6 3.2Hits per part:
Transfer/tandem combined 2.5 2.5
Assembly:
Direct labor 64 80
Indirect labor 178 210
Number of spot welds 2206 3250
Length (mm) laser weld 18286 0
Number of robots 136 200
Number of laser welders 13 0
Number of assbly stations 114 130Assembly bldg. area (m2) 20925 30000
Cost: (in $US)
Stamped parts 584 609
Hydroformed rail 41 0
Purchased parts 41 41
Assembly 281 329
TOTAL COST $947 $979
7/29/2019 Ulsab Final Report (1).Ashx
http://slidepdf.com/reader/full/ulsab-final-report-1ashx 61/62ULSAB Final Report
5.7 Conclusion
Achieving lightweight and superior performance in a steel bodystructure can be done at no cost penalty. In fact, it can be lessexpensive than structures that do not have its benefits. ULSABdemonstrates that reduced weight and superior performance areachievable and affordable.
50

7/29/2019 Ulsab Final Report (1).Ashx
http://slidepdf.com/reader/full/ulsab-final-report-1ashx 62/62
Related Documents