Ann. Geophys., 24, 1455–1468, 2006 www.ann-geophys.net/24/1455/2006/ © European Geosciences Union 2006 Annales Geophysicae ULF fluctuations of the geomagnetic field and ionospheric sounding measurements at low latitudes during the first CAWSES campaign U. Villante 1 , M. Vellante 1 , P. Francia 1 , M. De Lauretis 1 , A. Meloni 1 , P. Palangio 1 , B. Zolesi 1 , M. Pezzopane 1 , M. F ¨ orster 2 , T. L. Zhang 3 , W. Magnes 3 , P. Nenovski 4 , I. Cholakov 4 , and V. Wesztergom 5 1 Consorzio Area di Ricerca in Astrogeofisica, L’Aquila, Italy 2 GeoForschungsZentrum, Potsdam, Germany 3 Space Research Institute, Austrian Academy of Sciences, Graz, Austria 4 Geophysical Institute, Bulgarian Academy of Science, Sofia, Bulgaria 5 Geodetic and Geophysical Research Institute of the Hungarian Academy of Science, Sopron, Hungary Received: 17 August 2005 – Revised: 17 January 2006 – Accepted: 21 April 2006 – Published: 3 July 2006 Part of Special Issue “The 11th International Symposium on Equatorial Aeronomy (ISEA-11), Taipei, May 2005” Abstract. We present an analysis of ULF geomagnetic field fluctuations at low latitudes during the first CAWSES cam- paign (29 March–3 April 2004). During the whole campaign, mainly in the prenoon sector, a moderate Pc3-4 pulsation ac- tivity is observed, clearly related to interplanetary upstream waves. On 3 April, in correspondence to the Earth’s arrival of a coronal mass ejection, two SIs are observed whose wave- forms are indicative of a contribution of the high-latitude ionospheric currents to the low-latitude ground field. During the following geomagnetic storm, low frequency (Pc5) waves are observed at discrete frequencies. Their correspondence with the same frequencies detected in the radial components of the interplanetary magnetic field and solar wind speed sug- gests that Alfv´ enic solar wind fluctuations may act as di- rect drivers of magnetospheric fluctuations. A cross-phase analysis, using different pairs of stations, is also presented for identifying field line resonant frequencies and monitor- ing changes in plasmaspheric mass density. Lastly, an analy- sis of ionospheric vertical soundings, measured at the Rome ionosonde station (41.8 ◦ N, 12.5 ◦ E), and vertical TEC mea- surements deduced from GPS signals within an European network shows the relation between the ULF resonances in the inner magnetosphere and thermal plasma density varia- tions during geomagnetically quiet conditions, in contrast to various storm phases at the end of the CAWSES campaign. Keywords. Magnetospheric physics (Solar wind-magneto- sphere interactions; MHD waves and instabilities) – Iono- sphere (Ionosphere-magnetosphere interactions) Correspondence to: U. Villante ([email protected]) 1 Introduction In the last several years, research activity has produced a sig- nificant improvement in the knowledge of the physical pro- cesses which are the foundation of the solar-terrestrial rela- tionships and enable interdisciplinary progresses in under- standing the Sun-Earth domain as a whole. One of the scopes of the first CAWSES Space Weather Campaign (29 March– 3 April 2004) consisted of a collaborative effort to combine measurements from satellite and ground-based magnetome- ter chains for a better definition of several aspects related to the ULF activity. ULF waves in the frequency range ∼1– 100 mHz (or “magnetic pulsations”, as they are usually re- ferred to) represent an important aspect of the Sun-Earth re- lationships. Indeed, they play a significant role in the energy transfer from the solar wind (SW) to the magnetosphere and are an intrinsic signature of different processes taking place in the Earth’s magnetosphere as, for instance, the large va- riety of waves typically observed during the development of geomagnetic storms and substorms (Posch et al., 2003; Ol- son, 1999). In addition, ULF waves recorded at a dense lati- tudinal array can also be used to monitor the magnetospheric plasma mass density (Menk et al., 1999). We contributed to this international campaign by conduct- ing an analysis of ULF measurements at several low-latitude stations. In particular, we focused our attention on the Pc3 wave activity (22–100 mHz) in the whole period, and on the appearance of lower frequency modes at discrete frequen- cies in the Pc5 range (1.6–6.6 mHz) during the geomagnetic storm which occurred on 3 April 2004. We also present the results of cross-phase analysis using different pairs of sta- tions which allows one to identify the field line resonant Published by Copernicus GmbH on behalf of the European Geosciences Union.

Welcome message from author
This document is posted to help you gain knowledge. Please leave a comment to let me know what you think about it! Share it to your friends and learn new things together.
Transcript
Ann. Geophys., 24, 1455–1468, 2006www.ann-geophys.net/24/1455/2006/© European Geosciences Union 2006
AnnalesGeophysicae
ULF fluctuations of the geomagnetic field and ionospheric soundingmeasurements at low latitudes during the first CAWSES campaign
U. Villante1, M. Vellante1, P. Francia1, M. De Lauretis1, A. Meloni1, P. Palangio1, B. Zolesi1, M. Pezzopane1,M. Forster2, T. L. Zhang3, W. Magnes3, P. Nenovski4, I. Cholakov4, and V. Wesztergom5
1Consorzio Area di Ricerca in Astrogeofisica, L’Aquila, Italy2GeoForschungsZentrum, Potsdam, Germany3Space Research Institute, Austrian Academy of Sciences, Graz, Austria4Geophysical Institute, Bulgarian Academy of Science, Sofia, Bulgaria5Geodetic and Geophysical Research Institute of the Hungarian Academy of Science, Sopron, Hungary
Received: 17 August 2005 – Revised: 17 January 2006 – Accepted: 21 April 2006 – Published: 3 July 2006
Part of Special Issue “The 11th International Symposium on Equatorial Aeronomy (ISEA-11), Taipei, May 2005”
Abstract. We present an analysis of ULF geomagnetic fieldfluctuations at low latitudes during the first CAWSES cam-paign (29 March–3 April 2004). During the whole campaign,mainly in the prenoon sector, a moderate Pc3-4 pulsation ac-tivity is observed, clearly related to interplanetary upstreamwaves. On 3 April, in correspondence to the Earth’s arrival ofa coronal mass ejection, two SIs are observed whose wave-forms are indicative of a contribution of the high-latitudeionospheric currents to the low-latitude ground field. Duringthe following geomagnetic storm, low frequency (Pc5) wavesare observed at discrete frequencies. Their correspondencewith the same frequencies detected in the radial componentsof the interplanetary magnetic field and solar wind speed sug-gests that Alfvenic solar wind fluctuations may act as di-rect drivers of magnetospheric fluctuations. A cross-phaseanalysis, using different pairs of stations, is also presentedfor identifying field line resonant frequencies and monitor-ing changes in plasmaspheric mass density. Lastly, an analy-sis of ionospheric vertical soundings, measured at the Romeionosonde station (41.8◦ N, 12.5◦ E), and vertical TEC mea-surements deduced from GPS signals within an Europeannetwork shows the relation between the ULF resonances inthe inner magnetosphere and thermal plasma density varia-tions during geomagnetically quiet conditions, in contrast tovarious storm phases at the end of the CAWSES campaign.
Keywords. Magnetospheric physics (Solar wind-magneto-sphere interactions; MHD waves and instabilities) – Iono-sphere (Ionosphere-magnetosphere interactions)
Correspondence to:U. Villante([email protected])
1 Introduction
In the last several years, research activity has produced a sig-nificant improvement in the knowledge of the physical pro-cesses which are the foundation of the solar-terrestrial rela-tionships and enable interdisciplinary progresses in under-standing the Sun-Earth domain as a whole. One of the scopesof the first CAWSES Space Weather Campaign (29 March–3 April 2004) consisted of a collaborative effort to combinemeasurements from satellite and ground-based magnetome-ter chains for a better definition of several aspects related tothe ULF activity. ULF waves in the frequency range∼1–100 mHz (or “magnetic pulsations”, as they are usually re-ferred to) represent an important aspect of the Sun-Earth re-lationships. Indeed, they play a significant role in the energytransfer from the solar wind (SW) to the magnetosphere andare an intrinsic signature of different processes taking placein the Earth’s magnetosphere as, for instance, the large va-riety of waves typically observed during the development ofgeomagnetic storms and substorms (Posch et al., 2003; Ol-son, 1999). In addition, ULF waves recorded at a dense lati-tudinal array can also be used to monitor the magnetosphericplasma mass density (Menk et al., 1999).
We contributed to this international campaign by conduct-ing an analysis of ULF measurements at several low-latitudestations. In particular, we focused our attention on the Pc3wave activity (22–100 mHz) in the whole period, and on theappearance of lower frequency modes at discrete frequen-cies in the Pc5 range (1.6–6.6 mHz) during the geomagneticstorm which occurred on 3 April 2004. We also present theresults of cross-phase analysis using different pairs of sta-tions which allows one to identify the field line resonant
Published by Copernicus GmbH on behalf of the European Geosciences Union.
1456 U. Villante et al.: ULF measurements during the first CAWSES campaign
24
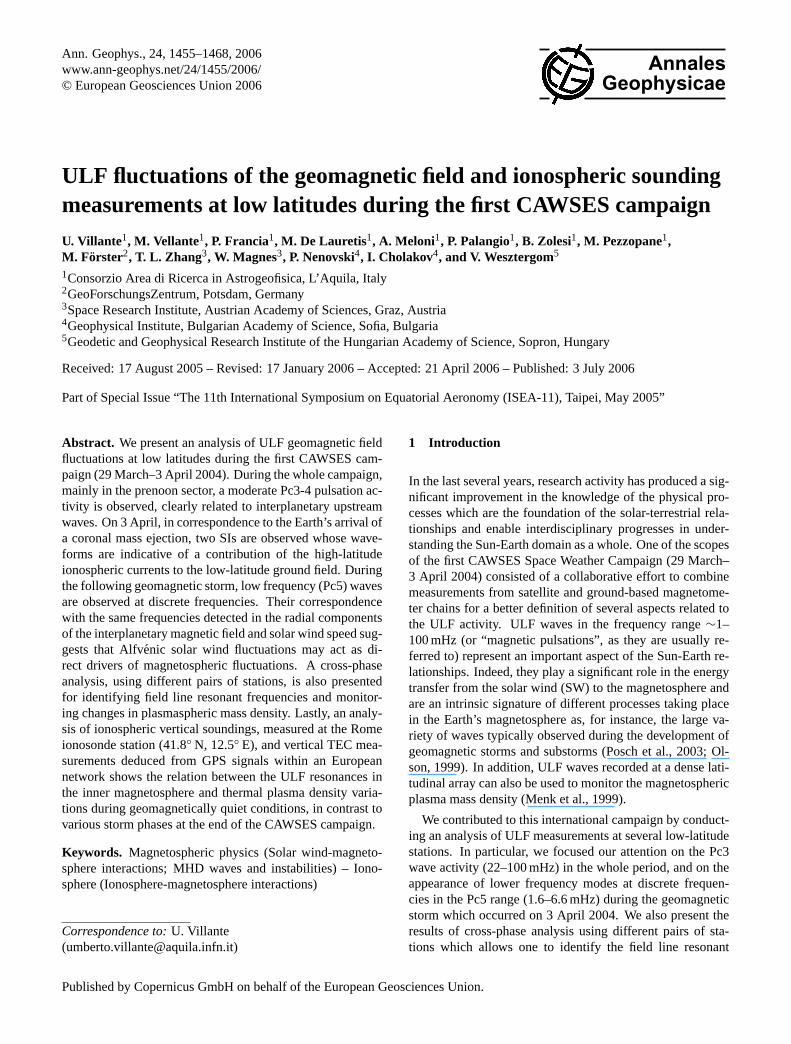
Fig. 1
Fig. 1. Hourly averages of the interplanetary parameters as measured by ACE during 29 March–3 April 2004. Starting from the top: IMFstrength, longitude (the angle between the IMF component in the ecliptic plane and the Sun-Earth direction) and latitude (the IMF inclinationon the ecliptic plane), SW speed and number density.
frequencies and to infer the variations of the plasmasphericmass density following the geomagnetic storm, an aspectwhich is very important in the space weather context. Iono-spheric vertical soundings, as well as vertical TEC measure-ments are also analyzed and compared with plasmasphericdensity estimates deduced from ULF wave resonances dur-ing the storm phases.
2 Data and instrumentation
The geomagnetic field measurements discussed in thepresent investigation come from SEGMA (South EuropeanGeoMagnetic Array; Vellante et al., 2002). SEGMA is a
low-latitude meridional magnetometer array which consistsof three stations in Italy and one in Hungary, latitudinallyequispaced betweenL=1.57–1.89. Each station is equippedwith high sensitivity (∼10 pT) triaxial fluxgate magnetome-ters recording the northward (H ), eastward (D), and verti-cally downward (Z) components of the geomagnetic fieldvariations. An automatic acquisition system collects the dataat 1 s, with timing provided via GPS. For this campaign wealso had available 1-s fluxgate measurements made at Ot-tana (Sardinia, Italy) and 1-s search-coil measurements atPanagyurishte (Bulgaria). The coordinates of all the stationsare given in Table 1.
Ann. Geophys., 24, 1455–1468, 2006 www.ann-geophys.net/24/1455/2006/

U. Villante et al.: ULF measurements during the first CAWSES campaign 1457
Table 1. Coordinates of the ULF magnetic stations.
Station Geographic Coord. Corr. Geomag. Coord. L
Name Code Lat. [◦ N] Lon. [◦ E] Lat. [◦ N] Lon. [◦ E] RE
Nagycenk NCK 47.63 16.72 42.76 91.41 1.89Castello Tesino CST 46.05 11.65 40.82 86.64 1.78Ranchio RNC 43.97 12.08 38.26 86.57 1.65L’Aquila AQU 42.38 13.32 36.30 87.35 1.57Panagyurishte PAG 42.51 24.18 36.98 97.21 1.59Ottana OTN 40.26 8.97 33.40 83.17 1.46
For a comparison with the interplanetary medium condi-tions we considered the SW and interplanetary magnetic field(IMF) parameters from the ACE spacecraft at the L1 librationpoint upstream of the Earth.
Fifteen-minute ionospheric measurements are routinelycarried out at the ionospheric station of Rome (41.8 N,12.5 E). The ionograms, visible at the sitehttp://dps-roma.ingv.it/, are recorded by a Digital Portable Sounder (DPS)(Reinisch, 1996) and automatically scaled by the ARTISTsystem (Reinisch and Huang, 1983). For our purposes theautomatically scaled values offoF2 (the critical frequency ofthe F2 layer) from 31 March to 5 April 2004 were validatedusing the Interpre software (Pezzopane, 2004).
We also used vertical Total Electron Content (TEC) mea-surements over Northern Italy as deduced from recordingsof GPS signals, using receiving stations of the InternationalGPS Service (IGS) all over Europe. They are compiled as re-gional maps of the European sector within the bounds from20◦ W to 40◦ E geographic longitude and 35◦–70◦ N latitude(seehttp://www.kn.nz.dlr.de/tecmon). We used TEC mapswith a 30-min time resolution. They combine measurementsfrom about 70–110 independent GPS data links for the con-struction of each TEC pattern in combination with a suitablebackground model (Jakowski, 1996).
3 The temporal pattern of Pc3 wave activity
In general, at middle and low latitudes, most aspects of theground Pc3 manifestations are interpreted in terms of pen-etration of upstream waves, generated by ions reflected offthe bow shock along the IMF lines, and related field lineresonance (FLR) phenomena (Yumoto, 1986). An importantargument in favor of the upstream wave source is the gener-ally observed linear relation between the frequency of groundpulsations and the IMF strength, i.e.f [mHz] ∼6·BIMF [nT](Troitskaya and Bolshakova, 1988). In addition, the IMF ori-entation also plays a significant role in that ground pulsationsoccur more frequently when the cone angle (the angleθXB
between the IMF and the Sun-Earth line) is small, suggesting
a direct transmission of waves from the subsolar bow shock(Russell et al., 1983).
The interplanetary medium conditions during the cam-paign are shown in Fig. 1. As can be seen, from 29 Marchto 2 April, the IMF strength is∼5 nT, its direction fluctu-ates both in longitude and in latitude, the SW speed mono-tonically decreases from∼600 km/s to values smaller than400 km/s and the number density is lower than 5 cm−3. On3 April at ∼08:55 UT, ACE observed the arrival of a coronalmass ejection (CME).
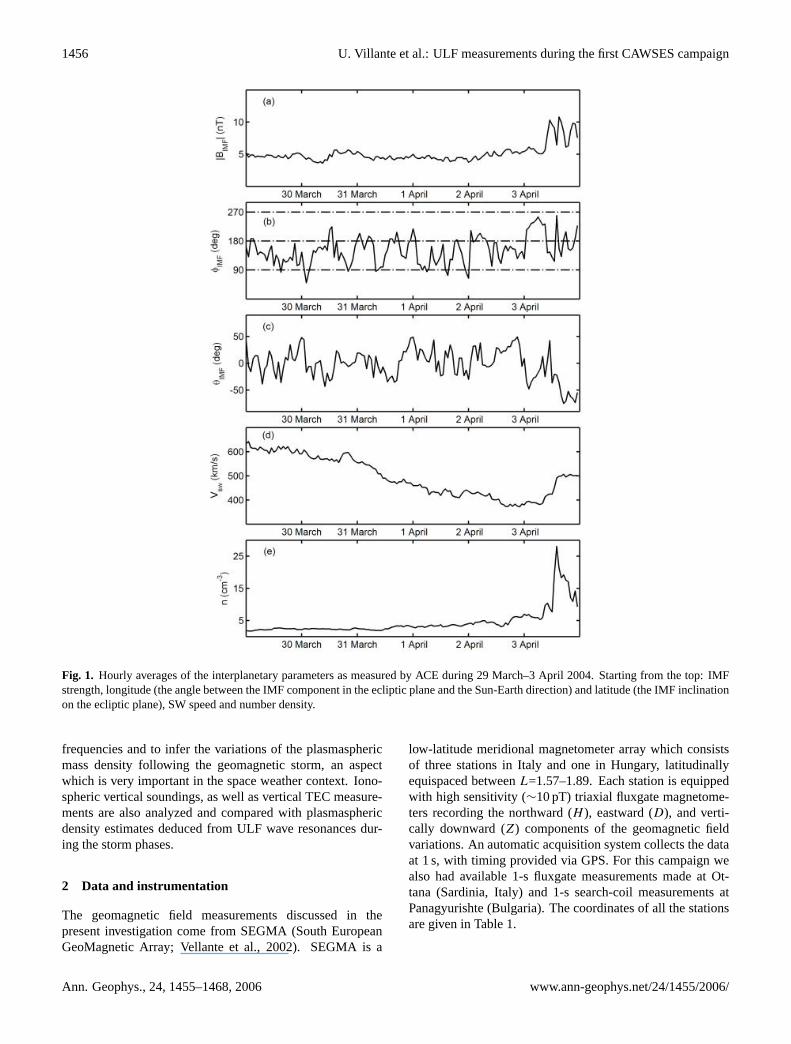
Figure 2 illustrates the time behaviour of the ULF waveactivity during the whole CAWSES campaign at NCK(MLT ∼ UT + 1:40); a similar behaviour also is observed atthe other stations of the array. We show here theD compo-nent, which is less affected, with respect to theH compo-nent, by local FLR. As typical at these latitudes, Pc3 waveactivity is observed in the form of distinct wave packets;the dominant frequency is∼30 mHz which, according to theabove-mentioned empirical relation, closely corresponds tothe expected upstream wave frequency for an IMF magni-tude of ∼5 nT. At the top of each spectrum, we show thehourly average of the cone angle with red (blue) lines, in-dicating favourable (unfavourable) conditions for upstreamwave transmission in the magnetosphere in correspondenceto θXB values lower (higher) than 50◦ (Greenstadt and Ol-son, 1979). As can be seen, distinct amplitude enhancementsmostly occur in the morning sector and are often associatedwith small cone angles, while in the afternoon sector thewave activity is negligible, independent onθXB .
This kind of morning/afternoon asymmetry was suggestedby Greenstadt (1973) to be caused by the average spiralorientation of the IMF lines which would create the quasi-parallel shock region (where upstream waves are generated),preferentially in the morning side. However, Takahashi etal. (1981) found, at geosyncronous orbit, a higher occurrenceof Pc3 pulsations in the morning, independent of the IMF ori-entation.
In our case, a clear example of strong morning/afternoonasymmetry in the Pc3 wave amplitude which is notexplained by the Greenstadt (1973) argument, is ob-served on 31 March. On this day, during the morning
www.ann-geophys.net/24/1455/2006/ Ann. Geophys., 24, 1455–1468, 2006
1458 U. Villante et al.: ULF measurements during the first CAWSES campaign
Fig. 2. Dynamic amplitude spectra of theD-comp. at NCK. Data have been time differenced before spectral processing to better visualizePc3 (20 mHz–100 mHz) wave activity. The amplitude scale is different for each day. Hourly values of the cone angle (taking into account thepropagation delay from ACE spacecraft to the magnetopause) are shown at the top of each spectrum. Favourable (unfavourable) conditionsfor upstream wave transmission in the magnetosphere are evidenced by the different colour: red (blue) forθXB lower (higher) than 50◦.
(04:00–07:00 UT) and afternoon (14:00–18:00 UT) hours,there is similar favourableθXB (Fig. 2), and the IMF lon-gitude (φ∼180◦, Fig. 1) should not provide a morning or anafternoon preference. This indicates that some other mech-anism has to be considered for the preferential morning oc-currence of Pc3 pulsations.
4 Arrival at Earth of the 3 April CME
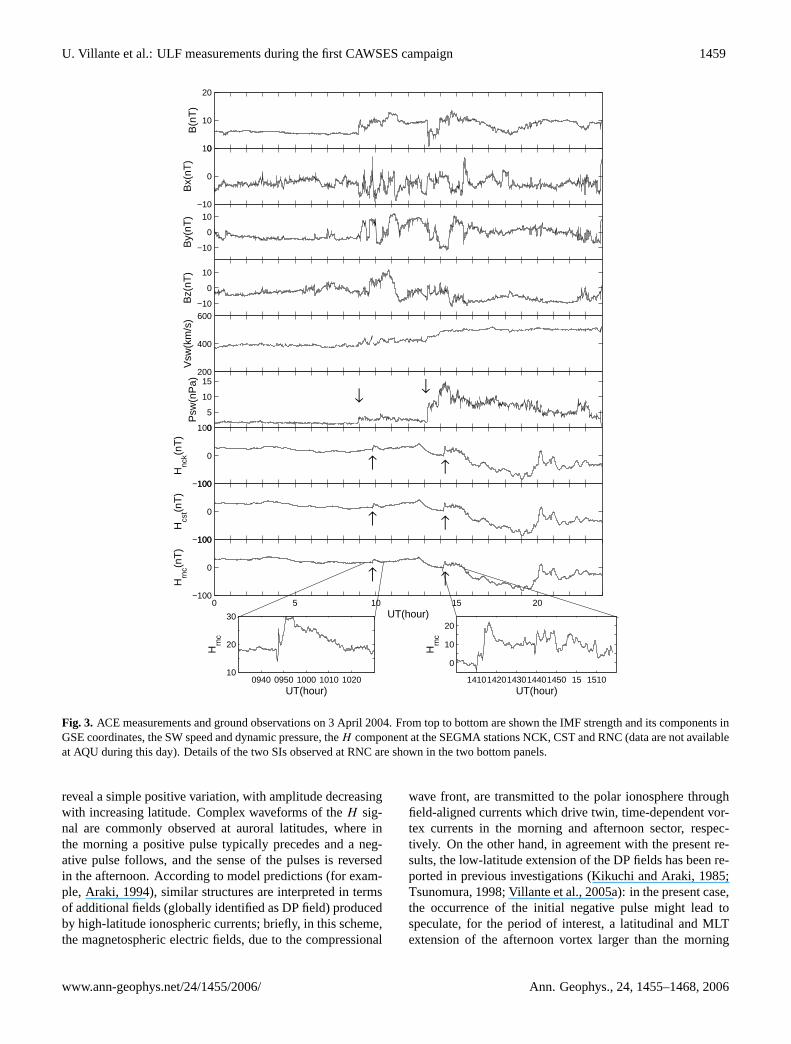
On 3 April a CME arrived at∼08:55 UT at the ACE position(Fig. 3). As can be seen, the IMF strength changes from∼5 to ∼8 nT, theBx and By components become highlyvariable, Bz increases to large positive values (∼12 nT)until ∼10:48 UT, then decreases, becoming negative at∼11:10 UT. After the IMF southward turning, ground ob-servations show the development of a moderate geomagneticstorm. The SW pressure shows two sharp, positive vari-ations at∼08:58 UT and∼13:12 UT (downward arrows)which find clear correspondence in two SIs observed on theH component of the geomagnetic field at SEGMA stations
at 09:47 UT and 14:10 UT (upward arrows). The time delaybetween the SW pressure variation and the SI occurrence is∼51 and∼58 min, respectively. While for the second SI theobserved time delay can be considered consistent with a ra-dial propagation of the SW structure (∼50 min to the subso-lar bow shock, plus the propagation time through the mag-netosheath and the magnetosphere), for the first SI the timedelay is lower than the estimated one (∼56 min to the sub-solar bow shock) suggesting a SW discontinuity inclined ata large angle (∼60–65◦) with respect to the radial direction(Villante et al., 2004).
As shown in the bottom left panel, the first SI (a simi-lar behaviour, although less explicit, is also identified for thesecond SI, bottom right panel) is characterized by a complexbehaviour of theH component, with two successive pulsesof opposite sign (negative/positive) preceding a further in-crease, and then a longer term decrease to a new steady state.Such complex behaviour confirms (Villante et al., 2005a) thatatL ∼1.6–1.9 the SI signal cannot be interpreted in terms ofthe magnetopause current alone (DL field): if this would bethe case, indeed, the experimental measurements should only
Ann. Geophys., 24, 1455–1468, 2006 www.ann-geophys.net/24/1455/2006/
U. Villante et al.: ULF measurements during the first CAWSES campaign 1459
0 5 10 15 20−100
0
100
↑ ↑Hrn
c(nT
)
UT(hour)
−100
0
100
↑ ↑Hcs
t(nT
)
−100
0
100
↑ ↑Hnc
k(nT
)
200
400
600
Vsw
(km
/s)
0
5
10
15
↓ ↓
Psw
(nP
a)
0
10
20
B(n
T)
−10
0
10
Bz(
nT)
−10
0
10
Bx(
nT)
−10
0
10
By(
nT)
0940 0950 1000 1010 102010
20
30
UT(hour)
Hrn
c
14101420143014401450 15 1510
0
10
20
UT(hour)
Hrn
c
Fig. 3. ACE measurements and ground observations on 3 April 2004. From top to bottom are shown the IMF strength and its components inGSE coordinates, the SW speed and dynamic pressure, theH component at the SEGMA stations NCK, CST and RNC (data are not availableat AQU during this day). Details of the two SIs observed at RNC are shown in the two bottom panels.
reveal a simple positive variation, with amplitude decreasingwith increasing latitude. Complex waveforms of theH sig-nal are commonly observed at auroral latitudes, where inthe morning a positive pulse typically precedes and a neg-ative pulse follows, and the sense of the pulses is reversedin the afternoon. According to model predictions (for exam-ple, Araki, 1994), similar structures are interpreted in termsof additional fields (globally identified as DP field) producedby high-latitude ionospheric currents; briefly, in this scheme,the magnetospheric electric fields, due to the compressional
wave front, are transmitted to the polar ionosphere throughfield-aligned currents which drive twin, time-dependent vor-tex currents in the morning and afternoon sector, respec-tively. On the other hand, in agreement with the present re-sults, the low-latitude extension of the DP fields has been re-ported in previous investigations (Kikuchi and Araki, 1985;Tsunomura, 1998; Villante et al., 2005a): in the present case,the occurrence of the initial negative pulse might lead tospeculate, for the period of interest, a latitudinal and MLTextension of the afternoon vortex larger than the morning
www.ann-geophys.net/24/1455/2006/ Ann. Geophys., 24, 1455–1468, 2006
1460 U. Villante et al.: ULF measurements during the first CAWSES campaign
1 3 50
10
20
30
40
50
60
PS
Dsw
Freq.(mHz)
0
0.2
0.4
0.6
0.8
1
PS
DB
x
0
0.2
0.4
0.6
0.8
1
1.2
PS
DH
(a)
(b)
(c)
Fig. 4. (a)Power spectral density of the H component at NCK (solidline), CST (dashed line) and RNC (dotted line) in the time interval14:18–15:18 UT on 3 April 2004;(b) power spectral density of theIMF Bx component time shifted by –1 h;(c) power spectral densityof the SW speed (solid line) and density (dashed line) time shiftedby −1 h.
one, a situation predicted by Araki (1994) as a consequenceof the different morning and afternoon conductivity. As tothe amplitude of the geomagnetic response, the comparisonof different stations suggests a steady-state response1H (asevaluated 5 min after the peak response) decreasing with de-creasing latitude as∼1 nT/◦: as previously underlined, thisbehaviour is odd with respect to predictions for the DL fieldalone and also confirms a significant contribution of the DPfield on the longer term variation (Villante and Di Giuseppe,2004; Villante et al., 2005a).
5 Low frequency magnetospheric modes during thestorm
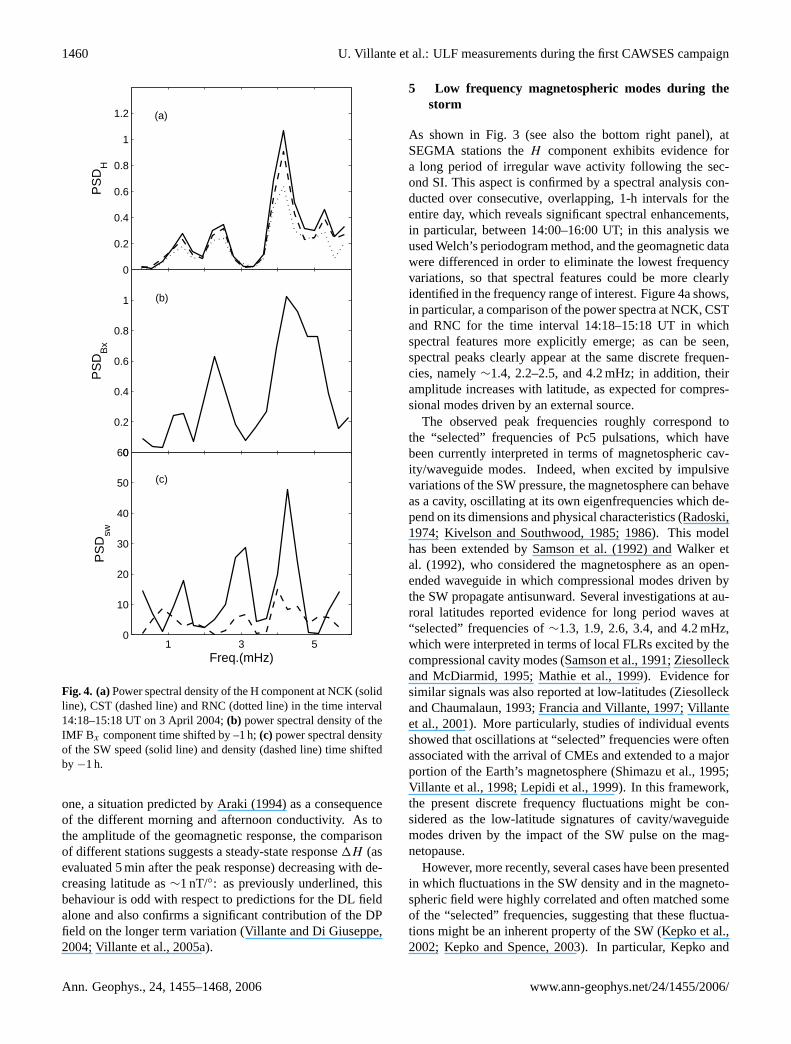
As shown in Fig. 3 (see also the bottom right panel), atSEGMA stations theH component exhibits evidence fora long period of irregular wave activity following the sec-ond SI. This aspect is confirmed by a spectral analysis con-ducted over consecutive, overlapping, 1-h intervals for theentire day, which reveals significant spectral enhancements,in particular, between 14:00–16:00 UT; in this analysis weused Welch’s periodogram method, and the geomagnetic datawere differenced in order to eliminate the lowest frequencyvariations, so that spectral features could be more clearlyidentified in the frequency range of interest. Figure 4a shows,in particular, a comparison of the power spectra at NCK, CSTand RNC for the time interval 14:18–15:18 UT in whichspectral features more explicitly emerge; as can be seen,spectral peaks clearly appear at the same discrete frequen-cies, namely∼1.4, 2.2–2.5, and 4.2 mHz; in addition, theiramplitude increases with latitude, as expected for compres-sional modes driven by an external source.
The observed peak frequencies roughly correspond tothe “selected” frequencies of Pc5 pulsations, which havebeen currently interpreted in terms of magnetospheric cav-ity/waveguide modes. Indeed, when excited by impulsivevariations of the SW pressure, the magnetosphere can behaveas a cavity, oscillating at its own eigenfrequencies which de-pend on its dimensions and physical characteristics (Radoski,1974; Kivelson and Southwood, 1985; 1986). This modelhas been extended by Samson et al. (1992) and Walker etal. (1992), who considered the magnetosphere as an open-ended waveguide in which compressional modes driven bythe SW propagate antisunward. Several investigations at au-roral latitudes reported evidence for long period waves at“selected” frequencies of∼1.3, 1.9, 2.6, 3.4, and 4.2 mHz,which were interpreted in terms of local FLRs excited by thecompressional cavity modes (Samson et al., 1991; Ziesolleckand McDiarmid, 1995; Mathie et al., 1999). Evidence forsimilar signals was also reported at low-latitudes (Ziesolleckand Chaumalaun, 1993; Francia and Villante, 1997; Villanteet al., 2001). More particularly, studies of individual eventsshowed that oscillations at “selected” frequencies were oftenassociated with the arrival of CMEs and extended to a majorportion of the Earth’s magnetosphere (Shimazu et al., 1995;Villante et al., 1998; Lepidi et al., 1999). In this framework,the present discrete frequency fluctuations might be con-sidered as the low-latitude signatures of cavity/waveguidemodes driven by the impact of the SW pulse on the mag-netopause.
However, more recently, several cases have been presentedin which fluctuations in the SW density and in the magneto-spheric field were highly correlated and often matched someof the “selected” frequencies, suggesting that these fluctua-tions might be an inherent property of the SW (Kepko et al.,2002; Kepko and Spence, 2003). In particular, Kepko and
Ann. Geophys., 24, 1455–1468, 2006 www.ann-geophys.net/24/1455/2006/
U. Villante et al.: ULF measurements during the first CAWSES campaign 1461
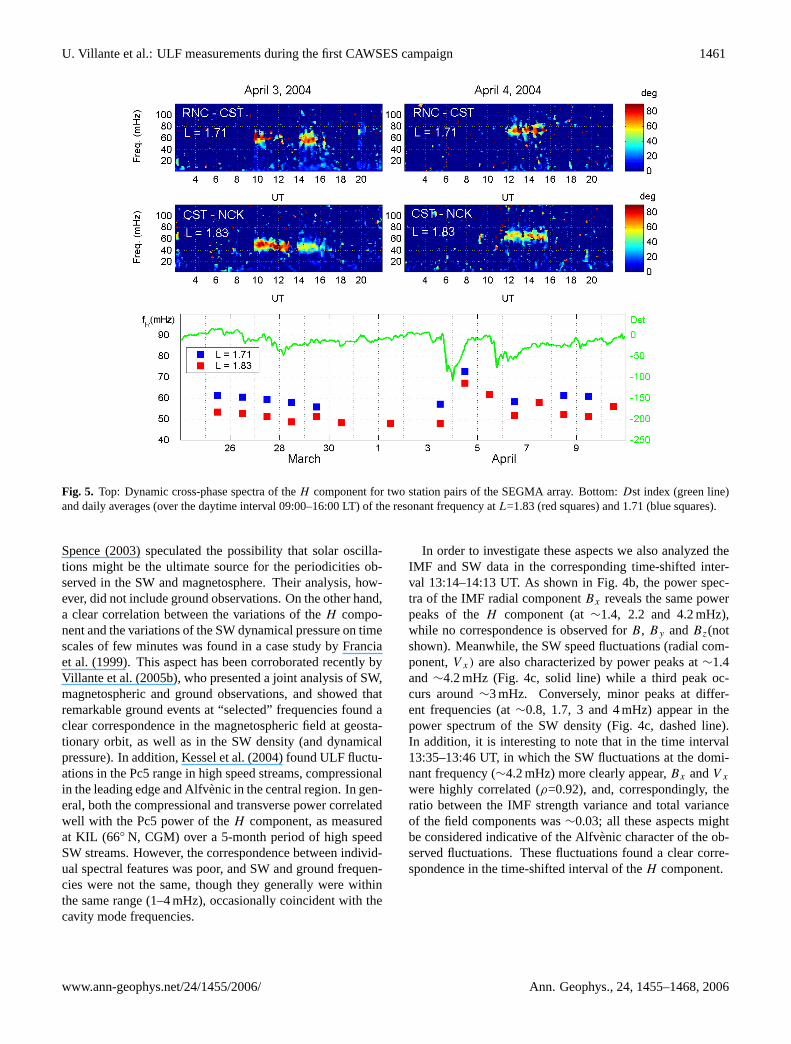
Fig. 5. Top: Dynamic cross-phase spectra of theH component for two station pairs of the SEGMA array. Bottom:Dst index (green line)and daily averages (over the daytime interval 09:00–16:00 LT) of the resonant frequency atL=1.83 (red squares) and 1.71 (blue squares).
Spence (2003) speculated the possibility that solar oscilla-tions might be the ultimate source for the periodicities ob-served in the SW and magnetosphere. Their analysis, how-ever, did not include ground observations. On the other hand,a clear correlation between the variations of theH compo-nent and the variations of the SW dynamical pressure on timescales of few minutes was found in a case study by Franciaet al. (1999). This aspect has been corroborated recently byVillante et al. (2005b), who presented a joint analysis of SW,magnetospheric and ground observations, and showed thatremarkable ground events at “selected” frequencies found aclear correspondence in the magnetospheric field at geosta-tionary orbit, as well as in the SW density (and dynamicalpressure). In addition, Kessel et al. (2004) found ULF fluctu-ations in the Pc5 range in high speed streams, compressionalin the leading edge and Alfvenic in the central region. In gen-eral, both the compressional and transverse power correlatedwell with the Pc5 power of theH component, as measuredat KIL (66◦ N, CGM) over a 5-month period of high speedSW streams. However, the correspondence between individ-ual spectral features was poor, and SW and ground frequen-cies were not the same, though they generally were withinthe same range (1–4 mHz), occasionally coincident with thecavity mode frequencies.
In order to investigate these aspects we also analyzed theIMF and SW data in the corresponding time-shifted inter-val 13:14–14:13 UT. As shown in Fig. 4b, the power spec-tra of the IMF radial componentBx reveals the same powerpeaks of theH component (at∼1.4, 2.2 and 4.2 mHz),while no correspondence is observed forB, By andBz(notshown). Meanwhile, the SW speed fluctuations (radial com-ponent,V x) are also characterized by power peaks at∼1.4and ∼4.2 mHz (Fig. 4c, solid line) while a third peak oc-curs around∼3 mHz. Conversely, minor peaks at differ-ent frequencies (at∼0.8, 1.7, 3 and 4 mHz) appear in thepower spectrum of the SW density (Fig. 4c, dashed line).In addition, it is interesting to note that in the time interval13:35–13:46 UT, in which the SW fluctuations at the domi-nant frequency (∼4.2 mHz) more clearly appear,Bx andV x
were highly correlated (ρ=0.92), and, correspondingly, theratio between the IMF strength variance and total varianceof the field components was∼0.03; all these aspects mightbe considered indicative of the Alfvenic character of the ob-served fluctuations. These fluctuations found a clear corre-spondence in the time-shifted interval of theH component.
www.ann-geophys.net/24/1455/2006/ Ann. Geophys., 24, 1455–1468, 2006
1462 U. Villante et al.: ULF measurements during the first CAWSES campaign
Table 2. Resonant frequencies and corresponding equatorial densities.
L fR (3 April) fR (4 April) ρ1=ρo (3 April) ρ2=ρo (4 April) ρ1/ρ2
1.71 57 mHz 73 mHz 7800 amu/cc 4800 amu/cc 1.61.83 48 mHz 67 mHz 5900 amu/cc 3000 amu/cc 2.0
29
Fig.6
Fig.7
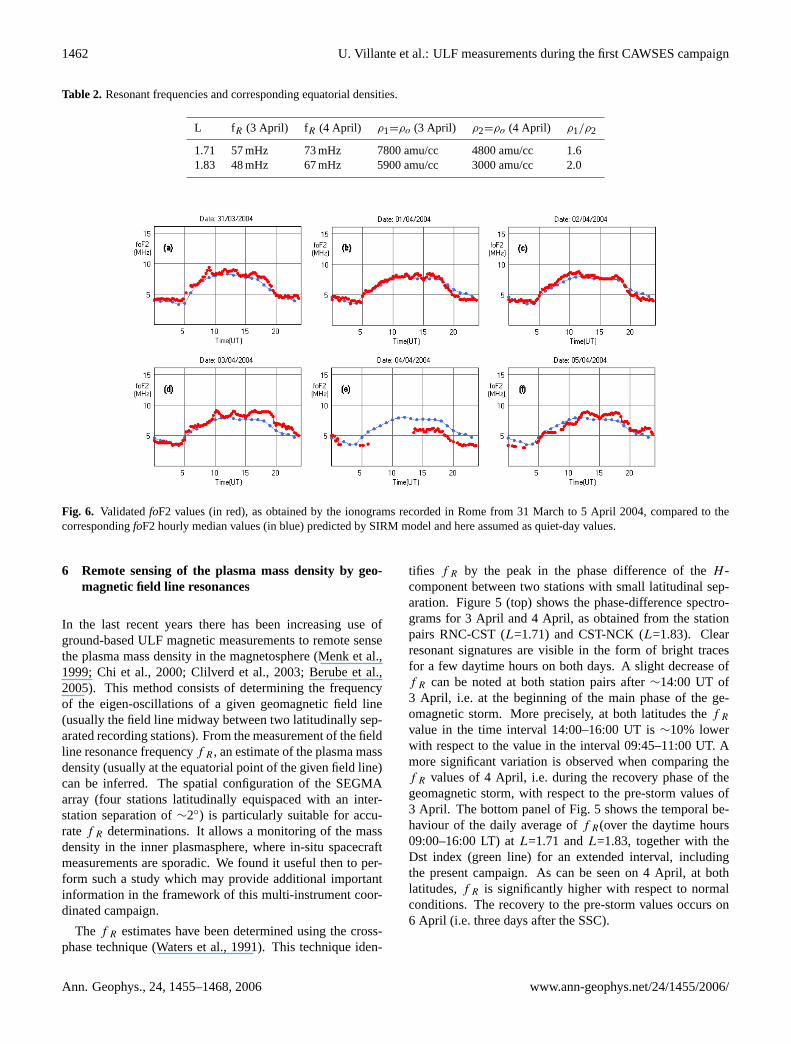
Fig. 6. ValidatedfoF2 values (in red), as obtained by the ionograms recorded in Rome from 31 March to 5 April 2004, compared to thecorrespondingfoF2 hourly median values (in blue) predicted by SIRM model and here assumed as quiet-day values.
6 Remote sensing of the plasma mass density by geo-magnetic field line resonances
In the last recent years there has been increasing use ofground-based ULF magnetic measurements to remote sensethe plasma mass density in the magnetosphere (Menk et al.,1999; Chi et al., 2000; Clilverd et al., 2003; Berube et al.,2005). This method consists of determining the frequencyof the eigen-oscillations of a given geomagnetic field line(usually the field line midway between two latitudinally sep-arated recording stations). From the measurement of the fieldline resonance frequencyf R, an estimate of the plasma massdensity (usually at the equatorial point of the given field line)can be inferred. The spatial configuration of the SEGMAarray (four stations latitudinally equispaced with an inter-station separation of∼2◦) is particularly suitable for accu-ratef R determinations. It allows a monitoring of the massdensity in the inner plasmasphere, where in-situ spacecraftmeasurements are sporadic. We found it useful then to per-form such a study which may provide additional importantinformation in the framework of this multi-instrument coor-dinated campaign.
The f R estimates have been determined using the cross-phase technique (Waters et al., 1991). This technique iden-
tifies f R by the peak in the phase difference of theH -component between two stations with small latitudinal sep-aration. Figure 5 (top) shows the phase-difference spectro-grams for 3 April and 4 April, as obtained from the stationpairs RNC-CST (L=1.71) and CST-NCK (L=1.83). Clearresonant signatures are visible in the form of bright tracesfor a few daytime hours on both days. A slight decrease off R can be noted at both station pairs after∼14:00 UT of3 April, i.e. at the beginning of the main phase of the ge-omagnetic storm. More precisely, at both latitudes thef R
value in the time interval 14:00–16:00 UT is∼10% lowerwith respect to the value in the interval 09:45–11:00 UT. Amore significant variation is observed when comparing thef R values of 4 April, i.e. during the recovery phase of thegeomagnetic storm, with respect to the pre-storm values of3 April. The bottom panel of Fig. 5 shows the temporal be-haviour of the daily average off R(over the daytime hours09:00–16:00 LT) atL=1.71 andL=1.83, together with theDst index (green line) for an extended interval, includingthe present campaign. As can be seen on 4 April, at bothlatitudes,f R is significantly higher with respect to normalconditions. The recovery to the pre-storm values occurs on6 April (i.e. three days after the SSC).
Ann. Geophys., 24, 1455–1468, 2006 www.ann-geophys.net/24/1455/2006/
U. Villante et al.: ULF measurements during the first CAWSES campaign 1463
29
Fig.6
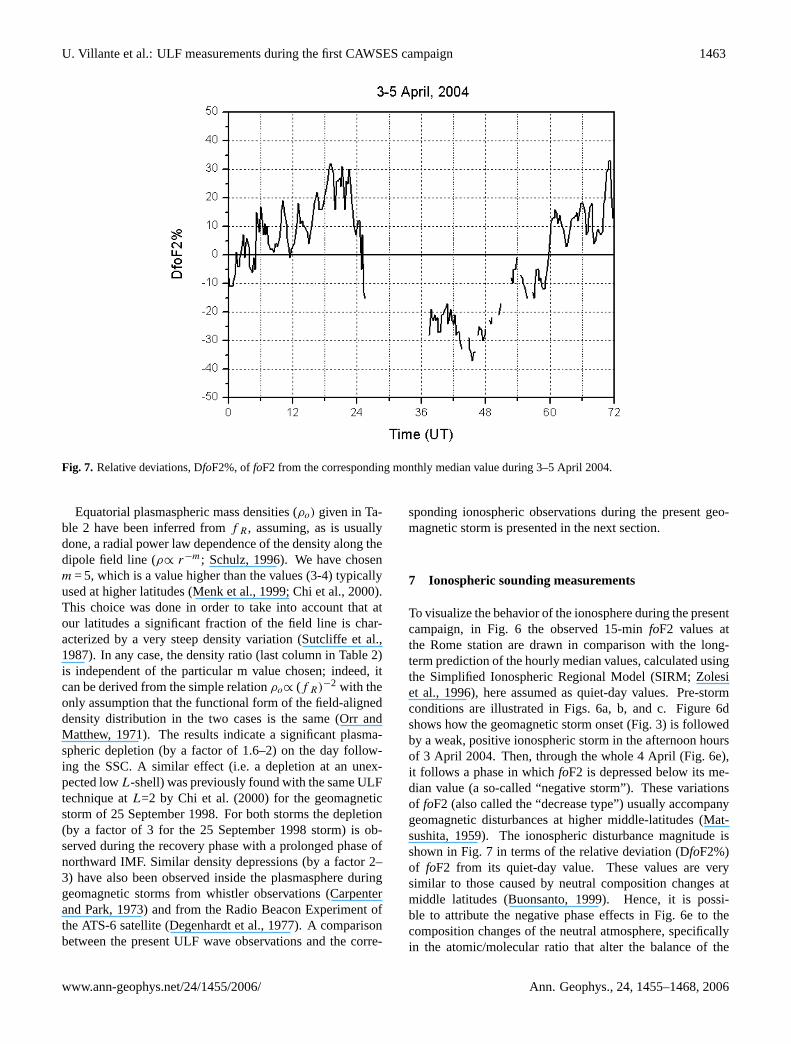
Fig.7 Fig. 7. Relative deviations, DfoF2%, offoF2 from the corresponding monthly median value during 3–5 April 2004.
Equatorial plasmaspheric mass densities (ρo) given in Ta-ble 2 have been inferred fromf R, assuming, as is usuallydone, a radial power law dependence of the density along thedipole field line (ρ∝ r−m; Schulz, 1996). We have chosenm = 5, which is a value higher than the values (3-4) typicallyused at higher latitudes (Menk et al., 1999; Chi et al., 2000).This choice was done in order to take into account that atour latitudes a significant fraction of the field line is char-acterized by a very steep density variation (Sutcliffe et al.,1987). In any case, the density ratio (last column in Table 2)is independent of the particular m value chosen; indeed, itcan be derived from the simple relationρo∝ (f R)−2 with theonly assumption that the functional form of the field-aligneddensity distribution in the two cases is the same (Orr andMatthew, 1971). The results indicate a significant plasma-spheric depletion (by a factor of 1.6–2) on the day follow-ing the SSC. A similar effect (i.e. a depletion at an unex-pected lowL-shell) was previously found with the same ULFtechnique atL=2 by Chi et al. (2000) for the geomagneticstorm of 25 September 1998. For both storms the depletion(by a factor of 3 for the 25 September 1998 storm) is ob-served during the recovery phase with a prolonged phase ofnorthward IMF. Similar density depressions (by a factor 2–3) have also been observed inside the plasmasphere duringgeomagnetic storms from whistler observations (Carpenterand Park, 1973) and from the Radio Beacon Experiment ofthe ATS-6 satellite (Degenhardt et al., 1977). A comparisonbetween the present ULF wave observations and the corre-
sponding ionospheric observations during the present geo-magnetic storm is presented in the next section.
7 Ionospheric sounding measurements
To visualize the behavior of the ionosphere during the presentcampaign, in Fig. 6 the observed 15-minfoF2 values atthe Rome station are drawn in comparison with the long-term prediction of the hourly median values, calculated usingthe Simplified Ionospheric Regional Model (SIRM; Zolesiet al., 1996), here assumed as quiet-day values. Pre-stormconditions are illustrated in Figs. 6a, b, and c. Figure 6dshows how the geomagnetic storm onset (Fig. 3) is followedby a weak, positive ionospheric storm in the afternoon hoursof 3 April 2004. Then, through the whole 4 April (Fig. 6e),it follows a phase in whichfoF2 is depressed below its me-dian value (a so-called “negative storm”). These variationsof foF2 (also called the “decrease type”) usually accompanygeomagnetic disturbances at higher middle-latitudes (Mat-sushita, 1959). The ionospheric disturbance magnitude isshown in Fig. 7 in terms of the relative deviation (DfoF2%)of foF2 from its quiet-day value. These values are verysimilar to those caused by neutral composition changes atmiddle latitudes (Buonsanto, 1999). Hence, it is possi-ble to attribute the negative phase effects in Fig. 6e to thecomposition changes of the neutral atmosphere, specificallyin the atomic/molecular ratio that alter the balance of the
www.ann-geophys.net/24/1455/2006/ Ann. Geophys., 24, 1455–1468, 2006
1464 U. Villante et al.: ULF measurements during the first CAWSES campaign
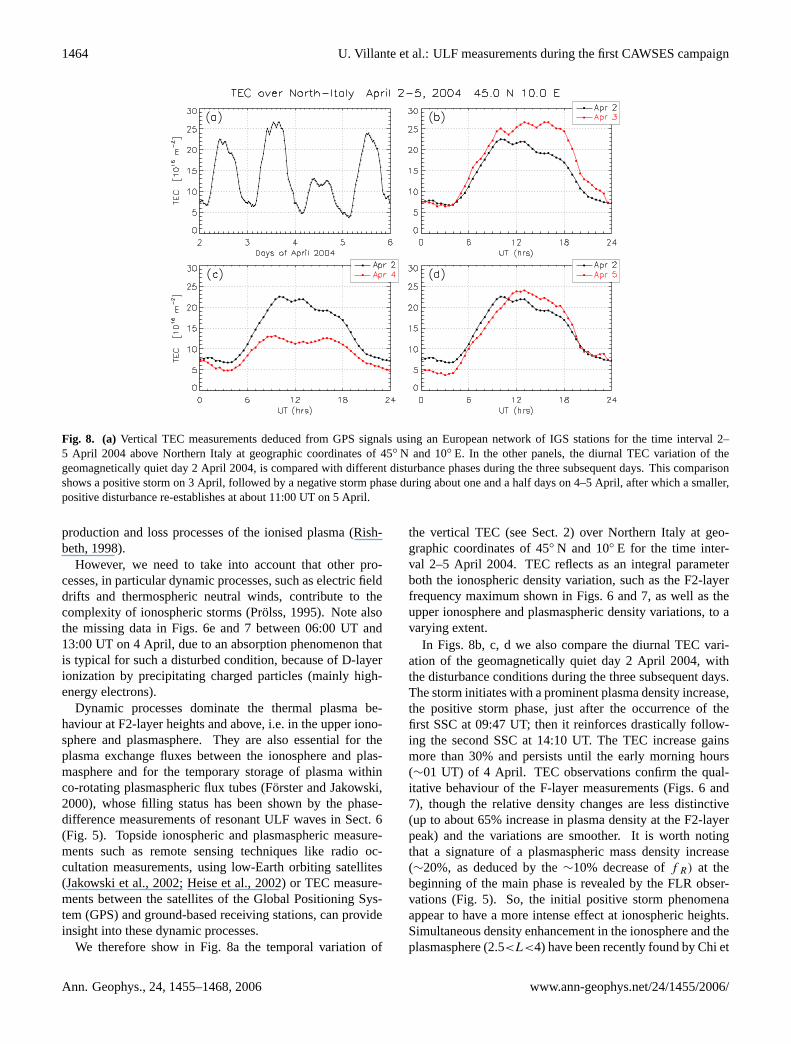
Fig. 8. (a) Vertical TEC measurements deduced from GPS signals using an European network of IGS stations for the time interval 2–5 April 2004 above Northern Italy at geographic coordinates of 45◦ N and 10◦ E. In the other panels, the diurnal TEC variation of thegeomagnetically quiet day 2 April 2004, is compared with different disturbance phases during the three subsequent days. This comparisonshows a positive storm on 3 April, followed by a negative storm phase during about one and a half days on 4–5 April, after which a smaller,positive disturbance re-establishes at about 11:00 UT on 5 April.
production and loss processes of the ionised plasma (Rish-beth, 1998).
However, we need to take into account that other pro-cesses, in particular dynamic processes, such as electric fielddrifts and thermospheric neutral winds, contribute to thecomplexity of ionospheric storms (Prolss, 1995). Note alsothe missing data in Figs. 6e and 7 between 06:00 UT and13:00 UT on 4 April, due to an absorption phenomenon thatis typical for such a disturbed condition, because of D-layerionization by precipitating charged particles (mainly high-energy electrons).
Dynamic processes dominate the thermal plasma be-haviour at F2-layer heights and above, i.e. in the upper iono-sphere and plasmasphere. They are also essential for theplasma exchange fluxes between the ionosphere and plas-masphere and for the temporary storage of plasma withinco-rotating plasmaspheric flux tubes (Forster and Jakowski,2000), whose filling status has been shown by the phase-difference measurements of resonant ULF waves in Sect. 6(Fig. 5). Topside ionospheric and plasmaspheric measure-ments such as remote sensing techniques like radio oc-cultation measurements, using low-Earth orbiting satellites(Jakowski et al., 2002; Heise et al., 2002) or TEC measure-ments between the satellites of the Global Positioning Sys-tem (GPS) and ground-based receiving stations, can provideinsight into these dynamic processes.
We therefore show in Fig. 8a the temporal variation of
the vertical TEC (see Sect. 2) over Northern Italy at geo-graphic coordinates of 45◦ N and 10◦ E for the time inter-val 2–5 April 2004. TEC reflects as an integral parameterboth the ionospheric density variation, such as the F2-layerfrequency maximum shown in Figs. 6 and 7, as well as theupper ionosphere and plasmaspheric density variations, to avarying extent.
In Figs. 8b, c, d we also compare the diurnal TEC vari-ation of the geomagnetically quiet day 2 April 2004, withthe disturbance conditions during the three subsequent days.The storm initiates with a prominent plasma density increase,the positive storm phase, just after the occurrence of thefirst SSC at 09:47 UT; then it reinforces drastically follow-ing the second SSC at 14:10 UT. The TEC increase gainsmore than 30% and persists until the early morning hours(∼01 UT) of 4 April. TEC observations confirm the qual-itative behaviour of the F-layer measurements (Figs. 6 and7), though the relative density changes are less distinctive(up to about 65% increase in plasma density at the F2-layerpeak) and the variations are smoother. It is worth notingthat a signature of a plasmaspheric mass density increase(∼20%, as deduced by the∼10% decrease off R) at thebeginning of the main phase is revealed by the FLR obser-vations (Fig. 5). So, the initial positive storm phenomenaappear to have a more intense effect at ionospheric heights.Simultaneous density enhancement in the ionosphere and theplasmasphere (2.5<L<4) have been recently found by Chi et
Ann. Geophys., 24, 1455–1468, 2006 www.ann-geophys.net/24/1455/2006/
U. Villante et al.: ULF measurements during the first CAWSES campaign 1465
al. (2005) during the main phase of the famous geomagneticstorm of 29–30 October 2003. FLR observations by Takasakiet al. (2004) and Vellante et al. (2005) also reported for thesame storm a plasmaspheric density increase at lower lati-tudes (1.4<L<1.8). Chi et al. (2005) attributed the densityincrease to the penetration in the low-latitude ionosphere ofthe duskward interplanetary electric field, which resulted inan uplifting of the F layer via theE×B drift. In turn, thisleads to an overall increase in the ionization density becauseof a reduced loss rate (Prolss, 1995; Tsurutani et al., 2004).A similar effect might be responsible for the present obser-vations.
During the subsequent negative storm phase (from∼00:00 UT of 4 April until ∼11:00 UT of 5 April, seeFigs. 6, 7 and 8), we observe a density decrease both in theionosphere and the plasmaphere, with a maximum depletionof about 50% in both regions. As previously mentioned, thenegative storm phase at F2-layer heights is thought to arisemainly from the decrease in the [O]/[N2] ratio, which re-sults in a strong ion loss rate enhancement. This composi-tion disturbance zone propagates equatorward from the au-roral region with the disturbance meridional neutral wind ofthe storm. Depending on the season it can propagate more orless far, and often a steep gradient in the meridional directionis formed (Skoblin and Forster, 1995; Zuzic et al., 1997).
On the other hand, penetration electric fields during stormonset and drifts due to the disturbance dynamo (Blancand Richmond, 1980) also contribute to the well-knownplasmapause displacement during the storm (Carpenter andLemaire, 1997), as well as to the decrease of plasma densityin the outer region within the re-filling plasmasphere. Thedisturbance dynamo effect is known to persist for many hoursdue to the neutral air inertia. Unfortunately, direct measure-ments of the electric drift are not available for this interval atmid- to low-latitudes in this longitudinal sector; however, thedisturbance dynamo presumably declines during the secondstorm day because no further magnetospheric forcing is ap-plied. Therefore, the refilling of the plasmaspheric flux tubesby field-aligned plasma fluxes from the daytime ionosphereregains control. On the other hand, the enhanced ion lossrates in the ionosphere (which caused the density depletionat ionospheric level inside the composition disturbance zone)also leads to a reduced upward ion flux from the ionosphereto the plasmasphere with respect to normal conditions. Therefilling process depends linearly on the amount of the av-erage upward ion flux rates and is proportional toL4 due tothe rapidly increasing flux tube volume. The reduced fluxesretard the full refilling of the flux tubes, whose characteristictime is of the order of one to a few days at theseL-shells(Krinberg and Tashchilin, 1982).
Lastly, a positive disturbance phase re-establishes at∼11:00 UT on 5 April, probably due to the advent of anew magnetospheric disturbance, consistent with the newly-decliningDst values (Fig. 5).
8 Conclusions
The first CAWSES campaign has been an effort to operate ina coordinate scheme in the framework of the solar-terrestrialresearch. Indeed, the joint acquisition and use of data fromtwo or more different instrumentations is not only useful inthe whole research field but also represents an added valueto the individual data. In this paper we describe the resultsobtained from the analysis of ULF geomagnetic field vari-ations and ionospheric measurements at low latitude duringthe campaign, and, in particular, in correspondence to thegeomagnetic storm associated with the Earth’s arrival of acoronal mass ejection. The principal results of the presentinvestigation can be summarized as follows:
– The whole period is characterized by a moderate Pc3wave activity during morning hours; its correspondencewith small cone angles is clearly indicative of a pen-etration of upstream wave turbulence generated in theforeshock region. The strong morning/afternoon asym-metry in the Pc3 wave activity does not seem to be re-lated to the IMF orientation in the ecliptic plane, con-firming a previous analysis conducted at geosyncronousorbit by Takahashi et al. (1981). Our results indicatethat the mechanisms of upstream wave penetration inthe magnetosphere still deserve further investigation bythe analysis of a larger number of case studies using az-imuthally extended ground magnetometer arrays to sep-arate LT and UT dependences.
– The complex SI waveforms are indicative of a signifi-cant contribution of the high-latitude ionospheric cur-rents on low-latitude ground measurements. It rein-forces the conclusions drawn by Kikuchi and Araki(1985), Tsunomura (1998), Villante et al. (2005a), whoshowed that at similar latitudes the SI manifestationcannot be interpreted in terms of the magnetopause cur-rent alone.
– After the SI occurrence, the power spectra of theH
component reveal clear evidence for spectral enhance-ments matching the magnetospheric cavity/waveguidemode eigenfrequencies. It is interesting to underlinein this sense that, as for the present case, most of theevents presented in the scientific literature (e.g. Kepkoand Spence, 2003; Villante et al., 2005b) typically oc-curred after the impact of SW shock waves on the mag-netopause. This leads one to speculate that, in general,perturbed magnetospheric conditions might be impor-tant for the onset of global oscillations of the Earth’smagnetosphere. Moreover, the results of the present in-vestigation seem to confirm that some “selected” fre-quency modes might be an inherent property of the SW(Kepko and Spence, 2003), and also suggest noncom-pressive Alfvenic SW fluctuations as direct drivers of
www.ann-geophys.net/24/1455/2006/ Ann. Geophys., 24, 1455–1468, 2006
1466 U. Villante et al.: ULF measurements during the first CAWSES campaign
long period geomagnetic field pulsations at “selected”frequencies.
– The FLR remote sensing technique revealed a signifi-cant reduction (by a factor of 1.6–2) in the plasmaspheredensity atL = 1.7–1.8 during the recovery phase of thegeomagnetic storm. This decrease is also accompaniedby a significant negative ionospheric storm phase and isconfirmed by vertical TEC measurements. It confirmssimilar observations obtained by completely differenttechniques (Degenhardt et al., 1977). The typical lackof FLR signatures during nighttime did not allow oneto monitor the plasmasphere density by this techniqueduring all phases of the geomagnetic storm. A larger,longitudinally extended, network would be necessary toobtain a more complete picture of the plasmaspheric dy-namics taking place during such events. On the otherhand, each storm event has its own individual manifes-tation because of the complex nonlinear interactions ofthe contributing processes and the large variety of theinitial and boundary conditions. An appropriate inter-play between global-scale modelling studies (such asthose dealing with the composition changes (Namgal-adze et al., 2000) or with the interaction of disturbancedynamo electric fields (Maruyama et al., 2005)) andcoordinated measurements, such as this first CAWSESSpace Weather campaign, is important for the under-standing of the complex storm events.
Acknowledgements.The authors thank N. F. Ness for the ACEMFI data and D. J. McComas for the ACE SWE data. We grate-fully acknowledge the TEC data supply by and discussions withN. Jakowski from DLR Neustrelitz.
Topical Editor M. Pinnock thanks two referees for their help inevaluating this paper.
References
Araki, T.: A physical model of the geomagnetic sudden commence-ment, in: Solar Wind Sources of Magnetospheric Ultra-Low-Frequency Waves, edited by: Engebretson, M. J., Takahashi, K.,and Scoler, M., Geophys. Mon. vol. 81, AGU, Washington D.C.,183–200, 1994.
Berube, D., Moldwin, M. B., Fung, S. F., and Green, J. L.:A plasmaspheric mass density model and constraints on itsheavy ion concentration, J. Geophys. Res., 110, A04212,doi:10.1029/2004JA010684, 2005.
Blanc, M. and Richmond, A. D.: The ionospheric disturbance dy-namo, J. Geophys. Res., 85, 1669–1686, 1980.
Buonsanto, M. J.: Ionospheric Storms-a review, Space Sci. Rev.,88, 563–601, 1999.
Carpenter, D. L. and Park, C. G.: On what ionosphere workersshould know about the plasmapause-plasmasphere, Rev. Geo-phys. Space Phys., 11, 133–154, 1973.
Carpenter, D. L. and Lemaire, J.: Erosion and recovery of the plas-masphere in the plasmapause region, Space Sci. Rev., 80, 153–179, 1997.
Chi, P. J., Russell, C. T., Musman, S., Peterson, W. K., Le, G.,Angelopoulos, V., Reeves, G. D., Moldwin, M. B., and Chun,F. K.: Plasmaspheric depletion and refilling associated with theSeptember 25, 1998 magnetic storm observed by ground magne-tometers at L=2, Geophys. Res. Lett., 27, 633–636, 2000.
Chi, P. J., Russell, C. T., Foster, J. C., Moldwin, M. B., Engebretson,M. J., and Mann, I. R.: Density enhancement in plasmasphere-ionosphere plasma during the 2003 Halloween Superstorm: Ob-servations along the 330th magnetic meridian in North America,Geophys. Res. Lett., 32, L03S07, doi:10.1029/2004GL021722,2005.
Clilverd, M. A., Menk, F. W., Milinevski, G., et al.: Insitu and ground-based intercalibration measurements of plasmadensity at L = 2.5, J. Geophys. Res., 108(A10), 1365,doi:10.1029/2003JA009866, 2003.
Degenhardt, W., Hartmann, G. K., and Leitinger, R.: Effects of amagnetic storm on the plasmaspheric electron content, J. Atmos.Terr. Phys., 39, 1435–1440, 1977.
Forster, M. and Jakowski, N.: Geomagnetic storm effects on thetopside ionosphere and plasmasphere: A compact tutorial andnew results, Surveys in Geophys., 21, 47–87, 2000.
Francia, P. and Villante, U.: Some evidence of ground power en-hancements at frequencies of global magnetospheric modes atlow latitude, Ann. Geophys., 15, 17–23, 1997.
Francia, P., Lepidi, S., Villante, U., Di Giuseppe, P., and Lazarus,A. J.: Geomagnetic response at low latitude to continuous solarwind pressure variations during northward interplanetary mag-netic field, J. Geophys. Res., 104, 19 923–19 930, 1999.
Greenstadt, E. W.: Field-determined oscillations in the magne-tosheath as possible source of medium-period, daytime mi-cropulsations, in: Proceedings of the Conference on solar Terres-trial Relations, edited by: Venkatesan, D., University of Calgary,Calgary, Alta, 515, 1973.
Greenstadt, E. W. and Olson, J. V.: Geomagnetic pulsation signalsand hourly distributions of IMF orientation, J. Geophys. Res., 84,1493–1498, 1979.
Heise, S., Jakowski, N., Wehrenpfennig, A., Reigber, C., and Luhr,H.: Sounding of the topside ionosphere/plasmasphere based onGPS measurements from CHAMP: Initial results, Geophys. Res.Lett., 29(14), doi:10.1029/2002GL014738, 2002.
Jakowski, N.: TEC monitoring by using satellite positioning sys-tems, in: Modern Ionospheric Science, edited by: Kohl, H.,Ruster, R., and Schlegel, K., European Geophysical Society,Katlenburg-Lindau, ProduServ GmbH Verlagsservice, Berlin,371–390, 1996.
Jakowski, N., Wehrenpfennig, A., Heise, S., Reigber, C., Luhr, H.,Grunwaldt, L., and Meehan, T.K.: GPS radio occultation mea-surements of the ionosphere from CHAMP: Early results, Geo-phys. Res. Lett., 29(10), doi:10.1029/2001GL014364, 2002.
Kepko, L. and Spence, H.E.: Observations of discrete,global magnetospheric oscillations directly driven by solarwind density variations, J. Geophys. Res., 108 (A6), 1257,doi:10.1029/2002JA009676, 2003.
Kepko, L., Spence, H. E., and Singer, H. J.: ULF waves in the solarwind as direct drivers of magnetospheric pulsations, Geophys.Res. Lett., 29 (8), 1197, doi:10.1029/2001GL014405, 2002.
Kessel, R. L., Mann, I. R., Fung, S. F., Milling, D. K., andO’Connell, N.: Correlation of Pc5 wave power inside and out-side themagnetosphere during high speed streams, Ann. Geo-
Ann. Geophys., 24, 1455–1468, 2006 www.ann-geophys.net/24/1455/2006/
U. Villante et al.: ULF measurements during the first CAWSES campaign 1467
phys., 22, 629–641, 2004.Kikuchi, T. and Araki, T.: Preliminary positive impulse of geomag-
netic sudden commencement observed at dayside middle and lowlatitudes, J. Geophys. Res., 90, 12 195–12 200, 1985.
Kivelson, M. and Southwood, D.: Resonant ULF waves: a newinterpretation, Geophys. Res. Lett., 12, 49–52, 1985.
Kivelson, M. and Southwood, D.: Coupling of global magneto-spheric MHD eigenmodes to field line resonances, J. Geophys.Res., 91, 4345–4351, 1986.
Krinberg, I. A. and Tashchilin, A. V.: Refilling of geomagnetic forcetube with a thermal plasma after magnetic disturbances, Ann.Geophys., 38, 25–32, 1982.
Lepidi, S., Francia, P., Villante, U., Meloni, A., Lazarus, A. J., andLepping, R. P.: The Earth’s passage of the 11 April 1997 coronalejecta: geomagnetic field fluctuations at high and low latitudeduring northward interplanetary magnetic field conditions, Ann.Geophys., 17, 1245–1250, 1999.
Maruyama, N., Richmond, A. D., Fuller-Rowell, T. J., Codrescu,M. V., Sazykin, S., Toffoletto, F. R., Spiro, R. W., and Millward,G. H.: Interaction between direct penetration and disturbancedynamo electric fields in the storm-time equatorial ionosphere,Geophys. Res. Lett., 32, L17105, doi:10.1029/2005GL023763,2005.
Mathie, R. A., Mann, I. R., Menk, F. W., and Orr, D.: Pc5 ULFpulsations associated with waveguide modes observed with theIMAGE magnetometer array, J. Geophys. Res., 104, 7025–7036,1999.
Matsushita, S.: A Study of the Morphology of Ionospheric Storms,J. Geophys. Res., 64, 305–321, 1959.
Menk, F. W., Orr, D., Clilverd, M. A., Smith, A. J., Waters, C. L.,Milling, D. K., and Fraser, B. J.: Monitoring spatial and temporalvariations in the dayside plasmasphere using geomagnetic fieldline resonances, J. Geophys. Res., 104, 19 955–19 969, 1999.
Namgaladze, A. A., Forster, M., and Yurik, R. Y.: Analysis of thepositive ionospheric response to a moderate geomagnetic stormusing a global numerical model, Ann. Geophys., 18, 461–477,2000.
Olson, J. V: Pi2 pulsations and substorm onsets: a review, J. Geo-phys. Res., 104, 17 499–17 520, 1999.
Orr, D. and Matthew, J. A. D.: The variation of geomagnetic mi-cropulsation periods with latitude and the plasmapause, Planet.Space Sci., 19, 897–905, 1971.
Pezzopane, M.: Interpre: a Windows software for semiautomaticscaling of ionospheric parameters from ionograms, Computers& Geosciences, 30, 125–130, 2004.
Posch, L. J., Engebretson, M. J., Pilipenko, V. A., Hughes, W. J.,Russell, C. T., and Lanzerotti, L. J.: Characteristics of long-period ULF response to magnetic storms, J. Geophys. Res., 108(A1), 1029, doi:101029/2002JA009386, 2003.
Prolss, G. W.: Ionospheric F-region storms, in: Handbook of At-mospheric Electrodynamics, Vol. 2, edited by: Volland, H., CRCPress, Boca Raton, 195–248, 1995.
Radoski, H. R.: A theory of latitude dependent geomagneticmicropulsations: the asymptotic fields, J. Geophys. Res., 79,595–603, 1974.
Reinisch, B. W.: Modern Ionosondes, in: Modern Ionospheric Sci-ence, edited by: Kohl, H., Ruster, R., and Schlegel, K., Euro-pean Geophysical Society, Katlenburg-Lindau, Germany, 440–458, 1996.
Reinisch, B. W. and Huang, X.: Automatic calculation of electrondensity profiles from digital ionograms, 3. Processing of bottom-side ionograms, Radio Science, 18, 477–492, 1983.
Rishbeth, H.: How the thermospheric circulation affects the iono-spheric F2-layer, J. Atmos. Solar-Terr. Phys., 60, 1385–1402,1998.
Russell, C. T., Luhmann, J. G., Odera, T. J., and Stuart, W. F.: Therate of occurrence of dayside Pc3,4 pulsations: the L-value de-pendence of the IMF cone angle effect, Geophys. Res. Lett., 10,663–666, 1983.
Samson, J. C., Greenwald, R. A., Ruohoniemi, J. M., Hughes, T.J., and Wallis, D. D.: Magnetometer and radar observations ofMHD cavity modes in the Earth’s magnetosphere, Can. J. Phys.,69, 929–937, 1991.
Samson, J. C., Harrold, B. G., Ruohoniemi, J. M., Greenwald, R.A., and Walker, A. D. M.: Field line resonances associated withMHD waveguides in the magnetosphere, Geophys. Res. Lett.,19, 441–444, 1992.
Schulz, M.: Eigenfrequencies of geomagnetic field lines and im-plications for plasma-density modeling, J. Geophys. Res., 101,17 385–17 397, 1996.
Shimazu, H., Araki, T., Kamei, T., and Hanado, H.: A symmetricappearence of Pc5 on dawn and dusk side associated with solarwind dynamic pressure enhancement, J. Geomag. Geoelect., 47,177–189, 1995.
Skoblin, M. G. and Forster, M.: Steep latitudinal gradients of ther-mospheric composition during magnetic storms: A possible for-mation mechanism, Ann. Geophys., 13, 277–284, 1995.
Sutcliffe, P. R., Hattingh, S. K. F., and Boshoff, H. F. V.: Longitu-dinal effects on the eigenfrequencies of low-latitude Pc 3 pulsa-tions, J. Geophys. Res., 92, 2535–2543, 1987.
Takahashi, K., McPherron, R. L., Greenstadt, E. W., and Neeley,C. A.: Factors controlling the occurrence of Pc3 magnetic pul-sations at synchronous orbit, J. Geophys. Res., 86, 5472–5484,1981.
Takasaki, S., Kawano, H., Tanaka, Y., Yoshikawa, A., Seto, M., Iiz-ima, M., and Yumoto, K.: Density perturbations in the inner plas-masphere during huge magnetic storms in October–November2003: Ground-based observations, Eos Trans. AGU, 85(17), Jt.Assem. Suppl., Abstract SH53A-11, 2004.
Troitskaya, V. A. and Bolshakova, O. V.: Diagnostics of the mag-netosphere using multipoint measurements of ULF-waves, Adv.Space Res., 8, 413–425, 1988.
Tsunomura, S.: Characteristics of geomagnetic sudden commence-ment observed in middle and low latitudes, Earth Planets andSpace, 50, 755–772, 1998.
Tsurutani, B., Mannucci, A., Iijima, B., et al.: Global day-side ionospheric uplift and enhancement associated with in-terplanetary electric fields, J. Geophys. Res., 109, A08302,doi:10.1029/2003JA010342, 2004.
Vellante, M., De Lauretis, M., Villante, U., Adorante, N., Pi-ancatelli, A., Schwingenschuh, K., Magnes, W., Koren, W.,and Zhang, T. L.: A new meridional array in middle-southeurope for monitoring dynamic processes in the coupled sys-tem plasmasphere-ionosphere, in: SOLSPA 2001: Proceedingsof the Second Solar Cycle and Space Weather Euroconference,ESA Spec. Publ. 477, edited by: Sawaya-Lacoste, H., Eur. SpaceAgency, Noordwijk, Netherlands, 487–490, 2002.
Vellante, M., Forster, M., Zhang, T. L., Villante, U., De Lauretis,
www.ann-geophys.net/24/1455/2006/ Ann. Geophys., 24, 1455–1468, 2006
1468 U. Villante et al.: ULF measurements during the first CAWSES campaign
M., and Magnes, W.: Remote sensing of the plasmasphere massdensity during geomagnetic storms by ULF waves recorded atlow latitudes (1.6<L<1.9), paper presented at the Xth IAGA Sci-entific Assembly, Toulouse, 18–29 July, 2005.
Villante, U. and Di Giuseppe, P.: Some aspects of the geomagneticresponse to solar wind pressure variations: a case study at lowand middle latitudes, Ann. Geophys., 22, 2053–2066, 2004.
Villante, U., Francia, P., Lepidi, S., De Lauretis, M., Pietropaolo,E., Cafarella, L., Meloni, A., Lazarus, A. J., Lepping, R. P., andMariani, F.: Geomagnetic field variations at low and high latitudeduring the January 10–11, 1997 magnetic cloud, Geophys. Res.Lett., 25, 2593–2596, 1998.
Villante, U., Francia, P., and Lepidi, S.: Pc5 geomagnetic field fluc-tuations at discrete frequencies at a low latitude station, Ann.Geophys., 19, 321–325, 2001.
Villante, U., Lepidi, S., Francia, P., and Bruno, T.: Some aspects ofthe interaction of interplanetary shocks with the Earth’s magne-tosphere: an estimate of the propagation time through the mag-netosheath, J. Atm. Solar-Terr. Phys., 66, 337–341, 2004.
Villante, U., Piersanti, M., Di Giuseppe, P., Vellante, M., Zhang, T.L., and Magnes, W.: Sudden commencement event of 17 April2002: Aspects of the geomagnetic response at low latitudes,J. Geophys. Res., 110, A12S23, doi:10.1029/2004JA010978,2005a.
Villante, U., Nubile, A., Di Giuseppe, P., Francia, P., and Vellante,M.: ULF oscillations at discrete frequencies: a comparison be-tween ground, magnetospheric and interplanetary measurements,Proceedings of the Solar Variability and Earth Climate Confer-ence (27 June–1th July, 2005, Monte Porzio Catone, Rome),Mem. SAIt., 76, 1060–1063, 2005b.
Walker, A. D. M., Ruohoniemi, J. M., Baker, K. B., Greenwald, R.A., and Samson, J. C.: Spatial and temporal behavior of ULFpulsations observed by Goose Bay HF radar, J. Geophys. Res.,97, 12 187–12 202, 1992.
Waters, C. L., Menk, F. W., and Fraser, B. J.: The resonance struc-ture of low latitude Pc3 geomagnetic pulsations, Geophys. Res.Lett., 18, 2293–2296, 1991.
Yumoto, K.: Generation and propagation mechanisms of low-latitude magnetic pulsations – a review, J. Geophys., 60, 79–105,1986.
Ziesolleck, C. W. S. and Chamalaun, F. H.: A two-dimensional ar-ray study of low-latitude Pc5 geomagnetic pulsations, J. Geo-phys. Res., 98, 13 703–13 713, 1993.
Ziesolleck, C. W. S. and McDiarmid, D. R.: Statistical survey ofauroral latitude Pc5 spectral and polarization characteristics, J.Geophys. Res., 100, 19 299–19 312, 1995.
Zolesi, B., Belehaki, A., and De Franceschi, G.: On the potential ap-plicability of the Simplified Ionospheric Regional Model to dif-ferent midlatitude areas, Radio Science, 31(3), 547–552, 1996.
Zuzic, M., Scherliess, L., and Prolss, G. W.: Latitudinal structureof thermospheric composition perturbations, J. Atmos. Sol. Terr.Phys., 59, 711–724, 1997.
Ann. Geophys., 24, 1455–1468, 2006 www.ann-geophys.net/24/1455/2006/
Related Documents