UK WIR The UK Experience Christopher Royce Anglian Water Services

UK WIR The UK Experience Christopher Royce Anglian Water Services.
Dec 18, 2015
Welcome message from author
This document is posted to help you gain knowledge. Please leave a comment to let me know what you think about it! Share it to your friends and learn new things together.
Transcript

UK WIR
The UK Experience
Christopher Royce
Anglian Water Services

UK WIR
Agenda
UK developmentUK Regulation Common framework Lessons learned Data Performance Investment Risk
Development areasConcluding remarks

UK WIR
Development
• The move of utilities to a three ball model• Owner• Asset manager • Service provider
● International models● Best practice from other large asset owners

UK WIR
Regulatory process
• Periodic review every five years• Prices for 2005 –10 just completed
• Cost base submission• Draft business plans • Final business plans – April 2004• Draft determination – August 2004• Company representations • Final determination – December 2004
• Effective date – 1 April 2005

UK WIR
Regulatory process
Requires companies to state:• Costs and timescales for new obligations• What customers require
• What service enhancements companies propose• Efficiencies• Future spend to cater for growth• Future spend projections for maintenance• Impact on customers bills
Asset Management Plan (AMP4)

UK WIR
Asset management
● Quality obligations• Water• Wastewater
● Growth● Service enhancements● Maintenance – serviceability to customers
Maintenance is the focus of this presentation

UK WIR
The UK Regulation model
Drinking Water Inspectorate
Maintenance of assets
Environment Agency
Government & other groups
Customers
NEEDS
What do we need to do?
How fast do we need to do it?
How much should it cost?
OFWAT REVIEW(Every five years but 20
year horizon)
STRATEGIC BUSINESS PLAN
5 year contract with specific outputs
Annual reporting of progress and outputs
Health Authorities
ECONOMETRIC MODEL
UK WIR
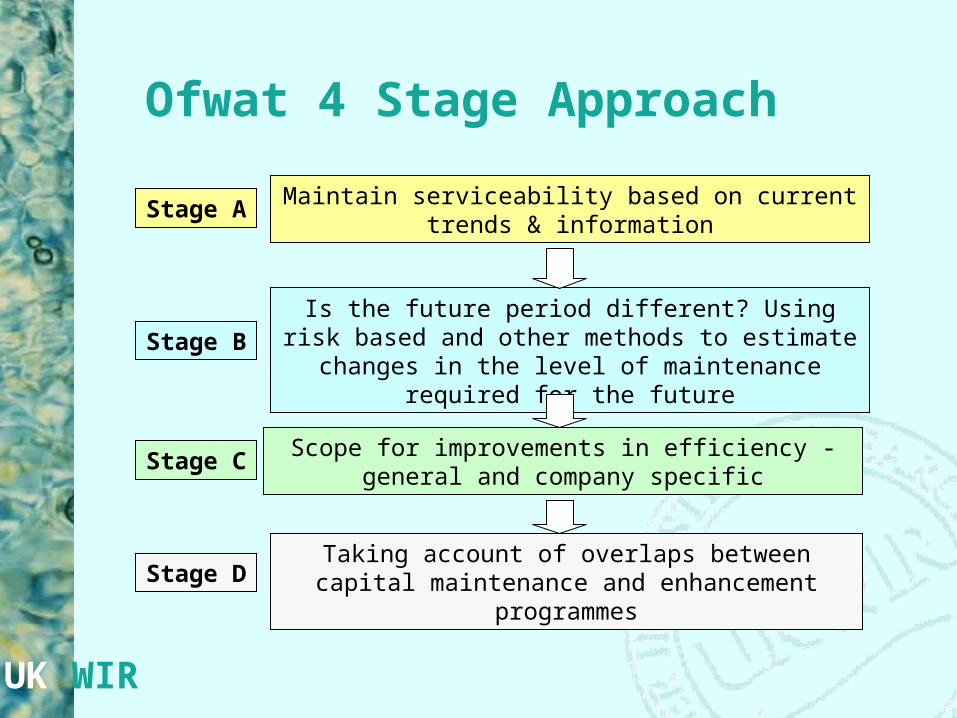
Ofwat 4 Stage Approach
Maintain serviceability based on current trends & information
Is the future period different? Using risk based and other methods to estimate changes in the level of
maintenance required for the future
Scope for improvements in efficiency - general and company specific
Taking account of overlaps between capital maintenance and enhancement programmes
Stage A
Stage B
Stage C
Stage D

UK WIR
Future spend projections
0.0
0.5
1.0
1.5
2.0
2.5
81 83 85 87 89 91 93 95 97 99 01 03 05 07 09 11 13 15 17 19
Financial year ending 31 March
£ b
illio
n
Our projected capital maintenance
Companies' capitalmaintenance projections
Actual capital maintenance and companies'estimate for 2004-05
0.0
0.5
1.0
1.5
2.0
2.5
81 83 85 87 89 91 93 95 97 99 01 03 05 07 09 11 13 15 17 19
Financial year ending 31 March
£ b
illio
n
Our projected capital maintenance
Companies' capitalmaintenance projections
Actual capital maintenance and companies'estimate for 2004-05
Developed through a common framework

UK WIR
Why a common framework
MD161 2000 (Maintaining serviceability to customers)‘Each company needs to demonstrate how the flow of services to customers can be maintained at least cost terms of both capital and operating expenditure, recognizing the trade off between cost and risk, whilst ensuring compliance with statutory duties’
Competition Commission Referral‘Given the importance of the issue, we are disappointed that the Director and the industry have not co-operated to develop an agreed methodology for assessing both serviceability to customer and asset condition’
Capital Maintenance PlanningA common framework
UKWIR Report Ref. No 02/RG/05/3

UK WIR
CM ImplementationCapital maintenance is defined as the renewal or
refurbishment of capital assets in order to provide continuing service to customers and the environment
consistent with current regulatory obligations.
Stage A Historical AnalysisIdentify the historical levels of maintenance expenditure and serviceability indicator trends
Stage BIdentify future maintenance expenditure to meet regulatory objectives
Stage CCompare and explain results of historical and forward-looking analyses; make the case for the required level of future maintenance
Main focus for improvement in the development of the Common Framework

UK WIR
Process
Focus the analysis
Select the planning objective
Design & initiate customersurveys (optional)
Identify failure modes
Obtain asset observations
Validate estimation methods
cost of failure
Develop estimation methods for:
probability of failure
consequences of failure
Forecast service
Identify intervention options
Estimate impact of interventions
Value service changes(optional)
Estimate intervention costs
Select optimal interventions
Monitor service and failures
Preparation
Service and costforecasting
Interventionanalysis
Forward-looking
Analysis
Collate and categorise costsConclusions
Compare & explain
Assess scope forfurther efficiencies
Present the case
A
Historical & current values
Expenditurereview
Service & assetperformance
review
HistoricalAnalysis
Identify typical expenditure
Select indicators
Reveal underlying trends
Identify historical expenditure
Draw conclusions
Identify asset categories
B
C
Historical Analysis
Forward-looking Analysis
Conclusions

UK WIR
Ofwat assessmentIndustry totals from 2005-06 to 2009-10 Five-year total
£M Companies’ business plan projections 9,447
Five years of average expenditure over the period 1992-93 to 2001-02
7,401
Sta
ge A
Stage A – Ofwat assessment of expenditure required to maintain stable serviceability in 2000-01 to 2004-05
7,463
Aggregate % uplift assessed as necessary to maintain stable serviceability in 2005-06 to 2009-10
19%
Sta
ge B
Stage B – Ofwat assessment of expenditure requirements to maintain stable serviceability in 2005-06 to 2009-10
8,894

UK WIR
Models and tools
Historical Performance Models
Predictive Performance Models
Option Models
Cost Models
Financial Models
Investment Prioritisation Model
Asset Groups
Risk Models
Asset Data & Information
Policy Performance Investment Data
Historical Performance Models
Predictive Performance Models
Option Models
Cost Models
Financial Models
Investment Prioritisation Model
Asset Groups
Risk Models
Asset Data & Information
Policy Performance Investment Data

UK WIR
Application
To apply the common framework you need to understand:
Asset deterioration rates Likely changes in asset performance, and resulting
impact on service The costs of replacing assets, compared with the costs
of maintaining deteriorating assets
This all needs to be supported by robust data and information
UK WIR
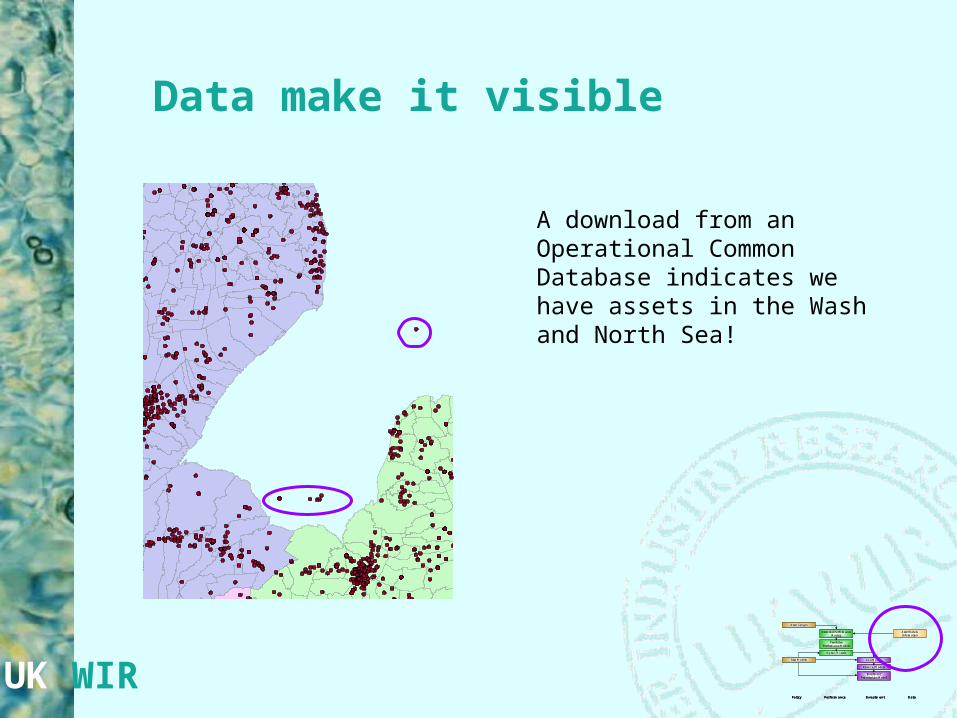
Data make it visible
A download from an Operational Common Database indicates we have assets in the Wash and North Sea!
Historical Performance Models
Predictive Performance Models
Option Models
Cost Models
Financial Models
Investment Prioritisation Model
Asset Groups
Risk Models
Asset Data & Information
Policy Performance Investment Data
Historical Performance Models
Predictive Performance Models
Option Models
Cost Models
Financial Models
Investment Prioritisation Model
Asset Groups
Risk Models
Asset Data & Information
Policy Performance Investment Data

UK WIR
Historical Performance Models
Predictive Performance Models
Option Models
Cost Models
Financial Models
Investment Prioritisation Model
Asset Groups
Risk Models
Asset Data & Information
Policy Performance Investment Data
Historical Performance Models
Predictive Performance Models
Option Models
Cost Models
Financial Models
Investment Prioritisation Model
Asset Groups
Risk Models
Asset Data & Information
Policy Performance Investment Data
Top down

UK WIR
Historical Performance Models
Predictive Performance Models
Option Models
Cost Models
Financial Models
Investment Prioritisation Model
Asset Groups
Risk Models
Asset Data & Information
Policy Performance Investment Data
Historical Performance Models
Predictive Performance Models
Option Models
Cost Models
Financial Models
Investment Prioritisation Model
Asset Groups
Risk Models
Asset Data & Information
Policy Performance Investment Data
Top down measures
UK WIR
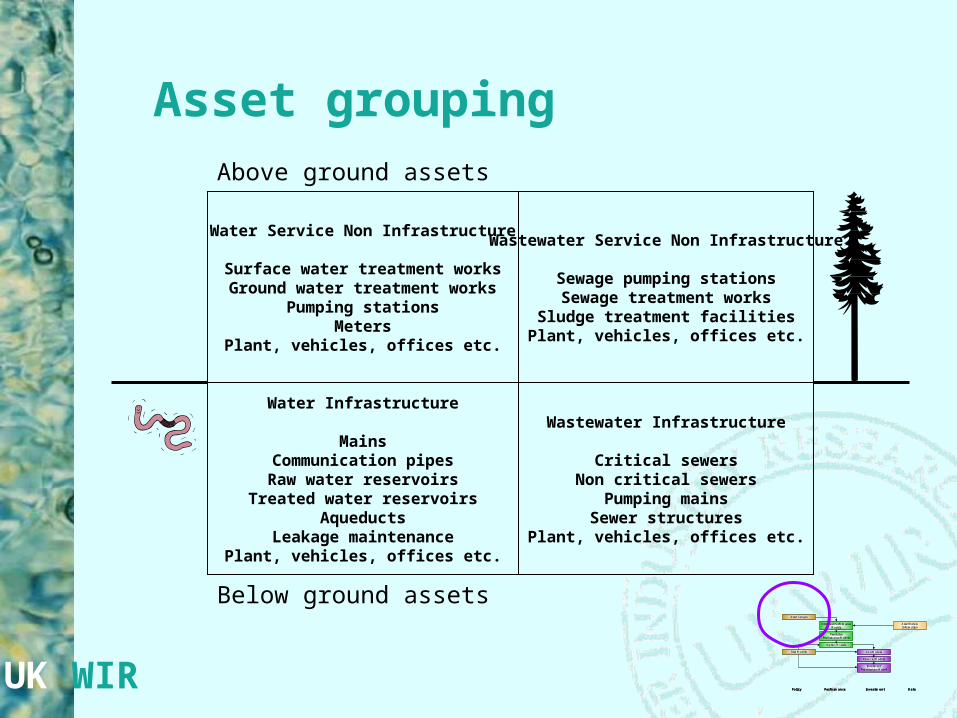
Asset grouping
Water Service Non Infrastructure
Surface water treatment worksGround water treatment works
Pumping stationsMeters
Plant, vehicles, offices etc.
Wastewater Service Non Infrastructure
Sewage pumping stationsSewage treatment works
Sludge treatment facilitiesPlant, vehicles, offices etc.
Wastewater Infrastructure
Critical sewersNon critical sewers
Pumping mainsSewer structures
Plant, vehicles, offices etc.
Water Infrastructure
MainsCommunication pipesRaw water reservoirs
Treated water reservoirsAqueducts
Leakage maintenancePlant, vehicles, offices etc.
Below ground assets
Above ground assets
Historical Performance Models
Predictive Performance Models
Option Models
Cost Models
Financial Models
Investment Prioritisation Model
Asset Groups
Risk Models
Asset Data & Information
Policy Performance Investment Data
Historical Performance Models
Predictive Performance Models
Option Models
Cost Models
Financial Models
Investment Prioritisation Model
Asset Groups
Risk Models
Asset Data & Information
Policy Performance Investment Data
UK WIR
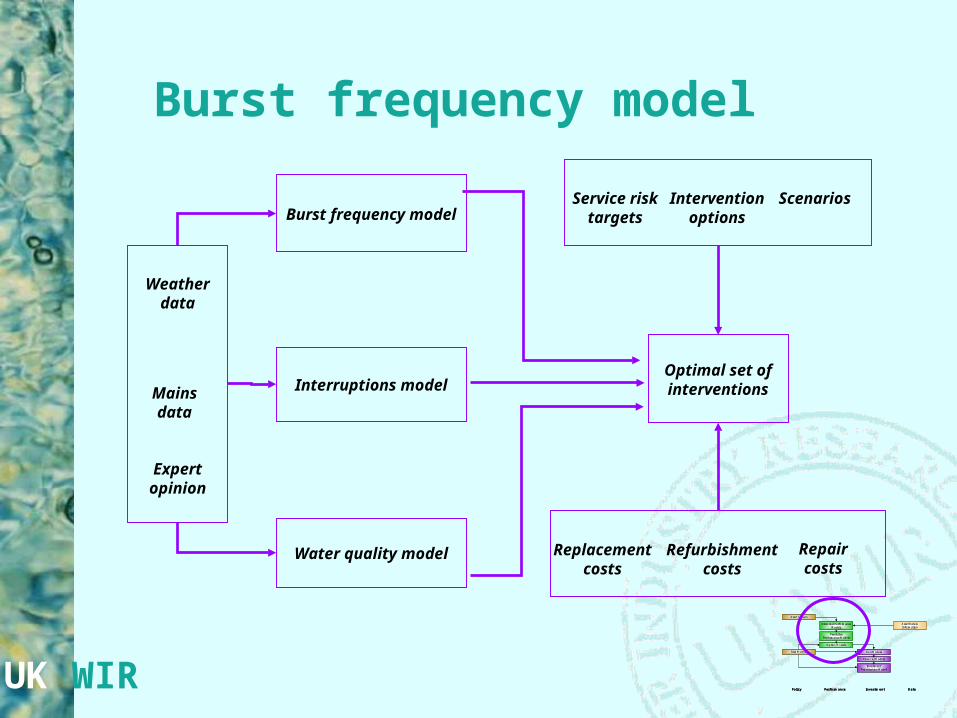
Burst frequency model
Burst frequency model
Interruptions model
Water quality model
Optimal set of interventionsMains
data
Weather data
Expert opinion
Service risk targets
Intervention options
Scenarios
Replacement costs
Repair costs
Refurbishment costs
Historical Performance Models
Predictive Performance Models
Option Models
Cost Models
Financial Models
Investment Prioritisation Model
Asset Groups
Risk Models
Asset Data & Information
Policy Performance Investment Data
Historical Performance Models
Predictive Performance Models
Option Models
Cost Models
Financial Models
Investment Prioritisation Model
Asset Groups
Risk Models
Asset Data & Information
Policy Performance Investment Data

UK WIR
Bursts predictions
Bursts Predicted
0
50
100
150
200
250
300
350
400
450
19
86
198
7
19
88
19
89
199
0
199
1
19
92
199
3
199
4
19
95
199
6
199
7
19
98
19
99
200
0
20
01
20
02
200
3
20
04
20
05
200
6
20
07
20
08
200
9
20
10
20
11
201
2
20
13
20
14
201
5
20
16
20
17
201
8
20
19
20
20
Year
To
tal
Bu
rsts
Actual Future - Average Weather Data
Past Predicted Future - Same W eather As Past
Future - Average Rolling W eather
Historical Performance Models
Predictive Performance Models
Option Models
Cost Models
Financial Models
Investment Prioritisation Model
Asset Groups
Risk Models
Asset Data & Information
Policy Performance Investment Data
Historical Performance Models
Predictive Performance Models
Option Models
Cost Models
Financial Models
Investment Prioritisation Model
Asset Groups
Risk Models
Asset Data & Information
Policy Performance Investment Data

UK WIR
Non infrastructuremethodology is based on Failure Mode Effects & Criticality Analysis (FMECA), incorporating reliability theoryidentify generic asset groups, i.e. similar processes and consequencesidentify principal failure modesfor each failure mode:
estimate probabilities of failure (failure rates)estimate service consequences of failure & impact probabilitiesestimate cost consequences of failure
identify intervention optionsreplace or refurbish and/or operational changes
assess costs and benefits of interventionsselect optimal interventions
Historical Performance Models
Predictive Performance Models
Option Models
Cost Models
Financial Models
Investment Prioritisation Model
Asset Groups
Risk Models
Asset Data & Information
Policy Performance Investment Data
Historical Performance Models
Predictive Performance Models
Option Models
Cost Models
Financial Models
Investment Prioritisation Model
Asset Groups
Risk Models
Asset Data & Information
Policy Performance Investment Data

UK WIR
Consequences of failure
Historical Performance Models
Predictive Performance Models
Option Models
Cost Models
Financial Models
Investment Prioritisation Model
Asset Groups
Risk Models
Asset Data & Information
Policy Performance Investment Data
Historical Performance Models
Predictive Performance Models
Option Models
Cost Models
Financial Models
Investment Prioritisation Model
Asset Groups
Risk Models
Asset Data & Information
Policy Performance Investment Data
UK WIR
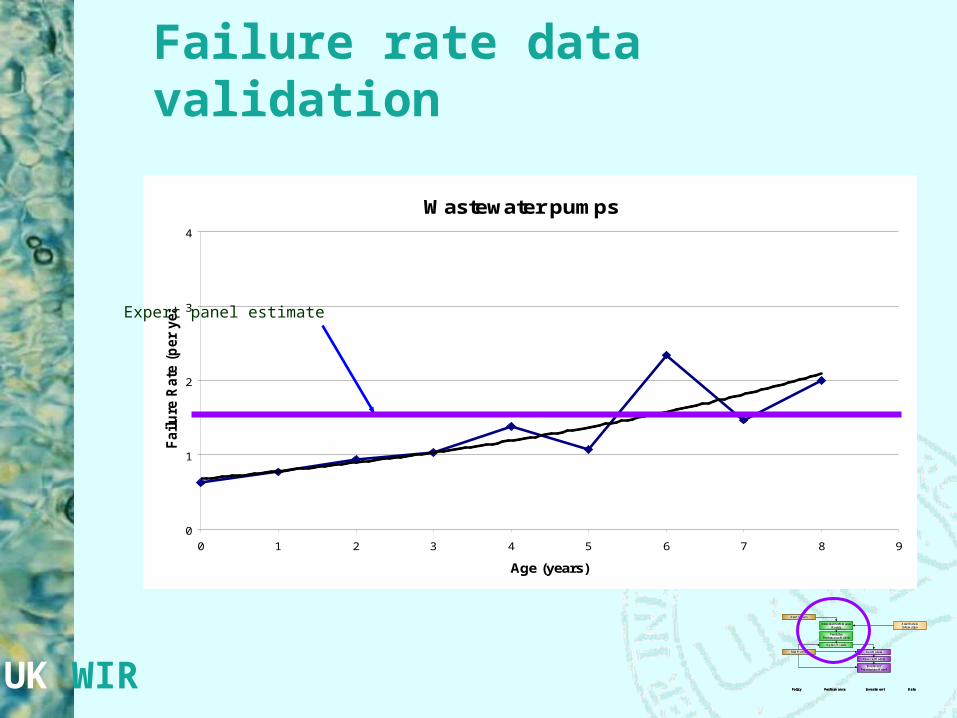
Wastewater pumps
0
1
2
3
4
0 1 2 3 4 5 6 7 8 9
Age (years)
Fail
ure
Rate
(p
er
year)
Failure rate data validation
Expert panel estimate
Historical Performance Models
Predictive Performance Models
Option Models
Cost Models
Financial Models
Investment Prioritisation Model
Asset Groups
Risk Models
Asset Data & Information
Policy Performance Investment Data
Historical Performance Models
Predictive Performance Models
Option Models
Cost Models
Financial Models
Investment Prioritisation Model
Asset Groups
Risk Models
Asset Data & Information
Policy Performance Investment Data

UK WIR
number of effluent quality failures per year
number of flow compliance failures per year
odour risk
flooding risk
pollution incident risk
sludge diversion/tankering risk
H&S risk
overall risk measure
cost
Wastewater treatment works - form of results
Historical Performance Models
Predictive Performance Models
Option Models
Cost Models
Financial Models
Investment Prioritisation Model
Asset Groups
Risk Models
Asset Data & Information
Policy Performance Investment Data
Historical Performance Models
Predictive Performance Models
Option Models
Cost Models
Financial Models
Investment Prioritisation Model
Asset Groups
Risk Models
Asset Data & Information
Policy Performance Investment Data
UK WIR
Historical Performance Models
Predictive Performance Models
Option Models
Cost Models
Financial Models
Investment Prioritisation Model
Asset Groups
Risk Models
Asset Data & Information
Policy Performance Investment Data
Historical Performance Models
Predictive Performance Models
Option Models
Cost Models
Financial Models
Investment Prioritisation Model
Asset Groups
Risk Models
Asset Data & Information
Policy Performance Investment Data
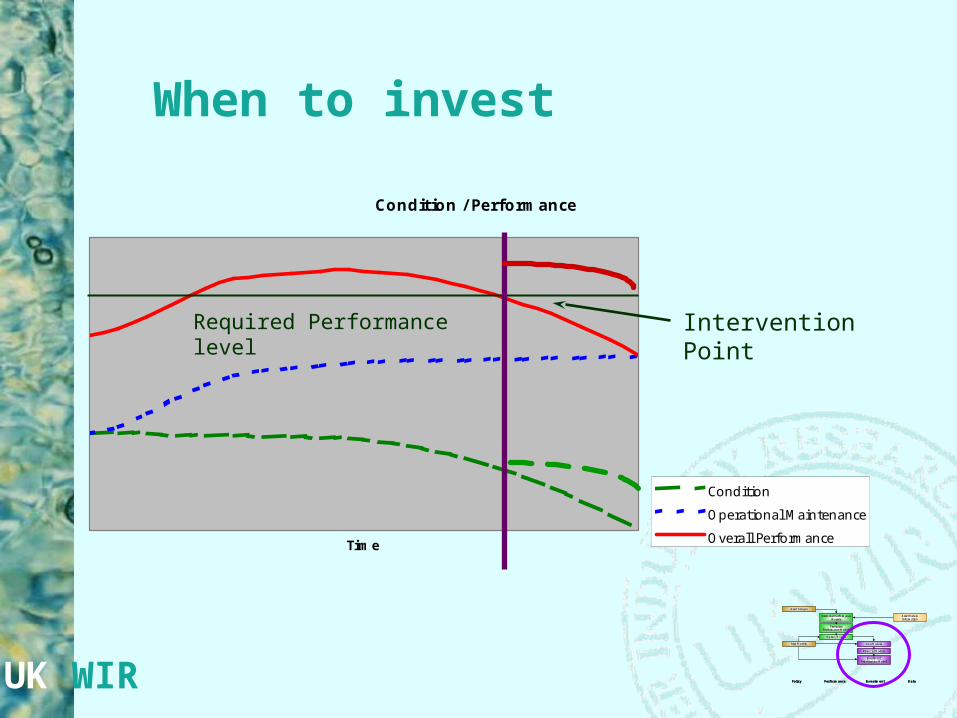
Condition / Performance
Time
Condition
Operational Maintenance
Overall Performance
Required Performance level
Intervention Point
When to invest
UK WIR
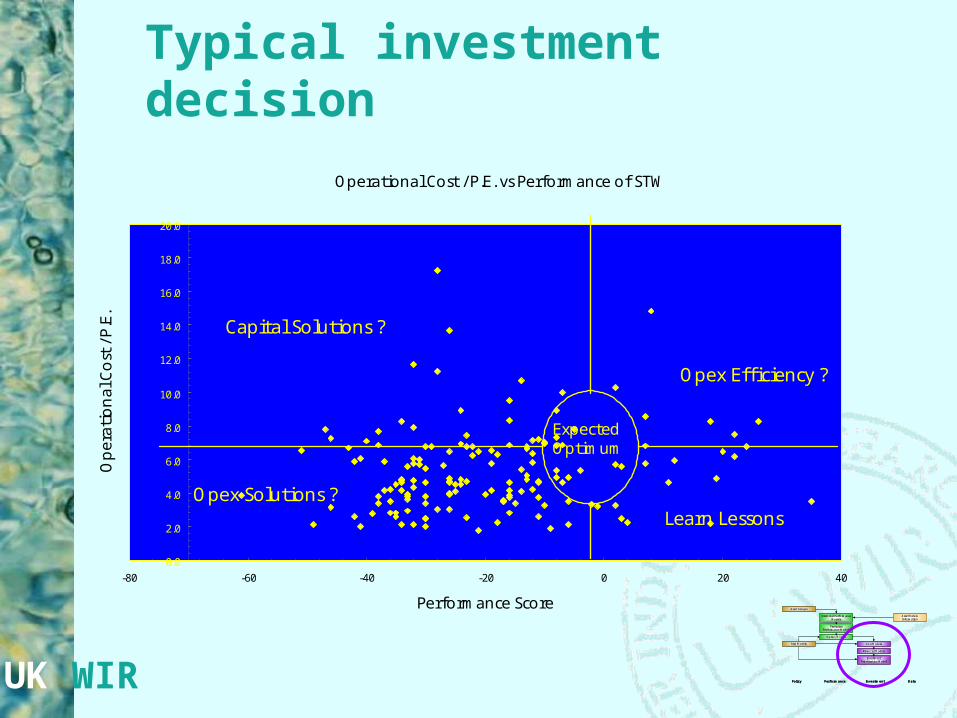
Typical investment decisionOperational Cost / P.E. vs Performance of STW
0.0
2.0
4.0
6.0
8.0
10.0
12.0
14.0
16.0
18.0
20.0
-80 -60 -40 -20 0 20 40
Performance Score
Oper
atio
nal
Cost
/ P.
E. Capital Solutions ?
Learn Lessons
Opex Efficiency ?
Opex Solutions ?
ExpectedOptimum
Historical Performance Models
Predictive Performance Models
Option Models
Cost Models
Financial Models
Investment Prioritisation Model
Asset Groups
Risk Models
Asset Data & Information
Policy Performance Investment Data
Historical Performance Models
Predictive Performance Models
Option Models
Cost Models
Financial Models
Investment Prioritisation Model
Asset Groups
Risk Models
Asset Data & Information
Policy Performance Investment Data

UK WIR
Cost riskOption 1 – cost certainty
The amount of investment is capped at a fixed point in time
Risk
£
Performance
Optimum for cost certainty
Intervention point
Historical Performance Models
Predictive Performance Models
Option Models
Cost Models
Financial Models
Investment Prioritisation Model
Asset Groups
Risk Models
Asset Data & Information
Policy Performance Investment Data
Historical Performance Models
Predictive Performance Models
Option Models
Cost Models
Financial Models
Investment Prioritisation Model
Asset Groups
Risk Models
Asset Data & Information
Policy Performance Investment Data

UK WIR
Performance riskOption 2 – performance certainty
The level of performance is fixed and the investment will be flexible
£Risk
Performance
Optimum for performance
certainty
Historical Performance Models
Predictive Performance Models
Option Models
Cost Models
Financial Models
Investment Prioritisation Model
Asset Groups
Risk Models
Asset Data & Information
Policy Performance Investment Data
Historical Performance Models
Predictive Performance Models
Option Models
Cost Models
Financial Models
Investment Prioritisation Model
Asset Groups
Risk Models
Asset Data & Information
Policy Performance Investment Data
UK WIR
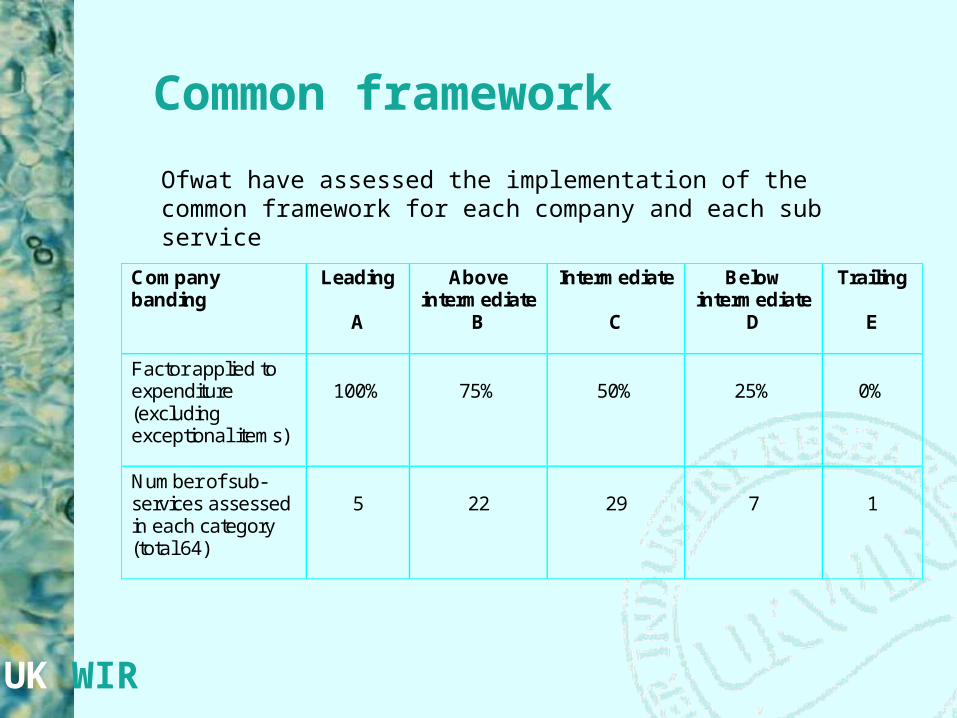
Common framework
Company banding
Leading
A
Above intermediate
B
Intermediate
C
Below intermediate
D
Trailing
E
Factor applied to expenditure (excluding exceptional items)
100%
75%
50%
25%
0%
Number of sub-services assessed in each category (total 64)
5
22
29
7
1
Ofwat have assessed the implementation of the common framework for each company and each sub service
UK WIR
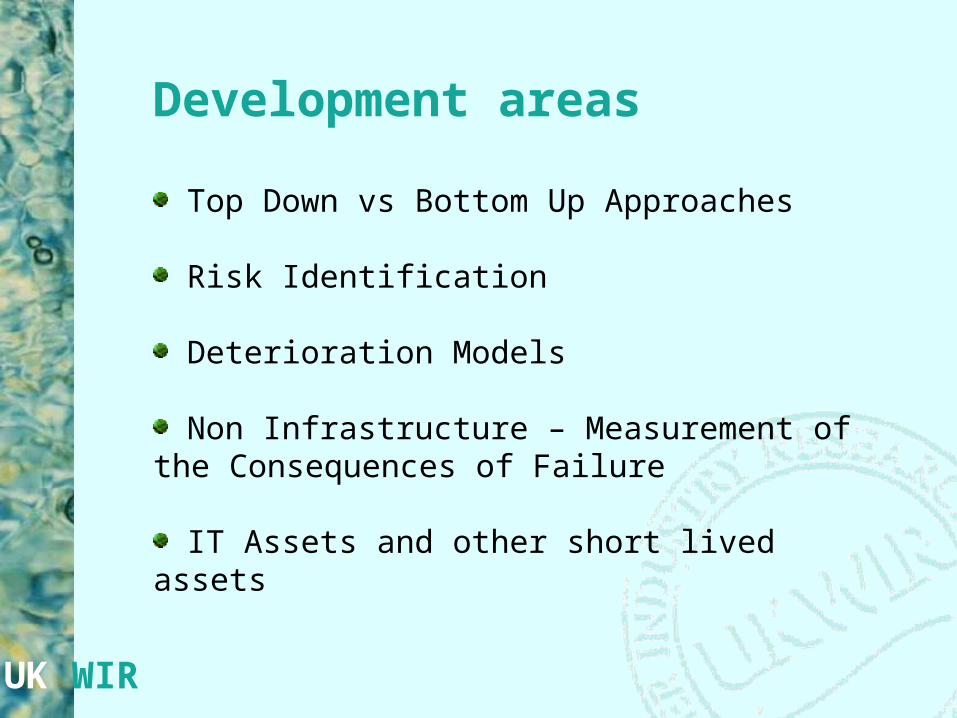
Development areas
Top Down vs Bottom Up Approaches
Risk Identification
Deterioration Models
Non Infrastructure – Measurement of the Consequences of Failure
IT Assets and other short lived assets
UK WIR
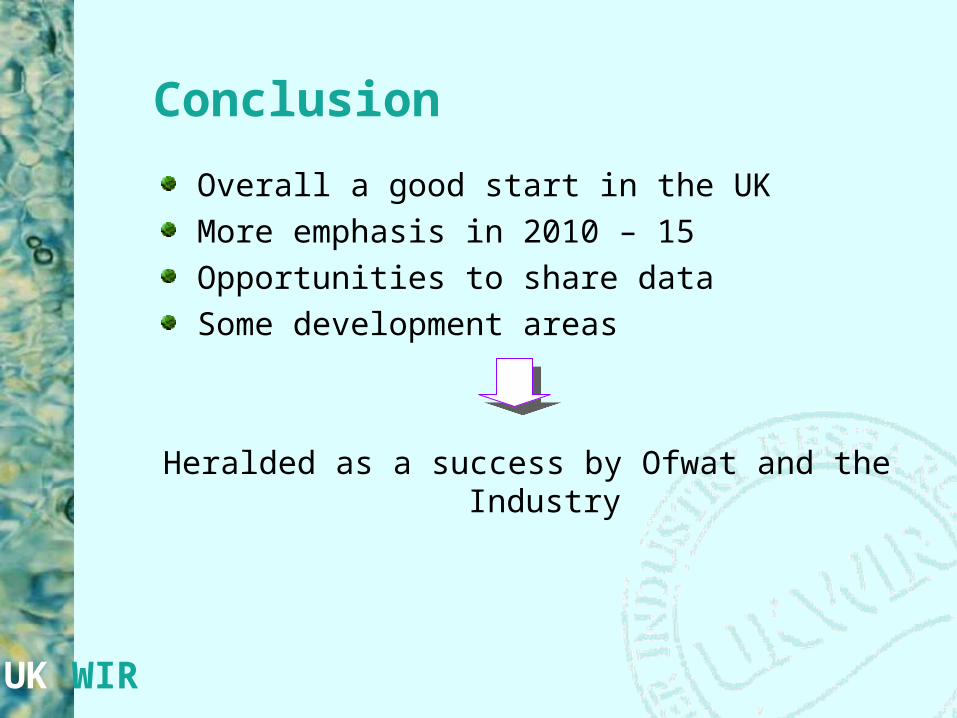
Conclusion
Overall a good start in the UKMore emphasis in 2010 – 15Opportunities to share dataSome development areas
Heralded as a success by Ofwat and the Industry

Related Documents