An update to ABI Research Paper No 19, 2009 31 January 2017 UK Windstorms and Climate Change Eric Robinson 1 , Michelle Cipullo 1 , Peter Sousounis 1 , Cagdas Kafali 1 , Shane Latchman 2 , Stephanie Higgs 2 , Paul Maisey 3 , and Lorna Mitchell 3

Welcome message from author
This document is posted to help you gain knowledge. Please leave a comment to let me know what you think about it! Share it to your friends and learn new things together.
Transcript

An update to ABI Research Paper No 19, 2009
31 January 2017
UK Windstorms and
Climate Change
Eric Robinson1, Michelle Cipullo1, Peter Sousounis1, Cagdas Kafali1,
Shane Latchman2, Stephanie Higgs2, Paul Maisey3, and Lorna Mitchell3

CONFIDENTIAL | 2
UK Windstorms and Climate Change
Trademarks
AIR Worldwide is a registered trademark in the European Community.
Copyright
This report was prepared by AIR Worldwide for the Association of British
Insurers, which retains all copyrights.
Contact Information
If you have any questions regarding this document, contact:
AIR Worldwide Corporation
131 Dartmouth Street
Boston, MA 02116-5134
USA
Tel: (617) 267-6645
Fax: (617) 267-8284
1AIR Worldwide, Boston, MA USA
2AIR Worldwide Limited, London UK
3UK Met Office

Table of Contents
Introduction ................................................................................................................ 4
Methods ...................................................................................................................... 7
Results ........................................................................................................................ 9
Key Caveats and Sensitivities ................................................................................. 14
Summary and Conclusions ..................................................................................... 15
References ................................................................................................................ 16
About AIR Worldwide ...........................................................................................

CONFIDENTIAL | 4
UK Windstorms and Climate Change
Introduction
In 2009, the Met Office and AIR collaborated on a report for the Association of British Insurers
(ABI) to assess the impacts of global temperature increases of 2, 4 and 6°C on the frequency and
intensity of UK windstorms, UK flooding and China typhoons, and the consequent implications for the
UK insurance industry. In the intervening period there have been substantial advances in climate
science, and the ABI now wishes to update the UK windstorm section of the report.
In this report the impact of three global temperature scenarios on the frequency and intensity
of UK windstorms will be assessed. When considering UK windstorms, similar to the previous report,
the focus will be on windstorms occurring during the winter (December – February), because this
represents the time period when the majority of severe windstorms occur over the UK. For example,
the Extreme Windstorm Catalogue (XWS) lists the top 50 European windstorms over the time period
1979 – 2013, and 44 of these events occur during December – February11. October, November,
March and summer extratropical cyclones, however, will not be explicitly excluded from the stochastic
loss results, but represent a very small percentage of the overall insured loss.
Review of climate science since 2009
The Intergovernmental Panel on Climate Change (IPCC) is an international body for
assessing the science related to climate change, and for providing an objective and scientific view on
climate change and its associated impacts. The IPCC produce reports approximately every 4-5 years
that consolidate the progress in climate science. The IPCC Fourth Assessment Report (IPCC AR4)
was published in 2007. In 2013 the IPCC AR4 was replaced by the IPCC Fifth Assessment Report
(IPCC AR5). The previous report produced for the ABI in 2009 relied upon data generated for the
IPCC AR4 assessment and the QUMP (Quantifying Uncertainties in Model Projections) Met Office
climate ensemble. Since this report there have been substantial advances in climate science, namely:
the publication of the IPCC AR5 report; and the availability of new climate models (e.g. Coupled Model
Intercomparison Project - CMIP5). This section discusses the main advances in climate models and
climate science related to the North Atlantic storm track.
Climate models often describe a range of climate scenarios that represent different
magnitudes of climate change and associated impacts. In the IPCC AR4 report, climate scenarios
were known as SRES scenarios. The SRES scenarios were designed to take into account that future
greenhouse gas emissions are a result of complex dynamical systems. Therefore the SRES scenarios
covered a wide range of demographic, economic and technological factors to analyse how these
different factors influence future greenhouse gas emissions.
The climate scenarios used within IPCC AR5 are known as Representative Concentration
Pathways (RCP). There are four RCP scenarios: RCP2.6, RCP4.5, RCP6, and RCP8.5, as well as the
historical simulation. In the historical simulations, climate models are forced by the observed
greenhouse gas concentrations, ozone, solar forcing, land use and aerosols over the last 150 years. In
this report the focus is on RCP4.5 and 8.5 scenarios since these scenarios result in temperature
changes closest to the scenarios of interest (1.5° C, 3.0° C, and 4.5° C). The RCP4.5 simulations are
1 XWS: www.europeanwindstorms.org. Last accessed: 28th October 2016.

CONFIDENTIAL | 5
UK Windstorms and Climate Change
future scenarios conditional on a mid-range mitigation of greenhouse gas emissions. In particular, this
scenario projects atmospheric carbon dioxide (CO2) concentrations peak by 2040 and then decline to
a value of 543ppm by 2100. This corresponds to roughly a doubling of atmospheric CO2
concentrations with respect to pre-industrial conditions. The RCP8.5 simulations are future scenarios
conditional on high greenhouse gas emissions. In this case, CO2 concentrations continue to rise
throughout the 21st century (Meinshausen et al., 2011). The RCP scenarios replaced SRES scenarios
to allow the climate scenarios to be more appropriate for policy makers (e.g. investigating approaches
to achieve a 2°C climate change target), and risk management (e.g. adaptation approaches to reduce
climate change impacts).
A key difference between the RCP and SRES climate scenarios is that they are not designed
to represent a specific set of assumptions about future demographic, economic or technical factors,
but rather aim to span the range of scenarios found in the academic literature. Although the RCP
scenarios were not designed to match the SRES scenarios, there are similarities between the
expected temperature projections between the two, and global mean temperature projections for the
end of the 21st century for the RCP scenarios are very similar to the closest matching SRES scenario.
However, the rate at which the warming occurs differs between the RCP and SRES scenarios (Table
1).
Since 2009 the main advance in climate modelling has been the publication of the most recent
ensemble of climate models: CMIP5 (the fifth phase of the World Climate Research Programme’s
Coupled Model Intercomparison Project; Taylor et al., 2012). CMIP5 is a collection of modelling
experiments in which many climate modelling centres produced a set of historical and future climate
simulations. For some models there are multiple simulations for each period, based upon different
model initialisations.
Table 1: Taken from Rogelj et al. (2012). Mean similarities and differences between temperature projections for
SRES scenarios and RCPs.
RCP Similar SRES Scenario Particular differences
RCP2.6 None
RCP4.5 SRES B1 Median temperatures in RCP4.5 rise faster than in SRES
B1 until mid-century and slower afterwards.
RCP6 SRES B2
Median temperatures in RCP6 rise faster than in SRES B2
during the three decades between 2060 and 2090, and
slower during other periods of the twenty-first century.
RCP8.5 SRES A1FI
Median temperatures in RCP8.5 rise slower than in SRES
A1FI during the period between 2035 and 2080, and faster
during other periods of the twenty-first century.
Impact of climate change on the North Atlantic storm track
The IPCC AR4 report concluded that the North Atlantic storm track would shift northward in
the future, resulting in fewer mid-latitude storms (Meehl et al., 2007). Since this publication, further

CONFIDENTIAL | 6
UK Windstorms and Climate Change
research has led to a revision of this result (e.g. Collins et al., 2013; and, Zappa et al., 2013) and the
IPCC AR5 report concluded that there was less indication of a poleward shift in the North Atlantic
storm track. Recent studies suggest that the future North Atlantic windstorm track is likely to be
characterised by a tripolar pattern with an increase in the number and intensity of ETCs over central
Europe, and a decrease in the number over the Norwegian and Mediterranean Seas (Zappa et al.,
2013; Sansom et al., 2013; Mizuta 2012).
Focusing on the UK winter, recent studies have indicated that in the future there is a small but
significant increase in the number of windstorms affecting the UK (Zappa et al., 2013; and, Sansom et
al., 2013). Zappa et al. (2013) and Mizuta (2012) also showed that the frequency and intensity of the
most extreme windstorms will increase over the UK during the winter months.
IPCC AR5 noted that the biases in the North Atlantic storm track have improved significantly
in CMIP5 models compared with previous climate models used in the IPCC AR4 (Flato et al., 2013).
This increased confidence in the ability of the models to represent the general characteristics of the
North Atlantic storm track is largely the result of: increased horizontal resolution and improved model
simulation of stratospheric dynamics leading to improved representation of natural variability (e.g.
NAO, ENSO). However, the IPCC AR5 also concluded that CMIP5 models produce a storm track that
is too zonal and underestimates cyclone intensity (Flato et al., 2013).
Studies looking at the impact of European windstorms on insured losses indicate an overall
increase in extreme wind speeds and subsequent insured losses over central and northern Europe
associated with changes in storm tracks (e.g. Beniston et al., 2007; Rockel and Woth, 2007; Rauthe et
al., 2010; and, Pinto et al., 2012). However, there is no evidence that the observed increase in
European storm losses is directly attributable to anthropogenic climate change (Barredo, 2010), and it
is well recognised that the near-term frequency and intensity of windstorms affecting the UK is
dominated by natural variability (Collins et al., 2013).

CONFIDENTIAL | 7
UK Windstorms and Climate Change
Methods
The 2009 report focussed on temperature increases of 2, 4, and 6 °C. The switch to RCPs
and the fact that CMIP5 models show that the global temperature will not likely exceed 4 °C ( by 2100
with the uncertainty in this ranging from 3 - 5.5 °C; Figure 2) means that it is not possible or desirable
to replicate the temperature increases in this update. Instead, the impact of temperature increases of
1.5, 3 and 4.5°C on the frequency and intensity of UK windstorms is analysed. This corresponds to
RCP 4.5 (2050-2059), RCP 8.5 (2070-2079), and RCP 8.5 (2090-2099), respectively. A lower global
temperature increase of 1.5 °C was chosen as following the Paris Climate Conference (COP21) in
2015, there has been focus on trying to limit global temperature increases to within 2 °C, and ideally to
no more than 1.5 °C . A historical time period of 1995-2004 was used as the baseline to calculate any
changes in the future storm track. This time period was chosen as it corresponds to the most recent
historical data available.
Track density analysis
In order to assess the change in frequency of UK windstorms, storm track density statistics
were calculated that show the mean storm track and the related uncertainty for the three projected
temperature increases. The storm track density indicates the number of times per winter (December -
February) that a windstorm passes through points on a grid.
Following the approach in Zappa et al. (2013) the mean storm track density is estimated from
averaging the mean of the multi-simulation CMIP5 model track densities. In other words, if multiple
simulations were available within a CMIP5 model, then those track densities were first averaged for
each temperature scenario, and then these CMIP5 model-average track densities were used to
estimate the average storm track density over all CMIP5 models. This ensures that each CMIP5 model
is equally weighted within the analysis irrespective of the number of model runs. Track densities are
analysed on a 4°x4° grid covering the UK and surrounding areas. The storm tracks provide the
position of the storm at 6-hourly intervals. It was this information that was used to create the storm
track density plots, and therefore an assumption has been made that if the grid boxes defined are
large enough then the storm will not travel so fast as to pass through more than one grid box within 6
hours. The storm track density plots suggest that 4°x4° grid boxes are large enough as there is spatial
coherence between the track density patterns and numbers under different temperature increases
indicating that the results are not dominated by sampling uncertainty related to storms being
miscounted.
Assessing changes in insured losses due to climate change scenarios
AIR Worldwide was tasked with assessing the insurance impacts of the various climate
scenarios put forth by the Met Office. Using state of the art catastrophe models, AIR has developed
“climate conditioned” catalogues of potential future events and compared the resulting losses based on
projected climate scenarios with the baseline risk associated with today’s climate. Changes in risk are
measured using several key metrics, in particular, the average annual loss (AAL) reflecting the
expected annual insured loss aggregated over an entire year, the 1.0% exceedance probability (100-
year) loss, and the 0.5% exceedance probability (200-year) loss. “AAL” refers to the loss that can be
expected to occur per year, averaged over a period of many years. Significant events are not expected
to happen every year, so it is important to emphasise that the AAL is a long-term expected loss. The
100-year loss is the loss threshold that has a 1.0 percent probability of exceedance in any given year.

CONFIDENTIAL | 8
UK Windstorms and Climate Change
These metrics are derived from versions of AIR’s standard stochastic catalogue for European
Windstorms that has been adjusted to account for the range of differences seen in the Met Office
analysis. Primarily, individual storm tracks were either removed of perturbed spatially in order to
increase or decrease the local value of storm track density or intensity. This process was performed
iteratively using varying degrees of perturbation. The final scenarios used in this analysis were those
that resulted in the smallest root mean squared error (RMSE) when compared to the three temperature
scenarios provided by the Met Office.

CONFIDENTIAL | 9
UK Windstorms and Climate Change
Results
Track density and intensity changes
Figure 1 shows the percentage change in average track density for the projected storm tracks
within the CMIP5 models. Under a global temperature increase of 1.5°C, the number of storms over
the UK generally decreases with the largest decrease in storm occurrence over the southwestern UK.
Under a global temperature increase of 3.0 and 4.5° C, the number of storms over the UK generally
increases by up to 15% of the CMIP5 baseline. An exception to this is over southern UK where we see
a decrease which gradually lessens with increasing temperature. In general, the activity over the UK
increases between subsequent climate change scenarios.
These results broadly agree with other studies (e.g. Zappa et al., 2013; and, Sansom et al.,
2013) which indicate that under the RCP4.5 and RCP8.5 scenarios, the frequency of storms over the
UK will increase by 0.3 to 1.2 over the majority of the UK, apart from over southern UK where the
number of storms will decrease by up to 0.3 storms per year. The main difference in the results is that
under a global temperature increase of 1.5°C we are indicating a decrease in the number of storms
affecting the UK.
The stochastic representation of each scenario is presented in the bottom half of Figure 1. It
should be noted that there are some differences between the CMIP5 scenarios and the ones
generated from the stochastic model; however the differences are well within the range of uncertainty
implicit to the CMIP5 analysis, and the broader-scale patterns over the UK are represented faithfully.
As in the CMIP5 data, we see an overall decrease in activity over most of the UK in the 1.5 °C case,
with subsequent increases seen in the 3.0 °C and 4.5 °C cases. The largest differences are found in
central UK in an area spanning Birmingham, Liverpool, and Sheffield.
Figure 1: Track densities from climate conditioned views of AIR stochastic catalogue (bottom), and the 1.5, 3.0,
and 4.5 °C CMIP5 scenarios (top). Plot values are percentage changes from the respective baseline.
CONFIDENTIAL | 10
UK Windstorms and Climate Change
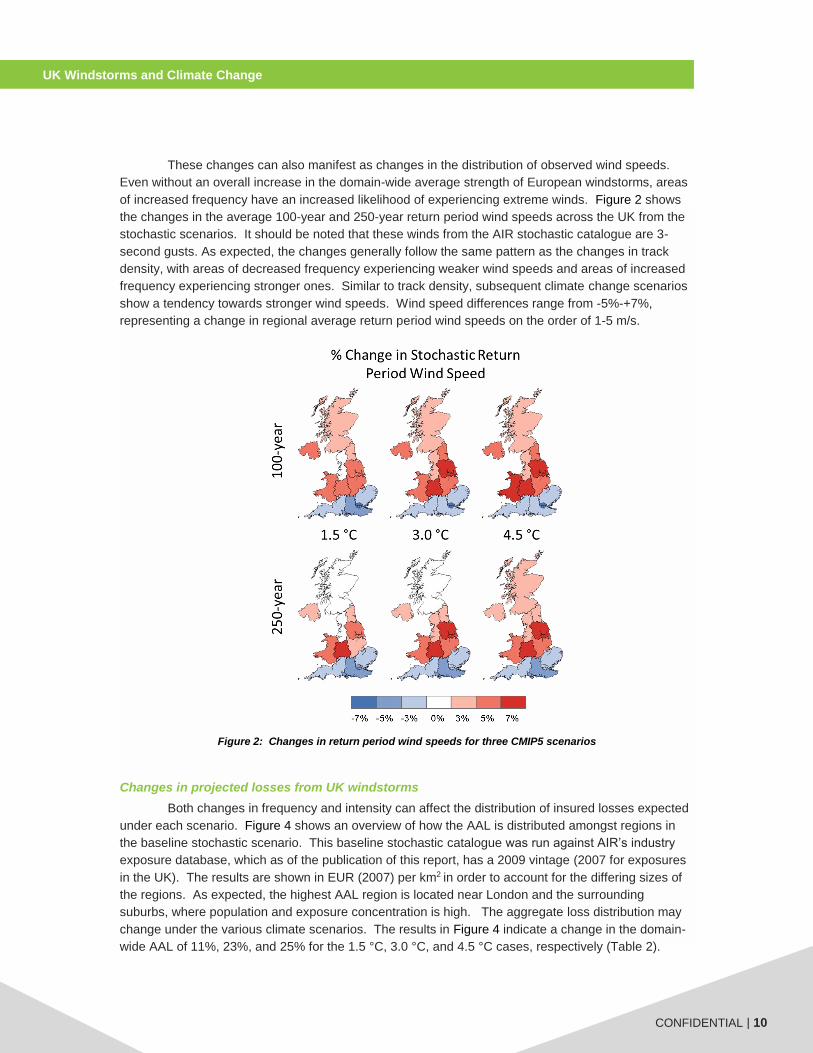
These changes can also manifest as changes in the distribution of observed wind speeds.
Even without an overall increase in the domain-wide average strength of European windstorms, areas
of increased frequency have an increased likelihood of experiencing extreme winds. Figure 2 shows
the changes in the average 100-year and 250-year return period wind speeds across the UK from the
stochastic scenarios. It should be noted that these winds from the AIR stochastic catalogue are 3-
second gusts. As expected, the changes generally follow the same pattern as the changes in track
density, with areas of decreased frequency experiencing weaker wind speeds and areas of increased
frequency experiencing stronger ones. Similar to track density, subsequent climate change scenarios
show a tendency towards stronger wind speeds. Wind speed differences range from -5%-+7%,
representing a change in regional average return period wind speeds on the order of 1-5 m/s.
Figure 2: Changes in return period wind speeds for three CMIP5 scenarios
Changes in projected losses from UK windstorms
Both changes in frequency and intensity can affect the distribution of insured losses expected
under each scenario. Figure 4 shows an overview of how the AAL is distributed amongst regions in
the baseline stochastic scenario. This baseline stochastic catalogue was run against AIR’s industry
exposure database, which as of the publication of this report, has a 2009 vintage (2007 for exposures
in the UK). The results are shown in EUR (2007) per km2 in order to account for the differing sizes of
the regions. As expected, the highest AAL region is located near London and the surrounding
suburbs, where population and exposure concentration is high. The aggregate loss distribution may
change under the various climate scenarios. The results in Figure 4 indicate a change in the domain-
wide AAL of 11%, 23%, and 25% for the 1.5 °C, 3.0 °C, and 4.5 °C cases, respectively (Table 2).

CONFIDENTIAL | 11
UK Windstorms and Climate Change
Perhaps more notable, the scenarios suggest a possible increase of up to 40% in the 200-year return
period loss, and approximately up to a 30% increase in the 100-year return level loss. Looking at the
results spatially in Figure 5, the UK-wide loss numbers appear to be the result of two competing areas:
an area of increasing loss starting at approximately 52 °N and extending northward, and an area of
decreasing loss to the South. As the temperature rises, the area to the south shows smaller
decreases, whereas the area to the north shows larger increases. This explains the increasing
percentage change in AAL with temperature, and highlights that while the domain-wide AAL sees little
change at 1.5 °C, regional AALs may experience significant differences.
Figure 3: Regional AAL values (in EUR (2007)/km2) for the baseline stochastic case. Note the non-linear colour
bar used in order to preserve regional detail.
Figure 4: Average Annual (AAL), Notional Premium (AAL+1/3*SD), 100-year, and 200-yr losses over the entire UK
for the 3 CMIP5 scenarios
0
5
10
15
20
25
AAL NotionalPremium
100-yr 200-yr
Lo
ss (
EU
R)
Billio
ns
UK Scenario Agg. Return Period Losses
baseline
1.5 °C
3.0 °C
4.5 °C

CONFIDENTIAL | 12
UK Windstorms and Climate Change
Table 2: Percent changes in AAL, Notional Premium (AAL + 1/3 SD), 100-yr, and 200-yr losses
1.5° C 3.0° C 4.5° C
AAL 11% 23% 25%
Notional Premium 12% 24% 26%
100-yr Aggregate 18% 27% 33%
200-yr Aggregate 31% 38% 44%
Figure 5: Percent changes in regional AAL relative to the stochastic baseline
In general, the changes in loss mirror those of the track density and wind speeds. The
patterns most closely resemble the track density changes, which is to be expected since aggregate
annual loss results tend to be dominated by the overall frequency of events. The relationship is not
necessarily linear, however, as the additional storms may be of higher or lower intensity than the
average storm that occurs over this area in the baseline scenario.
More specifically however, the AAL changes relative to and across the temperature scenarios
they represent, are noticeably non-uniform with temperature increase. However, it is important to note
that the 1.5 °C temperature scenario represents a more conservative scenario and for an earlier time
(RCP 4.5 at 2050-59) than the 3.0 and 4.5 °C ones (RCP 8.5 at 2070-79 and RCP 8.5 at 2090-2099).
The absence of any substantial increase in AAL exhibited by the 1.5°C scenario is certainly a
combined result of compensating decreases and increases from London to the south and Birmingham
and other industrial towns to the north. This scenario at 2050-59 likely reflects an intermediate
CONFIDENTIAL | 13
UK Windstorms and Climate Change
response of the climate system, perhaps one where the tripolar storm track pattern is beginning to
materialise spatially but has not yet reached its mature state. Despite the intermediate state, and
despite the absence of a change in AAL, it is easy to recognise that in regions where frequency and
intensity have increased, that the opportunity and hence loss for a 100- or 200-year event UK-wide has
increased relative to the base state.
For the 3.0 and 4.5 °C scenarios, especially because these are from a more aggressive RCP,
the change in the tripolar pattern is perhaps more robust so the increases in frequency and intensity
extend over a larger region so that the AAL increases considerably for the 3.0 °C scenario. For the 4.5
°C scenario, the AAL increases only marginally over that for the 3.0 °C one. This result is consistent
with the fact that frequency changes are marginal between the two scenarios (frequency increases in
the region south of London) and intensity being more noticeably stronger over the northern region of
the UK, in areas with relatively little exposure currently. Additionally, because the two scenarios reflect
10-year averages separated by 20 years, climate variability could likely be influencing the frequency
and intensity changes for these two time periods.

CONFIDENTIAL | 14
UK Windstorms and Climate Change
Key Caveats and Sensitivities
As with all climate change studies, there are significant caveats and sensitivities that should
be acknowledged in this report. The climate system is intrinsically non-linear. Small changes or errors
in the modelling can result in large changes in the final results. This is especially true in this case,
where losses can be quite sensitive to small changes in the magnitude and location of future wind
speeds. The range of uncertainty seen in the CMIP5 ensembles with respect to both track density and
storm intensity is large, with the 5-95% confidence intervals ranging between positive and negative
values (see Figure 6). Additional analysis suggests at least some sensitivity to both the choice of
reference period and individual CMIP5 model ensemble members.
Figure 6: The 5th (left), median (middle), and 95th (right) quantiles of the change in average wind intensity for the
4.5 °C case. Cool colours indicate negative changes, warm positive changes.
It should also be noted that the analysis performed by the Met Office for this study looked at
UK windstorms independent of their relative strengths, whereas by virtue of being a catastrophe
model, the stochastic model used by AIR is intended to examine the strongest of these events.
Additionally, it must be stated that the stochastic model used in this study is a pre-release version of
AIR’s upcoming Extratropical Cyclone Model for Europe, which may undergo additional calibration
before being finalised.
Finally, there are many other aspects of the changing risk not addressed in this report. Chief
among them are changes in storm clustering, global teleconnections (such as the NAO), storm surge,
inland flooding, construction practices, exposure growth, and many others. An in-depth analysis of
these various factors was beyond the scope of this work.

CONFIDENTIAL | 15
UK Windstorms and Climate Change
Summary and Conclusions
This project aimed to quantify the effect of changing global temperature on the risk posed by
windstorms to the United Kingdom. Recent advances in climate modelling have allowed for a better
representation of current and future climate, especially since the publication of the previous version of
this report in 2009. Previous results had indicated a poleward shift in the North Atlantic storm track,
resulting in fewer windstorms; however more recent studies suggest a more complicated, tri-polar
pattern with localised increases in activity over the UK. A set of CMIP5 models were analysed to
understand the climate response to three temperature thresholds and were found to be in broad
agreement with recent studies showing an increase in windstorm activity over the UK. This increase,
quantified as a change in track density, was introduced into a set of “climate conditioned” stochastic
catalogues which showed a subsequent increase in future insured losses, both on an average annual
(up to an 18% change over current day) and extreme exceedance basis (up to 30% change for the 1%
exceedance probability, up to a 40% change for the 0.5% exceedance probability). These changes
were highly regionalised, with the largest increases occurring in the central UK, and potential
decreases in the Southern UK. The analysis also indicates, however, significant sensitivity and
uncertainty with confidence bands that span both an increasing and decreasing view of risk over the
entire UK.

CONFIDENTIAL | 16
UK Windstorms and Climate Change
References
Andrews, M.B., J.R. Knight, and L.J. Gray, 2015: A simulated lagged response of the North Atlantic
Oscillation to the solar cycle over the period 1960-2009. Environmental Research Letters, 10,
054022
Beniston, M., D.B. Stephenson, O.B. Christensen, C.A.T. Ferro, C. Frei, S. Goyette, K. Halsnaes, T.
Holt, K. Jylhä, B. Koffi, J. Palutikof, R. Schöll, T. Semmler, and K. Woth, 2007: Future extreme
events in European climate: an exploration of regional climate model projections. Climatic
Change, 81, 71-95.
Collins, M., R. Knutti, J. Arblaster, J.-L. Dufresne, T. Fichefet, P. Friedlingstein, X. Gao, W.J. Gutowski,
T. Johns, G. Krinner, M. Shongwe, C. Tebaldi, A.J. Weaver and M. Wehner, 2013: Long-term
Climate Change: Projections, Commitments and Irreversibility. In: Climate Change 2013: The
Physical Science Basis. Contribution of Working Group I to the Fifth Assessment Report of
the Intergovernmental Panel on Climate Change
Stocker, T.F., D. Qin, G.-K. Plattner, M. Tignor, S.K. Allen, J. Boschung, A. Nauels, Y. Xia, V. Bex and
P.M. Midgley (eds.)]. Cambridge University Press, Cambridge, United Kingdom and New
York, NY, USA.
Economou T., D.B. Stephenson, J.G. Pinto, L.C. Shaffrey, and G. Zappa, 2015: Serial clustering of
extratropical cyclones in a multi-model ensemble of historical and future simulations.
Q.J.R.Meteorol.Soc., 141, 3076 – 3087.
Fereday, D.R., J.R.Knight, A.A.Scaife, C.K. Folland, and A.Philipp, 2008: Cluster Analysis of North
Atlantic–European Circulation Types and Links with Tropical Pacific Sea Surface
Temperatures. American Meteorological Society, 21, 3687-3703.
Flato, G., J. Marotzke, B. Abiodun, P. Braconnot, S.C. Chou, W. Collins, P. Cox, F. Driouech, S.
Emori, V. Eyring, C. Forest, P. Gleckler, E. Guilyardi, C. Jakob, V. Kattsov, C. Reason and M.
Rummukainen, 2013: Evaluation of Climate Models. In: Climate Change 2013: The Physical
Science Basis. Contribution of Working Group I to the Fifth Assessment Report of the
Intergovernmental Panel on Climate Change [Stocker, T.F., D. Qin, G.-K. Plattner, M. Tignor,
S.K. Allen, J. Boschung, A. Nauels, Y. Xia, V. Bex and P.M. Midgley (eds.)]. Cambridge
University Press, Cambridge, United Kingdom and New York, NY, USA.
Gray, L.J., J. Beer, M. Geller, J.D. Haigh, M. Lockwood, K. Matthes, U. Cubasch, D. Fleitmann, G.
Harrison, L. Hood, J. Luterbacher, G.A. Meehl, D. Shindell, B. van Geel, and W. White, 2010:
Solar Influences on Climate. Rev. Geophys., 48, RG4001.
Hodges, K.I., 1994: A general method for tracking analysis and its application to meteorological data.
Mon. Wea. Rev., 122, 2573-2585.
Hodges, K.I., 1995: Feature tracking on the unit sphere. Mon. Wea. Rev., 123, 3458-3465.
Hodges, K.I., 1999: Adaptive constraints for feature tracking. Mon. Wea. Rev., 127,1362-1373.

CONFIDENTIAL | 17
UK Windstorms and Climate Change
Ineson, S., A.A. Scaife, J.R. Knight, J.C. Manners, N.J. Dunstone, L.J. Gray, and J.D. Haigh, 2011:
Solar forcing of winter climate variability in the Northern Hemisphere. Nature Geoscience
Letters, 4, 753-757.
IPCC, 2014: Climate Change 2014: Synthesis Report. Contribution of Working Groups I, II and
III to the Fifth Assessment Report of the Intergovernmental Panel on Climate Change
[Core Writing Team, R.K. Pachauri and L.A. Meyer (eds.)]. IPCC, Geneva, Switzerland, 151
pp.
Kidston, J., A.A. Scaife, S.C. Hardiman, D.M. Mitchell, N. Butchart, M.P. Baldwin, and L.J. Gray, 2015:
Stratospheric influence on tropospheric jet streams, storm tracks and surface weather. Nature
Geoscience, DOI: 10.1038/NGEO2424.
Li, J., R. Swinbank, R. Grotjahn, and H. Volkert, 2016: Dynamics and predictability of of large-scale
high-impact weather and climate events. Cambridge University Press.
Leckebusch, G., Renggli, D., and Ulbrich, U.: Development and application of an objective storm
severity measure for the Northeast Atlantic region, Meteor. Z., 17, 575–587, 200.
Mailier. P.J., D.B. Stephenson, C.A.T. Ferro, and K.I. Hodges, 2006: Serial clustering of extratropical
cyclones. Monthly Weather Review, 134, 2224-2240.
Meehl, G.A., T.F. Stocker, W.D. Collins, P. Friedlingstein, A.T. Gaye, J.M. Gregory, A. Kitoh, R. Knutti,
J.M. Murphy, A. Noda, S.C.B. Raper, I.G. Watterson, A.J. Weaver and Z.-C. Zhao, 2007:
Global Climate Projections. In: Climate Change 2007: The Physical Science Basis.
Contribution of Working Group I to the Fourth Assessment Report of the Intergovernmental
Panel on Climate Change [Solomon, S., D. Qin, M. Manning, Z. Chen, M. Marquis, K.B.
Averyt, M. Tignor and H.L. Miller (eds.)]. Cambridge University Press, Cambridge, United
Kingdom and New York, NY, USA.
Meinshausen, M., S.J. Smith, K. Calvin, J.S. Daniel, M.L.T. Kainuma, J-F. Lamarque, K. Matsumoto,
S.A. Montzka, S.C.B. Raper, K. Riahi, A. Thomson, G.J.M. Velders, D.P.P. van Vuuren, 2011:
The RCP greenhouse gas concentrations and their extensions from 1765 to 2300. Climatic
Change, 109, 213-241.
Mizuta, R., 2012: Intensification of extratropical cyclones associated with the polar jet change in the
CMIP5 global warming projections. Geophysical Research Letters, 39, L19707.
Pinto, J.G., S. Zacharias, A.H. Fink, G.C. Leckebusch, and U. Ulbrich, 2009: Factors contributing to
the development of extreme North Atlantic cyclones and their relationship with the NAO.
Climate Dynamics, 32, 711-737.
Pinto, J.G., M.K. Karremann, K. Born, P.M. Della-Marta, M. Klawa, 2012: Loss potentials associated
with European windstorms under future climate conditions. Climatic Research, 54, 1-20.
Roberts, J. F., A. J. Champion, L. C. Dawkins, K. I. Hodges, L. C. Shaffrey, D. B. Stephenson, M. A.
Stringer, H. E. Thornton, and B. D. Youngman (2014). The XWS open access catalogue of
extreme European windstorms from 1979 to 2012. Nat Haz Earth Sys Sci, 14, 2487-2501.

CONFIDENTIAL | 18
UK Windstorms and Climate Change
Rockel, B., and K. Woth, 2007: Extremes of near-ssurface wind speed over Europe and their future
changes as estimated from an ensemble of RCM simulations. Climatic Change, 81, 267-280.
Rauthe, M., M. Kunz, and C. Kottmeier, 2010: Changes in wind gust extremes over Central Europe
derived from a small ensemble of high resolution regional climate models. Meteorol. Z., 19,
299-312.
Rogelj, J., M. Meinshausen, and R. Knutti (2012): Global warming under old and new scenarios using
IPCC climate sensitivity range estimates. Nature Climate Change Letters, 2, 248-253. doi:
10.1038/NCLIMATE1385
Sansom, P.G., D.B. Stephenson, C.A.T. Ferro, G. Zappa, and L. Shaffrey, 2013: Simple uncertainty
frameworks for selecting weighting schemes and interpreting multimodel ensemble climate
change experiments. American Meteorological Society, 26, 4017-4037.
Taylor, K., R. Stouffer, and G. Meehl, 2012: An overview of CMIP5 and the experiment design. Bull.
Amer. Meteor. Soc., 93, 485-496.
Toniazzo, T., A.A. Scaife, 2006: The influence of ENSO on winter North Atlantic climate. Geophysical
Research Letter, 33, L24704, doi:10.1029/2006GL027881.
Vitolo, R., D.B. Stephenson, I.M. Cook, and K. Mitchell-Wallace, 2009.: Serial clustering of intense
European storms, Meteorol. Z., 18, 411–424.
Zappa, G., L.C. Shaffrey, K.I. Hodges, P.G. Sansom, and D.B. Stephenson, 2013: A multimodel
assessment og future projections of North Atlantic and European Extratropical cyclones in the
CMIP5 climate models. Journal of Climate, 26, 5846-5862.
Related Documents