UK Trade & Investment Annual Report and Accounts 2014-15

Welcome message from author
This document is posted to help you gain knowledge. Please leave a comment to let me know what you think about it! Share it to your friends and learn new things together.
Transcript
UK Trade &
Investment Annual Report and Accounts 2014-15
UK Trade & Investment Annual Report and Accounts 2014-15


UK Trade & Investment Annual Report and Accounts
2014-15 (for the year ended 31 March 2015)
Accounts presented to the House of Commons pursuant to Section 6(4) of the Government Resources and Accounts Act 2000.
Annual Report presented to the House of Commons by Command of Her Majesty.
Annual Report and Accounts presented to the House of Lords by Command of Her Majesty.
Ordered by the House of Commons to be printed on 1 July 2015
HC 73

This is part of a series of departmental publications which, along with the Main Estimates 2015–16, the document Public Expenditure: Statistical Analyses 2015, and the Supply Estimates 2014–15: Supplementary Budgetary Information, present the government’s outturn for 2014–15 and planned expenditure for 2015–16.
© Crown copyright 2015
This publication is licensed under the terms of the Open Government Licence v3.0 except where otherwise stated. To view this licence, visit nationalarchives.gov.uk/doc/open-government-licence/ version/3 or write to the Information Policy Team, The National Archives, Kew, London TW9 4DU, or email: [email protected].
Where we have identified any third party copyright information you will need to obtain permission from the copyright holders concerned.
This publication is available at www.gov.uk/government/publications
Any enquiries regarding this publication should be sent to us at UK Trade and Investment, Central Finance Team, 1 Victoria Street, London SW1H 0ET
Print ISBN 9781474122412
Web ISBN 9781474122429
ID 22061502 06/15
Printed on paper containing 75% recycled fibre content minimum
Printed in the UK by the Williams Lea Group on behalf of the Controller of Her Majesty’s Stationery Office
Contents
Forewords
Minister’s Foreword Chief Executive’s Foreword
4
4 5
Strategic Report
Our Strategy Our People Our Work People Strategy Our Partners
6
6 7 7
11 12
Departmental Performance
Financial Review
Public Interest
Remuneration Report
Statement of Accounting Officer’s Responsibilities
Governance Statement
Financials
Annexes 72
14
16
22
24
31
32
41
4 UK Trade & Investment Annual Report and Accounts 2014-15
Minister’s Foreword The Rt Hon Lord Maude of Horsham Trade and investment are at the heart of economic growth, and the work of UK Trade and Investment (UKTI) is central to Government’s economic strategy. I am delighted that this year’s annual report reveals UKTI put in another strong performance in 2014-15.
UKTI set itself the ambitious target of helping 50,000 UK companies to export last year and early figures indicate that we are on track to exceed this target.
In January 2014 my predecessor, Lord Livingston, wrote to the UK’s 8,900 Medium Sized Businesses (MSBs), offering tailored advice and support to start exporting or enter new markets. Subsequently, in 2014-15 UKTI has trebled the number of MSBs it supported from 1,000 in 2013-14 to 3,000.
UKTI and its partners were involved in the delivery of 1,610 successful inward investment projects in 201415, helping to ensure the UK remains the number one destination in Europe for FDI.
UKTI helped businesses to achieve significant wins last year. This is due to the work, experience and expertise of its people in the UK and overseas, and the tireless commitment and leadership of Lord Livingston.
We will build upon this success by continuing to focus our efforts on where we can provide greatest support to UK businesses, particularly in our work with small and medium-sized companies. Last year the Chancellor provided an additional £20 million to help companies export for the first time and in May I was delighted to launch UKTI’s first-time exporters programme. The programme builds on UKTI’s existing services and introduces some exciting new initiatives to help companies to sell internationally through the internet.
I look forward to working with UKTI and UK businesses to bring these initiatives to fruition in the coming years.
The Rt Hon Lord Maude of Horsham Minister for Trade & Investment

5 UK Trade & Investment Annual Report and Accounts 2014-15
Chief Executive’s Foreword Dominic Jermey CVO OBE UK Trade & Investment (UKTI) is at the heart of a whole of Government effort to support the UK economy. Working closely with partners across Government and the private sector, we enjoyed a record year supporting the UK economy in 2014-15. In the 12 months to September 2014, we have helped more than 54,000 UK companies to export, significantly exceeding our target. Our investment figures tell a similar story with UKTI supporting the delivery of more than 1,600 Foreign Direct Investment (FDI) projects successfully landing in the UK, a 10 percent increase on 2013-14. The UK remains Europe’s No1 destination for FDI.
This has been a year of developing and forging new partnerships. In December 2014, UKTI published the 2020 Export Drive. This sets out how the aspiration to reach £1 trillion in exports by 2020 will require a bolder, more ambitious and collaborative approach from Government and our partners in industry.
Towards the end of this year, UKTI signed strategic partnerships with Lloyds Bank Commercial Banking, Santander and KPMG, as well as accrediting 115 organisations under our Trade Challenge Partners initiative. These new strategic partnerships further deepen UKTI’s longstanding relationships with banks, professional services companies and trade associations, all of whom collectively touch many thousands of the UK’s best businesses. This enables us to bring together the best of public and private sector expertise to provide a stronger range of support and advice to a much greater number of exporters and investors.
As well as helping maintain the UK’s position as Europe’s largest defence exporter, UKTI DSO continued to strengthen its relationships with partners across the cyber security industry and, working with the Cyber Growth Partnership, appointed a Cyber Security Envoy based in Washington – the UK’s most important cyber market. This year also saw the launch of a dedicated cyber security platform, designed to tackle the challenges small and medium-sized businesses have in promoting their products to overseas clients.
Our work to attract FDI was recognised by the United Nations World Investment Forum in October when UKTI picked up an award for excellence in attracting foreign investment. Organised by the United Nations Conference on Trade and Investment, the biennial awards celebrate the achievements of the world’s best-practice investment promotion agencies and I am delighted that UKTI were recognised for ‘Excellence in promoting Foreign Direct Investment for sustainable development,’ the theme of this year’s awards. New initiatives such as HQUK, launched in New York in February, are designed to help us to maintain our leadership of investment in Europe. HQUK provides US technology companies with a dedicated programme of support to build their international headquarters in the UK.
In the year ahead, we will continue to lead the effort to mobilise all parts of the Government in support of the UK’s international trade and investment. This will involve working ever more closely with other Government Departments to align both strategy and delivery. Further enhancement of our digital delivery will also be crucial in helping us to achieve our challenging aspirations.
We have a strong and dedicated team at UKTI and I would like to thank them, our non-executive directors, and our partners across both Government and the private sector, for their hard work and commitment at home and abroad in 2014-15. We also benefit greatly from the strongest support from Ministers across Government, led by the Minister for Trade and Investment. We look forward to the challenges ahead.
Dominic Jermey CVO OBE UKTI Chief Executive
25 June 2015

6
Strategic Report
UK Trade & Investment (UKTI) is a joint, non-ministerial Government Department which reports to the Secretaries of State for the Department for Business, Innovation and Skills (BIS) and the Foreign & Commonwealth Office (FCO). UKTI has its own objectives and also contributes to the objectives of both parent departments.
UKTI is the UK’s international trade and inward investment promotion organisation. In England, we use a network of private sector international trade advisers to provide support and assistance to new and existing exporters of goods and services, while staff in over 100 markets overseas are available to support UK businesses locally. We also lead an inward investment network incorporating private sector expertise to help overseas-owned firms locate and build their business in, and from the UK.
In 2014-15 UKTI played a central role in helping the Government to work towards its challenging aspirations for the economy:
• Export £1 trillion of goods and services by 2020
• Get 100,000 more companies exporting by 2020
• Double the UK’s stock of foreign investment to £1.5 trillion by 2020
• Maintain the UK’s longstanding position as the top destination for Foreign Direct Investment (FDI) in Europe and become the number one destination for Europe-bound FDI from high growth markets.
UKTI works across the whole of government and cooperates with the devolved administrations and with regional and subregional partners across the English regions. UKTI’s Defence and Security Organisation group works with the Ministry of Defence, the Home Office and other Government Departments to help UK defence and security companies succeed internationally.
Our Strategy Whole of Government approach to trade and investment
UKTI leads a whole of Government approach, in partnership with the private sector, to drive an increase in exports and inward investment.
We are using all available levers to drive an increase in exports and to shape a positive export environment in which British businesses can prosper internationally. UKTI, with the FCO and BIS, is leading the coordination of all efforts, ensuring that our priorities are coherent and shared across Government and with our overseas network and business partners. UKTI is particularly focused on where Government can add value and make the most difference:
• Focusing on high growth sectors, countries and high value opportunities: targeting cross-Government working on the best opportunities for UK success
• Leading from the front, with senior Ministers from all Departments leading negotiations and trade missions to open up new markets and opportunities for UK business
• Inspiring, encouraging and supporting small and medium-sized businesses to take their first export steps, or to explore new markets, working together with private sector partners
• Promoting positive perceptions of the UK and British products and services internationally, through the GREAT Britain campaign
• Maintaining the UK as a competitive location for investment, with a focus on attracting investors with export potential
• Capitalising on unique world events such as Milan Expo and the Commonwealth Games to achieve global recognition for UK goods and services.
7 UK Trade & Investment Annual Report and Accounts 2014-15
Our People
UKTI Values
Working together – We work as one team and build partnerships to add value.
Empowered to deliver – We trust each other to innovate and get results.
Committed to our customers – We listen to our customers’ needs and focus on real outcomes.
UKTI is not an employer in its own right. For the majority of our human resource requirements we draw on civil servants employed by one or other of our parent departments. In the UK, most of our staff are drawn from BIS, while overseas the majority of our staff are from the FCO. Of these, approximately 570 are based in the UK, including Glasgow and the English regions, with approximately 1,340 working overseas.
UKTI is supported by approximately 540 commercial specialists provided through our major outsourced service contracts. This includes international trade advisors in the English regions and private sector specialists at UKTI headquarters. This mix of civil servants and partners is vital to ensuring that inward investors or exporting firms are directly engaged and supported effectively.
Our Work
Trade
Trade Group helps UK-based businesses succeed internationally. We work across Whitehall, together with strong regional and overseas networks and external partners, to provide companies with the help and support they need to enter new markets and support them once they are there. To achieve this, we have developed a comprehensive range of products and services for UK businesses. The most recent independently verified data for the 12 months to September 2014 shows we have assisted over 54,000 businesses. In addition UK customers tell us that this financial year, UKTI has provided significant support for over £37 billion of business wins.
High Value Opportunities
This programme provides support for those larger companies looking to win overseas contracts with a value in excess of £250 million, such as major infrastructure projects. It also looks to identify the supply chain involved in these projects which gives smaller companies a valuable means of developing new business, accessing new markets and establishing partnerships which help build a sustained export presence.
Regional Trade Support
UKTI provides support for small and medium-sized businesses (MSBs) across the UK through our dedicated team of international trade advisers in nine English regions. Help is available for both experienced and new exporters and international trade advisers offer tailored support to meet the individual needs of the business.
During 2014-15 UKTI launched a programme of activity and targeted export support to help MSBs with guidance on export strategies, routes to market, international business culture, sources of additional expertise, and access to the UKTI global contact network. We have increased the number of MSBs assisted from 1,000 to 3,000 in the past year. Encouraging more MSBs to export is a vital part of the Government’s long-term economic plan to create jobs.
The English regional teams also supported the successful delivery of Export Week in November with UK companies participating in more than 70 events across the UK. These seminars, workshops and market briefings helped companies either start their export journey or increase their international business. Export Week drew in up to 5,500 businesses to meet with market experts and explore how to start or continue their export journey.
In addition the English regional teams have a number of programmes available that offer support to exporters, these include:
Passport to Export
Passport to Export is aimed at first time small and medium-sized businesses looking to export and provides free assessment of a company’s ability to export as well as the help needed to take those first steps in international markets through a tailored action plan.
8
Events, Missions and Trade Show Access Programme
Alongside the support from regional teams UKTI offers support through its trade show, events and missions programmes, enabling small and medium-sized businesses attending trade shows and events to access new markets and export opportunities. During 2014-15 we began reforming our events and missions delivery through the introduction of the Events Alliance programme. This provides UKTI with a new model for the delivery of event and exhibition support, providing economies of scale and increased purchasing power. By contracting with select event and exhibition organisers to purchase packages of premium events, we are able to maximise the numbers of customers reached in support of the 2020 Export Drive aspirations, targeting first time exporters and increasing the volume of companies assisted at a lower unit cost. The Trade Show Access Programme (TAP) also provides grant support for eligible small and medium-sized businesses to attend overseas exhibitions. In 2014-15, it has continued to work closely with Trade Associations to support 6,500 companies.
Trade Challenge Partners (TCP)
We have strengthened our relationships with Trade Associations through the TCP initiative. This is part of the drive to get more small and medium-sized businesses exporting and is designed to leverage our Trade Association partners’ extensive industry knowledge to support UK trade overseas.
To ensure that TCPs offer the best possible service to the UK’s small and medium-sized businesses UKTI introduced a new accreditation process in 2014-15. All 115 Trade Organisations were accredited in Wave 1, a process which committed them to promote exporting to their members and opens up the opportunity of a deeper, closer working relationship with UKTI.
Overseas Business Network Initiative
The Overseas Business Networks Initiative (OBNI) is creating a global network of business-led partner organisations. In 2014-15, OBNI moved out of its pilot phase enabling us to retain those elements which have delivered greater effectiveness and value for money, while revisiting those which have not. As a result we are focusing resource on building up delivery partners overseas, where our companies most need support. In 2014-15 OBNI partners delivered services to 5,000 businesses, in 2015-16 we expect to increase this to more than 28,000.
Overseas Market Introduction Service
UKTI also offers help in the form of the Overseas Market Introduction Service (OMIS). This is an in-depth, bespoke service for companies on every aspect of breaking into a foreign market. UKTI staff overseas provide tailored business advice, undertake bespoke research, seek out business contacts and can support events and visits. The service outlines the regulations, the size and characteristics of the market, potential customers and business partners and other essential information a company needs to be successful in a new market.
UKTI’s Defence & Security Organisation (UKTI DSO)
UKTI’s Defence & Security Organisation (DSO) helps the UK defence and security industry increase exports by building relationships with overseas Governments, raising awareness of UK industry capabilities and coordinating UK Government support for export opportunities in established and developing markets. UKTI DSO provides specialist export advice and practical assistance to UK companies, working closely with the Ministry of Defence, the Home Office and other Government Departments and Agencies. During 2014-15, UKTI DSO and other partners continued to help UK defence and security companies achieve success internationally. Highlights included a business win of £250m for MBDA to supply advance short range air to air missiles to the Indian Air Force and AugustaWestland’s contract in excess of £100m for helicopter upgrades for the Brazilian Navy.

9 UK Trade & Investment Annual Report and Accounts 2014-15
UKTI DSO was also instrumental in the implementation of the Defence Growth Partnership (DGP); a collaboration between the UK defence industry and the UK Government which aims to deliver a more export focused and innovative industry to sustain and grow the sector in the long term.
UKTI DSO continued to build its capacity and relationships with partners to achieve the target of £2 billion of cyber security export sales by 2016. Working with the Cyber Growth Partnership, progress has been made on campaigns in priority markets, notably in the US, supported by the appointment of a Cyber Security Envoy based in Washington.
Events and exhibitions activity continued to be a key output for UKTI DSO in 2014-15, delivering a global programme of 28 defence and security exhibitions. Highlights included the Farnborough International Airshow (FIA 2014), where UKTI worked in partnership with the commercial organiser and was responsible for the invitation and management of 56 international defence delegations (242 official delegates) from 32 countries. In February 2015, more than 300 delegates from the UK defence and security industry attended a UKTI DSO Symposium in London. The event attracted representatives from over 140 firms of all sizes, from large multi-nationals to small and medium-sized businesses. In March 2015, working with the Home Office, UKTI DSO delivered the international delegation programme for the Security and Policing Exhibition at Farnborough. 245 official delegates from 69 countries visited the exhibition at which over 300 UK security companies were exhibiting.
UKTI DSO was also responsible for the planning and delivery of the UK Defence & Security Showcase at the NATO Summit, held in Wales in September 2014. The Showcase enabled visiting country delegates and senior support staff to be briefed and to interact with innovative UK defence and security equipment.
Investment
UKTI’s Investment Group works to attract and sustain a high quality pipeline of inward investment to the UK. Its aims are to maintain the UK’s long-standing position as the top destination for Foreign Direct Investment (FDI) in Europe, and for the UK to become the number one destination for Europe-bound FDI from high growth markets. We work with our overseas network and delivery partners to increase the numbers of high value investments into the UK. Inward investment results for 2014-15 were published in June 2015. These results show UKTI and its partners were involved in the delivery of 1,610 successful inward investment projects in 2014-15. These projects are estimated to have created a total of 72,841 new jobs and safeguarded a further 22,593 jobs.
In 2014-15, Investment Group worked to support the renewed focus on cross-department working and delivering trade wins via investment success. We identified an inward investor’s propensity to export as a factor of strategic importance in evaluating the value of an investment to the UK, and have created a new indicator in our internal framework for categorising inward investment projects to incentivise and promote export-oriented foreign direct investment. We started the implementation of this new policy in 2014-15 and expect a significant
increase in the effectiveness of our work for foreign investors who are also potential trade clients.
High Growth Markets
2014-15 was the first full year for four new outsourced contracts delivering FDI to the UK from Latin America, Russia, the Gulf and Central and Eastern Europe. These aim to build a sustainable pipeline of investment opportunities and successfully land new investments in the UK from these markets. The initiative goes directly to the target of the UK becoming the location of choice for investments from high-growth markets.
Supporting individuals and entrepreneurs
In 2014-15 we broadened our investor targeting approach from companies to individual investors, as a part of an initiative to bring high value investment to the UK. UKTI has shown commercial opportunities to a number of individual investors, including investors from the Philippines, the US and South Asia.
UKTI’s Global Entrepreneur Programme (GEP) is an accelerator focused on attracting overseas-based entrepreneurs with innovation-rich businesses to grow from a UK strategic hub. In 2013-14 GEP delivered 65 investment successes, exceeding their target. We increased the target to 90 for 2014-15, and look likely to exceed that too. UKTI’s Sirius Programme seeks to encourage the world’s brightest graduate talent, who have world-class start-up ideas, to relocate and establish a business in the UK. These top-quality graduates have developed emerging technologies in key sectors to establish 43 new businesses in the UK in 2014-15.
10
Investment Organisations
Our sector teams, including dedicated sector-focused Investment Organisations, provide expert knowledge and project leadership to deliver inward investment success. In 2014-15, many of our Investment Organisations, following our strategy, broadened to incorporate export goals to become Sector Organisations, supporting business needs whether they be exporting or investing. Others have remained Investment focused where the sector drivers point in that direction. All of our sector teams have been successful in supporting companies and attracting investment in 2014-15, including in areas such as advanced manufacturing, financial services and offshore wind technology.
Strategic Relationship Management
Relationship management is at the heart of the Investment Group’s approach to working with companies. We aspire to be a centre of excellence in account management across Government. This has informed our approach to capability development both within the Investment Group and with stakeholders, which seeks to embed effective account management and business development skills.
Our Strategic Relationship Management (SRM) team works across Whitehall with the top 76 companies of strategic importance to the UK. The programme is well regarded by the companies involved. In our autumn 2014 survey of SRM companies, 92% had a positive or very positive view of SRM, 86% felt SRM has made departments work more effectively together, and 90% agreed SRM provided the Government with greater company understanding. We have also been highly successful in attracting investment and commitments to invest from Institutional Investors.
We have helped to deliver over £13 billion of commitments into UKTI infrastructure and regeneration in 2014-15. We have attracted institutional and corporate investment from Japan, Korea, China, the Gulf, Canada, Australia, Europe, the US and Hong Kong. This capital is being injected into the UK’s nuclear new build programme, our offshore wind sector, our oil and gas fields, the UK’s electricity interconnector network, and our transport and port facilities.
Over 200 global accounts are now being actively managed by UKTI Sector Teams, providing real benefits to both the client and the economy.
Global Commercial Partners (GCP)
In 2014-15 UKTI established a new GCP team to transform its strategic partnerships with the six main banks in the UK (Barclays, HSBC, Lloyds, RBS, Santander and Standard Chartered) and the ‘Big 4’ professional services organisations (Deloitte, EY, KPMG and PwC) in order to work with the private sector to deliver a greater range of support and advice to more customers.
The approach has two main pillars:
• Develop two-year partnership programmes with each organisation based on agreed strategic priorities and targets that aim to transform how export and investment services are delivered over a 5-10 year period.
• Engage in cross cutting partnership-based campaigns where there is significant potential for new business across trade and investment through the Export Challenge; GREAT campaign and ‘How to open a Bank Account in the UK.’
Milan Expo
UKTI is leading on the UK presence at the Milan Expo. Under the theme of ‘Feeding the Planet, Energy for Life,’ Milan Expo 2015 aims to highlight one of the most pressing challenges of our time – how to feed and sustain an expected rise in the world’s population to 9 billion by 2050. It is expected to attract more than 20 million visitors and reach millions more online.
Milan Expo 2015 presents a global platform for the UK to enhance our global reputation, strengthen our trading relationships, and attract inward investment. The UK pavilion with its ‘Grown in Britain’ theme will show how our creativity, technological expertise and influence can improve the quality of life of the world’s population.
The Grown in Britain campaign has three key messages:
• The UK is a hive of innovation and creativity
• The UK is welcoming, diverse and open for business
• The UK takes the lead in overcoming global challenges
It will promote the UK’s position as a world-leading business environment, an open, innovative and creative nation, a global leader in sustainable development and climate action and a world-class tourism destination.

11 UK Trade & Investment Annual Report and Accounts 2014-15
Grown in Britain Business Programme
Supporting and informing the campaign is a comprehensive business programme led by UKTI. We aim to maximise UK participation in the Expo in order to help UK companies win business overseas and promote the UK as the FDI destination of choice. The programme focuses on the key sectors of food and drink, agri-tech, life sciences, healthcare, information economy and the creative industries.
GREAT Campaign
During 2014-15, UKTI stepped up our marketing and campaign leadership activity for the GREAT campaign. The GREAT Britain campaign showcases the very best of what Britain has to offer, encouraging the world to visit, study in and do business with the UK.
UKTI’s ‘Exporting is GREAT’ campaign is an integral part of the wider BIS ‘Business is GREAT’ campaign and was designed to inspire small and medium-sized firms with an appetite for growth to consider exporting, reassure them about exporting, promote the sources of support and encourage them to take action by making an appointment with one of UKTI’s international trade advisers.
The second wave of the Exporting is GREAT campaign commenced in July 2014 using direct mail, telemarketing and digital media only. Exporting is GREAT is making it easier for small companies to access UKTI services through the GREAT business website, which allows access to UKTI international trade advisers.
People Strategy Learning and Development
UKTI’s people are supported to meet the needs of their clients through a range of learning and development opportunities. On 1 April 2014, we introduced the UKTI Learning Passport for our staff based in the UK. This brings together a range of learning options in one place, enabling staff to plan out and access the learning and development which is best for them throughout the course of their career. This was rolled out to overseas staff in April 2015.
During 2014-15 we have developed a new UKTI Capability Programme for staff working on trade and investment. The focus of the programme will be to develop core skills and competencies through an accredited Continued Professional Development (CPD) programme for account management; business relationship and customer service skills; product knowledge and wider skills relating to key UKTI priorities such as leadership and talent development.
Recruitment
All of the permanent vacancies in UKTI are filled following the Civil Service principles of fair and open recruitment.
Engaging and Communicating with Staff
UKTI undertakes the annual Civil Service People Survey. The survey provides an overall staff engagement index score, based on an assessment of different areas which impact on employees’ experience at work. These areas include learning and development, leadership and managing change. UKTI’s engagement score for 2014 was 61%, an improvement of 6% from previous years. During 2014-15, we have continued our focus on ensuring UKTI is a great place to work. Each area of UKTI has reflected on their People Survey results and produced an action plan to ensure any issues are identified and addressed. This made an important contribution to achieving our Investors in People accreditation.
We have a variety of communications channels to enable all individuals in UKTI to have access to and share a range of information relevant not only to their role but also to the wider performance of UKTI. These channels include: all staff meetings (including Communications Wednesday where three time slots are available for staff all over the world to hear from the leadership team); UKTI bulletins sent out via email; and Connect, UKTI’s intranet site. Additionally, the UKTI Secretariat invites staff to observe the decision making process by attending UKTI management boards such as the Executive Committee, People Committee and the Trade and Investment Board.

12
Diversity
We support arrangements for flexible working patterns and are committed to creating a culture where individual differences are valued and respected. We do not tolerate any form of discrimination, harassment or victimisation. UKTI’s status means that we can call on the expertise of the diversity and equality units of both BIS and the FCO. While the two departments develop and promote diversity and equal opportunities policies affecting UKTI, we supplement these where necessary with our own policies.
During 2014-15, UKTI appointed a network of senior-level Diversity and Inclusion Champions to promote and support diversity and inclusion initiatives in UKTI. UKTI seeks to ensure that its policies, practices and procedures in relation to staff and customers are compliant with current legislation, and reflect best practice. UKTI also participates in the diversity training and development opportunities available through BIS and the FCO.
The following table reports workforce gender diversity for UKTI and the FCO civil servants working for UKTI. In 2013-14 this data was reported through the annual reports of BIS and the FCO.
Workforce diversity % 2015
Female 50%
Male 50%
Workforce diversity – 2015 Senior Civil Servants %
Female 44%
Male 56%
Our Partners UKTI is working ever more closely with a range of partners across Government to achieve a step change in the UK’s trade and investment performance including:
• Our two parent departments:
– The Department for Business, Innovation and Skills (BIS), which sets the Government’s trade policy agenda, supports UK industry and helps create an attractive UK for investors; and
– The Foreign and Commonwealth Office (FCO) which promotes British interests overseas and supports trade and investment through its commercial diplomacy agenda.
• The UK’s export credit agency, UK Export Finance (UKEF), helps UK exporters and investors do business overseas, principally by providing insurance and guarantees against payment risks.
• Other Government departments, with which we work closely to create the right conditions for economic growth, attracting investment, making it easier to do business in the UK and developing the supply chain for export.
• Our delivery partners in the Devolved Administrations – Scottish Development International, Invest Northern Ireland and the Welsh Government.
• UKTI coordinates the 14 trade envoys, MPs and peers from across the political spectrum, appointed by the Prime Minister. The trade envoys build relationships which help promote trade and investment with specific markets.
UKTI’s partnerships extend beyond Government and we are committed to increasing our impact by working with more partners than ever before, building strategic relationships with business and industry to provide the support business needs to export, and to create the environment for international success. A significant proportion of our delivery has already been outsourced to private sector partners.
UKTI also works with private sector individuals and parliamentarians through the Business Ambassadors Network and Catalyst UK networks. The Business Ambassadors Network consists of key business and academic leaders, who act as advocates for the UK abroad in support of trade and investment, offering expertise and experience. Catalyst UK is made up of business and academic leaders, with the same objective as Business Ambassadors – to act as powerful advocates for UK trade and inward investment abroad.

13 UK Trade & Investment Annual Report and Accounts 2014-15
Through the Overseas Business Network Initiative (OBNI), UKTI is working with Chambers of Commerce and British Business Groups to create a global network of business-led partner organisations, delivering market specific support. This will enable UKTI teams based overseas to focus on the areas where Government can add the most value.
UKTI also works with trusted intermediaries such as banks, lawyers and accounting firms and business organisations such as the Confederation of British Industry, Federation of Small Businesses and Chambers of Commerce to ensure that the best possible support is available to UK companies. UKTI is developing local strategies with Local Enterprise Partnerships and working together with BIS to provide more joined up services through Growth Hubs.
14
Departmental Performance
Despite a challenging international environment, the UK experienced strong economic growth of 2.8 per cent in 2014 (the highest amongst the G7 countries) as a result of increasing investment and employment. The UK continues to be a major player in global foreign direct investment across a number of measures including flows and stocks (now worth over £1 trillion), and ranks as number one in Europe in terms of projects won. In comparison, UK exports have remained flat (reaching £507.7 billion in 2014, 1.6% lower than in 2013). A number of short and long term factors affected exports, including anaemic global demand and the appreciation of sterling. Looking ahead, the Office of Budget Responsibility (OBR) forecasts nominal exports to rise by 4.3% on average annually for the 2015-19 period. The Government is committed to helping UK companies enter new markets overseas and secure high value business.
Key Performance Indicators We measure the impact of our work on the business performance of the exporters and investors we serve. Further details of UKTI key performance indicators are included in Annex A. Annex B includes a technical note which outlines how UKTI monitors and evaluates evidence of performance and impact.
UKTI’s key performance measurement tool is the Performance and Impact Monitoring Survey (PIMS). It is an independent survey of our performance carried out by a leading market research organisation. Annex C contains further details of the key sources of UKTI performance measurement data.
The tables on page 15 show the latest verified results UKTI achieved against our key performance indicators for trade development and inward investment promotion.
15 UK Trade & Investment Annual Report and Accounts 2014-15
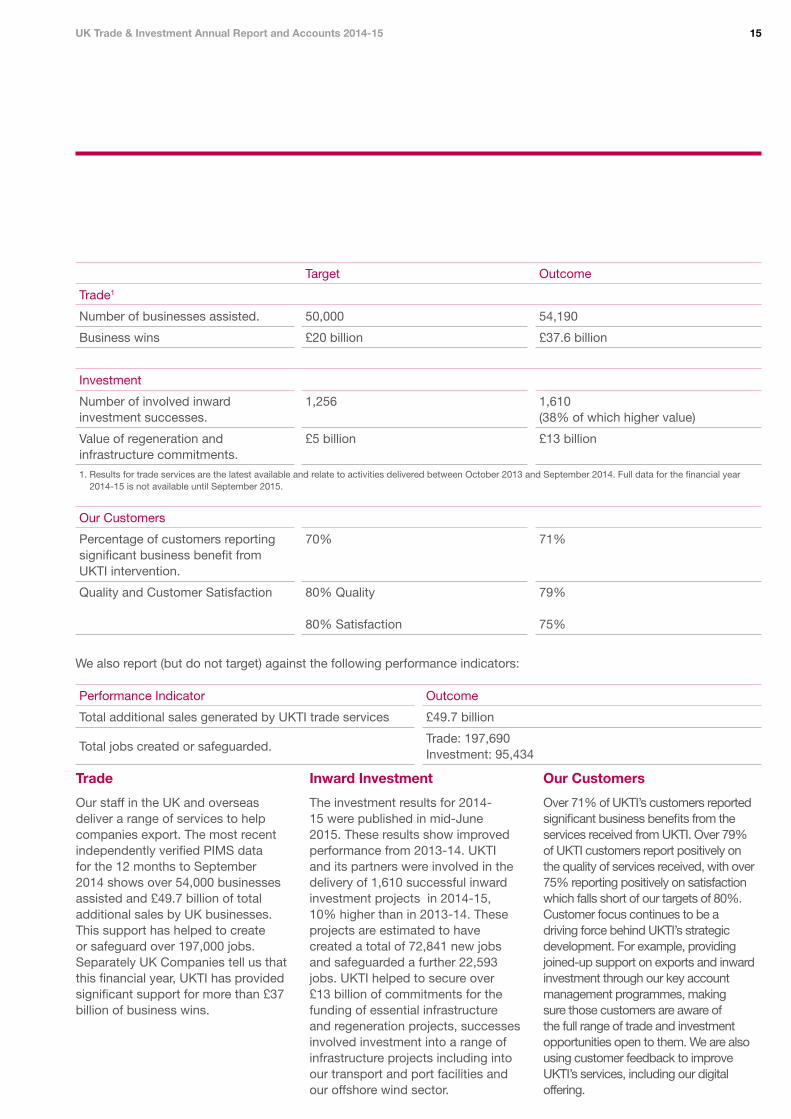
Target Outcome
Trade1
Number of businesses assisted. 50,000 54,190
Business wins £20 billion £37.6 billion
Investment
Number of involved inward investment successes.
1,256 1,610 (38% of which higher value)
Value of regeneration and infrastructure commitments.
£5 billion £13 billion
1. Results for trade services are the latest available and relate to activities delivered between October 2013 and September 2014. Full data for the financial year 2014-15 is not available until September 2015.
Our Customers
Percentage of customers reporting significant business benefit from UKTI intervention.
70%
71%
Quality and Customer Satisfaction
80% Quality
80% Satisfaction
79%
75%
We also report (but do not target) against the following performance indicators:
Performance Indicator Outcome
Total additional sales generated by UKTI trade services £49.7 billion
Total jobs created or safeguarded. Trade: 197,690
Investment: 95,434
Trade
Our staff in the UK and overseas deliver a range of services to help companies export. The most recent independently verified PIMS data for the 12 months to September 2014 shows over 54,000 businesses assisted and £49.7 billion of total additional sales by UK businesses. This support has helped to create or safeguard over 197,000 jobs. Separately UK Companies tell us that this financial year, UKTI has provided significant support for more than £37 billion of business wins.
Inward Investment
The investment results for 201415 were published in mid-June 2015. These results show improved performance from 2013-14. UKTI and its partners were involved in the delivery of 1,610 successful inward investment projects in 2014-15, 10% higher than in 2013-14. These projects are estimated to have created a total of 72,841 new jobs and safeguarded a further 22,593 jobs. UKTI helped to secure over £13 billion of commitments for the funding of essential infrastructure and regeneration projects, successes involved investment into a range of infrastructure projects including into our transport and port facilities and our offshore wind sector.
Our Customers
Over 71% of UKTI’s customers reported significant business benefits from the services received from UKTI. Over 79% of UKTI customers report positively on the quality of services received, with over 75% reporting positively on satisfaction which falls short of our targets of 80%. Customer focus continues to be a driving force behind UKTI’s strategic development. For example, providing joined-up support on exports and inward investment through our key account management programmes, making sure those customers are aware of the full range of trade and investment opportunities open to them. We are also using customer feedback to improve UKTI’s services, including our digital offering.
16
Financial Review
Introduction This financial review records information on the use of resources voted by Parliament directly to UKTI via the Supply Estimates process. Prior year comparatives are provided in brackets. The outturn reported for 2014-15 is not directly comparable to the prior year due to the staff related costs and overheads recharged from BIS and the FCO for the first time this year. These costs were previously reported in the FCO and BIS accounts. The total resources deployed by UKTI are detailed in fig. 5 with prior year comparatives.
UKTI’s total resource DEL budget for 2014-15 was £265.2m (£158.3m). The main factors contributing to the increase to our budgets compared with prior years are:
• £36.2m transferred from BIS budgets and £51.7m transferred from the FCO budgets as part of the move to a single budget for UKTI. UKTI’s total resource DEL budget excluding amounts transferred from BIS and the FCO was £177.3m against a budget of £158.3m in 2013-14. Further details on these changes are provided below.
• £14.5m transferred from Cabinet Office to fund activities under the GREAT campaign. GREAT is the Government’s international marketing campaign to showcase the very best of what Britain has to offer. UKTI undertakes activities under the campaign to support trade development and promotion, and inward investment.
The move to a Single Budget for UKTI In prior years the total resources deployed on UKTI activities were funded from three different sources:
• funds voted directly to UKTI for programme activities;
• BIS funding for BIS employees working for UKTI and the overheads of UKTI headquarters; and
• funding for the FCO employees working for UKTI and the overheads of the UKTI network overseas.
In the 2013 Autumn Statement, HM Treasury announced that UKTI, BIS and the FCO should work towards combining this funding into a single budget for UKTI, under the direct control of the UKTI Accounting Officer. This was designed to improve transparency, accountability and operational efficiency.
2014-15 is a transition year which saw:
• £36.2m transferred from the BIS budget to UKTI to fund the staff costs and the overheads of the UKTI London headquarters.
• £51.7m transferred from the FCO budget to UKTI. This budget largely relates to the staff and associated costs at 101 overseas posts previously ring fenced within the FCO budget.
• Due to the complexity involved the remaining overheads of the UKTI overseas network remain within the FCO budget. These costs are reported in the Annual Report and Accounts of the FCO and are shown in the memorandum notes to these accounts. The budget for these overheads was transferred to UKTI budgets from April 2015.

17 UK Trade & Investment Annual Report and Accounts 2014-15
Fig 1: Summary of Outturn Against Key Control Totals
Actual Voted total Variance Variance £m £m £m %
Resource DEL
o/w Resource DEL programme 250.3 251.1 0.8 0.3
o/w Resource DEL Admin 13.8 14.1 0.3 2
Resource AME 0.0 5.0 5.0 100
Total Net Resource Outturn 264.1 270.2 6.1 2
Capital 1.6 1.7 0.1 6
Net Cash Requirement 243.0 265.7 22.7 9
Resource Departmental Expenditure Limit (DEL) Estimates are the means by which the Government seeks and obtains authority from Parliament for its spending each year. This covers expenditure on specified services for which the Accounting Officer is accountable to Parliament. The Accounts report outturn figures against estimate, as well as other key control figures (Fig 1). Further information on the Supply Estimate is available at: www.gov.uk
In 2014-15, UKTI’s net resource outturn, which is equal to UKTI’s Net Operating Cost, was £264.1m (£157.2m). This consisted of a net resource DEL underspend of £1.1m (0.4%) against a net resource DEL budget of £265.2m (£163.4m). At the beginning of 2014-15, the targets relating to the provision of ‘Overseas Market Introduction Service’ were removed as a key performance indicator for business units. The decision was taken to allow the organisation to focus on core service provision and delivery of key business objectives.
This resulted in a larger than budgeted fall in the generation of income which resulted in some trade activity, such as trade events, being scaled down during the year.
Fig 2: Reconciliation of Resource Expenditure between Estimates, Accounts and Budgets
2014-15 2013-14 £m £m
Net Resource Outturn (Estimates) 264.1 157.2
Total Resource Outturn (Budget) 264.1 157.2
Of which:
Departmental Expenditure Limits (DEL) 264.1 156.8
Annually Managed Expenditure (AME) 0.0 0.4
Net Operating Cost (Accounts) 264.1 157.2

18
Resource DEL Administration In 2014-15 UKTI’s administration budget increased to £14.1m (£2m) as a result of the transfer of BIS budgets for UKTI overheads. As set out by HM Treasury, UKTI classifies all expenditure relating to individually identified operating units within the Chief Operating Office Group in UKTI as administration expenditure. All expenditure by other business groups is classified as frontline and therefore programme expenditure.
Resource DEL Programme Fig 3: Table of UKTI Major Programme Expenditure (2013-14 to 2014-15)
2014-15 £m
2013-14 £m
Trade Development which includes: 199.7 110.2
Regional Trade Support 44.2 39.7
High Value Opportunities & Sector Campaigns 27.8 26.0
Trade Events & Missions 5.9 11.2
Tradeshow Access 11.0 16.2
Marketing and Publicity 1.5 3.7
GREAT Campaign 19.9 11.7
Defence and Security Export Services 1.5 2.0
Overseas Business Network 16.0 4.7
Milan Expo 6.9
UKTI Delivery Overseas 46.1
Programme Related Staff Costs 27.2
Other Programme Costs 6.4 11.3
Income (14.7) (16.3)
Inward Investment which includes: 50.6 45.7
Delivery of Foreign Direct Investment 17.8 18.1
Investment Organisations 14.4 11.9
High Potential Markets 3.7 5.7
Other Foreign Direct Investment Expenditure 14.7 10.0
19 UK Trade & Investment Annual Report and Accounts 2014-15
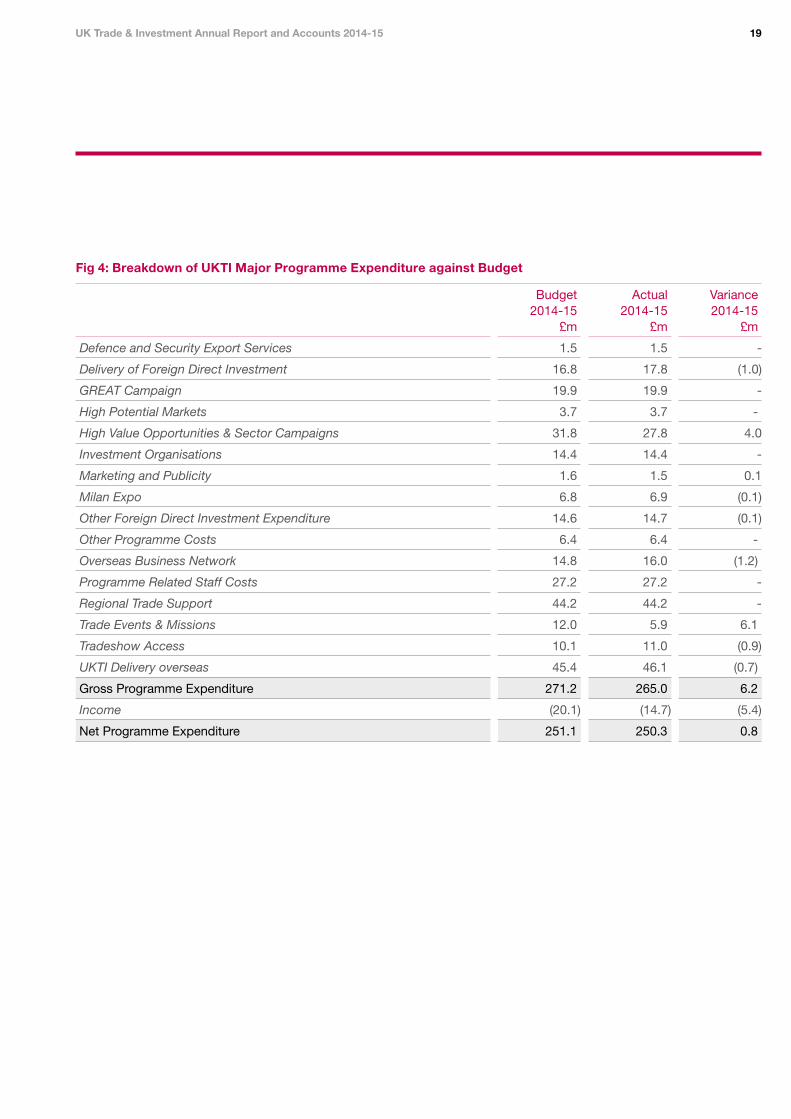
Fig 4: Breakdown of UKTI Major Programme Expenditure against Budget
Budget Actual Variance 2014-15 2014-15 2014-15
£m £m £m
Defence and Security Export Services 1.5 1.5
Delivery of Foreign Direct Investment 16.8 17.8 (1.0)
GREAT Campaign 19.9 19.9
High Potential Markets 3.7 3.7
High Value Opportunities & Sector Campaigns 31.8 27.8 4.0
Investment Organisations 14.4 14.4
Marketing and Publicity 1.6 1.5 0.1
Milan Expo 6.8 6.9 (0.1)
Other Foreign Direct Investment Expenditure 14.6 14.7 (0.1)
Other Programme Costs 6.4 6.4
Overseas Business Network 14.8 16.0 (1.2)
Programme Related Staff Costs 27.2 27.2
Regional Trade Support 44.2 44.2
Trade Events & Missions 12.0 5.9 6.1
Tradeshow Access 10.1 11.0 (0.9)
UKTI Delivery overseas 45.4 46.1 (0.7)
Gross Programme Expenditure 271.2 265.0 6.2
Income (20.1)
251.1
(14.7) (5.4)
Net Programme Expenditure 250.3 0.8

20
Trade Support £46.1m was spent on delivering UKTI services through UKTI posts overseas, including the direct costs of employing UK civil servants and locally employed workers. These costs were previously recognised against the budgets of the FCO. As part of the new single budget arrangements they were recharged to UKTI for the first time in 2014-15. The budget was £45.4m.
£44.2m (£39.7m) was spent on funding private-sector delivered, customer-facing activity (International Trade Teams) delivering international trade support in the English Regions, including the passport to export programme. The budget was £44.2m.
£27.8m (£26m) was spent on the High Value Opportunities Programme, which helps UK companies access the highest value overseas opportunities overseas; the budget was £31.8m.
£27.2m was spent on programme related staff costs, the significant increase from 2013-14 was due to the UKTI single budget reform as these costs were transferred from BIS at the beginning of 2014-15. The budget was £27.2m.
£19.9m (£11.7m) was spent on GREAT Campaign activities, promoting UK Trade around the world. A further £1.5m (£3.7m) was spent on other marketing and publicity. The budget for the year for both these elements was £21.5m.
£16.0m (£4.7m) was spent on outsourcing the delivery of UKTI services to overseas bodies. The budget was £14.8m. In 2013-14 the programme was in its pilot phase, in 2014-15 the programme expanded into 41 markets.
£11m (£16.1m) was spent on the Trade Access Programme, assisting British business access foreign markets through attendance at trade events overseas. The budget for this was £10.1m.
A further £5.9m (£11.2m) was spent on the holding of trade events promoting UK companies overseas, the budget was £12m.
£6.9m was spent on the delivery of the UK Pavilion at the Milan Expo 2015, designed to showcase UK businesses throughout the duration of the Expo.
£1.5m (£2m) was spent on major defence and security events. The budget for the year was £1.5m.
Inward Investment The increase in expenditure across inward investment programmes is due to a number of programmes, and underlying commercial agreements, being initiated in 2013-14. 2014-15 represented the first year full year of delivery.
£17.8m (£18.1m) was spent on contracted delivery of Foreign Direct Investment services. The budget for the year was £16.8m. £14.4m (£11.9m) was spent on UKTI’s dedicated sector-focused Investment Organisations, the budget for the year was £14.4m. A further £3.7m (£5.7m) was focused at high priority markets for investment. £14.7m (£9.9m) was spent on other inward investment programmes. The budget for the year was £14.6m.
Income Received
£15.0m (£16.3m) of income was received against a budget of £20.1m. The income for 2014-15 largely consists of fees and charges for events, sponsorship income, OMIS income and £6m received from BIS to support trade activities.
Capital Spend
Outturn was £1.6m (£2.5m), compared to a budget of £1.7m. This was spent on developing replacement business critical systems, both customer-facing and internal knowledge-sharing.
Annually Managed Expenditure (AME)
UKTI has an AME budget of £5m to cover potential provisions relating to incentivised contract payments. Outturn was nil due to provisions recognised and utilised in year as disclosed in note 13. Under the HM Treasury Budgeting Guidance for Government Departments the utilisation of a provision is recognised as a debit to DEL budgets and a credit to AME budgets. This was offset by the recognition of a provision relating to the incentivised payment for the main FDI contract which is recognised as a debit to the AME budget.

21 UK Trade & Investment Annual Report and Accounts 2014-15
Fig 5: Summary of Total Resources Consumed and Outputs / Outcomes
The table below summarises the total resources used during 2014-15, with comparators and key outputs/outcomes. Details of the total resources deployed by UKTI can be found in the Memorandum Notes on pages 68 to 71.
2014-15
Resource £m
2013-14
Outputs/Outcomes Objective Resource £m Outputs/Outcomes
To enhance the UKTI 189.5 54,190 business assists UKTI 111.6 34,820 business assists
£51.8bn additional sales for UK business
£16.3m income
1,462 inward investment
competitiveness of companies in the UK through overseas trade and investments
To attract a continuing
FCO
UKTI
61.1
250.6
74.6
£49.7bn additional sales for UK business
£15.0m income
1,610 inward investment
BIS
FCO
UKTI
28.2
139.6
279.4
45.6 high level of quality foreign direct investment
decisions
72,841 new jobs created BIS 11.5
decisions
41,558 new jobs created
Total
FCO 29.3
103.9
354.5
22,593 jobs safeguarded FCO 30.4
87.5
366.9
54,327 jobs safeguarded
Dominic Jermey CVO OBE Accounting Officer
25 June 2015

22
Public Interest
Basis of accounts and resources deployed
The accounts on pages 43 to 67 show UKTI’s voted resource only. They have been prepared in accordance with directions given by HM Treasury in pursuance of Section 5(2) of the Government Resources and Accounts Act 2000.
To arrive at the total resources used, the resources expended by the FCO must also be added to UKTI’s voted resource. These have been included by way of Memorandum Notes providing an estimate of the total resources used by UKTI to deliver its activity – see pages 68 to 71 for further details. From 2015-16, all direct overheads currently voted to the FCO will be voted directly to UKTI and reported in UKTI’s accounts.
Going Concern
In common with other Government Departments, the future financing of UKTI’s liabilities is to be met by future grants of supply and the application of future income, both of which are approved by Parliament on an annual basis. There is no reason to believe that future approvals will not be forthcoming and therefore it is considered appropriate to adopt a going concern basis for the preparation of these financial statements.
Transparency Reporting
In accordance with Government policy, UKTI publishes all payment transactions on the Government website: www.gov.uk
Payment of Suppliers
UKTI’s policy is to comply with the Better Payment Practice Code, which includes the Late Payments of Commercial Debts (Interest) Act 1988.
In accordance with Government policy, UKTI endeavours to pay all invoices within five days. The five days allows for three days to process the invoice and a further two days for the payment to be received by the supplier. During 2014-15 79% ( 77%, 2013-14) of invoices were paid within five days.
Charging Policy
UKTI provides services for which it charges fees such as OMIS and events. Any such fees are set to comply with the cost allocation and charging requirements set out in HM Treasury guidance.
Whistleblowing Policy
The Civil Service Code (CSC) requires Government Departments to set out arrangements for staff to be able to raise any concern where they believe they, or others, are being asked to do something that contravenes the CS code or is inappropriate in some way. Please see the Government website for further details of the code: www.gov.uk
UKTI has a clear whistleblowing policy which is regularly reviewed and updated as and when required, to maintain compliance with best practice. The policy supports the need to operate in an environment of openness to enable our people to speak freely and raise legitimate and serious concerns without fear of reprisal or victimisation, provided that they do so lawfully, without malice and in the public interest. The policy is reviewed regularly by the Audit Committee and the policy has been placed on UKTI’s intranet. This guidance is in addition to that of our parent departments (BIS and the FCO) and reflects the fact that UKTI is not an employer in its own right (staff are drawn from both departments).

23 UK Trade & Investment Annual Report and Accounts 2014-15
Auditors
These financial statements have been audited, under the Government Resources and Accounts Act 2000, by the Comptroller & Auditor General (C&AG), who is appointed under statute and reports to Parliament. The audit opinion is on pages 41 to 42. The notional cost to UKTI of the external audit of its resource account by the NAO for the C&AG was £115k (£66k). The increase in this fee is due to the increased funding reported in UKTI’s accounts because of the move to a single UKTI budget. This is disclosed as administration costs in note 4 to the accounts.
Health and Safety
UKTI follows the Health and Safety policies of its parent Departments, BIS and the FCO. Further details can be found in their respective annual reports. UKTI is committed to working with our parent departments to ensure a safe working environment.
Disclosure of Audit Information
As far as the Accounting Officer is aware, there is no relevant audit information of which the entity’s auditors are unaware. The Accounting Officer has taken all the steps that he ought to have taken to make himself aware of any relevant audit information and to establish that the entity’s auditors are aware of that information.
Complaints to the Departments and Parliamentary Ombudsman
During the year, UKTI received no complaints that went to the Parliamentary Ombudsman. UKTI is committed to providing a high quality, accessible and responsive service to businesses and the community, and takes all of its few complaints very seriously. UKTI gives all staff advice on how to deal with complaints, in line with Cabinet Office guidance and the Freedom of Information Act. Complaints are handled by our parent departments, BIS and the FCO. For further details, please contact the:
• BIS Enquiry Unit on +44 (0)20 7215 5000 or email [email protected]. gov.uk
• The FCO at King Charles Street, London SW1A 2AH
Off-Payroll Engagements
HM Treasury requires all departments to publish details of off-payroll engagements, as the use of off-payroll arrangements for permanent employees generates suspicions of tax avoidance, places value for money at risk, and fails to meet the standards expected of public officials.
A summary of the UKTI tax assurance data is available at: www.gov.uk/ukti
Communications to Staff
UKTI has a range of channels for communicating with staff, including a regular email bulletin, extranet, magazine and team briefings. These are regularly reviewed to ensure that they meet staff and management needs. Regular all-staff events provide an opportunity for staff to hear from and question the Executive Team, encouraging two-way communications across the UKTI network.
Sustainability
UKTI does not have its own sustainability strategy, but rather follows those of its parent departments. Further details can be found in their respective reports.
Dominic Jermey CVO OBE Accounting Officer
25 June 2015
24 UK Trade & Investment Annual Report and Accounts 2014-15
Departmental Remuneration Report
Introduction
UKTI is not an employer in its own right therefore we do not have a Remuneration Committee. Staff working for UKTI are drawn from UKTI’s parent departments, BIS and the FCO who have their own Remuneration Committees. Staff costs are reported under Note 3 to the accounts on page 56.
Remuneration Policy
The remuneration of Senior Civil Servants is set by the Prime Minister, following independent advice from the Senior Salaries Review Body (SSRB).
The Review Body also periodically advises the Prime Minister on the pay and pensions of Members of Parliament and their allowances; on Peers’ allowances and on the pay, pensions and allowances of Ministers and others whose pay is determined by the Ministerial and Other Salaries Act 1975.
In reaching its recommendations, the Review Body was required to have regard to the following considerations;
• the need to recruit, retain and motivate suitably able and qualified people to exercise their different responsibilities;
• regional/local variations in labour markets and their effects on the recruitment and retention of staff;
• Government policies for improving public services, including the requirement on departments to meet the output targets for the delivery of departmental services;
• the funds available to Departments as set out in the Government’s departmental expenditure limits; and
• the Government’s inflation target.
The Review Body takes account of the evidence it receives about wider economic considerations and the affordability of its recommendations. Further information about the work of the Review Body can be found on the Government website: www.gov.uk
Senior Official Appointments
The Chief Executive of UKTI is appointed by the Prime Minister on the recommendation of the Head of the Home Civil Service and with the agreement of the Ministerial Heads of the two parent Departments.
The Constitutional Reform and Governance Act 2010 requires Civil Service appointments to be made on merit, on the basis of fair and open competition. The Recruitment Principles published by the Civil Service Commission specify the circumstances when appointments may be made otherwise.
Unless otherwise stated below, the officials covered by this report hold appointments which are open-ended. Early termination, other than for misconduct, would result in the individual receiving compensation, as set out in the Civil Service Compensation Scheme.
Further information about the work of the Civil Service Commission can be found at: (www. civilservicecommission.org.uk).
• Michael Boyd was appointed on a three-year contract commencing 1 July 2012. This contract has been extended for a further year. The notice period for the employee is three months. For the employer, the notice period is six months or a period, if less, equal to the unexpired part of the fixed-term contract.

25 UK Trade & Investment Annual Report and Accounts 2014-15
Remuneration Report
The following sections provide details of the remuneration and pension interests of the Ministers and most senior management of the Department.
Salary
‘Salary’ includes gross salary; overtime; reserved rights to London weighting or London allowances; recruitment and retention allowances; private office allowances and any other allowance to the extent that it is subject to UK taxation.
This report is based on accrued payments made by the Department and thus recorded in these accounts.
Benefits in Kind
The monetary value of benefits in kind covers any benefits provided by the Department and treated by HM Revenue and Customs as a taxable emolument.
Bonuses
Bonuses are based on performance levels attained and are made as part of the appraisal process. Bonuses relate to the performance in the year in which they become payable to the individual. The bonuses reported in 2014-15 relate to performance in 2013-14, and the comparative bonuses reported for 2013-14 relate to the performance in 2012-13.
Pay multiples
Reporting bodies are required to disclose the relationship between the remuneration of the highest-paid director in their organisation and the median remuneration of the organisation’s workforce.
The banded annualised remuneration of the highest-paid director in UKTI in the financial year 2014-15 was £180,000 – 185,000. This was 5 times the median remuneration of the FCO and BIS civil servants recharged to UKTI. The median remuneration was £36,366. Prior year figures are included in the pay multiple calculations disclosed in the FCO and BIS accounts for 2013-14. In 2014-15, no employee received remuneration in excess of the highest-paid director.
Total remuneration includes salary, non-consolidated performance-related pay and benefits-in-kind. It does not include severance payments, employer pension contributions and the cash equivalent transfer value of pensions.The median remuneration is calculated based on the average annual salary at each grade.
Ministerial Salary and Pension Benefit
The Minister elected not to draw a Ministerial salary or receive any pension benefits.

26
Ministers’ salaries, allowances and taxable benefits in kind in 2014-15 were as follows:
2014-15 2013-14
Benefits in Benefits in kind kind
Salary (to nearest Salary (to nearest Ministers £000 £100) £000 £100)
Lord Livingston of Parkhead – – – –
This table has been subject to audit.
Ministers’ pension and benefits entitlements in 2014-15 were as follows:
Accrued pension at Real increase Real
age 65 as at in pension at CETV at CETV at increase in 31/03/15 age 65 31/03/15 31/03/14 CETV
Ministers £000 £000 £000 £000 £000
Lord Livingston of Parkhead
This table has been subject to audi
–
t.
– – – –

27 UK Trade & Investment Annual Report and Accounts 2014-15
Remuneration Report – Senior Officials
Senior Officials’ (the Executive Team) salaries, allowances and taxable benefits in kind in 2014-15 were as follows (for those officials who only worked for part of the year, full time equivalent figures can be found in brackets):
2014-15 2013-14
Salary £000
Bonus Payments
£000
Pension Benefits
£000
Total Remuneration
£000 Salary £000
Bonus Payments
£000
Pension Benefits
£000
Total Remuneration
£000
Dominic Jermey CVO
OBE (from 9 June 2014)
85-90 (105110)
– 82 170-175 – – – –
Jane Owen (from 18 Aug 2014)
50-55 (85-90)
– 78 130-135 – – – –
Michael Boyd 135-140 – – 135-140 135-140 – – 135-140
Nick Archer 85-90 – 95 180-185 15-20 (85-90)
– – 15-20
Iain Banfield (from 26 April 2014)
60-65 (65- 70)
– 26 85-90 – – – –
Nicola Bolton (from 3 Oct 2014)
50-55 (95-100)
– 18 70-75 – – – –
Stephen Phipson (from
2 Mar 2015)
5-10 (120125)
– 3 10-15 – – – –
Sir Richard Paniguian CBE (to 31 Jan 2015)
140-145 (170175)
10-15 67 220-225 170-175 10-15 62 245-250
Crispin Simon1
(to 2 Oct 2014) 65-70 (135140)
10-15 – 80-85 135-140 10-15 – 145-150
Jon Harding (to 1 Sept 2014)
55-60 (140145)
– 44 100-105 140-145 – 20 160-165
Sandra Rogers (to 30 Nov 2014)
100-105 (135140)
– 26 125-130 135-140 – 20 150-155
Charu Gorasia (to 25 April 2014)
5-10 (70-75)
– 9 15-20 70-75 5-10 20 100-105
David Godfrey Paid by UKEF. Please refer to UKEF’s accounts for full details.
This table has been subject to audit. 1. Acting Chief Executive from 16 December 2013 to 8 June 2014.
28
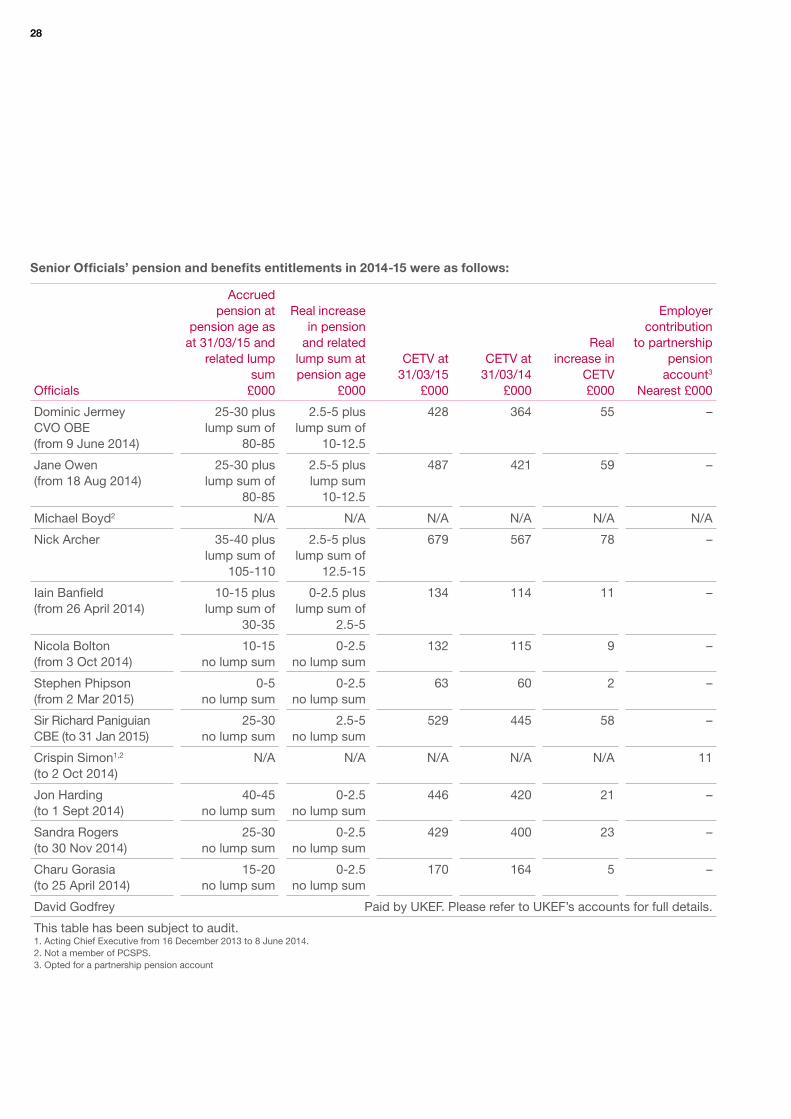
Senior Officials’ pension and benefits entitlements in 2014-15 were as follows:
Officials
Accrued pension at
pension age as at 31/03/15 and
related lump sum
£000
Real increase in pension
and related lump sum at pension age
£000
CETV at 31/03/15
£000
CETV at 31/03/14
£000
Real increase in
CETV £000
Employer contribution
to partnership pension
account3
Nearest £000
Dominic Jermey CVO OBE
(from 9 June 2014)
25-30 plus lump sum of
80-85
2.5-5 plus lump sum of
10-12.5
428 364 55 –
Jane Owen (from 18 Aug 2014)
25-30 plus lump sum of
80-85
2.5-5 plus lump sum
10-12.5
487 421 59 –
Michael Boyd2 N/A N/A N/A N/A N/A N/A
Nick Archer 35-40 plus lump sum of
105-110
2.5-5 plus lump sum of
12.5-15
679 567 78 –
Iain Banfield (from 26 April 2014)
10-15 plus lump sum of
30-35
0-2.5 plus lump sum of
2.5-5
134 114 11 –
Nicola Bolton (from 3 Oct 2014)
10-15 no lump sum
0-2.5 no lump sum
132 115 9 –
Stephen Phipson (from 2 Mar 2015)
0-5 no lump sum
0-2.5 no lump sum
63 60 2 –
Sir Richard Paniguian CBE (to 31 Jan 2015)
25-30 no lump sum
2.5-5 no lump sum
529 445 58 –
Crispin Simon1,2
(to 2 Oct 2014) N/A N/A N/A N/A N/A 11
Jon Harding (to 1 Sept 2014)
40-45 no lump sum
0-2.5 no lump sum
446 420 21 –
Sandra Rogers (to 30 Nov 2014)
25-30 no lump sum
0-2.5 no lump sum
429 400 23 –
Charu Gorasia (to 25 April 2014)
15-20 no lump sum
0-2.5 no lump sum
170 164 5 –
David Godfrey Paid by UKEF. Please refer to UKEF’s accounts for full details.
This table has been subject to audit. 1. Acting Chief Executive from 16 December 2013 to 8 June 2014. 2. Not a member of PCSPS. 3. Opted for a partnership pension account

29 UK Trade & Investment Annual Report and Accounts 2014-15
Fees Paid by UKTI to Non-Executive Board Members
Below are the annual fees plus expenses paid to the Non-Executive Board Members of UKTI. The total payments for the year to each person were in the following ranges:
2014-15 2013-14 Name £000 £000 Note
Sir Eric Peacock CMG DL 0-5 0-5 Expenses of £0-5k are included (to 30 Sept 2014)
Expenses of £0-5k (£0-5k) are included Alan Jenkins 0-5 0-5
Chris Fitzpatrick 0-5 5-10 Expenses of £0-5k (£0-5k) are included (to 30 Sept 2014)
Expenses of £0-5k are included Mark Gostick 0-5 0-5 (to 30 Sept 2014)
Expenses of £0-5k are included Alex Dorrian CBE 0-5 0-5 (to 30 Sept 2014)
Expenses of £0-5k (£0-5k) are included Dale Murray CBE 0-5 0-5
Jan Ward CBE 0-5 5-10 Expenses of £0-5k are included (to 30 Sept 2014)
Fees are paid by UKEF. Amounts paid can be Guy Beringer
Amin Mawji OBE
found in the accounts of UKEF.
Fees are paid by UKEF. Amounts paid can be
This table has been subject to audit.
found in the accounts of UKEF.
Civil Service Pensions
Pension benefits are provided through the Civil Service pension arrangements. From 30 July 2007, civil servants may be in one of four defined benefit schemes: either a final salary scheme (classic, premium or classic plus); or a whole career scheme (nuvos). These statutory arrangements are unfunded with the cost of benefits met by monies voted by Parliament each year. Pensions payable under classic, premium, classic plus and nuvos are increased annually in line with Pensions Increase legislation. Members joining from October 2002 may opt for either the appropriate defined benefit arrangement or a ‘money purchase’ stakeholder pension with an employer contribution (partnership pension account).
Employee contributions are salary-related and range between 1.5% and 6.85% of pensionable earnings for classic and 3.5% and 8.85% for premium, classic plus and nuvos. Benefits in classic accrue at the rate of 1/80th of final pensionable earnings for each year of service. In addition, a lump sum equivalent to three years initial pension is payable on retirement. For premium, benefits accrue at the rate of 1/60th of final pensionable earnings for each year of service. Unlike classic, there is no automatic lump sum. Classic plus is essentially a hybrid with benefits for service before 1 October 2002 calculated broadly as per classic and benefits for service from October 2002 worked out as in premium. In nuvos a member builds up a pension based on his pensionable earnings during their period of scheme membership. At the end of the scheme year (31 March) the member’s earned pension account is credited with 2.3% of their pensionable earnings in that scheme year and the accrued pension is uprated in line with Pensions Increase legislation. In all cases members may opt to give up (commute) pension for a lump sum up to the limits set by the Finance Act 2004.
30
The partnership pension account is a stakeholder pension arrangement. The employer makes a basic contribution of between 3% and 12.5% (depending on the age of the member) into a stakeholder pension product chosen by the employee from a panel of providers. The employee does not have to contribute, but where they do make contributions, the employer will match these up to a limit of 3% of pensionable salary (in addition to the employer’s basic contribution). Employers also contribute a further 0.8% of pensionable salary to cover the cost of centrally-provided risk benefit cover (death in service and ill health retirement).
The accrued pension quoted is the pension the member is entitled to receive when they reach pension age, or immediately on ceasing to be an active member of the scheme if they are already at or over pension age. Pension age is 60 for members of classic, premium and classic plus and 65 for members of nuvos.
Further details about the Civil Service pension arrangements can be found at the website: www. civilservicepensionscheme.org.uk.
New Career Average pension arrangements were introduced from 1 April 2015 and the majority of classic, premium, classic plus and nuvos members have now moved to the new scheme. Further details of this new scheme are available at: www. civilservicepensionscheme.org.uk/ members/the-new-pension-schemealpha.
Cash Equivalent Transfer Values
A Cash Equivalent Transfer Value (CETV) is the actuarially assessed capitalised value of the pension scheme benefits accrued by a member at a particular point in time. The benefits valued are the member’s accrued benefits and any contingent spouse’s pension payable from the scheme. A CETV is a payment made by a pension scheme or arrangement to secure pension benefits in another pension scheme or arrangement when the member leaves a scheme and chooses to transfer the benefits accrued in their former scheme. The pension figures shown relate to the benefits that the individual has accrued as a consequence of their total membership of the pension scheme, not just their service in a senior capacity to which disclosure applies.
The figures include the value of any pension benefit in another scheme or arrangement which the member has transferred to the Civil Service pension arrangements. They also include any additional pension benefit accrued to the member as a result of their buying additional pension benefits at their own cost. CETVs are worked out in accordance with The Occupational Pension Schemes (Transfer Values) (Amendment) Regulations 2008 and do not take account of any actual or potential reduction to benefits resulting from Lifetime Allowance Tax which may be due when pension benefits are taken.
Real increase in CETV
This reflects the increase in CETV that is funded by the employer. It does not include the increase in accrued pension due to inflation, contributions paid by the employee (including the value of any benefits transferred from another pension scheme or arrangement) and uses common market valuation factors for the start and end of the period.
Compensation for loss of office
One senior official left under voluntary exit terms on 30 November 2014. They received a compensation payment between the band of £25,000 - £30,000.
Redundancy and other departure costs have been paid in accordance with the provision of the Civil Service Compensation Scheme, a statutory scheme made under the Superannuation Act 1972. Exit costs are accounted for in full in the year of departure. The costs were paid by BIS. All exit packages were voluntary.
Dominic Jermey CVO OBE Accounting Officer
25 June 2015

31 UK Trade & Investment Annual Report and Accounts 2014-15
Statement of Accounting Officer’sResponsibilities Under the Government Resources and Accounts Act 2000, HM Treasury has directed UKTI to prepare for each financial year resource accounts detailing the resources acquired, used, held or disposed of by the Department during the year and the use of resource by the Department during the year. The accounts are prepared on an accruals basis, and must give a true and fair view of the state of affairs of UKTI, and of its net resource outturn, application of resources, changes in taxpayers’ equity, and cash flows for the financial year.
In preparing the accounts, the Accounting Officer is required to comply with the requirements of the Government Financial Reporting Manual, and in particular to:
• observe the Accounts Direction issued by HM Treasury, including the relevant accounting and disclosure requirements, and apply suitable accounting policies on a consistent basis;
• make judgements and estimates on a reasonable basis;
• state whether applicable accounting standards as set out in the Government Financial Reporting Manual have been followed, and disclose and explain any material departures in the Accounts; and
• prepare the Accounts on a going concern basis.
HM Treasury has appointed the Chief Executive as Accounting Officer of UKTI. The responsibilities of an Accounting Officer, including responsibility for the propriety and regularity of the public finances for which the Accounting Officer is answerable, for keeping proper records and for safeguarding UKTI’s assets, are set out in Managing Public Money published by HM Treasury.
Dominic Jermey CVO OBE Accounting Officer
25 June 2015

32
UKTI Annual Governance Statement 2014-15 1. Purpose of the Governance Statement The aim of the Governance Statement is to explain how we have followed the principles of the Corporate Governance Code for Central Government Departments. UKTI, as a Non-Ministerial Public Department, is not bound by the code, but we follow the principles as best practice.
This statement will supplement the accounts by setting out the governance structure, internal controls and risk management processes that have been operating within UKTI during the financial year. It also reviews the effectiveness of these arrangements, in supporting UKTI to achieve its aims and objectives.
2. Ministers During 2014-15, joint ministerial responsibilities were as follows:
Secretary of State for Foreign and Commonwealth Affairs The Rt Hon William Hague MP (to 14 July 2014)
The Rt Hon Philip Hammond MP (from 15 July 2014)
Secretary of State for Business, Innovation and Skills The Rt Hon Dr Vince Cable MP
Portfolio Responsibility Minister of State for Trade and Investment
Lord Livingston of Parkhead (to 10 May 2015)
The Rt Hon Lord Maude (from 11 May 2015)
Accounting Officer
Crispin Simon (to 8 June 2014)
Dominic Jermey CVO OBE (from 9 June 2014)
3. Governance Structure UKTI’s Corporate Governance Structure
TRADE & INVESTMENT BOARD (formerly UKTI Executive Board)
Operating Committee (to February 2015)
People Committee
ICT Board
UKTI Executive Committee
Audit & Risk Assurance Committee

33 UK Trade & Investment Annual Report and Accounts 2014-15
4. The UKTI Departmental Board This section sets out the membership, role and structure of UKTI’s Departmental Board for the full reporting period. In September 2014, the UKTI Executive Board was replaced by the Trade and Investment Board. The Trade and Investment Board is a joint Board of UKTI and UKEF. Unlike its predecessor it is chaired by the Minister for Trade and Investment. It brings together the work of two key departments in the Minister’s portfolio, ensuring UKTI and UKEF work closer together through the delivery of a shared strategy on Trade and Investment. This section outlines the role and membership of both Boards.
UKTI Executive Board
The role of the UKTI Executive Board was to provide strategic and operational leadership to UKTI. The Board was chaired by the Chief Executive Officer and comprised seven Executive Board Members, seven Non-Executive Board Members and five Representative Board Members.
The Members of the UKTI Executive Board until 30 September 2014 are detailed below.
Chair
Alan Jenkins Non Executive Board Member (to 14 April 2014)
Dominic Jermey CVO OBE Chief Executive Officer (from 9 June 2014)
Executive Members
Jon Harding Chief Operating Officer (to 17 August 2014)
Jane Owen Chief Operating Officer (from 18 August 2014)
Sir Richard Paniguian CBE Head, UKTI Defence & Security Organisation
Crispin Simon Managing Director, Trade
Sandra Rogers Managing Director, Marketing (to 31 July 2014)
Michael Boyd Managing Director, Investment
Nick Archer Managing Director, Policy and Network Development
Charu Gorasia Director of Finance & Information Technology (to 25 April 2014)
Iain Banfield Director of Finance (from 26 April 2014)
Non-Executive Board Members
Sir Eric Peacock CMG DL Alan Jenkins Chris Fitzpatrick Mark Gostick Alex Dorrian CBE Dale Murray CBE Jan Ward CBE
Representative Board Members
BIS and the FCO were represented on the Executive UKTI Board, as parent departments of the organisation. UKTI overseas posts and UKEF were also represented.
BIS representative Philippa Lloyd, BIS Director General People, Communications and Corporate Effectiveness
FCO representative Andrew Mitchell, Director General, Prosperity
UKTI overseas network Danny Lopez, Consul-General New York and Caroline Wilson, Consul General Hong Kong
UKEF Representative David Godfrey, Chief Executive and Accounting Officer, UKEF

34
5. Trade and Investment Board This section sets out the membership, role and structure of the Trade and Investment Board. The first meeting of the Trade and Investment Board was held on 3 November 2014.
For UKTI, the Board provides strategic direction and examines the effective performance of UKTI, offering advice and challenge to the Chief Executive on UKTI’s major programmes.The Trade and Investment Board has responsibility for scrutinising and advising on UKTI’s performance, efficiency, capability and risk. This is done through the review of business planning and regular scrutiny of the UKTI finance, risk and performance dashboard, as well as receiving more detailed updates on specific issues facing UKTI. It also ensures that UKEF and UKTI priorities are aligned. UKTI’s Audit and Risk Assurance Committee supports the Board, scrutinising UKTI’s system of internal control, audit and risk management.
In addition, the role of the Trade and Investment Board is to provide strategic support to the Trade Minister by;
• providing advice on the effectiveness of the Government’s trade and investment strategy;
• aligning and prioritising UKTI’s and UKEF’s strategic objectives and projects; and
• reviewing UKTI’s and UKEF’s business plans so as to ensure that they are co-ordinated and consistent with that strategy and those priorities.
Trade and Investment Board Members
The board is chaired by the Minister of State for Trade and Investment and comprises four Executive Board Members, four Non-Executive Board Members and two Representative Board Members from BIS and the FCO respectively.
Chair
Lord Livingston of Parkhead Minister of State for Trade and Investment
Executive Members
Dominic Jermey CVO OBE UKTI Chief Executive and Accounting Officer
David Godfrey UKEF Chief Executive and Accounting Officer
Michael Boyd UKTI Managing Director, Investment
Iain Banfield UKTI Director of Finance
Non-Executive Board Member
Alan Jenkins Guy Beringer Dale Murray CBE Amin Mawji OBE
BIS representative Bernadette Kelly, Director General, Business and Local Growth
FCO representative Sir Julian King KCVO CMG, Director General Economic and Consular
The biographies of the members of the Trade and Investment Board are available on the Government website: www.gov.uk
Upon appointment, each board member is required to declare any conflicts of interest which are recorded in the Register of Interests. Where a board member raises a potential conflict at meetings, it is recorded in the minutes and the board member absents himself or herself from that item of discussion. Throughout this financial year, board members raised no conflicts of interest.
6. Audit and Risk Assurance Committee The Audit and Risk Assurance Committee (ARAC) is a sub-committee of the Board. Its role is to support the Board and Accounting Officer in monitoring the corporate governance, risk management and control systems in UKTI and to advise on their effectiveness. Amongst other things, this is performed through the review of the work of Internal Audit and also the National Audit Office (NAO).
The ARAC is comprised entirely of independent members, two of whom are Non-Executive Board Members, which provides independent scrutiny.
The committee operates under terms of reference (ToR) which follow best practice as defined in the revised HM Treasury Audit & Risk Assurance Committee Handbook. The Committee’s ToR were reviewed in November 2014.

35 UK Trade & Investment Annual Report and Accounts 2014-15
During 2014-15, the composition of the UKTI ARAC was as follows:
Alan Jenkins (Chair) Non-Executive Board Member
Mark Gostick (to 30 September 2014) Non-Executive Board Member
Amin Mawji OBE (from 30 September 2014) Non-Executive Board Member
Robert Hull Independent Member
Richard Vincent (from 14 May 2014) Independent Member
Chris Jenkins (from 14 May 2014) Independent Member
The following are also invited to meetings:
UKTI Chief Executive Chief Operating Officer (UKTI) UKTI Director of Finance Representatives from BIS and the FCO Representative from Internal Audit (BIS and the FCO) Representatives from the NAO
7. Executive Committee The Executive Committee is chaired by the Chief Executive Officer. The committee operates within terms of reference which define its role as detailed below. It is responsible for supporting the Accounting Officer to deliver UKTI’s strategy and take principal decisions and, with its delegated subcommittees, ensuring the effective management of UKTI through:
• approving the annual business plan and monitoring performance against these plans;
• agreeing the reallocation of resource at fixed points during the year, and approving UKTI advice to Ministers for each Autumn Statement, Budget and Spending review;
• business planning and reporting – providing challenge and advice;
• financial management;
• overseeing UKTI’s capability and skills to deliver its objectives; and
• overseeing and approving operation strategies including Estates and ICT, as advised by its operational committees.
8. Sub-Committees In the last year there have been three sub-committees of the Executive Committee. They were the:
• Operating Committee,
• ICT Board, and
• People Committee.
36
9. Operating Committee This was chaired by the Chief Operating Officer. The membership consisted of Directors from the Business Groups, the Finance Director and the Director of Economics and Evaluation.
The Operating Committee reported to the Executive Committee of UKTI. The committee operated within terms of reference which defined its role as detailed below;
• it was responsible for supporting the implementation of UKTI’s strategy, business plan and targets through the allocation of human and financial resource and;
• financial management; and
• estates and network management.
The Committee was dissolved by the Executive Committee on 26 February 2015, as much of its work was duplicated by the Executive Committee and other sub-committees. The Committee’s remaining functions were distributed to the other subcommittees.
10. ICT Board The ICT Board reports to the Executive Committee. It is responsible for overseeing UKTI’s ICT strategy and ensuring compliance and best practice throughout UKTI. The ICT Board operates within terms of reference which define its role as:
• driving compliance with central initiatives and developing the ICT Strategy;
• approving ICT procurement within an agreed tolerance and approving business cases;
• overseeing all ICT systems for UKTI users in London HQ, the regions and the overseas network; and
• monitoring the performance of UKTI’s ICT infrastructure and applications.
11. People Committee The People Committee reports to the Executive Committee of UKTI and is responsible for providing a review and challenge function in relation to the development of staff capabilities and skills, and effective people management. Its role is to:
• develop leadership and management;
• drive effective performance, embedding high quality appraisal and support;
• focus on talent management and development, monitoring impact and embedding a culture of continuous improvement;
• engage staff below the executive team more actively into wider policy development and decision-making; and
• promote excellent people management throughout UKTI and escalate areas of concern to Executive Committee as appropriate.
12. Attendance at Board, Audit and Risk Assurance Committee and Executive Committee meetings There were four Board Meetings and five ARAC meetings held during the year. Attendance by members was as follows: Executive Board – 67 percent; Trade and Investment Board – 81 percent; Audit and Risk Assurance Committee – 100 percent; and Executive Committee – 89 percent.
37 UK Trade & Investment Annual Report and Accounts 2014-15
13. Internal Audit During the year, the ARAC considered 9 internal audit reports; 8 overseas and 1 UK-Based. There were an additional three UK-Based advisory assignments undertaken in the year. These reports covered a range of risk management and governance. The opinion given on the overall adequacy and effectiveness of UKTI’s framework of risk management, control and governance was ‘moderate’. Under the new classification introduced by the Government Internal Audit Service in 2014-15 the ‘moderate’ rating is the standard rating applied to organisations considered to be well-run. Internal Audit consider that the systems of internal control, governance and risk management that operated in UKTI during 2014-15 were generally effective and supported the achievement of the organisation’s objectives.
14. The Move to a Single UKTI Budget In prior years the total resources deployed on UKTI activities included the funds voted directly to UKTI for programme activities and funds voted to BIS and the FCO for UKTI staff and overheads. In the 2013 Autumn Statement HM Treasury set out that UKTI, BIS and the FCO should work towards a single budget for UKTI, under the direct control of the UKTI Accounting Officer.
In 2014-15 the funds for the overheads of UKTI previously included in BIS budgets were voted directly to UKTI. Due to the complexity involved, 2014-15 was a transition year for the FCO budgets in which the funds for UK based staff costs and the direct overheads of overseas posts previously ring-fenced within the FCO budgets were transferred to UKTI. The overheads of the overseas network relating to posts not previously ring-fenced within the FCO budgets and the indirect overheads of the overseas platform remain within the FCO budgets. In the next financial year, these overheads will also be transferred to UKTI budgets. From April 2015, UKTI has a single budget voted by Parliament directly to UKTI’s Chief Executive. This will bring a number of benefits including:
• clear accountability to Parliament for all UKTI expenditure through the UKTI Chief Executive;
• the ability to mobilise resources quickly and respond to commercial opportunities; and
• much clearer public transparency around the costs and performance of the organisation.
A project plan and team is in place to ensure UKTI financial management and governance is appropriate to ensure effective stewardship of the single UKTI budget. In addition UKTI is implementing a training plan and communications plan to enable overseas teams to effectively manage their new budgets. An additional meeting of the UKTI ARAC was held in September 2014 to review progress made. This was in addition to the regular updates received at its other meetings.
15. Risk Management UKTI is committed to high standards of governance, ensuring that a robust system of risk management is implemented throughout the organisation. UKTI’s Risk Management Framework, published in 2012, sets out the means by which risks are identified, managed and mitigated including how to assess risk appetite.
UKTI refreshed its approach to performance and risk management in 2014-15, building on the Risk Management Framework, to further improve the quality of information on risks collected and discussed. Risks continue to be identified and managed at the operational level in the first instance and a traffic light system is used to assess the status of each risk based upon its probability and impact and the assessment of risk appetite. The UKTI Strategy Team also provides support and challenge on the risks, RAG ratings and mitigations that the Business Groups identify in their Group risk registers.
Engagement on risks has been extended across UKTI, to teams overseas and in the English regions, and media scanning and engagement with Whitehall colleagues improves the likelihood that external and crosscutting risks are also captured and managed effectively.

38
The chart below sets out the process by which UKTI assesses and manages risk. Groups regularly review their own risk registers, issues logs and performance dashboards. Key projects and procurements have their own, more detailed risk registers and summary information is reflected in those Group risk registers. The UKTI Commercial Unit advises on contract risks and has created contract management guidance to ensure consistent management of contracts, to reduce further risks across UKTI.
The top risks for UKTI are escalated from Group Risk Registers to the UKTI Risk Register, alongside the cross-cutting risks identified by the UKTI Strategy Team. Those risks materialising into live issues are tracked, managed and resolved on a UKTI Issues Log. The UKTI Performance Dashboard is dedicated to those projects and contracts which are critical to achieving UKTI’s business objectives.
The UKTI Risk Register, Issues Log and Performance Dashboard are reviewed monthly by the UKTI Executive Committee as well as at each meeting of the Trade and Investment Board. Both bodies help to verify that UKTI is managing those critical, strategic risks with the potential to have greatest impact on performance. The UKTI Audit and Risk Assurance Committee reviews the risk register regularly and provides challenge to UKTI management in order to advise the UKTI Accounting Officer and Board on whether risks are correctly identified and mitigated.
-
- -
Application of UKTI’s Risk Management Policy
UKTI Group Dashboards Cross cutting and external
UKTI Risk Register UKTI Issues Log UKTI Performance
Dashboard
UKTI Trade and Investment Board
UKTI Audit and Risk Assurance Committee
UKTI Executive Committee
Advises on the adequacy of risk management
processes
Scrutiny, support and Challenge UKTI Strategy Team
risks and issues and Risk Registers
UKTI Trade and Investment Board and UKTI Executive Committee
review and discuss management of top risks and issues and
identify risks and issues
Risk Owners identify, assess, address and record risks and risk
appetite on an on going basis via Group Risk Registers, in conjunction with monitoring
progress against the objectives of business plans
UKTI Risk Register consolidated monthly (except in exceptional
circumstances)
UKTI Strategy Team engage across UKTI and outside to
gather cross cutting and external risks and issues

39 UK Trade & Investment Annual Report and Accounts 2014-15
16. UKTI’s Significant Risks 2014-15 and Key Mitigating Factors Priorities
The risks impacting on UKTI’s ability to deliver its objectives are sometimes those outside UKTI’s control, reflecting conditions in the global marketplace. Global growth trends, conflicts overseas, and fluctuations in exchange rates and commodity prices, all impact on the demand for and value of UK exports and potentially affect the supply of investors seeking to locate in the UK. In order to mitigate these risks, UKTI has continued to build success in established markets as well as seeking new ones, both for exports and inward investment. As well as focusing on high growth manufacturing and service sectors in which the UK has a comparative advantage, UKTI has sought supply chain opportunities across a broad range of sectors and continued to build its relationship and account management programmes with inward investors and exporters. UKTI also continues to seek best value returns on the UK’s participation in high profile events like the Commonwealth Games, the GREAT Festival in Shanghai and the Milan Expo which provide opportunities to showcase the UK’s trade and investment strengths in the global marketplace.
UKTI is continuously monitoring its budgets and income to ensure that it can deliver on business objectives. Difficult choices sometimes need to be made and reprioritisation and efficiency savings are likely to remain important activities going forward into the next Parliament. The risk is that customers and stakeholders do not understand the basis for changes made and UKTI’s ability to influence
them in order to achieve Government’s objectives on trade and investment is reduced. In order to mitigate these risks, all changes which impact on frontline delivery are supported by plans to communicate and engage with customers and stakeholders.
Partnerships
UKTI relies on excellent partnership working to deliver its objectives. This brings opportunities but also risks. Outsourced contracts with the private sector enable UKTI to secure the specialist expertise needed to achieve its objectives. There is a risk that UKTI staff may lack the skills to ensure effectiveness in procurement and effective implementation and management of contracts, therefore failing to achieve best value for money for the tax payer. In addition, when contracts are re-tendered there are challenges in ensuring effective transition to a new contract, whether with a new or current private sector partner. UKTI has mitigated these risk by the support provided through the commercial expertise embedded in its Commercial Unit and by regular and open communications and engagement with contractors, staff and teams engaged in re-tendering activities. In addition UKTI has started a rolling programme of supplier audits.
2020 Export Drive
The 2020 Export Drive is a whole of Government effort to support UK businesses to export £1 trillion by 2020. It is supported by the Government’s Export Implementation Task Force. It is delivered with and through other Government Departments and delivery partners across the UK, plus UKTI teams in the UK and overseas. The risk is that we are unable to deliver effectively with so many partners working together across sectors and countries. This has been mitigated
through a joint UKTI and FCO planning process, bringing together UKTI and the FCO Prosperity programme, which aims to support the conditions for global and UK growth, into one coherent business plan in market. UKTI has developed a programme management framework and is in the process of strengthening its performance management regime to drive delivery and support the whole of government effort.
People
A dynamic organisation, responding to global trends, opportunities and changing priorities, and delivering through a relatively large number of outsourced contracts, is subject to regular and rapid changes which can be unsettling for staff. There is a risk that staff may become demotivated or UKTI has difficulties recruiting and retaining staff. This is being mitigated through regular communications from the Chief Executive on changes planned and being implemented, change management best practice being embedded across UKTI teams through training and support from expert contractors, plus all-staff engagement to discuss continuous improvement and people issues. Follow up actions are being led from teams across UKTI.
17. Review of Effectiveness Each year, the effectiveness of the systems of governance, risk management and internal control are reviewed, informed by work undertaken by the Executive Management team, Internal Audit and the management letter received from the External Auditors. The ARAC reviews the evidence that supports the Governance Statement and advises the UKTI Accounting Officer and the Executive Board on their adequacy.
40
An Annual Governance Return is completed by the Managing Directors of each business group to review and gain assurance over those parts of the governance structures, risk management and internal control framework for which they have responsibility. A group discussion with Managing Directors is facilitated by Internal Audit to review and challenge the returns. Internal Audit prepares a summary paper and this is used to support the drafting of the governance statement. This year Internal Audit will prepare an assurance report on overall governance and controls of the FCO relevant to UKTI. This will be based on the FCO’s own assurance process.
The Departmental Board was reviewed in year and the UKTI Executive Board was replaced with the Trade and Investment Board, a joint Board for UKTI and UKEF. The joint Board allows alignment between UKTI and UKEF at a strategic level, to ensure that our collective efforts to support exporters have maximum impact. The joint Board is atypical, though, the process to set up the Board reviewed the terms of reference, structure and role to ensure compliance with Civil Service best practice. In addition an assessment of UKTI’s compliance with the Corporate Governance Code for Central Government Departments was undertaken as part of the annual process to evidence UKTI’s Governance Statement. This reviewed the full UKTI governance framework against the code and concluded that UKTI is compliant with the principles and spirit of the code.
The effectiveness of the ARAC Committee was assessed during 2014-15 through a workshop facilitated by the NAO. The overall conclusion of the review was that in most areas, the UKTI ARAC is already effective and operating in line with current requirements and good
practice. The workshop identified areas that participants considered would benefit from review or enhancement to improve the overall effectiveness of the UKTI ARAC. The Secretariat is supporting the implementation of the resulting action plan.
Monthly Financial Management reports are presented at Executive Committee meetings, alongside a corporate Dashboard which provides an overview of finance, performance and risk within UKTI. These are closely scrutinised and questioned to ensure that the information being received is adequate and timely.
UKTI undertook a review of financial management in 2014-15 using the Chartered Institute of Public Finance and Accountancy (CIPFA) Financial Management Model. This is a public sector specific, self-assessment and self-improvement tool that looks at financial management across the whole organisation, rather than just the narrower finance function. The resulting report highlighted strengths including control and compliance, and stewardship of funds, as well as areas for potential development. In 2015-16 UKTI will be implementing an action plan based on the recommendations.
UKTI has outsourced payroll, transactional finance and procurement to UK Shared Business Services (UK SBS). An Annual Assurance Statement for 2014-15 was provided by the Chief Executive of UK SBS to UKTI’s Accounting Officer. This stated that UK SBS had received moderate assurance for the effectiveness of its internal controls relating to customer processes. However the letter highlighted several areas for improvement. UKTI will continue to monitor progress against these areas through the customer governance forum for each service and continued engagement with UK SBS at a senior level.
18. Data Handling During 2014-15, UKTI had two data security breaches involving staff working for UKTI transferring sensitive UKTI data. Investigations into these have concluded and UKTI has worked with BIS and the FCO to reduce the likelihood of a recurrence.
19. Ministerial Directions During 2014-15, no ministerial directions were given to UKTI.
I have considered the evidence provided which formed the basis of the Annual Governance Statement along with the independent advice received from the Audit and Risk Assurance Committee and can conclude that UKTI has adequate governance and risk management systems, which include an appetite to ensure these remain compliant with best practice. I have also taken into account the Corporate Governance Code for Central Government Departments, and I am satisfied UKTI is able to demonstrate compliance with the relevant areas of the code and that no departures need to be reported for the relevant period.
Dominic Jermey CVO OBE Accounting Officer
25 June 2015
41 UK Trade & Investment Annual Report and Accounts 2014-15
The Certificate and Report of the Comptroller and Auditor Generalto the House of Commons I certify that I have audited the financial statements of the UK Trade and Investment for the year ended 31 March 2015 under the Government Resources and Accounts Act 2000. The financial statements comprise: the Statements of Comprehensive Net Expenditure, Financial Position, Cash Flows, Changes in Taxpayers’ Equity; and the related notes. I have also audited the Statement of Parliamentary Supply and the related notes. These financial statements have been prepared under the accounting policies set out within them. I have also audited the information in the Remuneration Report that is described in that report as having been audited.
Respective responsibilities of the Accounting Officer and auditor
As explained more fully in the Statement of Accounting Officer’s Responsibilities, the Accounting Officer is responsible for the preparation of the financial statements and for being satisfied that they give a true and fair view. My responsibility is to audit, certify and report on the financial statements in accordance with the Government Resources and Accounts Act 2000. I conducted my audit in accordance with International Standards on Auditing (UK and Ireland). Those standards require me and my staff to comply with the Auditing Practices Board’s Ethical Standards for Auditors.
Scope of the audit of the financial statements
An audit involves obtaining evidence about the amounts and disclosures in the financial statements sufficient to give reasonable assurance that the financial statements are free from material misstatement, whether caused by fraud or error. This includes an assessment of: whether the accounting policies are appropriate to the Department’s circumstances and have been consistently applied and adequately disclosed; the reasonableness of significant accounting estimates made by the Accounting Officer; and the overall presentation of the financial statements. In addition I read all the financial and non-financial information in the Annual Report to identify material inconsistencies with the audited financial statements and to identify any information that is apparently materially incorrect based on, or materially inconsistent with, the knowledge acquired by me in the course of performing the audit. If I become aware of any apparent material misstatements or inconsistencies I consider the implications for my certificate.
I am required to obtain evidence sufficient to give reasonable assurance that the Statement of Parliamentary Supply properly presents the outturn against voted Parliamentary control totals and that those totals have not been exceeded. The voted Parliamentary control totals are Departmental Expenditure Limits (Resource and Capital), Annually Managed Expenditure (Resource and Capital), Non-Budget (Resource) and Net Cash Requirement. I am also required to obtain evidence sufficient to give reasonable assurance that the expenditure and income recorded in the financial statements have been applied to the purposes intended by Parliament and the financial transactions recorded in the financial statements conform to the authorities which govern them.
Opinion on regularity
In my opinion, in all material respects:
• the Statement of Parliamentary Supply properly presents the outturn against voted Parliamentary control totals for the year ended 31 March 2015 and shows that those totals have not been exceeded; and
• the expenditure and income recorded in the financial statements have been applied to the purposes intended by Parliament and the financial transactions recorded in the financial statements conform to the authorities which govern them.

42
Opinion on financial statements
In my opinion:
• the financial statements give a true and fair view of the state of the Department’s affairs as at 31 March 2015 and of its net operating cost for the year then ended; and
• the financial statements have been properly prepared in accordance with the Government Resources and Accounts Act 2000 and HM Treasury directions issued thereunder.
Opinion on other matters
In my opinion:
• the part of the Remuneration Report to be audited has been properly prepared in accordance with HM Treasury directions made under the Government Resources and Accounts Act 2000; and
• the information given in section entitled Departmental Performance for the financial year for which the financial statements are prepared is consistent with the financial statements.
Matters on which I report by exception
I have nothing to report in respect of the following matters which I report to you if, in my opinion:
• adequate accounting records have not been kept or returns adequate for my audit have not been received from branches not visited by my staff; or
• the financial statements and the part of the Remuneration Report to be audited are not in agreement with the accounting records and returns; or
• I have not received all of the information and explanations I require for my audit; or
• the Governance Statement does not reflect compliance with HM Treasury’s guidance.
Report
I have no observations to make on these financial statements.
Sir Amyas C E Morse
Comptroller and Auditor General
National Audit Office 157-197 Buckingham Palace Road Victoria London SW1W 9SP
29 June 2015

43 UK Trade & Investment Annual Report and Accounts 2014-15
Statement of Parliamentary Supply
In addition to the primary statements prepared under IFRS, the Government Financial Reporting Manual (FReM) requires UKTI to prepare a Statement of Parliamentary Supply (SoPS) and supporting notes to show resource outturn against the Supply Estimate presented to Parliament, in respect of each budgetary control limit.
Summary of Resource and Capital Outturn 2014-15
2013-14 2014-15 £000
Estimate Outturn £000 Outturn
Voted Outturn
compared with
Estimate Non- Non- saving/
Note Voted Voted Total Voted Voted Total (excess) Total
Departmental Expenditure Limit
– Resource SOPS 265,246 - 265,246 264,151 - 264,151 1,095 156,844 2.1
– Capital SOPS 1,715 - 1,715 1,619 - 1,619 96 2,511 2.2
Annually Managed Expenditure
– Resource SOPS 5,000 - 5,000 (4) - (4) 5,004 355 2.1
– Capital SOPS - - - - - - - – 2.2
Total Budget 271,961 - 271,961 265,766 - 265,766 6,195 159,710
Non-Budget
– Resource – – – – – – – –
Total Non-Budget – – – – – – – –
Total Resource SOPS 270,246 - 270,246 264,147 - 264,147 6,099 157,199 2.1
Total Capital SOPS 1,715 - 1,715 1,619 - 1,619 96 2,511 2.2
Total 271,961 - 271,961 265,766 - 265,766 6,195 159,710
The notes on pages 45-47 form part of these accounts.
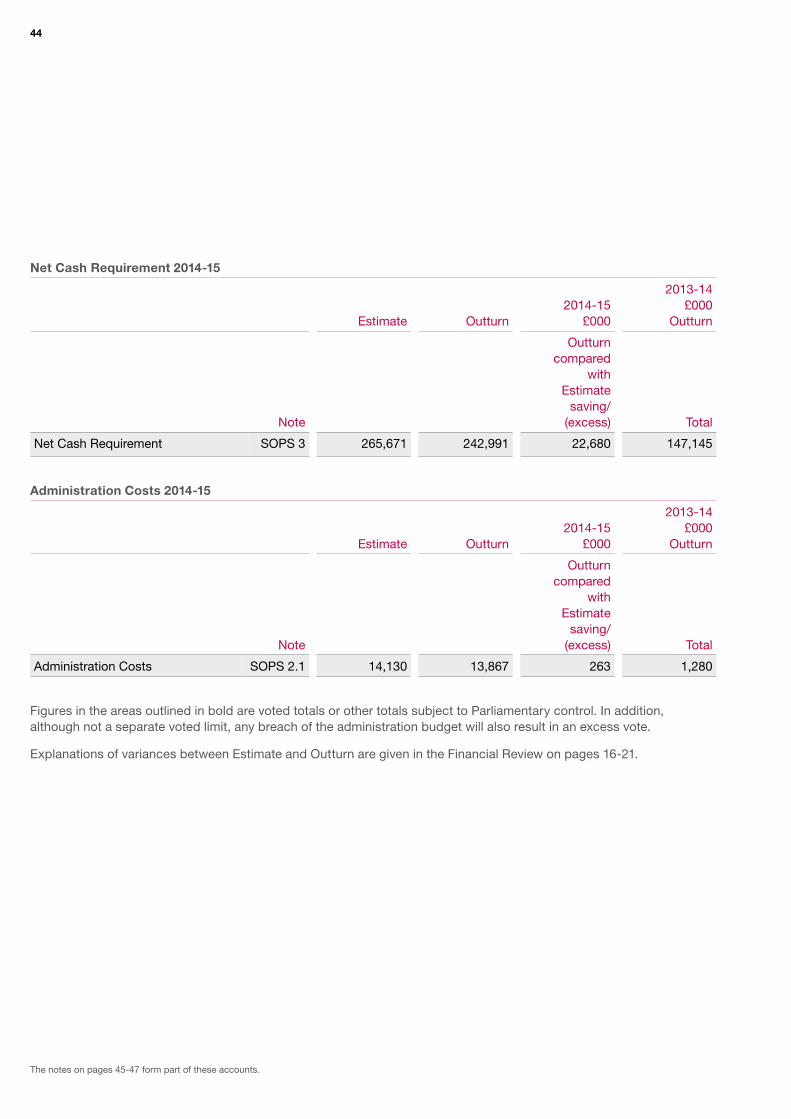
44
Net Cash Requirement 2014-15
2013-14 2014-15 £000
Estimate Outturn £000 Outturn
Outturn compared
with Estimate
saving/ Note (excess) Total
Net Cash Requirement SOPS 3 265,671 242,991 22,680 147,145
Administration Costs 2014-15
2013-14 2014-15 £000
Estimate Outturn £000 Outturn
Outturn compared
with Estimate
saving/ Note (excess) Total
Administration Costs SOPS 2.1 14,130 13,867 263 1,280
Figures in the areas outlined in bold are voted totals or other totals subject to Parliamentary control. In addition, although not a separate voted limit, any breach of the administration budget will also result in an excess vote.
Explanations of variances between Estimate and Outturn are given in the Financial Review on pages 16-21.
The notes on pages 45-47 form part of these accounts.

45 UK Trade & Investment Annual Report and Accounts 2014-15
Notes to the Departmental Resource Accounts (Statement of Parliamentary Supply) SOPS1. Statement of accounting policies The Statement of Parliamentary Supply and supporting notes have been prepared in accordance with the 2014-15 Government Financial Reporting Manual (FReM) issued by HM Treasury. The Statement of Parliamentary Supply accounting policies contained in the FReM are consistent with the requirements set out in the 2014-15 Consolidated Budgeting Guidance and Supply Estimates Guidance Manual.
SOPS1.1 Accounting convention
The Statement of Parliamentary Supply and related notes are presented consistently with Treasury budget control and Supply Estimates. The aggregates across government are measured using National Accounts, prepared in accordance with the internationally agreed framework ‘European System of Accounts’ (ESA95). ESA95 is in turn consistent with the System of National Accounts (SNA93), which is prepared under the auspices of the United Nations.
The budgeting system and the consequential presentation of Supply Estimates and the Statement of Parliamentary Supply and related notes, have different objectives to IFRS-based accounts. The system supports the achievement of macroeconomic stability by ensuring that public expenditure is controlled, with relevant Parliamentary authority, in support of the Government’s fiscal framework. The system provides incentives to departments to manage spending well so as to provide high quality public services that offer value for money to the taxpayer.
The Government’s objectives for fiscal policy are set out in the Charter for Budget Responsibility. These are to:
• ensure sustainable public finances that support confidence in the economy, promote intergenerational fairness, and ensure the effectiveness of wider Government policy; and
• support and improve the effectiveness of monetary policy in stabilising economic fluctuations.
SOPS 1.2 Comparison with IFRS-based accounts
There are no differences between the programme and administration expenditure in the Statement of Parliamentary Supply and the IFRS-Based accounts.
SOPS1.3 Provisions – Programme expenditure
Provisions recognised in IFRS-based accounts are not recognised as expenditure for national accounts purposes until the actual payment of cash (or accrual liability) is recognised. To meet the requirements of both resource accounting and national accounts, additional data entries are made in the Statement of Parliamentary Supply across AME and DEL control totals, which do not affect the Statement of Comprehensive Net Expenditure.

46
SOPS2 Net Outturn SOPS2.1 Analysis of Net Resource Outturn by Section
2014-15 2013-14 £000 £000
Outturn Estimate Outturn
Administration Programme Net total Net compared
Gross Income Net Gross Income Net Total total to Estimate Total
Spending in Departmental Expenditure Limit
Voted:
A. Trade development and promotion and inward investment: 14,118 (251) 13,867 265,026 (14,742) 250,284 264,151 265,246 1,095 156,844
Annually Managed Expenditure
Voted:
B. Trade development and promotion and inward investment: – – – (4) – (4) (4) 5,000 5,004 355
Total 14,118 (251) 13,867 265,022 (14,742) 250,280 264,147 270,246 6,099 157,199
SOPS2.2 Analysis of Net Capital Outturn by Section
2014-15 2013-14 £000 £000
Outturn Estimate Outturn
Net total compared
Gross Income Net total Net to Estimate Total
Spending in Departmental Expenditure Limit
Voted:
A. Trade development and promotion and inward investment: 1,619
1,619
– 1,619 1,715 96 2,511
2,511 Total – 1,619 1,715 96
Explanations of variances between Estimate and Outturn are given in the Financial Review on pages 16-21.

47 UK Trade & Investment Annual Report and Accounts 2014-15
SOPS3 Reconciliation of Net Resource Outturn to Net Cash Requirement
Net total Outturn
compared with
Estimate: savings
Note Estimate Outturn (excess)
Resource Outturn SOPS 2.1 270,246 264,147 6,099
Capital Outturn SOPS 2.2 1,715 1,619 96
541
Accruals to cash adjustments
Adjustments to remove non-cash items:
Depreciation and amortisation 7,8 (1,811) (2,352)
Impairments 4,5 - - -
Auditor’s remuneration 4 - (115) 115
New provisions and adjustments to previous provisions 13 (4,979) 4 (4,983)
Loss on disposal of assets 4,5 (213) 213
672
Adjustments to reflect movements in working balances:
Increase/(decrease) in debtors CF, 10 – (672)
(Increase)/decrease in creditors
Net cash requirements
CF, 12 500
265,671
(19,427)
242,991
19,927
22,680
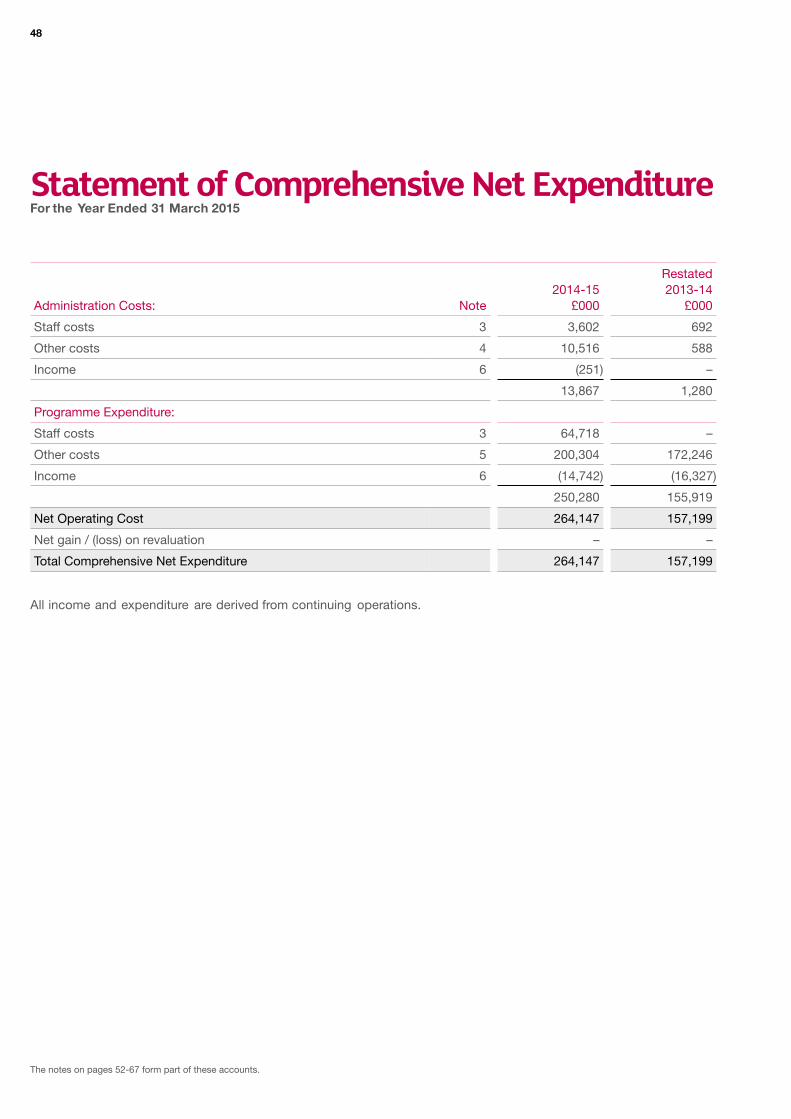
48
Statement of Comprehensive Net ExpenditureFor the Year Ended 31 March 2015
Administration Costs: Note 2014-15
£000
Restated 2013-14
£000
Staff costs 3 3,602 692
Other costs 4 10,516 588
Income 6 (251) –
13,867 1,280
Programme Expenditure:
Staff costs 3 64,718 –
Other costs 5 200,304 172,246
Income 6 (14,742) (16,327)
250,280 155,919
Net Operating Cost 264,147 157,199
Net gain / (loss) on revaluation –
264,147
–
Total Comprehensive Net Expenditure 157,199
All income and expenditure are derived from continuing operations.
The notes on pages 52-67 form part of these accounts.

49 UK Trade & Investment Annual Report and Accounts 2014-15
Statement of Financial Position As at 31 March 2015
2015 2014 Note £000 £000
732
Non-current Assets
Property, plant and equipment 7 762
Intangible assets 8 3,241 4,219
Total non-current assets 4,003 4,951
9,726
Current assets
Trade and other receivables 10 9,054
Cash and cash equivalents 11 21,550 12,709
Total current assets 30,604 22,435
Total assets 34,607 27,386
(355)
Current liabilities
Provision 13 (351)
Trade and other payables 12 (74,159) (45,893)
Total current liabilities (74,510) (46,248)
Total assets less current liabilities (39,903) (18,862)
(18,862)
(18,862)
Taxpayers Equity and Other Reserves
General fund
Total equity
(39,903)
(39,903)
Dominic Jermey CVO OBE Accounting Officer
25 June 2015
The notes on pages 52-67 form part of these accounts.
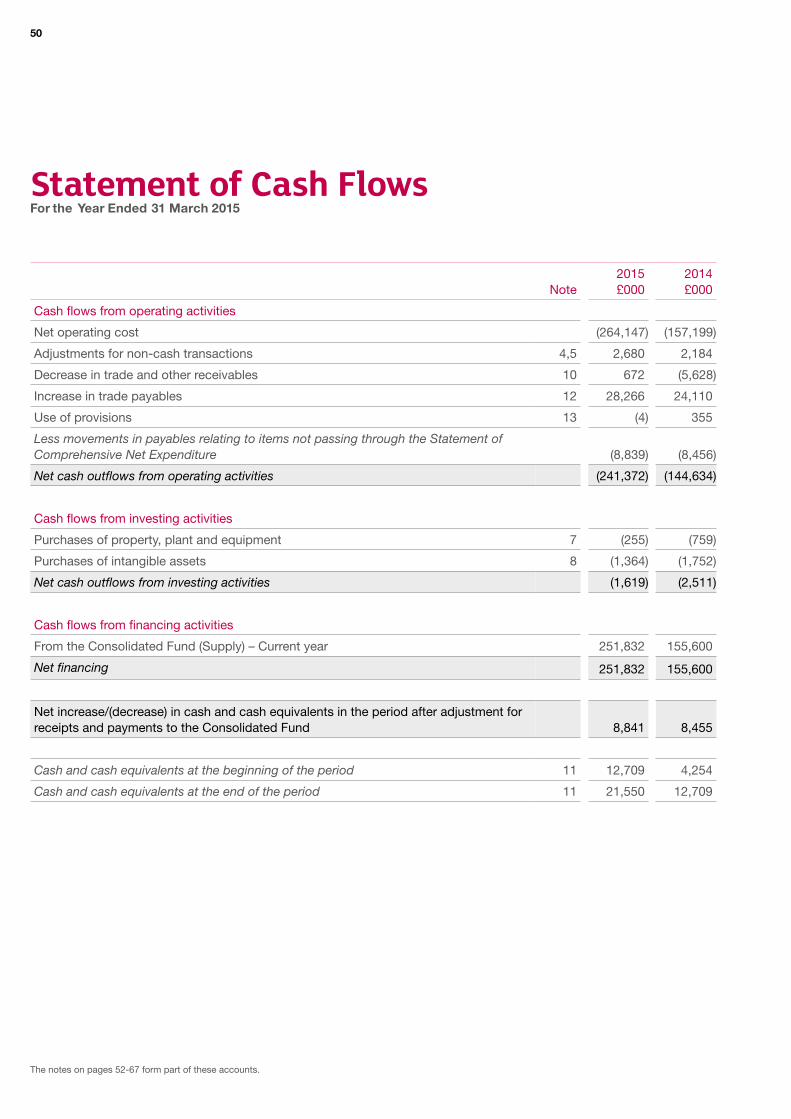
50
Statement of Cash Flows For the Year Ended 31 March 2015
2015 2014 Note £000 £000
Cash flows from operating activities
Net operating cost (264,147) (157,199)
Adjustments for non-cash transactions 4,5 2,680 2,184
Decrease in trade and other receivables 10 672 (5,628)
Increase in trade payables 12 28,266 24,110
Use of provisions 13 (4) 355
Less movements in payables relating to items not passing through the Statement of Comprehensive Net Expenditure (8,839) (8,456)
Net cash outflows from operating activities (241,372) (144,634)
Cash flows from investing activities
Purchases of property, plant and equipment 7 (255) (759)
Purchases of intangible assets 8 (1,364) (1,752)
Net cash outflows from investing activities (1,619) (2,511)
Cash flows from financing activities
From the Consolidated Fund (Supply) – Current year 251,832 155,600
Net financing 251,832 155,600
Net increase/(decrease) in cash and cash equivalents in the period after adjustment for receipts and payments to the Consolidated Fund 8,841 8,455
Cash and cash equivalents at the beginning of the period 11 12,709 4,254
Cash and cash equivalents at the end of the period 11 21,550 12,709
The notes on pages 52-67 form part of these accounts.
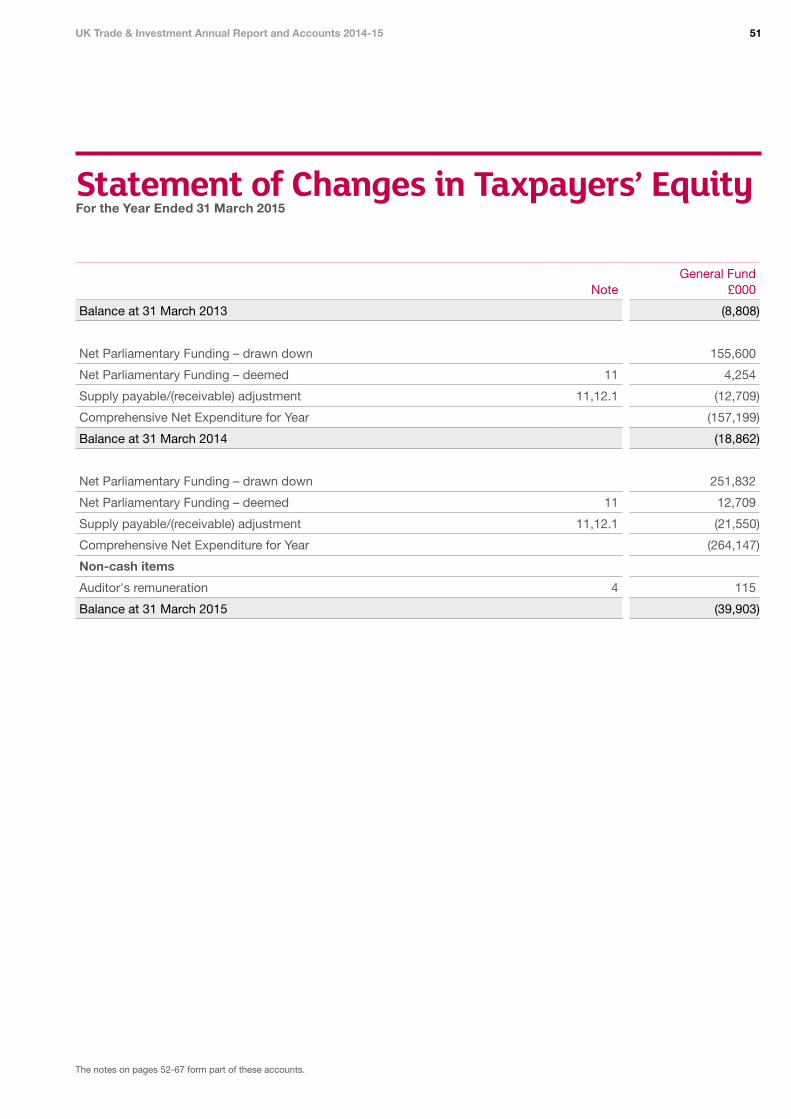
51 UK Trade & Investment Annual Report and Accounts 2014-15
Statement of Changes in Taxpayers’ EquityFor the Year Ended 31 March 2015
General Fund Note £000
Balance at 31 March 2013 (8,808)
Net Parliamentary Funding – drawn down 155,600
Net Parliamentary Funding – deemed 11 4,254
Supply payable/(receivable) adjustment 11,12.1 (12,709)
Comprehensive Net Expenditure for Year (157,199)
Balance at 31 March 2014 (18,862)
Net Parliamentary Funding – drawn down 251,832
Net Parliamentary Funding – deemed 11 12,709
Supply payable/(receivable) adjustment 11,12.1 (21,550)
Comprehensive Net Expenditure for Year (264,147)
Non-cash items
Auditor's remuneration 4 115
Balance at 31 March 2015 (39,903)
The notes on pages 52-67 form part of these accounts.

52
Notes to the 2014-15 Resource Accounts
1 Statement of Accounting Policies These financial statements have been prepared in accordance with the 2014-15 Government Financial Reporting Manual (FReM), issued by HM Treasury. The accounting policies contained in the FReM apply International Financial Reporting Standards (IFRS) as adapted, or interpreted, for the public-sector context. Where the FReM permits a choice of accounting policy, the accounting policy which is judged to be most appropriate to the particular circumstances of UKTI, for the purpose of giving a true and fair view has been selected. The particular policies adopted by UKTI are described below. They have been applied consistently in dealing with items that are considered material to the accounts.
In addition to the primary statements prepared under IFRS, the FReM also requires UKTI to prepare additional primary statements, the Statement of Parliamentary Supply and supporting notes which show Outturn against Estimate in terms of the Net Resource Requirement and the Net Cash Requirement.
1.1 Accounting Convention
These accounts have been prepared on a going concern basis under the historical cost convention modified to account for the fair value revaluation of property, plant and equipment, and intangible assets as described in paragraphs 1.11 to 1.14.
1.2 Basis of Accounting
These accounts cover all activities for which the Chief Executive of UKTI has principal Accounting Officer (AO) responsibility. In 2014-15 this includes the direct costs previously included in the annual report and accounts of UKTI’s two parent departments, the Foreign & Commonwealth Office (FCO) and the Department for Business Innovation and Skills (BIS).
The indirect costs of the overseas network and the direct staff costs at overseas posts not previously ring-fenced within the FCO budgets are incurred by the FCO and disclosed in the annual report and accounts of the FCO. These costs are included by way of memorandum notes to the accounts (pages 68 to 71).
1.3 Estimates and Judgements
The preparation of UKTI’s financial statements requires management to make judgements, estimates and assumptions that affect the reported amounts of assets and liabilities, income and expenditure. The estimates and associated assumptions are based on historical experience and other factors, including expectations or future events that are believed to be reasonable under the circumstances. The results of these form the basis of making judgements about carrying values of assets and liabilities that are not readily apparent from other sources. Uncertainty about these assumptions and estimates could result in outcomes that require an adjustment to the carrying value of the asset or liability. Where applicable, these uncertainties are disclosed in the Notes to the Accounts.
1.4 Regional Contracts
UKTI has a number of external contracts to provide the delivery of trade services to nine English regions. Each of these contracts is incentivised with 15% of the value of the regional contract being payable on the basis of performance. The accounting treatment of these payments represents a significant judgement area as final performance data is not available at year-end.
The performance targets are based on stretch targets for quantity (measured through the customer data management system (CDMS) and verified through PIMS) and on stretch targets for quality (measured through PIMS). In addition, there are minimum thresholds for quantity and quality that must be met to trigger any incentivised payment. CDMS data is available at the yearend, but PIMS data is only available 6 months in arrears. Quantity payments can be assessed at year end, but the final decision on whether incentivised payments should be made is not possible until 6 months into the new financial year when corresponding PIMS scores are available.
A forecast of performance is used at year end to assess the value of the accrual for the incentive payments. The forecast is based on the actual CDMS data for the year adjusted for the historical dropout rate following verification through PIMS. The average dropout rate is calculated using the last 12 months of available PIMS data. The total available incentivised payments of £3.096 million were accrued for in 2014-5 (2013-14 £3.98 million).

53 UK Trade & Investment Annual Report and Accounts 2014-15
1.5 FDI Contracts in High Growth Markets
UKTI has a number of private sector contracts to deliver FDI Services in high growth markets. A proportion of each of these contracts is incentivised based on performance. These targets are based on the number of pipeline opportunities identified and investment projects won. As at March 2015, these contracts have an additional 6-12 months in which the contractor can continue to work towards these targets. UKTI has accrued for those targets already met based on performance in 2014-15. The remaining payments are recognised as contingent liabilities because they represent a possible obligation, the existence of which will be confirmed by the performance of the contractors in 2015-16. Further details are provided in note 15.
In accordance with IAS 8, revisions to the accounting estimates are recognised in the period in which the estimate is revised.
1.6 Operating Income
Operating income is income which relates directly to the operating activities of UKTI and is measured at the fair value of consideration received or receivable. Income is only recognised once the work or service has been provided and principally comprises fees and charges for services provided to external customers.
1.7 Administration and Programme Income and Expenditure
The Consolidated Statement of Comprehensive Net Expenditure is analysed between administration and programme income and expenditure. The organisational support undertaken by the Chief Operating Officer’s Group is classified as administration expenditure. The frontline activities of UKTI are classified as programme expenditure.
1.8 Research and Development
Expenditure on research and development is treated as an operating cost in the year in which it is incurred, unless it meets the criteria set out in IAS 38 Intangible Assets in which case it is capitalised.
1.9 Pensions
Staff working for UKTI are employees of either BIS or the FCO. Past and present employees are covered by the provisions of the Civil Service Pension Schemes. The defined benefit schemes are unfunded. BIS and the FCO recognise the expected costs of these elements on a systematic and rational basis over the period during which they benefit from an employee’s services by payment to the Civil Service Pension Scheme of amounts calculated on an accruing basis. Liability for payment of future benefits is a charge on the Civil Service Pension Scheme. In respect of defined contribution schemes, BIS and the FCO recognise the contributions payable for the year.
These pension costs are recharged from BIS and the FCO and are shown in the Staff Costs Note.
1.10 Value Added Tax (VAT)
VAT is accounted for in the Accounts. Amounts are shown net of VAT except:
• Irrecoverable VAT is charged to the Statement of Comprehensive Net Expenditure, and included under the relevant expenditure category.
• Irrecoverable VAT on the purchase of an asset is included in additions.
The net amount due to, or from HM Revenue and Customs in respect of VAT is included within payables or receivables on the Statement of Financial Position.
1.11 Property, Plant and Equipment
In accordance with the FReM, UKTI has opted to value property, plant and equipment on a depreciated historical cost basis, as a proxy for fair value. This method of valuation has been chosen because UKTI has a large number of relatively small-value items, with short useful lives.
UKTI’s capitalisation threshold for property, plant and equipment is £1,000, except for furniture assets, where all expenditure in one financial year is pooled and capitalised, and IT hardware, where a pack of equipment purchased under the Flexible Computing Programme (FCP), with a cost in excess of £1,000, is capitalised as one asset.
Much of the business of UKTI is conducted through the offices of BIS and the FCO. The use of BIS assets is recharged directly to UKTI and is included in Expenditure Note 4. The use of the FCO’s assets is reflected in the indirect overheads which appear as memorandum notes to these accounts.

54
Control and beneficial interest in this property, plant and equipment are vested in BIS and the FCO. Their total asset values are reflected in their respective Statements of Financial Positions.
1.12 Depreciation
Property, plant and equipment are depreciated at rates calculated to write them down to their estimated residual value on a straight-line basis over their estimated useful lives. Tangible assets are normally depreciated over the following periods:
Assets under construction
Not depreciated until assets are in use
IT assets Three to five years
Plant and machinery
Five years
1.13 Intangible Assets
Intangible assets are stated at the amortised historic cost as a proxy for fair value and are reviewed annually for impairment. The minimum level of capitalisation of an intangible asset is £1,000. This method of valuation has been chosen because the assets have no value in use.
Software licences are amortised on a straight-line basis over the shorter of the term of the licence and the useful economic life (three to five years). Intangible assets are normally depreciated over the following periods:
Development costs
Not depreciated until assets are
in use
Software licences Three to five years
Website Four to five years
IT assets Three to five years
1.14 Impairments
The carrying value of UKTI’s assets is reviewed at each Statement of Financial Position date to determine whether there is any indication of impairment. If any such indication exists, the assets’ recoverable amount is estimated in accordance with IAS 36.
An impairment loss is recognised whenever the carrying amount of an asset or its cash-generating unit is less than the recoverable amount. Impairment losses are recognised in the Statement of Comprehensive Net Expenditure.
1.15 Trade and Other Receivables
Trade and other receivables are recognised initially at fair value, less any provision for impairment. A provision for impairment of trade receivables is established when there is evidence that UKTI will not be able to recover all amounts due in accordance with contracts.
1.16 Trade and Other Payables
Trade and other payables are recognised at fair value, which represent liabilities for goods and services provided to UKTI prior to the financial year end that are unpaid. Trade and other payables are non-interest bearing and are usually paid within 10 working days, thus their carrying value approximates their fair value.
1.17 Cash and Cash Equivalents
Cash and cash equivalents comprise cash at bank and in hand. The carrying amount of these assets approximates their fair value.
1.18 Foreign Exchange
Transactions which are denominated in a foreign currency are translated into sterling at the exchange rate ruling on the date of the transaction. Current assets and liabilities denominated in foreign currency are translated into sterling at the date on which they are recorded in the accounts, on average no more than 30 days prior to the Statement of Financial Position date. UKTI does not have the authority to undertake exchange rate risk management (hedging) and as a consequence all gains or losses on exchange differences are charged direct to the Operating Cost Statement during the period in which they occur.
1.19 Impending Application of Newly Issued Accounting Standard Not Yet Effective
UKTI provides disclosure that it has not yet applied a new accounting standard, and known of reasonably estimable information relevant to assessing the possible impact that the initial application of the new standard will have on the resource accounts. There were no new standards issued for 2014-15 and not applied, which would materially affect the resource accounts. UKTI has also not adopted any standards early.

55 UK Trade & Investment Annual Report and Accounts 2014-15
2 Statement of Operating Cost by Business Group Restated
2014-15 2013-14 £000 £000
Gross Income Net Gross Income Net
Trade 99,231 (10,709) 88,522 93,223 (13,962) 79,261
Investment 54,747 (5) 54,742 40,337 - 40,337
Overseas Network 46,137 (2) 46,135 - - -
Policy and Network Development 28,418 (168) 28,250 10,257 (1,300) 8,957
Marketing 25,253 (3,094) 22,159 20,139 (180) 19,959
Chief Operating Office 14,304 (251) 14,053 5,695 - 5,695
Defence & Security Organisation 11,050
279,140
(764) 10,286
264,147
3,875 (885) 2,990
Total Comprehensive Net Expenditure (14,993) 173,526 (16,327) 157,199
Resources that have been consumed by the FCO in meeting UKTI’s objectives are detailed in memorandum notes to these accounts.
Departments are required to apply IFRS 8 Operating Segments. This requires Departments to identify their operating segments based on their main areas of activity reported to the Chief Operating Decision Maker (CODM).
UKTI’s CODM is the Accounting Officer. He receives financial information at aggregate level as well as information on outcomes relating to seven business groups, Trade, Investment, Chief Operating Office, Marketing, Policy and Network Development, Defence & Security Organisation and the Overseas Network.
The Policy and Network Development group was reported separately for the first time in 2014-15.The comparatives have been restated to reflect this with £9.0m of Policy and Network Development expenditure reclassified from Trade and Chief Operating Office groups.
The expenditure for the Overseas Network relates to the staff related costs recharged to UKTI from the FCO. In prior years these costs were incurred by the FCO and reported in their annual accounts.
The segmental analysis provided covers all UKTI net expenditure. COO expenditure and expenditure relating to teams moved from COO to other business groups in the year is included in administration budgets whilst all other business groups are classified as front-line activities and therefore programme. There are no reconciling items between the Net Operating Cost in the Statement of Comprehensive Net Expenditure and this note.
No segmental analysis of the Statement of Financial Position is disclosed as UKTI’s CODM receives information at aggregate level. All depreciation and amortisation expenditure is reported within the Chief Operating Office.
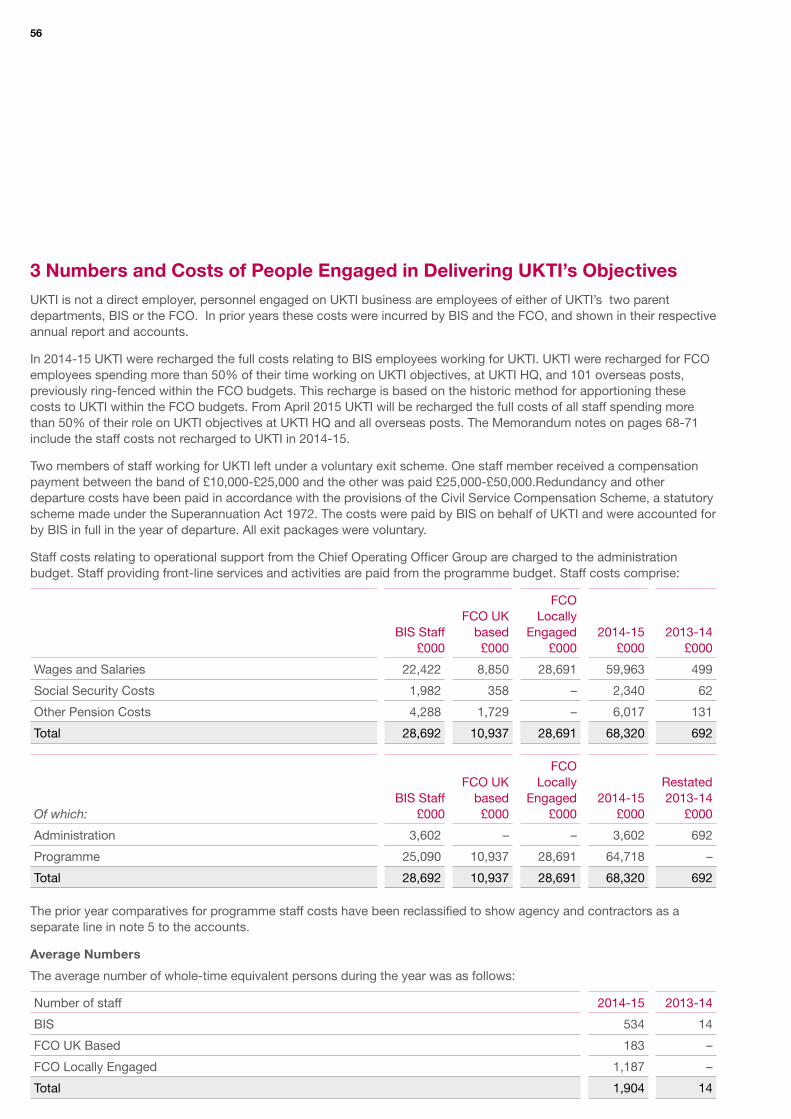
56
3 Numbers and Costs of People Engaged in Delivering UKTI’s Objectives UKTI is not a direct employer, personnel engaged on UKTI business are employees of either of UKTI’s two parent departments, BIS or the FCO. In prior years these costs were incurred by BIS and the FCO, and shown in their respective annual report and accounts.
In 2014-15 UKTI were recharged the full costs relating to BIS employees working for UKTI. UKTI were recharged for FCO employees spending more than 50% of their time working on UKTI objectives, at UKTI HQ, and 101 overseas posts, previously ring-fenced within the FCO budgets. This recharge is based on the historic method for apportioning these costs to UKTI within the FCO budgets. From April 2015 UKTI will be recharged the full costs of all staff spending more than 50% of their role on UKTI objectives at UKTI HQ and all overseas posts. The Memorandum notes on pages 68-71 include the staff costs not recharged to UKTI in 2014-15.
Two members of staff working for UKTI left under a voluntary exit scheme. One staff member received a compensation payment between the band of £10,000-£25,000 and the other was paid £25,000-£50,000.Redundancy and other departure costs have been paid in accordance with the provisions of the Civil Service Compensation Scheme, a statutory scheme made under the Superannuation Act 1972. The costs were paid by BIS on behalf of UKTI and were accounted for by BIS in full in the year of departure. All exit packages were voluntary.
Staff costs relating to operational support from the Chief Operating Officer Group are charged to the administration budget. Staff providing front-line services and activities are paid from the programme budget. Staff costs comprise:
FCO FCO UK Locally
BIS Staff based Engaged 2014-15 2013-14 £000 £000 £000 £000 £000
Wages and Salaries 22,422 8,850 28,691 59,963 499
Social Security Costs 1,982 358 – 2,340 62
Other Pension Costs 4,288 1,729 – 6,017 131
Total 28,692 10,937 28,691 68,320 692
FCO FCO UK Locally Restated BIS Staff based Engaged 2014-15 2013-14 Of which: £000 £000 £000 £000 £000
Administration 3,602 – – 3,602 692
Programme 25,090 10,937 28,691 64,718 –
Total 28,692 10,937 28,691 68,320 692
The prior year comparatives for programme staff costs have been reclassified to show agency and contractors as a separate line in note 5 to the accounts.
Average Numbers
The average number of whole-time equivalent persons during the year was as follows:
Number of staff 2014-15 2013-14
BIS 534 14
FCO UK Based 183 –
FCO Locally Engaged 1,187 –
Total 1,904 14

57 UK Trade & Investment Annual Report and Accounts 2014-15
4 Other Administration Costs 2014-15 2013-14
£000 £000
Outsourced Activity 1,080 263
BIS Overhead Recharge 2,354 –
Other costs 245 125
Agency and Temporary Staff 239 –
Events 100 –
IT expenditure 3,228 –
Promotion and publications 112 –
Training and other staff costs 342 –
Market Research and evaluation 154 –
Travel and subsistence 195 200
Non-cash items
Depreciation 225 –
Amortisation 2,127 –
Impairment – –
Loss on disposal of assets – –
Auditor’s remuneration 115 –
2,467 –
8,049 588
Non-staff administration expenditure 10,516 588

58
5 Other Programme Costs Restated
2014-15 2013-14 £000 £000
Outsourced FDI Services 43,534 33,438
Outsourced Trade Services 55,714 48,034
Other Outsourced Programme Activity 9,615 6,260
Events 39,934 30,068
Grants 23,773 24,785
Promotions and Publications 8,821 12,697
Training and Other Staff Costs 2,252 1,891
Travel and Subsistence 9,442 4,888
Other Costs 1,039 462
Agency Staff and Temporary Staff 5,140 3,463
Market Research and Evaluation 239 1,974
IT Expenditure 588 2,102
Non-cash items
Depreciation – 133
Amortisation – 2,011
Impairment – 40
Loss on disposal of assets 213 –
213 2,184
200,091 170,062
Non-staff programme expenditure 200,304 172,246
In 2014-15 the classification of expenditure was amended in order to provide increased detail on the nature of UKTI expenditure. Comparatives have been restated to reflect this; £1.7m was reclassified to agency and temporary staff costs from note 3; and £3.6m was reclassified from other costs and split between grants, training and other staff costs, and agency and temporary staff.
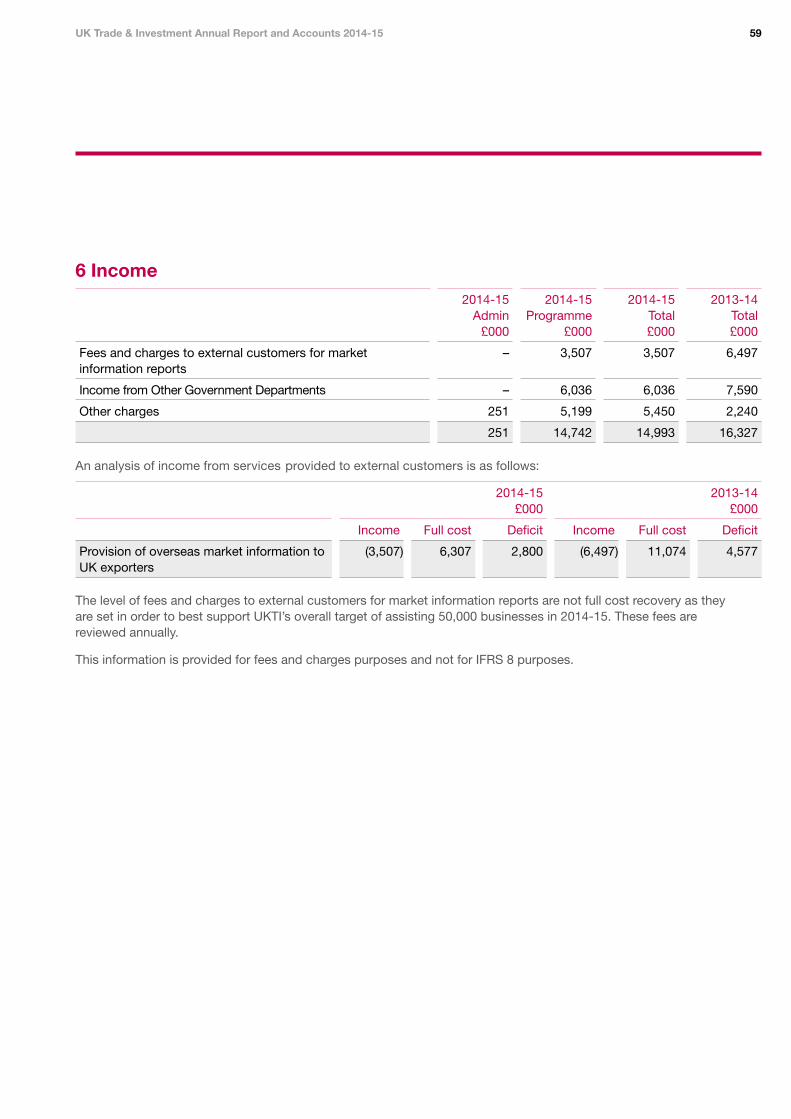
59 UK Trade & Investment Annual Report and Accounts 2014-15
6 Income 2014-15 2014-15 2014-15 2013-14
Admin Programme Total Total £000 £000 £000 £000
Fees and charges to external customers for market – 3,507 3,507 6,497 information reports
Income from Other Government Departments – 6,036 6,036 7,590
Other charges 251 5,199 5,450 2,240
251 14,742 14,993 16,327
An analysis of income from services provided to external customers is as follows:
2014-15 2013-14 £000 £000
Income Full cost Deficit Income Full cost Deficit
Provision of overseas market information to (3,507) 6,307 2,800 (6,497) 11,074 4,577 UK exporters
The level of fees and charges to external customers for market information reports are not full cost recovery as they are set in order to best support UKTI’s overall target of assisting 50,000 businesses in 2014-15. These fees are reviewed annually.
This information is provided for fees and charges purposes and not for IFRS 8 purposes.

60
7 Property, Plant and Equipment 2014-15
Furniture, Assets Information Office Fixtures under Technology Machinery and Fittings Construction Total
£000 £000 £000 £000 £000
Cost or valuation
At 1 April 2014 747 51 753 – 1,551
Additions 189 – 66 – 255
Disposals (636) (5) – – (641)
Impairment – – – – –
Transfers – – – – –
At 31 March 2015 300 46 819 – 1,165
Depreciation
At 1 April 2014 (734) (49) (36) – (819)
Charge in year (71) (38) (116) – (225)
Disposals 636 5 – – 641
Impairment – – – – –
Transfer – 74 (74) – –
At 31 March 2015 (169) (8) (226) – (403)
Carrying amount at 31 March 2015 131 38 593 – 762
Asset financing
Owned 131
131
38 593 – 762
Carrying amount at 31 March 2015 38 593 – 762
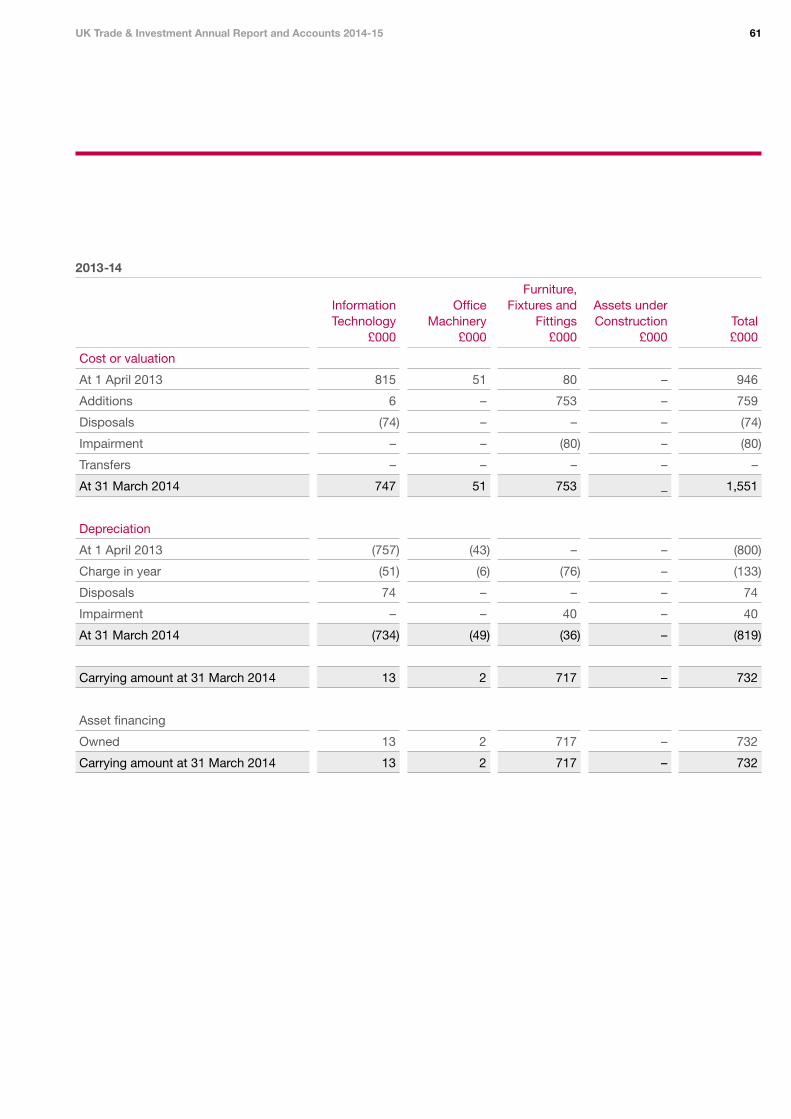
61 UK Trade & Investment Annual Report and Accounts 2014-15
2013-14
Furniture, Information Office Fixtures and Assets under Technology Machinery Fittings Construction Total
£000 £000 £000 £000 £000
Cost or valuation
At 1 April 2013 815 51 80 – 946
Additions 6 – 753 – 759
Disposals (74) – – – (74)
Impairment – – (80) – (80)
Transfers – – – – –
At 31 March 2014 747
(757)
(51)
74
–
(734)
13
13
13
51 753 _ 1,551
Depreciation
At 1 April 2013 (43) – – (800)
Charge in year (6) (76) – (133)
Disposals – – – 74
Impairment – 40 – 40
At 31 March 2014 (49) (36) – (819)
Carrying amount at 31 March 2014 2 717 – 732
Asset financing
Owned 2 717 – 732
Carrying amount at 31 March 2014 2 717 – 732

62
8 Intangible Assets 2014-15
Development Software Information costs licence Website technology Total £000 £000 £000 £000 £000
Cost or valuation
At 1 April 2014 337 3,598 4,379 6,266 14,580
Additions – – – 1,364 1,364
Disposals _ (2,386) (2,210) (3,127) (7,723)
Reclassifications (339) – – 339 –
Transfers _
(2)
–
–
–
–
–
(2)
(2)
(2)
– – – –
At 31 March 2015 1,212 2,169 4,842 8,221
Amortisation
At 1 April 2014 (3,030) (3,843) (3,488) (10,361)
Charge in year (296) (502) (1,329) (2,127)
Disposals 2,386 2,210 2,912 7,508
Transfers – – – –
At 31 March 2015 (940) (2,135) (1,905) (4,980)
Carrying amount at 31 March 2015 272 34 2,937 3,241
Asset financing
Owned 272 34 2,937 3,241
Carrying amount at 31 March 2015 272 34 2,937 3,241

63 UK Trade & Investment Annual Report and Accounts 2014-15
2013-14
Development Software Information costs licence Website technology Total £000 £000 £000 £000 £000
Cost or valuation
At 1 April 2013 77 3,607 4,379 4,774 12,837
Additions 663 – – 1,089 1,752
Disposals – (9) – – (9)
Transfers (403) – – 403 –
At 31 March 2014 337 3,598 4,379 6,266 14,580
Amortisation
At 1 April 2013 – (2,742) (2,756) (2,861) (8,359)
Charge in year – (297) (1,087) (627) (2,011)
Disposals – 9 – – 9
Transfers – – – – –
At 31 March 2014 – (3,030) (3,843) (3,488) (10,361)
Carrying amount at 31 March 2014 337 568 536 2,778 4,219
Asset financing
Owned 337
337
568 536 2,778 4,219
Carrying amount at 31 March 2014 568 536 2,778 4,219
9 Financial Instruments As the cash requirements of the Departments are met through the Estimates process, financial instruments play a more limited role in creating risk than would apply to a non-public sector body of a similar size. The majority of financial instruments relate to contracts for non-financial items in line with the Departments’ expected purchase and usage requirements, and UKTI is therefore exposed to very little credit, liquidity or market risk.
Due to the largely non-trading nature of UKTI’s activities and the way in which Government Departments are financed, UKTI is not exposed to the degree of financial risk faced by business entities. Financial assets and liabilities are generated by day-to-day operational activities and are not held to change the risks facing UKTI in undertaking its activities.

64
10 Trade Receivables and Other Current Assets 10.1 Analysis by type
31 March 2015 £000
31 March 2014 £000
Amounts falling due within one year
Trade receivables 2,757 2,464
VAT 5,256 6,005
Other receivables 303 –
Prepayments and accrued income 738 1,257
9,054 9,726
10.2 Intra-Government balances
Amounts falling due within one year
£000 £000
31 March 2015 31 March 2014
Balances with other central Government bodies 6,179 6,391
Balances with bodies external to Government 2,875 3,335
9,054 9,726
11 Cash and Cash Equivalents 31 March 2015
£000 31 March 2014
£000
Balance at 1 April 12,709 4,254
Net change in cash and cash equivalents 8,841 8,455
Balance at 31 March 21,550 12,709
The following balances at 31 March were held at:
Government banking service 21,550
21,550
12,709
Balance at 31 March 12,709
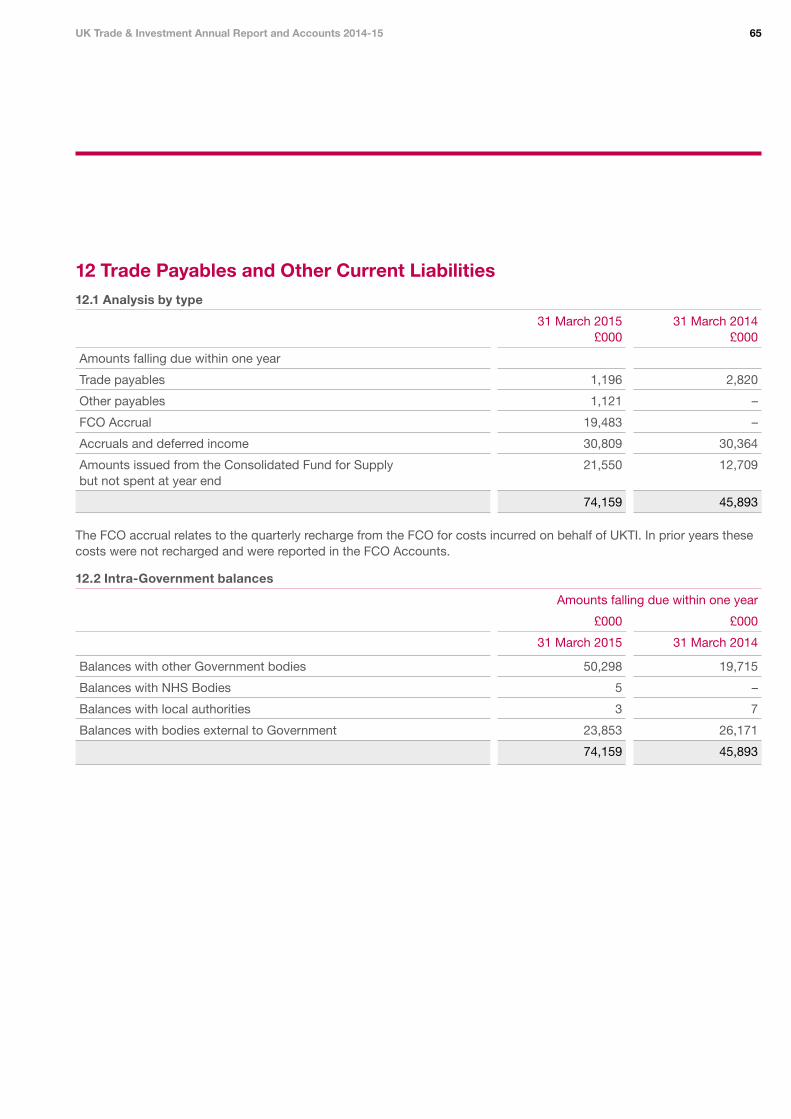
65 UK Trade & Investment Annual Report and Accounts 2014-15
12 Trade Payables and Other Current Liabilities 12.1 Analysis by type
31 March 2015 31 March 2014 £000 £000
Amounts falling due within one year
Trade payables 1,196 2,820
Other payables 1,121 –
FCO Accrual 19,483 –
Accruals and deferred income 30,809 30,364
Amounts issued from the Consolidated Fund for Supply 21,550 12,709 but not spent at year end
74,159 45,893
The FCO accrual relates to the quarterly recharge from the FCO for costs incurred on behalf of UKTI. In prior years these costs were not recharged and were reported in the FCO Accounts.
12.2 Intra-Government balances
Amounts falling due within one year
£000 £000
31 March 2015 31 March 2014
Balances with other Government bodies 50,298 19,715
Balances with NHS Bodies 5 –
Balances with local authorities 3 7
Balances with bodies external to Government 23,853 26,171
74,159 45,893

66
13 Provisions 31 March 2015 31 March 2014
£000 £000
Balance as at 1 April 355 –
Provided in the year 351 355
Provisions utilised in the year (355)
351
–
Total 355
Analysis of expected timing of cashflows
31 March 2015 31 March 2014 £000 £000
Not later than one year 351 –
Later than one year and not later than five years – 355
Later than five years –
351
–
Total 355
The main contract for the delivery of Foreign Direct Investment Services is incentivised with 25% of the management fee based on performance targets for quality (measured through PIMS).
This data is available 18 months in arrears. Based on historical performance and an assessment of current performance management believe that it is probable this target will be met and have therefore provided for this fee.
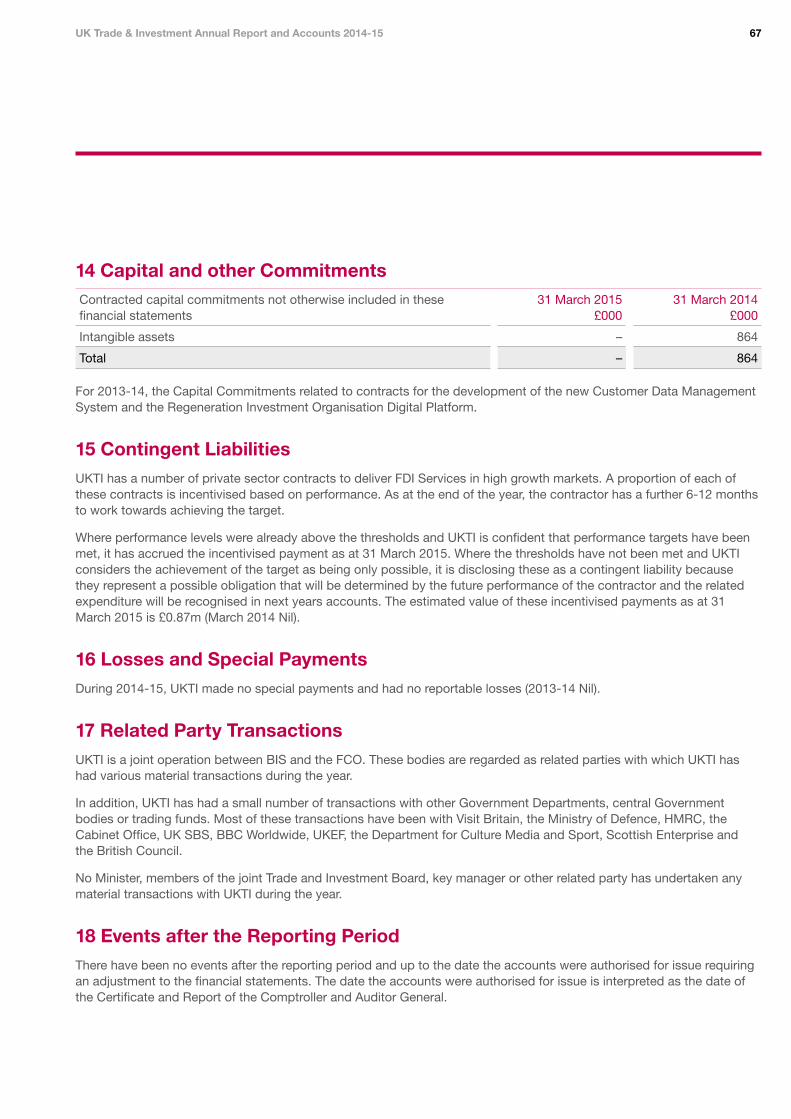
67 UK Trade & Investment Annual Report and Accounts 2014-15
14 Capital and other Commitments Contracted capital commitments not otherwise included in these 31 March 2015 31 March 2014 financial statements £000 £000
Intangible assets –
–
864
Total 864
For 2013-14, the Capital Commitments related to contracts for the development of the new Customer Data Management System and the Regeneration Investment Organisation Digital Platform.
15 Contingent Liabilities UKTI has a number of private sector contracts to deliver FDI Services in high growth markets. A proportion of each of these contracts is incentivised based on performance. As at the end of the year, the contractor has a further 6-12 months to work towards achieving the target.
Where performance levels were already above the thresholds and UKTI is confident that performance targets have been met, it has accrued the incentivised payment as at 31 March 2015. Where the thresholds have not been met and UKTI considers the achievement of the target as being only possible, it is disclosing these as a contingent liability because they represent a possible obligation that will be determined by the future performance of the contractor and the related expenditure will be recognised in next years accounts. The estimated value of these incentivised payments as at 31 March 2015 is £0.87m (March 2014 Nil).
16 Losses and Special Payments During 2014-15, UKTI made no special payments and had no reportable losses (2013-14 Nil).
17 Related Party Transactions UKTI is a joint operation between BIS and the FCO. These bodies are regarded as related parties with which UKTI has had various material transactions during the year.
In addition, UKTI has had a small number of transactions with other Government Departments, central Government bodies or trading funds. Most of these transactions have been with Visit Britain, the Ministry of Defence, HMRC, the Cabinet Office, UK SBS, BBC Worldwide, UKEF, the Department for Culture Media and Sport, Scottish Enterprise and the British Council.
No Minister, members of the joint Trade and Investment Board, key manager or other related party has undertaken any material transactions with UKTI during the year.
18 Events after the Reporting Period There have been no events after the reporting period and up to the date the accounts were authorised for issue requiring an adjustment to the financial statements. The date the accounts were authorised for issue is interpreted as the date of the Certificate and Report of the Comptroller and Auditor General.

68
Memorandum Notes Aggregating TotalResources Used To Deliver UKTI’s Services These Memorandum Notes are not within the scope of the Comptroller and Auditor General’s opinion.
In addition to the resources voted to UKTI set out in the Primary Statements, these Memorandum Notes also include an estimate of the resources allocated to UKTI activity by the FCO. In prior years the total resources deployed on UKTI activities were funded from three different sources;
• funds voted directly to UKTI for programme activities;
• BIS funding for BIS employees working for UKTI and the overheads of UKTI headquarters; and
• funding for the FCO employees working for UKTI and the overheads of the UKTI network overseas.
The BIS funding was transferred to UKTI budgets in 2014-15 and the associated costs are reported in UKTI’s financial statements. 2014-15 was a transition year for FCO costs which saw the budget for the staff and associated costs at 101 overseas posts, previously ring fenced within the FCO budget, transferred to UKTI. The related expenditure is reported in UKTI’s financial statements. The remaining overheads of the UKTI overseas network remain within the FCO budget. These costs are reported in the Annual Report and Accounts of the FCO and are shown in the memorandum notes. The budget for these overheads will be transferred to UKTI budgets from April 2015.
With respect to the FCO, the amounts stated are based on the latest information provided from the FCO Expenditure Allocation Report (EAR) in June 2015. UKTI considers that the costs stated are reasonable estimates and are in line with management’s expectations.
1 Statement of Comprehensive Net Expenditure The Statements of Comprehensive Net Expenditure below provide a breakdown by organisation of the total estimated resources consumed in the meeting of UKTI’s objectives.
UKTI Administration BIS FCO Administration and Programme Administration and Programme Total
2014-15 2013-14 2014-15 2013-14 2014-15 2013-14 2014-15 2013-14 Note £000 £000 £000 £000 £000 £000 £000 £000
Staff costs 2 68,320 692 41 28,176 12,137 51,581 80,498 80,449
Other costs 3 210,820 172,834 – 12,303 78,281 118,352 289,101 303,489
Income 4 (14,993) (16,327) – (804) – – (14,993) (17,131)
Net Comprehensive 264,147 157,199 41 39,675 90,418 169,933 354,606 366,807 Expenditure

69 UK Trade & Investment Annual Report and Accounts 2014-15
2 Staff Costs Staff working for UKTI are either employees of BIS or the FCO. Staff costs consisted of:
UKTI Admin and FCO Admin and Programme BIS Administration Programme Total
2014-15 2013-14 2014-15 2013-14 2014-15 2013-14 2014-15 2013-14 £000 £000 £000 £000 £000 £000 £000 £000
Total Total Total Total Total Total Total Total
Wages and salaries 31,272 499 – 22,466 – 8,458 31,272 31,423
Social security costs 2,340 62 – 2,045 – 402 2,340 2,509
Other pension costs 6,017 131 – 4,486 – 1,601 6,017 6,218
Exit package cost – – 41 (569) – – 41 (569)
Locally employed staff costs 28,691 – – – 12,137 41,120 40,828 41,120
Less recoveries for outward – – – (252) – – – (252) secondments
68,320 Total net cost 692 41 28,176 12,137 51,581 80,498 80,449
Two members of staff working for UKTI left under a voluntary exit scheme. One staff member received a compensation payment between the band of £10,000-£25,000 and the other was paid £25,000-£50,000. Redundancy and other departure costs have been paid in accordance with the provisions of the Civil Service Compensation Scheme, a statutory scheme made under the Superannuation Act 1972. The costs were paid by BIS on behalf of UKTI and were accounted for by BIS in full in the year of departure. All exit packages were voluntary.

70
3 Other Costs UKTI Admin and FCO Admin and
Programme BIS Administration Programme Total
Restated Restated 2014-15 2013-14 2014-15 2013-14 2014-15 2013-14 2014-15 2013-14
£000 £000 £000 £000 £000 £000 £000 £000
–
Expenditure
BIS Overhead charge 2,354 – – – – – 2,354
Other Costs 1,284 587 – 2,803 18,066 4,473 19,350 7,863
Agency Costs 5,379 3,463 – – – – 5,379 3,463
Events 40,034 30,068 – 78 – – 40,034 30,146
IT Expenditure 3,816 2,102 – 518 332 794 4,148 3,414
Promotions & Publications 8,933 12,697 – 103 – – 8,933 12,800
Training & other staff costs 2,594 1,891 – – – – 2,594 1,891
Market Research & Evaluation 393 1,974 – – – – 393 1,974
Travel & Subsistence 9,637 5,088 – 2,190 5,049 6,411 14,686 13,689
Outsource FDI services 43,534 33,438 – – – – 43,534 33,438
Outsource Trade services 55,714 48,034 – – – – 55,714 48,034
Other programme activity 10,695 6,523 – – 1,677 4,303 12,372 10,826
Grants 23,773 24,785 – – – – 23,773 24,785
Accommodation – – – 2,262 22,987 23,587 22,987 25,849
Programme – – – – 2,175 98 2,175 98
PFI service charges – – – 1,832 – – – 1,832
5,668
Non-cash items
Depreciation 225 133 – – 5,768 5,535 5,993
Amortisation 2,127 2,011 – – – – 2,127 2,011
Impairment – 40 – – – – 40
Loss on disposal of assets 213 – – – – – 213 –
Apportionment of central – – – 2,484 22,227 73,118 22,227 75,602 overheads attributable to UKTI activities
66
303,489
Auditor’s remuneration
Non-staff expenditure
115
210,820
–
172,834
–
–
33
12,303
–
78,281
33
118,352
115
289,101

71 UK Trade & Investment Annual Report and Accounts 2014-15
4 Income The amounts included in the FCO’s financial statements from which the figures shown in these Memorandum Notes are derived, include apportioned income that is not directly attributable to UKTI’s activities. FCO income is therefore not identified separately, but is included as part of the net figures disclosed in Memorandum Notes 1 and 3.
5 Capital Employed Property, Plant and Equipment and Intangible Assets used in the delivery of UKTI’s objectives are recognised on UKTI’s Statement of Financial Position (see Property, Plant and Equipment and Intangible Assets notes).
BIS and the FCO have not purchased property, plant and equipment or intangible assets for the sole purpose of delivering UKTI’s objectives.

72
Annex A Performance Framework and Resources The goals set out below are our aspirations for 2015-16. They measure the impact of what UKTI does on the business performance of the exporters and investors we serve.
UKTI Performance Measurement Framework
Trade Inward investment
UK Economy (policy aim) Productivity and GDP Growth; Productivity and GDP Growth; Innovation Innovation
Business Outcomes Business Wins: £25bn Jobs: Total (reported upon, not targeted) £additional sales: Total and per £spend; Jobs: (reported upon, not targeted)
Activity – volume 52,000 Businesses Assisted 1,400 involved successes; (Productivity Measures) 560 higher value projects (40%) (See below for definitions)
80% Quality Activity – quality 80% Quality 80% Satisfaction 80% Satisfaction
Definitions of the key performance indicators are provided on pages 73-75.

73 UK Trade & Investment Annual Report and Accounts 2014-15
Results for Inward Investment (2014-15)
Number of Inward Investment Involved Successes: 1,610
Of which:
• Proportion which are Higher Value: 38%
Total jobs created or safeguarded: 95,434
Of which:
• Additional jobs created: 72,841
• Jobs safeguarded: 22,593
Results for Trade Development (2013-14)1
Number of businesses assisted: 54,190
Of which:
• Number innovative: 45,360
• Number expecting substantial growth: 23,280
• Number new to exporting: 11,430
£ Additional sales: £49.7bn
Total jobs created or safeguarded: 197,690
Of which:
• Additional jobs created: 106,080
• Jobs safeguarded: 91,610 % improve medium-term productivity and profit:
• All UKTI trade services 51%
• Intensive support: 74%
• Other tailored support: 50%
• Outreach events: 46%
Number increasing R&D: 7,230
% reporting significant business benefit: 71%
Quality:
• All trade services: 79%
• Satisfaction:
• All trade services: 75%
Definitions of Measures Used in the Performance Framework:
Trade Development:
All performance measures apart from Business Wins are reported on the basis of results from the independent Performance and Impact Monitoring Survey (PIMS). Full results of these surveys, and detailed discussion of the methodology, including the questions used to derive the measures, are published on the UKTI website at: www.ukti.gov.uk
Businesses Assisted
(a) Number of Businesses Assisted:
Definition: Businesses are counted against the measure only once in the year, even if they have received support relating to more than one overseas market during the year. A business is defined as a separate legal entity. Businesses are only counted against the target if the relevant details of support have been provided to the independent market research specialist for inclusion in PIMS. All such businesses are eligible for interview, and are selected for interview at random.
1 Results for trade services relate to activity delivered between October 2013 and September 2014.
74
(b) Number of innovative businesses helped to exploit overseas business opportunities:
Definition: PIMS respondents are asked about characteristics of their business, including R&D activity and other key indicators of innovation, and are classified as innovative if they report such characteristics. The indicators used for this classification are based on relevant questions from the Community Innovation Survey, and are defined to capture innovation in service sectors as well as in manufacturing. Full details are published in the annual reports on PIMS on the UKTI website at www.ukti.gov.uk. The fraction of respondents classified as innovative is grossed up to provide an estimate of the number of innovative businesses helped.
(c) Number of businesses expecting substantial growth:
Definition: PIMS respondents are asked about their expectations for business growth over the next five years, distinguishing between substantial growth, moderate growth, no change, and becoming smaller. The proportion reporting substantial growth is then grossed up to provide an estimate of the total number.
(d) % improving medium-term productivity and profit:
Definition: Medium-term refers to five years from the time of the PIMS interview. Respondents are asked separately about productivity and profit, and only those who say yes to both are counted in this measure.
(e) % reporting significant business benefit:
Definition: PIMS respondents are asked a number of specific questions about ways in which their business may have benefited from the service. For each benefit reported, they are asked to rate the extent to which the business had benefited using a 1-5 scale, where 1 = no benefit and 5 = benefited to a critical extent. The measure reports the proportion, giving ratings of 4 or 5 for at least one benefit, excluding any who say that they would have achieved similar results without UKTI help.
(f) Additional sales: See Annex B
(g) Jobs created and safeguarded:
Definition: PIMS respondents are asked separately about jobs created and safeguarded, in each case asking only about jobs specifically attributed to the help provided. As for the ‘significant business benefit’ measure, respondents who say they would have achieved similar results anyway are excluded from these figures.
(h) Quality:
Definition: PIMS respondents are asked to give ratings for a number of specific aspects of service quality, in each case using a scale of 1-5, where 1 = very poor, and 5 = very good. The measure reports the average % respondents giving ratings of 4 or 5.
(i) Satisfaction:
Definition: PIMS respondents are asked to rate their overall satisfaction with the service provided, using a 1-5 scale, where 1 = very dissatisfied and 5 = very satisfied. The measure reports the % of respondents giving ratings of 4 or 5. The dissatisfied fraction is reported in the published PIMS results, which show that 2% were ‘very dissatisfied’ and 5% ‘fairly dissatisfied’. The remaining respondents gave a rating of 3.
Business Wins
Business Wins were introduced in UKTI in 2012-13 to measure the impact of UKTI support for UK business. Business Wins (BWs) capture either the actual business won by a customer or the customer’s forecast sales for up to 5 years. They give us a picture of the impact of UKTI support for business and demonstrate the value we bring. Business Wins follow after UKTI has provided a UK company significant support which has resulted in an export or non-export deal.
Business Wins measure the impact of UKTI support, via Business Win Forms, completed by the customer in two ways.
• The total expected actual value to our customer of the export or non-export deal.
• Our customer’s assessment of whether it would have achieved similar results without our support.
The Standard Operating procedures for Business Wins outlines the policy and procedures for recording and validating business wins.

75 UK Trade & Investment Annual Report and Accounts 2014-15
Inward investment
FDI Involved Successes
(a) Number of involved inward investment successes:
Definition: UKTI works with its local and regional partners as ‘One Team’ to support the delivery of FDI into the UK. In order for a project to be claimed as an involved success at least one team from the UKTI network needs to provide significant assistance to the delivery of the investment project.
(b) Number of “higher value” and “good value” projects:
UKTI’s ultimate goal is to attract high value and better quality foreign investments to the UK capable of contributing positively to productivity, UK research and development (R&D), and the creation and retention of skilled jobs. This approach should enable the economic benefits of FDI to be maximised, both in the short-run and over the longer-term.
In 2013-14 UKTI introduced a new framework to measure the ‘value’ of FDI projects for which it provides support. This is based on a set of quantitative indicators (total value of investment, and new job numbers) and qualitative indicators (quality of jobs, quality of investor; Research and development (R&D); Global/European Headquarter (HQ), and export potential) to establish the relative value of each project:
• Higher Value FDI project- if at least 3 indicators are met (one must be quantitative indicator).
• Good (Medium) Value FDI project- if any of the 2 indicators are met.
• Standard Value FDI project- all other projects.
Quantitative indicators
These two indicators are used to identify and promote investment projects which are expected to deliver greater levels of economic and social benefit largely due to their size.
• Total value of investment – an indicator of the likely magnitude of impacts and associated benefits from an investment. The value of the project is compared to an estimated historic average for the relevant sector/industry group (the ‘threshold’).
• Number of new jobs created-an indicator of the social and welfare benefits associated with an investment. The number of jobs created by a project is compared to an estimated historic average for the relevant sector/industry group (the ‘threshold’).
Qualitative Indicators
These five indicators aim to recognise a number of important non-quantitative characteristics of investments which have the potential to produce significant economic benefits to the UK.
• Salary level of the new jobs created – an indicator of job quality via calculation of the average salary level of all new jobs created by a project, compared to an estimated historic average for the relevant sector/industry group (the ‘threshold’).
• R&D focus – an indicator of the potential longer term benefits to UK productivity and growth of an investment project, via the extent to which new or additional R&D activity is expected to take place in the UK – particularly involving new to the world technology or Intellectual Property (IP).
• Global or European HQ – an indicator of importance and significance of the UK site to the investor’s global operations, and the potential additional benefits associated to the UK of having a HQ (e.g. higher quality jobs, knowledge transfer from strategic decision-making).
• Investor quality – an indicator of reliability, higher probability of success and longer term viability of the investment project. Investors (or the parent companies) who are included in the FT Global 500 list, or in the UKTI One List (Category A, A1, A2 or B companies)
• Export potential – an indicator of the likelihood of the investment project contributing towards additional exports of goods or services from the UK (directly or indirectly), and recognizing the additional benefits that exporters can bring in terms of, for example, innovation and productivity.
(c) Jobs (new and safeguarded):
Definition: Figures are estimated on the estimates provided by companies at the start of a project.
(d) % influenced:
Definition: PIMS respondents are asked about the extent to which the support provided had influenced a number of different decisions relating to the project. The questions are designed to capture influence on the aspects of the scale or scope of the project which are likely to benefit the UK, as well as capturing influence on the decision to locate in the UK. In each case, influence is rated on a 1-5 scale, where 1 = no influence, and 5 = influenced the decision to a significant extent. The measure reports the proportion giving ratings of 3-5.
(e) Quality: As for Trade.
(f) Satisfaction: As for Trade.

76
Annex B Technical Note: UKTI’s Monitoring and Evaluation Evidence Introduction
Evidence about the financial benefits generated by UKTI trade services is gathered quarterly through the Performance and Impact Monitoring Survey (PIMS) carried out by an independent market research company specialising in business surveys. In addition to the evidence collected through PIMS, estimates of the impact of UKTI trade services are obtained through a rolling programme of independent evaluations of particular trade services. These evaluations use a range of alternative techniques, in order to derive estimates of the magnitude of the impact of trade services on business sales and other measures of performance. Further detail on the evaluation programme is in Annex C.
An estimate of total financial benefits generated by UKTI trade services is published annually in reports by OMB Research on results from the PIMS. Results published at the end of March 2015, based on data derived from surveys carried out during the financial year 2014-15, reported estimated total benefits of £49.7 billion measured in terms of additional sales attributed by UKTI trade clients to the help provided.
The PIMS estimates reflect businesses’ own judgments about the value of additional revenues and profits which they expect to achieve, as a direct result of the help provided. Figures for additional profits and revenues are obtained from UKTI trade clients interviewed for PIMS, using a sequence of questions which has been rigorously tested to ensure that it elicits well informed and carefully considered judgments about these values, taking account of the specific ways in which UKTI support had benefited a business. These judgments are then used by OMB Research to calculate a figure for estimated mean and total additional sales. Clients who said they would have achieved similar results without UKTI support are counted as having received zero additional sales.
PIMS interviews are conducted at two stages, the first being between 4-7 months after the provision of the support, and a follow-up, with a smaller sample, a year later. Interviews are designed to capture a rounded picture of the quality and impact of the support, taking into account the business context.
The values of financial benefit given by the firms themselves, in the context of PIMS interviews, are then adjusted downwards through application of discounting and a number of robustness checks. These adjustments cover the following:
• Discounting: Expected future profits are discounted at 8% and counted over a limited period, normally up to five years, exceptionally up to a maximum of 10 years. After this period, the discount rate is, in effect, increased to 100%.
• Additionality: Two separate additionality tests are applied. Benefits which are not explicitly attributed by the client directly to the support are excluded. Clients who state that they could have achieved similar results without support are classified as having achieved zero additional sales.
• Consistency: Additional profits attributed to UKTI by the client are not counted, unless the client has also reported significant impact on one or more qualitative indicators, showing how the service had enabled the additional profits to be made.
Details of these adjustments, and of their effects on the mean reported additional profit attributable to UKTI support, are published quarterly in the summary reports by OMB Research on PIMS results. A more detailed description is provided by OMB Research in its full annual report on PIMS.
Analysis of PIMS data shows that the significant qualitative impacts most frequently reported by UKTI clients, who consider that the support has enabled them to generate additional profit and sales revenues are:
• gained access to customers/ business partners not otherwise available,
• gained access to information not otherwise available,
• improved profile or credibility overseas,
• improved knowledge of the competitive environment,
• improved overseas marketing strategy, and
• gained confidence to explore or expand in an overseas market or markets.
77 UK Trade & Investment Annual Report and Accounts 2014-15
These findings confirm that the reported financial benefit is generated as a result of UKTI trade services enabling clients to upgrade their approach to overseas business and overcome barriers to accessing overseas opportunities.
The very high financial benefits reported by UKTI clients have been a consistent finding over the 7 years covered by the PIMS research, and are also consistent with evidence from evaluations using other methodologies. Further qualitative insight into how the services achieve such high impact can be gleaned from case studies carried out as part of PIMS follow up qualitative research. Reports are available at: www.ukti.gov.uk
Alternative estimates of the additional sales resulting from UKTI trade support are available from quantitative evaluations of specific trade services, which are carried out by independent contractors as part of UKTI’s rolling programme of depth evaluations. These studies use econometric techniques to compare the performance of supported firms with that of a matched comparison group of non-supported firms. Two quantitative impact evaluations were completed during 2012:
• Evaluation of Trade Advisory Services delivered by the International Trade Teams in the English Regions (London Economics 2012): The analysis used data from a purpose designed survey of 300 users, and a matched sample of 300 non-user businesses. It found that UKTI support resulted in 11% faster growth over a 2 year period, and was also associated with a higher probability of entering new markets.
• Economic Impact Evaluation of UKTI’s Overseas Market Introduction Service (Breinlich, Mion, et al Essex, LSE, and Warwick University; 2012): The study matched client data to data on the wider population of UK businesses1. Econometric techniques were then used to evaluate the impact of service use on the performance of the client businesses. The study estimated that the mean effect of OMIS on employment and total turnover growth, over a two year period, was £1.5m additional turnover, and 7 additional jobs. At the median, the impact was £611,000 additional turnover, and 3 additional jobs.
These estimates are of a similar order of magnitude to those obtained from PIMS. Full reports on these and other evaluation research are available at: www.ukti.gov.uk
1 The study used the OFLIP database which was compiled by Christian Helmers and the late Mark Rogers (Oxford), and incorporates data from FAME based on Companies House records, together with publicly available data on intellectual property ownership from IPO and other sources.
Other Possible Measures of Benefit
Two other measures of economic benefit, which are sometimes used in evaluation of trade services or other business support services, are:
• Additional exports: This measure was commonly used in evaluations of trade services carried out in the UK prior to 2002, and featured in the Public Service Agreement Targets for British Trade International for the period 1999-20022. For the Spending Review period 2002-04, it was replaced by a measure of improved business performance of users of the trade services, where performance was defined in terms of improved productivity and profitability over the medium term. This change reflects the fact that export activity is not an end in itself, but benefits businesses and the UK economy through enabling companies to improve their performance, and achieve stronger growth than would otherwise be possible. Focus on additional exports can potentially be misaligned with the business development needs of a company, whereas focus on a business performance improvement target ensures clear alignment with these needs.
2 The target was set on “the value of additional exports generated for each £1 DTI/FCO expenditure”, with the baseline set at £20:£1.

78
Moreover, focus on exports would substantially understate the impact of trade services, both in terms of benefit to the supported firm, and in terms of impact on net exports. This is because the improvements to products and services, and to productivity, which result from the services, have a favourable impact on the firm’s competitiveness and performance in all its markets, including in the UK domestic market.
• Gross Value Added (GVA): This measure is often used in the context of evaluating other forms of publicly funded business support. However, as the measure includes wages, there is a need to take into account the likelihood that staff in the supported business might be able to earn similar wages in another company or sector, possibly in another UK region. The measure should therefore be reported net of displaced alternative wage earnings, either at regional or national level, as appropriate in context. If this displacement is not taken into account, estimates of GVA will substantially overstate the impact of business support. However, displacement is very difficult to measure.
Calculation of Total Benefit
The method of calculation of the £49.7bn estimated total additional revenues generated by UKTI trade services is summarised below, in three parts:
• estimation of mean benefit per business supported,
• de-duplication to count the number of businesses that received support during the year: de-duplication is necessary because some businesses will have used more than one service in the course of a year; and
• grossing up from the mean, The total de-duplicated number of businesses is multiplied by the mean.
Calculation of the mean benefit, in terms of additional profit and sales attributed specifically to the help provided by UKTI, uses the following steps:
• Firms asked to estimate the expected benefit in terms of bottom-line profit £, or in terms of additional sales, if easier for the client to estimate.
• Future expectations allowed for (using annual discounting rate of 8%); number of years in the future is normally capped at five years, for example when the respondent says the revenues will continue “indefinitely”. Exceptionally, up to 10 years are counted, where the respondent is specific about the number of years.
• Allowance made for actions not taken as a result of support. This adjustment takes account of the client’s assessment of the costs and benefit which might have been achieved through these foregone actions.
• Adjustment for non-additionality Total profit is weighted by proportion “would have realised anyway”, based on the client’s own judgment,
• Consistency check and further additionality check: Adjusted to zero if no impact has been recorded against at least one of two qualitative impact measures, namely, “change in behaviour (PIMS measure A83)” or “barriers to market access overcome” (PIMS measure A92). Impact is classified as zero in these qualitative measures if the firm has said it would have achieved similar results in any case.
All outliers are checked by a qualitative call back to the respondent by one of the OMB Research directors. (If the respondent is not able to provide a credible or consistent explanation, the observation is reduced to zero).
79 UK Trade & Investment Annual Report and Accounts 2014-15
Annex C Key Sources of UKTI Data
The key source of data for measuring how UKTI is performing against our targets is UKTI’s Customer Data Management System (CDMS), a customer relationship management system, which provides the foundation information used within PIMS.
CDMS – provides UKTI staff worldwide with a single view into customer-history transactions, allowing us to share relevant customer information across the organisation, and avoid duplication of effort. In doing this, it enhances the quality and professionalism of the service we provide to customers.
PIMS – our key performance measurement tool. It is an independent survey of UKTI performance, carried out on our behalf by a leading market research organisation. The contract for this tool is being retendered in 2015-16.
Economic and Evaluation Research – Evidence from PIMS is complemented by evidence from a rolling annual programme of in-depth evaluation, carried out by independent research teams, with technical advice and scrutiny also provided by senior academics that are not part of the lead research team. Reports on PIMS and on economic evaluation and research projects, commissioned by UKTI, are published in full on the UKTI website at: www.ukti.gov.uk
It is vital for measuring our progress, as well as for the delivery of high-quality, professional services to our customers, that all customer interactions, service deliveries, and active and successful inward investment projects are recorded fully and accurately on the CDMS system throughout the year. To underline the importance of this to UKTI, all CDMS users are required to meet a 100% accuracy target for entering customer data onto the CDMS system within 48 hours.

80
Annex D Private-Sector Sponsorship
UKTI continues to follow strictly the recommendations of the Committee on Standards in Public Life and Cabinet Office guidelines on handling sponsorship arrangements with the private sector. It uses detailed guidelines and central advice from its parent Departments.
During 2014-15, UKTI received the following private-sector sponsorship (only sponsorship exceeding £5,000 for a single event is shown here).
Sponsorship table of amounts received during 2014-15
Sponsor Amount (£) Event Note
Selex ES Ltd 10,000 Commonwealth Games
TPP (UK based IT company) 10,000 Commonwealth Games
Snoozebox 5,000 Commonwealth Games
Royal Dutch Shell Plc 20,000 Commonwealth Games
Ernst & Young LLP 17,500 Commonwealth Games
Farnborough International Ltd Non-monetary Farnborough International Airshow 2014 estimated value
£225,000
BBC Worldwide Ltd 100,000 GREAT Festivals of Creativity, Shanghai, China
Beijing Wanda Cultural Industry 200,000 GREAT Festivals of Creativity, Shanghai, China Group Co. Ltd
Royal Mail Group Ltd 88,000 GREAT Festivals of Creativity, Shanghai, China
Sanpower Group Co. Ltd 200,000 GREAT Festivals of Creativity, Shanghai, China
Visit Britain Ltd 200,000 GREAT Festivals of Creativity, Shanghai, China
De Montfort University 300,000 GREAT Festivals of Creativity, Shanghai, China and Istanbul, Turkey
HSBC Plc 780,000 GREAT Festivals of Creativity, Shanghai, China and Istanbul, Turkey
Jaguar Land Rover Automative PLC 300,000 GREAT Festivals of Creativity, Shanghai, China and Istanbul, Turkey
PricewaterhouseCooper (PWC) LLP 300,000 GREAT Festivals of Creativity, Shanghai, China and Istanbul, Turkey
Blick Rothenberg LLP 5,917 GREAT Tech Awards
Propel London Ltd 6,217 GREAT Tech Awards
Taylor Wessing LLP 6,217 GREAT Tech Awards
Merck Ltd 15,548 GREAT Tech Awards
Liverpool Vision Ltd 80,000 International Festival for Business, Liverpool
BAE Systems Plc Non-monetary Malaysian Armd Forces Cyber Command Technical review estimated value
£5,000
Forbo Ltd Non-monetary Milan Expo May to Oct 2015 estimated value
£8,000
Ercol Ltd Non-monetary Milan Expo May to Oct 2015 estimated value
£32,000
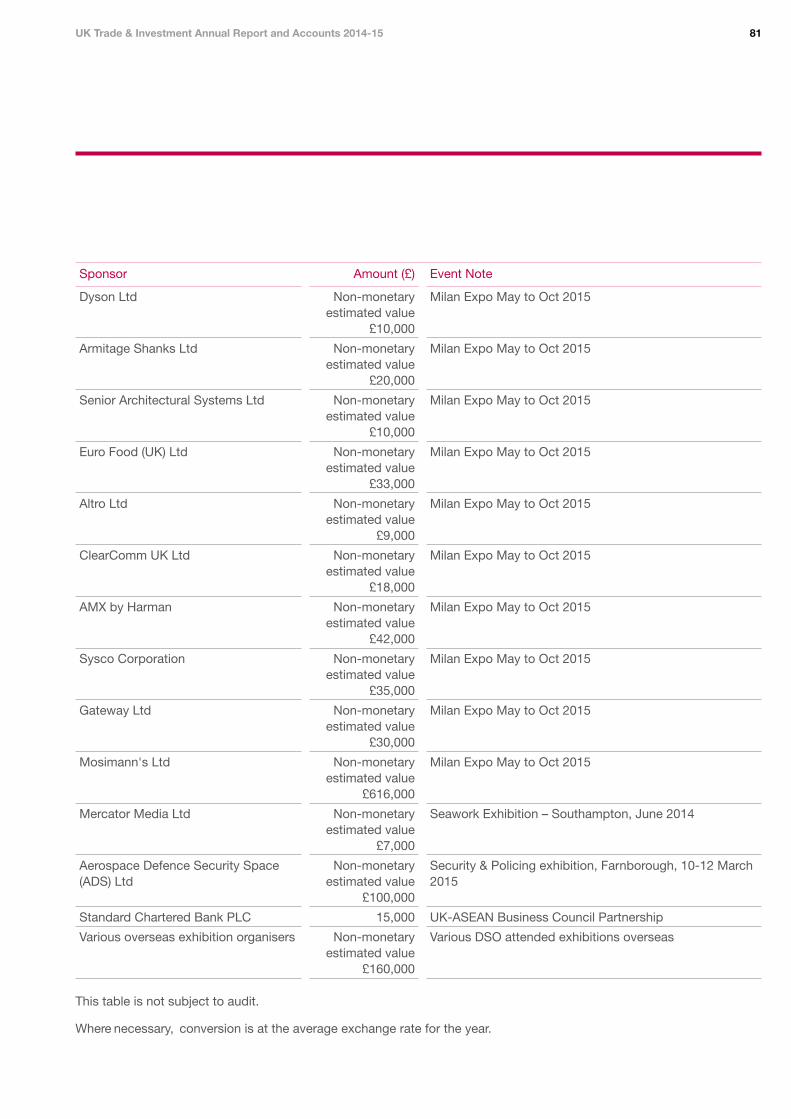
81 UK Trade & Investment Annual Report and Accounts 2014-15
Sponsor Amount (£) Event Note
Dyson Ltd Non-monetary estimated value
£10,000
Milan Expo May to Oct 2015
Armitage Shanks Ltd Non-monetary estimated value
£20,000
Milan Expo May to Oct 2015
Senior Architectural Systems Ltd Non-monetary estimated value
£10,000
Milan Expo May to Oct 2015
Euro Food (UK) Ltd Non-monetary estimated value
£33,000
Milan Expo May to Oct 2015
Altro Ltd Non-monetary estimated value
£9,000
Milan Expo May to Oct 2015
ClearComm UK Ltd Non-monetary estimated value
£18,000
Milan Expo May to Oct 2015
AMX by Harman Non-monetary estimated value
£42,000
Milan Expo May to Oct 2015
Sysco Corporation Non-monetary estimated value
£35,000
Milan Expo May to Oct 2015
Gateway Ltd Non-monetary estimated value
£30,000
Milan Expo May to Oct 2015
Mosimann's Ltd Non-monetary estimated value
£616,000
Milan Expo May to Oct 2015
Mercator Media Ltd Non-monetary estimated value
£7,000
Seawork Exhibition – Southampton, June 2014
Aerospace Defence Security Space (ADS) Ltd
Non-monetary estimated value
£100,000
Security & Policing exhibition, Farnborough, 10-12 March 2015
Standard Chartered Bank PLC 15,000 UK-ASEAN Business Council Partnership
Various overseas exhibition organisers Non-monetary estimated value
£160,000
Various DSO attended exhibitions overseas
This table is not subject to audit.
Where necessary, conversion is at the average exchange rate for the year.

82
Annex E Acronyms
AME Annually Managed Expenditure
AO Accounting Officer
ARAC Audit and Risk Assurance Committee
BIS Department for Business, Innovation & Skills
C&AG Comptroller and Auditor General
CBE Commander of the British Empire
CBI Confederation of British Industry
CETV Cash Equivalent Transfer Value
CEO Chief Executive Officer
CFER Consolidated Funds Extra Receipts
CPD Continued Professional Development
CSC Civil Service Code
CMG Companion of the Order of St Michael and St George
CODM Chief Operating Decision Maker
CRM Customer Relationship Management
DEL Departmental Expenditure Limit
DGP Defence Growth Partnership
DTI Department for Trade and Industry
EAR Expenditure Allocation report
EU European Union
FCO Foreign & Commonwealth Office
FDI Foreign Direct Investment
FReM Financial Reporting Manual
FY Financial Year
GCP Global Commercial Partners
GEP Global Entrepreneur Programme
HM Her Majesty’s
HMRC Her Majesty’s Revenue and Customs
HMT Her Majesty’s Treasury
HQ Headquarters
HVO High Value Opportunities
IAS International Accounting Standards
ICT Information and Communications Technologies
IFRS International Financial Reporting Standards
IiP Investors in People
ITA International Trade Adviser
MP Member of Parliament
MSBs Medium-sized Businesses
MSEU Material & Strategic Engagement Unit
NAO National Audit Office
NCR Net Cash Requirement
OBE Order of the British Empire
OBNI Overseas Business Network Initiative
OBR Office of Budget Responsibility
OMIS Overseas Market Introduction Service
PCPSP Parliamentary Contributory Pension Fund
PIMS Performance and Impact Monitoring Survey
SoPS Statement of Parliamentary Supply
SRM Strategic Relationship Management
SSRB Senior Salaries Review Body
TCP Trade Challenge Partners
ToR Terms of Reference
UK United Kingdom
UKEF UK Export Finance
UK SBS UK Shared Business Services
UKTI UK Trade & Investment
UKTI DSO UKTI Defence & Security Organisation
VAT Value Added Tax

Front cover: UK Trade & Investment 2014-15 in pictures
Top row left to right: Panel discussion at UKTI China Focus, International Festival for Business, Liverpool; Fashion Show at the Pure London event; Prime Minister David Cameron speaks at the UK Investment Summit in Newport, Wales
Middle row: HRH The Duke of Cambridge opening the GREAT Festival of Creativity, Shanghai
Bottom row left to right: UK Defence & Security Showcase, NATO Summit, Wales; Chancellor of the Exchequer, George Osborne speaks at the Commonwealth Games Business Conference; GREAT Campaign at Paris Gare du Nord

UK Trade &
Investment Annual Report and Accounts 2014-15
Related Documents