UK Renal Registry 17th Annual Report Figure 2.1. Prevalence rates per million population by age group and UK country on 31/12/2013

UK Renal Registry 17th Annual Report Figure 2.1. Prevalence rates per million population by age group and UK country on 31/12/2013.
Jan 03, 2016
Welcome message from author
This document is posted to help you gain knowledge. Please leave a comment to let me know what you think about it! Share it to your friends and learn new things together.
Transcript

UK Renal Registry 17th Annual Report
Figure 2.1. Prevalence rates per million population by age group and UK country on 31/12/2013

UK Renal Registry 17th Annual Report
Figure 2.2. Growth in prevalent patients by treatment modality at the end of each year 1997–2013

UK Renal Registry 17th Annual Report
Figure 2.3. Standardised prevalence ratios for CCG/HB areas by percentage non-White on 31/12/2013
(excluding areas with <5% ethnic minorities)

UK Renal Registry 17th Annual Report
Figure 2.4. Age profile of prevalent RRT patients by modality on 31/12/2013

UK Renal Registry 17th Annual Report
Figure 2.5. Prevalence rate of RRT patients per million population by age and gender on 31/12/2013

UK Renal Registry 17th Annual Report
Figure 2.6. Treatment modality in prevalent RRT patients on 31/12/2013

UK Renal Registry 17th Annual Report
Figure 2.7. Treatment modality distribution by age in prevalent RRT patients on 31/12/2013
N = 35
UK Renal Registry 17th Annual Report
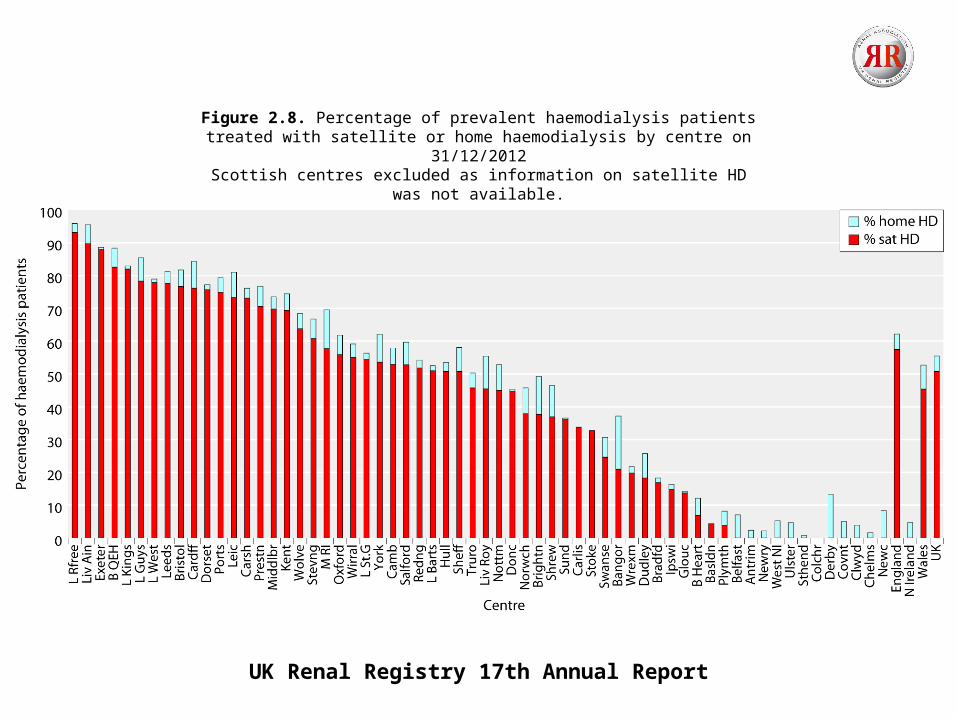
Figure 2.8. Percentage of prevalent haemodialysis patients treated with satellite or home haemodialysis by centre on 31/12/2012
Scottish centres excluded as information on satellite HD was not available.No centres in Northern Ireland have satellite dialysis units

UK Renal Registry 17th Annual Report
Figure 2.9. Modality changes in prevalent RRT patients from 1998–2013

UK Renal Registry 17th Annual Report
Figure 2.10. Detailed dialysis modality changes in prevalent RRT patients from 1998–2013
Scottish centres excluded as information on satellite HD was not available

UK Renal Registry 17th Annual Report
Figure 2.11. RRT prevalence rates (pmp) by country in 2011Non-UK data from USRDS
The UK data include paediatric patients to agree with the data from the other countries.
All rates unadjusted. Japan is dialysis only.Data for France include 25 regions in 2011.
Related Documents