UK Renal Registry 16th Annual Report Figure 8.1. Trend in 1 year after 90 day incident patient survival by first modality, 2005–2011 cohort (adjusted to age 60) (excluding patients whose first modality was transplantation)

UK Renal Registry 16th Annual Report Figure 8.1. Trend in 1 year after 90 day incident patient survival by first modality, 2005–2011 cohort (adjusted to.
Dec 22, 2015
Welcome message from author
This document is posted to help you gain knowledge. Please leave a comment to let me know what you think about it! Share it to your friends and learn new things together.
Transcript
UK Renal Registry 16th Annual Report
Figure 8.1. Trend in 1 year after 90 day incident patient survival by first modality, 2005–2011 cohort (adjusted to age 60)
(excluding patients whose first modality was transplantation)
UK Renal Registry 16th Annual Report
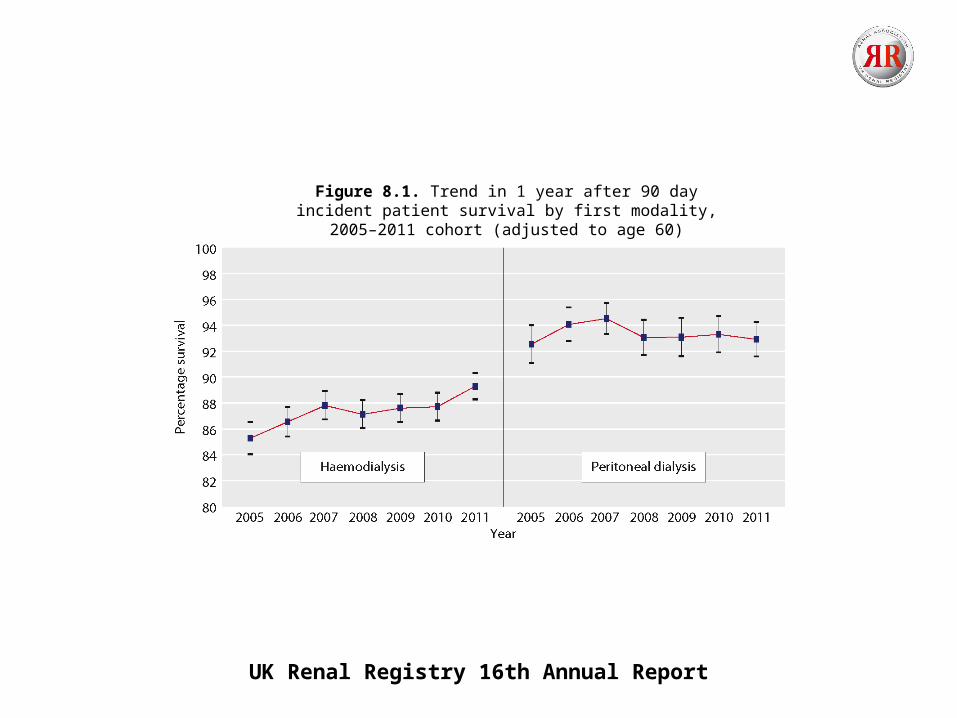
Figure 8.2. Unadjusted survival of incident patients by age group, 2011 cohort
UK Renal Registry 16th Annual Report
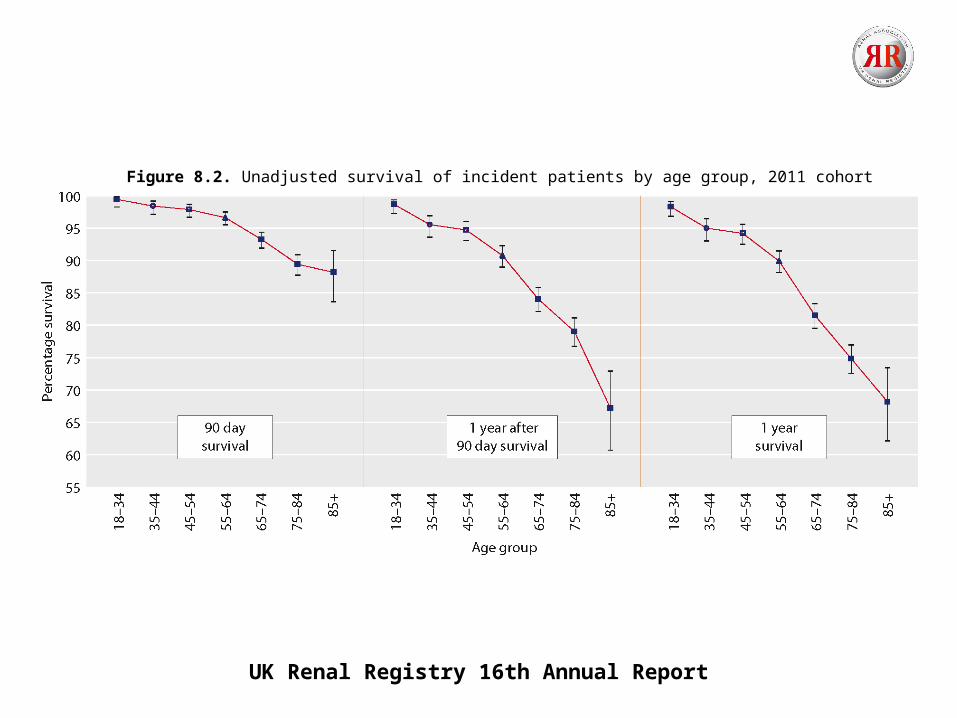
Figure 8.3. One year after 90 days death rate per 1,000 patient yearsby UK country and age group for incident patients, 2008–2011 cohort
UK Renal Registry 16th Annual Report
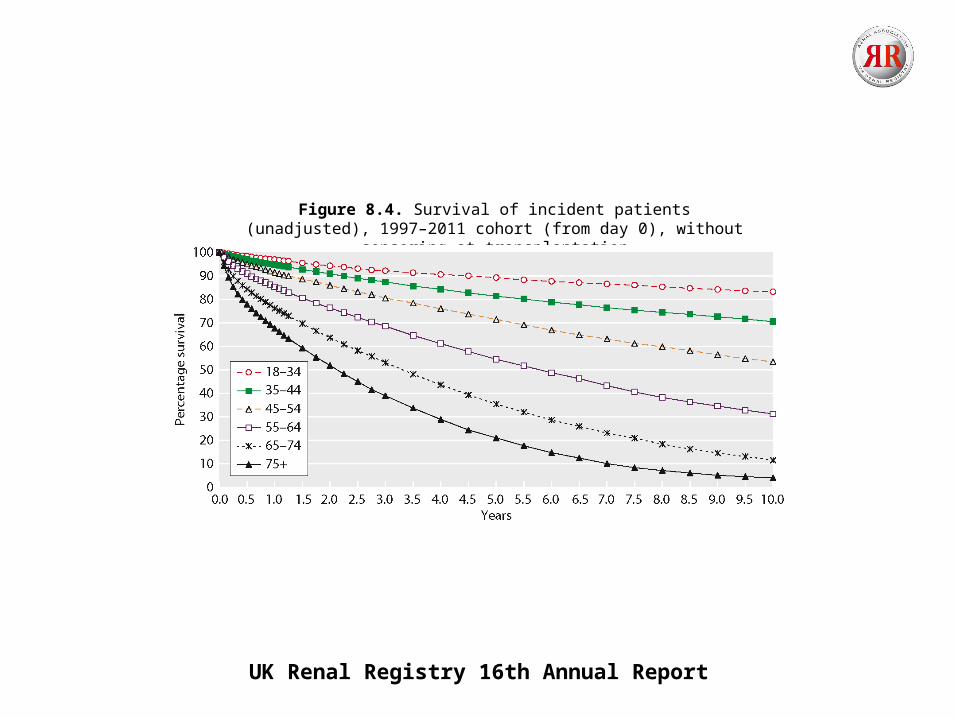
Figure 8.4. Survival of incident patients (unadjusted), 1997–2011 cohort (from day 0), without censoring at transplantation
UK Renal Registry 16th Annual Report
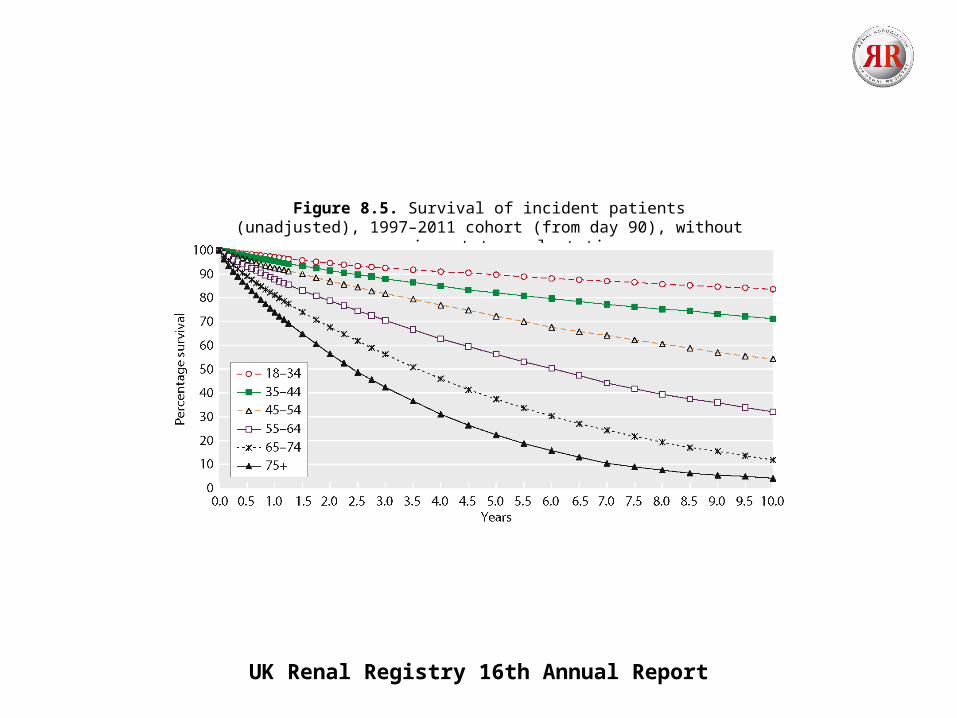
Figure 8.5. Survival of incident patients (unadjusted), 1997–2011 cohort (from day 90), without censoring at transplantation
UK Renal Registry 16th Annual Report
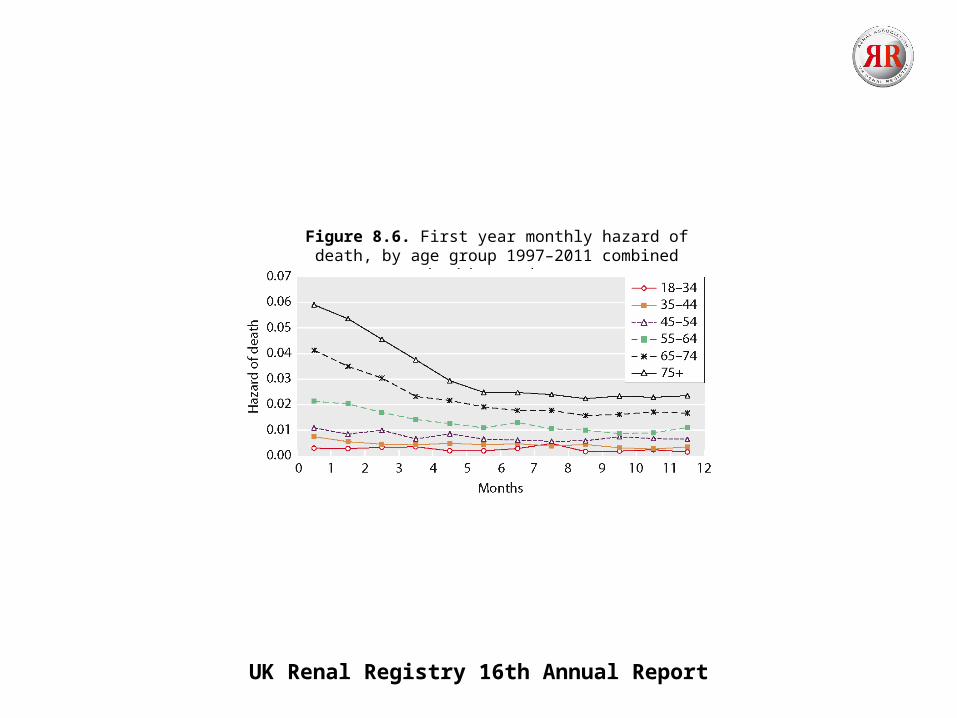
Figure 8.6. First year monthly hazard of death, by age group 1997–2011 combined incident cohort
UK Renal Registry 16th Annual Report
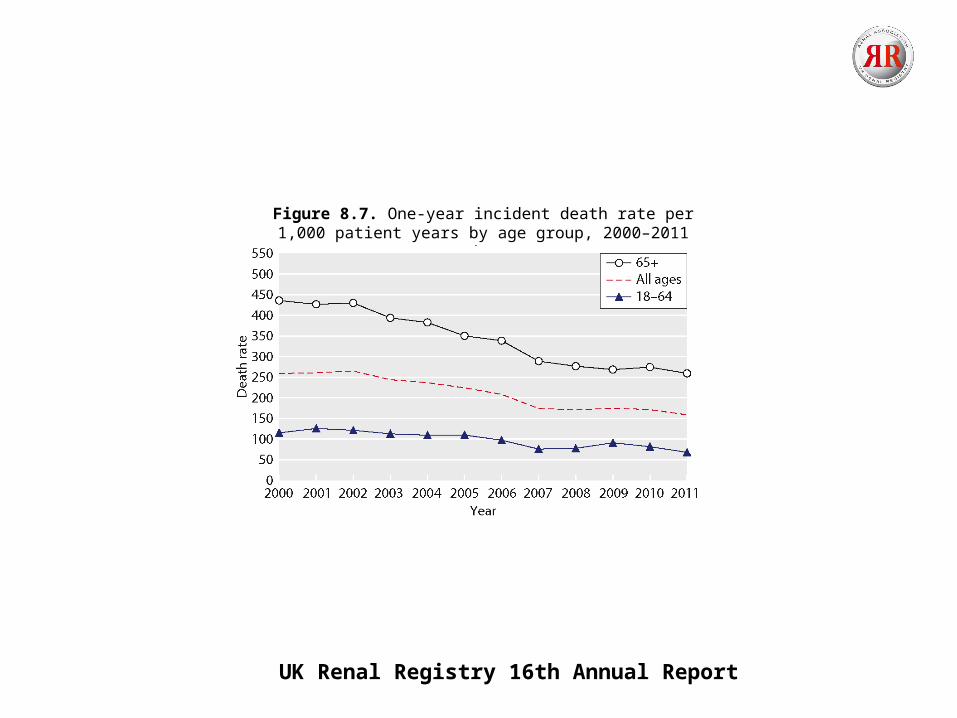
Figure 8.7. One-year incident death rate per 1,000 patient years by age group, 2000–2011 cohort
UK Renal Registry 16th Annual Report
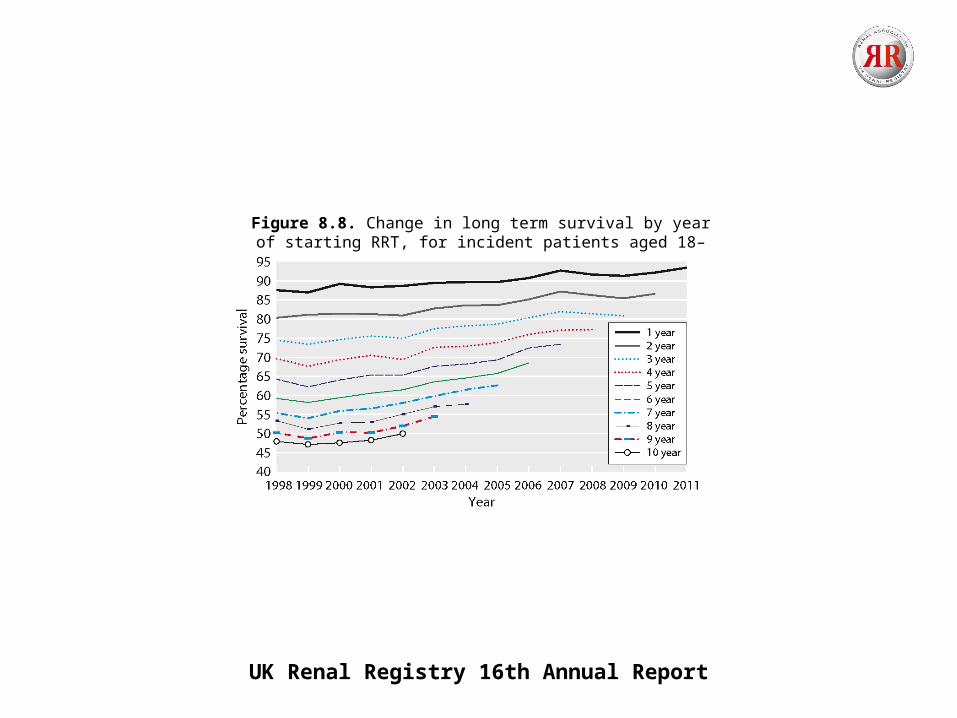
Figure 8.8. Change in long term survival by year of starting RRT, for incident patients aged 18–64 years
UK Renal Registry 16th Annual Report
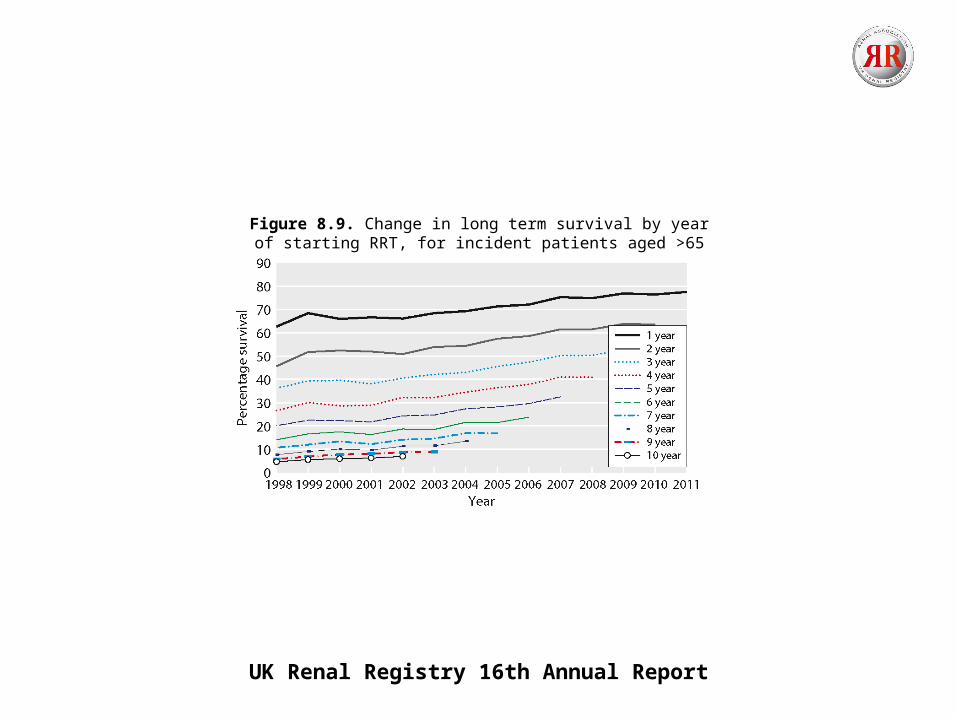
Figure 8.9. Change in long term survival by year of starting RRT, for incident patients aged >65 years
UK Renal Registry 16th Annual Report
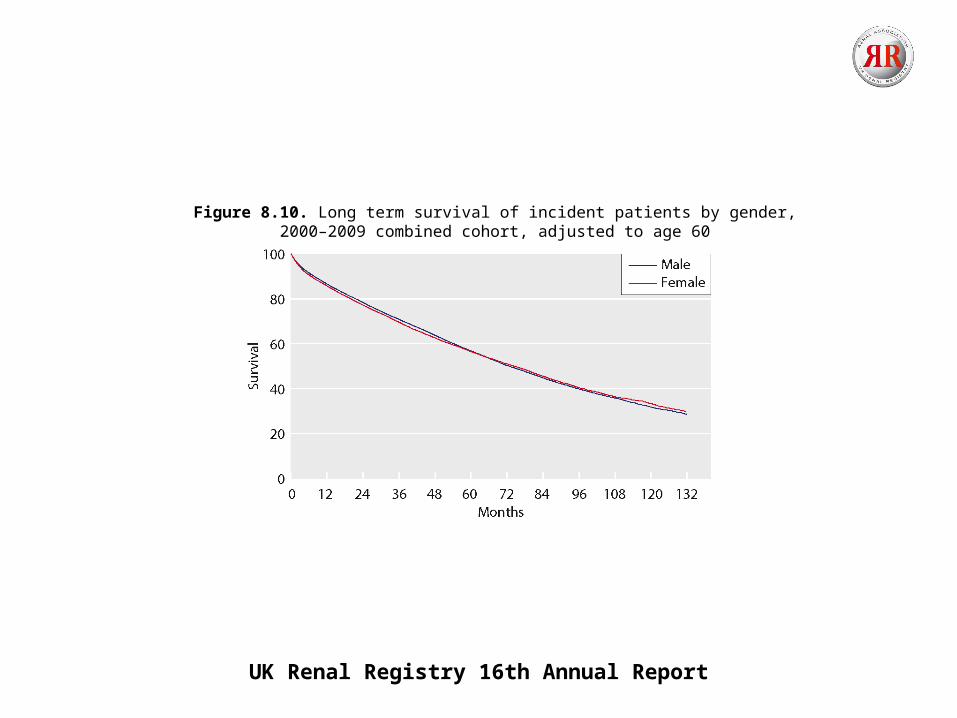
Figure 8.10. Long term survival of incident patients by gender,2000–2009 combined cohort, adjusted to age 60
UK Renal Registry 16th Annual Report
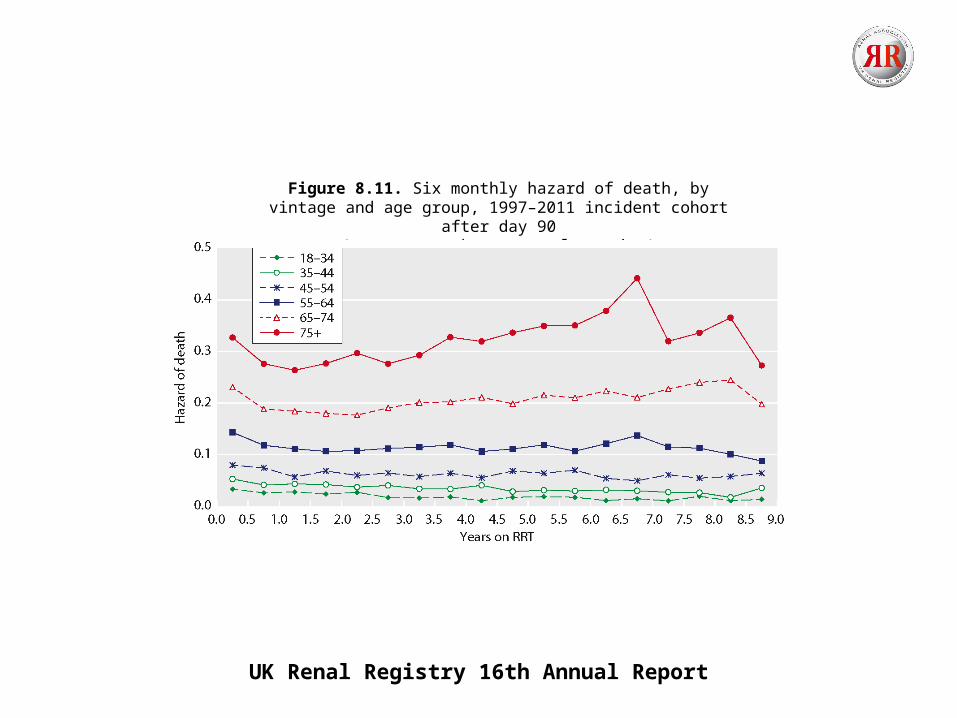
Figure 8.11. Six monthly hazard of death, by vintage and age group, 1997–2011 incident cohort after day 90
(not censored at transplantation)
UK Renal Registry 16th Annual Report
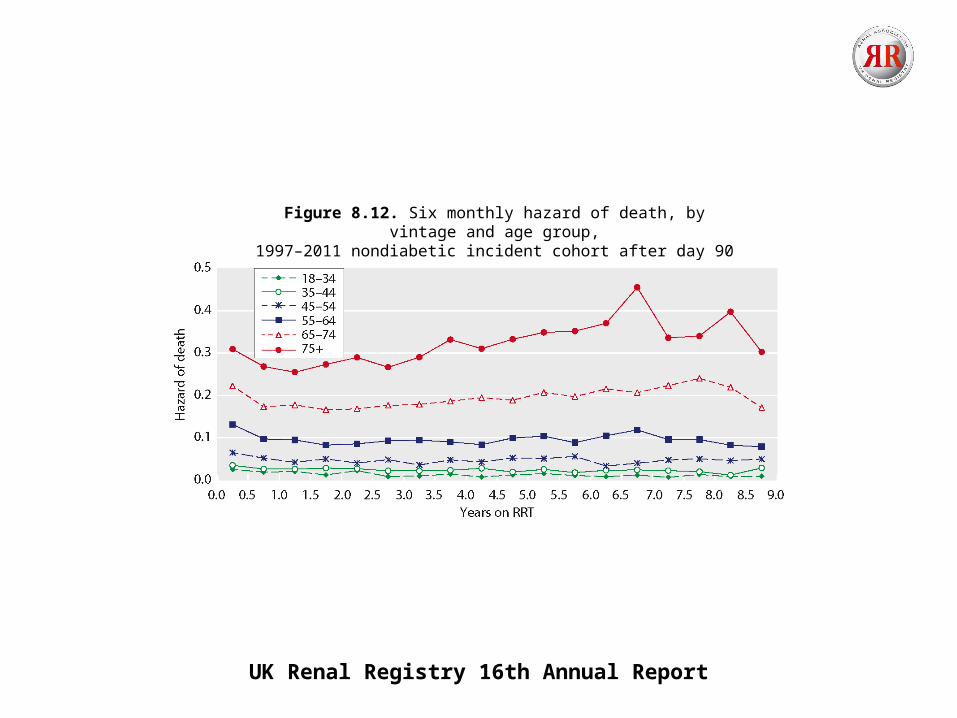
Figure 8.12. Six monthly hazard of death, by vintage and age group,1997–2011 nondiabetic incident cohort after day 90
(not censored at transplantation)
UK Renal Registry 16th Annual Report
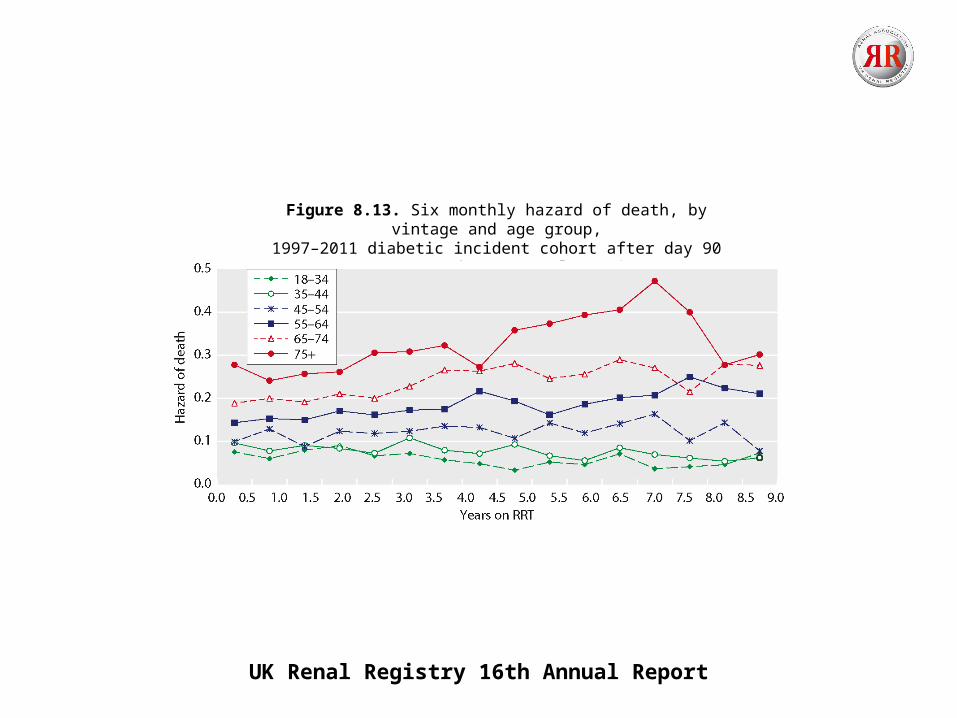
Figure 8.13. Six monthly hazard of death, by vintage and age group,1997–2011 diabetic incident cohort after day 90
(not censored at transplantation)
UK Renal Registry 16th Annual Report
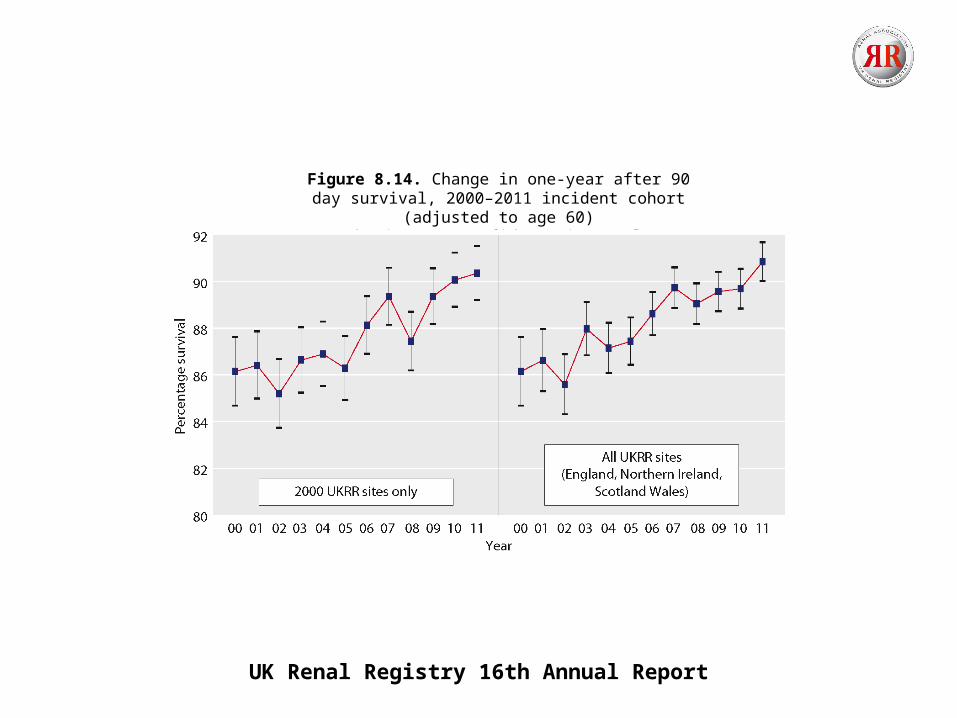
Figure 8.14. Change in one-year after 90 day survival, 2000–2011 incident cohort (adjusted to age 60)
Showing 95% confidence intervals
UK Renal Registry 16th Annual Report
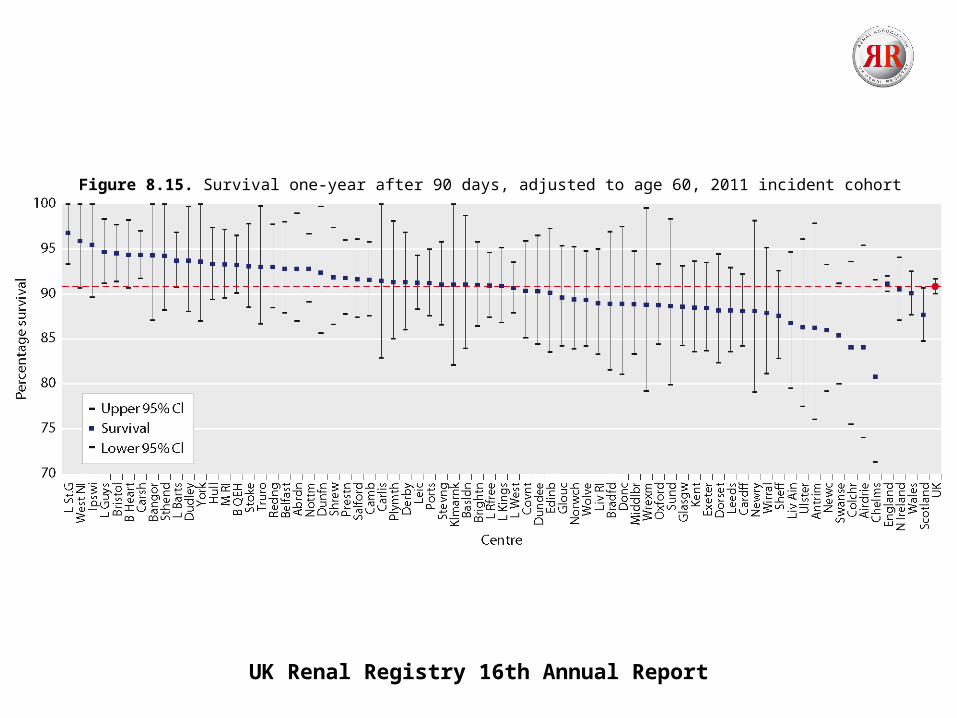
Figure 8.15. Survival one-year after 90 days, adjusted to age 60, 2011 incident cohort
UK Renal Registry 16th Annual Report
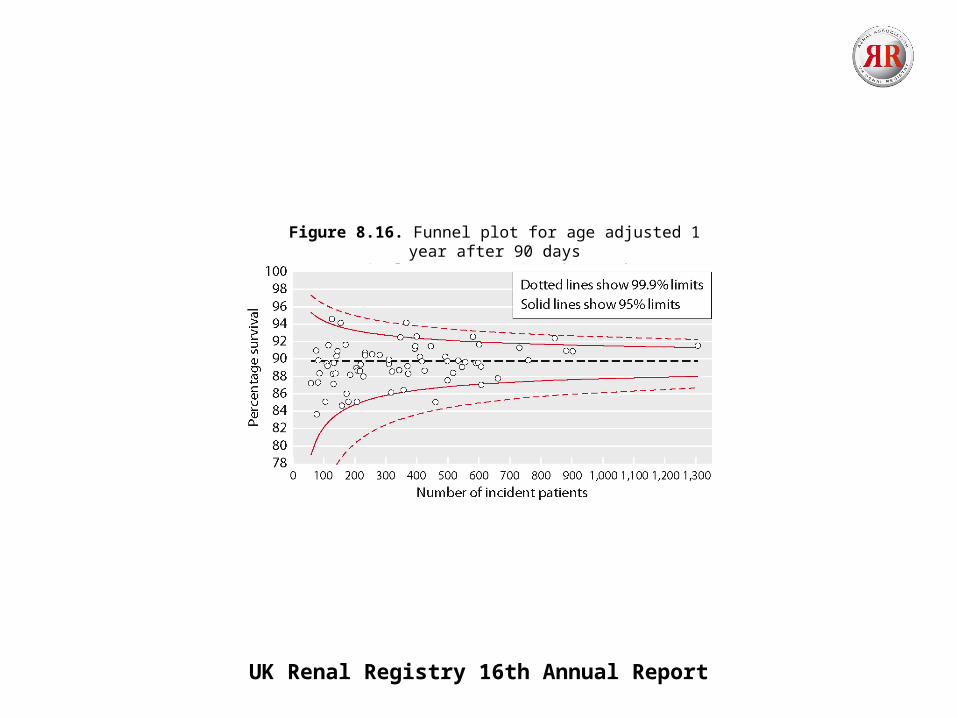
Figure 8.16. Funnel plot for age adjusted 1 year after 90 dayssurvival, 2008–2011 incident cohort

UK Renal Registry 16th Annual Report
Figure 8.17. The effect on survival after sequential adjustment for age, PRD and comorbidity, 2007–2011 incident cohort
UK Renal Registry 16th Annual Report
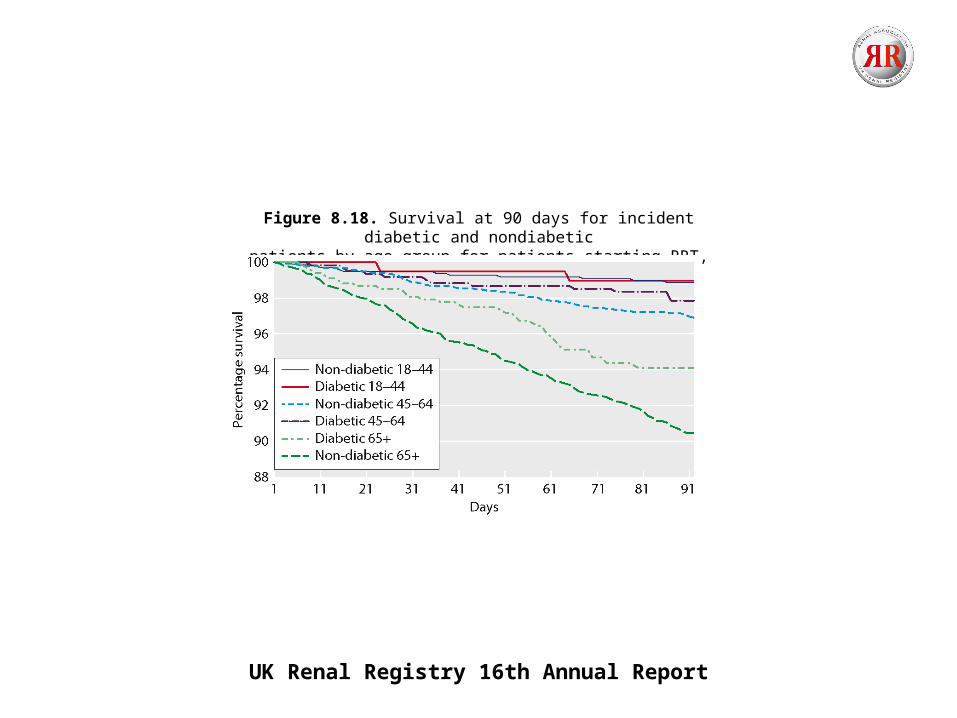
Figure 8.18. Survival at 90 days for incident diabetic and nondiabeticpatients by age group for patients starting RRT, 2011 cohort
UK Renal Registry 16th Annual Report
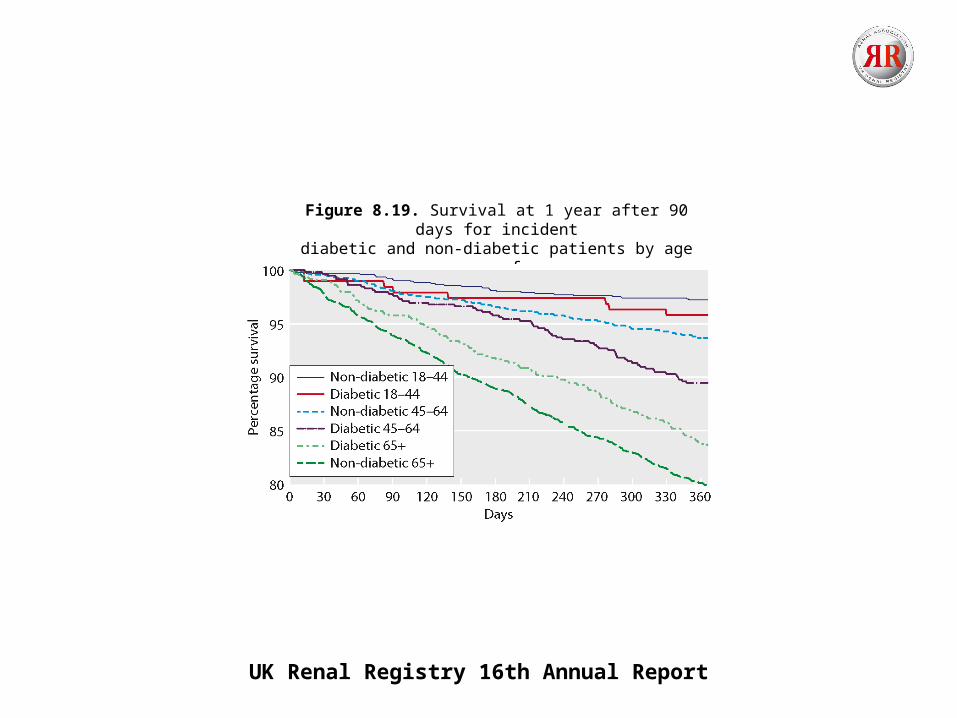
Figure 8.19. Survival at 1 year after 90 days for incidentdiabetic and non-diabetic patients by age group for
patients starting RRT, 2011 cohort
UK Renal Registry 16th Annual Report
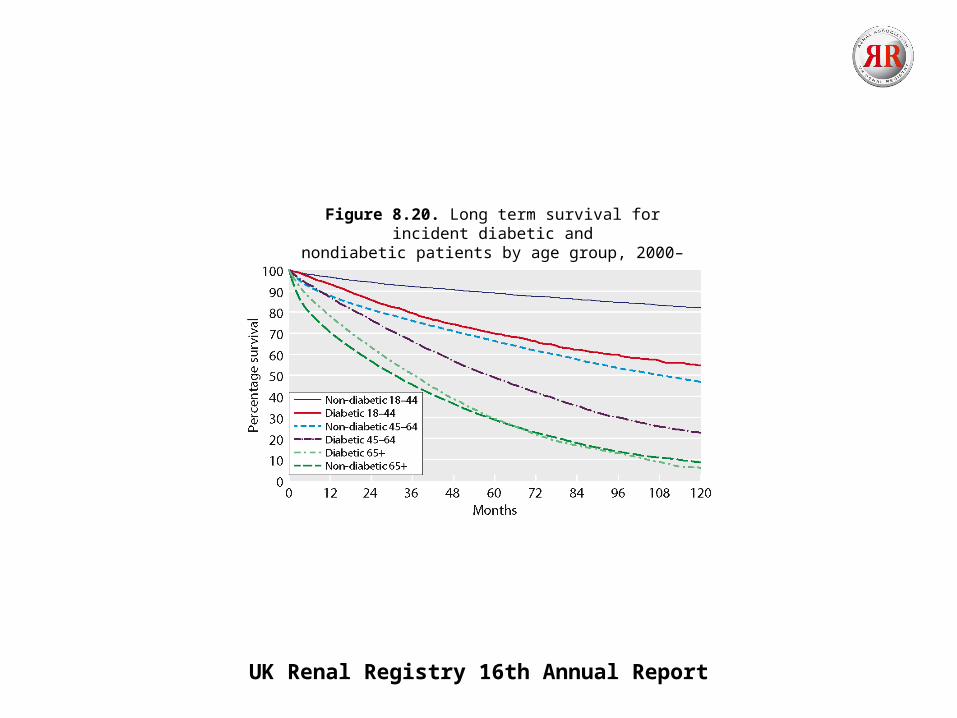
Figure 8.20. Long term survival for incident diabetic andnondiabetic patients by age group, 2000–2009 cohort,
followed up for a minimum of 3 years
UK Renal Registry 16th Annual Report
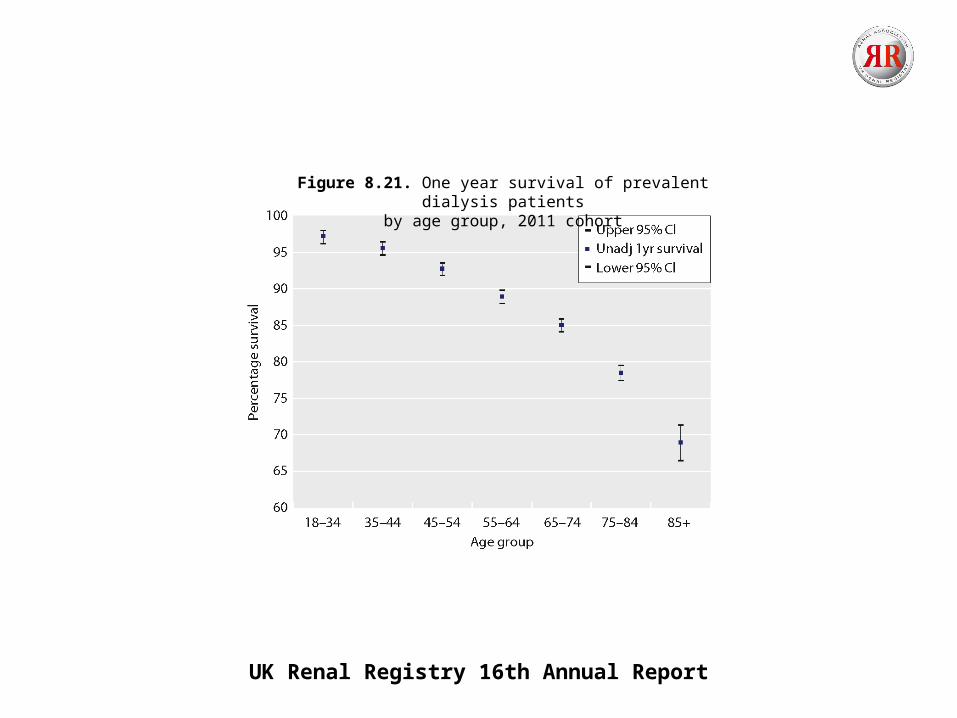
Figure 8.21. One year survival of prevalent dialysis patientsby age group, 2011 cohort
UK Renal Registry 16th Annual Report
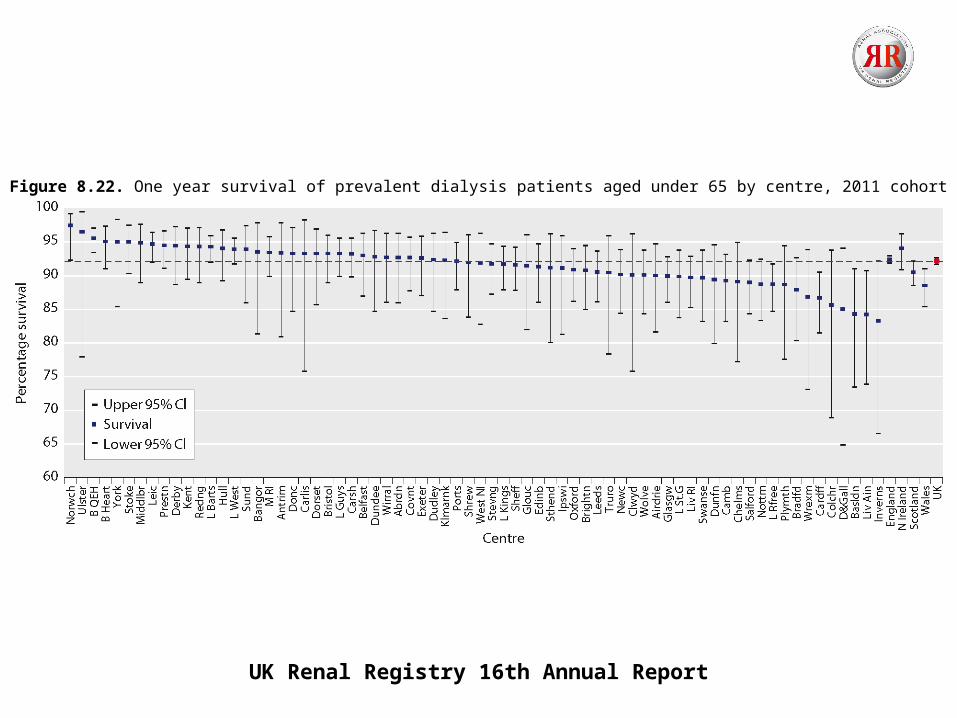
Figure 8.22. One year survival of prevalent dialysis patients aged under 65 by centre, 2011 cohort

UK Renal Registry 16th Annual Report
Figure 8.23. One year survival of prevalent dialysis patients aged 65 years and over by centre, 2011 cohort
UK Renal Registry 16th Annual Report
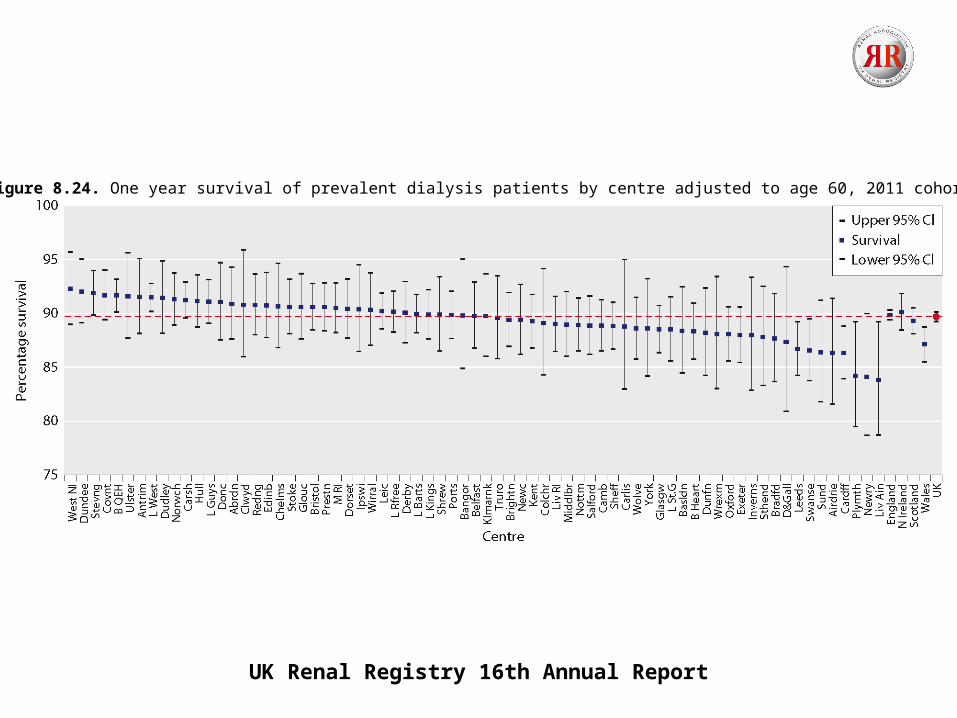
Figure 8.24. One year survival of prevalent dialysis patients by centre adjusted to age 60, 2011 cohort
UK Renal Registry 16th Annual Report
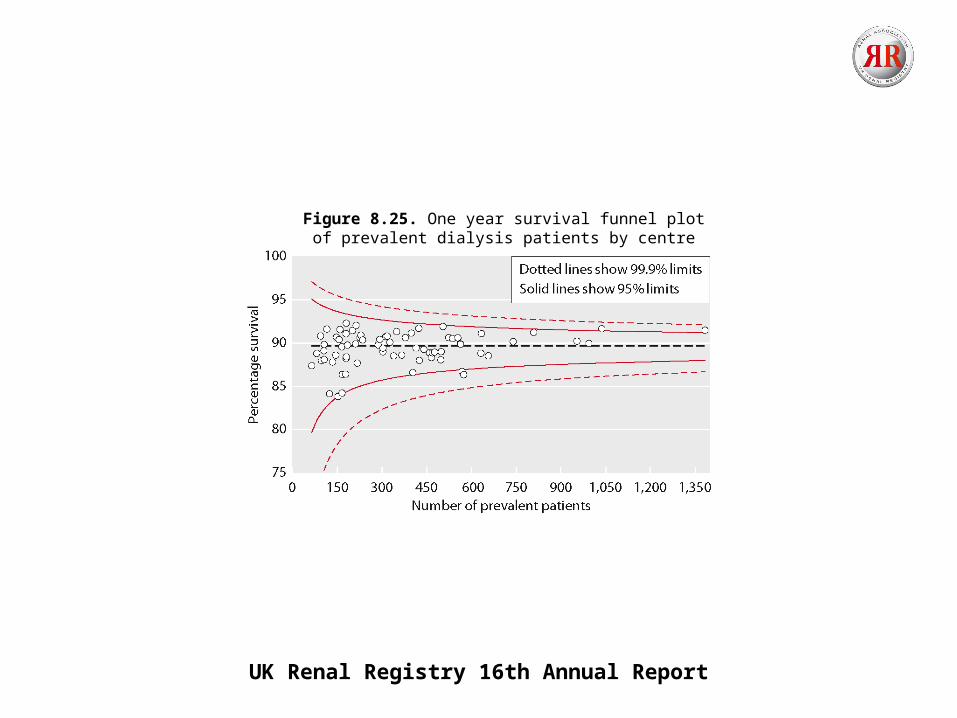
Figure 8.25. One year survival funnel plot of prevalent dialysis patients by centre adjusted to age 60, 2011 cohort
UK Renal Registry 16th Annual Report
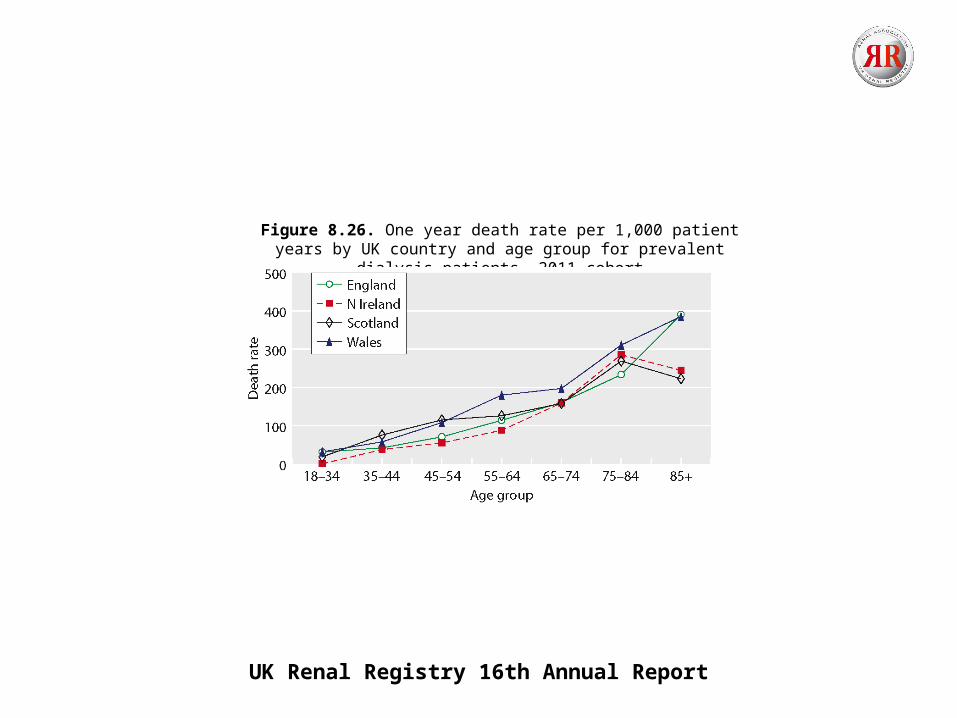
Figure 8.26. One year death rate per 1,000 patient years by UK country and age group for prevalent dialysis patients, 2011 cohort
UK Renal Registry 16th Annual Report
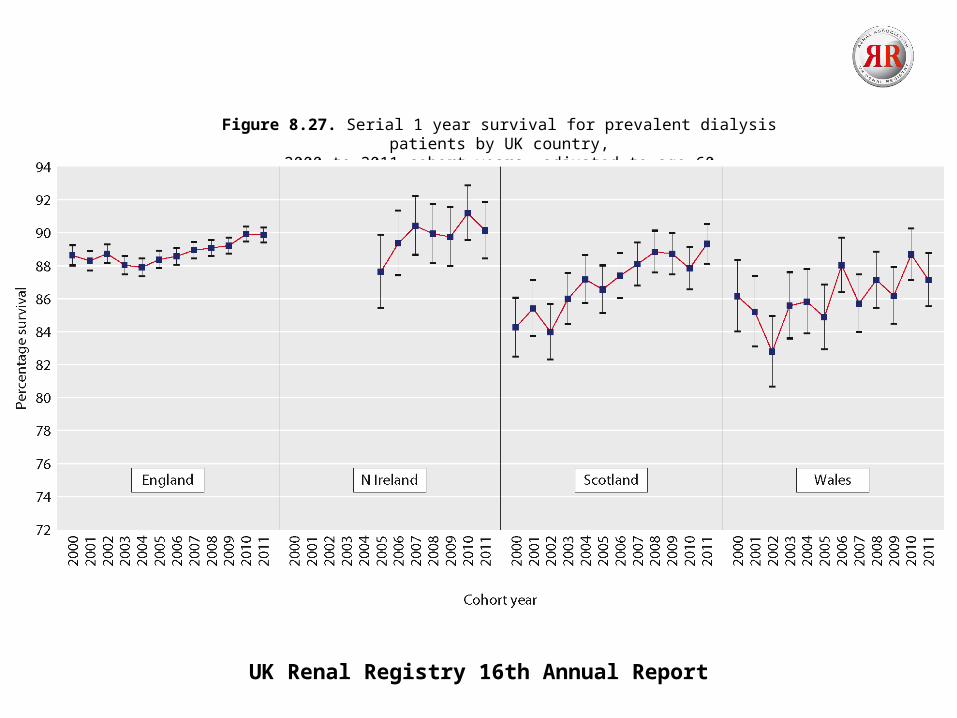
Figure 8.27. Serial 1 year survival for prevalent dialysis patients by UK country,2000 to 2011 cohort years, adjusted to age 60
UK Renal Registry 16th Annual Report
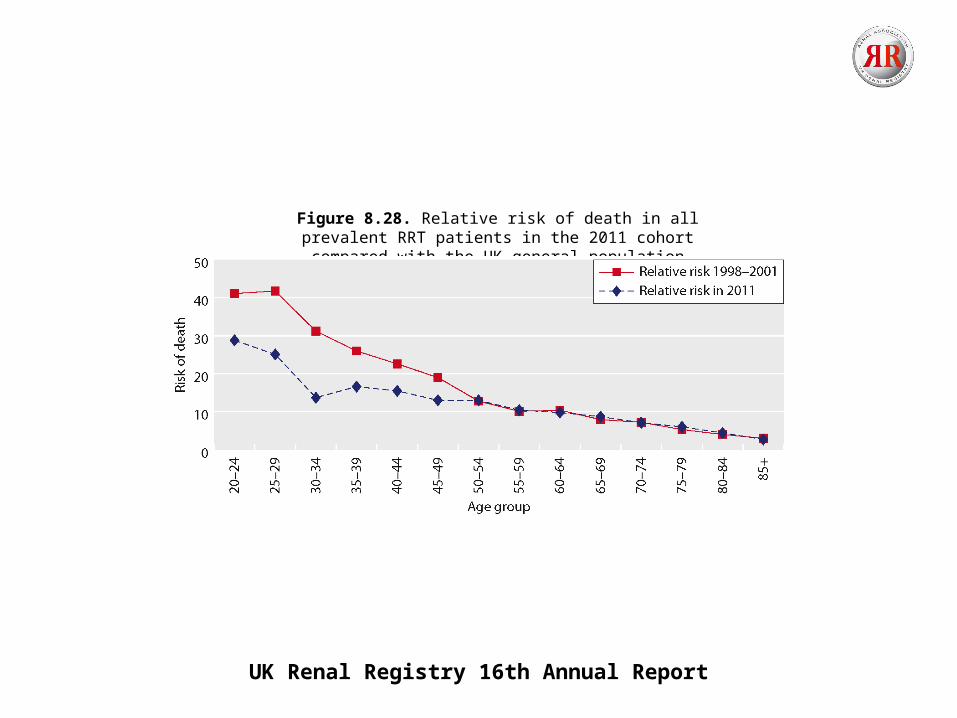
Figure 8.28. Relative risk of death in all prevalent RRT patients in the 2011 cohort compared with the UK general population

UK Renal Registry 16th Annual Report
Figure 8.29. Percentage contribution to cause of deathfor prevalent dialysis patients, 2011 cohort
UK Renal Registry 16th Annual Report
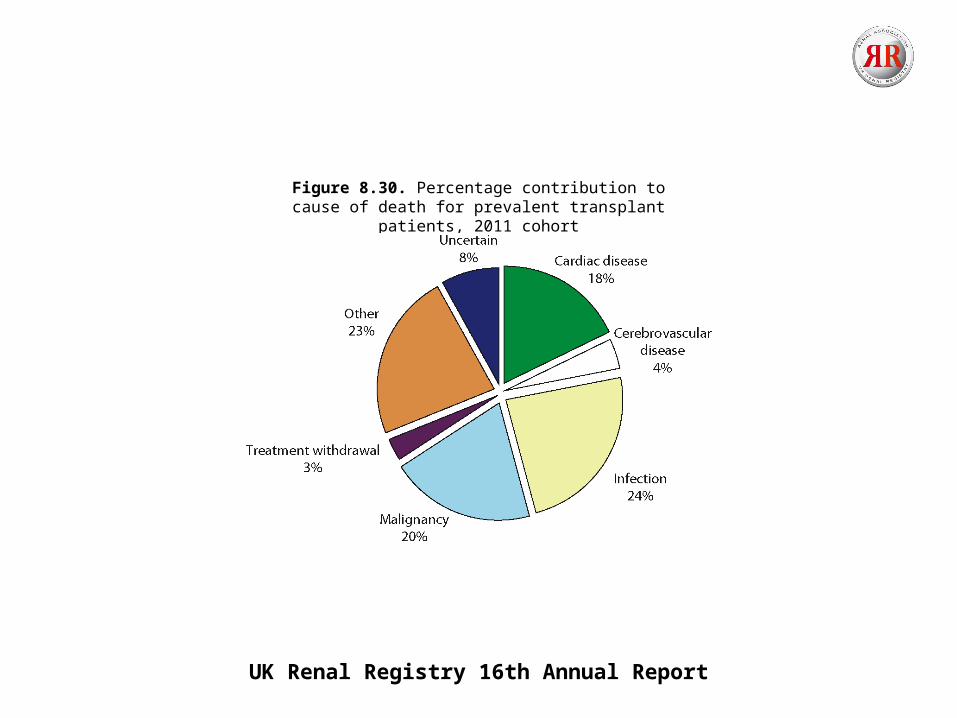
Figure 8.30. Percentage contribution to cause of death for prevalent transplant patients, 2011 cohort
UK Renal Registry 16th Annual Report
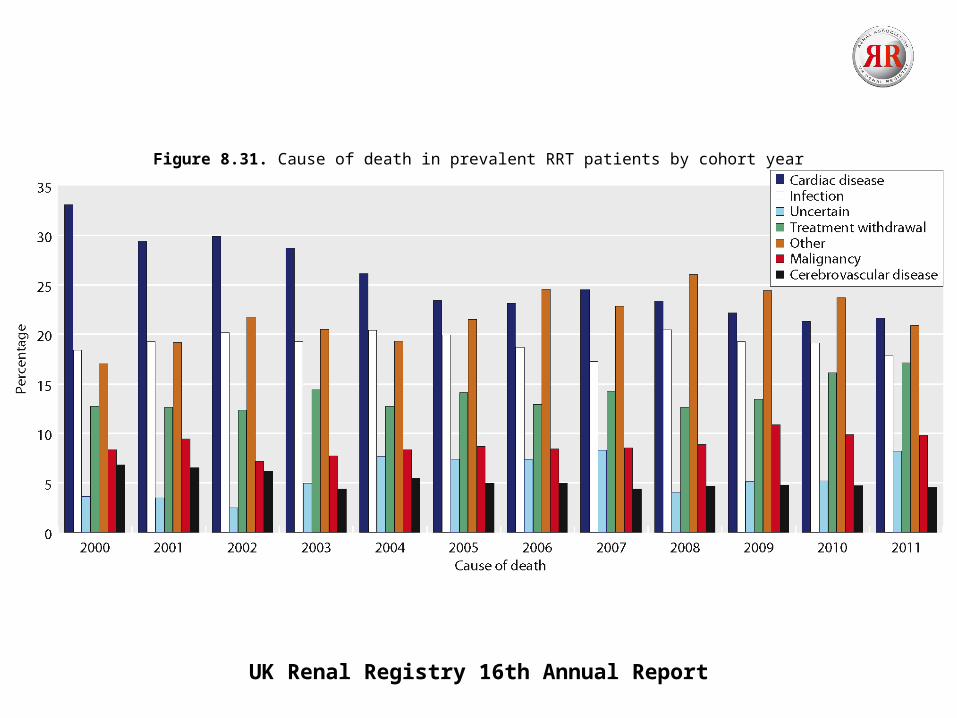
Figure 8.31. Cause of death in prevalent RRT patients by cohort year

UK Renal Registry 16th Annual Report
Figure 8.32. Median life expectancy on RRT after 90 days,by age group, incident patients starting RRT from 2000–2009
UK Renal Registry 16th Annual Report
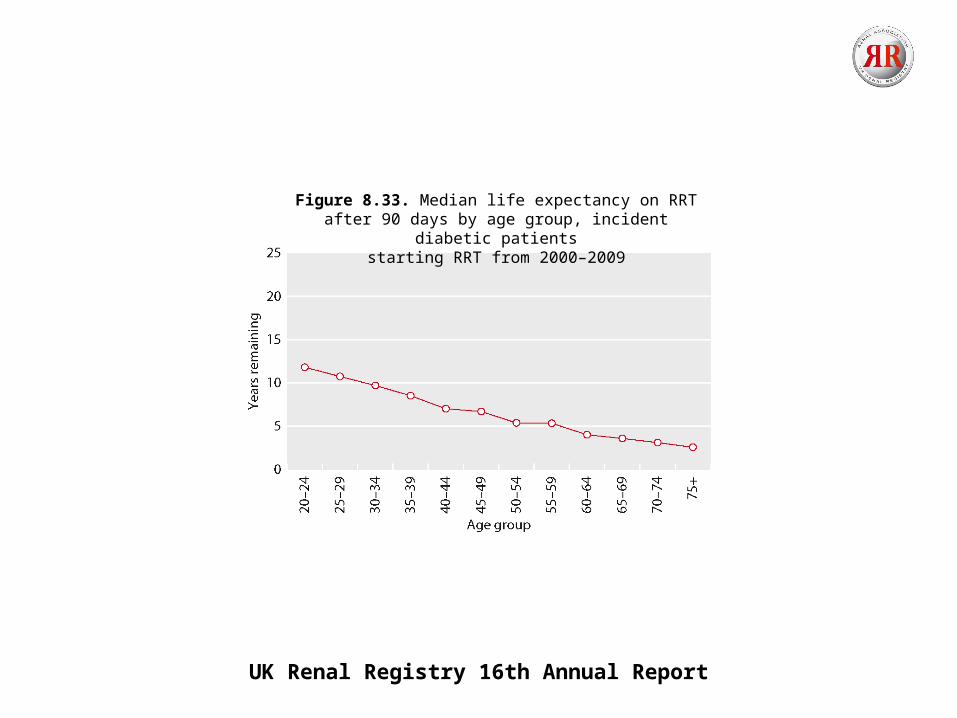
Figure 8.33. Median life expectancy on RRT after 90 days by age group, incident diabetic patients
starting RRT from 2000–2009
Related Documents