UK Renal Registry 16th Annual Report: Chapter 1 UK Renal Replacement Therapy Incidence in 2012: National and Centre-specific Analyses Julie Gilg a , Anirudh Rao a , Damian Fogarty ab a UK Renal Registry, Bristol, UK; b Centre for Public Health, Queen’s University Belfast and Belfast Health and Social Care Trust Key Words Acceptance rates . Comorbidity . Dialysis . End stage renal disease . End stage renal failure . Established renal failure . Haemodialysis . Incidence . Peritoneal dialysis . Registries . Renal replacement therapy . Transplantation . Treatment modality Summary . In 2012 the incidence rate in the UK was stable at 108 per million population (pmp) reflecting renal replacement therapy (RRT) initiation for 6,891 new patients. . From 2006 to 2012 the incidence rate pmp was stable for England but had increased from 95 pmp in 2001. . The median age of all incident patients was 64.6 years but this is highly dependant on race (66.1 for White incident patients; 57.8 for non-White patients). . Diabetic renal disease remained the single most common cause of renal failure (26%). . By 90 days, 66.9% of patients were on haemo- dialysis, 19.0% on peritoneal dialysis, 8.3% had had a transplant and 5.9% had died or stopped treatment. . The mean eGFR at the start of RRT was 8.5 ml/min/ 1.73 m 2 similar to the previous four years. . Late presentation (,90 days) fell from 23.9% in 2006 to 19.3% in 2012. 9

Welcome message from author
This document is posted to help you gain knowledge. Please leave a comment to let me know what you think about it! Share it to your friends and learn new things together.
Transcript
UK Renal Registry 16th Annual Report:Chapter 1 UK Renal Replacement TherapyIncidence in 2012: National andCentre-specific Analyses
Julie Gilga, Anirudh Raoa, Damian Fogartyab
aUK Renal Registry, Bristol, UK; bCentre for Public Health, Queen’s University Belfast and Belfast Health andSocial Care Trust
Key WordsAcceptance rates . Comorbidity . Dialysis . End stage renaldisease . End stage renal failure . Established renal failure .Haemodialysis . Incidence . Peritoneal dialysis . Registries .Renal replacement therapy . Transplantation . Treatmentmodality
Summary
. In 2012 the incidence rate in the UK was stable at108 per million population (pmp) reflecting renalreplacement therapy (RRT) initiation for 6,891new patients.
. From 2006 to 2012 the incidence rate pmp wasstable for England but had increased from 95 pmpin 2001.
. The median age of all incident patients was 64.6years but this is highly dependant on race (66.1for White incident patients; 57.8 for non-Whitepatients).
. Diabetic renal disease remained the single mostcommon cause of renal failure (26%).
. By 90 days, 66.9% of patients were on haemo-dialysis, 19.0% on peritoneal dialysis, 8.3% hadhad a transplant and 5.9% had died or stoppedtreatment.
. The mean eGFR at the start of RRT was 8.5 ml/min/1.73 m2 similar to the previous four years.
. Late presentation (,90 days) fell from 23.9% in2006 to 19.3% in 2012.
9
Introduction
This chapter contains analyses of adult patients startingrenal replacement therapy (RRT) in the UK in 2012. Itdescribes regional and national variations in incidencerates of RRT, the demographic and clinical characteristicsof all patients starting RRT and analyses of late presen-tation and delayed referral. The methodology and resultsfor these analyses are in three separate sections.
DefinitionsThe definition of incident patients is given in detail in
appendix B: Definitions and Analysis Criteria (www.renalreg.com). In brief, it is all patients over 18 whocommenced RRT in the UK in 2012 and who did notrecover renal function within 90 days. Importantly thisdoes not include those with a failed renal transplantwho returned to dialysis as they had already started RRT.
Differences may be seen in the 2007 to 2011 numbersnow quoted when compared with previous publicationsbecause of retrospective updating of data in collaborationwith renal centres, in particular for patients who wereinitially thought to have acute renal failure. Whereapplicable and possible, pre-emptive transplant patientswere allocated to their work up centre rather than theirtransplant centre. However, this was not possible for allsuch patients and consequently some patients probablyremain incorrectly allocated to the transplanting centre.The term established renal failure (ERF) as used withinthis chapter is synonymous with the terms end stagerenal failure/disease (ESRF or ESRD).
UK Renal Registry coverageThe UK Renal Registry (UKRR) received individual
patient level data from all 71 adult renal centres in theUK (five renal centres in Wales, five in Northern Ireland,nine in Scotland, 52 in England). Data from centres inScotland were obtained from the Scottish Renal Registry.Data on children and young adults can be found inchapter 7: Demography of the UK Paediatric RenalReplacement Therapy population in 2012.
1. Geographical variation in incidence rates
Over the years, there have been wide variations in inci-dence rates between renal centres. Equity of access toRRT is an important aim but hard to assess as the needfor RRT depends on many variables including medical,
social and demographic factors such as underlyingconditions, age, gender, social deprivation and ethnicity.Thus, comparison of crude incidence rates by geographi-cal area can be misleading. This year’s report again usesage and gender standardisation of PCT/HB rates as wellas showing crude rates. It also gives the ethnic minoritypercentage of each area as this influences incidence rates.
The UKRR investigated the effect of socio-demographic, population health status and access tocare factors on RRT incidence. This work suggestedthat population age, socio-economic deprivation andthe proportion of non-White residents were able toexplain 22% of the observed variation in RRT incidence.The prevalence of diabetes in an area explained a further4% of the variation and access to complex healthprocedures (CABG/coronary angioplasty) a further 6%[1]. Much of the observed variation (about 2/3rds)remains unexplained and may be due to unmeasuredelements of the above factors or be due to differences inpractice patterns at individual renal centres which havenot yet been captured.
MethodsCrude incidence rates were calculated per million population
(pmp) and age/gender standardised incidence ratios were calcu-lated as detailed in appendix D: Methodology used for Analyses(www.renalreg.com).
ResultsIn 2012, the number of adult patients starting RRT in
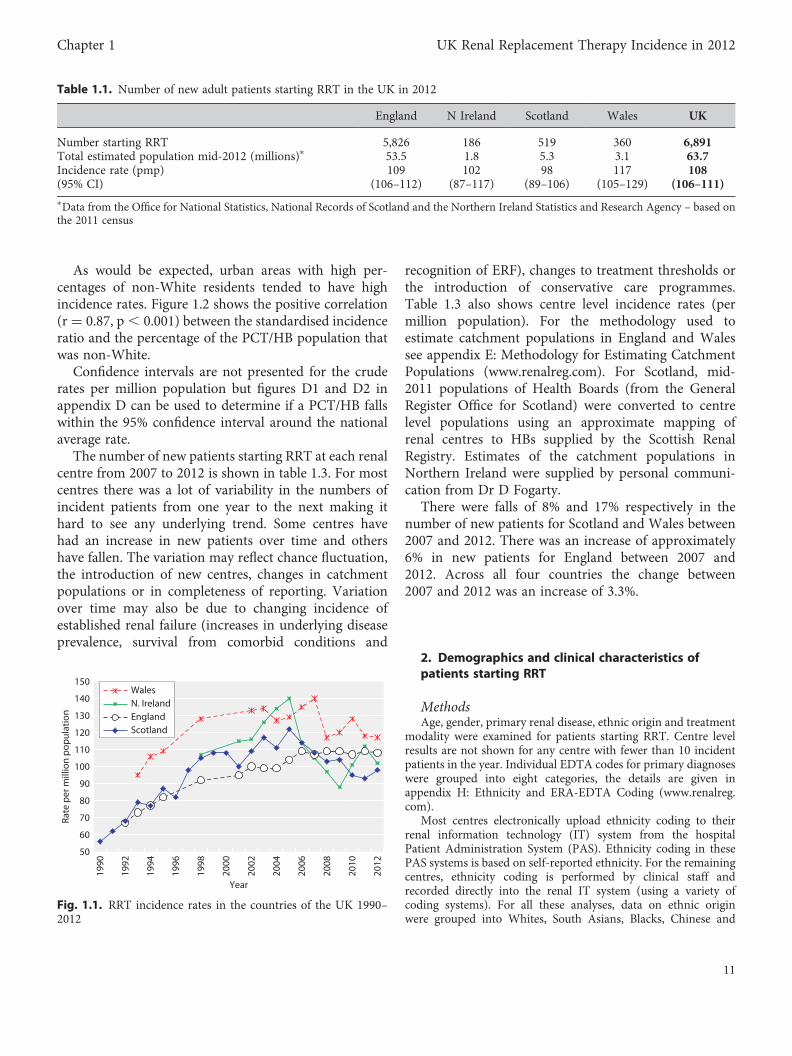
the UK was 6,891 equating to an incidence rate of108 pmp (table 1.1), the same as in 2011. Wales remainedthe country with the highest incidence rate (figure 1.1).For England, incidence rates have been stable for thelast seven years. There continued to be very markedgender differences in incidence rates which were136 pmp (95% CI 132–140) in males and 80 pmp (95%CI 77–83) in females. When incident patients agedunder 18 were included, the UK rate was 110 pmp.
Table 1.2 shows incidence rates and standardisedincidence ratios for PCT/HBs. The ratios calculatedusing combined data from up to six years have beenused to determine areas with significantly high or lowincidence rates. Significantly high areas have been shadedwith bold text and significantly low areas shaded a lightergrey with italicised text. There were wide variationsbetween areas, with 49 being significantly high and 48being significantly low out of a total of 177 areas. Lastyear these numbers were 53 and 48 areas respectively.The standardised incidence ratios ranged from 0.51 to2.37 (IQR 0.84, 1.18).
10
The UK Renal Registry The Sixteenth Annual Report
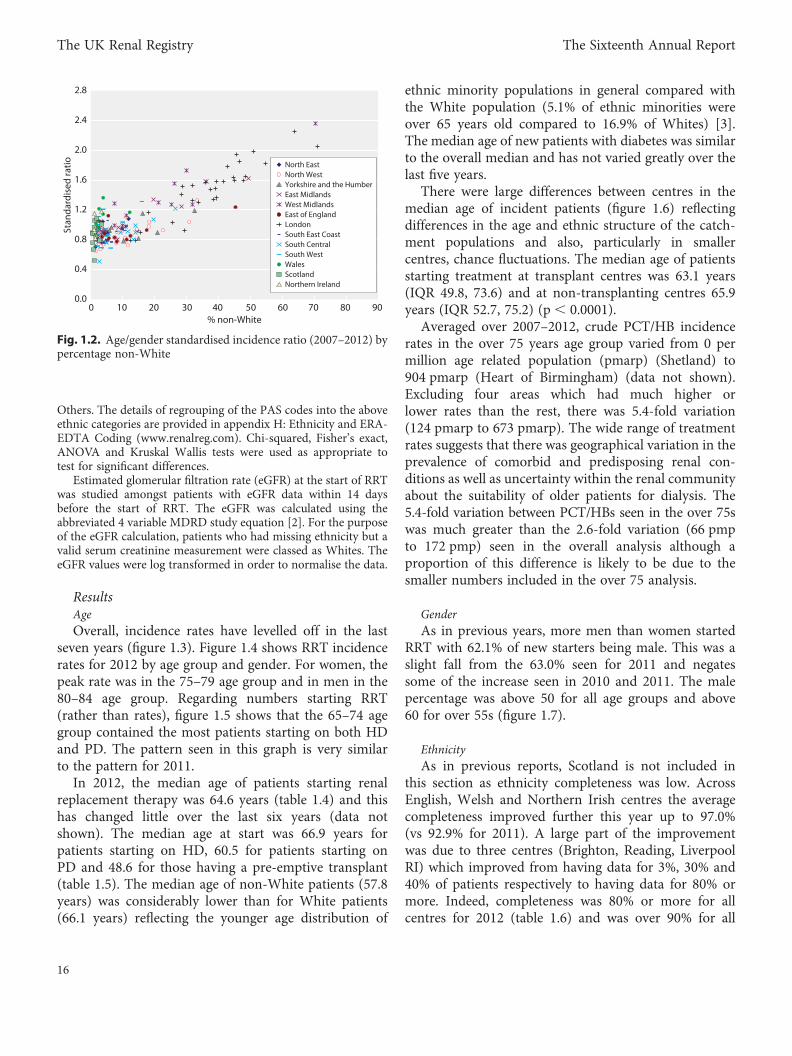
As would be expected, urban areas with high per-centages of non-White residents tended to have highincidence rates. Figure 1.2 shows the positive correlation(r = 0.87, p , 0.001) between the standardised incidenceratio and the percentage of the PCT/HB population thatwas non-White.
Confidence intervals are not presented for the cruderates per million population but figures D1 and D2 inappendix D can be used to determine if a PCT/HB fallswithin the 95% confidence interval around the nationalaverage rate.
The number of new patients starting RRT at each renalcentre from 2007 to 2012 is shown in table 1.3. For mostcentres there was a lot of variability in the numbers ofincident patients from one year to the next making ithard to see any underlying trend. Some centres havehad an increase in new patients over time and othershave fallen. The variation may reflect chance fluctuation,the introduction of new centres, changes in catchmentpopulations or in completeness of reporting. Variationover time may also be due to changing incidence ofestablished renal failure (increases in underlying diseaseprevalence, survival from comorbid conditions and
recognition of ERF), changes to treatment thresholds orthe introduction of conservative care programmes.Table 1.3 also shows centre level incidence rates (permillion population). For the methodology used toestimate catchment populations in England and Walessee appendix E: Methodology for Estimating CatchmentPopulations (www.renalreg.com). For Scotland, mid-2011 populations of Health Boards (from the GeneralRegister Office for Scotland) were converted to centrelevel populations using an approximate mapping ofrenal centres to HBs supplied by the Scottish RenalRegistry. Estimates of the catchment populations inNorthern Ireland were supplied by personal communi-cation from Dr D Fogarty.
There were falls of 8% and 17% respectively in thenumber of new patients for Scotland and Wales between2007 and 2012. There was an increase of approximately6% in new patients for England between 2007 and2012. Across all four countries the change between2007 and 2012 was an increase of 3.3%.
2. Demographics and clinical characteristics ofpatients starting RRT
MethodsAge, gender, primary renal disease, ethnic origin and treatment
modality were examined for patients starting RRT. Centre levelresults are not shown for any centre with fewer than 10 incidentpatients in the year. Individual EDTA codes for primary diagnoseswere grouped into eight categories, the details are given inappendix H: Ethnicity and ERA-EDTA Coding (www.renalreg.com).
Most centres electronically upload ethnicity coding to theirrenal information technology (IT) system from the hospitalPatient Administration System (PAS). Ethnicity coding in thesePAS systems is based on self-reported ethnicity. For the remainingcentres, ethnicity coding is performed by clinical staff andrecorded directly into the renal IT system (using a variety ofcoding systems). For all these analyses, data on ethnic originwere grouped into Whites, South Asians, Blacks, Chinese and
50
60
70
80
90
100
110
120
130
140
150
1990
1992
1994
1996
1998
2000
2002
2004
2006
2008
2010
2012
Year
Rate
per
mill
ion
pop
ulat
ion
WalesN. IrelandEnglandScotland
Fig. 1.1. RRT incidence rates in the countries of the UK 1990–2012
Table 1.1. Number of new adult patients starting RRT in the UK in 2012
England N Ireland Scotland Wales UK
Number starting RRT 5,826 186 519 360 6,891Total estimated population mid-2012 (millions)∗ 53.5 1.8 5.3 3.1 63.7Incidence rate (pmp) 109 102 98 117 108(95% CI) (106–112) (87–117) (89–106) (105–129) (106–111)∗Data from the Office for National Statistics, National Records of Scotland and the Northern Ireland Statistics and Research Agency – based onthe 2011 census
11
Chapter 1 UK Renal Replacement Therapy Incidence in 2012
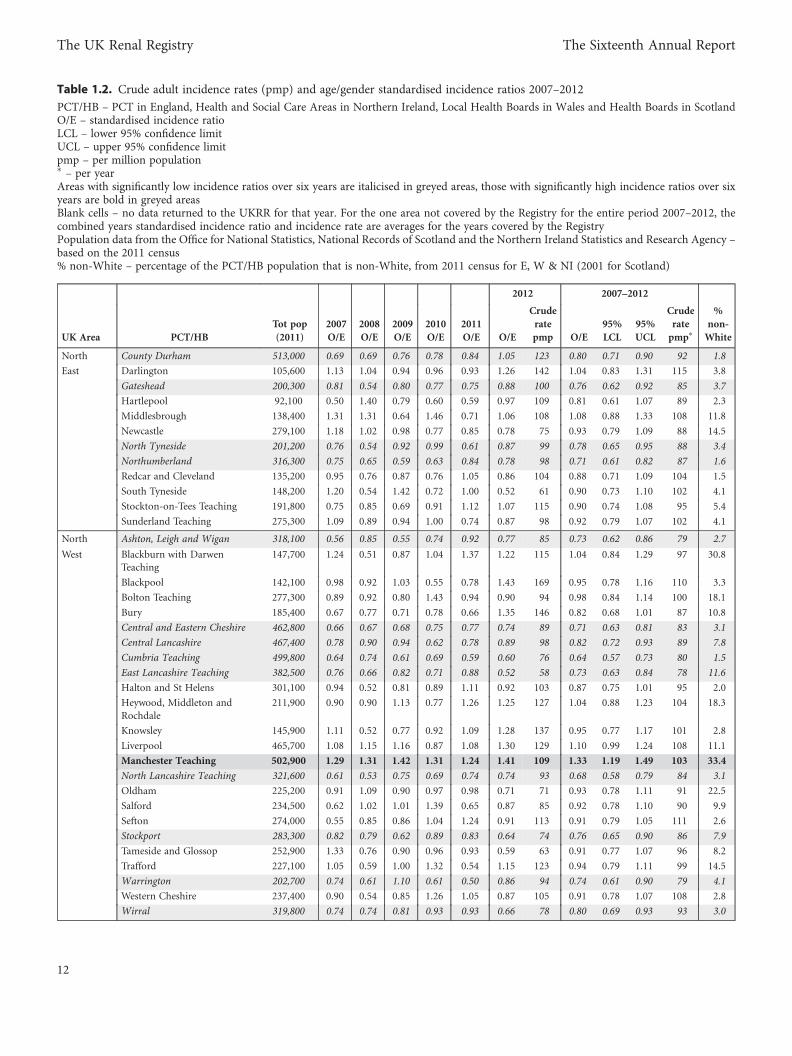
Table 1.2. Crude adult incidence rates (pmp) and age/gender standardised incidence ratios 2007–2012
PCT/HB – PCT in England, Health and Social Care Areas in Northern Ireland, Local Health Boards in Wales and Health Boards in ScotlandO/E – standardised incidence ratioLCL – lower 95% confidence limitUCL – upper 95% confidence limitpmp – per million population∗ – per yearAreas with significantly low incidence ratios over six years are italicised in greyed areas, those with significantly high incidence ratios over sixyears are bold in greyed areasBlank cells – no data returned to the UKRR for that year. For the one area not covered by the Registry for the entire period 2007–2012, thecombined years standardised incidence ratio and incidence rate are averages for the years covered by the RegistryPopulation data from the Office for National Statistics, National Records of Scotland and the Northern Ireland Statistics and Research Agency –based on the 2011 census% non-White – percentage of the PCT/HB population that is non-White, from 2011 census for E, W & NI (2001 for Scotland)
2012 2007–2012
UK Area PCT/HB
Tot pop
(2011)
2007
O/E
2008
O/E
2009
O/E
2010
O/E
2011
O/E O/E
Crude
rate
pmp O/E
95%
LCL
95%
UCL
Crude
rate
pmp∗
%
non-
White
North County Durham 513,000 0.69 0.69 0.76 0.78 0.84 1.05 123 0.80 0.71 0.90 92 1.8
East Darlington 105,600 1.13 1.04 0.94 0.96 0.93 1.26 142 1.04 0.83 1.31 115 3.8
Gateshead 200,300 0.81 0.54 0.80 0.77 0.75 0.88 100 0.76 0.62 0.92 85 3.7
Hartlepool 92,100 0.50 1.40 0.79 0.60 0.59 0.97 109 0.81 0.61 1.07 89 2.3
Middlesbrough 138,400 1.31 1.31 0.64 1.46 0.71 1.06 108 1.08 0.88 1.33 108 11.8
Newcastle 279,100 1.18 1.02 0.98 0.77 0.85 0.78 75 0.93 0.79 1.09 88 14.5
North Tyneside 201,200 0.76 0.54 0.92 0.99 0.61 0.87 99 0.78 0.65 0.95 88 3.4
Northumberland 316,300 0.75 0.65 0.59 0.63 0.84 0.78 98 0.71 0.61 0.82 87 1.6
Redcar and Cleveland 135,200 0.95 0.76 0.87 0.76 1.05 0.86 104 0.88 0.71 1.09 104 1.5
South Tyneside 148,200 1.20 0.54 1.42 0.72 1.00 0.52 61 0.90 0.73 1.10 102 4.1
Stockton-on-Tees Teaching 191,800 0.75 0.85 0.69 0.91 1.12 1.07 115 0.90 0.74 1.08 95 5.4
Sunderland Teaching 275,300 1.09 0.89 0.94 1.00 0.74 0.87 98 0.92 0.79 1.07 102 4.1
North Ashton, Leigh and Wigan 318,100 0.56 0.85 0.55 0.74 0.92 0.77 85 0.73 0.62 0.86 79 2.7
West Blackburn with DarwenTeaching
147,700 1.24 0.51 0.87 1.04 1.37 1.22 115 1.04 0.84 1.29 97 30.8
Blackpool 142,100 0.98 0.92 1.03 0.55 0.78 1.43 169 0.95 0.78 1.16 110 3.3
Bolton Teaching 277,300 0.89 0.92 0.80 1.43 0.94 0.90 94 0.98 0.84 1.14 100 18.1
Bury 185,400 0.67 0.77 0.71 0.78 0.66 1.35 146 0.82 0.68 1.01 87 10.8
Central and Eastern Cheshire 462,800 0.66 0.67 0.68 0.75 0.77 0.74 89 0.71 0.63 0.81 83 3.1
Central Lancashire 467,400 0.78 0.90 0.94 0.62 0.78 0.89 98 0.82 0.72 0.93 89 7.8
Cumbria Teaching 499,800 0.64 0.74 0.61 0.69 0.59 0.60 76 0.64 0.57 0.73 80 1.5
East Lancashire Teaching 382,500 0.76 0.66 0.82 0.71 0.88 0.52 58 0.73 0.63 0.84 78 11.6
Halton and St Helens 301,100 0.94 0.52 0.81 0.89 1.11 0.92 103 0.87 0.75 1.01 95 2.0
Heywood, Middleton andRochdale
211,900 0.90 0.90 1.13 0.77 1.26 1.25 127 1.04 0.88 1.23 104 18.3
Knowsley 145,900 1.11 0.52 0.77 0.92 1.09 1.28 137 0.95 0.77 1.17 101 2.8
Liverpool 465,700 1.08 1.15 1.16 0.87 1.08 1.30 129 1.10 0.99 1.24 108 11.1
Manchester Teaching 502,900 1.29 1.31 1.42 1.31 1.24 1.41 109 1.33 1.19 1.49 103 33.4
North Lancashire Teaching 321,600 0.61 0.53 0.75 0.69 0.74 0.74 93 0.68 0.58 0.79 84 3.1
Oldham 225,200 0.91 1.09 0.90 0.97 0.98 0.71 71 0.93 0.78 1.11 91 22.5
Salford 234,500 0.62 1.02 1.01 1.39 0.65 0.87 85 0.92 0.78 1.10 90 9.9
Sefton 274,000 0.55 0.85 0.86 1.04 1.24 0.91 113 0.91 0.79 1.05 111 2.6
Stockport 283,300 0.82 0.79 0.62 0.89 0.83 0.64 74 0.76 0.65 0.90 86 7.9
Tameside and Glossop 252,900 1.33 0.76 0.90 0.96 0.93 0.59 63 0.91 0.77 1.07 96 8.2
Trafford 227,100 1.05 0.59 1.00 1.32 0.54 1.15 123 0.94 0.79 1.11 99 14.5
Warrington 202,700 0.74 0.61 1.10 0.61 0.50 0.86 94 0.74 0.61 0.90 79 4.1
Western Cheshire 237,400 0.90 0.54 0.85 1.26 1.05 0.87 105 0.91 0.78 1.07 108 2.8
Wirral 319,800 0.74 0.74 0.81 0.93 0.93 0.66 78 0.80 0.69 0.93 93 3.0
12
The UK Renal Registry The Sixteenth Annual Report
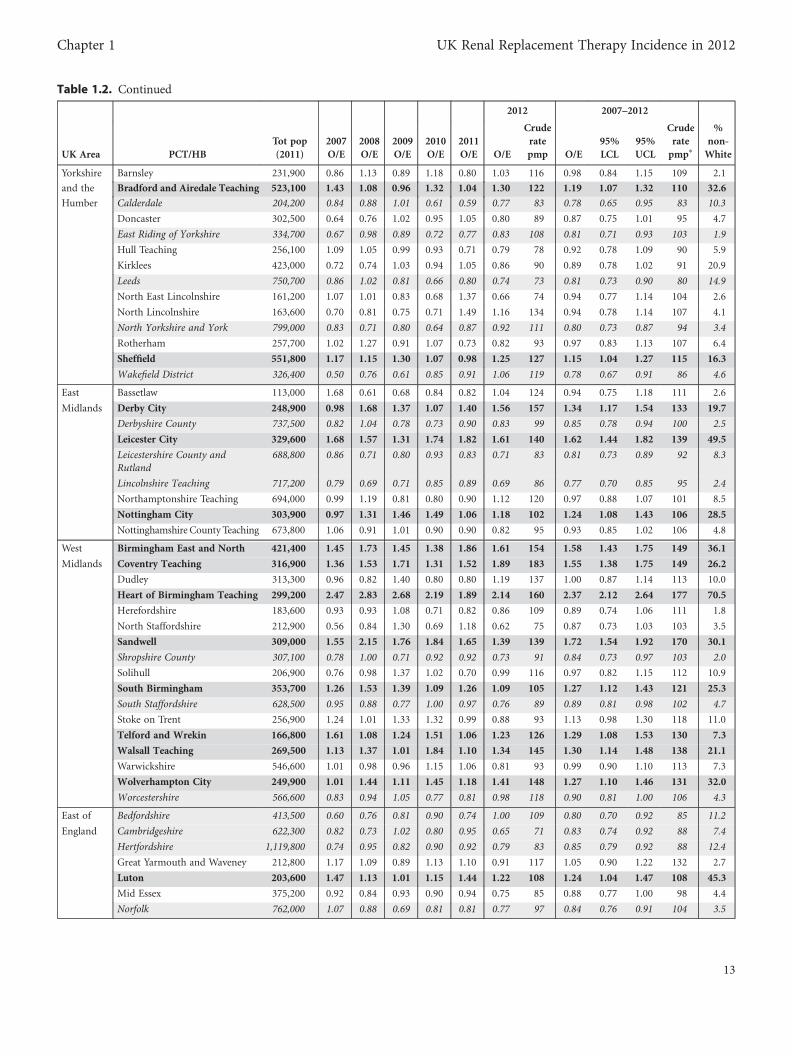
Table 1.2. Continued
2012 2007–2012
UK Area PCT/HB
Tot pop
(2011)
2007
O/E
2008
O/E
2009
O/E
2010
O/E
2011
O/E O/E
Crude
rate
pmp O/E
95%
LCL
95%
UCL
Crude
rate
pmp∗
%
non-
White
Yorkshire Barnsley 231,900 0.86 1.13 0.89 1.18 0.80 1.03 116 0.98 0.84 1.15 109 2.1
and the Bradford and Airedale Teaching 523,100 1.43 1.08 0.96 1.32 1.04 1.30 122 1.19 1.07 1.32 110 32.6
Humber Calderdale 204,200 0.84 0.88 1.01 0.61 0.59 0.77 83 0.78 0.65 0.95 83 10.3
Doncaster 302,500 0.64 0.76 1.02 0.95 1.05 0.80 89 0.87 0.75 1.01 95 4.7
East Riding of Yorkshire 334,700 0.67 0.98 0.89 0.72 0.77 0.83 108 0.81 0.71 0.93 103 1.9
Hull Teaching 256,100 1.09 1.05 0.99 0.93 0.71 0.79 78 0.92 0.78 1.09 90 5.9
Kirklees 423,000 0.72 0.74 1.03 0.94 1.05 0.86 90 0.89 0.78 1.02 91 20.9
Leeds 750,700 0.86 1.02 0.81 0.66 0.80 0.74 73 0.81 0.73 0.90 80 14.9
North East Lincolnshire 161,200 1.07 1.01 0.83 0.68 1.37 0.66 74 0.94 0.77 1.14 104 2.6
North Lincolnshire 163,600 0.70 0.81 0.75 0.71 1.49 1.16 134 0.94 0.78 1.14 107 4.1
North Yorkshire and York 799,000 0.83 0.71 0.80 0.64 0.87 0.92 111 0.80 0.73 0.87 94 3.4
Rotherham 257,700 1.02 1.27 0.91 1.07 0.73 0.82 93 0.97 0.83 1.13 107 6.4
Sheffield 551,800 1.17 1.15 1.30 1.07 0.98 1.25 127 1.15 1.04 1.27 115 16.3
Wakefield District 326,400 0.50 0.76 0.61 0.85 0.91 1.06 119 0.78 0.67 0.91 86 4.6
East Bassetlaw 113,000 1.68 0.61 0.68 0.84 0.82 1.04 124 0.94 0.75 1.18 111 2.6
Midlands Derby City 248,900 0.98 1.68 1.37 1.07 1.40 1.56 157 1.34 1.17 1.54 133 19.7
Derbyshire County 737,500 0.82 1.04 0.78 0.73 0.90 0.83 99 0.85 0.78 0.94 100 2.5
Leicester City 329,600 1.68 1.57 1.31 1.74 1.82 1.61 140 1.62 1.44 1.82 139 49.5
Leicestershire County andRutland
688,800 0.86 0.71 0.80 0.93 0.83 0.71 83 0.81 0.73 0.89 92 8.3
Lincolnshire Teaching 717,200 0.79 0.69 0.71 0.85 0.89 0.69 86 0.77 0.70 0.85 95 2.4
Northamptonshire Teaching 694,000 0.99 1.19 0.81 0.80 0.90 1.12 120 0.97 0.88 1.07 101 8.5
Nottingham City 303,900 0.97 1.31 1.46 1.49 1.06 1.18 102 1.24 1.08 1.43 106 28.5
Nottinghamshire County Teaching 673,800 1.06 0.91 1.01 0.90 0.90 0.82 95 0.93 0.85 1.02 106 4.8
West Birmingham East and North 421,400 1.45 1.73 1.45 1.38 1.86 1.61 154 1.58 1.43 1.75 149 36.1
Midlands Coventry Teaching 316,900 1.36 1.53 1.71 1.31 1.52 1.89 183 1.55 1.38 1.75 149 26.2
Dudley 313,300 0.96 0.82 1.40 0.80 0.80 1.19 137 1.00 0.87 1.14 113 10.0
Heart of Birmingham Teaching 299,200 2.47 2.83 2.68 2.19 1.89 2.14 160 2.37 2.12 2.64 177 70.5
Herefordshire 183,600 0.93 0.93 1.08 0.71 0.82 0.86 109 0.89 0.74 1.06 111 1.8
North Staffordshire 212,900 0.56 0.84 1.30 0.69 1.18 0.62 75 0.87 0.73 1.03 103 3.5
Sandwell 309,000 1.55 2.15 1.76 1.84 1.65 1.39 139 1.72 1.54 1.92 170 30.1
Shropshire County 307,100 0.78 1.00 0.71 0.92 0.92 0.73 91 0.84 0.73 0.97 103 2.0
Solihull 206,900 0.76 0.98 1.37 1.02 0.70 0.99 116 0.97 0.82 1.15 112 10.9
South Birmingham 353,700 1.26 1.53 1.39 1.09 1.26 1.09 105 1.27 1.12 1.43 121 25.3
South Staffordshire 628,500 0.95 0.88 0.77 1.00 0.97 0.76 89 0.89 0.81 0.98 102 4.7
Stoke on Trent 256,900 1.24 1.01 1.33 1.32 0.99 0.88 93 1.13 0.98 1.30 118 11.0
Telford and Wrekin 166,800 1.61 1.08 1.24 1.51 1.06 1.23 126 1.29 1.08 1.53 130 7.3
Walsall Teaching 269,500 1.13 1.37 1.01 1.84 1.10 1.34 145 1.30 1.14 1.48 138 21.1
Warwickshire 546,600 1.01 0.98 0.96 1.15 1.06 0.81 93 0.99 0.90 1.10 113 7.3
Wolverhampton City 249,900 1.01 1.44 1.11 1.45 1.18 1.41 148 1.27 1.10 1.46 131 32.0
Worcestershire 566,600 0.83 0.94 1.05 0.77 0.81 0.98 118 0.90 0.81 1.00 106 4.3
East of Bedfordshire 413,500 0.60 0.76 0.81 0.90 0.74 1.00 109 0.80 0.70 0.92 85 11.2
England Cambridgeshire 622,300 0.82 0.73 1.02 0.80 0.95 0.65 71 0.83 0.74 0.92 88 7.4
Hertfordshire 1,119,800 0.74 0.95 0.82 0.90 0.92 0.79 83 0.85 0.79 0.92 88 12.4
Great Yarmouth and Waveney 212,800 1.17 1.09 0.89 1.13 1.10 0.91 117 1.05 0.90 1.22 132 2.7
Luton 203,600 1.47 1.13 1.01 1.15 1.44 1.22 108 1.24 1.04 1.47 108 45.3
Mid Essex 375,200 0.92 0.84 0.93 0.90 0.94 0.75 85 0.88 0.77 1.00 98 4.4
Norfolk 762,000 1.07 0.88 0.69 0.81 0.81 0.77 97 0.84 0.76 0.91 104 3.5
13
Chapter 1 UK Renal Replacement Therapy Incidence in 2012
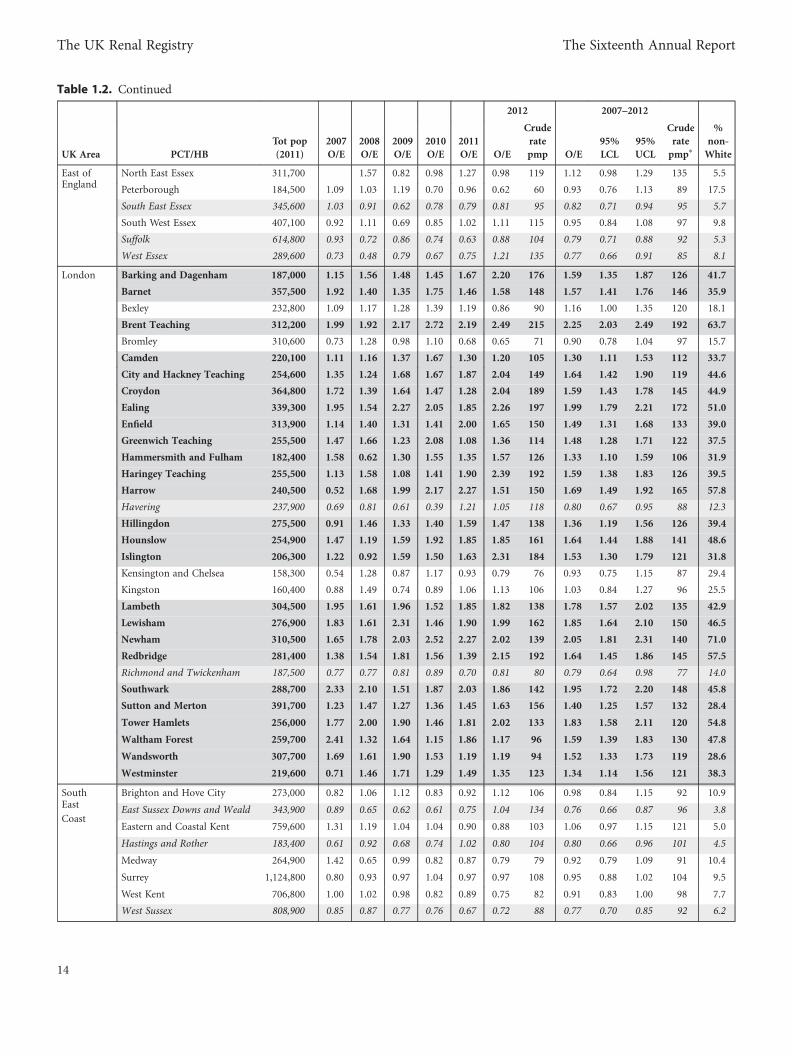
Table 1.2. Continued
2012 2007–2012
UK Area PCT/HB
Tot pop
(2011)
2007
O/E
2008
O/E
2009
O/E
2010
O/E
2011
O/E O/E
Crude
rate
pmp O/E
95%
LCL
95%
UCL
Crude
rate
pmp∗
%
non-
White
East of North East Essex 311,700 1.57 0.82 0.98 1.27 0.98 119 1.12 0.98 1.29 135 5.5England
Peterborough 184,500 1.09 1.03 1.19 0.70 0.96 0.62 60 0.93 0.76 1.13 89 17.5
South East Essex 345,600 1.03 0.91 0.62 0.78 0.79 0.81 95 0.82 0.71 0.94 95 5.7
South West Essex 407,100 0.92 1.11 0.69 0.85 1.02 1.11 115 0.95 0.84 1.08 97 9.8
Suffolk 614,800 0.93 0.72 0.86 0.74 0.63 0.88 104 0.79 0.71 0.88 92 5.3
West Essex 289,600 0.73 0.48 0.79 0.67 0.75 1.21 135 0.77 0.66 0.91 85 8.1
London Barking and Dagenham 187,000 1.15 1.56 1.48 1.45 1.67 2.20 176 1.59 1.35 1.87 126 41.7
Barnet 357,500 1.92 1.40 1.35 1.75 1.46 1.58 148 1.57 1.41 1.76 146 35.9
Bexley 232,800 1.09 1.17 1.28 1.39 1.19 0.86 90 1.16 1.00 1.35 120 18.1
Brent Teaching 312,200 1.99 1.92 2.17 2.72 2.19 2.49 215 2.25 2.03 2.49 192 63.7
Bromley 310,600 0.73 1.28 0.98 1.10 0.68 0.65 71 0.90 0.78 1.04 97 15.7
Camden 220,100 1.11 1.16 1.37 1.67 1.30 1.20 105 1.30 1.11 1.53 112 33.7
City and Hackney Teaching 254,600 1.35 1.24 1.68 1.67 1.87 2.04 149 1.64 1.42 1.90 119 44.6
Croydon 364,800 1.72 1.39 1.64 1.47 1.28 2.04 189 1.59 1.43 1.78 145 44.9
Ealing 339,300 1.95 1.54 2.27 2.05 1.85 2.26 197 1.99 1.79 2.21 172 51.0
Enfield 313,900 1.14 1.40 1.31 1.41 2.00 1.65 150 1.49 1.31 1.68 133 39.0
Greenwich Teaching 255,500 1.47 1.66 1.23 2.08 1.08 1.36 114 1.48 1.28 1.71 122 37.5
Hammersmith and Fulham 182,400 1.58 0.62 1.30 1.55 1.35 1.57 126 1.33 1.10 1.59 106 31.9
Haringey Teaching 255,500 1.13 1.58 1.08 1.41 1.90 2.39 192 1.59 1.38 1.83 126 39.5
Harrow 240,500 0.52 1.68 1.99 2.17 2.27 1.51 150 1.69 1.49 1.92 165 57.8
Havering 237,900 0.69 0.81 0.61 0.39 1.21 1.05 118 0.80 0.67 0.95 88 12.3
Hillingdon 275,500 0.91 1.46 1.33 1.40 1.59 1.47 138 1.36 1.19 1.56 126 39.4
Hounslow 254,900 1.47 1.19 1.59 1.92 1.85 1.85 161 1.64 1.44 1.88 141 48.6
Islington 206,300 1.22 0.92 1.59 1.50 1.63 2.31 184 1.53 1.30 1.79 121 31.8
Kensington and Chelsea 158,300 0.54 1.28 0.87 1.17 0.93 0.79 76 0.93 0.75 1.15 87 29.4
Kingston 160,400 0.88 1.49 0.74 0.89 1.06 1.13 106 1.03 0.84 1.27 96 25.5
Lambeth 304,500 1.95 1.61 1.96 1.52 1.85 1.82 138 1.78 1.57 2.02 135 42.9
Lewisham 276,900 1.83 1.61 2.31 1.46 1.90 1.99 162 1.85 1.64 2.10 150 46.5
Newham 310,500 1.65 1.78 2.03 2.52 2.27 2.02 139 2.05 1.81 2.31 140 71.0
Redbridge 281,400 1.38 1.54 1.81 1.56 1.39 2.15 192 1.64 1.45 1.86 145 57.5
Richmond and Twickenham 187,500 0.77 0.77 0.81 0.89 0.70 0.81 80 0.79 0.64 0.98 77 14.0
Southwark 288,700 2.33 2.10 1.51 1.87 2.03 1.86 142 1.95 1.72 2.20 148 45.8
Sutton and Merton 391,700 1.23 1.47 1.27 1.36 1.45 1.63 156 1.40 1.25 1.57 132 28.4
Tower Hamlets 256,000 1.77 2.00 1.90 1.46 1.81 2.02 133 1.83 1.58 2.11 120 54.8
Waltham Forest 259,700 2.41 1.32 1.64 1.15 1.86 1.17 96 1.59 1.39 1.83 130 47.8
Wandsworth 307,700 1.69 1.61 1.90 1.53 1.19 1.19 94 1.52 1.33 1.73 119 28.6
Westminster 219,600 0.71 1.46 1.71 1.29 1.49 1.35 123 1.34 1.14 1.56 121 38.3
South Brighton and Hove City 273,000 0.82 1.06 1.12 0.83 0.92 1.12 106 0.98 0.84 1.15 92 10.9East East Sussex Downs and Weald 343,900 0.89 0.65 0.62 0.61 0.75 1.04 134 0.76 0.66 0.87 96 3.8Coast
Eastern and Coastal Kent 759,600 1.31 1.19 1.04 1.04 0.90 0.88 103 1.06 0.97 1.15 121 5.0
Hastings and Rother 183,400 0.61 0.92 0.68 0.74 1.02 0.80 104 0.80 0.66 0.96 101 4.5
Medway 264,900 1.42 0.65 0.99 0.82 0.87 0.79 79 0.92 0.79 1.09 91 10.4
Surrey 1,124,800 0.80 0.93 0.97 1.04 0.97 0.97 108 0.95 0.88 1.02 104 9.5
West Kent 706,800 1.00 1.02 0.98 0.82 0.89 0.75 82 0.91 0.83 1.00 98 7.7
West Sussex 808,900 0.85 0.87 0.77 0.76 0.67 0.72 88 0.77 0.70 0.85 92 6.2
14
The UK Renal Registry The Sixteenth Annual Report
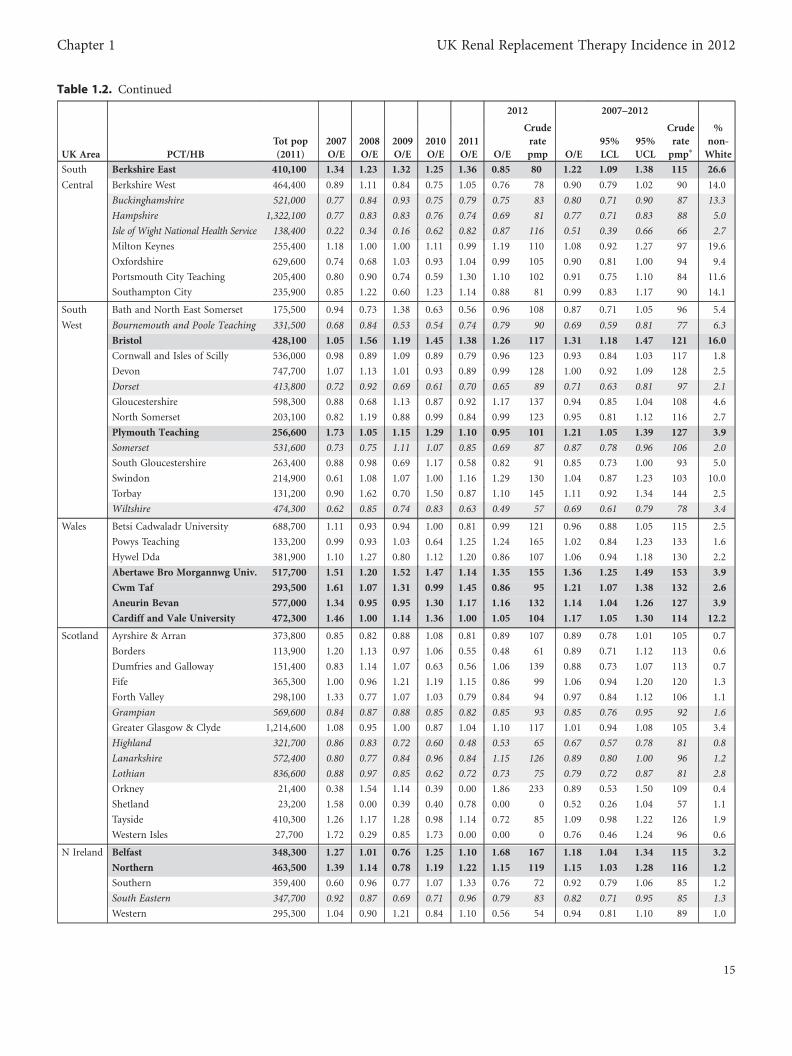
Table 1.2. Continued
2012 2007–2012
UK Area PCT/HB
Tot pop
(2011)
2007
O/E
2008
O/E
2009
O/E
2010
O/E
2011
O/E O/E
Crude
rate
pmp O/E
95%
LCL
95%
UCL
Crude
rate
pmp∗
%
non-
White
South Berkshire East 410,100 1.34 1.23 1.32 1.25 1.36 0.85 80 1.22 1.09 1.38 115 26.6
Central Berkshire West 464,400 0.89 1.11 0.84 0.75 1.05 0.76 78 0.90 0.79 1.02 90 14.0
Buckinghamshire 521,000 0.77 0.84 0.93 0.75 0.79 0.75 83 0.80 0.71 0.90 87 13.3
Hampshire 1,322,100 0.77 0.83 0.83 0.76 0.74 0.69 81 0.77 0.71 0.83 88 5.0
Isle of Wight National Health Service 138,400 0.22 0.34 0.16 0.62 0.82 0.87 116 0.51 0.39 0.66 66 2.7
Milton Keynes 255,400 1.18 1.00 1.00 1.11 0.99 1.19 110 1.08 0.92 1.27 97 19.6
Oxfordshire 629,600 0.74 0.68 1.03 0.93 1.04 0.99 105 0.90 0.81 1.00 94 9.4
Portsmouth City Teaching 205,400 0.80 0.90 0.74 0.59 1.30 1.10 102 0.91 0.75 1.10 84 11.6
Southampton City 235,900 0.85 1.22 0.60 1.23 1.14 0.88 81 0.99 0.83 1.17 90 14.1
South Bath and North East Somerset 175,500 0.94 0.73 1.38 0.63 0.56 0.96 108 0.87 0.71 1.05 96 5.4
West Bournemouth and Poole Teaching 331,500 0.68 0.84 0.53 0.54 0.74 0.79 90 0.69 0.59 0.81 77 6.3
Bristol 428,100 1.05 1.56 1.19 1.45 1.38 1.26 117 1.31 1.18 1.47 121 16.0
Cornwall and Isles of Scilly 536,000 0.98 0.89 1.09 0.89 0.79 0.96 123 0.93 0.84 1.03 117 1.8
Devon 747,700 1.07 1.13 1.01 0.93 0.89 0.99 128 1.00 0.92 1.09 128 2.5
Dorset 413,800 0.72 0.92 0.69 0.61 0.70 0.65 89 0.71 0.63 0.81 97 2.1
Gloucestershire 598,300 0.88 0.68 1.13 0.87 0.92 1.17 137 0.94 0.85 1.04 108 4.6
North Somerset 203,100 0.82 1.19 0.88 0.99 0.84 0.99 123 0.95 0.81 1.12 116 2.7
Plymouth Teaching 256,600 1.73 1.05 1.15 1.29 1.10 0.95 101 1.21 1.05 1.39 127 3.9
Somerset 531,600 0.73 0.75 1.11 1.07 0.85 0.69 87 0.87 0.78 0.96 106 2.0
South Gloucestershire 263,400 0.88 0.98 0.69 1.17 0.58 0.82 91 0.85 0.73 1.00 93 5.0
Swindon 214,900 0.61 1.08 1.07 1.00 1.16 1.29 130 1.04 0.87 1.23 103 10.0
Torbay 131,200 0.90 1.62 0.70 1.50 0.87 1.10 145 1.11 0.92 1.34 144 2.5
Wiltshire 474,300 0.62 0.85 0.74 0.83 0.63 0.49 57 0.69 0.61 0.79 78 3.4
Wales Betsi Cadwaladr University 688,700 1.11 0.93 0.94 1.00 0.81 0.99 121 0.96 0.88 1.05 115 2.5
Powys Teaching 133,200 0.99 0.93 1.03 0.64 1.25 1.24 165 1.02 0.84 1.23 133 1.6
Hywel Dda 381,900 1.10 1.27 0.80 1.12 1.20 0.86 107 1.06 0.94 1.18 130 2.2
Abertawe Bro Morgannwg Univ. 517,700 1.51 1.20 1.52 1.47 1.14 1.35 155 1.36 1.25 1.49 153 3.9
Cwm Taf 293,500 1.61 1.07 1.31 0.99 1.45 0.86 95 1.21 1.07 1.38 132 2.6
Aneurin Bevan 577,000 1.34 0.95 0.95 1.30 1.17 1.16 132 1.14 1.04 1.26 127 3.9
Cardiff and Vale University 472,300 1.46 1.00 1.14 1.36 1.00 1.05 104 1.17 1.05 1.30 114 12.2
Scotland Ayrshire & Arran 373,800 0.85 0.82 0.88 1.08 0.81 0.89 107 0.89 0.78 1.01 105 0.7
Borders 113,900 1.20 1.13 0.97 1.06 0.55 0.48 61 0.89 0.71 1.12 113 0.6
Dumfries and Galloway 151,400 0.83 1.14 1.07 0.63 0.56 1.06 139 0.88 0.73 1.07 113 0.7
Fife 365,300 1.00 0.96 1.21 1.19 1.15 0.86 99 1.06 0.94 1.20 120 1.3
Forth Valley 298,100 1.33 0.77 1.07 1.03 0.79 0.84 94 0.97 0.84 1.12 106 1.1
Grampian 569,600 0.84 0.87 0.88 0.85 0.82 0.85 93 0.85 0.76 0.95 92 1.6
Greater Glasgow & Clyde 1,214,600 1.08 0.95 1.00 0.87 1.04 1.10 117 1.01 0.94 1.08 105 3.4
Highland 321,700 0.86 0.83 0.72 0.60 0.48 0.53 65 0.67 0.57 0.78 81 0.8
Lanarkshire 572,400 0.80 0.77 0.84 0.96 0.84 1.15 126 0.89 0.80 1.00 96 1.2
Lothian 836,600 0.88 0.97 0.85 0.62 0.72 0.73 75 0.79 0.72 0.87 81 2.8
Orkney 21,400 0.38 1.54 1.14 0.39 0.00 1.86 233 0.89 0.53 1.50 109 0.4
Shetland 23,200 1.58 0.00 0.39 0.40 0.78 0.00 0 0.52 0.26 1.04 57 1.1
Tayside 410,300 1.26 1.17 1.28 0.98 1.14 0.72 85 1.09 0.98 1.22 126 1.9
Western Isles 27,700 1.72 0.29 0.85 1.73 0.00 0.00 0 0.76 0.46 1.24 96 0.6
N Ireland Belfast 348,300 1.27 1.01 0.76 1.25 1.10 1.68 167 1.18 1.04 1.34 115 3.2
Northern 463,500 1.39 1.14 0.78 1.19 1.22 1.15 119 1.15 1.03 1.28 116 1.2
Southern 359,400 0.60 0.96 0.77 1.07 1.33 0.76 72 0.92 0.79 1.06 85 1.2
South Eastern 347,700 0.92 0.87 0.69 0.71 0.96 0.79 83 0.82 0.71 0.95 85 1.3
Western 295,300 1.04 0.90 1.21 0.84 1.10 0.56 54 0.94 0.81 1.10 89 1.0
15
Chapter 1 UK Renal Replacement Therapy Incidence in 2012
Others. The details of regrouping of the PAS codes into the aboveethnic categories are provided in appendix H: Ethnicity and ERA-EDTA Coding (www.renalreg.com). Chi-squared, Fisher’s exact,ANOVA and Kruskal Wallis tests were used as appropriate totest for significant differences.
Estimated glomerular filtration rate (eGFR) at the start of RRTwas studied amongst patients with eGFR data within 14 daysbefore the start of RRT. The eGFR was calculated using theabbreviated 4 variable MDRD study equation [2]. For the purposeof the eGFR calculation, patients who had missing ethnicity but avalid serum creatinine measurement were classed as Whites. TheeGFR values were log transformed in order to normalise the data.
ResultsAgeOverall, incidence rates have levelled off in the last
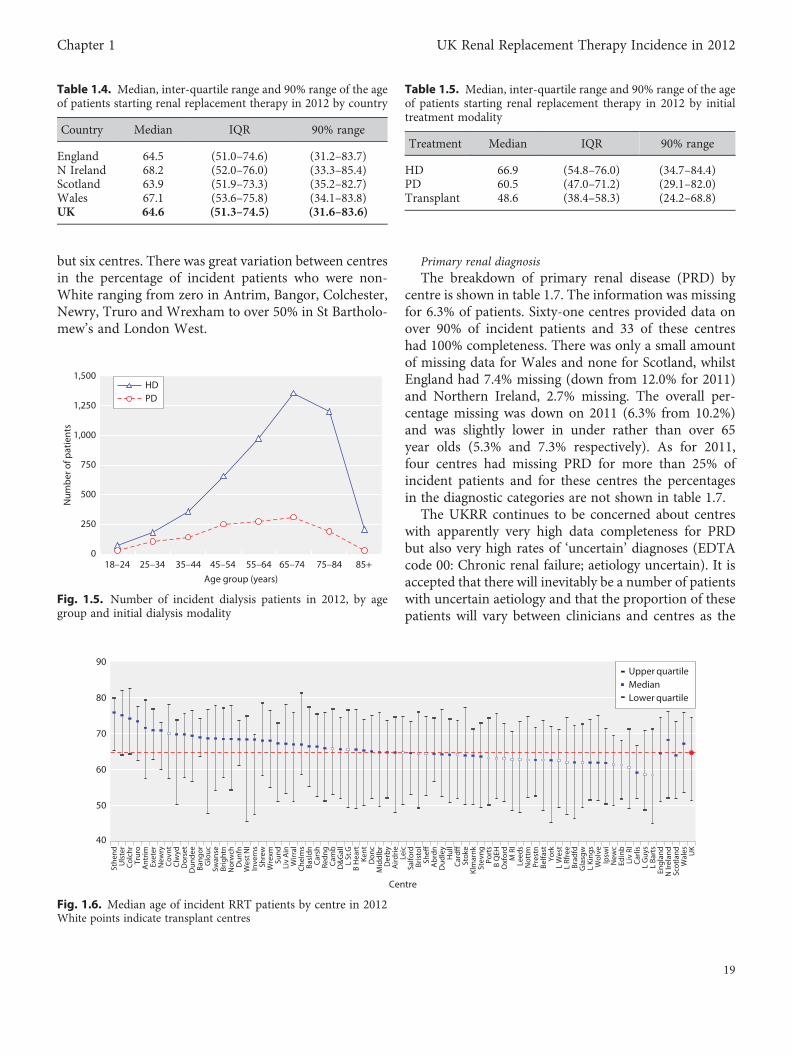
seven years (figure 1.3). Figure 1.4 shows RRT incidencerates for 2012 by age group and gender. For women, thepeak rate was in the 75–79 age group and in men in the80–84 age group. Regarding numbers starting RRT(rather than rates), figure 1.5 shows that the 65–74 agegroup contained the most patients starting on both HDand PD. The pattern seen in this graph is very similarto the pattern for 2011.
In 2012, the median age of patients starting renalreplacement therapy was 64.6 years (table 1.4) and thishas changed little over the last six years (data notshown). The median age at start was 66.9 years forpatients starting on HD, 60.5 for patients starting onPD and 48.6 for those having a pre-emptive transplant(table 1.5). The median age of non-White patients (57.8years) was considerably lower than for White patients(66.1 years) reflecting the younger age distribution of
ethnic minority populations in general compared withthe White population (5.1% of ethnic minorities wereover 65 years old compared to 16.9% of Whites) [3].The median age of new patients with diabetes was similarto the overall median and has not varied greatly over thelast five years.
There were large differences between centres in themedian age of incident patients (figure 1.6) reflectingdifferences in the age and ethnic structure of the catch-ment populations and also, particularly in smallercentres, chance fluctuations. The median age of patientsstarting treatment at transplant centres was 63.1 years(IQR 49.8, 73.6) and at non-transplanting centres 65.9years (IQR 52.7, 75.2) (p, 0.0001).
Averaged over 2007–2012, crude PCT/HB incidencerates in the over 75 years age group varied from 0 permillion age related population (pmarp) (Shetland) to904 pmarp (Heart of Birmingham) (data not shown).Excluding four areas which had much higher orlower rates than the rest, there was 5.4-fold variation(124 pmarp to 673 pmarp). The wide range of treatmentrates suggests that there was geographical variation in theprevalence of comorbid and predisposing renal con-ditions as well as uncertainty within the renal communityabout the suitability of older patients for dialysis. The5.4-fold variation between PCT/HBs seen in the over 75swas much greater than the 2.6-fold variation (66 pmpto 172 pmp) seen in the overall analysis although aproportion of this difference is likely to be due to thesmaller numbers included in the over 75 analysis.
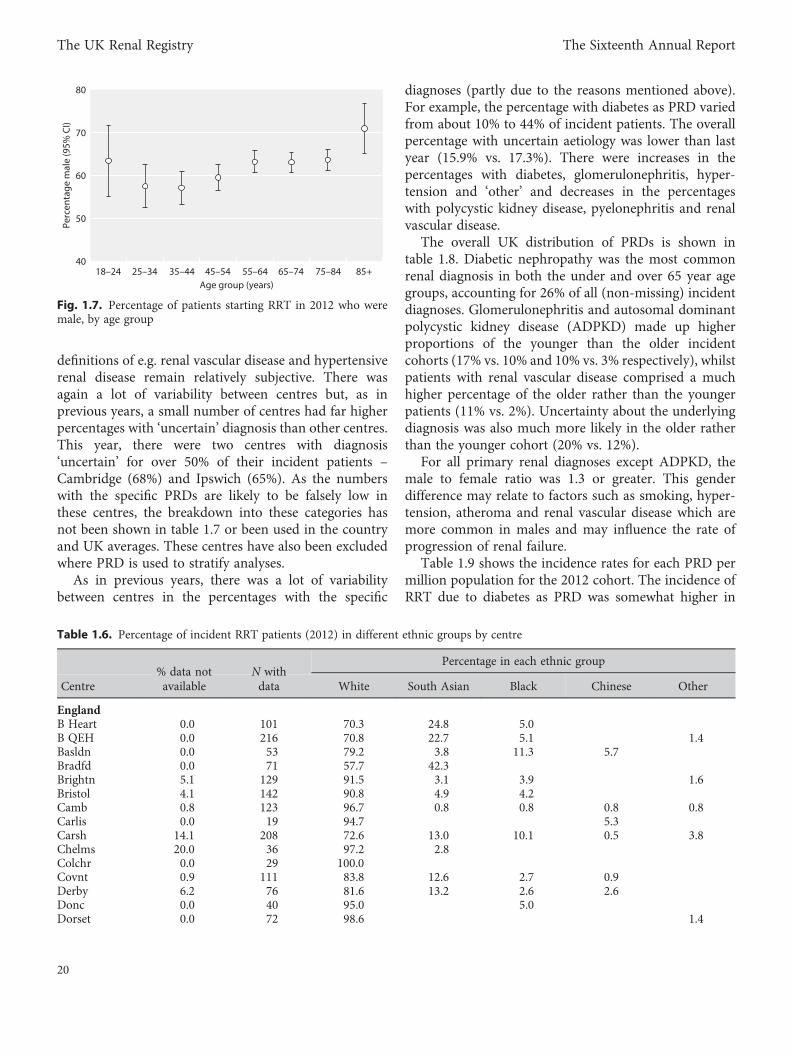
GenderAs in previous years, more men than women started
RRT with 62.1% of new starters being male. This was aslight fall from the 63.0% seen for 2011 and negatessome of the increase seen in 2010 and 2011. The malepercentage was above 50 for all age groups and above60 for over 55s (figure 1.7).
EthnicityAs in previous reports, Scotland is not included in
this section as ethnicity completeness was low. AcrossEnglish, Welsh and Northern Irish centres the averagecompleteness improved further this year up to 97.0%(vs 92.9% for 2011). A large part of the improvementwas due to three centres (Brighton, Reading, LiverpoolRI) which improved from having data for 3%, 30% and40% of patients respectively to having data for 80% ormore. Indeed, completeness was 80% or more for allcentres for 2012 (table 1.6) and was over 90% for all
0 10 20 30 40 50 60 70 80 90% non-White
Stan
dard
ised
ratio
0.0
0.4
0.8
1.2
1.6
2.0
2.4
2.8
North EastNorth WestYorkshire and the HumberEast MidlandsWest MidlandsEast of EnglandLondonSouth East CoastSouth CentralSouth WestWalesScotlandNorthern Ireland
Fig. 1.2. Age/gender standardised incidence ratio (2007–2012) bypercentage non-White
16
The UK Renal Registry The Sixteenth Annual Report
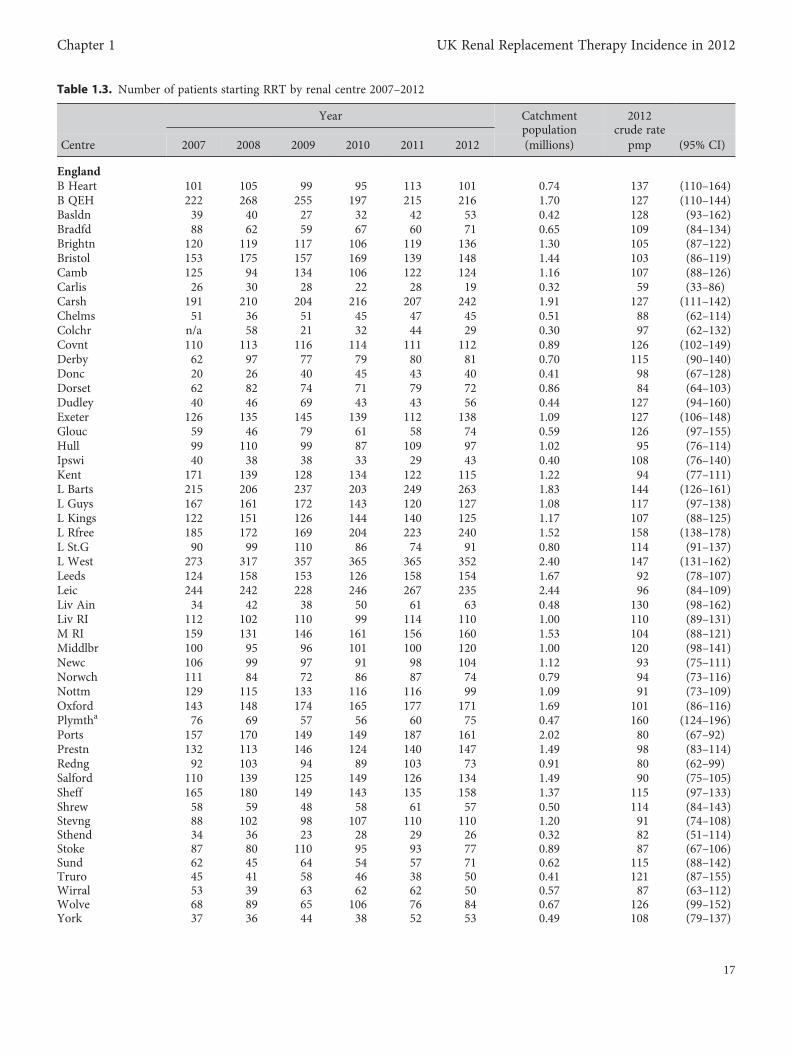
Table 1.3. Number of patients starting RRT by renal centre 2007–2012
Year Catchmentpopulation
2012crude rate
Centre 2007 2008 2009 2010 2011 2012 (millions) pmp (95% CI)
EnglandB Heart 101 105 99 95 113 101 0.74 137 (110–164)B QEH 222 268 255 197 215 216 1.70 127 (110–144)Basldn 39 40 27 32 42 53 0.42 128 (93–162)Bradfd 88 62 59 67 60 71 0.65 109 (84–134)Brightn 120 119 117 106 119 136 1.30 105 (87–122)Bristol 153 175 157 169 139 148 1.44 103 (86–119)Camb 125 94 134 106 122 124 1.16 107 (88–126)Carlis 26 30 28 22 28 19 0.32 59 (33–86)Carsh 191 210 204 216 207 242 1.91 127 (111–142)Chelms 51 36 51 45 47 45 0.51 88 (62–114)Colchr n/a 58 21 32 44 29 0.30 97 (62–132)Covnt 110 113 116 114 111 112 0.89 126 (102–149)Derby 62 97 77 79 80 81 0.70 115 (90–140)Donc 20 26 40 45 43 40 0.41 98 (67–128)Dorset 62 82 74 71 79 72 0.86 84 (64–103)Dudley 40 46 69 43 43 56 0.44 127 (94–160)Exeter 126 135 145 139 112 138 1.09 127 (106–148)Glouc 59 46 79 61 58 74 0.59 126 (97–155)Hull 99 110 99 87 109 97 1.02 95 (76–114)Ipswi 40 38 38 33 29 43 0.40 108 (76–140)Kent 171 139 128 134 122 115 1.22 94 (77–111)L Barts 215 206 237 203 249 263 1.83 144 (126–161)L Guys 167 161 172 143 120 127 1.08 117 (97–138)L Kings 122 151 126 144 140 125 1.17 107 (88–125)L Rfree 185 172 169 204 223 240 1.52 158 (138–178)L St.G 90 99 110 86 74 91 0.80 114 (91–137)L West 273 317 357 365 365 352 2.40 147 (131–162)Leeds 124 158 153 126 158 154 1.67 92 (78–107)Leic 244 242 228 246 267 235 2.44 96 (84–109)Liv Ain 34 42 38 50 61 63 0.48 130 (98–162)Liv RI 112 102 110 99 114 110 1.00 110 (89–131)M RI 159 131 146 161 156 160 1.53 104 (88–121)Middlbr 100 95 96 101 100 120 1.00 120 (98–141)Newc 106 99 97 91 98 104 1.12 93 (75–111)Norwch 111 84 72 86 87 74 0.79 94 (73–116)Nottm 129 115 133 116 116 99 1.09 91 (73–109)Oxford 143 148 174 165 177 171 1.69 101 (86–116)Plymtha 76 69 57 56 60 75 0.47 160 (124–196)Ports 157 170 149 149 187 161 2.02 80 (67–92)Prestn 132 113 146 124 140 147 1.49 98 (83–114)Redng 92 103 94 89 103 73 0.91 80 (62–99)Salford 110 139 125 149 126 134 1.49 90 (75–105)Sheff 165 180 149 143 135 158 1.37 115 (97–133)Shrew 58 59 48 58 61 57 0.50 114 (84–143)Stevng 88 102 98 107 110 110 1.20 91 (74–108)Sthend 34 36 23 28 29 26 0.32 82 (51–114)Stoke 87 80 110 95 93 77 0.89 87 (67–106)Sund 62 45 64 54 57 71 0.62 115 (88–142)Truro 45 41 58 46 38 50 0.41 121 (87–155)Wirral 53 39 63 62 62 50 0.57 87 (63–112)Wolve 68 89 65 106 76 84 0.67 126 (99–152)York 37 36 44 38 52 53 0.49 108 (79–137)
17
Chapter 1 UK Renal Replacement Therapy Incidence in 2012
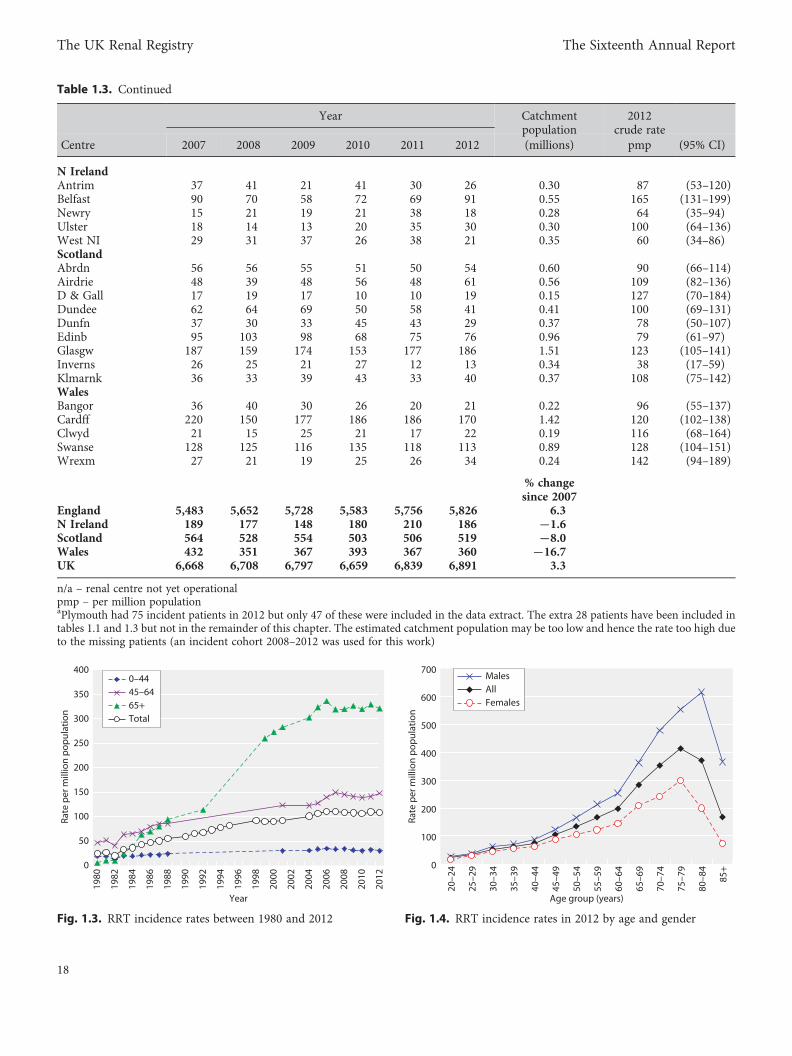
Table 1.3. Continued
Year Catchmentpopulation
2012crude rate
Centre 2007 2008 2009 2010 2011 2012 (millions) pmp (95% CI)
N IrelandAntrim 37 41 21 41 30 26 0.30 87 (53–120)Belfast 90 70 58 72 69 91 0.55 165 (131–199)Newry 15 21 19 21 38 18 0.28 64 (35–94)Ulster 18 14 13 20 35 30 0.30 100 (64–136)West NI 29 31 37 26 38 21 0.35 60 (34–86)ScotlandAbrdn 56 56 55 51 50 54 0.60 90 (66–114)Airdrie 48 39 48 56 48 61 0.56 109 (82–136)D & Gall 17 19 17 10 10 19 0.15 127 (70–184)Dundee 62 64 69 50 58 41 0.41 100 (69–131)Dunfn 37 30 33 45 43 29 0.37 78 (50–107)Edinb 95 103 98 68 75 76 0.96 79 (61–97)Glasgw 187 159 174 153 177 186 1.51 123 (105–141)Inverns 26 25 21 27 12 13 0.34 38 (17–59)Klmarnk 36 33 39 43 33 40 0.37 108 (75–142)WalesBangor 36 40 30 26 20 21 0.22 96 (55–137)Cardff 220 150 177 186 186 170 1.42 120 (102–138)Clwyd 21 15 25 21 17 22 0.19 116 (68–164)Swanse 128 125 116 135 118 113 0.89 128 (104–151)Wrexm 27 21 19 25 26 34 0.24 142 (94–189)
% changesince 2007
England 5,483 5,652 5,728 5,583 5,756 5,826 6.3N Ireland 189 177 148 180 210 186 −1.6Scotland 564 528 554 503 506 519 −8.0Wales 432 351 367 393 367 360 −16.7UK 6,668 6,708 6,797 6,659 6,839 6,891 3.3
n/a – renal centre not yet operationalpmp – per million populationaPlymouth had 75 incident patients in 2012 but only 47 of these were included in the data extract. The extra 28 patients have been included intables 1.1 and 1.3 but not in the remainder of this chapter. The estimated catchment population may be too low and hence the rate too high dueto the missing patients (an incident cohort 2008–2012 was used for this work)
0
50
100
150
200
250
300
350
400
1980
1982
1984
1986
1988
1990
1992
1994
1996
1998
2000
2002
2004
2006
2008
2010
2012
Year
Rat
e p
er m
illio
n p
opul
atio
n
0–4445–6465+Total
Fig. 1.3. RRT incidence rates between 1980 and 2012
0
100
200
300
400
500
600
700
Rate
per
mill
ion
pop
ulat
ion
20–2
4
25–2
9
30–3
4
35–3
9
40–4
4
45–4
9
50–5
4
55–5
9
60–6
4
65–6
9
70–7
4
75–7
9
80–8
4
85+
Age group (years)
MalesAllFemales
Fig. 1.4. RRT incidence rates in 2012 by age and gender
18
The UK Renal Registry The Sixteenth Annual Report
but six centres. There was great variation between centresin the percentage of incident patients who were non-White ranging from zero in Antrim, Bangor, Colchester,Newry, Truro and Wrexham to over 50% in St Bartholo-mew’s and London West.
Primary renal diagnosisThe breakdown of primary renal disease (PRD) by
centre is shown in table 1.7. The information was missingfor 6.3% of patients. Sixty-one centres provided data onover 90% of incident patients and 33 of these centreshad 100% completeness. There was only a small amountof missing data for Wales and none for Scotland, whilstEngland had 7.4% missing (down from 12.0% for 2011)and Northern Ireland, 2.7% missing. The overall per-centage missing was down on 2011 (6.3% from 10.2%)and was slightly lower in under rather than over 65year olds (5.3% and 7.3% respectively). As for 2011,four centres had missing PRD for more than 25% ofincident patients and for these centres the percentagesin the diagnostic categories are not shown in table 1.7.
The UKRR continues to be concerned about centreswith apparently very high data completeness for PRDbut also very high rates of ‘uncertain’ diagnoses (EDTAcode 00: Chronic renal failure; aetiology uncertain). It isaccepted that there will inevitably be a number of patientswith uncertain aetiology and that the proportion of thesepatients will vary between clinicians and centres as the
0
250
500
750
1,000
1,250
1,500
18–24 25–34 35–44 45–54 55–64 65–74 75–84 85+
Age group (years)
Num
ber
of p
atie
nts
HDPD
Fig. 1.5. Number of incident dialysis patients in 2012, by agegroup and initial dialysis modality
40
50
60
70
80
90
Sthe
ndU
lste
rC
olch
rTr
uro
Ant
rimEx
eter
New
ryC
ovnt
Clw
ydD
orse
tD
unde
eBa
ngor
Glo
ucSw
anse
Brig
htn
Nor
wch
Dun
fnW
est N
IIn
vern
sSh
rew
Wre
xmSu
ndLi
v A
inW
irral
Che
lms
Basl
dnC
arsh
Redn
gC
amb
D&
Gal
lL
St.G
B H
eart
Kent
Don
cM
iddl
br
Der
by
Aird
rieLe
icSa
lford
Bris
tol
Sheff
Ab
rdn
Dud
ley
Hul
lC
ardff
Stok
eKl
mar
nkSt
evng
Port
sB
QEH
Oxf
ord
M R
ILe
eds
Not
tmPr
estn
Belfa
stYo
rkL
Wes
tL
Rfre
eBr
adfd
Gla
sgw
L Ki
ngs
Wol
veIp
swi
New
cEd
inb
Liv
RIC
arlis
L G
uys
L Ba
rts
Engl
and
N Ir
elan
dSc
otla
ndW
ales UK
Centre
Upper quartileMedianLower quartile
Fig. 1.6. Median age of incident RRT patients by centre in 2012White points indicate transplant centres
Table 1.4. Median, inter-quartile range and 90% range of the ageof patients starting renal replacement therapy in 2012 by country
Country Median IQR 90% range
England 64.5 (51.0–74.6) (31.2–83.7)N Ireland 68.2 (52.0–76.0) (33.3–85.4)Scotland 63.9 (51.9–73.3) (35.2–82.7)Wales 67.1 (53.6–75.8) (34.1–83.8)UK 64.6 (51.3–74.5) (31.6–83.6)
Table 1.5. Median, inter-quartile range and 90% range of the ageof patients starting renal replacement therapy in 2012 by initialtreatment modality
Treatment Median IQR 90% range
HD 66.9 (54.8–76.0) (34.7–84.4)PD 60.5 (47.0–71.2) (29.1–82.0)Transplant 48.6 (38.4–58.3) (24.2–68.8)
19
Chapter 1 UK Renal Replacement Therapy Incidence in 2012
definitions of e.g. renal vascular disease and hypertensiverenal disease remain relatively subjective. There wasagain a lot of variability between centres but, as inprevious years, a small number of centres had far higherpercentages with ‘uncertain’ diagnosis than other centres.This year, there were two centres with diagnosis‘uncertain’ for over 50% of their incident patients –Cambridge (68%) and Ipswich (65%). As the numberswith the specific PRDs are likely to be falsely low inthese centres, the breakdown into these categories hasnot been shown in table 1.7 or been used in the countryand UK averages. These centres have also been excludedwhere PRD is used to stratify analyses.
As in previous years, there was a lot of variabilitybetween centres in the percentages with the specific
diagnoses (partly due to the reasons mentioned above).For example, the percentage with diabetes as PRD variedfrom about 10% to 44% of incident patients. The overallpercentage with uncertain aetiology was lower than lastyear (15.9% vs. 17.3%). There were increases in thepercentages with diabetes, glomerulonephritis, hyper-tension and ‘other’ and decreases in the percentageswith polycystic kidney disease, pyelonephritis and renalvascular disease.
The overall UK distribution of PRDs is shown intable 1.8. Diabetic nephropathy was the most commonrenal diagnosis in both the under and over 65 year agegroups, accounting for 26% of all (non-missing) incidentdiagnoses. Glomerulonephritis and autosomal dominantpolycystic kidney disease (ADPKD) made up higherproportions of the younger than the older incidentcohorts (17% vs. 10% and 10% vs. 3% respectively), whilstpatients with renal vascular disease comprised a muchhigher percentage of the older rather than the youngerpatients (11% vs. 2%). Uncertainty about the underlyingdiagnosis was also much more likely in the older ratherthan the younger cohort (20% vs. 12%).
For all primary renal diagnoses except ADPKD, themale to female ratio was 1.3 or greater. This genderdifference may relate to factors such as smoking, hyper-tension, atheroma and renal vascular disease which aremore common in males and may influence the rate ofprogression of renal failure.
Table 1.9 shows the incidence rates for each PRD permillion population for the 2012 cohort. The incidence ofRRT due to diabetes as PRD was somewhat higher in
40
50
60
70
80
18–24 25–34 35–44 45–54 55–64 65–74 75–84 85+Age group (years)
Perc
enta
ge m
ale
(95%
CI)
Fig. 1.7. Percentage of patients starting RRT in 2012 who weremale, by age group
Table 1.6. Percentage of incident RRT patients (2012) in different ethnic groups by centre
% data not N withPercentage in each ethnic group
Centre available data White South Asian Black Chinese Other
EnglandB Heart 0.0 101 70.3 24.8 5.0B QEH 0.0 216 70.8 22.7 5.1 1.4Basldn 0.0 53 79.2 3.8 11.3 5.7Bradfd 0.0 71 57.7 42.3Brightn 5.1 129 91.5 3.1 3.9 1.6Bristol 4.1 142 90.8 4.9 4.2Camb 0.8 123 96.7 0.8 0.8 0.8 0.8Carlis 0.0 19 94.7 5.3Carsh 14.1 208 72.6 13.0 10.1 0.5 3.8Chelms 20.0 36 97.2 2.8Colchr 0.0 29 100.0Covnt 0.9 111 83.8 12.6 2.7 0.9Derby 6.2 76 81.6 13.2 2.6 2.6Donc 0.0 40 95.0 5.0Dorset 0.0 72 98.6 1.4
20
The UK Renal Registry The Sixteenth Annual Report
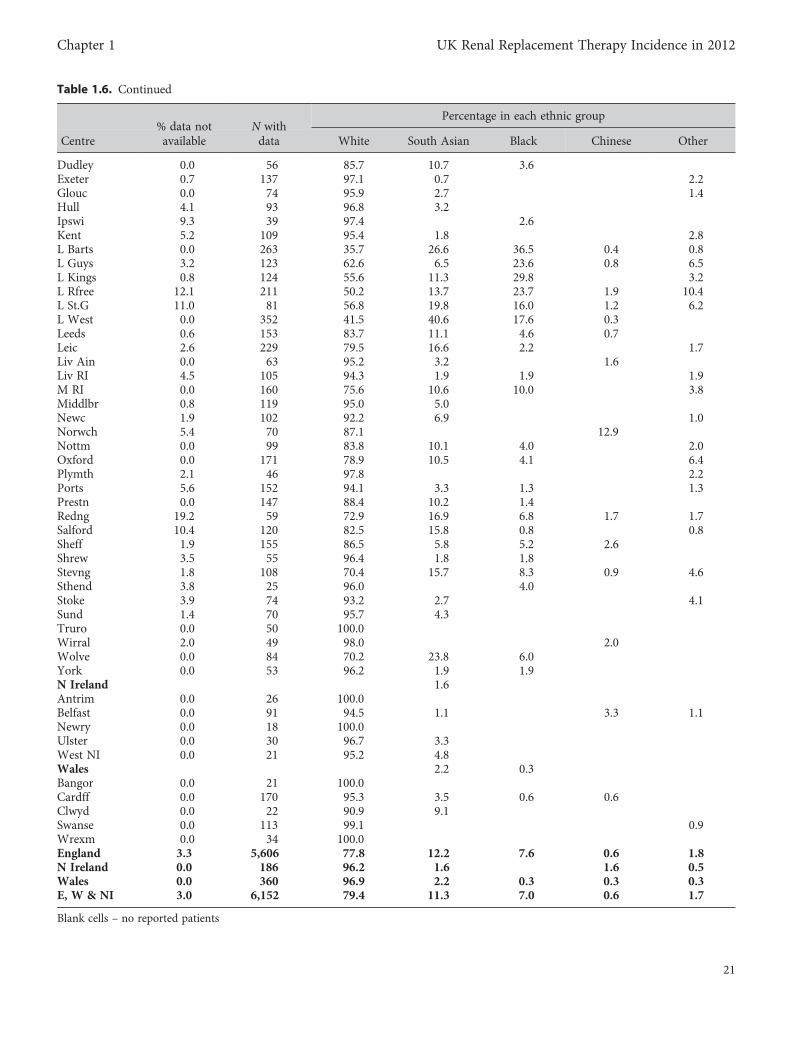
Table 1.6. Continued
% data not N withPercentage in each ethnic group
Centre available data White South Asian Black Chinese Other
Dudley 0.0 56 85.7 10.7 3.6Exeter 0.7 137 97.1 0.7 2.2Glouc 0.0 74 95.9 2.7 1.4Hull 4.1 93 96.8 3.2Ipswi 9.3 39 97.4 2.6Kent 5.2 109 95.4 1.8 2.8L Barts 0.0 263 35.7 26.6 36.5 0.4 0.8L Guys 3.2 123 62.6 6.5 23.6 0.8 6.5L Kings 0.8 124 55.6 11.3 29.8 3.2L Rfree 12.1 211 50.2 13.7 23.7 1.9 10.4L St.G 11.0 81 56.8 19.8 16.0 1.2 6.2L West 0.0 352 41.5 40.6 17.6 0.3Leeds 0.6 153 83.7 11.1 4.6 0.7Leic 2.6 229 79.5 16.6 2.2 1.7Liv Ain 0.0 63 95.2 3.2 1.6Liv RI 4.5 105 94.3 1.9 1.9 1.9M RI 0.0 160 75.6 10.6 10.0 3.8Middlbr 0.8 119 95.0 5.0Newc 1.9 102 92.2 6.9 1.0Norwch 5.4 70 87.1 12.9Nottm 0.0 99 83.8 10.1 4.0 2.0Oxford 0.0 171 78.9 10.5 4.1 6.4Plymth 2.1 46 97.8 2.2Ports 5.6 152 94.1 3.3 1.3 1.3Prestn 0.0 147 88.4 10.2 1.4Redng 19.2 59 72.9 16.9 6.8 1.7 1.7Salford 10.4 120 82.5 15.8 0.8 0.8Sheff 1.9 155 86.5 5.8 5.2 2.6Shrew 3.5 55 96.4 1.8 1.8Stevng 1.8 108 70.4 15.7 8.3 0.9 4.6Sthend 3.8 25 96.0 4.0Stoke 3.9 74 93.2 2.7 4.1Sund 1.4 70 95.7 4.3Truro 0.0 50 100.0Wirral 2.0 49 98.0 2.0Wolve 0.0 84 70.2 23.8 6.0York 0.0 53 96.2 1.9 1.9N Ireland 1.6Antrim 0.0 26 100.0Belfast 0.0 91 94.5 1.1 3.3 1.1Newry 0.0 18 100.0Ulster 0.0 30 96.7 3.3West NI 0.0 21 95.2 4.8Wales 2.2 0.3Bangor 0.0 21 100.0Cardff 0.0 170 95.3 3.5 0.6 0.6Clwyd 0.0 22 90.9 9.1Swanse 0.0 113 99.1 0.9Wrexm 0.0 34 100.0England 3.3 5,606 77.8 12.2 7.6 0.6 1.8N Ireland 0.0 186 96.2 1.6 1.6 0.5Wales 0.0 360 96.9 2.2 0.3 0.3 0.3E, W & NI 3.0 6,152 79.4 11.3 7.0 0.6 1.7
Blank cells – no reported patients
21
Chapter 1 UK Renal Replacement Therapy Incidence in 2012
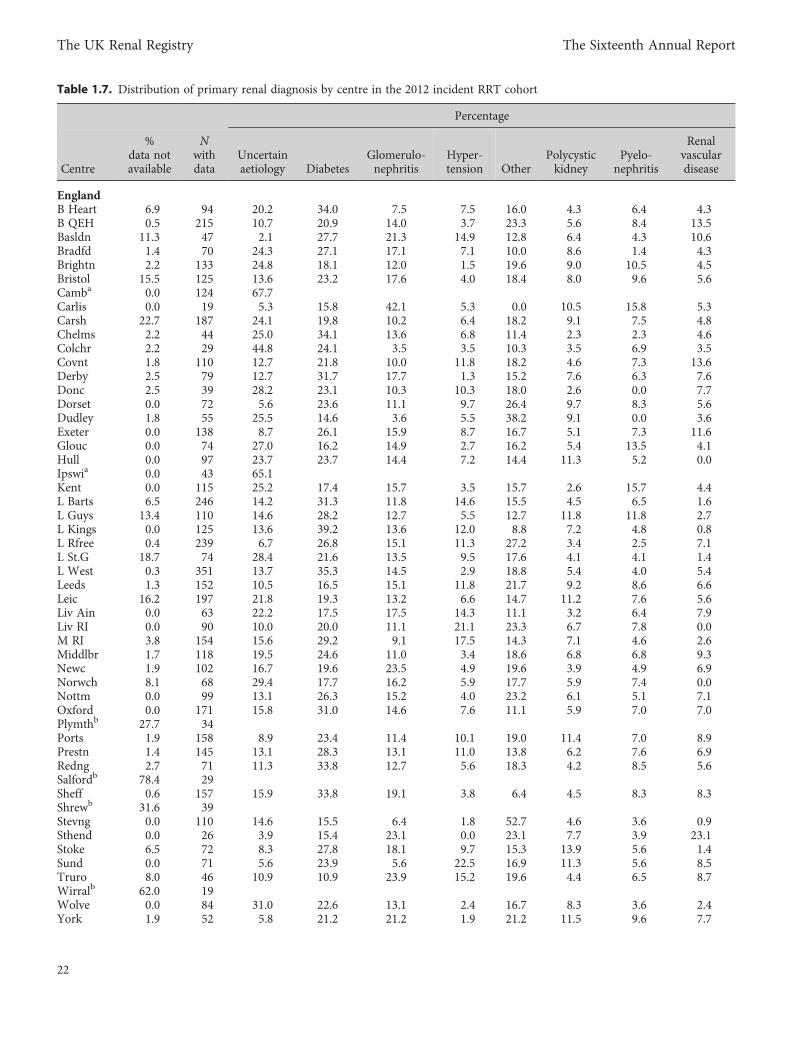
Table 1.7. Distribution of primary renal diagnosis by centre in the 2012 incident RRT cohort
Percentage
Centre
%data notavailable
Nwithdata
Uncertainaetiology Diabetes
Glomerulo-nephritis
Hyper-tension Other
Polycystickidney
Pyelo-nephritis
Renalvasculardisease
EnglandB Heart 6.9 94 20.2 34.0 7.5 7.5 16.0 4.3 6.4 4.3B QEH 0.5 215 10.7 20.9 14.0 3.7 23.3 5.6 8.4 13.5Basldn 11.3 47 2.1 27.7 21.3 14.9 12.8 6.4 4.3 10.6Bradfd 1.4 70 24.3 27.1 17.1 7.1 10.0 8.6 1.4 4.3Brightn 2.2 133 24.8 18.1 12.0 1.5 19.6 9.0 10.5 4.5Bristol 15.5 125 13.6 23.2 17.6 4.0 18.4 8.0 9.6 5.6Camba 0.0 124 67.7Carlis 0.0 19 5.3 15.8 42.1 5.3 0.0 10.5 15.8 5.3Carsh 22.7 187 24.1 19.8 10.2 6.4 18.2 9.1 7.5 4.8Chelms 2.2 44 25.0 34.1 13.6 6.8 11.4 2.3 2.3 4.6Colchr 2.2 29 44.8 24.1 3.5 3.5 10.3 3.5 6.9 3.5Covnt 1.8 110 12.7 21.8 10.0 11.8 18.2 4.6 7.3 13.6Derby 2.5 79 12.7 31.7 17.7 1.3 15.2 7.6 6.3 7.6Donc 2.5 39 28.2 23.1 10.3 10.3 18.0 2.6 0.0 7.7Dorset 0.0 72 5.6 23.6 11.1 9.7 26.4 9.7 8.3 5.6Dudley 1.8 55 25.5 14.6 3.6 5.5 38.2 9.1 0.0 3.6Exeter 0.0 138 8.7 26.1 15.9 8.7 16.7 5.1 7.3 11.6Glouc 0.0 74 27.0 16.2 14.9 2.7 16.2 5.4 13.5 4.1Hull 0.0 97 23.7 23.7 14.4 7.2 14.4 11.3 5.2 0.0Ipswia 0.0 43 65.1Kent 0.0 115 25.2 17.4 15.7 3.5 15.7 2.6 15.7 4.4L Barts 6.5 246 14.2 31.3 11.8 14.6 15.5 4.5 6.5 1.6L Guys 13.4 110 14.6 28.2 12.7 5.5 12.7 11.8 11.8 2.7L Kings 0.0 125 13.6 39.2 13.6 12.0 8.8 7.2 4.8 0.8L Rfree 0.4 239 6.7 26.8 15.1 11.3 27.2 3.4 2.5 7.1L St.G 18.7 74 28.4 21.6 13.5 9.5 17.6 4.1 4.1 1.4L West 0.3 351 13.7 35.3 14.5 2.9 18.8 5.4 4.0 5.4Leeds 1.3 152 10.5 16.5 15.1 11.8 21.7 9.2 8.6 6.6Leic 16.2 197 21.8 19.3 13.2 6.6 14.7 11.2 7.6 5.6Liv Ain 0.0 63 22.2 17.5 17.5 14.3 11.1 3.2 6.4 7.9Liv RI 0.0 90 10.0 20.0 11.1 21.1 23.3 6.7 7.8 0.0M RI 3.8 154 15.6 29.2 9.1 17.5 14.3 7.1 4.6 2.6Middlbr 1.7 118 19.5 24.6 11.0 3.4 18.6 6.8 6.8 9.3Newc 1.9 102 16.7 19.6 23.5 4.9 19.6 3.9 4.9 6.9Norwch 8.1 68 29.4 17.7 16.2 5.9 17.7 5.9 7.4 0.0Nottm 0.0 99 13.1 26.3 15.2 4.0 23.2 6.1 5.1 7.1Oxford 0.0 171 15.8 31.0 14.6 7.6 11.1 5.9 7.0 7.0Plymthb 27.7 34Ports 1.9 158 8.9 23.4 11.4 10.1 19.0 11.4 7.0 8.9Prestn 1.4 145 13.1 28.3 13.1 11.0 13.8 6.2 7.6 6.9Redng 2.7 71 11.3 33.8 12.7 5.6 18.3 4.2 8.5 5.6Salfordb 78.4 29Sheff 0.6 157 15.9 33.8 19.1 3.8 6.4 4.5 8.3 8.3Shrewb 31.6 39Stevng 0.0 110 14.6 15.5 6.4 1.8 52.7 4.6 3.6 0.9Sthend 0.0 26 3.9 15.4 23.1 0.0 23.1 7.7 3.9 23.1Stoke 6.5 72 8.3 27.8 18.1 9.7 15.3 13.9 5.6 1.4Sund 0.0 71 5.6 23.9 5.6 22.5 16.9 11.3 5.6 8.5Truro 8.0 46 10.9 10.9 23.9 15.2 19.6 4.4 6.5 8.7Wirralb 62.0 19Wolve 0.0 84 31.0 22.6 13.1 2.4 16.7 8.3 3.6 2.4York 1.9 52 5.8 21.2 21.2 1.9 21.2 11.5 9.6 7.7
22
The UK Renal Registry The Sixteenth Annual Report
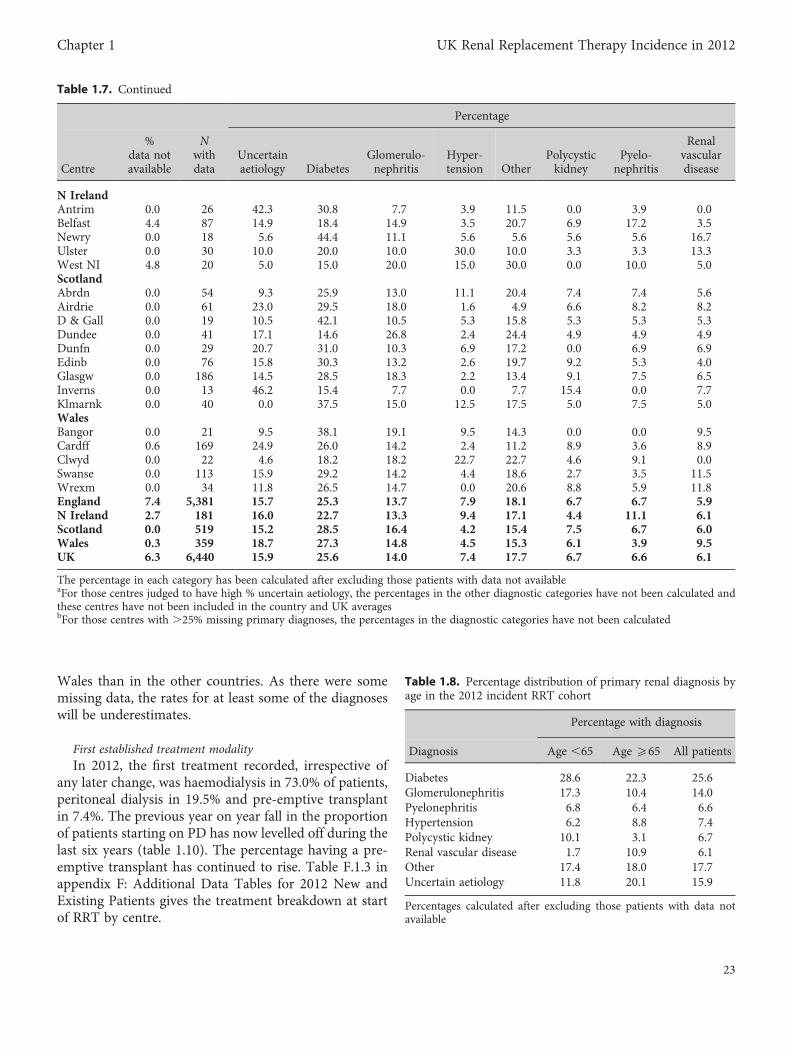
Wales than in the other countries. As there were somemissing data, the rates for at least some of the diagnoseswill be underestimates.
First established treatment modalityIn 2012, the first treatment recorded, irrespective of
any later change, was haemodialysis in 73.0% of patients,peritoneal dialysis in 19.5% and pre-emptive transplantin 7.4%. The previous year on year fall in the proportionof patients starting on PD has now levelled off during thelast six years (table 1.10). The percentage having a pre-emptive transplant has continued to rise. Table F.1.3 inappendix F: Additional Data Tables for 2012 New andExisting Patients gives the treatment breakdown at startof RRT by centre.
Table 1.7. Continued
Percentage
Centre
%data notavailable
Nwithdata
Uncertainaetiology Diabetes
Glomerulo-nephritis
Hyper-tension Other
Polycystickidney
Pyelo-nephritis
Renalvasculardisease
N IrelandAntrim 0.0 26 42.3 30.8 7.7 3.9 11.5 0.0 3.9 0.0Belfast 4.4 87 14.9 18.4 14.9 3.5 20.7 6.9 17.2 3.5Newry 0.0 18 5.6 44.4 11.1 5.6 5.6 5.6 5.6 16.7Ulster 0.0 30 10.0 20.0 10.0 30.0 10.0 3.3 3.3 13.3West NI 4.8 20 5.0 15.0 20.0 15.0 30.0 0.0 10.0 5.0ScotlandAbrdn 0.0 54 9.3 25.9 13.0 11.1 20.4 7.4 7.4 5.6Airdrie 0.0 61 23.0 29.5 18.0 1.6 4.9 6.6 8.2 8.2D & Gall 0.0 19 10.5 42.1 10.5 5.3 15.8 5.3 5.3 5.3Dundee 0.0 41 17.1 14.6 26.8 2.4 24.4 4.9 4.9 4.9Dunfn 0.0 29 20.7 31.0 10.3 6.9 17.2 0.0 6.9 6.9Edinb 0.0 76 15.8 30.3 13.2 2.6 19.7 9.2 5.3 4.0Glasgw 0.0 186 14.5 28.5 18.3 2.2 13.4 9.1 7.5 6.5Inverns 0.0 13 46.2 15.4 7.7 0.0 7.7 15.4 0.0 7.7Klmarnk 0.0 40 0.0 37.5 15.0 12.5 17.5 5.0 7.5 5.0WalesBangor 0.0 21 9.5 38.1 19.1 9.5 14.3 0.0 0.0 9.5Cardff 0.6 169 24.9 26.0 14.2 2.4 11.2 8.9 3.6 8.9Clwyd 0.0 22 4.6 18.2 18.2 22.7 22.7 4.6 9.1 0.0Swanse 0.0 113 15.9 29.2 14.2 4.4 18.6 2.7 3.5 11.5Wrexm 0.0 34 11.8 26.5 14.7 0.0 20.6 8.8 5.9 11.8England 7.4 5,381 15.7 25.3 13.7 7.9 18.1 6.7 6.7 5.9N Ireland 2.7 181 16.0 22.7 13.3 9.4 17.1 4.4 11.1 6.1Scotland 0.0 519 15.2 28.5 16.4 4.2 15.4 7.5 6.7 6.0Wales 0.3 359 18.7 27.3 14.8 4.5 15.3 6.1 3.9 9.5UK 6.3 6,440 15.9 25.6 14.0 7.4 17.7 6.7 6.6 6.1
The percentage in each category has been calculated after excluding those patients with data not availableaFor those centres judged to have high % uncertain aetiology, the percentages in the other diagnostic categories have not been calculated andthese centres have not been included in the country and UK averagesbFor those centres with .25% missing primary diagnoses, the percentages in the diagnostic categories have not been calculated
Table 1.8. Percentage distribution of primary renal diagnosis byage in the 2012 incident RRT cohort
Percentage with diagnosis
Diagnosis Age ,65 Age 565 All patients
Diabetes 28.6 22.3 25.6Glomerulonephritis 17.3 10.4 14.0Pyelonephritis 6.8 6.4 6.6Hypertension 6.2 8.8 7.4Polycystic kidney 10.1 3.1 6.7Renal vascular disease 1.7 10.9 6.1Other 17.4 18.0 17.7Uncertain aetiology 11.8 20.1 15.9
Percentages calculated after excluding those patients with data notavailable
23
Chapter 1 UK Renal Replacement Therapy Incidence in 2012
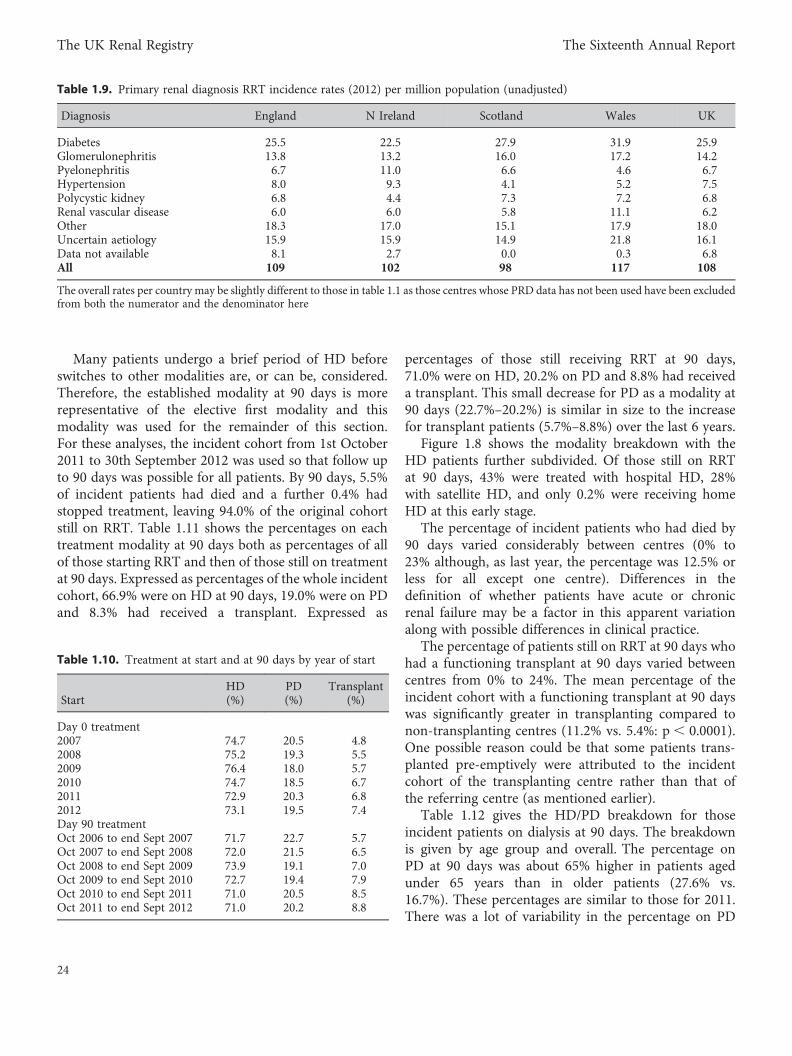
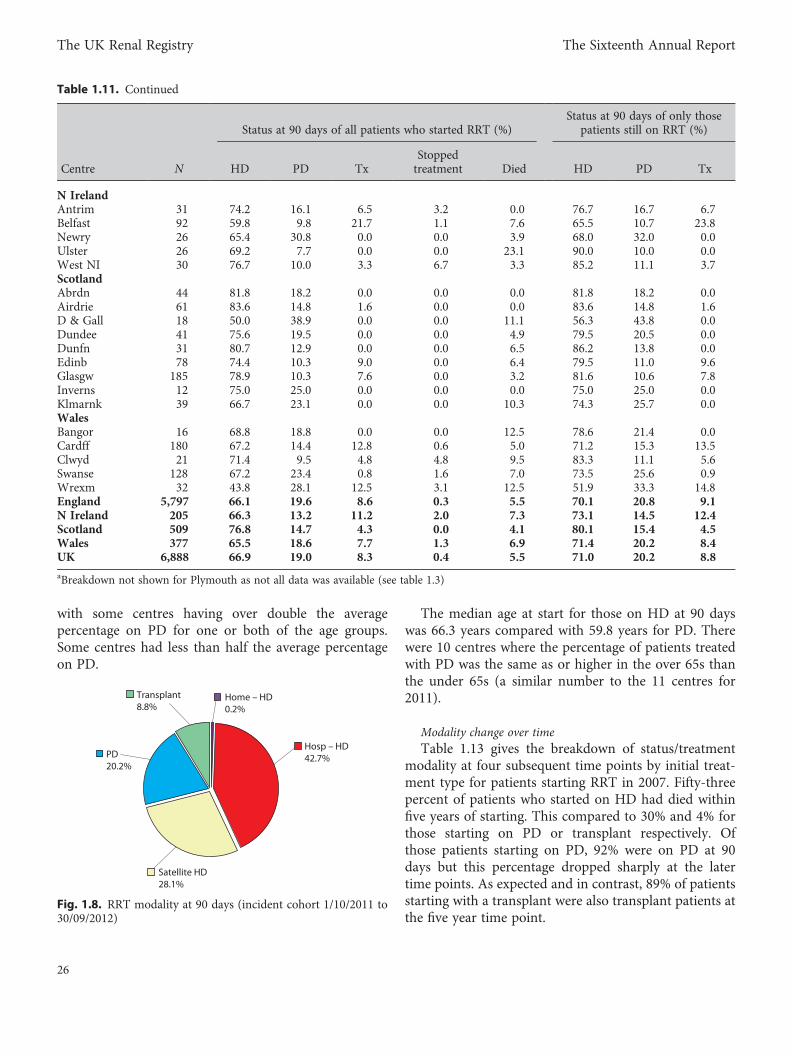
Many patients undergo a brief period of HD beforeswitches to other modalities are, or can be, considered.Therefore, the established modality at 90 days is morerepresentative of the elective first modality and thismodality was used for the remainder of this section.For these analyses, the incident cohort from 1st October2011 to 30th September 2012 was used so that follow upto 90 days was possible for all patients. By 90 days, 5.5%of incident patients had died and a further 0.4% hadstopped treatment, leaving 94.0% of the original cohortstill on RRT. Table 1.11 shows the percentages on eachtreatment modality at 90 days both as percentages of allof those starting RRT and then of those still on treatmentat 90 days. Expressed as percentages of the whole incidentcohort, 66.9% were on HD at 90 days, 19.0% were on PDand 8.3% had received a transplant. Expressed as
percentages of those still receiving RRT at 90 days,71.0% were on HD, 20.2% on PD and 8.8% had receiveda transplant. This small decrease for PD as a modality at90 days (22.7%–20.2%) is similar in size to the increasefor transplant patients (5.7%–8.8%) over the last 6 years.
Figure 1.8 shows the modality breakdown with theHD patients further subdivided. Of those still on RRTat 90 days, 43% were treated with hospital HD, 28%with satellite HD, and only 0.2% were receiving homeHD at this early stage.
The percentage of incident patients who had died by90 days varied considerably between centres (0% to23% although, as last year, the percentage was 12.5% orless for all except one centre). Differences in thedefinition of whether patients have acute or chronicrenal failure may be a factor in this apparent variationalong with possible differences in clinical practice.
The percentage of patients still on RRT at 90 days whohad a functioning transplant at 90 days varied betweencentres from 0% to 24%. The mean percentage of theincident cohort with a functioning transplant at 90 dayswas significantly greater in transplanting compared tonon-transplanting centres (11.2% vs. 5.4%: p, 0.0001).One possible reason could be that some patients trans-planted pre-emptively were attributed to the incidentcohort of the transplanting centre rather than that ofthe referring centre (as mentioned earlier).
Table 1.12 gives the HD/PD breakdown for thoseincident patients on dialysis at 90 days. The breakdownis given by age group and overall. The percentage onPD at 90 days was about 65% higher in patients agedunder 65 years than in older patients (27.6% vs.16.7%). These percentages are similar to those for 2011.There was a lot of variability in the percentage on PD
Table 1.9. Primary renal diagnosis RRT incidence rates (2012) per million population (unadjusted)
Diagnosis England N Ireland Scotland Wales UK
Diabetes 25.5 22.5 27.9 31.9 25.9Glomerulonephritis 13.8 13.2 16.0 17.2 14.2Pyelonephritis 6.7 11.0 6.6 4.6 6.7Hypertension 8.0 9.3 4.1 5.2 7.5Polycystic kidney 6.8 4.4 7.3 7.2 6.8Renal vascular disease 6.0 6.0 5.8 11.1 6.2Other 18.3 17.0 15.1 17.9 18.0Uncertain aetiology 15.9 15.9 14.9 21.8 16.1Data not available 8.1 2.7 0.0 0.3 6.8All 109 102 98 117 108
The overall rates per country may be slightly different to those in table 1.1 as those centres whose PRD data has not been used have been excludedfrom both the numerator and the denominator here
Table 1.10. Treatment at start and at 90 days by year of start
StartHD(%)
PD(%)
Transplant(%)
Day 0 treatment2007 74.7 20.5 4.82008 75.2 19.3 5.52009 76.4 18.0 5.72010 74.7 18.5 6.72011 72.9 20.3 6.82012 73.1 19.5 7.4Day 90 treatmentOct 2006 to end Sept 2007 71.7 22.7 5.7Oct 2007 to end Sept 2008 72.0 21.5 6.5Oct 2008 to end Sept 2009 73.9 19.1 7.0Oct 2009 to end Sept 2010 72.7 19.4 7.9Oct 2010 to end Sept 2011 71.0 20.5 8.5Oct 2011 to end Sept 2012 71.0 20.2 8.8
24
The UK Renal Registry The Sixteenth Annual Report
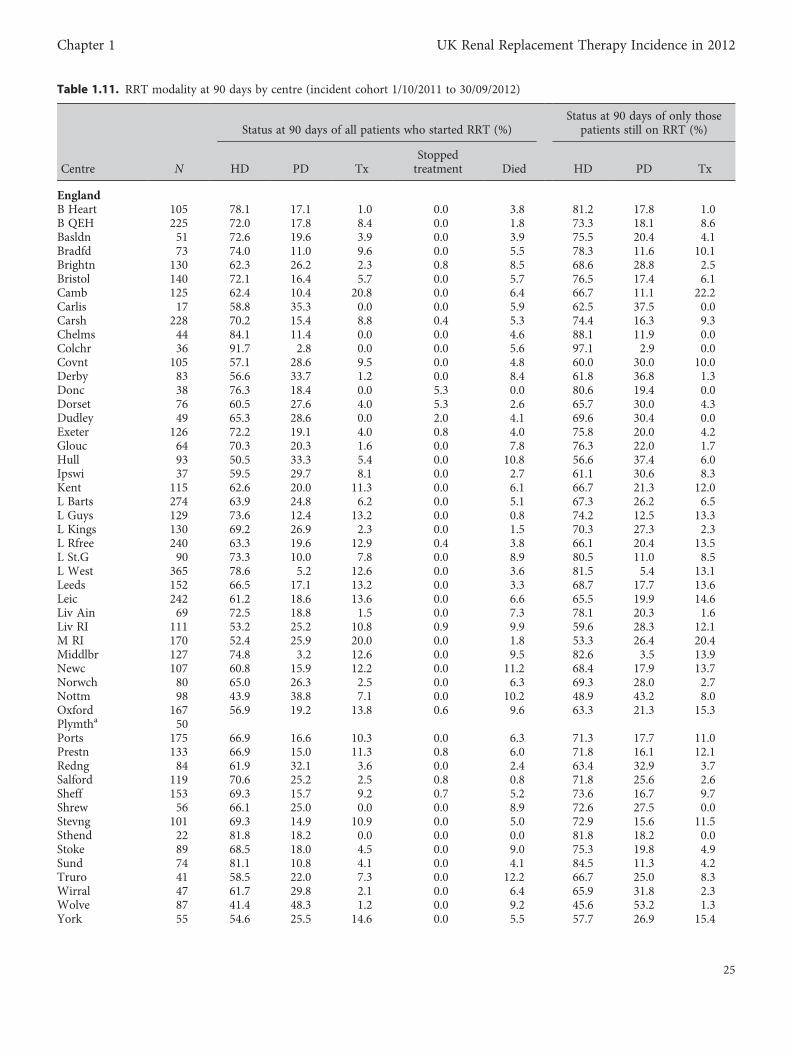
Table 1.11. RRT modality at 90 days by centre (incident cohort 1/10/2011 to 30/09/2012)
Status at 90 days of all patients who started RRT (%)Status at 90 days of only those
patients still on RRT (%)
Centre N HD PD TxStoppedtreatment Died HD PD Tx
EnglandB Heart 105 78.1 17.1 1.0 0.0 3.8 81.2 17.8 1.0B QEH 225 72.0 17.8 8.4 0.0 1.8 73.3 18.1 8.6Basldn 51 72.6 19.6 3.9 0.0 3.9 75.5 20.4 4.1Bradfd 73 74.0 11.0 9.6 0.0 5.5 78.3 11.6 10.1Brightn 130 62.3 26.2 2.3 0.8 8.5 68.6 28.8 2.5Bristol 140 72.1 16.4 5.7 0.0 5.7 76.5 17.4 6.1Camb 125 62.4 10.4 20.8 0.0 6.4 66.7 11.1 22.2Carlis 17 58.8 35.3 0.0 0.0 5.9 62.5 37.5 0.0Carsh 228 70.2 15.4 8.8 0.4 5.3 74.4 16.3 9.3Chelms 44 84.1 11.4 0.0 0.0 4.6 88.1 11.9 0.0Colchr 36 91.7 2.8 0.0 0.0 5.6 97.1 2.9 0.0Covnt 105 57.1 28.6 9.5 0.0 4.8 60.0 30.0 10.0Derby 83 56.6 33.7 1.2 0.0 8.4 61.8 36.8 1.3Donc 38 76.3 18.4 0.0 5.3 0.0 80.6 19.4 0.0Dorset 76 60.5 27.6 4.0 5.3 2.6 65.7 30.0 4.3Dudley 49 65.3 28.6 0.0 2.0 4.1 69.6 30.4 0.0Exeter 126 72.2 19.1 4.0 0.8 4.0 75.8 20.0 4.2Glouc 64 70.3 20.3 1.6 0.0 7.8 76.3 22.0 1.7Hull 93 50.5 33.3 5.4 0.0 10.8 56.6 37.4 6.0Ipswi 37 59.5 29.7 8.1 0.0 2.7 61.1 30.6 8.3Kent 115 62.6 20.0 11.3 0.0 6.1 66.7 21.3 12.0L Barts 274 63.9 24.8 6.2 0.0 5.1 67.3 26.2 6.5L Guys 129 73.6 12.4 13.2 0.0 0.8 74.2 12.5 13.3L Kings 130 69.2 26.9 2.3 0.0 1.5 70.3 27.3 2.3L Rfree 240 63.3 19.6 12.9 0.4 3.8 66.1 20.4 13.5L St.G 90 73.3 10.0 7.8 0.0 8.9 80.5 11.0 8.5L West 365 78.6 5.2 12.6 0.0 3.6 81.5 5.4 13.1Leeds 152 66.5 17.1 13.2 0.0 3.3 68.7 17.7 13.6Leic 242 61.2 18.6 13.6 0.0 6.6 65.5 19.9 14.6Liv Ain 69 72.5 18.8 1.5 0.0 7.3 78.1 20.3 1.6Liv RI 111 53.2 25.2 10.8 0.9 9.9 59.6 28.3 12.1M RI 170 52.4 25.9 20.0 0.0 1.8 53.3 26.4 20.4Middlbr 127 74.8 3.2 12.6 0.0 9.5 82.6 3.5 13.9Newc 107 60.8 15.9 12.2 0.0 11.2 68.4 17.9 13.7Norwch 80 65.0 26.3 2.5 0.0 6.3 69.3 28.0 2.7Nottm 98 43.9 38.8 7.1 0.0 10.2 48.9 43.2 8.0Oxford 167 56.9 19.2 13.8 0.6 9.6 63.3 21.3 15.3Plymtha 50Ports 175 66.9 16.6 10.3 0.0 6.3 71.3 17.7 11.0Prestn 133 66.9 15.0 11.3 0.8 6.0 71.8 16.1 12.1Redng 84 61.9 32.1 3.6 0.0 2.4 63.4 32.9 3.7Salford 119 70.6 25.2 2.5 0.8 0.8 71.8 25.6 2.6Sheff 153 69.3 15.7 9.2 0.7 5.2 73.6 16.7 9.7Shrew 56 66.1 25.0 0.0 0.0 8.9 72.6 27.5 0.0Stevng 101 69.3 14.9 10.9 0.0 5.0 72.9 15.6 11.5Sthend 22 81.8 18.2 0.0 0.0 0.0 81.8 18.2 0.0Stoke 89 68.5 18.0 4.5 0.0 9.0 75.3 19.8 4.9Sund 74 81.1 10.8 4.1 0.0 4.1 84.5 11.3 4.2Truro 41 58.5 22.0 7.3 0.0 12.2 66.7 25.0 8.3Wirral 47 61.7 29.8 2.1 0.0 6.4 65.9 31.8 2.3Wolve 87 41.4 48.3 1.2 0.0 9.2 45.6 53.2 1.3York 55 54.6 25.5 14.6 0.0 5.5 57.7 26.9 15.4
25
Chapter 1 UK Renal Replacement Therapy Incidence in 2012
with some centres having over double the averagepercentage on PD for one or both of the age groups.Some centres had less than half the average percentageon PD.
The median age at start for those on HD at 90 dayswas 66.3 years compared with 59.8 years for PD. Therewere 10 centres where the percentage of patients treatedwith PD was the same as or higher in the over 65s thanthe under 65s (a similar number to the 11 centres for2011).
Modality change over timeTable 1.13 gives the breakdown of status/treatment
modality at four subsequent time points by initial treat-ment type for patients starting RRT in 2007. Fifty-threepercent of patients who started on HD had died withinfive years of starting. This compared to 30% and 4% forthose starting on PD or transplant respectively. Ofthose patients starting on PD, 92% were on PD at 90days but this percentage dropped sharply at the latertime points. As expected and in contrast, 89% of patientsstarting with a transplant were also transplant patients atthe five year time point.
Table 1.11. Continued
Status at 90 days of all patients who started RRT (%)Status at 90 days of only those
patients still on RRT (%)
Centre N HD PD TxStoppedtreatment Died HD PD Tx
N IrelandAntrim 31 74.2 16.1 6.5 3.2 0.0 76.7 16.7 6.7Belfast 92 59.8 9.8 21.7 1.1 7.6 65.5 10.7 23.8Newry 26 65.4 30.8 0.0 0.0 3.9 68.0 32.0 0.0Ulster 26 69.2 7.7 0.0 0.0 23.1 90.0 10.0 0.0West NI 30 76.7 10.0 3.3 6.7 3.3 85.2 11.1 3.7ScotlandAbrdn 44 81.8 18.2 0.0 0.0 0.0 81.8 18.2 0.0Airdrie 61 83.6 14.8 1.6 0.0 0.0 83.6 14.8 1.6D & Gall 18 50.0 38.9 0.0 0.0 11.1 56.3 43.8 0.0Dundee 41 75.6 19.5 0.0 0.0 4.9 79.5 20.5 0.0Dunfn 31 80.7 12.9 0.0 0.0 6.5 86.2 13.8 0.0Edinb 78 74.4 10.3 9.0 0.0 6.4 79.5 11.0 9.6Glasgw 185 78.9 10.3 7.6 0.0 3.2 81.6 10.6 7.8Inverns 12 75.0 25.0 0.0 0.0 0.0 75.0 25.0 0.0Klmarnk 39 66.7 23.1 0.0 0.0 10.3 74.3 25.7 0.0WalesBangor 16 68.8 18.8 0.0 0.0 12.5 78.6 21.4 0.0Cardff 180 67.2 14.4 12.8 0.6 5.0 71.2 15.3 13.5Clwyd 21 71.4 9.5 4.8 4.8 9.5 83.3 11.1 5.6Swanse 128 67.2 23.4 0.8 1.6 7.0 73.5 25.6 0.9Wrexm 32 43.8 28.1 12.5 3.1 12.5 51.9 33.3 14.8England 5,797 66.1 19.6 8.6 0.3 5.5 70.1 20.8 9.1N Ireland 205 66.3 13.2 11.2 2.0 7.3 73.1 14.5 12.4Scotland 509 76.8 14.7 4.3 0.0 4.1 80.1 15.4 4.5Wales 377 65.5 18.6 7.7 1.3 6.9 71.4 20.2 8.4UK 6,888 66.9 19.0 8.3 0.4 5.5 71.0 20.2 8.8
aBreakdown not shown for Plymouth as not all data was available (see table 1.3)
Transplant8.8%
PD20.2%
Home – HD0.2%
Satellite HD28.1%
Hosp – HD42.7%
Fig. 1.8. RRT modality at 90 days (incident cohort 1/10/2011 to30/09/2012)
26
The UK Renal Registry The Sixteenth Annual Report
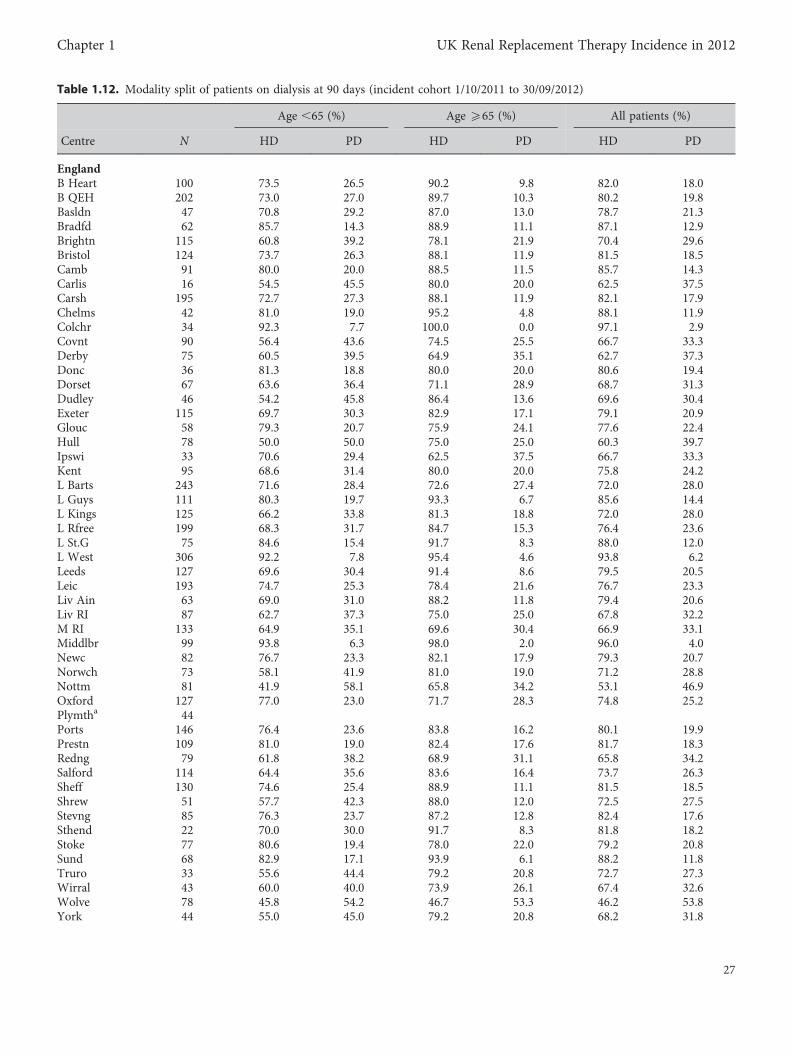
Table 1.12. Modality split of patients on dialysis at 90 days (incident cohort 1/10/2011 to 30/09/2012)
Age ,65 (%) Age 565 (%) All patients (%)
Centre N HD PD HD PD HD PD
EnglandB Heart 100 73.5 26.5 90.2 9.8 82.0 18.0B QEH 202 73.0 27.0 89.7 10.3 80.2 19.8Basldn 47 70.8 29.2 87.0 13.0 78.7 21.3Bradfd 62 85.7 14.3 88.9 11.1 87.1 12.9Brightn 115 60.8 39.2 78.1 21.9 70.4 29.6Bristol 124 73.7 26.3 88.1 11.9 81.5 18.5Camb 91 80.0 20.0 88.5 11.5 85.7 14.3Carlis 16 54.5 45.5 80.0 20.0 62.5 37.5Carsh 195 72.7 27.3 88.1 11.9 82.1 17.9Chelms 42 81.0 19.0 95.2 4.8 88.1 11.9Colchr 34 92.3 7.7 100.0 0.0 97.1 2.9Covnt 90 56.4 43.6 74.5 25.5 66.7 33.3Derby 75 60.5 39.5 64.9 35.1 62.7 37.3Donc 36 81.3 18.8 80.0 20.0 80.6 19.4Dorset 67 63.6 36.4 71.1 28.9 68.7 31.3Dudley 46 54.2 45.8 86.4 13.6 69.6 30.4Exeter 115 69.7 30.3 82.9 17.1 79.1 20.9Glouc 58 79.3 20.7 75.9 24.1 77.6 22.4Hull 78 50.0 50.0 75.0 25.0 60.3 39.7Ipswi 33 70.6 29.4 62.5 37.5 66.7 33.3Kent 95 68.6 31.4 80.0 20.0 75.8 24.2L Barts 243 71.6 28.4 72.6 27.4 72.0 28.0L Guys 111 80.3 19.7 93.3 6.7 85.6 14.4L Kings 125 66.2 33.8 81.3 18.8 72.0 28.0L Rfree 199 68.3 31.7 84.7 15.3 76.4 23.6L St.G 75 84.6 15.4 91.7 8.3 88.0 12.0L West 306 92.2 7.8 95.4 4.6 93.8 6.2Leeds 127 69.6 30.4 91.4 8.6 79.5 20.5Leic 193 74.7 25.3 78.4 21.6 76.7 23.3Liv Ain 63 69.0 31.0 88.2 11.8 79.4 20.6Liv RI 87 62.7 37.3 75.0 25.0 67.8 32.2M RI 133 64.9 35.1 69.6 30.4 66.9 33.1Middlbr 99 93.8 6.3 98.0 2.0 96.0 4.0Newc 82 76.7 23.3 82.1 17.9 79.3 20.7Norwch 73 58.1 41.9 81.0 19.0 71.2 28.8Nottm 81 41.9 58.1 65.8 34.2 53.1 46.9Oxford 127 77.0 23.0 71.7 28.3 74.8 25.2Plymtha 44Ports 146 76.4 23.6 83.8 16.2 80.1 19.9Prestn 109 81.0 19.0 82.4 17.6 81.7 18.3Redng 79 61.8 38.2 68.9 31.1 65.8 34.2Salford 114 64.4 35.6 83.6 16.4 73.7 26.3Sheff 130 74.6 25.4 88.9 11.1 81.5 18.5Shrew 51 57.7 42.3 88.0 12.0 72.5 27.5Stevng 85 76.3 23.7 87.2 12.8 82.4 17.6Sthend 22 70.0 30.0 91.7 8.3 81.8 18.2Stoke 77 80.6 19.4 78.0 22.0 79.2 20.8Sund 68 82.9 17.1 93.9 6.1 88.2 11.8Truro 33 55.6 44.4 79.2 20.8 72.7 27.3Wirral 43 60.0 40.0 73.9 26.1 67.4 32.6Wolve 78 45.8 54.2 46.7 53.3 46.2 53.8York 44 55.0 45.0 79.2 20.8 68.2 31.8
27
Chapter 1 UK Renal Replacement Therapy Incidence in 2012
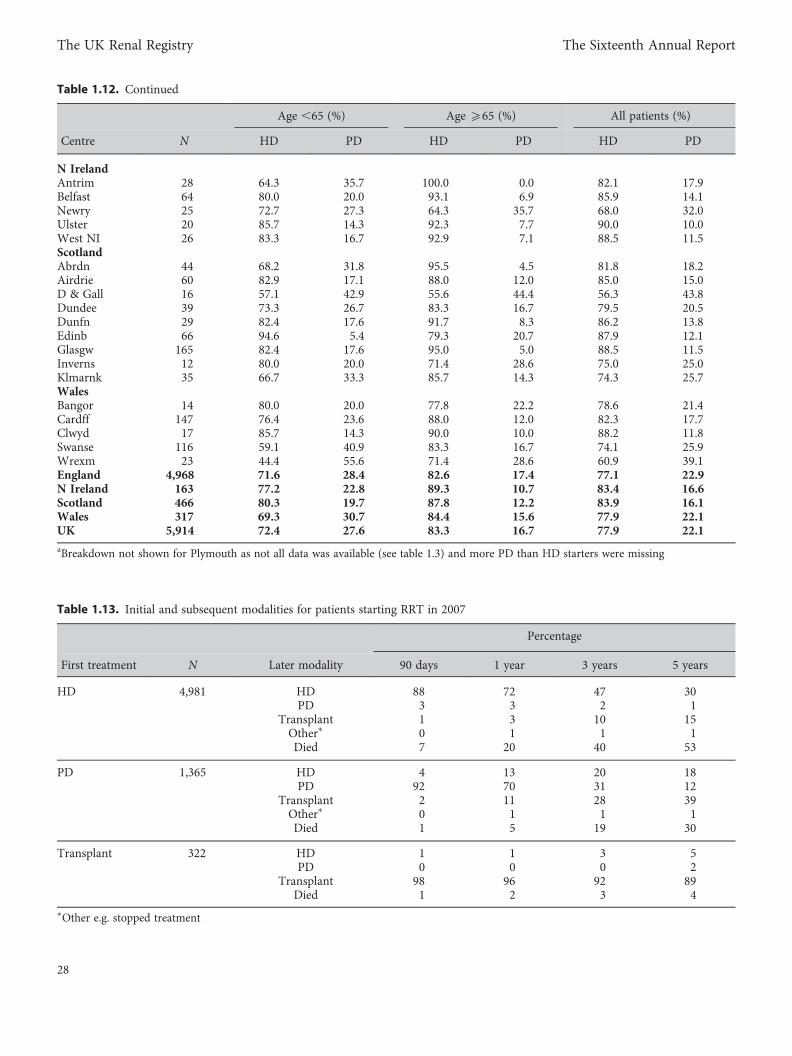
Table 1.12. Continued
Age ,65 (%) Age 565 (%) All patients (%)
Centre N HD PD HD PD HD PD
N IrelandAntrim 28 64.3 35.7 100.0 0.0 82.1 17.9Belfast 64 80.0 20.0 93.1 6.9 85.9 14.1Newry 25 72.7 27.3 64.3 35.7 68.0 32.0Ulster 20 85.7 14.3 92.3 7.7 90.0 10.0West NI 26 83.3 16.7 92.9 7.1 88.5 11.5ScotlandAbrdn 44 68.2 31.8 95.5 4.5 81.8 18.2Airdrie 60 82.9 17.1 88.0 12.0 85.0 15.0D & Gall 16 57.1 42.9 55.6 44.4 56.3 43.8Dundee 39 73.3 26.7 83.3 16.7 79.5 20.5Dunfn 29 82.4 17.6 91.7 8.3 86.2 13.8Edinb 66 94.6 5.4 79.3 20.7 87.9 12.1Glasgw 165 82.4 17.6 95.0 5.0 88.5 11.5Inverns 12 80.0 20.0 71.4 28.6 75.0 25.0Klmarnk 35 66.7 33.3 85.7 14.3 74.3 25.7WalesBangor 14 80.0 20.0 77.8 22.2 78.6 21.4Cardff 147 76.4 23.6 88.0 12.0 82.3 17.7Clwyd 17 85.7 14.3 90.0 10.0 88.2 11.8Swanse 116 59.1 40.9 83.3 16.7 74.1 25.9Wrexm 23 44.4 55.6 71.4 28.6 60.9 39.1England 4,968 71.6 28.4 82.6 17.4 77.1 22.9N Ireland 163 77.2 22.8 89.3 10.7 83.4 16.6Scotland 466 80.3 19.7 87.8 12.2 83.9 16.1Wales 317 69.3 30.7 84.4 15.6 77.9 22.1UK 5,914 72.4 27.6 83.3 16.7 77.9 22.1aBreakdown not shown for Plymouth as not all data was available (see table 1.3) and more PD than HD starters were missing
Table 1.13. Initial and subsequent modalities for patients starting RRT in 2007
Percentage
First treatment N Later modality 90 days 1 year 3 years 5 years
HD 4,981 HD 88 72 47 30PD 3 3 2 1
Transplant 1 3 10 15Other∗ 0 1 1 1Died 7 20 40 53
PD 1,365 HD 4 13 20 18PD 92 70 31 12
Transplant 2 11 28 39Other∗ 0 1 1 1Died 1 5 19 30
Transplant 322 HD 1 1 3 5PD 0 0 0 2
Transplant 98 96 92 89Died 1 2 3 4
∗Other e.g. stopped treatment
28
The UK Renal Registry The Sixteenth Annual Report
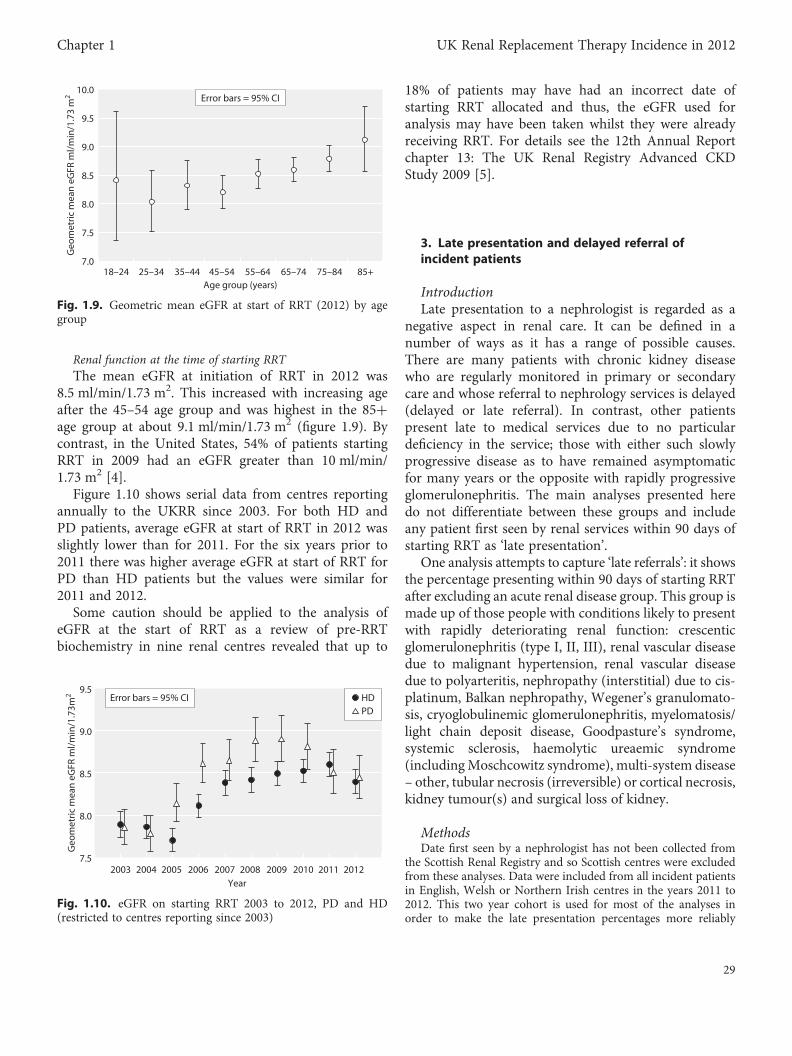
Renal function at the time of starting RRTThe mean eGFR at initiation of RRT in 2012 was
8.5 ml/min/1.73 m2. This increased with increasing ageafter the 45–54 age group and was highest in the 85+age group at about 9.1 ml/min/1.73 m2 (figure 1.9). Bycontrast, in the United States, 54% of patients startingRRT in 2009 had an eGFR greater than 10 ml/min/1.73 m2 [4].
Figure 1.10 shows serial data from centres reportingannually to the UKRR since 2003. For both HD andPD patients, average eGFR at start of RRT in 2012 wasslightly lower than for 2011. For the six years prior to2011 there was higher average eGFR at start of RRT forPD than HD patients but the values were similar for2011 and 2012.
Some caution should be applied to the analysis ofeGFR at the start of RRT as a review of pre-RRTbiochemistry in nine renal centres revealed that up to
18% of patients may have had an incorrect date ofstarting RRT allocated and thus, the eGFR used foranalysis may have been taken whilst they were alreadyreceiving RRT. For details see the 12th Annual Reportchapter 13: The UK Renal Registry Advanced CKDStudy 2009 [5].
3. Late presentation and delayed referral ofincident patients
IntroductionLate presentation to a nephrologist is regarded as a
negative aspect in renal care. It can be defined in anumber of ways as it has a range of possible causes.There are many patients with chronic kidney diseasewho are regularly monitored in primary or secondarycare and whose referral to nephrology services is delayed(delayed or late referral). In contrast, other patientspresent late to medical services due to no particulardeficiency in the service; those with either such slowlyprogressive disease as to have remained asymptomaticfor many years or the opposite with rapidly progressiveglomerulonephritis. The main analyses presented heredo not differentiate between these groups and includeany patient first seen by renal services within 90 days ofstarting RRT as ‘late presentation’.
One analysis attempts to capture ‘late referrals’: it showsthe percentage presenting within 90 days of starting RRTafter excluding an acute renal disease group. This group ismade up of those people with conditions likely to presentwith rapidly deteriorating renal function: crescenticglomerulonephritis (type I, II, III), renal vascular diseasedue to malignant hypertension, renal vascular diseasedue to polyarteritis, nephropathy (interstitial) due to cis-platinum, Balkan nephropathy, Wegener’s granulomato-sis, cryoglobulinemic glomerulonephritis, myelomatosis/light chain deposit disease, Goodpasture’s syndrome,systemic sclerosis, haemolytic ureaemic syndrome(includingMoschcowitz syndrome), multi-system disease– other, tubular necrosis (irreversible) or cortical necrosis,kidney tumour(s) and surgical loss of kidney.
MethodsDate first seen by a nephrologist has not been collected from
the Scottish Renal Registry and so Scottish centres were excludedfrom these analyses. Data were included from all incident patientsin English, Welsh or Northern Irish centres in the years 2011 to2012. This two year cohort is used for most of the analyses inorder to make the late presentation percentages more reliably
18–24 25–34 35–44 45–54 55–64 65–74 75–84 85+Age group (years)
Geo
met
ric m
ean
eGFR
ml/
min
/1.7
3 m
2
7.0
7.5
8.0
8.5
9.0
9.5
10.0Error bars = 95% CI
Fig. 1.9. Geometric mean eGFR at start of RRT (2012) by agegroup
7.5
8.0
8.5
9.0
9.5
2003 2004 2005 2006 2007 2008 2009 2010 2011 2012
Geo
met
ric m
ean
eGFR
ml/
min
/1.7
3m2
Year
HDPD
Error bars = 95% CI
Fig. 1.10. eGFR on starting RRT 2003 to 2012, PD and HD(restricted to centres reporting since 2003)
29
Chapter 1 UK Renal Replacement Therapy Incidence in 2012
estimated and to allow these to be shown for subgroups of patients.The date first seen in a renal centre and the date of starting RRTwere used to define the late presenting cohort. A small amountof data were excluded because of actual or potential inconsisten-cies. Only data from those centres with 75% or more completenessfor the relevant year were used. Some data were excluded if 10% ormore of the patients were reported to have started RRT on thesame date as the first presentation. This was because investigationhas shown that this is likely due to misunderstanding on the partof the renal centres resulting in incorrect recording of data. Afterthese exclusions, data on 9,937 patients were available for analysis.Presentation times of 90 days or more were defined as earlypresentation and times of less than 90 days were defined as latepresentation.
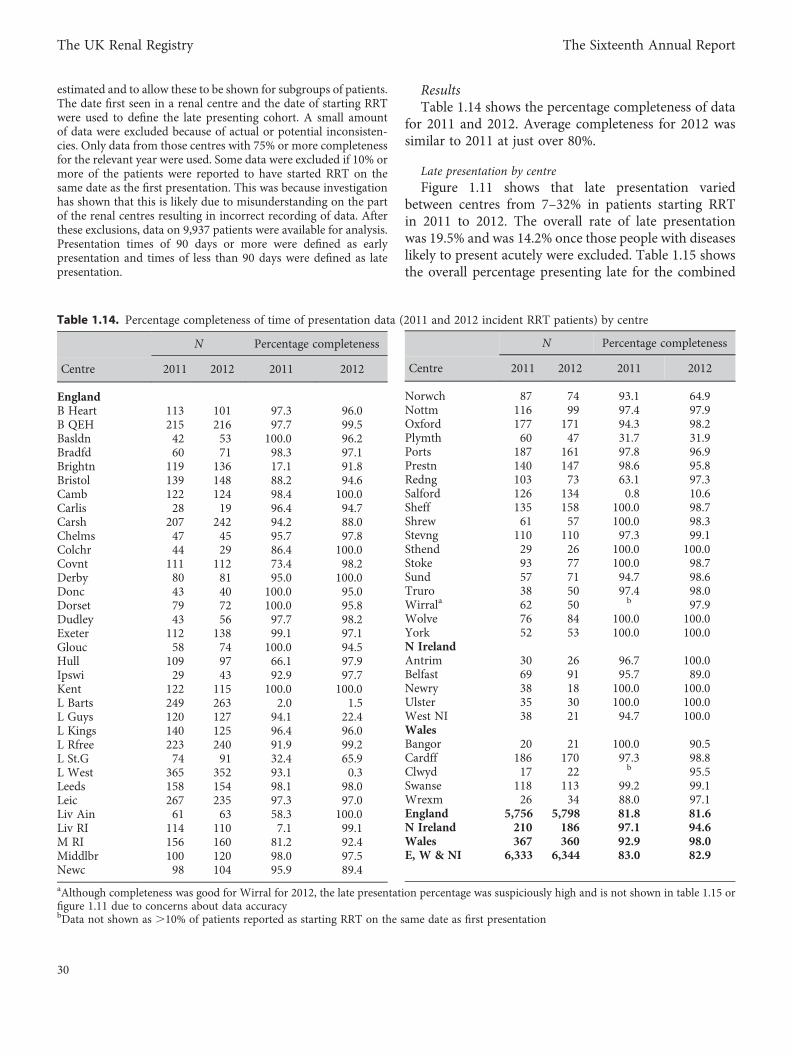
ResultsTable 1.14 shows the percentage completeness of data
for 2011 and 2012. Average completeness for 2012 wassimilar to 2011 at just over 80%.
Late presentation by centreFigure 1.11 shows that late presentation varied
between centres from 7–32% in patients starting RRTin 2011 to 2012. The overall rate of late presentationwas 19.5% and was 14.2% once those people with diseaseslikely to present acutely were excluded. Table 1.15 showsthe overall percentage presenting late for the combined
Table 1.14. Percentage completeness of time of presentation data (2011 and 2012 incident RRT patients) by centre
N Percentage completeness
Centre 2011 2012 2011 2012
EnglandB Heart 113 101 97.3 96.0B QEH 215 216 97.7 99.5Basldn 42 53 100.0 96.2Bradfd 60 71 98.3 97.1Brightn 119 136 17.1 91.8Bristol 139 148 88.2 94.6Camb 122 124 98.4 100.0Carlis 28 19 96.4 94.7Carsh 207 242 94.2 88.0Chelms 47 45 95.7 97.8Colchr 44 29 86.4 100.0Covnt 111 112 73.4 98.2Derby 80 81 95.0 100.0Donc 43 40 100.0 95.0Dorset 79 72 100.0 95.8Dudley 43 56 97.7 98.2Exeter 112 138 99.1 97.1Glouc 58 74 100.0 94.5Hull 109 97 66.1 97.9Ipswi 29 43 92.9 97.7Kent 122 115 100.0 100.0L Barts 249 263 2.0 1.5L Guys 120 127 94.1 22.4L Kings 140 125 96.4 96.0L Rfree 223 240 91.9 99.2L St.G 74 91 32.4 65.9L West 365 352 93.1 0.3Leeds 158 154 98.1 98.0Leic 267 235 97.3 97.0Liv Ain 61 63 58.3 100.0Liv RI 114 110 7.1 99.1M RI 156 160 81.2 92.4Middlbr 100 120 98.0 97.5Newc 98 104 95.9 89.4
aAlthough completeness was good for Wirral for 2012, the late presentation percentage was suspiciously high and is not shown in table 1.15 orfigure 1.11 due to concerns about data accuracybData not shown as .10% of patients reported as starting RRT on the same date as first presentation
N Percentage completeness
Centre 2011 2012 2011 2012
Norwch 87 74 93.1 64.9Nottm 116 99 97.4 97.9Oxford 177 171 94.3 98.2Plymth 60 47 31.7 31.9Ports 187 161 97.8 96.9Prestn 140 147 98.6 95.8Redng 103 73 63.1 97.3Salford 126 134 0.8 10.6Sheff 135 158 100.0 98.7Shrew 61 57 100.0 98.3Stevng 110 110 97.3 99.1Sthend 29 26 100.0 100.0Stoke 93 77 100.0 98.7Sund 57 71 94.7 98.6Truro 38 50 97.4 98.0Wirrala 62 50 b 97.9Wolve 76 84 100.0 100.0York 52 53 100.0 100.0N IrelandAntrim 30 26 96.7 100.0Belfast 69 91 95.7 89.0Newry 38 18 100.0 100.0Ulster 35 30 100.0 100.0West NI 38 21 94.7 100.0WalesBangor 20 21 100.0 90.5Cardff 186 170 97.3 98.8Clwyd 17 22 b 95.5Swanse 118 113 99.2 99.1Wrexm 26 34 88.0 97.1England 5,756 5,798 81.8 81.6N Ireland 210 186 97.1 94.6Wales 367 360 92.9 98.0E, W & NI 6,333 6,344 83.0 82.9
30
The UK Renal Registry The Sixteenth Annual Report
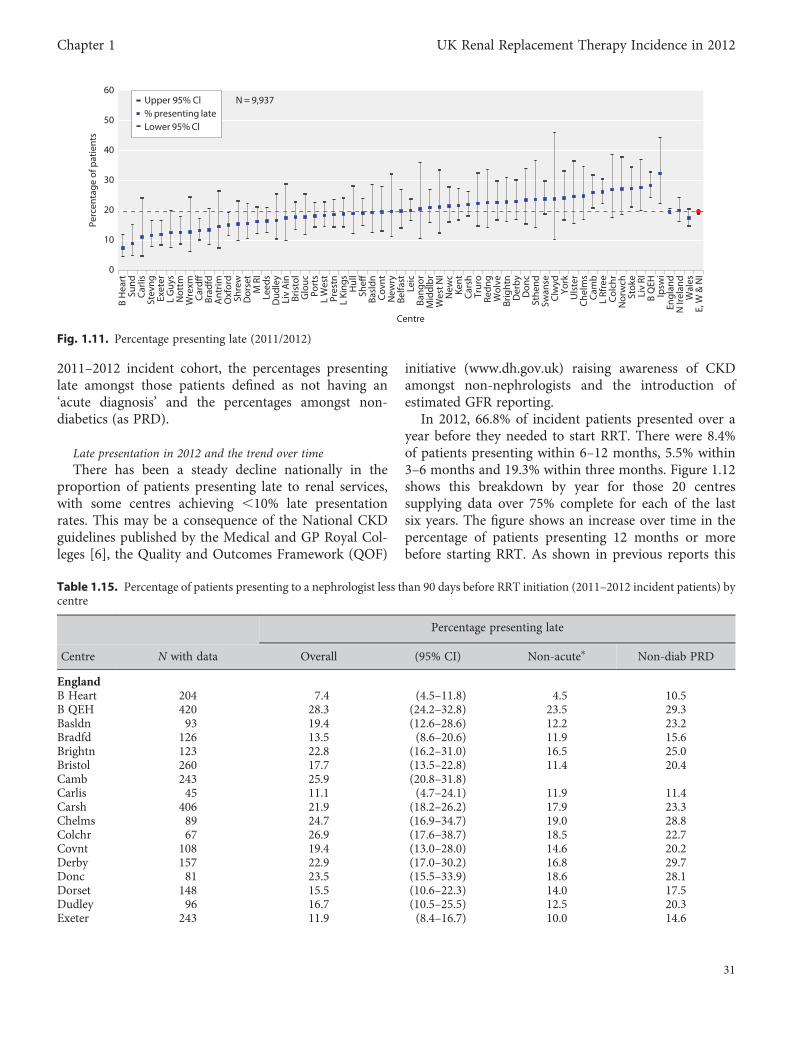
2011–2012 incident cohort, the percentages presentinglate amongst those patients defined as not having an‘acute diagnosis’ and the percentages amongst non-diabetics (as PRD).
Late presentation in 2012 and the trend over timeThere has been a steady decline nationally in the
proportion of patients presenting late to renal services,with some centres achieving ,10% late presentationrates. This may be a consequence of the National CKDguidelines published by the Medical and GP Royal Col-leges [6], the Quality and Outcomes Framework (QOF)
initiative (www.dh.gov.uk) raising awareness of CKDamongst non-nephrologists and the introduction ofestimated GFR reporting.
In 2012, 66.8% of incident patients presented over ayear before they needed to start RRT. There were 8.4%of patients presenting within 6–12 months, 5.5% within3–6 months and 19.3% within three months. Figure 1.12shows this breakdown by year for those 20 centressupplying data over 75% complete for each of the lastsix years. The figure shows an increase over time in thepercentage of patients presenting 12 months or morebefore starting RRT. As shown in previous reports this
Table 1.15. Percentage of patients presenting to a nephrologist less than 90 days before RRT initiation (2011–2012 incident patients) bycentre
Percentage presenting late
Centre N with data Overall (95% CI) Non-acute∗ Non-diab PRD
EnglandB Heart 204 7.4 (4.5–11.8) 4.5 10.5B QEH 420 28.3 (24.2–32.8) 23.5 29.3Basldn 93 19.4 (12.6–28.6) 12.2 23.2Bradfd 126 13.5 (8.6–20.6) 11.9 15.6Brightn 123 22.8 (16.2–31.0) 16.5 25.0Bristol 260 17.7 (13.5–22.8) 11.4 20.4Camb 243 25.9 (20.8–31.8)Carlis 45 11.1 (4.7–24.1) 11.9 11.4Carsh 406 21.9 (18.2–26.2) 17.9 23.3Chelms 89 24.7 (16.9–34.7) 19.0 28.8Colchr 67 26.9 (17.6–38.7) 18.5 22.7Covnt 108 19.4 (13.0–28.0) 14.6 20.2Derby 157 22.9 (17.0–30.2) 16.8 29.7Donc 81 23.5 (15.5–33.9) 18.6 28.1Dorset 148 15.5 (10.6–22.3) 14.0 17.5Dudley 96 16.7 (10.5–25.5) 12.5 20.3Exeter 243 11.9 (8.4–16.7) 10.0 14.6
Centre
Perc
enta
ge o
f pat
ient
s
0
10
20
30
40
50
60
B H
eart
Sund
Car
lisSt
evng
Exet
erL
Guy
sN
ottm
Wre
xmC
ardff
Brad
fdA
ntrim
Oxf
ord
Shre
wD
orse
tM
RI
Leed
sD
udle
yLi
v A
inBr
isto
lG
louc
Port
sL
Wes
tPr
estn
L Ki
ngs
Hul
lSh
effBa
sldn
Cov
ntN
ewry
Belfa
stLe
icBa
ngor
Mid
dlb
rW
est N
IN
ewc
Kent
Car
shTr
uro
Redn
gW
olve
Brig
htn
Der
by
Don
cSt
hend
Swan
seC
lwyd
York
Uls
ter
Che
lms
Cam
bL
Rfre
eC
olch
rN
orw
chSt
oke
Liv
RIB
QEH
Ipsw
iEn
glan
dN
Irel
and
Wal
esE,
W &
NI
Upper 95% Cl N = 9,937% presenting lateLower 95% Cl
Fig. 1.11. Percentage presenting late (2011/2012)
31
Chapter 1 UK Renal Replacement Therapy Incidence in 2012
Table 1.15. Continued
Percentage presenting late
Centre N with data Overall (95% CI) Non-acute∗ Non-diab PRD
Glouc 124 17.7 (12.0–25.5) 13.9 19.0Hull 95 19.0 (12.3–28.1) 14.9 23.0Ipswi 68 32.4 (22.4–44.3) 34.6 44.4Kent 237 21.5 (16.8–27.2) 16.8 25.0L Guys 112 12.5 (7.5–20.0) 10.2 12.8L Kings 255 18.8 (14.5–24.1) 14.0 27.5L Rfree 443 26.2 (22.3–30.5) 21.5 28.7L West 338 18.3 (14.6–22.8) 14.9 21.9Leeds 299 16.4 (12.6–21.0) 8.7 18.8Leic 482 19.9 (16.6–23.7) 11.7 23.5Liv Ain 63 17.5 (9.9–28.9) 16.7 21.2Liv RI 105 27.6 (19.9–36.9) 11.3 32.2M RI 271 16.2 (12.3–21.1) 14.3 18.5Middlbr 215 20.9 (16.0–26.9) 18.8 26.1Newc 187 21.4 (16.1–27.9) 11.8 24.2Norwch 81 27.2 (18.6–37.8) 17.7 30.4Nottm 206 12.6 (8.7–17.9) 11.3 14.8Oxford 332 15.1 (11.6–19.3) 11.3 19.0Ports 336 18.2 (14.4–22.6) 9.4 20.3Prestn 275 18.6 (14.4–23.6) 13.1 20.1Redng 71 22.5 (14.3–33.7) 19.1 31.3Sheff 289 19.0 (14.9–24.0) 13.5 23.8Shrew 117 15.4 (9.9–23.1) 11.1 11.1Stevng 215 11.6 (8.0–16.6) 9.8 12.1Sthend 55 23.6 (14.3–36.6) 18.8 28.9Stoke 169 27.2 (21.0–34.4) 19.0 32.3Sund 124 8.9 (5.0–15.3) 5.6 10.0Truro 85 22.4 (14.7–32.4) 18.7 25.0Wolve 159 22.6 (16.8–29.8) 20.5 25.6York 104 24.0 (16.8–33.2) 17.4 27.4N IrelandAntrim 55 14.6 (7.4–26.5) 13.2 18.4Belfast 147 19.7 (14.1–27.0) 12.3 24.6Newry 56 19.6 (11.2–32.1) 13.5 23.7Ulster 65 24.6 (15.7–36.5) 21.0 22.5West NI 57 21.1 (12.4–33.5) 16.3 22.9WalesBangor 39 20.5 (10.6–36.0) 21.1 25.0Cardff 347 13.3 (10.1–17.3) 10.3 16.3Clwyd 21 23.8 (10.3–46.0) 22.2 17.7Swanse 227 23.8 (18.7–29.8) 16.2 30.7Wrexm 55 12.7 (6.2–24.4) 11.1 18.4England 8,868 19.7 (18.9–20.5) 14.3 22.2N Ireland 380 20.0 (16.3–24.3) 14.8 23.0Wales 689 17.4 (14.8–20.4) 13.2 21.7E, W & NI 9,937 19.5 (18.8–20.3) 14.2 22.2(min, max) (7.4–42.6) (4.5–34.6) (10.0–44.4)(IQR) (16.3–23.6) (11.7–18.5) (18.5–26.4)
Blank cells – data for PRD not used due to high % with uncertain aetiology∗Non-acute group excludes crescentic (extracapillary) glomerulonephritis (type I, II, III), nephropathy (interstitial) due to cis-platinum, renalvascular disease due to malignant hypertension, renal vascular disease due to polyarteritis, Wegener’s granulomatosis, cryoglobulinemicglomerulonephritis, myelomatosis/light chain deposit disease, Goodpasture’s syndrome, systemic sclerosis (scleroderma), haemolytic ureaemicsyndrome (including Moschcowitz syndrome), multi-system disease – other, tubular necrosis (irreversible) or cortical necrosis, Balkannephropathy, kidney tumour(s), and traumatic or surgical loss of kidney
32
The UK Renal Registry The Sixteenth Annual Report
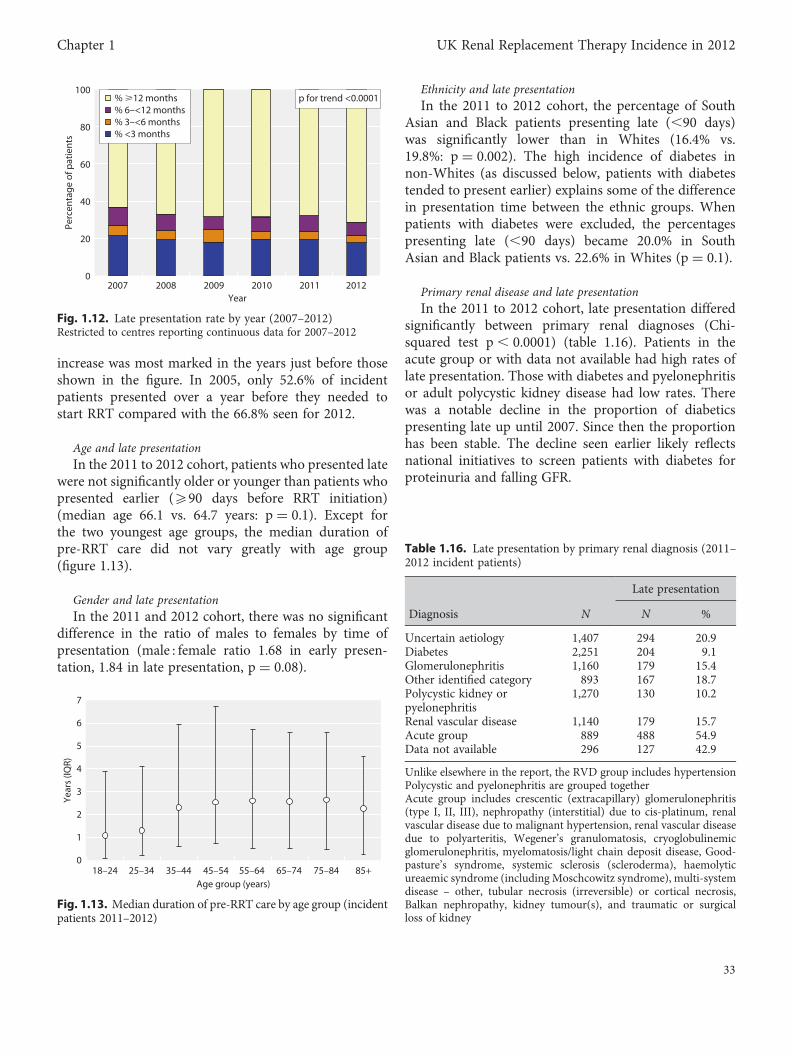
increase was most marked in the years just before thoseshown in the figure. In 2005, only 52.6% of incidentpatients presented over a year before they needed tostart RRT compared with the 66.8% seen for 2012.
Age and late presentationIn the 2011 to 2012 cohort, patients who presented late
were not significantly older or younger than patients whopresented earlier (590 days before RRT initiation)(median age 66.1 vs. 64.7 years: p = 0.1). Except forthe two youngest age groups, the median duration ofpre-RRT care did not vary greatly with age group(figure 1.13).
Gender and late presentationIn the 2011 and 2012 cohort, there was no significant
difference in the ratio of males to females by time ofpresentation (male : female ratio 1.68 in early presen-tation, 1.84 in late presentation, p = 0.08).
Ethnicity and late presentationIn the 2011 to 2012 cohort, the percentage of South
Asian and Black patients presenting late (,90 days)was significantly lower than in Whites (16.4% vs.19.8%: p = 0.002). The high incidence of diabetes innon-Whites (as discussed below, patients with diabetestended to present earlier) explains some of the differencein presentation time between the ethnic groups. Whenpatients with diabetes were excluded, the percentagespresenting late (,90 days) became 20.0% in SouthAsian and Black patients vs. 22.6% in Whites (p = 0.1).
Primary renal disease and late presentationIn the 2011 to 2012 cohort, late presentation differed
significantly between primary renal diagnoses (Chi-squared test p, 0.0001) (table 1.16). Patients in theacute group or with data not available had high rates oflate presentation. Those with diabetes and pyelonephritisor adult polycystic kidney disease had low rates. Therewas a notable decline in the proportion of diabeticspresenting late up until 2007. Since then the proportionhas been stable. The decline seen earlier likely reflectsnational initiatives to screen patients with diabetes forproteinuria and falling GFR.
0
20
40
60
80
100
2007 2008 2009 2010 2011 2012Year
Perc
enta
ge o
f pat
ient
s
% >12 months% 6–<12 months% 3–<6 months% <3 months
p for trend <0.0001
Fig. 1.12. Late presentation rate by year (2007–2012)Restricted to centres reporting continuous data for 2007–2012
0
1
2
3
4
5
6
7
18–24 25–34 35–44 45–54 55–64 65–74 75–84 85+Age group (years)
Year
s (IQ
R)
Fig. 1.13. Median duration of pre-RRT care by age group (incidentpatients 2011–2012)
Table 1.16. Late presentation by primary renal diagnosis (2011–2012 incident patients)
Late presentation
Diagnosis N N %
Uncertain aetiology 1,407 294 20.9Diabetes 2,251 204 9.1Glomerulonephritis 1,160 179 15.4Other identified category 893 167 18.7Polycystic kidney orpyelonephritis
1,270 130 10.2
Renal vascular disease 1,140 179 15.7Acute group 889 488 54.9Data not available 296 127 42.9
Unlike elsewhere in the report, the RVD group includes hypertensionPolycystic and pyelonephritis are grouped togetherAcute group includes crescentic (extracapillary) glomerulonephritis(type I, II, III), nephropathy (interstitial) due to cis-platinum, renalvascular disease due to malignant hypertension, renal vascular diseasedue to polyarteritis, Wegener’s granulomatosis, cryoglobulinemicglomerulonephritis, myelomatosis/light chain deposit disease, Good-pasture’s syndrome, systemic sclerosis (scleroderma), haemolyticureaemic syndrome (including Moschcowitz syndrome), multi-systemdisease – other, tubular necrosis (irreversible) or cortical necrosis,Balkan nephropathy, kidney tumour(s), and traumatic or surgicalloss of kidney
33
Chapter 1 UK Renal Replacement Therapy Incidence in 2012
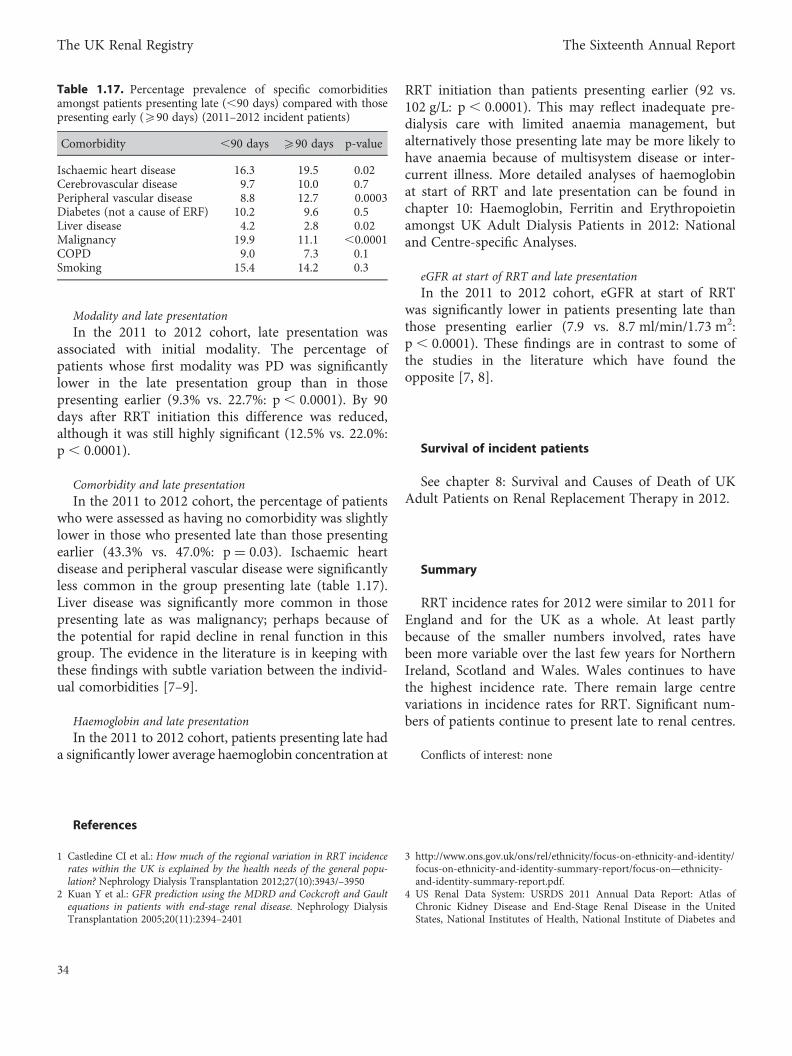
Modality and late presentationIn the 2011 to 2012 cohort, late presentation was
associated with initial modality. The percentage ofpatients whose first modality was PD was significantlylower in the late presentation group than in thosepresenting earlier (9.3% vs. 22.7%: p, 0.0001). By 90days after RRT initiation this difference was reduced,although it was still highly significant (12.5% vs. 22.0%:p , 0.0001).
Comorbidity and late presentationIn the 2011 to 2012 cohort, the percentage of patients
who were assessed as having no comorbidity was slightlylower in those who presented late than those presentingearlier (43.3% vs. 47.0%: p = 0.03). Ischaemic heartdisease and peripheral vascular disease were significantlyless common in the group presenting late (table 1.17).Liver disease was significantly more common in thosepresenting late as was malignancy; perhaps because ofthe potential for rapid decline in renal function in thisgroup. The evidence in the literature is in keeping withthese findings with subtle variation between the individ-ual comorbidities [7–9].
Haemoglobin and late presentationIn the 2011 to 2012 cohort, patients presenting late had
a significantly lower average haemoglobin concentration at
RRT initiation than patients presenting earlier (92 vs.102 g/L: p , 0.0001). This may reflect inadequate pre-dialysis care with limited anaemia management, butalternatively those presenting late may be more likely tohave anaemia because of multisystem disease or inter-current illness. More detailed analyses of haemoglobinat start of RRT and late presentation can be found inchapter 10: Haemoglobin, Ferritin and Erythropoietinamongst UK Adult Dialysis Patients in 2012: Nationaland Centre-specific Analyses.
eGFR at start of RRT and late presentationIn the 2011 to 2012 cohort, eGFR at start of RRT
was significantly lower in patients presenting late thanthose presenting earlier (7.9 vs. 8.7 ml/min/1.73 m2:p, 0.0001). These findings are in contrast to some ofthe studies in the literature which have found theopposite [7, 8].
Survival of incident patients
See chapter 8: Survival and Causes of Death of UKAdult Patients on Renal Replacement Therapy in 2012.
Summary
RRT incidence rates for 2012 were similar to 2011 forEngland and for the UK as a whole. At least partlybecause of the smaller numbers involved, rates havebeen more variable over the last few years for NorthernIreland, Scotland and Wales. Wales continues to havethe highest incidence rate. There remain large centrevariations in incidence rates for RRT. Significant num-bers of patients continue to present late to renal centres.
Conflicts of interest: none
References
1 Castledine CI et al.: How much of the regional variation in RRT incidencerates within the UK is explained by the health needs of the general popu-lation? Nephrology Dialysis Transplantation 2012;27(10):3943/–3950
2 Kuan Y et al.: GFR prediction using the MDRD and Cockcroft and Gaultequations in patients with end-stage renal disease. Nephrology DialysisTransplantation 2005;20(11):2394–2401
3 http://www.ons.gov.uk/ons/rel/ethnicity/focus-on-ethnicity-and-identity/focus-on-ethnicity-and-identity-summary-report/focus-on—ethnicity-and-identity-summary-report.pdf.
4 US Renal Data System: USRDS 2011 Annual Data Report: Atlas ofChronic Kidney Disease and End-Stage Renal Disease in the UnitedStates, National Institutes of Health, National Institute of Diabetes and
Table 1.17. Percentage prevalence of specific comorbiditiesamongst patients presenting late (,90 days) compared with thosepresenting early (590 days) (2011–2012 incident patients)
Comorbidity ,90 days 590 days p-value
Ischaemic heart disease 16.3 19.5 0.02Cerebrovascular disease 9.7 10.0 0.7Peripheral vascular disease 8.8 12.7 0.0003Diabetes (not a cause of ERF) 10.2 9.6 0.5Liver disease 4.2 2.8 0.02Malignancy 19.9 11.1 ,0.0001COPD 9.0 7.3 0.1Smoking 15.4 14.2 0.3
34
The UK Renal Registry The Sixteenth Annual Report
Digestive and Kidney Diseases, Bethesda, MD, 2011. Publications basedupon USRDS data reported here or supplied upon request must includethis citation and the following notice: The data reported here have beensupplied by the United States Renal Data System (USRDS)
5 Ford DJ, Fogarty DG, Steenkamp R, Tomson CRV, Ben-Shlomo Y, AnsellD. Chapter 13: The UK Renal Registry Advanced CKD Study: frequencyof incorrect reporting of date of start of RRT. Nephron Clinical Practice;115(suppl 1):c271–c278
6 http://www.renal.org/CKDguide/full/UKCKDfull.pdf.
7 Kazmi WHet al.: Late nephrology referral and mortality among patientswith end-stage renal disease: a propensity score analysis. NephrologyDialysis Transplantation 2004;19(7):1808–1814
8 Roubicek C et al.: Timing of nephrology referral: Influence on mortality andmorbidity. American journal of kidney diseases: the official journal of theNational Kidney Foundation 2000;36(1):35–41
9 Winkelmayer WC et al.: A Propensity Analysis of Late Versus EarlyNephrologist Referral and Mortality on Dialysis. Journal of the AmericanSociety of Nephrology 2003;14(2):486–492.
35
Chapter 1 UK Renal Replacement Therapy Incidence in 2012
Related Documents